
Seasonal Variation in the Water Quality and Eutrophication of Lake Xingyun in Southwestern China
by
 , and
, and
Yanbo Zeng
1, 
Fengqin Chang
1,
Xinyu Wen
2,*,
Lizeng Duan
1,
Yang Zhang
1,
Qi Liu
1 and
Hucai Zhang
1,* 1
Institute for Ecological Research and Pollution Control of Plateau Lakes, School of Ecology and Environmental Science, Yunnan University, Kunming 650504, China
2
School of Geography and Engineering of Land Resources, Yuxi Normal University, Yuxi 653100, China
*
Authors to whom correspondence should be addressed.
Water 2022, 14(22), 3677; https://doi.org/10.3390/w14223677
Submission received: 8 September 2022
/
Revised: 24 October 2022
/
Accepted: 10 November 2022
/
Published: 14 November 2022
(This article belongs to the Special Issue Plateau Lake Water Quality and Eutrophication: Status and Challenges)
Abstract
:It is crucial to understand the spatial-temporal variation of water quality for the water safety and eutrophication migration in plateau lakes. To identify the variation property and the main causes of eutrophication and continuous water quality deterioration, the water quality, including the water temperature (WT), dissolved oxygen (DO), pH, Chl-a, turbidity, total nitrogen (TN) and total phosphorus (TP), of Lake Xingyun was monitored from 2016 to 2021, and their spatial and temporal distribution characteristics were analyzed. The results show that there is no obvious thermal stratification in the vertical direction; pH and DO decrease with depth, which is caused by both physical and biochemical processes, especially at the bottom of Lake Xingyun, which has an anaerobic environment. The chlorophyll content was higher during the high-flow periods and varied significantly in the vertical direction; the spatial variation of water quality in Lake Xingyun was more obvious in the low-flow period and alkaline throughout the year. The average content of total phosphorus (TP) ranged between 0.33 and 0.53 mg/L during the high-flow periods and between 0.22 and 0.51 mg/L during the low-flow periods, while the average content of total nitrogen (TN) ranged between 1.92 and 2.62 mg/L and 1.36 and 2.53 mg/L during the high- and low-flow periods, respectively. The analysis of the inflow samples shows that exogenous nitrogen and phosphorus is the main pollution source affecting the nitrogen and phosphorus content of Lake Xingyun. The trophic level index (TLI) shows that Lake Xingyun is in eutrophication all year round, and even in areas less affected by the exogenous nutrient, there are still conditions for cyanobacterial blooms. This study shed new light on the water quality, eutrophication status and changes in Lake Xingyun, providing suggestions for controlling lake pollution and eutrophication mitigation.
1. Introduction
Natural lakes are waters maintained at a certain scale and duration, whereby specific biological species and combinations are formed under a specific geological and geographical background. During the evolution of natural lakes, from formation to maturity and final extinction, there are numerous interactions between tectonic movements, climate change, sea levels and human activities [1], which appear as prominent regional characteristics. As a unique natural complex, the plateau lake features a steep lakeshore and a deep lake basin, with fewer rivers flowing out of the lake and along its residence period.
Once pollution or eutrophication occur in the lake, it is a big and time-consuming challenge to effectively treat and mitigate the pollution within a short time. Unfortunately, owing to the effects of land use [2], climate change [3], geological structure [4], surface runoff [5], sewage discharge [6] and other natural processes and human activities, lake pollution and eutrophication problems have become one of the most significant ecological and environmental problems affecting humankind, severely restricting the development of the local economy. Thus, recognizing and understanding the temporal and spatial changes in water quality at the watershed scale is important for evaluating water quality, aquatic ecosystem rehabilitation and water management [7,8].
WT is an essential factor affecting various physical and chemical processes and dynamic phenomena of a lake. It defines the lake type, biological community structure and aquatic ecosystem productivity. A lake’s WT is mainly influenced by seasons, which are synchronous and highly correlated with the regional temperature [9,10]. Xu et al. have monitored Lake Yangzong for a long time, and the analysis results show that Lake Yangzong is a warm, monophasic lake, and the temperature has a significant impact on the water quality parameters. In spring and autumn, cyanobacteria are in danger of blooming [11]. Studies have shown that global warming since the 20th century has led to an increased spread of harmful algal blooms worldwide, which is closely related to the global temperature rise [12,13]. Chlorophyll-a (Chl-a) is one of the leading indicators of phytoplankton abundance in inland waters and can be used to measure the nutrient status of lake water [14,15] because its content can indicate the number of algae. Algae distribution is controlled by temperature, pH, DO, light intensity, organic carbon content, wind direction and nutrients such as TN and TP, which are related to its biology and population ecology. According to the accumulated monitoring data of the Yuxi Environmental Monitoring Station over several years, in 2000, cyanobacteria started to bloom. They began to appear at a few bays of Lake Xingyun, followed by periodic outbreaks from April to November every year. Although the mechanism of the water bloom is still not fully understood, it was found that the variation in algae had a close relationship with Chl-a and algae cell density [16], which are the most intuitive factors reflecting the number of algae. They are often used for determinations of the alert level for cyanobacteria bloom. However, Chl-a concentration is more accessible to measure than algal cell density and can predict algal biomass.
Many studies on the spatial and temporal variations in surface water quality in reservoirs or lakes have been published [8,16,17,18,19,20,21]. At the same time, Najafzadeh et al. used a Data-Driven Model (DDM) to assess the Water Quality Index (WQI) of rivers [22], and they found that the WQI of the Karun River was categorized as “relatively poor” quality. Furthermore, based on reliability analysis, the Karun River had only a 19% chance of having a better quality index; the DDM model exhibited better performance in estimating the WQI classification. Chen et al. used principal component analysis/factor analysis (PCA/FA) to reveal potential sources of contamination in the Danjiangkou Reservoir Basin, and the results showed that high-pollution regions are polluted by chemicals and industries, while low-pollution regions are polluted by sewage from agriculture and livestock [23]. However, from the perspective of regional conditions, the accumulation, systematisms and interpretation of data for plateau lakes in Yunnan, China, still need to be improved.
Lake Xingyun is a typical plateau lake located in Yunnan and plays an irreplaceable role in regulating the local climate, providing water sources and beautifying the environment. It is a place where people have lived for thousands of years. However, in recent years, the influence of human activities, the discharge of large amounts of industrial wastewater and domestic sewage and the unreasonable crops planting structure have not only led to hydrological fluctuations but also to more serious consequences such as eutrophication [11,24], which is severely impacting the local ecological environment and water security and restricting the development of the local economy and people’s quality of life. Over the past few decades, studies on Lake Xingyun mainly concentrate on the analysis of phytoplankton biomass and its population structure [25], sedimentation [26], tributary loadings [27], climate change and watershed land-use evolution [28]. There is no comprehensive characterization of the dynamic changes in water quality in Lake Xingyun, and few correlations between eutrophication and water quality indicators have been identified. Therefore, it is necessary to accurately and comprehensively study the trophic level of the lake, especially the nitrogen and phosphorus levels, the pollutant sources and the variation in water quality parameters. This study uses our continuous water quality monitoring data from 2016 to 2021 to:
- (1)
- Investigate the spatial and temporal distribution characteristics of water quality parameters;
- (2)
- Evaluate Lake XingYun’s water quality and nutrient content;
- (3)
- Investigate the potential source of nutrient dynamics and the relationship between nutrient status and water quality indicators.
The purpose of the investigation was to deeply understand the fate of physiochemical contaminants in the lake and to put forward corresponding countermeasures and suggestions.
2. Materials and Methods
2.1. Study Area
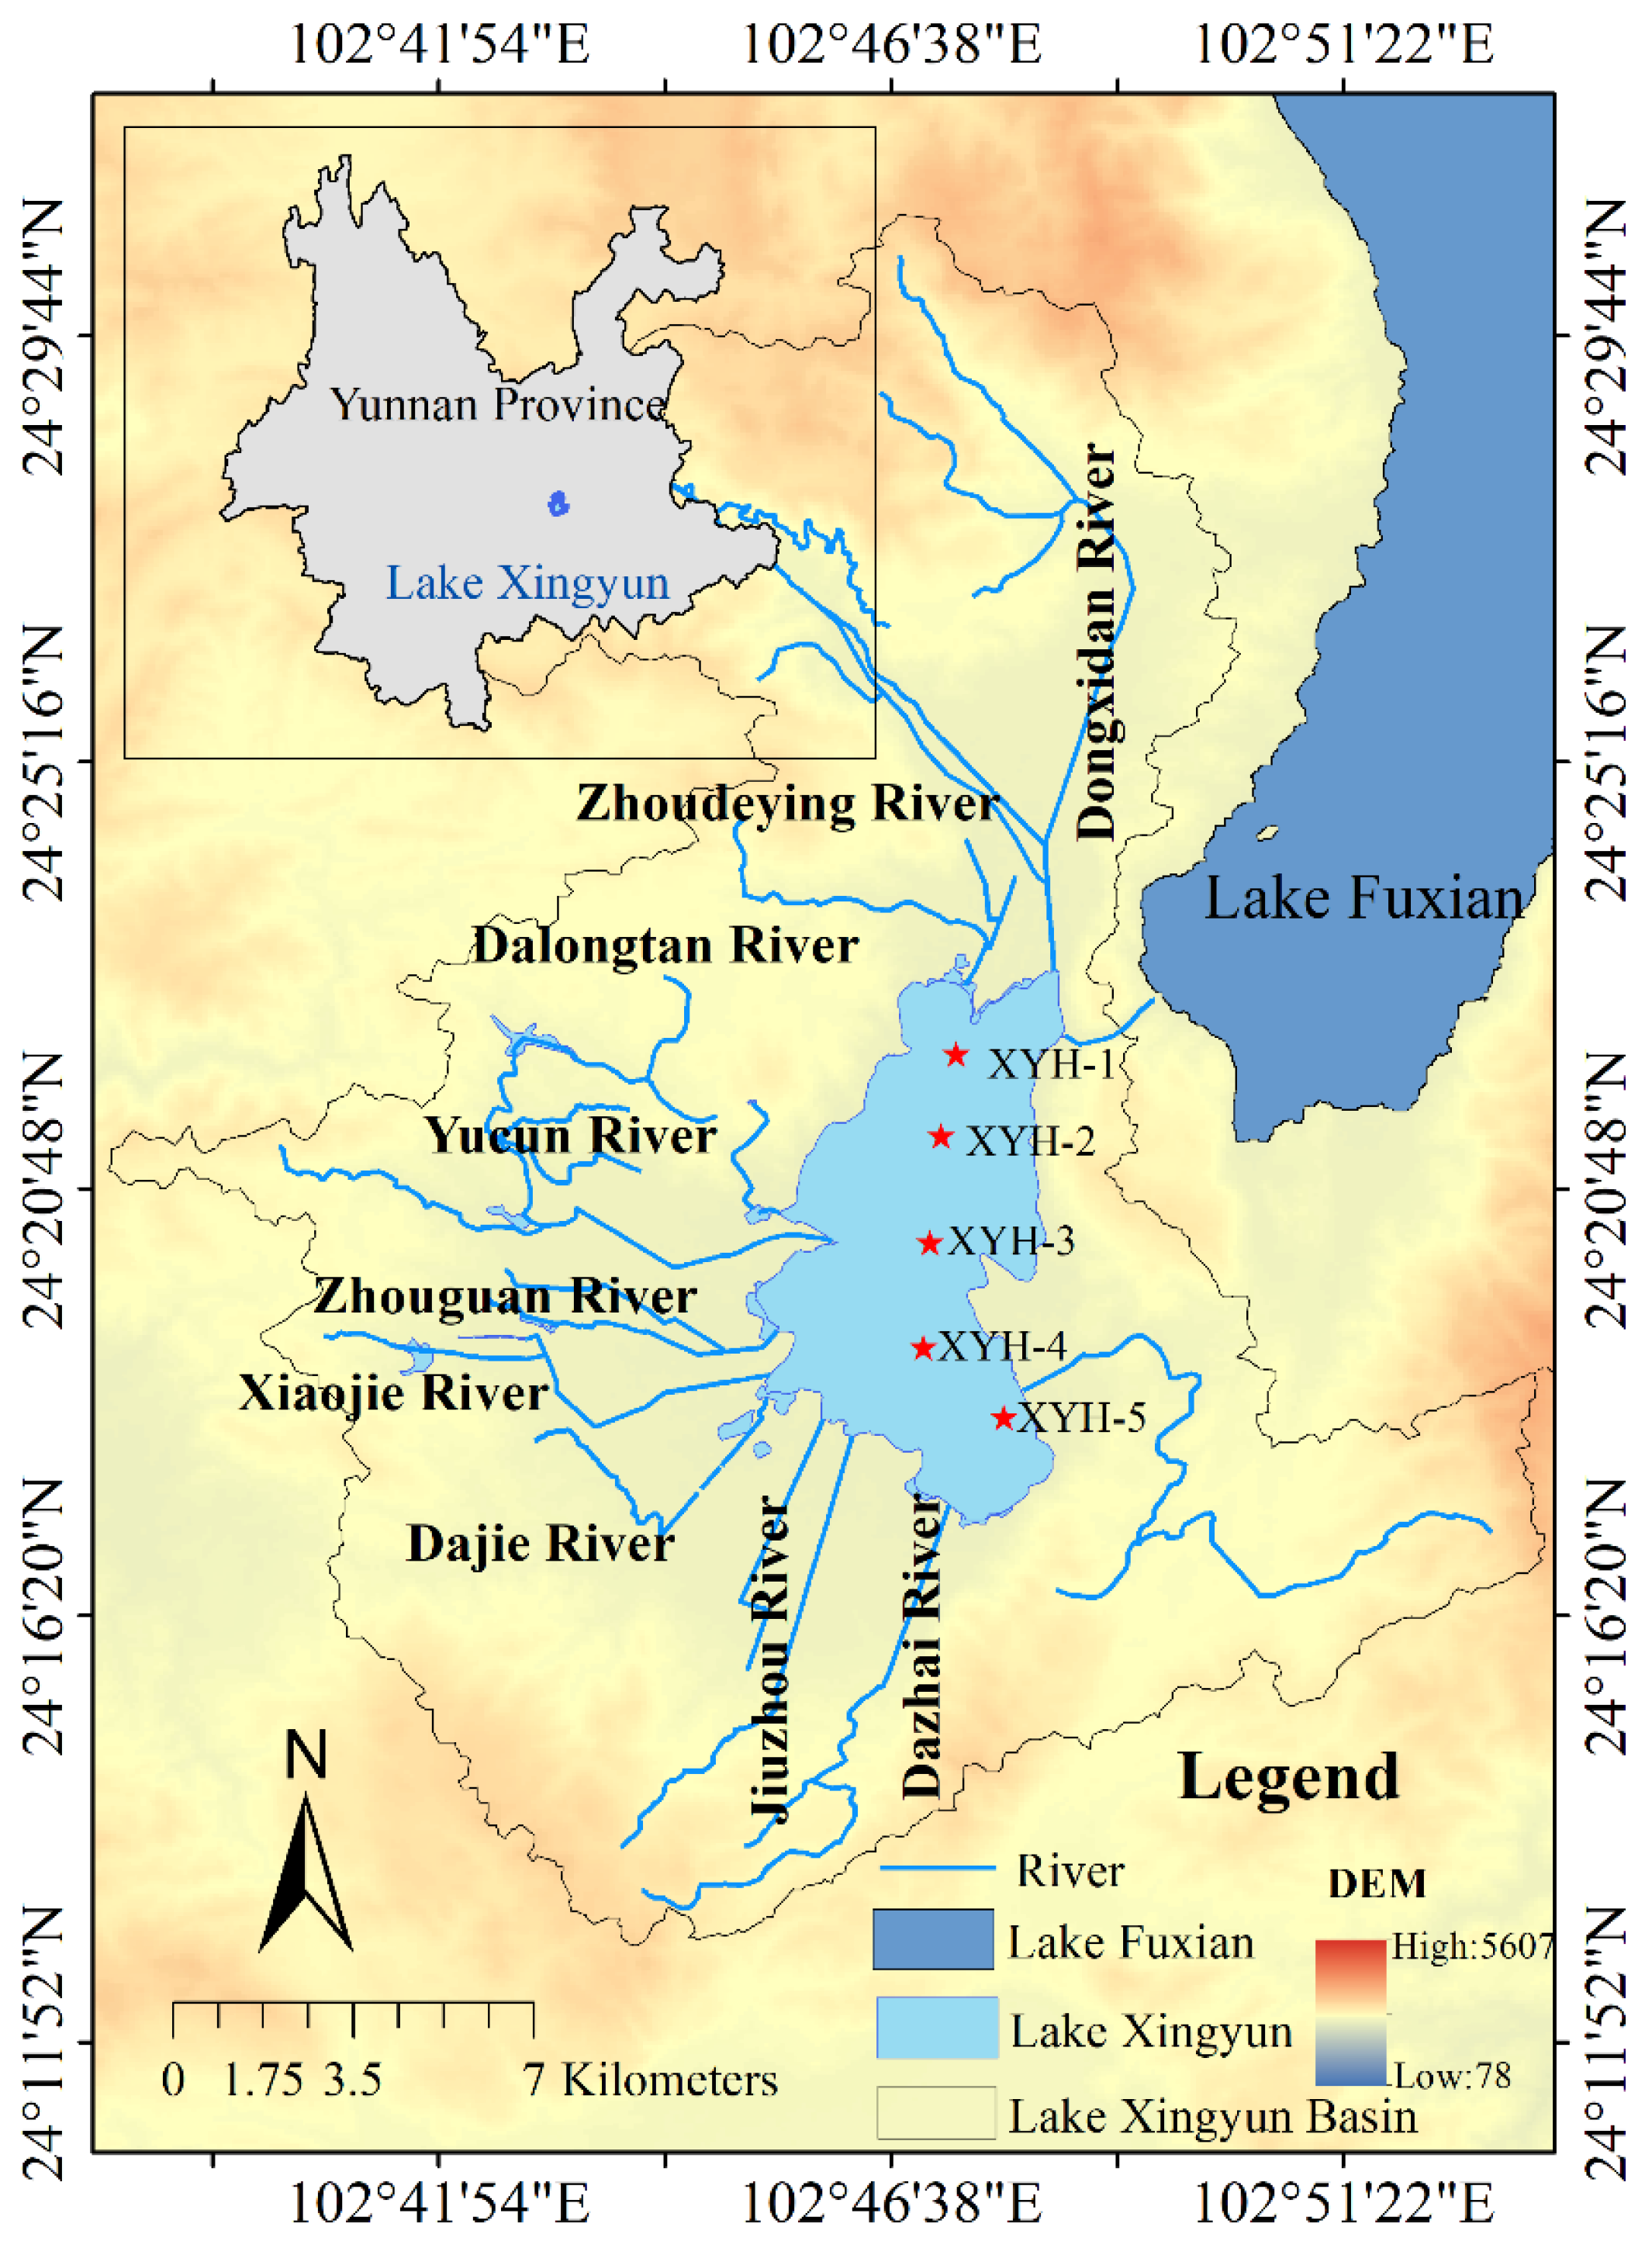
Lake Xingyun is a lake in Yunnan Province, southwest China (Figure 1), located in the eastern part of the Jiangchuan Basin in Yunnan Province. Lake Xingyun was mainly formed in the Miocene-Pliocene, has a history of about 3.4 million years and has entered the middle and late stages of lake marsh development. The geography scope of Lake Xingyun is 24°17′20″–24°23′03″ N, 102°45′20″–102°48′20″ E. The lake surface is located at a mean sea level of 1722 m. From north to south, it has a length of 10.5 km and is 3.8 km wide from east to west. The maximum water depth is 10 m, with an average depth of 7 m, a total lake area of 34.7 km2 and a total drainage area of 386 km2. The lake is maintained by rainfall and runoff in the watershed, with more than 14 rivers flowing into the lake [29].
Quaternary alluvium makes up the majority of the lake’s catchment area; the reason for this is that it was deposited during the period when the lake was at a high altitude [30]. Presently, it is a semi-closed, shallow water plateau lake with a subsidence center near the east side of its basin. As a result, the east side of the lake basin is steeper than the west side, which is less steep, with many hot springs around it. The main rivers flowing into the lake are the eastern and western rivers, including the Luosipu River, Yucun River, Dazhuang River, Haiku River and more than ten seasonal rivers. Lake Xingyun used to be a river in the upper reaches of Lake Fuxian, which was connected with Lake Fuxian through a man-made river called Gehe river. Later, after the “Lake Xingyun–Lake Fuxian Outflow Diversion” project, the Xiaojie River was manually excavated and became the only outlet of Lake Xingyun. According to local county records of Jiangchuan, in the prime time of the lake basin, it was connected to Lake Fuxian and Lake Qilu, named the ancient Lake Fuxian. In the Quaternary period, when the north–south faulting activity occurred, the earth’s crust subsided along the fault, dividing the Fuxian Lake and eventually forming Lake Xingyun.
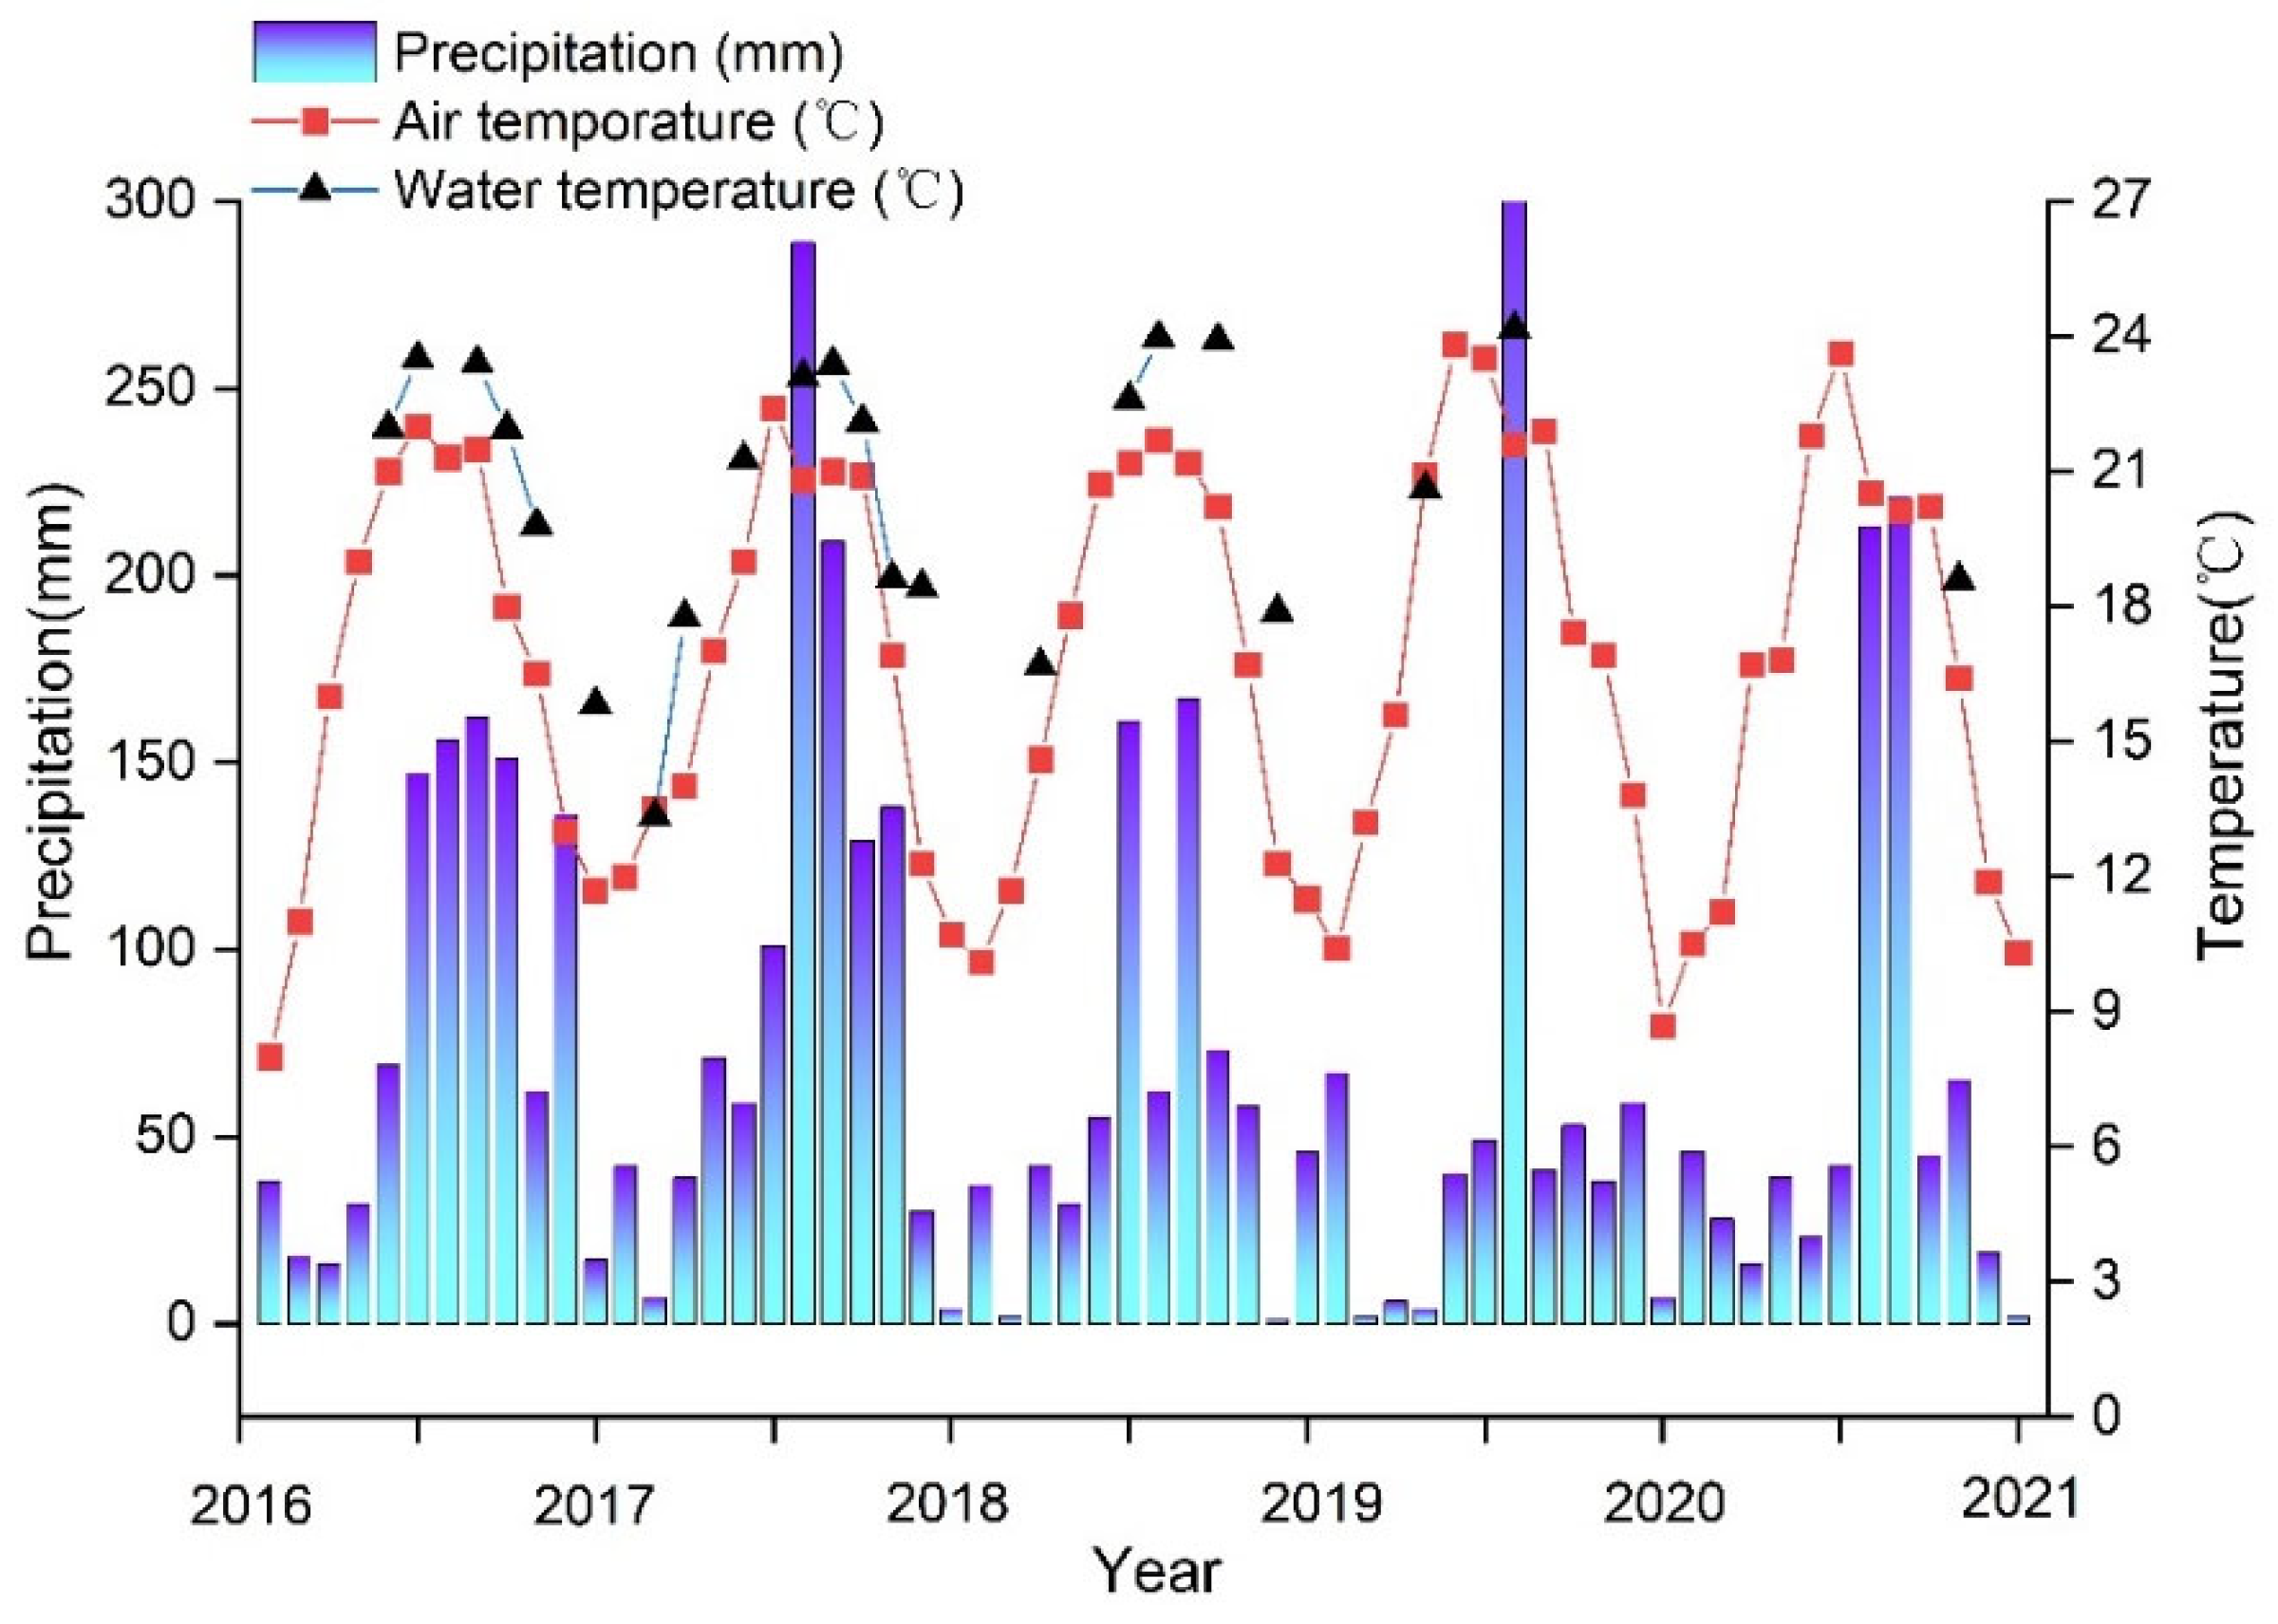
The lake is located in the subtropical semi-humid plateau monsoon climatic zone and has dry and wet seasons. About 81.4% of the precipitation is concentrated from May to October, forming the rainy season, and the average annual precipitation is about 717.5 mm (Figure 2). Based on the meteorological data from 2016 to 2021, the average air temperature was about 16.8 °C for many years, with warm climates from May to September and cold climates from October to April. The main direction of the wind is southwest, the annual average wind speed is about 2.2 m/s and the maximum wind speed value is 33 m/s. The soil in the basin is dominated by red earth, combined with purple and paddy soil. The primary vegetation in the area is the secondary coniferous forest, such as the Yunnan pine forest and Huashan pine.
2.2. Study Methods
Given the seasonal variations in the vertical and spatial distribution of the physical and chemical properties of the lake, field surveys and monitoring were performed in Lake Xingyun. The instrument used for measurement was the YSI 6600 V multi-parameter water quality monitor (Xylem, Inc., Rye Brook, NY, USA). The water quality parameters of WT, pH, DO, conductivity, turbidity and depth at selected points were measured after calibrating the instrument. During the fieldwork, the probe was placed vertically in the lake, and data were collected at an average interval of about 1 m from the top to the bottom of the water column. From 2016 to 2021, water samples were collected at five sites (XYL-1, XYL-2, XYL-3, XYL-4 and XYL-5) in Lake Xingyun, sealed in a pre-cleaned 1 L polyethylene plastic bottle after sampling and kept in cold storage. TN and TP in the water were measured using a spectrophotometer in the laboratory.
2.3. Data Analysis
The water quality evaluation method was based on the national “environmental quality standard of surface water” (GB3838-2002) for classification [25], and the water quality inferior to V was classified as Ⅵ. The environmental quality level standard of each evaluation project was the same as the national standard. In the evaluation process, the evaluation of the trophic level mainly adopted the comprehensive trophic level index TLI (Σ) (a number used to indicate the health of lakes in New Zealand) [31] scoring standard to score each sampling point (with two decimals), which is given as:
where TLI(j) is used to represent the single trophic level index for parameter j, and Wj represents the correlative weighted score of the trophic level index and is expressed by the following equation:
where R1j represents the relative coefficient of Chl-a and parameter j, and m represents the number of parameters. Table 1 displays the findings of 26 Chinese major lakes and reservoirs, which were used to determine the correlation coefficients of Chl-a and other parameters [32].
The equations for each eutrophication index are as follows [33]:
TLI(Chl-a) = 10 (2.5 + 1.086 ln Chl-a)
TLI(TP) = 10 (9.463 + 1.624 ln TP)
TLI(TN) = 10 (5.453 + 1.694 ln TN)
TLI(SD) = 10 (5.118 − 1.94 ln SD)
The unit of Chl-a is μg L−1, the unit of SD is m, and the other units are all mg L−1.
The Carson index method was used to grade each monitoring point (Table 2). Water quality parameters (temperature, Chl-a, DO, pH, turbidity) were determined. The TP and TN data used in this study were measured using the ultraviolet spectrophotometer UV-1750. The data were processed using software such as Grapher and Arcgis for geospatial analysis.
As the annual precipitation in the lake area is mainly concentrated from May to October, its water level is affected primarily by rain. The water level varied by about 1 m before and after the rainy season. The data used in this study were based on a combination of monitoring data from the year 2016 to 2021. We divided Lake Xingyun into rainy and dry seasons. The water quality characteristics in the vertical and spatial distribution of Lake Xingyun were analyzed and combined with the nitrogen and phosphorus test data. We also investigated the seasonal change and influencing factors of water quality parameters in Lake Xingyun before and after the rainy season.
3. Results
3.1. Analysis of Temporal and Spatial Changes
3.1.1. Analysis of Temporal and Spatial Changes in WT
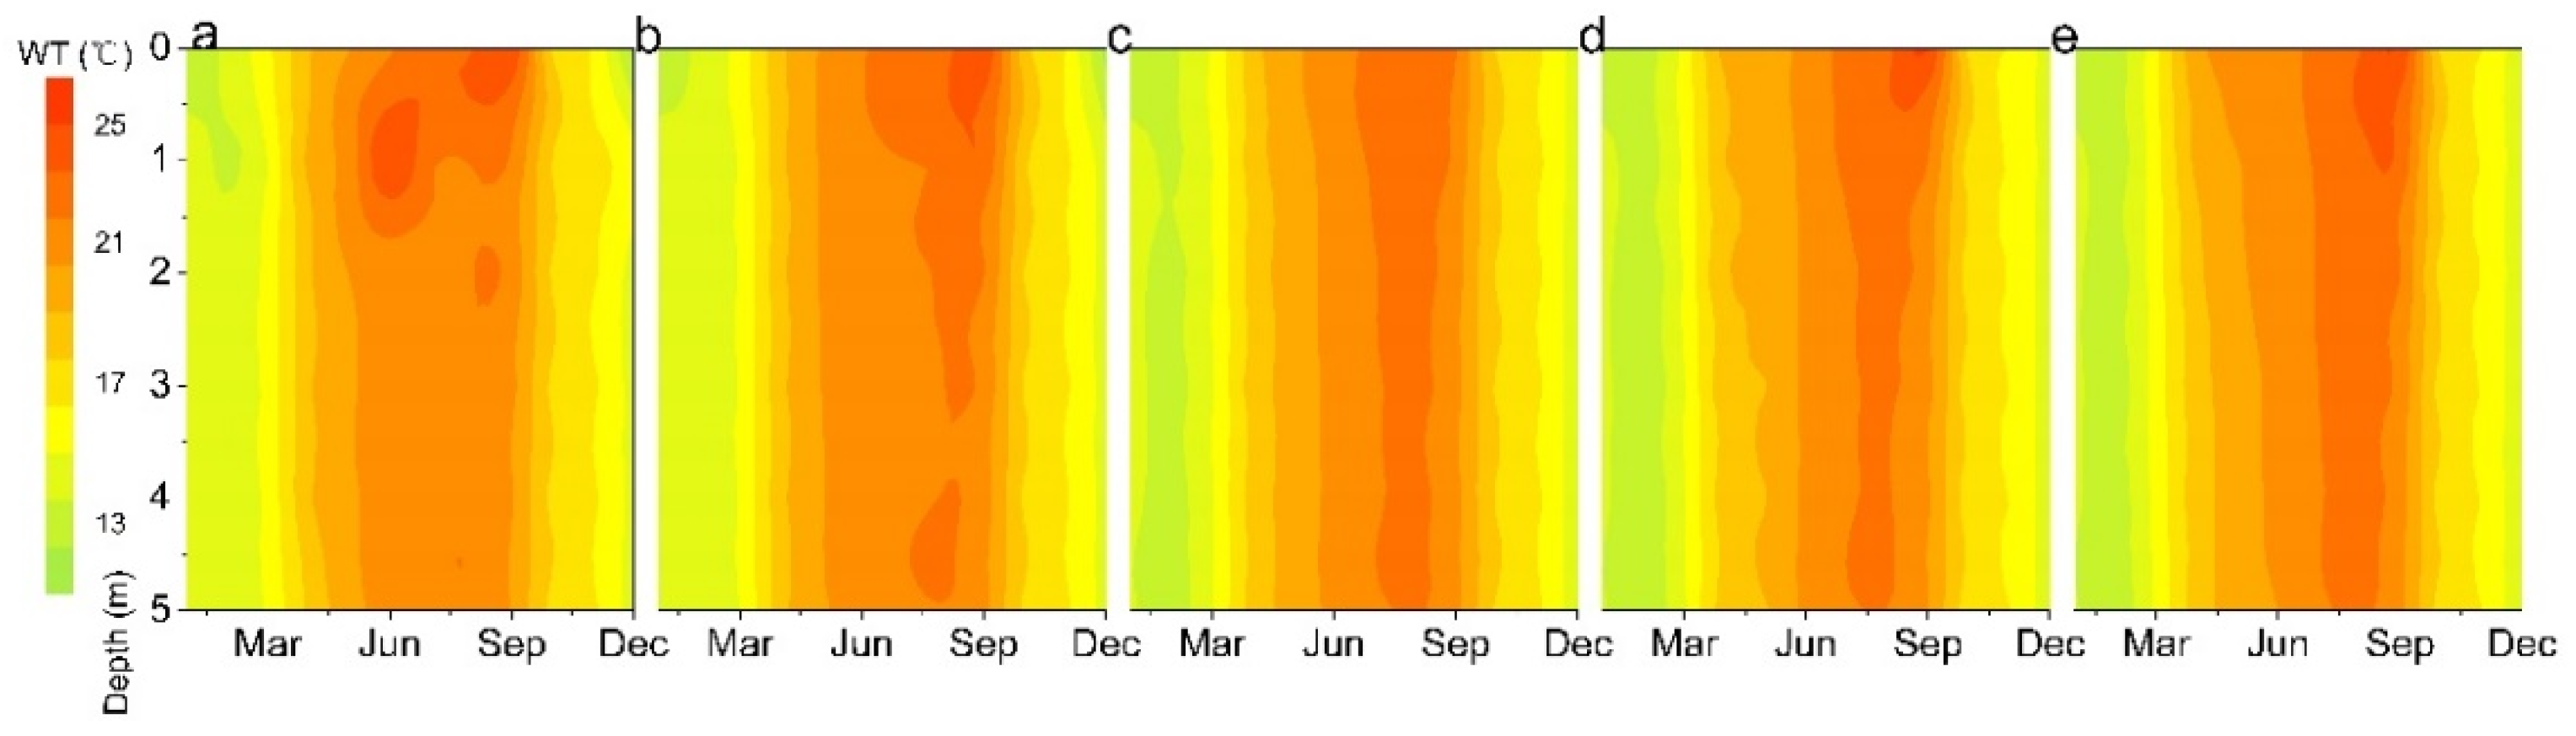
As a shallow lake, no thermocline exists in Lake Xingyun (Figure 3), and the WT was mainly affected by air temperature changes. The WT below 1 m from the surface showed a significant downward trend and varied significantly in different seasons, showing a monthly increase in spring and reaching a maximum in summer. The pattern was in line with the cyclical pattern of temperature variation. Water temperature is an essential factor affecting various physical and chemical processes and dynamic phenomena of a lake; it defines the lake type, biological community structure and aquatic ecosystem productivity.
3.1.2. Analysis of Temporal and Spatial Changes in pH
The pH change curve of Figure 4 shows that the pH value of Lake Xingyun was overall alkaline and changed slightly in the vertical direction, with all the measured results at five observatory sites ranging from 7.5 to 9.6. Most of them showed a downward trend with increasing depth, probably due to planktonic algal respiration, as on the top, they performed photosynthesis and absorbed CO2 from the surrounding water, which raises the pH. The algae in the bottom layer, which get less sunlight, exhale CO2, thus reducing the pH value of the surrounding water. Compared with the dry season, the pH of Lake Xingyun is higher during the wet season. This enhanced the hydrodynamics of the lake, leading to a significant difference in its pH during the wet season. The mean pH values of Lake Xingyun were as follows: north > central > south. Seasonally, the highest pH values were in autumn, followed by summer, and they were relatively low in winter and spring, with significant temporal differences and little overall spatial variation.
3.1.3. Analysis of Temporal and Spatial Changes of DO
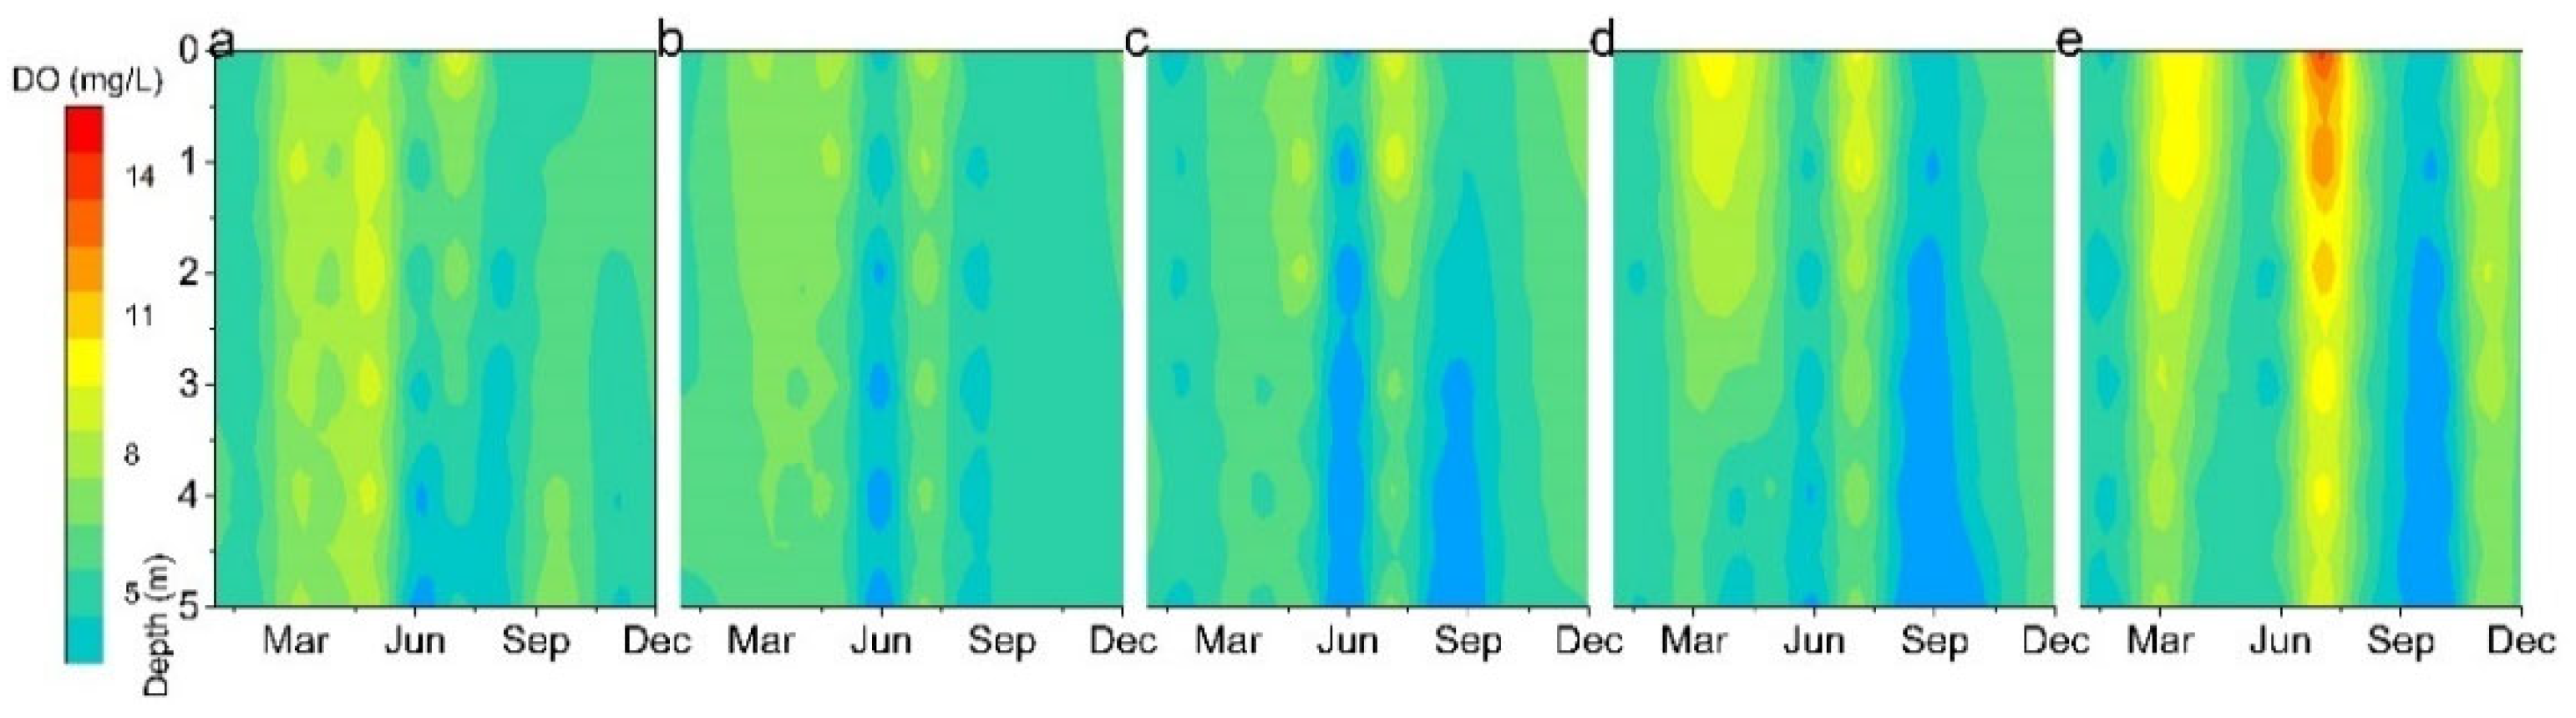
The DO variation shows that, in the vertical direction, its change trend was similar to that of pH, which generally showed a downward trend with an increased depth (Figure 5). This might result from photosynthesis by planktonic algae, which releases O2 on the surface and increases the O2 content in the water. When the bottom planktonic algae respire, they consume O2 in the surrounding water, reducing the O2 content. Compared with the dry season, the DO in Lake Xingyun is generally higher during the wet season. This may be due to the increase in algae caused by the rise in WT in the wet season and the growth of dissolved O2 content in the water due to photosynthesis. In addition, due to the increase in precipitation, an increase in the hydrodynamic intensity allows the surface water to supply DO supplement quickly, and at the same time, with a rise in the seasonal water level, sunlight at the bottom decreases, the respiration of the underlying plants increases and the O2 consumption increases, leading to a rise in DO in the surface water of Lake Xingyun. In contrast, the DO in the bottom decreased, showing a quite different variation situation.
Dissolved O2 in Lake Xingyun varied significantly in the vertical direction. The DO at the bottom of the lake was extremely low in summer. In spring, wind disturbance is stronger, solar radiation is weaker, the density difference of the water is smaller and the water is mixed evenly, so the DO in Lake Xingyun was more evenly distributed in the vertical direction. In terms of concentration, a higher DO concentration was observed in summer, which was also the season in which the vertical gradient of DO was the largest and the planktonic algae grew in large quantities. Due to the abundant light and heat on the surface layer of the lake, algae and floating plants gather in large quantities on the surface layer to carry out photosynthesis and produce O2, making the surface layer of the lake rich in O2. Due to the high density of algae on the surface layer, the O2 in the atmosphere has a difficult time penetrating to the bottom of the water, making the bottom layer of the lake severely hypoxic. Thus, the vertical DO gradient was larger during this time. The southwest wind prevails in Lake Xingyun all year round, making large amounts of planktonic algae gather in the lake’s northern part to grow and develop under the wind effects. As they release O2 during photosynthesis, the DO content in this area was also high. On the seasonal time scale, the differences in dissolved O2 in Lake Xingyun were significant, with some concentration differences among months, resulting in the obvious spatial heterogeneity of DO in Lake Xingyun.
3.1.4. Analysis of Temporal and Spatial Changes of Chlorophyll
According to the chlorophyll curve in Figure 6, the chlorophyll content in the wet season is higher than that in the dry season, which could be due to the rising summer temperature, causing the algae to grow steadily. The detected Chl-a data showed a large difference between the highest and lowest values, with significant vertical variation, showing a decreasing trend from the surface layer to the bottom layer. The surface layer of the water had suitable light and heat conditions, especially in summer, and the algae were concentrated in the upper layer of the water. In terms of regional distribution, the vertical variation varied among regions, with a small vertical concentration gradient in the dry season, a larger vertical gradient in the north and central parts of the lake, a smaller one in the south during the rainy season and significant spatial and temporal variation in Chl-a in the whole lake.
3.1.5. Analysis of Temporal and Spatial Changes in Turbidity
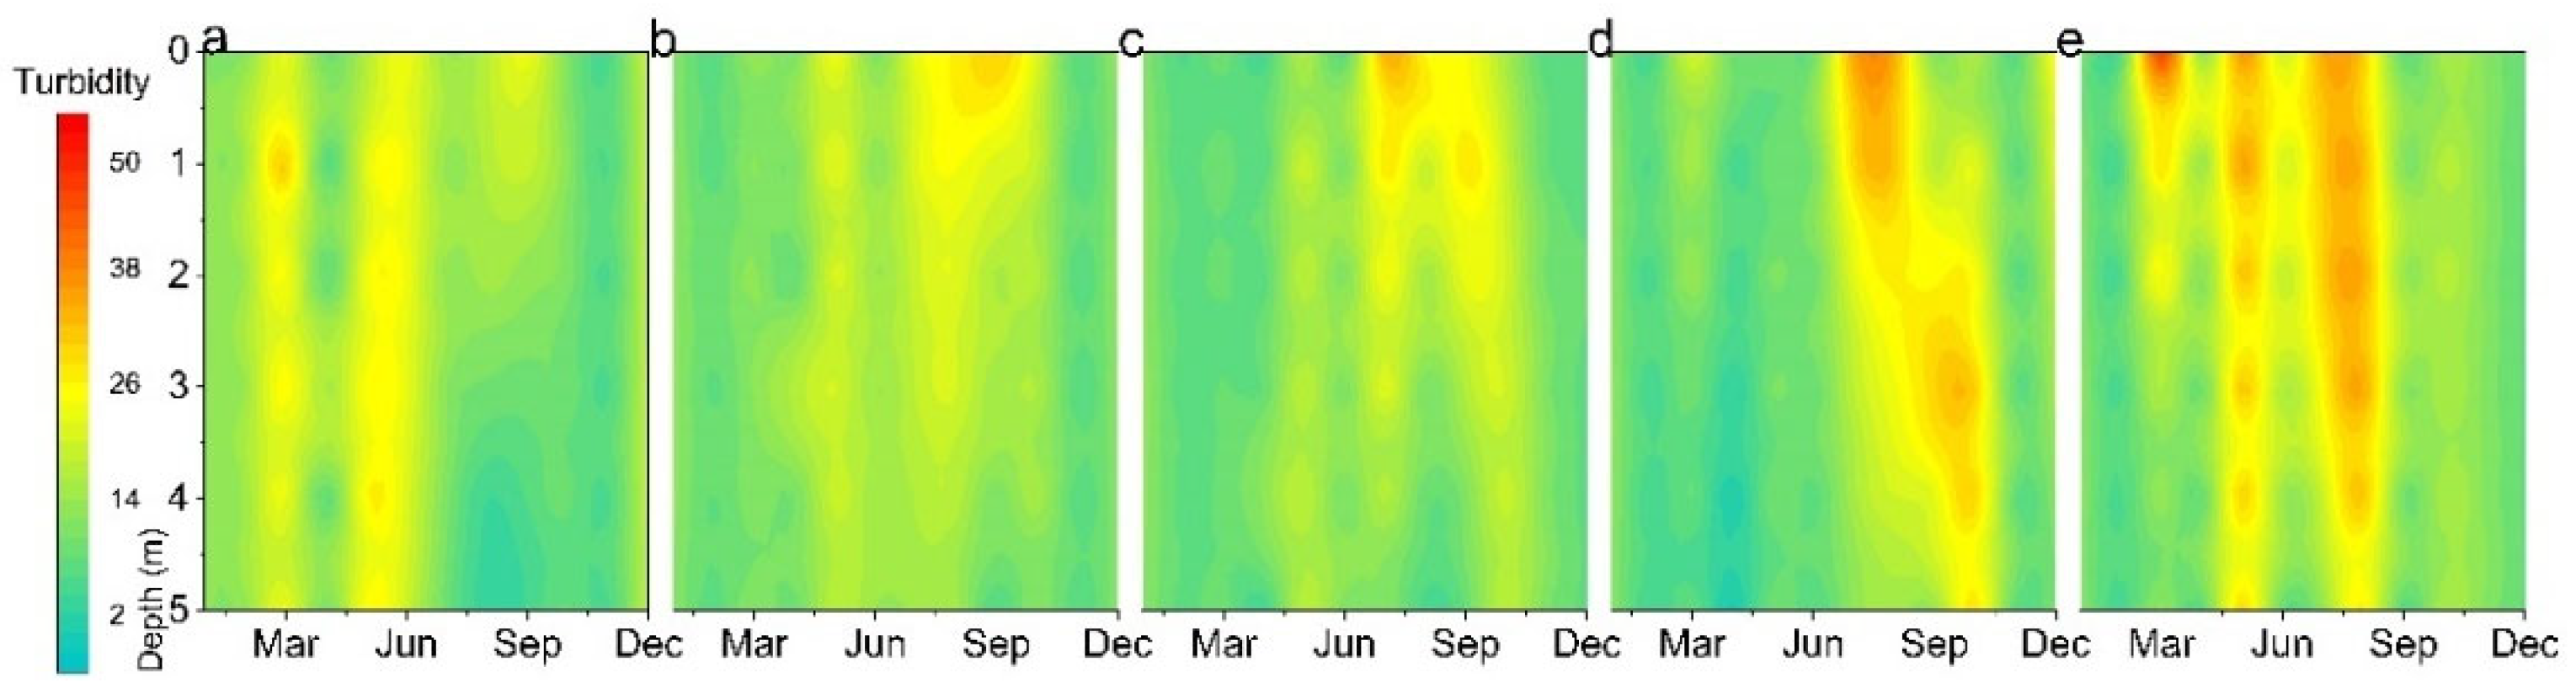
The monitoring results (Figure 7) show that the turbidity of Lake Xingyun ranged from 5 to 50 NTU. It also varied with seasons. The turbidity of the surface water was higher in the rainy season, which may partly be due to the increase in rainfall during the wet season, which increased the amount of sand that flowed into the lake, leading to the rise in the lake’s NTU. In terms of spatial scale, the turbidity of the east coast was higher than that of the west coast in the dry season. There were obvious seasonal differences in the vertical variation in turbidity in Lake Xingyun. Algae proliferated during summer and autumn, and the transmission rate of light in the water was lower, so the turbidity of the water layer was also higher where the algae were denser. When the water was disturbed during the rainy season, the insoluble substances settled in the bottom mud returned to the water and increased the water turbidity. The turbidity of Lake Xingyun also had significant spatial and temporal differences.
3.1.6. Inter-Annual Changes in Water Quality
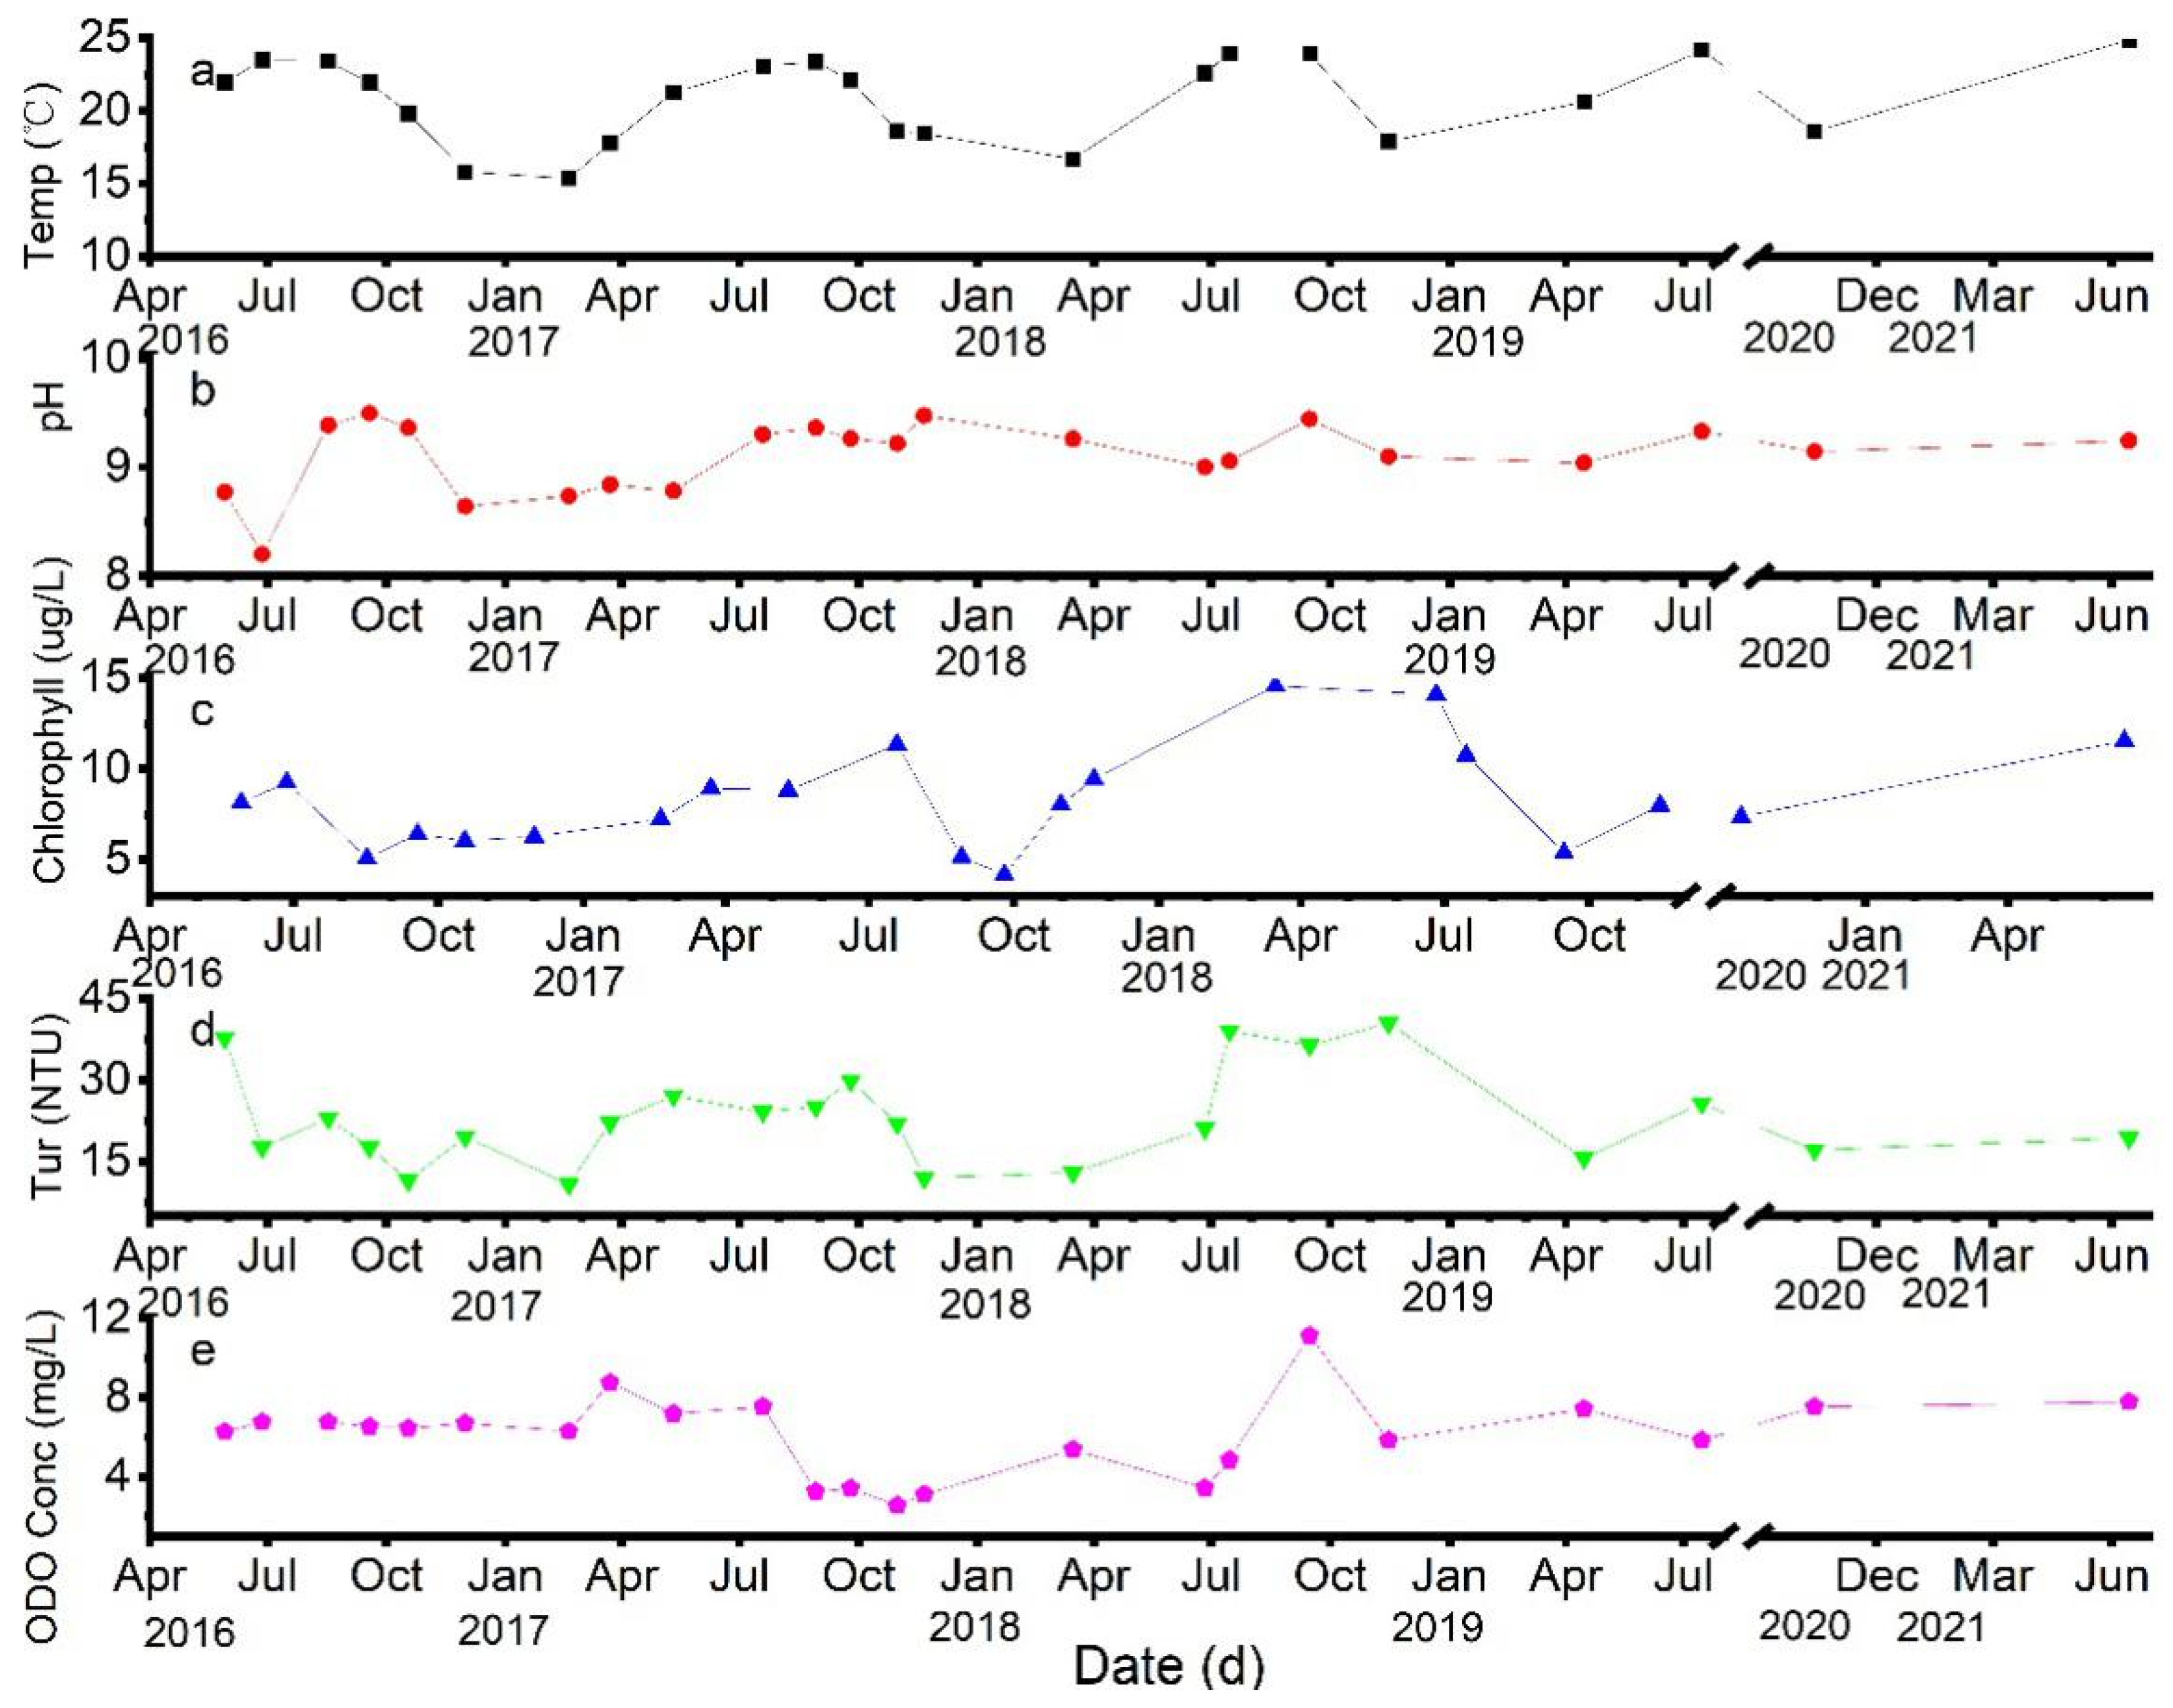
The water quality parameter values were measured at five monitoring sites (Figure 8). The monitoring data showed that the interannual variation trend of water quality parameters at the five monitoring sites was the same, and the variation trend of each monitoring site was also the same in the same year. The peak value of the Chl-a concentration in the five areas occurred in summer (July to August), while the lowest value occurred approximately in November. The Chl-a concentration varied significantly between seasons, with higher concentrations in summer than in winter. During rising summer temperatures, and when rainfalls were relatively abundant, there was a stable growth of algae. When the temperature dropped gradually in October, the metabolism of algae was suspended, and they entered a dormant state, inhibiting the growth and reproduction of algae. The change in the DO content was related to the intensity of algae photosynthesis and lake wave action, consistent with previous studies’ results. The pH value varied between 8 and 9.6, the average pH value is higher in autumn and the water of Lake Xingyun is alkaline. April to July was generally the peak period for Chl-a concentrations.
3.2. Water Quality Evaluation
The main reason for the eutrophication process of lakes is that primary producers (plants and algae with photosynthesis) use the nutrients available in the lake to produce organic matter. The three primary sources of nutrients were lake input, organic matter circulation [34] and sediment release. N and P are the main controlling factors of lake plant biomass.
Table 3 and Table 4 show that the water quality of Lake Xingyun was in the V class all year round. In terms of the nutrient level, it was almost in the eutrophication and medium eutrophication stages.
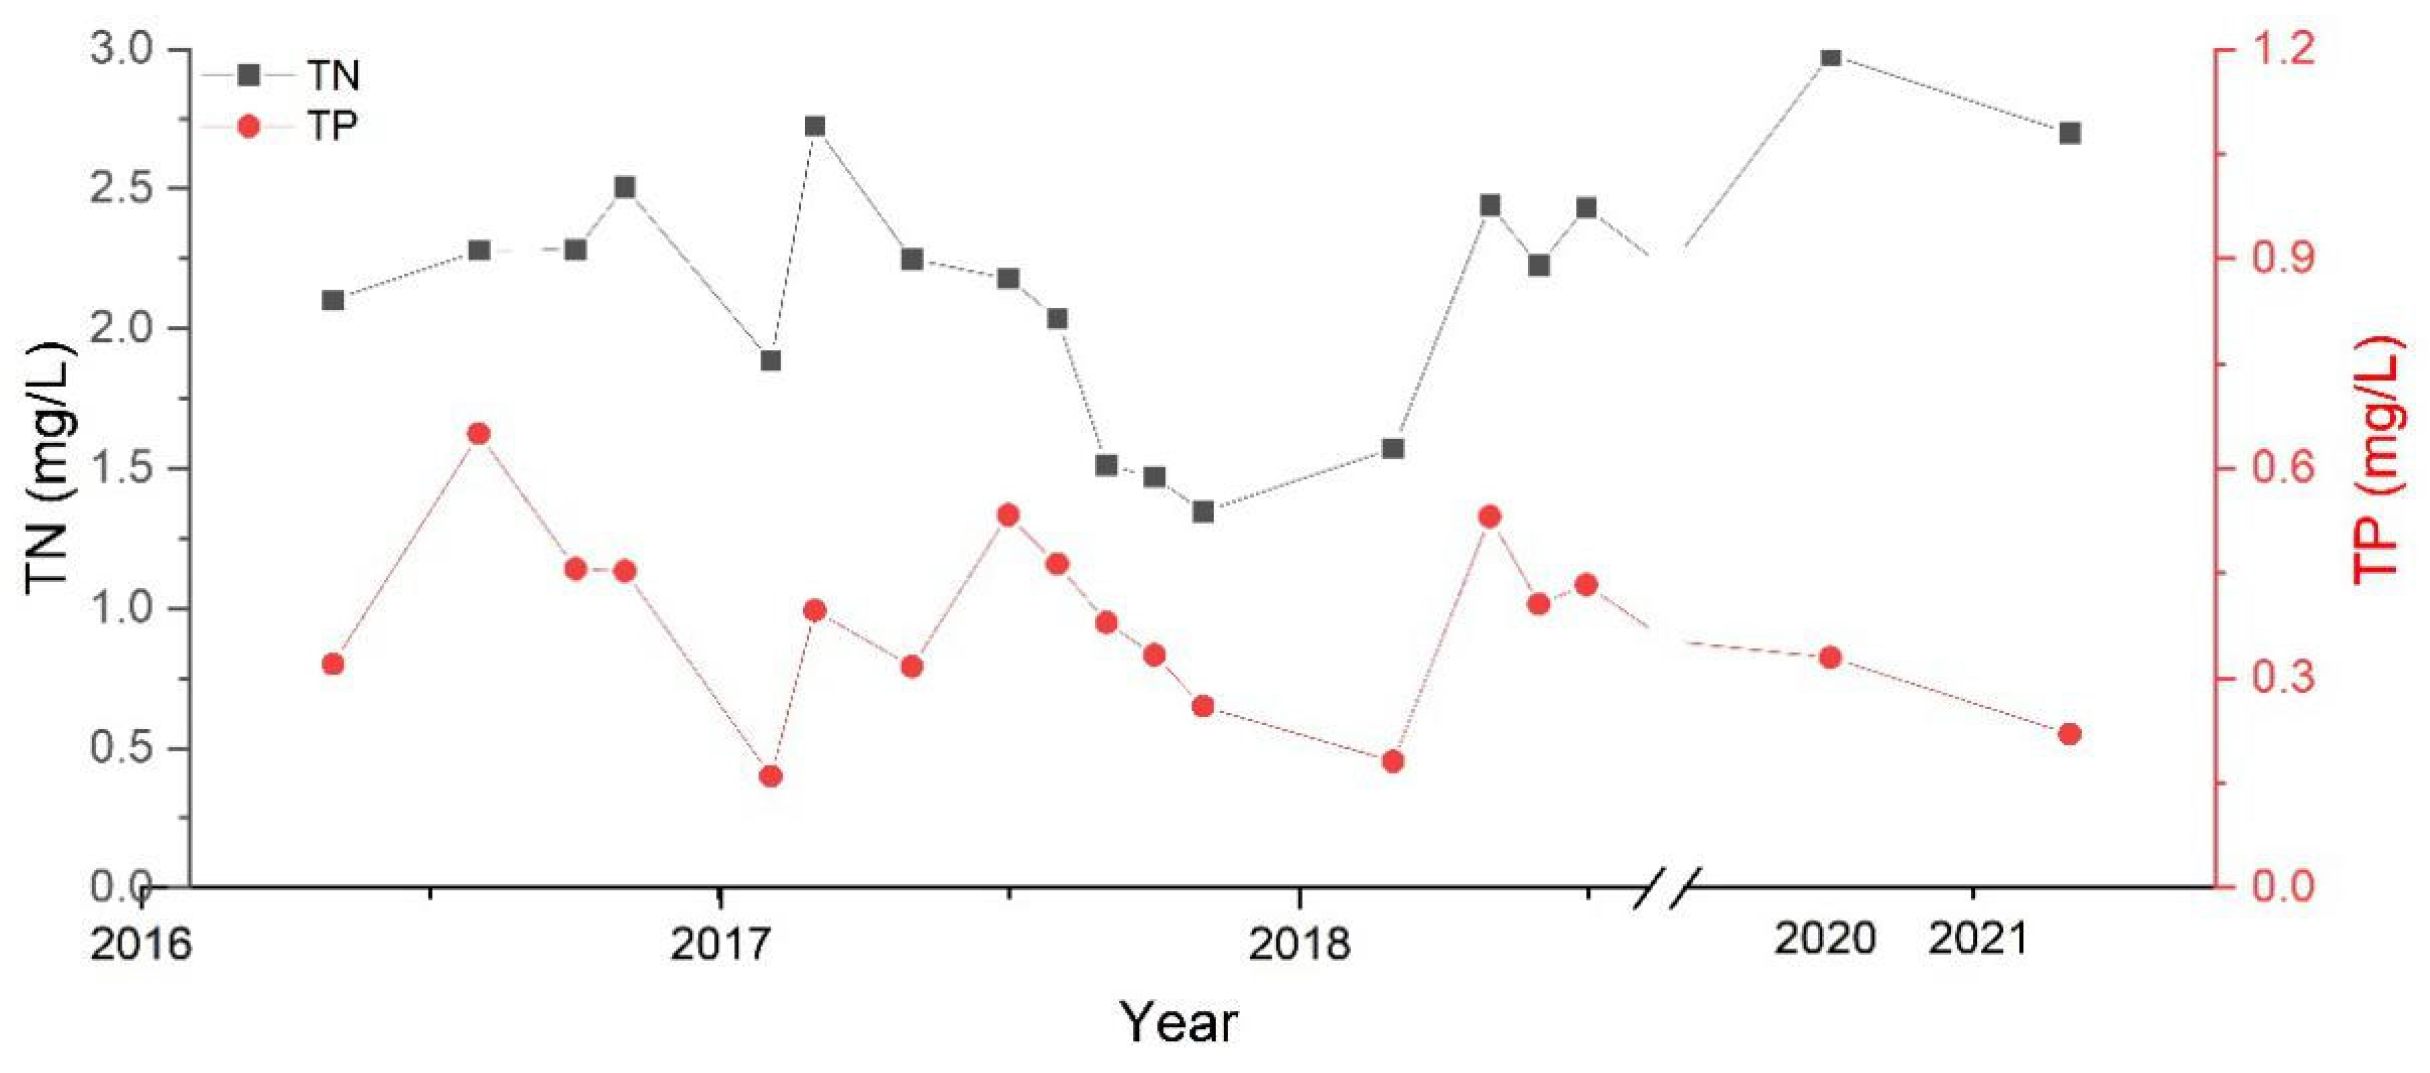
Based on the trend of recent years (Figure 9), the TN content ranged from 1.25 to 2.75 mg/L, and that of TP ranged from 0.26 to 1.6 mg/L. High TN concentration values in Lake Xingyun were usually observed during spring and summer, with a significant increase in spring, a slight decrease and subsequent increase in late spring or early summer and a decrease in autumn. These could be due to Lake Xingyun being in the dry period in spring, with a low flow velocity, coupled with the low utilization of N by plants, the weak denitrification at low temperatures, most of the N being stored in the water and the input of industrial and agricultural wastewater, leading to abundant N nutrients in the lake and higher TN in spring compared to other seasons. The change in TP in all seasons of the year showed an obvious periodicity, characterized by a rise in spring, a peak in summer and a decrease in winter, similar to the WT and TN cycles. The high TP in Lake Xingyun in summer may be due to the strong metabolism of aquatic animals and more excretion in summer, while cyanobacteria proliferate greatly in summer, and the algae are rich in phosphorus. On the other hand, it may also be due to the suspension of the bottom mud under the wind and waves, and the phosphorus in the bottom mud released in a dissolved form, making the TP content high.
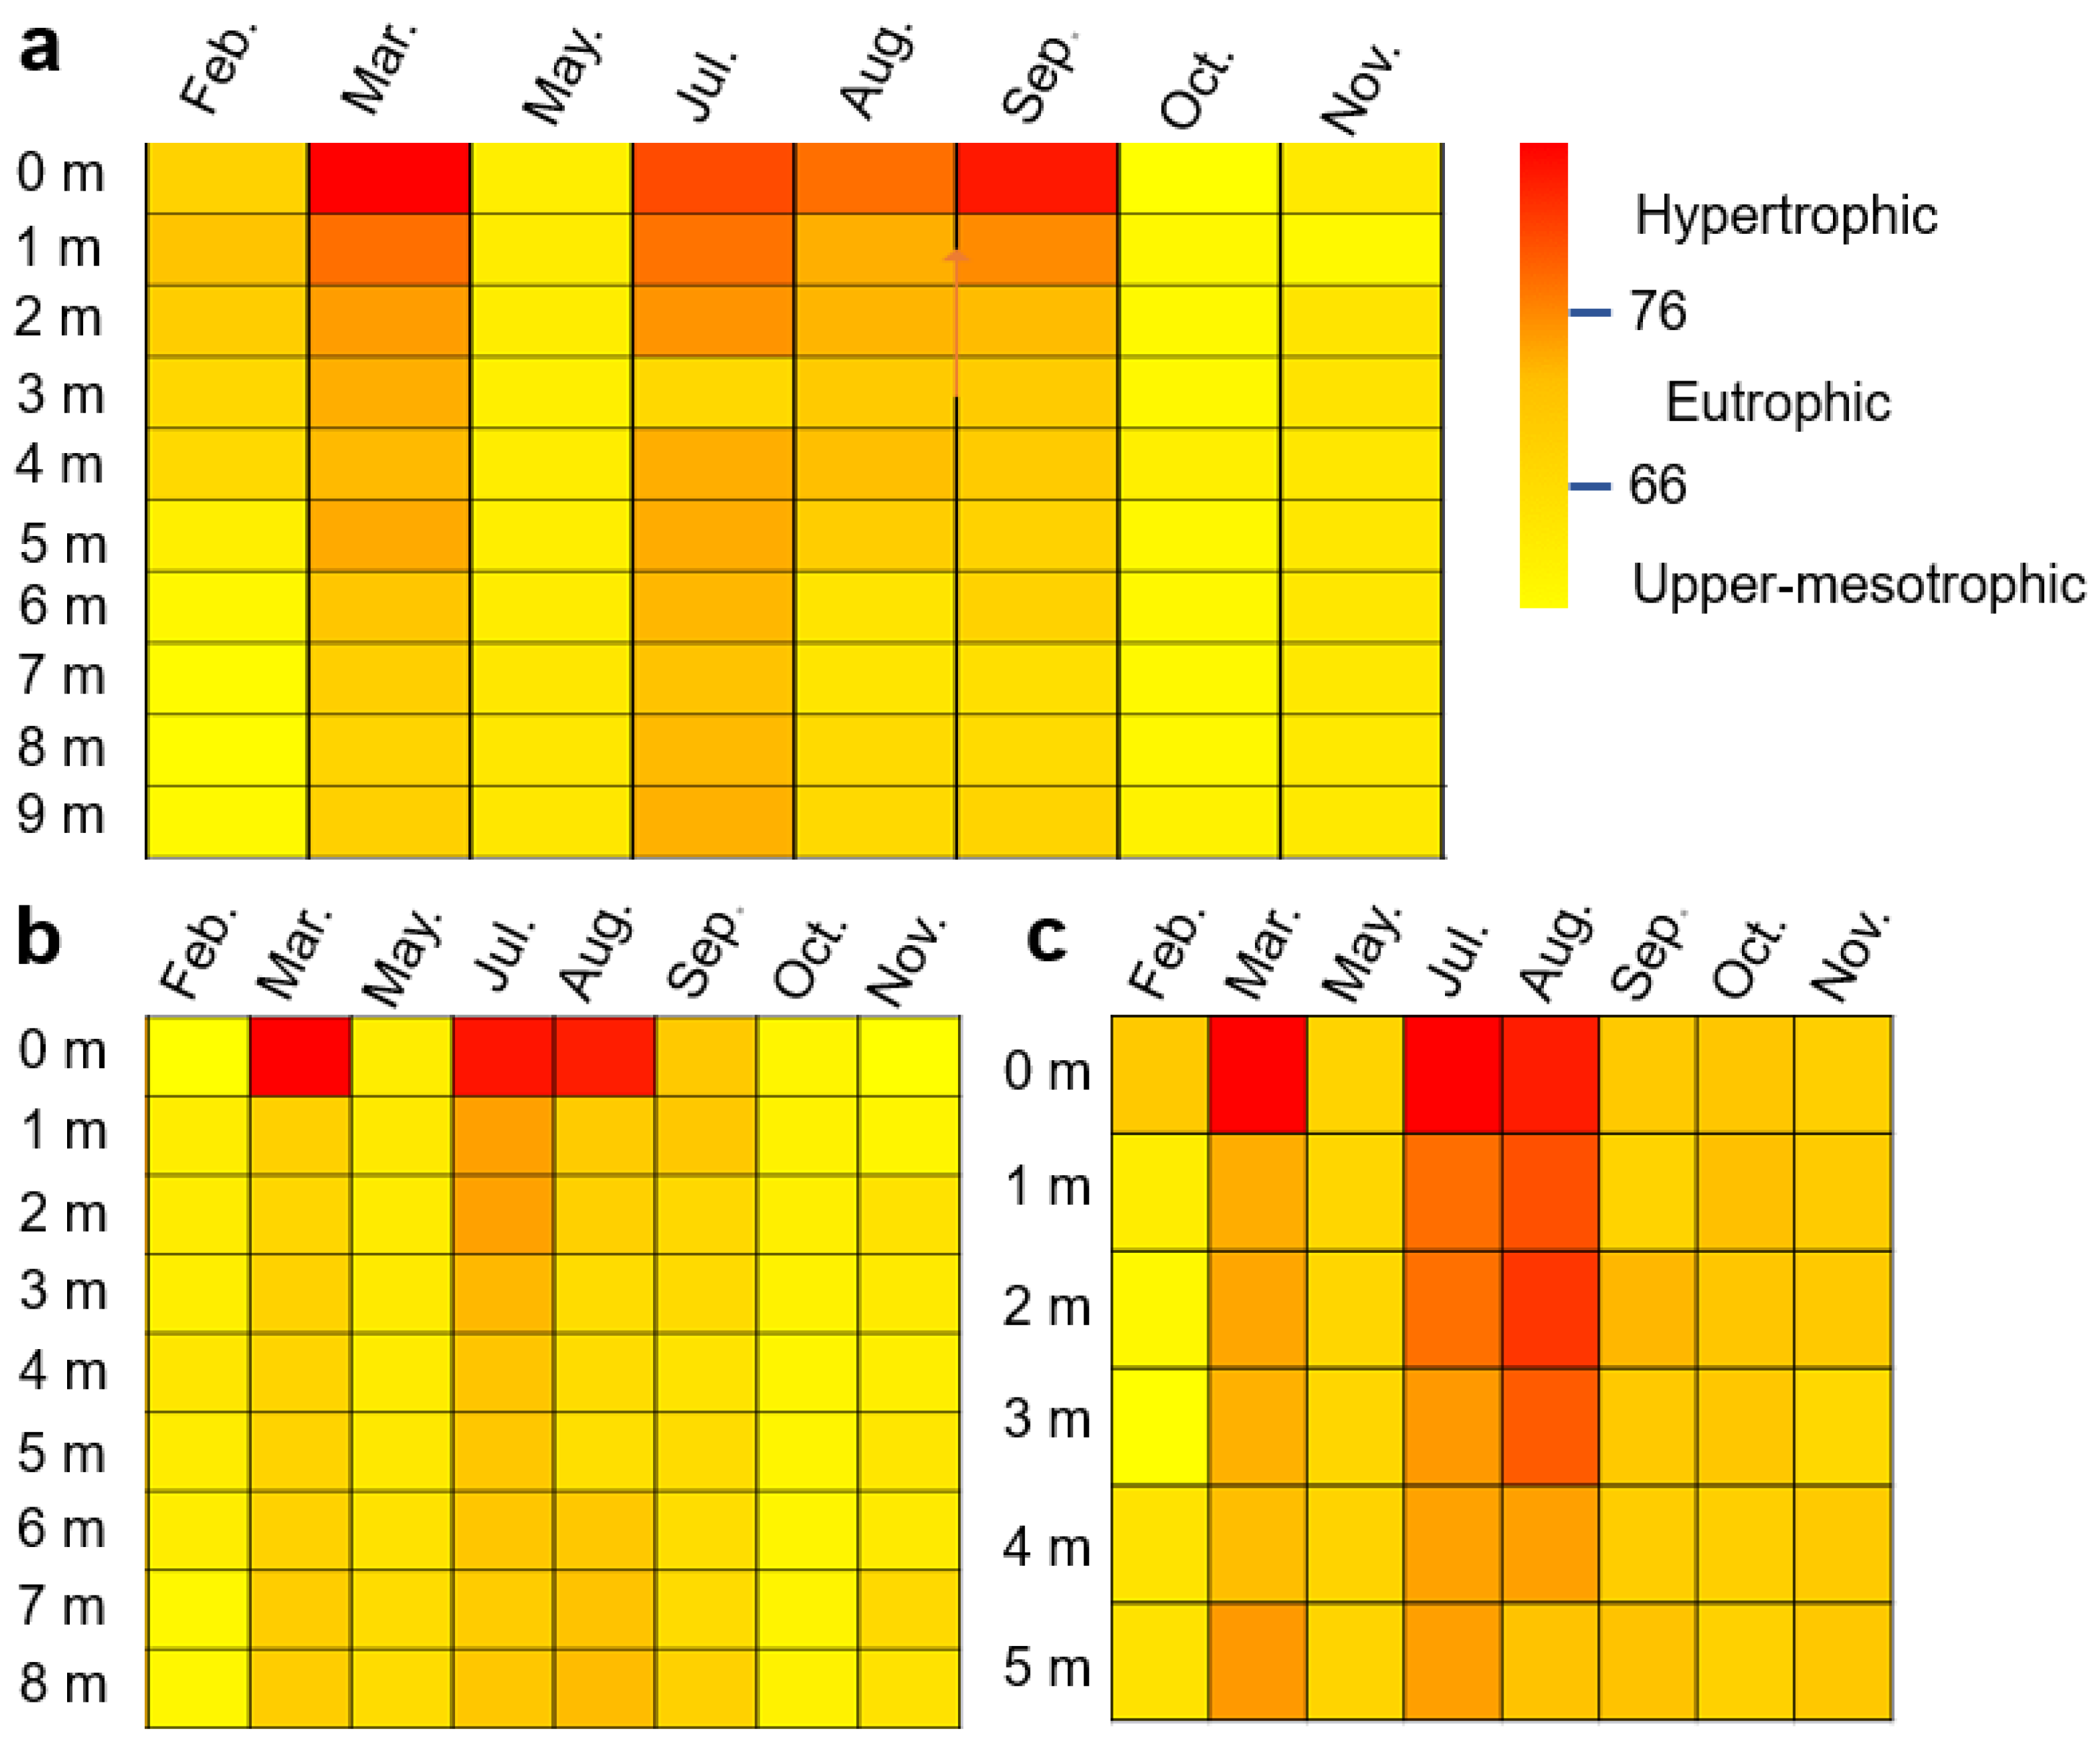
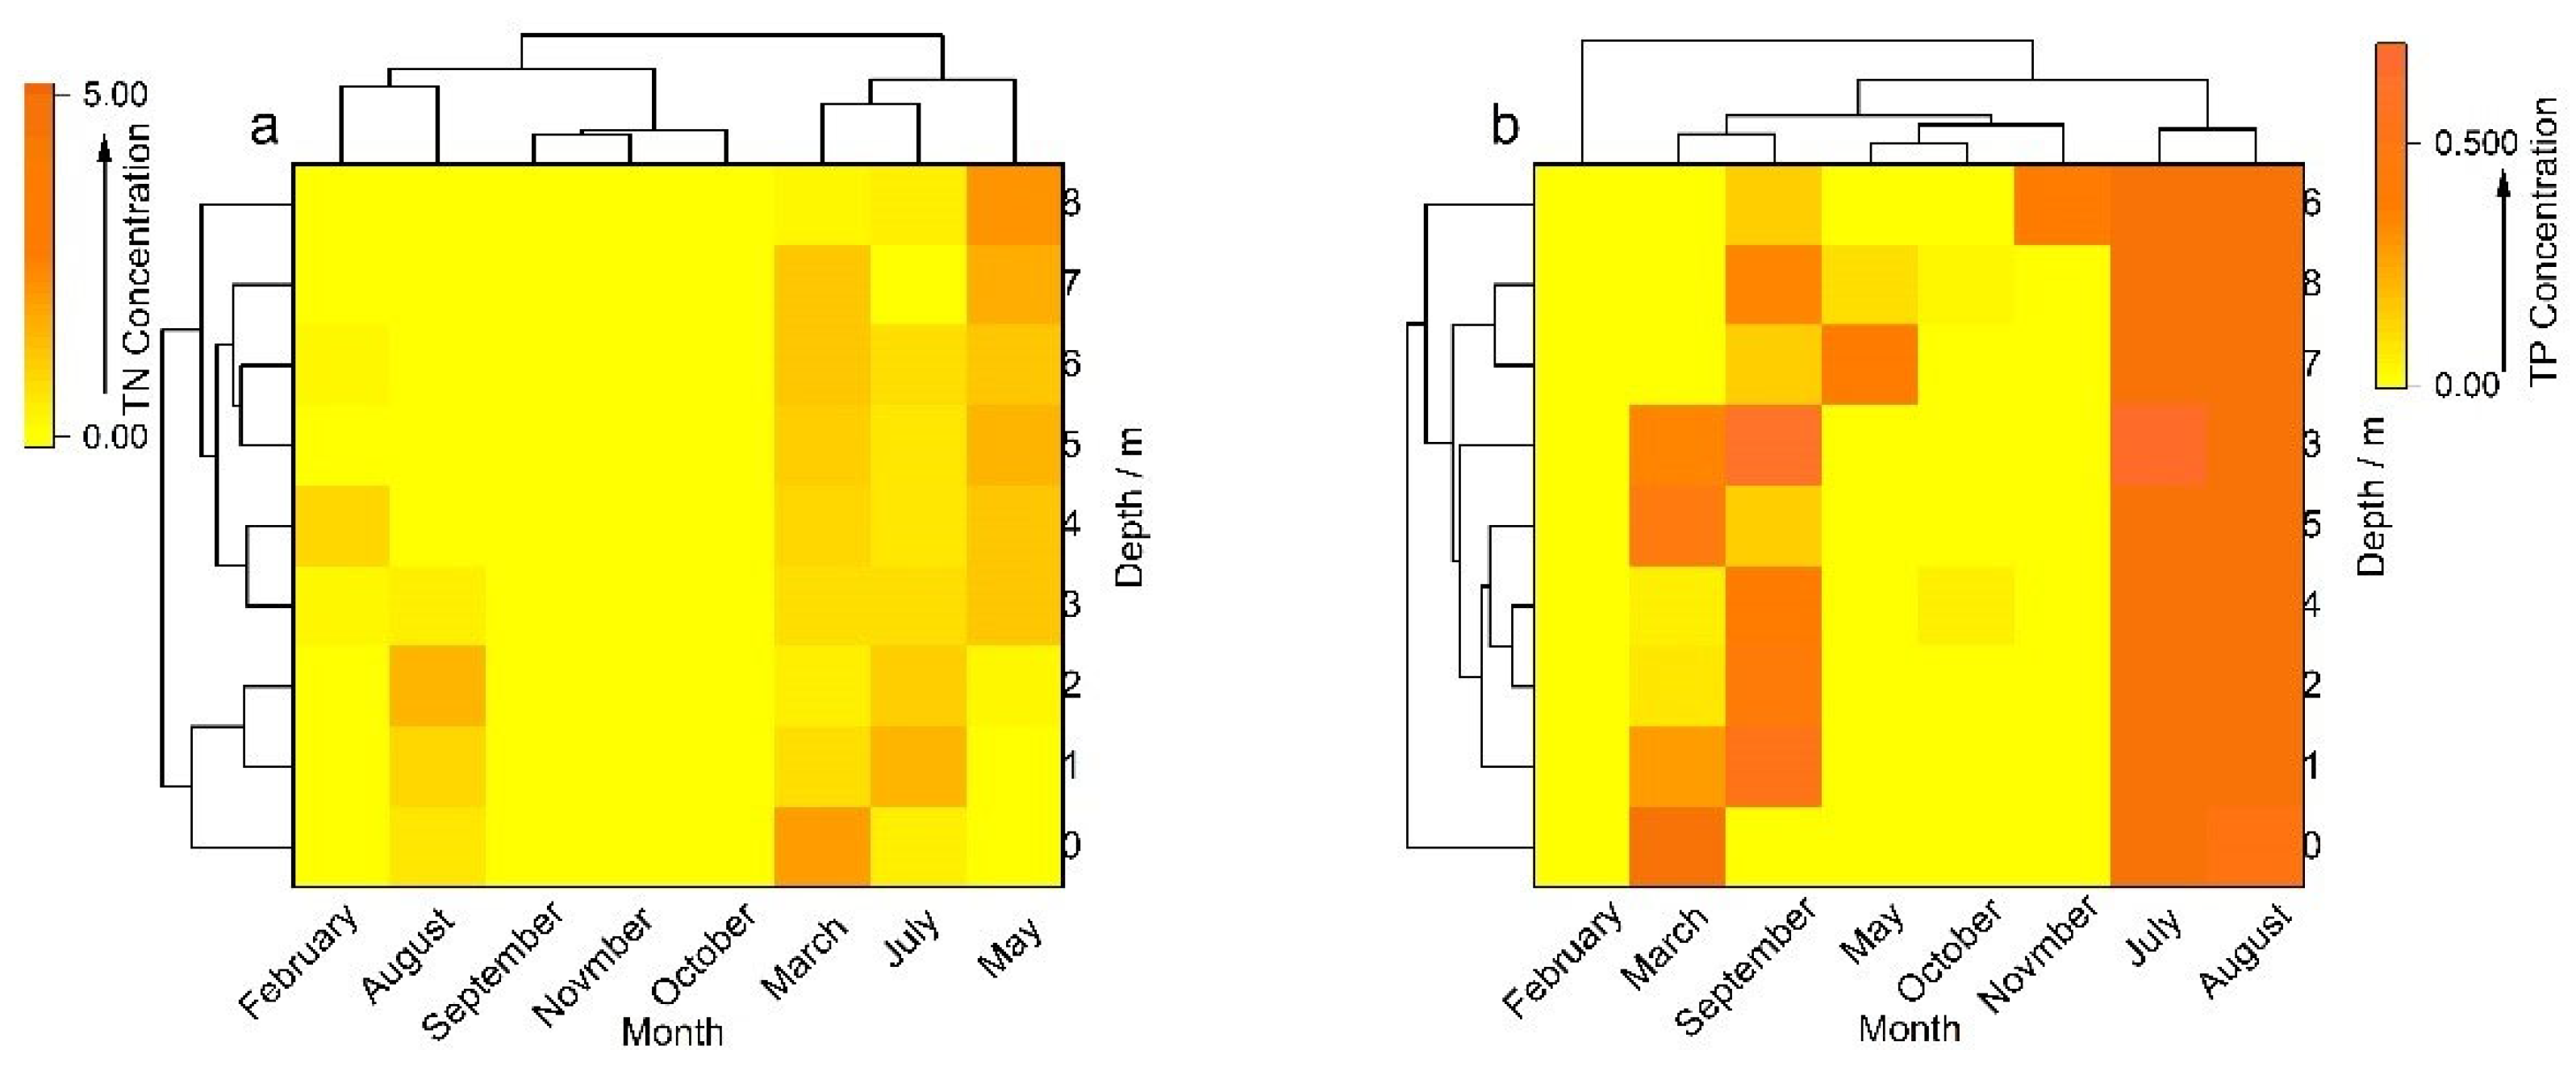
Water quality along the depth gradient in 2017 was analyzed using heatmaps (Figure 10), showing a poor water quality at the top and bottom of the lake. The water quality of Lake Xingyun demonstrated a large seasonal variation. Eutrophication levels were higher in the wet season. The distribution of TP and TN along the depth gradient is illustrated on the heatmap (Figure 11). The highest concentrations of TP and TN were observed at the surface and near the bottom of the lake. Seasonally, the distribution patterns of TP and TN were varied significantly.
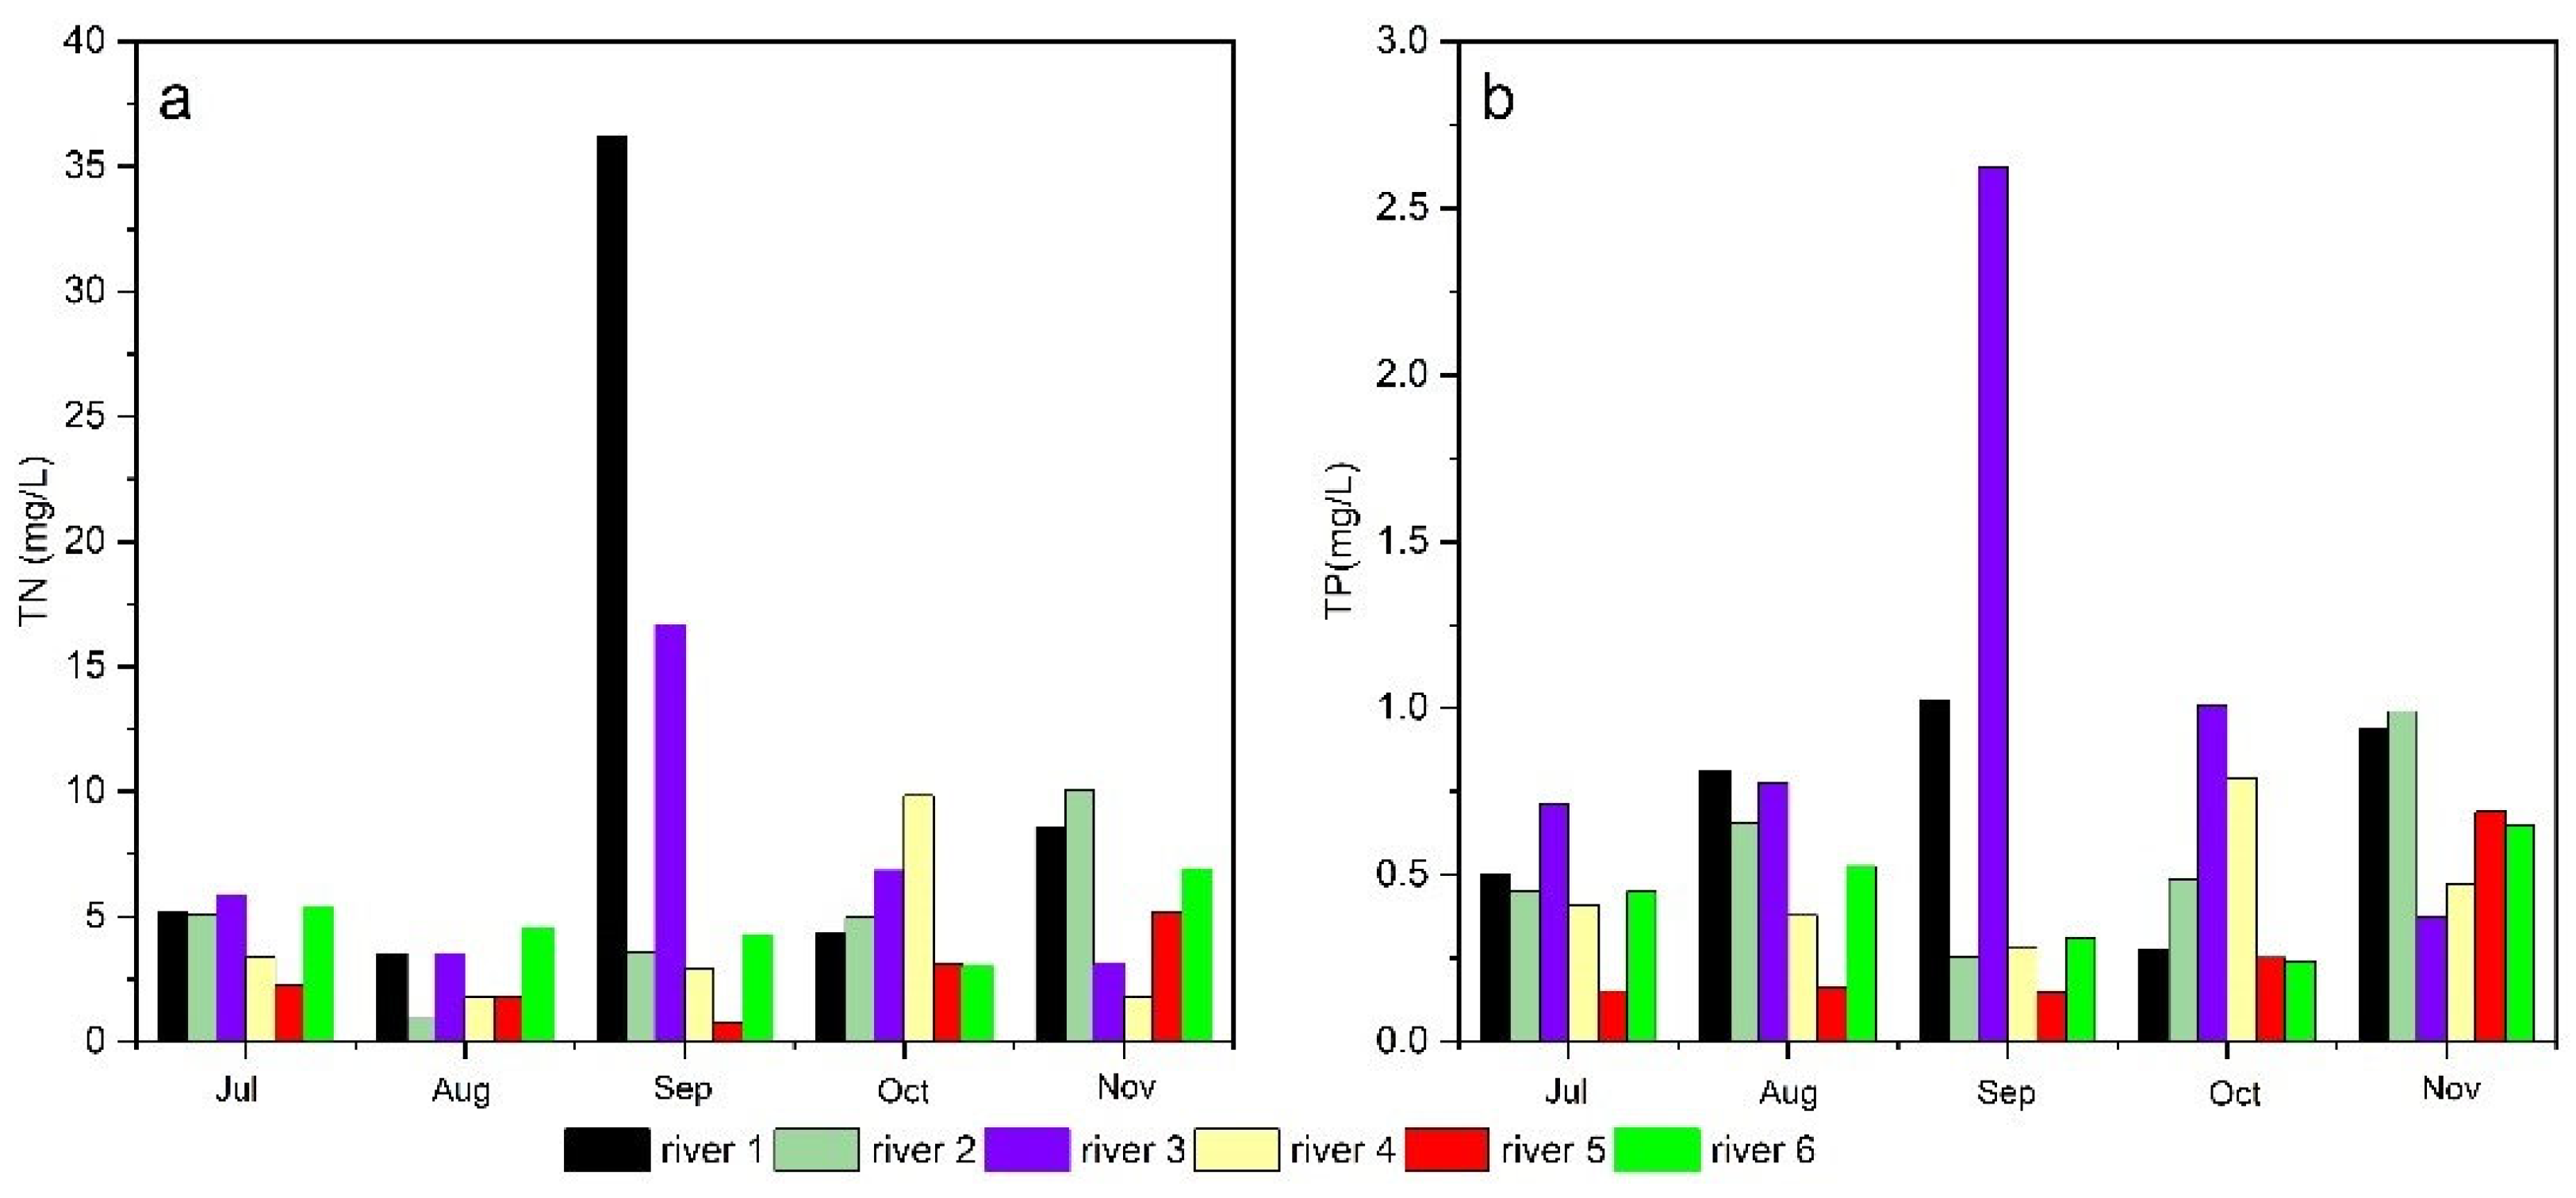
The TN and TP data of six rivers (river 1 to river 6: Dajie river, Xiaojie river, Zhouguan river, Yucun river, Dalongtan river and Zhoudeying river, respectively) entering Lake Xingyun in 2017 were analyzed (Figure 12). The TN and TP values of inflow rivers were higher than those of the lake. Therefore, the primary source of nutrients in Lake Xingyun may be related to the external input. We hypothesize that the water quality of Lake Xingyun may be greatly affected by the nitrogen and phosphorus nutrients from rainwater washing the surrounding farmland during the wet season, reflecting an enormous external load.
There was little variation in the TP content at different depths in the wet season, which could be related to the relatively high DO concentration in cold weather. The oxidation-reduction potential of surface sediments remained at a high value, conducive to the formation of iron oxide or hydroxide [35], with a high content of ferric iron absorbing phosphorus released by sediments. During the dry season, the TP content increased with increased water depth. This may be because the WT in the dry season was relatively high, there was decreased oxidation-reduction potential in surface sediments and there was decreased adsorption capacity of phosphorus released by deposits. The release of phosphorus, adsorbed initially on iron oxide or hydroxide, increased the TP content in the deep-water area [36]. In addition, low oxidation-reduction potentials and hypoxia conditions in surface sediments stimulated the release of polyphosphates by microorganisms [37]. In some lakes, polyphosphates may account for a significant proportion of the total phosphorus in sediments. The TN content is similar to the TP content in seasons and spaces, and the TN content is higher in the wet season. The release of nitrogen from sediment is affected by microbial activity, the degradation of organic matter and the internal phosphorus load in sediment [27,38,39]. Compared with phosphorus, nitrogen cycling in lake sediments is mainly regulated by microbial activity [40]. During the rainy season, the TN content increases significantly with depth, which may be due to the solid microbial activity in the warm season and the decomposition of organic matter in sediments by microorganisms, resulting in the release of ammonium into the water and an increase in the nitrogen concentration in deep water. Therefore, there were also internal sources of pollution in Lake Xingyun.
In regard to the treatment of Lake Xingyun, based on the obtained scores of TP and TN, first of all, we should reduce the use of pesticides and fertilizers in the surrounding farmlands and promote the plantation of green vegetables. Second, wetland sewage treatment systems should be constructed at the surrounding rivers entering the lake to reduce the impact of domestic sewage and livestock pollution. Lastly, the desalting of Lake Xingyun should be made a priority.
3.3. Comprehensive Analysis
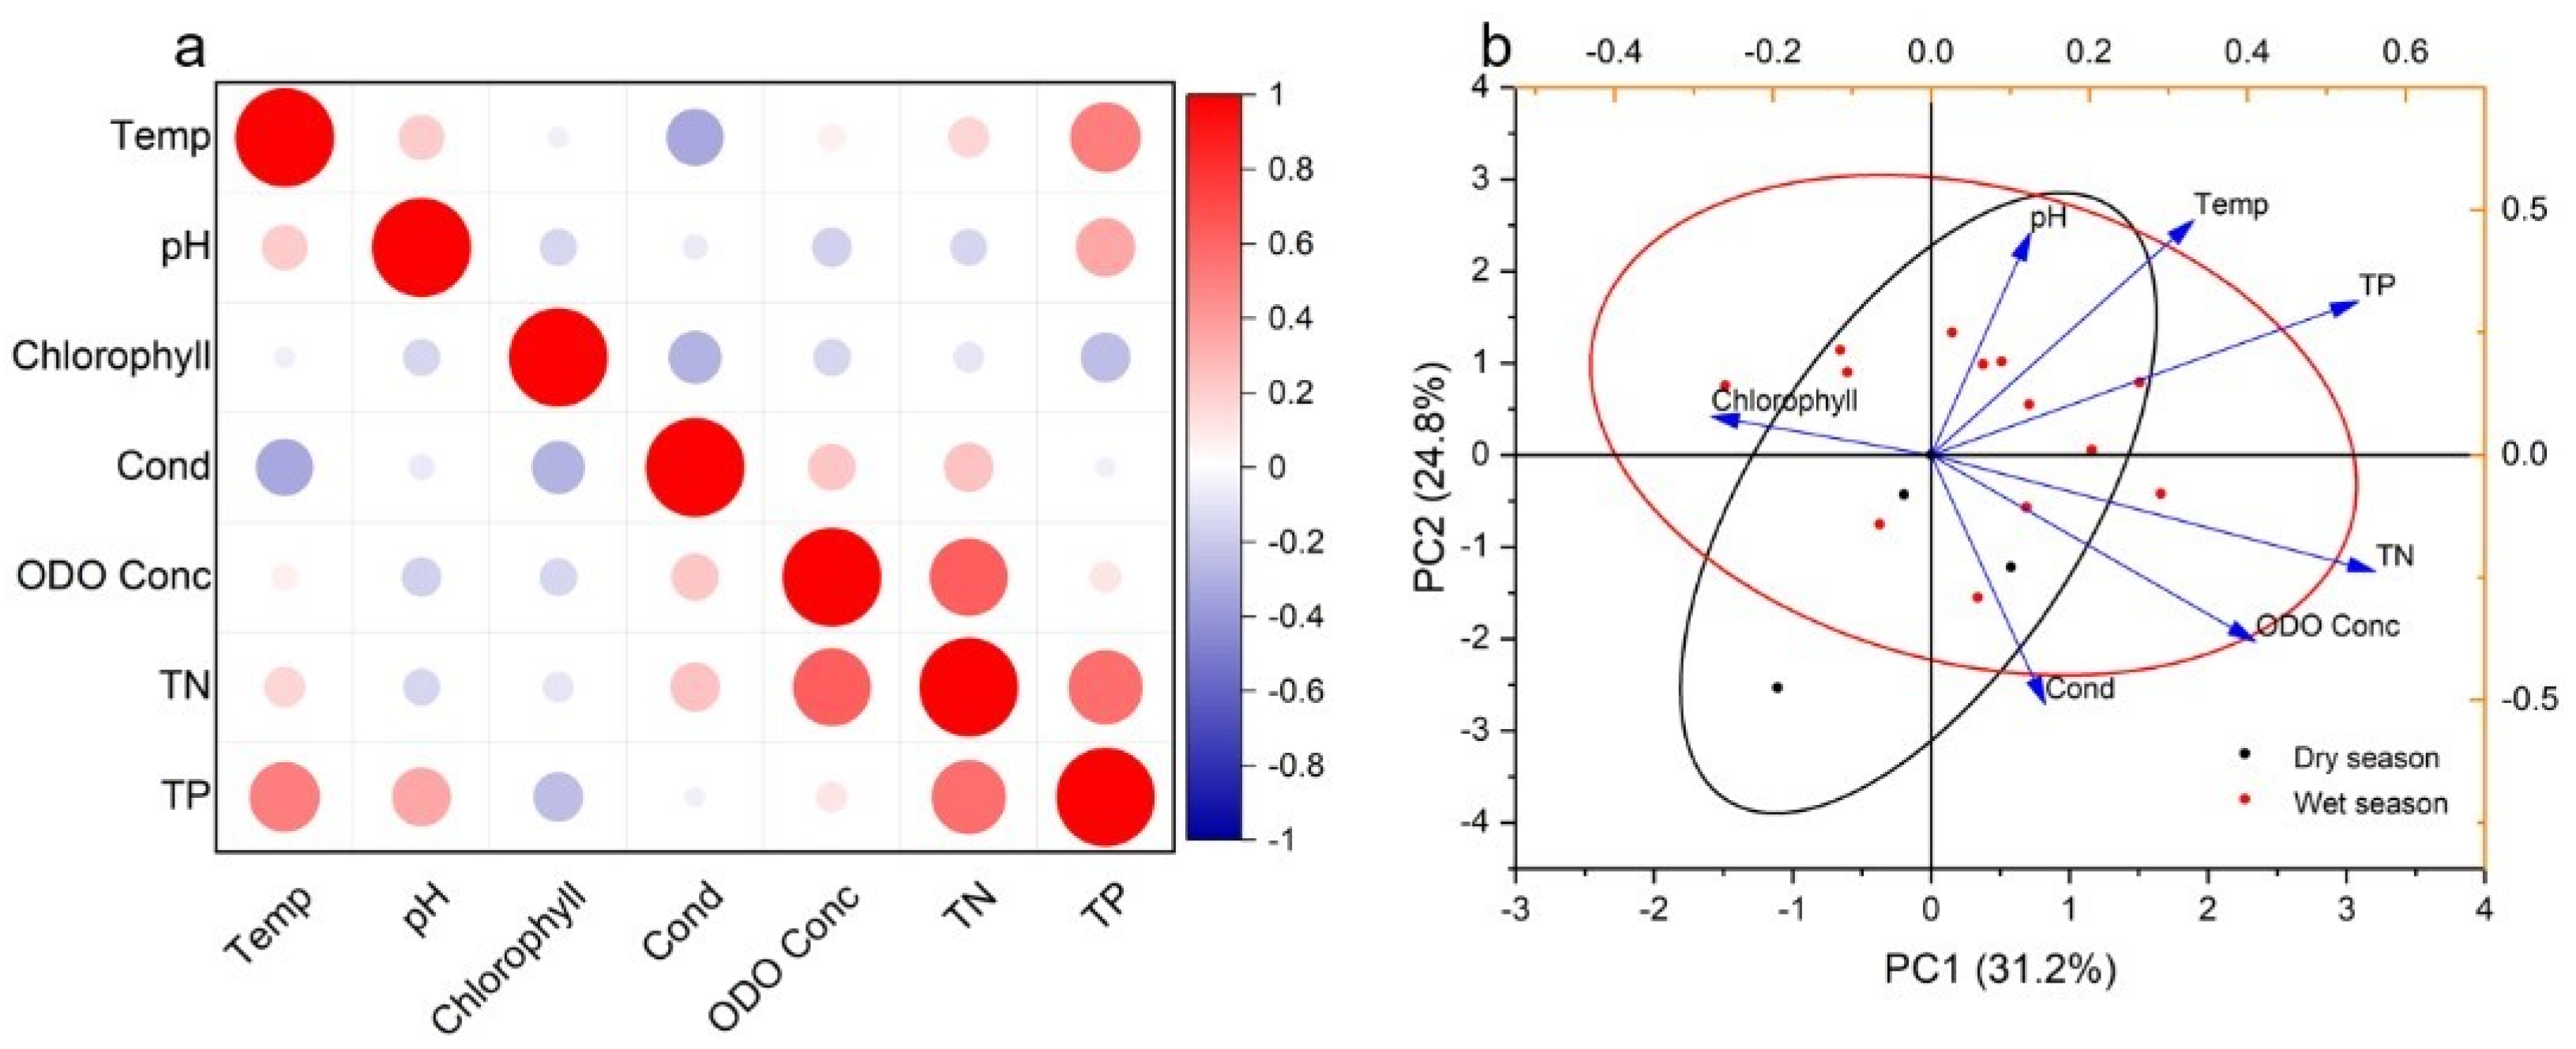
Correlation analysis showed that DO was significantly and positively correlated with TN (F = 0.62, p = 0.0026), TN showed a positive correlation (F = 0.57, p = 0.0074) with TP and temperature was significantly and positively correlated with TP (F = 0.51, p = 0.019) (Figure 13a). A graphical biplot was developed from Principal Component Analysis (PCA) by integrating the indexes of TN and TP with five water quality data matrixes (Figure 13b). The results showed that PC1 was positively correlated with most water quality indicators (i.e., TN, TP and DO) but negatively correlated with chlorophyll. PC2 was positively correlated with temperature, pH and Cond.
4. Discussion
With the increase in water depth, WT, turbidity, pH and DO showed an overall decreasing trend. Factors associated with WT are affected by the hydrological regime, the orographical conditions of its basin [41] and the anthropogenic impact [42,43]. The decrease in pH and DO may be related to algae photosynthesis, pH is an important factor controlling the eutrophication of lakes. An analysis of the spatial and temporal variation characteristics of Lake Cajititlan’s water quality showed significant spatial differences in biochemical oxygen demand (BOD) and pH values, with significant temporal differences in alkalinity, total chlorine, electrical conductivity, COD, total hardness, ammonia nitrogen, pH, total dissolved solids and temperature. The parameters with the most significant spatial variation were pH, , , conductivity, hardness of water and , while pH and temperature were the most influential parameters distinguishing seasons. The temporal behavior of these parameters was related to the transport route of seasonal pollutants [44]. The phosphorus cycle in sediments and the distribution of other micropaleontology, such as ostracism [45,46], also directly affect the forms of inorganic carbon sources in water bodies. Its formation is related to the local geological background, such as the climatic conditions, terrestrial heat flow, etc., the interactions between different nutrient elements, the algal propagation, DO and other factors in artificial eutrophication. High pH is one of the characteristics of Yunnan Plateau lakes. Studies on the relationship between pH and algae showed that cyanobacteria dominated in low acid lakes, while color bacteria dominated in acid lakes. Acidic lakes have more species than less acidic lakes [47], and cyanobacteria were utterly absent from habitats with a pH of less than 4 [48]. DO is inversely proportional to salinity and temperature but positively correlated with hydrodynamic intensity, and the DO level is related to algae’s photosynthesis. The influencing factors are not only related to its natural geological background and climatic conditions but also to the sewage and industrial wastewater released by human activities and agricultural pollution [49]. During the wet season, the hydrodynamics of Lake Xingyun were enhanced as wind and waves, resulting in an increase in the water mixing and DO. In the dry season, the parameters have some spatial heterogeneity in the horizontal direction due to differences in the lake basin landscape, geographical location, wind and wave action. The seasonal variation in chlorophyll in Lake Xingyun may be related to algal succession and urges further experimental analysis and research.
The analysis results of nutrients showed high concentrations of nitrogen and phosphorus in Lake Xingyun, with TN concentrations ranging from 1.64 to 2.57 mg/L and TP concentrations ranging from 0.27 to 0.52 mg/L. The content of TP in the wet season was almost twice that in the dry season, showing that the nutrient discharge into the lake was pronounced in the wet season, and the exogenous pollution was serious. Fertilization residues in farmland are washed into the lake by rainwater; the main source of nitrogen in the catchment is vegetable cultivation. Most of the TN enters the lake through tributaries during the rainy season. This is the reason for the increase in the annual TN load in the lake over the past 30 years [50]. Analysis results show that, since 2000, the water pollution index has gradually increased and is positively correlated with farmland, fully indicating that the deterioration of water quality may be the result of non-point source pollution [51]. Luo et al. [27] discussed the nutrient concentrations in the main tributaries of Lake Xingyun from January 2010 to April 2018. Their results revealed that the multi-year average load for TN is 183.8 t/year, and the multi-year average load for TP is 23.3 t/year. The external loads of TN and TP increase significantly during high-flow periods. Among them, the TN and TP load account for 84.9% and 84.0% of the annual load during the rainy season (May–October), respectively. Similar findings have been observed in other lakes, Zhen et al. analyzed the monitoring data of Lake Poyang (Jiujiang, China) and found that the increasingly intensive chemical fertilizer use by local farmers has caused a relatively high concentration of total nitrogen and total phosphorus and chemical oxygen demand (COD) in Lake Poyang, leading to moderate to severe eutrophication, which has worsened in recent years [52]. Chen et al. collected data on 11 water quality indicators from the mainstream and major tributaries of the Danjiangkou Reservoir Basin in central China during 2012–2014 to analyze the water spatial-temporal variation and evaluate the water pollution situation. Their results showed that the study area was being affected by industrial and domestic sewage [23].
In addition, the release of the TN and TP from the sediment is also a potential cause of eutrophication in the lake [27,53,54,55]. Cheng et al. [39] showed that the concentration of TN in the surface sediment of Lake Xingyun is 5140 mg/kg, and that of TP is 4790 mg/kg, which are the highest concentrations in the nine great plateau lakes of Yunnan. Sakamoto et al. [56] estimated that the bottom sediments of Lake Xingyun store 25% of the TN input to the catchment. In addition to the internal load contained in the sediment, cyanobacteria and water hyacinth in the lake also produce internal pollution due to their own decomposition, and the biomass of both nutrient types has increased in recent years. It has been shown that internal loading is a key component of lake eutrophication [57,58]. The water quality evaluation of Lake Xingyun was in the V class all year round, with almost all points being heavy eutrophic. The nutrients in Lake Xingyun were mainly derived from the simultaneous effects of external input and internal pollution.
Despite the analysis of the spatiotemporal variation patterns of water quality, and the seasonal characteristics of the water quality and eutrophication in Lake Xingyun being discussed, long-term observations of hydrodynamic conditions, nutrients and phytoplankton in Lake Xingyun are lacking—for example, to identify its causes for changes in the phytoplankton community structure and the driving mechanism of bloom. At the same time, the impact of human activities on the water quality of Lake Xinyun has not been fully understood. Our study only collected samples from six rivers entering the lake for analysis, while the other seasonal rivers were not sampled, as the exogenous nitrogen and phosphorus pollution from them usually discharge large amounts of pollutants, affecting the nutrients in Lake Xingyun, Therefore, much work remains to be done to gain a more comprehensive and in-depth understanding of the ecological and environmental impacts of the Lake Xingyun watershed.
5. Conclusions
By using water quality monitoring data from 2016 to 2021 on Lake Xingyun, complex seasonal variations in water quality parameters were revealed. The results show that there is no obvious thermal stratification in the vertical direction; changes in pH and DO are caused by physical and biochemical processes, especially at the bottom of Lake Xingyun, which has an anaerobic environment. The pH of Lake Xingyun is alkaline throughout the year, with the increase in depth. WT, turbidity, pH and DO show an overall decreasing trend. In the dry season, the surface spatial heterogeneity of WT, turbidity, pH and Chl-a was greater than that of the bottom. Except for DO, small differences were observed in the spatial heterogeneity of pH and DO in the surface and bottom waters, but they were larger for turbidity and Chl-a. During the wet season, the hydrodynamics of Lake Xingyun were enhanced as wind and waves, resulting in an increase in the water mixing and DO. The content of TP in the wet season was almost twice that in the dry season. The nutrient loads from the catchment area are continuously high, providing excessive nutrients for the growth of planktonic algae, and even in areas where the exogenous nutrient input is low, there are still conditions for cyanobacterial blooming. In addition, the intra-lake load is also an important cause of lake eutrophication; sediments, especially under hypoxic conditions, are potentially major sources of nutrients that may stimulate lake eutrophication, indicating that the nutrient-rich surface sediment was a significant source of N and P that might be released under hypoxic circumstances at the sediment–water interface or resuspended by wind at the lake’s surface. In addition to the internal load contained in the sediment, cyanobacteria and water hyacinth in the lake also produce internal pollution due to their own decomposition. Eutrophication leads to the loss of biodiversity, the disruption of food chains and the reduction in ecosystem services. Algal blooming and toxic by-products have negative impacts on fisheries and economic development, leading to declining ecosystem services.
The effective control will need long-term and arduous work; however, the first step should be to gradually control and reduce the area of farmland near the lake, reduce the use of pesticides and fertilizers and promote green vegetable plantations. Secondly, wetland sewage treatment systems should be constructed at the surrounding rivers that enter the lake to reduce the impact of domestic sewage and livestock pollution, regular dredging and management should be performed to reduce the lake’s internal pollution hazards and another alternate strategy for reducing eutrophication may be to directly remove the accumulated algae from surface waters, thus achieving the sustainable development and utilization of lake resources.
Author Contributions
H.Z. and Y.Z. (Yanbo Zeng) designed the study. F.C., X.W., Q.L., L.D. and Y.Z. (Yang Zhang) collected and analyzed the data used. Y.Z. (Yanbo Zeng) wrote the first draft of the article. H.Z. contributed to the final version of the manuscript. All authors have read and agreed to the published version of the manuscript.
Funding
This research was funded by the Yunnan Provincial Government Scientist workshop, the Special Project for Social Development of Yunnan Province (Grant No. 202103AC100001), the Natural Science Foundation of Yunnan Province (2018FH 001-047) and the Yunnan Provincial Government Scientist workshop and the China Scholarship Council (No. 202007030022).
Institutional Review Board Statement
Not applicable.
Informed Consent Statement
Not applicable.
Data Availability Statement
Not applicable.
Acknowledgments
We thank all the students who participated in the fieldwork and laboratory analyses.
Conflicts of Interest
The author declares no conflict of interest.
References
- Beets, D.J.; van der Spek, A.J.F. The Holocene evolution of the barrier and the back-barrier basins of Belgium and the Netherlands as a function of late Weichselian morphology, relative sea-level rise and sediment supply. Geol. En Mijnb. Neth. J. Geosci. 2000, 79, 3–16. [Google Scholar] [CrossRef] [Green Version]
- Duncan, R. Regulating agricultural land use to manage water quality: The challenges for science and policy in enforcing limits on non-point source pollution in New Zealand. Land Use Policy 2014, 41, 378–387. [Google Scholar] [CrossRef] [Green Version]
- Whitehead, P.G.; Wilby, R.L.; Battarbee, R.W.; Kernan, M.; Wade, A.J. A review of the potential impacts of climate change on surface water quality. Hydrol. Sci. J. 2009, 54, 101–123. [Google Scholar] [CrossRef] [Green Version]
- Bilgin, A.; Konanç, M.U. Evaluation of surface water quality and heavy metal pollution of Coruh River Basin (Turkey) by multivariate statistical methods. Environ. Earth Sci. 2016, 75, 1029. [Google Scholar] [CrossRef]
- Abbaspour, K.C.; Yang, J.; Maximov, I.; Siber, R.; Bogner, K.; Mieleitner, J.; Zobrist, J.; Srinivasan, R. Modelling hydrology and water quality in the pre-alpine/alpine Thur watershed using SWAT. J. Hydrol. 2007, 333, 413–430. [Google Scholar] [CrossRef]
- Zhen, S.; Zhu, W. Analysis of isotope tracing of domestic sewage sources in Taihu Lake—A case study of Meiliang Bay and Gonghu Bay. Ecol. Indic. 2016, 66, 113–120. [Google Scholar] [CrossRef]
- Bu, H.; Tan, X.; Li, S.; Zhang, Q. Temporal and spatial variations of water quality in the Jinshui River of the South Qinling Mts., China. Ecotoxicol. Environ. Saf. 2010, 73, 907–913. [Google Scholar] [CrossRef]
- Iscen, C.F.; Emiroglu, Ö.; Ilhan, S.; Arslan, N.; Yilmaz, V.; Akiska, S. Application of multivariate statistical techniques in the assessment of surface water quality in Uluabat Lake, Turkey. Environ. Monit. Assess. 2007, 144, 269–276. [Google Scholar] [CrossRef]
- Van Vliet, M.T.H.; Ludwig, F.; Zwolsman, J.J.G.; Weedon, G.P.; Kabat, P. Global river temperatures and sensitivity to atmospheric warming and changes in river flow. Water Resour. Res. 2011, 47, W02544. [Google Scholar] [CrossRef]
- O’Reilly, C.M.; Alin, S.R.; Plisnier, P.-D.; Cohen, A.S.; McKee, B.A. Climate change decreases aquatic ecosystem productivity of Lake Tanganyika, Africa. Nature 2003, 424, 766–768. [Google Scholar] [CrossRef]
- Xu, W.; Duan, L.; Wen, X.; Li, H.; Li, D.; Zhang, Y.; Zhang, H. Effects of Seasonal Variation on Water Quality Parameters and Eutrophication in Lake Yangzong. Water 2022, 14, 2732. [Google Scholar] [CrossRef]
- Huang, C.; Li, Y.; Yang, H.; Sun, D.; Yu, Z.; Zhang, Z.; Chen, X.; Xu, L. Detection of algal bloom and factors influencing its formation in Taihu Lake from 2000 to 2011 by MODIS. Environ. Earth Sci. 2013, 71, 3705–3714. [Google Scholar] [CrossRef]
- Qin, B.; Zhu, G.; Gao, G.; Zhang, Y.; Li, W.; Paerl, H.W.; Carmichael, W.W. A Drinking Water Crisis in Lake Taihu, China: Linkage to Climatic Variability and Lake Management. Environ. Manag. 2009, 45, 105–112. [Google Scholar] [CrossRef] [PubMed]
- Wang, Y.; Ma, H.; Sheng, D.; Wang, D. Assessing the Interactions between Chlorophyll a and Environmental Variables Using Copula Method. J. Hydrol. Eng. 2012, 17, 495–506. [Google Scholar] [CrossRef]
- Modabberi, A.; Noori, R.; Madani, K.; Ehsani, A.H.; Mehr, A.D.; Hooshyaripor, F.; Kløve, B. Caspian Sea is eutrophying: The alarming message of satellite data. Environ. Res. Lett. 2020, 15, 124047. [Google Scholar] [CrossRef]
- Wu, G.; Xu, Z. Prediction of algal blooming using EFDC model: Case study in the Daoxiang Lake. Ecol. Model. 2011, 222, 1245–1252. [Google Scholar] [CrossRef]
- Liu, W.-C.; Yu, H.-L.; Chung, C.-E. Assessment of Water Quality in a Subtropical Alpine Lake Using Multivariate Statistical Techniques and Geostatistical Mapping: A Case Study. Int. J. Environ. Res. Public Health 2011, 8, 1126–1140. [Google Scholar] [CrossRef] [PubMed] [Green Version]
- Palma, P.; Alvarenga, P.; Palma, V.L.; Fernandes, R.M.; Soares, A.; Barbosa, I. Assessment of anthropogenic sources of water pollution using multivariate statistical techniques: A case study of the Alqueva’s reservoir, Portugal. Environ. Monit. Assess. 2009, 165, 539–552. [Google Scholar] [CrossRef]
- Joshi, J.; Abhyankar, A.A. Evaluation of Spatial and Temporal Variations in Water Quality of River Ganga. Int. J. Ecol. Dev. 2019, 34, 69–81. [Google Scholar]
- Sun, X.; Zhang, H.; Zhong, M.; Wang, Z.; Liang, X.; Huang, T.; Huang, H. Analyses on the Temporal and Spatial Characteristics of Water Quality in a Seagoing River Using Multivariate Statistical Techniques: A Case Study in the Duliujian River, China. Int. J. Environ. Res. Public Health 2019, 16, 1020. [Google Scholar] [CrossRef] [Green Version]
- Yerel, S. Assessment of Surface Water Quality using Multivariate Statistical Analysis Techniques: A Case Study from Tahtali Dam, Turkey. Asian J. Chem. 2009, 21, 4054–4062. [Google Scholar]
- Najafzadeh, M.; Homaei, F.; Farhadi, H. Reliability assessment of water quality index based on guidelines of national sanitation foundation in natural streams: Integration of remote sensing and data-driven models. Artif. Intell. Rev. 2021, 54, 4619–4651. [Google Scholar] [CrossRef]
- Chen, P.; Li, L.; Zhang, H. Spatio-Temporal Variations and Source Apportionment of Water Pollution in Danjiangkou Reservoir Basin, Central China. Water 2015, 7, 2591–2611. [Google Scholar] [CrossRef] [Green Version]
- Zhang, Y.; Chang, F.; Zhang, X.; Li, D.; Liu, Q.; Liu, F.; Zhang, H. Release of Endogenous Nutrients Drives the Transformation of Nitrogen and Phosphorous in the Shallow Plateau of Lake Jian in Southwestern China. Water 2022, 14, 2624. [Google Scholar] [CrossRef]
- GB3838-2002; Environmental Quality Standard for Surface Water. State Environmental Protection Administration (SEPA): Beijing, China, 2002; pp. 1–8.
- Zhou, X.F. Characterization and sources of sedimentary organic matter in Xingyun Lake, Jiangchuan, Yunnan, China. Environ. Earth Sci. 2016, 75, 1–11. [Google Scholar] [CrossRef]
- Luo, L.; Zhang, H.; Luo, C.; McBridge, C.; Muraoka, K.; Zhou, H.; Hou, C.; Liu, F.; Li, H. Tributary Loadings and Their Impacts on Water Quality of Lake Xingyun, a Plateau Lake in Southwest China. Water 2022, 14, 1281. [Google Scholar] [CrossRef]
- Chen, X.; Huang, X.; Wu, D.; Chen, J.; Zhang, J.; Zhou, A.; Dodson, J.; Zawadzki, A.; Jacobsen, G.; Yu, J.; et al. Late Holocene land use evolution and vegetation response to climate change in the watershed of Xingyun Lake, SW China. CATENA 2021, 211, 105973. [Google Scholar] [CrossRef]
- Wu, D.; Chen, X.; Lv, F.; Brenner, M.; Curtis, J.; Zhou, A.; Chen, J.; Abbott, M.; Yu, J.; Chen, F. Decoupled early Holocene summer temperature and monsoon precipitation in southwest China. Quat. Sci. Rev. 2018, 193, 54–67. [Google Scholar] [CrossRef]
- Hillman, A.L.; Abbott, M.B.; Finkenbinder, M.S.; Yu, J. An 8600 year lacustrine record of summer monsoon variability from Yunnan, China. Quat. Sci. Rev. 2017, 174, 120–132. [Google Scholar] [CrossRef]
- Zhao, L.; Li, Y.; Zou, R.; He, B.; Zhu, X.; Liu, Y.; Wang, J.; Zhu, Y. A three-dimensional water quality modeling approach for exploring the eutrophication responses to load reduction scenarios in Lake Yilong (China). Environ. Pollut. 2013, 177, 13–21. [Google Scholar] [CrossRef]
- Jin, X. Lacustrine Environment in China; Ocean Press: Beijing, China, 1995. [Google Scholar]
- Xu, M.; Yu, L.; Zhao, Y.; Li, M. The Simulation of Shallow Reservoir Eutrophication Based on MIKE21: A Case Study of Douhe Reservoir in North China. Procedia Environ. Sci. 2012, 13, 1975–1988. [Google Scholar] [CrossRef] [Green Version]
- Doi, H. Spatial patterns of autochthonous and allochthonous resources in aquatic food webs. Popul. Ecol. 2008, 51, 57–64. [Google Scholar] [CrossRef]
- Markovic, S.; Liang, A.; Watson, S.B.; Guo, J.; Mugalingam, S.; Arhonditsis, G.; Morley, A.; Dittrich, M. Biogeochemical mechanisms controlling phosphorus diagenesis and internal loading in a remediated hard water eutrophic embayment. Chem. Geol. 2019, 514, 122–137. [Google Scholar] [CrossRef]
- Yang, C.; Yang, P.; Geng, J.; Yin, H.; Chen, K. Sediment internal nutrient loading in the most polluted area of a shallow eutrophic lake (Lake Chaohu, China) and its contribution to lake eutrophication. Environ. Pollut. 2020, 262, 114292. [Google Scholar] [CrossRef]
- Xie, L.; Xie, P.; Tang, H. Enhancement of dissolved phosphorus release from sediment to lake water by Microcystis blooms—An enclosure experiment in a hyper-eutrophic, subtropical Chinese lake. Environ. Pollut. 2003, 122, 391–399. [Google Scholar] [CrossRef]
- Zheng, Y.; Jiang, X.; Hou, L.; Liu, M.; Lin, X.; Gao, J.; Li, X.; Yin, G.; Yu, C.; Wang, R. Shifts in the community structure and activity of anaerobic ammonium oxidation bacteria along an estuarine salinity gradient. J. Geophys. Res. Biogeosci. 2016, 121, 1632–1645. [Google Scholar] [CrossRef] [Green Version]
- Cheng, N.; Liu, L.; Hou, Z.; Wu, J.; Wang, Q. Pollution characteristics and risk assessment of surface sediments in nine plateau lakes of Yunnan Province. In Proceedings of the 4th International Conference on Energy Engineering and Environmental Protection (EEEP), Xiamen, China, 19–21 November 2019. [Google Scholar]
- Liu, C.; Du, Y.; Yin, H.; Fan, C.; Chen, K.; Zhong, J.; Gu, X. Exchanges of nitrogen and phosphorus across the sediment-water interface influenced by the external suspended particulate matter and the residual matter after dredging. Environ. Pollut. 2018, 246, 207–216. [Google Scholar] [CrossRef]
- Pekárová, P.; Halmová, D.; Miklánek, P.; Onderka, M.; Pekár, J.; Škoda, P. Is the Water Temperature of the Danube River at Bratislava, Slovakia, Rising? J. Hydrometeorol. 2008, 9, 1115–1122. [Google Scholar] [CrossRef]
- Borman, M.M.; Larson, L.L. A case study of river temperature response to agricultural land use and environmental thermal patterns. J. Soil Water Conserv. 2003, 58, 8–12. [Google Scholar]
- Huguet, F.; Parey, S.; Dacunha-Castelle, D.; Malek, F. Is there a trend in extremely high river temperature for the next decades? A case study for France. Nat. Hazards Earth Syst. Sci. 2008, 8, 67–79. [Google Scholar] [CrossRef] [Green Version]
- Gradilla-Hernandez, M.S.; de Anda, J.; Garcia-Gonzalez, A.; Meza-Rodríguez, D.; Yebra Montes, C.; Perfecto-Avalos, Y. Multivariate water quality analysis of Lake Cajititlan, Mexico. Environ. Monit. Assess. 2020, 192, 5. [Google Scholar] [CrossRef] [PubMed]
- Flynn, K.J.; Clark, D.R.; Mitra, A.; Fabian, H.; Hansen, P.J.; Glibert, P.M.; Wheeler, G.L.; Stoecker, D.K.; Blackford, J.C.; Brownlee, C. Ocean acidification with (de)eutrophication will alter future phytoplankton growth and succession. Proc. R. Soc. B-Biol. Sci. 2015, 282, 20142604. [Google Scholar] [CrossRef] [PubMed]
- Ramin, N.; Bates, M.H. The effects of pH on the aluminum, iron and calcium phosphate fraction of lake sediments. Water Res. 1979, 13, 813–815. [Google Scholar]
- Brezonik, P.L.; Crisman, T.L.; Schulze, R.L. Planktonic communities in florida softwater lakes of varying ph. Can. J. Fish. Aquat. Sci. 1984, 41, 46–56. [Google Scholar] [CrossRef]
- Brock, T.D. Lower pH limit for the existence of blue-green algae: Evolutionary and ecological implications. Science 1973, 179, 480–483. [Google Scholar] [CrossRef] [PubMed]
- Tutmez, B.; Hatipoglu, Z.; Kaymak, U. Modelling electrical conductivity of groundwater using an adaptive neuro-fuzzy inference system. Comput. Geosci. 2006, 32, 421–433. [Google Scholar] [CrossRef] [Green Version]
- Jin, X.L.; Jin, S.; Liu, H.; Li, Y. Research on amount of total phosphorus entering into Fuxian Lake and Xingyun Lake through dry ad wet deposition caused by surrounding phosphorus chemical factories. Environ. Sci. Surv. 2010, 29, 39–42. (In Chinese) [Google Scholar]
- Zhang, X.; Shao, Y. LUCC impact on water quality change in Xingyun Lake basin. E3S Web Conf. 2020, 198, 04025. [Google Scholar] [CrossRef]
- Zhen, L.; Li, F.; Huang, H.; Dilly, O.; Liu, J.; Wei, Y.; Yang, L.; Cao, X. Households’ willingness to reduce pollution threats in the Poyang Lake region, southern China. J. Geochem. Explor. 2011, 110, 15–22. [Google Scholar] [CrossRef]
- Noori, R.; Ansari, E.; Bhattarai, R.; Tang, Q.; Aradpour, S.; Maghrebi, M.; Haghighi, A.T.; Bengtsson, L.; Kløve, B. Complex dynamics of water quality mixing in a warm mono-mictic reservoir. Sci. Total Environ. 2021, 777, 146097. [Google Scholar] [CrossRef]
- Zhou, B.; Fu, X.; Wu, B.; He, J.; Vogt, R.; Yu, D.; Yue, F.; Chai, M. Phosphorus Release from Sediments in a Raw Water Reservoir with Reduced Allochthonous Input. Water 2021, 13, 1983. [Google Scholar] [CrossRef]
- Shou, C.-Y.; Tian, Y.; Zhou, B.; Fu, X.-J.; Zhu, Y.-J.; Yue, F.-J. The Effect of Rainfall on Aquatic Nitrogen and Phosphorus in a Semi-Humid Area Catchment, Northern China. Int. J. Environ. Res. Public Health 2022, 19, 10962. [Google Scholar] [CrossRef] [PubMed]
- Sakamoto, M.S.M.; Maruo, M.; Murase, J.; Song, X.; Zhang, Z. Distribution and dynamics of nitrogen and phosphorus in the Fuxian and Xingyun lake system in the Yunnan Plateau, China. Yunnan Geogr. Environ. Res. 2002, 14, 1–9. [Google Scholar]
- Qin, B.; Paerl, H.W.; Brookes, J.D.; Liu, J.; Jeppesen, E.; Zhu, G.; Zhang, Y.; Xu, H.; Shi, K.; Deng, J. Why Lake Taihu continues to be plagued with cyanobacterial blooms through 10 years (2007–2017) efforts. Sci. Bull. 2019, 64, 354–356. [Google Scholar] [CrossRef] [Green Version]
- Sondergaard, M.; Kristensen, P.; Jeppesen, E. Phosphorus Release from Resuspended Sediment in the Shallow and Wind-Exposed Lake Arreso, Denmark. Hydrobiologia 1992, 228, 91–99. [Google Scholar] [CrossRef]
Figure 1.
The location of Lake Xingyun and sampling sites.

Figure 2.
Monthly average air temperature and precipitation of Lake Xingyun from 2016 to 2020 (data provided by the Jiangchuan meteorological station).
Figure 2.
Monthly average air temperature and precipitation of Lake Xingyun from 2016 to 2020 (data provided by the Jiangchuan meteorological station).

Figure 3.
Spatiotemporal variation in temperature in Lake Xingyun, measured during 2017. (a) XYH-1. (b) XYH-2. (c) XYH-3. (d) XYH-4. (e) XYH-5.
Figure 3.
Spatiotemporal variation in temperature in Lake Xingyun, measured during 2017. (a) XYH-1. (b) XYH-2. (c) XYH-3. (d) XYH-4. (e) XYH-5.

Figure 4.
Spatiotemporal variation in pH in Lake Xingyun, measured during 2017. (a) XYH-1. (b) XYH-2. (c) XYH-3. (d) XYH-4. (e) XYH-5.
Figure 4.
Spatiotemporal variation in pH in Lake Xingyun, measured during 2017. (a) XYH-1. (b) XYH-2. (c) XYH-3. (d) XYH-4. (e) XYH-5.

Figure 5.
Spatiotemporal variation in DO in Lake Xingyun. measured during 2017. (a) XYH-1. (b) XYH-2. (c) XYH-3. (d) XYH-4. (e) XYH-5.
Figure 5.
Spatiotemporal variation in DO in Lake Xingyun. measured during 2017. (a) XYH-1. (b) XYH-2. (c) XYH-3. (d) XYH-4. (e) XYH-5.

Figure 6.
Spatiotemporal variation in chlorophyll in Lake Xingyun, measured during 2017. (a) XYH-1. (b) XYH-2. (c) XYH-3. (d) XYH-4. (e) XYH-5.
Figure 6.
Spatiotemporal variation in chlorophyll in Lake Xingyun, measured during 2017. (a) XYH-1. (b) XYH-2. (c) XYH-3. (d) XYH-4. (e) XYH-5.

Figure 7.
Spatiotemporal variation in turbidity in Lake Xingyun, measured during 2017. (a) XYH-1. (b) XYH-2. (c) XYH-3. (d) XYH-4. (e) XYH-5.
Figure 7.
Spatiotemporal variation in turbidity in Lake Xingyun, measured during 2017. (a) XYH-1. (b) XYH-2. (c) XYH-3. (d) XYH-4. (e) XYH-5.

Figure 8.
Water quality trend lines of Lake Xingyun from 2016 to 2021. (a) TW. (b) pH. (c) Chl-a. (d) Turbidity. (e) DO.
Figure 8.
Water quality trend lines of Lake Xingyun from 2016 to 2021. (a) TW. (b) pH. (c) Chl-a. (d) Turbidity. (e) DO.

Figure 9.
Average TN and TP concentrations in Lake Xingyun from 2016 to 2021.

Figure 10.
Heat map of the temporal and spatial distribution of water quality in Lake Xingyun in 2017. (a) XYH-1, (b) XYH-3, (c) XYH-5.
Figure 10.
Heat map of the temporal and spatial distribution of water quality in Lake Xingyun in 2017. (a) XYH-1, (b) XYH-3, (c) XYH-5.

Figure 11.
Heatmap showing the temporal and spatial distribution patterns of TN and TP in Lake Xingyun. (a) TN. (b) TP.
Figure 11.
Heatmap showing the temporal and spatial distribution patterns of TN and TP in Lake Xingyun. (a) TN. (b) TP.

Figure 12.
Average TN and TP concentrations in Lake Xingyun inflow rivers in 2017. (a) TN. (b) TP.

Figure 13.
Correlations and principal component analysis of each water parameter in Lake Xingyun. (a) Correlations analysis. (b) principal component analysis.
Figure 13.
Correlations and principal component analysis of each water parameter in Lake Xingyun. (a) Correlations analysis. (b) principal component analysis.


Table 1.
The correlation coefficient for Chl-a to other parameters of Chinese lakes and reservoirs.
| Parameters | Chl-a | TP | TN | SD |
|---|---|---|---|---|
| R1j | 1 | 0.84 | 0.82 | −0.83 |
| 1 | 0.7056 | 0.6724 | 0.6889 | |
| Wj | 0.2663 | 0.1879 | 0.1790 | 0.1834 |
Table 2.
The standard of grading and classification.
| Score Value | 0–35 | 36–45 | 46–55 | 56–65 | 66–75 | 76–85 | 86–95 | 96–100 |
|---|---|---|---|---|---|---|---|---|
| Level | Dystrophic | Lower-Mesotrophic | Mesotrophic | Upper-Mesotrophic | Eutrophic | Hypertrophic | Severe Eutrophic | Abnormal Eutrophic |
Table 3.
The evaluation table of water quality in Lake Xingyun in 2016.
| Monitoring Site | Depth (m) | 2016.5 | 2016.10 | ||||||||
|---|---|---|---|---|---|---|---|---|---|---|---|
| TN (mg/L) | TP (mg/L) | Average | Trophic Level | Category | TN (mg/L) | TP (mg/L) | Average | Trophic Level | Category | ||
| XYH-1 | 0 | 2.68 | 0.60 | 72.9 | Eutrophic | V | 2.09 | 0.45 | 66.07 | Eutrophic | V |
| 1 | 2.33 | 0.46 | 70.8 | Eutrophic | V | 2.53 | 0.46 | 67.11 | Eutrophic | V | |
| 2 | 2.13 | 0.34 | 67.8 | Eutrophic | V | 2.78 | 0.46 | 67.34 | Eutrophic | V | |
| 3 | 2.34 | 0.30 | 66.9 | Eutrophic | V | 2.82 | 0.46 | 67.19 | Eutrophic | V | |
| 4 | 2.90 | 0.34 | 67.1 | Eutrophic | V | 2.43 | 0.46 | 66.96 | Eutrophic | V | |
| 5 | 1.87 | 0.30 | 65.2 | Eutrophic | V | 2.15 | 0.44 | 66.19 | Eutrophic | V | |
| 6 | 1.93 | 0.29 | 64.5 | Eutrophic | V | 2.60 | 0.46 | 66.30 | Eutrophic | V | |
| 7 | 1.90 | 0.31 | 64.2 | Eutrophic | V | 2.80 | 0.47 | 66.07 | Eutrophic | V | |
| 8 | 2.43 | 0.38 | 66.8 | Eutrophic | V | / | / | / | / | / | |
| 9 | 2.67 | 0.42 | 67.6 | Eutrophic | V | / | / | / | / | / | |
| Average | 2.62 | 0.37 | 67.4 | Eutrophic | V | 2.53 | 0.46 | 66.65 | Eutrophic | V | |
| XYH-2 | 0 | 1.98 | 0.28 | 65.22 | Eutrophic | V | / | / | / | / | / |
| 1 | 1.84 | 0.29 | 65.79 | Eutrophic | V | / | / | / | / | / | |
| 2 | 2.11 | 0.29 | 64.37 | Upper-mesotrophic | V | / | / | / | / | / | |
| 3 | 1.66 | 0.29 | 65.06 | Eutrophic | V | / | / | / | / | / | |
| 4 | 1.80 | 0.29 | 64.99 | Upper-mesotrophic | V | / | / | / | / | / | |
| 5 | 1.96 | 0.28 | 64.36 | Eutrophic | V | / | / | / | / | / | |
| 6 | 3.44 | 0.29 | 63.83 | Upper-mesotrophic | V | / | / | / | / | / | |
| 7 | 2.14 | 0.29 | 63.49 | Upper-mesotrophic | V | / | / | / | / | / | |
| 8 | 2.49 | 0.29 | 63.58 | Upper-mesotrophic | V | / | / | / | / | / | |
| 9 | 2.65 | 0.38 | 65.19 | Eutrophic | V | / | / | / | / | / | |
| Average | 2.2 | 0.30 | 64.59 | Eutrophic | V | / | / | / | / | / | |
| XYH-3 | 0 | 2.06 | 0.26 | 64.24 | Upper-mesotrophic | V | 2.24 | 0.42 | 63.98 | Upper-mesotrophic | V |
| 1 | 1.95 | 0.29 | 65.62 | Eutrophic | V | 1.94 | 0.43 | 64.48 | Upper-mesotrophic | V | |
| 2 | 1.91 | 0.28 | 63.44 | Upper-mesotrophic | V | 1.91 | 0.44 | 65.46 | Eutrophic | V | |
| 3 | 1.77 | 0.28 | 63.44 | Upper-mesotrophic | V | 2.32 | 0.42 | 65.46 | Eutrophic | V | |
| 4 | 1.83 | 0.29 | 63.74 | Upper-mesotrophic | V | 2.61 | 0.43 | 65.42 | Eutrophic | V | |
| 5 | 1.98 | 0.30 | 63.87 | Upper-mesotrophic | V | 2.35 | 0.44 | 65.46 | Eutrophic | V | |
| 6 | 1.91 | 0.28 | 64.00 | Upper-mesotrophic | V | 1.71 | 0.43 | 65.22 | Eutrophic | V | |
| 7 | 2.10 | 0.35 | 64.22 | Upper-mesotrophic | V | 1.76 | 0.44 | 65.28 | Eutrophic | V | |
| 8 | 2.18 | 0.33 | 63.75 | Upper-mesotrophic | V | 1.66 | 0.44 | 65.65 | Eutrophic | V | |
| Average | 1.97 | 0.30 | 64.04 | Upper-mesotrophic | V | 2.06 | 0.43 | 65.16 | Eutrophic | V | |
| XYH-4 | 0 | 1.41 | 0.24 | 62.30 | Upper-mesotrophic | Ⅳ | / | / | / | / | / |
| 1 | 1.84 | 0.27 | 63.38 | Upper-mesotrophic | V | / | / | / | / | / | |
| 2 | 2.00 | 0.26 | 63.22 | Upper-mesotrophic | V | / | / | / | / | / | |
| 3 | 1.90 | 0.28 | 64.29 | Upper-mesotrophic | V | / | / | / | / | / | |
| 4 | 2.74 | 0.31 | 65.14 | Eutrophic | V | / | / | / | / | / | |
| 5 | 2.09 | 0.31 | 65.48 | Eutrophic | V | / | / | / | / | / | |
| 6 | 2.46 | 0.35 | 65.97 | Eutrophic | V | / | / | / | / | / | |
| 7 | 2.55 | 0.35 | 65.55 | Eutrophic | V | / | / | / | / | / | |
| Average | 2.12 | 0.30 | 64.42 | Upper-mesotrophic | V | / | / | / | / | / | |
| XYH-5 | 0 | 1.93 | 0.27 | 65.05 | Eutrophic | V | 1.94 | 0.45 | 65.30 | Eutrophic | V |
| 1 | 1.86 | 0.27 | 65.51 | Eutrophic | V | 1.84 | 0.47 | 65.58 | Eutrophic | V | |
| 2 | 1.74 | 0.26 | 64.63 | Upper-mesotrophic | V | 2.90 | 0.46 | 65.74 | Eutrophic | V | |
| 3 | 1.95 | 0.28 | 64.77 | Upper-mesotrophic | V | 2.82 | 0.46 | 65.54 | Eutrophic | V | |
| 4 | 2.28 | 0.31 | 66.26 | Eutrophic | V | 2.04 | 0.54 | 66.85 | Eutrophic | V | |
| 5 | 2.38 | 0.36 | 67.48 | Eutrophic | V | 2.02 | 0.48 | 66.11 | Eutrophic | V | |
| Average | 2.02 | 0.29 | 65.62 | Upper-mesotrophic | V | 2.26 | 0.48 | 65.85 | Eutrophic | V | |
Table 4.
The evaluation table of water quality in Lake Xingyun in 2017.
| Monitoring Site | Depth (m) | 2017.5 | 2017.10 | ||||||||
|---|---|---|---|---|---|---|---|---|---|---|---|
| TN (mg/L) | TP (mg/L) | Average | Trophic Level | Category | TN (mg/L) | TP (mg/L) | Average | Trophic Level | Category | ||
| XYH-1 | 0 | 3.2 | 0.31 | 65.07 | Upper-mesotrophic | V | 1.93 | 0.32 | 61.68 | Upper-mesotrophic | V |
| 1 | 2.61 | 0.29 | 65.50 | Upper-mesotrophic | V | 1.44 | 0.32 | 63.10 | Upper-mesotrophic | V | |
| 2 | 2.83 | 0.27 | 65.22 | Upper-mesotrophic | V | 1.31 | 0.31 | 62.98 | Upper-mesotrophic | V | |
| 3 | 2.63 | 0.26 | 64.78 | Upper-mesotrophic | V | 1.31 | 0.31 | 63.06 | Upper-mesotrophic | V | |
| 4 | 2.19 | 0.27 | 65.34 | Upper-mesotrophic | V | 1.21 | 0.43 | 64.97 | Upper-mesotrophic | V | |
| 5 | 2.32 | 0.27 | 65.05 | Upper-mesotrophic | V | 1.21 | 0.33 | 63.18 | Upper-mesotrophic | V | |
| 6 | 2.02 | 0.28 | 65.37 | Upper-mesotrophic | V | 1.35 | 0.33 | 63.06 | Upper-mesotrophic | V | |
| 7 | 2.39 | 0.34 | 66.42 | Eutrophic | V | 1.24 | 0.33 | 62.89 | Upper-mesotrophic | V | |
| 8 | 2.61 | 0.36 | 66.43 | Eutrophic | V | 1.31 | 0.34 | 63.15 | Upper-mesotrophic | V | |
| 9 | 2.59 | 0.35 | 66.52 | Eutrophic | V | 1.28 | 0.42 | 64.39 | Upper-mesotrophic | V | |
| Average | 2.54 | 0.30 | 65.57 | Upper-mesotrophic | V | 1.36 | 0.34 | 63.25 | Upper-mesotrophic | V | |
| XYH-3 | 0 | 2.75 | 0.31 | 64.77 | Upper-mesotrophic | V | 1.76 | 0.33 | 63.00 | Upper-mesotrophic | V |
| 1 | 2.44 | 0.32 | 65.73 | Upper-mesotrophic | V | 1.77 | 0.33 | 63.72 | Upper-mesotrophic | V | |
| 2 | 2.05 | 0.30 | 65.38 | Upper-mesotrophic | V | 1.66 | 0.33 | 64.33 | Upper-mesotrophic | V | |
| 3 | 2.43 | 0.30 | 65.46 | Upper-mesotrophic | V | 1.71 | 0.29 | 63.75 | Upper-mesotrophic | V | |
| 4 | 2.06 | 0.27 | 65.23 | Upper-mesotrophic | V | 1.67 | 0.28 | 63.20 | Upper-mesotrophic | V | |
| 5 | 2.41 | 0.29 | 65.94 | Upper-mesotrophic | V | 1.45 | 0.31 | 63.21 | Upper-mesotrophic | V | |
| 6 | 2.08 | 0.35 | 67.35 | Eutrophic | V | 1.44 | 0.31 | 63.08 | Upper-mesotrophic | V | |
| 7 | 2.03 | 0.45 | 68.68 | Eutrophic | V | 1.06 | 0.33 | 63.43 | Upper-mesotrophic | V | |
| 8 | / | / | / | / | / | 1.16 | 0.36 | 63.70 | Upper-mesotrophic | V | |
| Average | 2.28 | 0.33 | 66.07 | Eutrophic | V | 1.52 | 0.32 | 63.49 | Upper-mesotrophic | V | |
| XYH-5 | 0 | 1.87 | 0.34 | 65.69 | Upper-mesotrophic | V | 1.64 | 0.34 | 68.62 | Eutrophic | V |
| 1 | 1.45 | 0.30 | 65.11 | Upper-mesotrophic | V | 1.73 | 0.38 | 69.77 | Eutrophic | V | |
| 2 | 1.78 | 0.31 | 65.17 | Upper-mesotrophic | V | 1.62 | 0.33 | 68.62 | Eutrophic | V | |
| 3 | 1.94 | 0.31 | 65.02 | Upper-mesotrophic | V | 1.61 | 0.35 | 68.43 | Eutrophic | V | |
| 4 | 2.27 | 0.32 | 65.74 | Upper-mesotrophic | V | 1.25 | 0.31 | 66.63 | Eutrophic | V | |
| 5 | 2.24 | 0.33 | 65.61 | Upper-mesotrophic | V | 1.31 | 0.31 | 66.17 | Eutrophic | V | |
| Average | 1.93 | 0.32 | 65.39 | Upper-mesotrophic | V | 1.53 | 0.34 | 68.04 | Eutrophic | V | |
Publisher’s Note: MDPI stays neutral with regard to jurisdictional claims in published maps and institutional affiliations. |
© 2022 by the authors. Licensee MDPI, Basel, Switzerland. This article is an open access article distributed under the terms and conditions of the Creative Commons Attribution (CC BY) license (https://creativecommons.org/licenses/by/4.0/).
Share and Cite
MDPI and ACS Style
Zeng, Y.; Chang, F.; Wen, X.; Duan, L.; Zhang, Y.; Liu, Q.; Zhang, H. Seasonal Variation in the Water Quality and Eutrophication of Lake Xingyun in Southwestern China. Water 2022, 14, 3677. https://doi.org/10.3390/w14223677
AMA Style
Zeng Y, Chang F, Wen X, Duan L, Zhang Y, Liu Q, Zhang H. Seasonal Variation in the Water Quality and Eutrophication of Lake Xingyun in Southwestern China. Water. 2022; 14(22):3677. https://doi.org/10.3390/w14223677
Chicago/Turabian StyleZeng, Yanbo, Fengqin Chang, Xinyu Wen, Lizeng Duan, Yang Zhang, Qi Liu, and Hucai Zhang. 2022. "Seasonal Variation in the Water Quality and Eutrophication of Lake Xingyun in Southwestern China" Water 14, no. 22: 3677. https://doi.org/10.3390/w14223677
Note that from the first issue of 2016, this journal uses article numbers instead of page numbers. See further details here.