
Study on the Risk Assessment Method of Rainfall Landslide
1
Key Laboratory of Transport Industry of Road Structure and Material, Research Institute of Highway Ministry of Transport, Beijing 100088, China
2
Key Laboratory of Shale Gas and Geoengineering, Institute of Geology and Geophysics, Chinese Academy of Sciences, Beijing 100029, China
3
Institutions of Earth Science, Chinese Academy of Sciences, Beijing 100029, China
4
College of Earth and Planetary Sciences, University of Chinese Academy of Sciences, Beijing 100049, China
5
Petroleum Development Center Limited, Sinopec Shengli Oilfield, Dongying 257029, China
*
Author to whom correspondence should be addressed.
Water 2022, 14(22), 3678; https://doi.org/10.3390/w14223678
Submission received: 18 October 2022
/
Revised: 4 November 2022
/
Accepted: 10 November 2022
/
Published: 14 November 2022
(This article belongs to the Special Issue Rainfall-Induced Geological Disasters)
Abstract
:Quantitative risk assessment of landslides has always been the focus and difficulty in the field of landslide research. In this paper, taking Mayang County, Hunan Province as an example, the risk assessment of rainfall-induced landslides was carried out from the regional and individual scales. On the regional scale, the risk factors of geological disasters were analyzed. Based on the slope unit, the risk analysis of slope geological disasters and the vulnerability risk assessment of hazard-bearing bodies were carried out to form the block plan. On an individual scale, based on the analysis of rainfall extreme value, the variation law of landslide seepage field and stability under different rainfall recurrence periods was simulated. Then, the vulnerability of the disaster-bearing body was studied according to the analysis of the impact range and the field investigation. Combined with the evaluation results of landslide hazard and vulnerability of the disaster-bearing body, the life and economic risks under different working conditions were further obtained. Therefore, the research results could provide not only a reference for the risk assessment of rainfall-induced landslides in other regions but also a theoretical basis for the early warning and prediction of landslide disasters.
1. Introduction
There are many geological disasters in China. Among them, landslide disasters are an important part, and their high frequency and high harm bring huge losses to human life and property. In addition, as a non-engineering measure for disaster prevention and mitigation, landslide risk assessment and management can effectively reflect the current state and future development trend of the landslide, which can provide an important basis for formulating disaster prevention and mitigation measures and play a guiding role in landslide disaster reduction planning and economic construction in disaster areas.
Based on the analysis and discussion of relevant data, it is easy to find that rainfall is the main factor affecting the occurrence of landslides in China, and about 80% of landslide disasters are caused by rainfall [1,2,3]. According to the current urgent demand for disaster prevention and mitigation, domestic and foreign scholars have conducted a lot of research on rainfall-induced landslides and related issues. For example, in terms of correlation and stability evaluation, Campbell et al. studied the relationship between rainfall and landslide and put forward the concept of critical cumulative rainfall of landslide for the first time. Caine, Aleotti, Chen et al. conducted in-depth research on the stability analysis and rainfall threshold of rainfall-induced landslides and further characterized the impact of rainfall duration, rainfall, and intensity on slope stability [4,5,6,7,8,9]. In terms of rainfall-induced landslide prediction, it is not difficult to find that the core problems are mainly concentrated in two aspects: one is the statistics of rainfall data, and the other is the selection of rainfall factors [10,11,12,13]. The method used is mainly to study the landslide and rainfall data of the region over the years, statistically analyze the correlation between the two, and finally obtain the probability of landslide occurrence in the region under a certain rainfall intensity.
Landslide risk assessment is one of the important subjects in the field of landslide research [14,15,16,17,18,19,20]. The term “risk” has a long history, and it was introduced into the field of geological disasters in the 1980s and has gradually become a hot topic in this field in recent years. Since the 1990s, landslide hazard and risk assessment at different scales have been carried out in the United States, Italy, Australia, France, Hong Kong, etc., which has effectively supported the land use planning of government departments and reduced the casualties and economic and property losses caused by landslide disasters [20,21]. Since 1999, China has conducted a lot of geological disaster investigations in a planned way, which has effectively supported the management of geological disaster prevention and control [22,23,24,25,26]. Based on this, it also carried out pilot projects of geological disaster risk assessment. Landslide risk assessment mainly involves landslide hazard analysis and vulnerability analysis. Hazard analysis is the basis of landslide risk assessment, and vulnerability analysis is the core of risk research. From the perspective of scale, landslide risk assessment research can be divided into two categories: regional research and individual research [20]. The risk assessment of regional landslide disasters is mainly based on GIS technology, and it considers the landslide susceptibility and the vulnerability of the disaster-bearing body, clarifies the risk assessment factors, and obtains the risk block plan [27,28,29,30]. There are in-depth theoretical studies on the risk assessment of individual landslides, which have gradually shifted from qualitative and semi-quantitative to quantitative analysis [19,31,32,33,34,35,36,37,38]. The risk analysis research includes the study of failure probability and influence range, while the vulnerability research includes the study of the intensity of disasters on disaster-bearing bodies as well as the vulnerability of disaster-bearing bodies.
It is concluded that the degree of refinement of the existing regional landslide risk assessment is not high enough, and it mainly uses GIS and other technologies and doesn’t fully define the risk factors affecting landslide disasters. The risk assessment methods, indexes, and standards of individual landslide disasters are greatly affected by special regional conditions, and there are few studies on rainfall-induced landslides. Therefore, in view of the above problems, taking the geological disasters in Mayang County, Hunan Province as an example, risk assessment research was performed, the risk factors of geological disasters in this area, carry out a risk assessment of slope geological disasters and vulnerability were carried out based on slope units, and then a block plan was formed. Later, typical individual landslides were selected to study the seepage field and infiltration depth of landslides under different rainfall reappearing periods, and then the economic and personnel risks of landslides under different rainfall reappearing periods were quantitatively analyzed.
2. Study Area and Data
2.1. Study Area
Mayang County is in the western Hunan province, central-south China, with a terrain changing from a mountainous area on all sides to a wide flat area in the middle and overall inclination to the east (Figure 1). Physiographically, the area lies in a region of tectonic or folded development with strata structurally marked by complex folds and NE–NNE compression and scissor fault. The area is traversed by many faults which are responsible for the crushing and shearing of rocks. The main geological formations belonging to the Qingbaikou, Cambrian, and Cretaceous comprise slate, limestone, aubergine siltstone, and mudstone in the study area. The elevation ranges from 130 m to 1405 m. There is a typical subtropical monsoon climate in the region, hot and humid with abundant rainfall events in summer, and mild and dry in winter. The average annual precipitation ranges between 750 and 1550 mm, with 60% of the annual average falling between May to September.
The study area has complex geological environment conditions, abundant rainfall, and strong human engineering activities (building houses, building roads, etc.), resulting in more geological disasters in this area, which is one of the areas prone to geological disasters in Hunan province. Landslides have a high threat to human life and properties, although they do not usually cause causalities, they lead to damage to properties, infrastructures and natural resources. With the development of the social economy and the construction of urban, roads, and water conservancies, the number of landslides has increased significantly in recent years, and the direct economic losses caused by disasters have increased. According to the survey, the landslides, which have hidden dangers, threaten a population of 5251 people, 5860 houses, 35 hectares of farmland, 5000 m of highways, and potential economic losses of 289.59 million yuan.
2.2. Landslide Data
According to the geological disaster investigation and zoning report of Mayang County, there are regular geological disasters in Mayang County, of which landslides are the most important. Though landslides do not usually cause causalities, they cause severe damage to properties, facilities, and infrastructure. Among them, the main types of landslides are small and medium-sized shallow soil landslides. The landslide data used in this study were from the geological environment monitoring station of Hunan Province, which recorded the geological disaster data of Mayang County in the past 30 years in detail, as shown in Figure 2. The detailed characteristics of most of the landslides causing damage were recorded in the data, including location, occurrence time, landslide characteristics (scale, slope structure type, disaster horizon, etc.), inducing factors, and damage. However, it might not record small collapses which caused almost no damage in remote areas. Before 2005, due to the problems such as recording methods, landslide data was not complete and the data was vague. Therefore, to ensure the accuracy of the data, the period from 2005 to 2017 was selected as the research period. Meanwhile, the rainfall data during the study period were collected from Huaihua Meteorological Bureau and Mayang County Rainfall Station. The accuracy of the above data took a day as the unit, and some corrections were made to reduce the uncertainty caused by the data.
3. Regional Security Risk Assessment
3.1. Analysis of Influencing Factors
3.1.1. Topography
The influence of geological disasters was analyzed mainly from the perspective of the slope, slope direction, and slope shape:
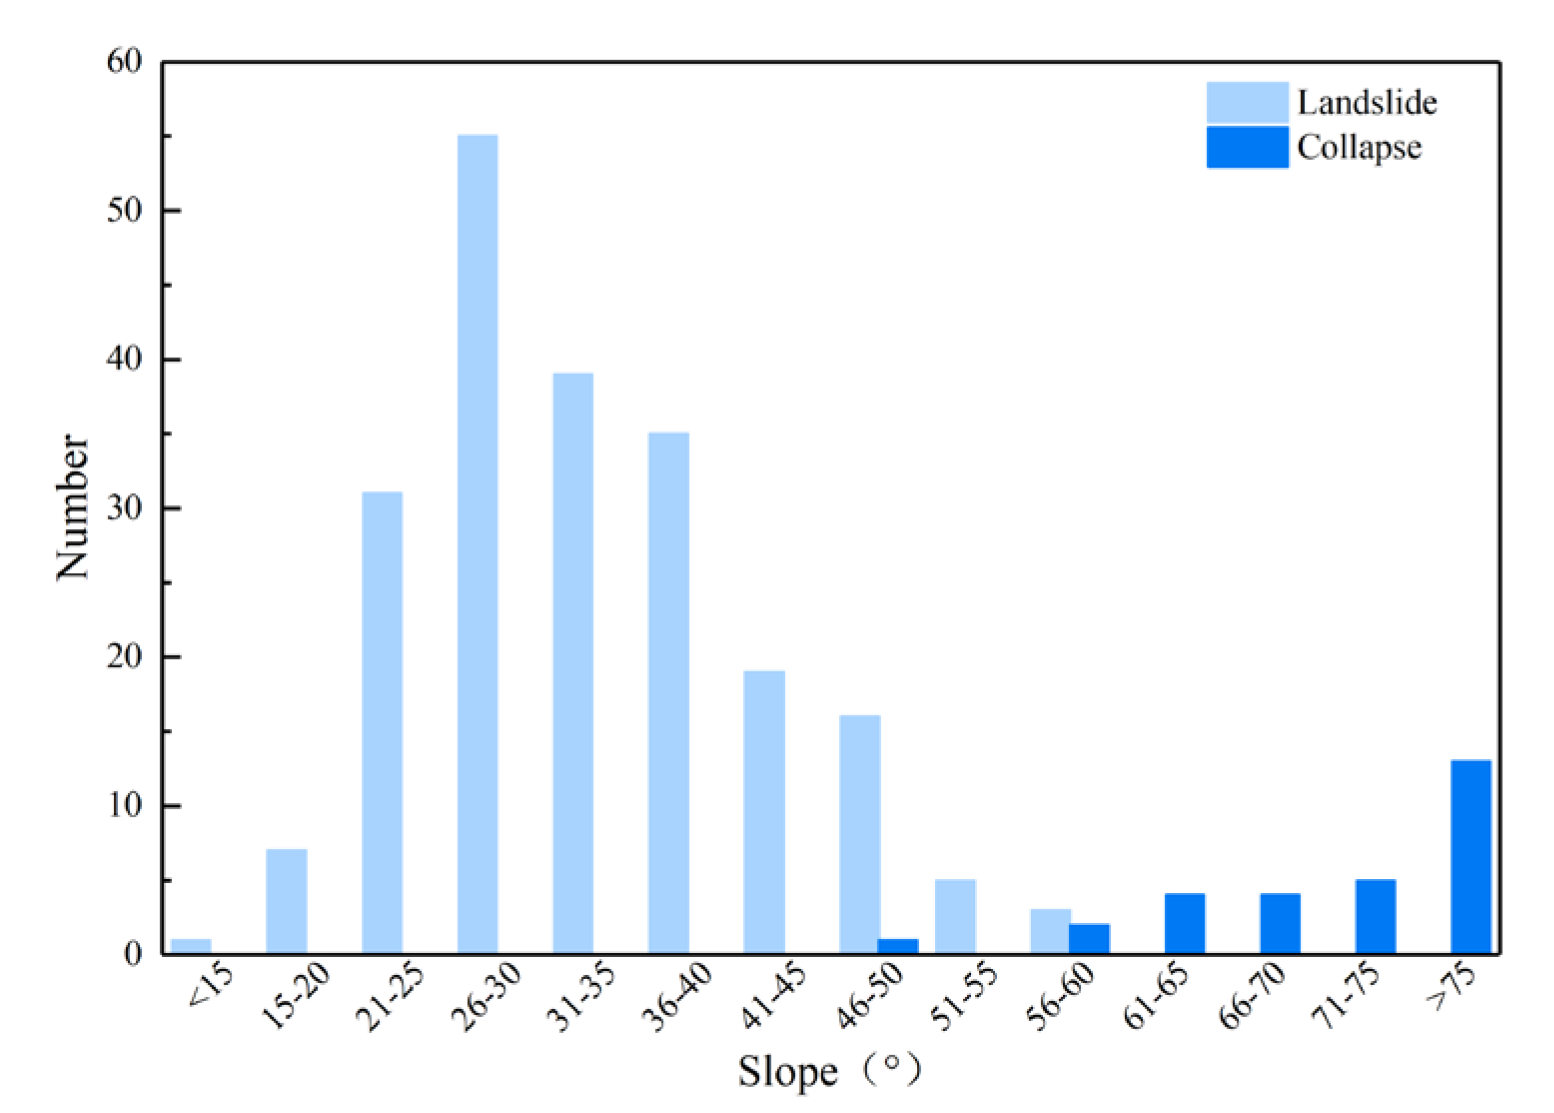
Terrain slope is closely correlated with geological disasters. High and steep slopes are mostly developed in Mayang County. The steeper the slope, the greater the relative height difference, and the greater the possibility of geological disasters. The terrain slope was graded, and the geological disasters in Mayang County were counted according to the slope gradient. The relationship between landslide and collapse and terrain slope in Mayang County is shown in Figure 3. Geological disasters such as landslides were concentrated in areas with a grade of side slope of 20–50°, of which geological disasters mostly happened in areas with a slope gradient of 25–40°. The survey found that the natural repose angle of the original slope was between 20 and 40°, collapses were developed in steep cliffs with a slope of more than 55°, and steep terrain could promote the occurrence of collapses.
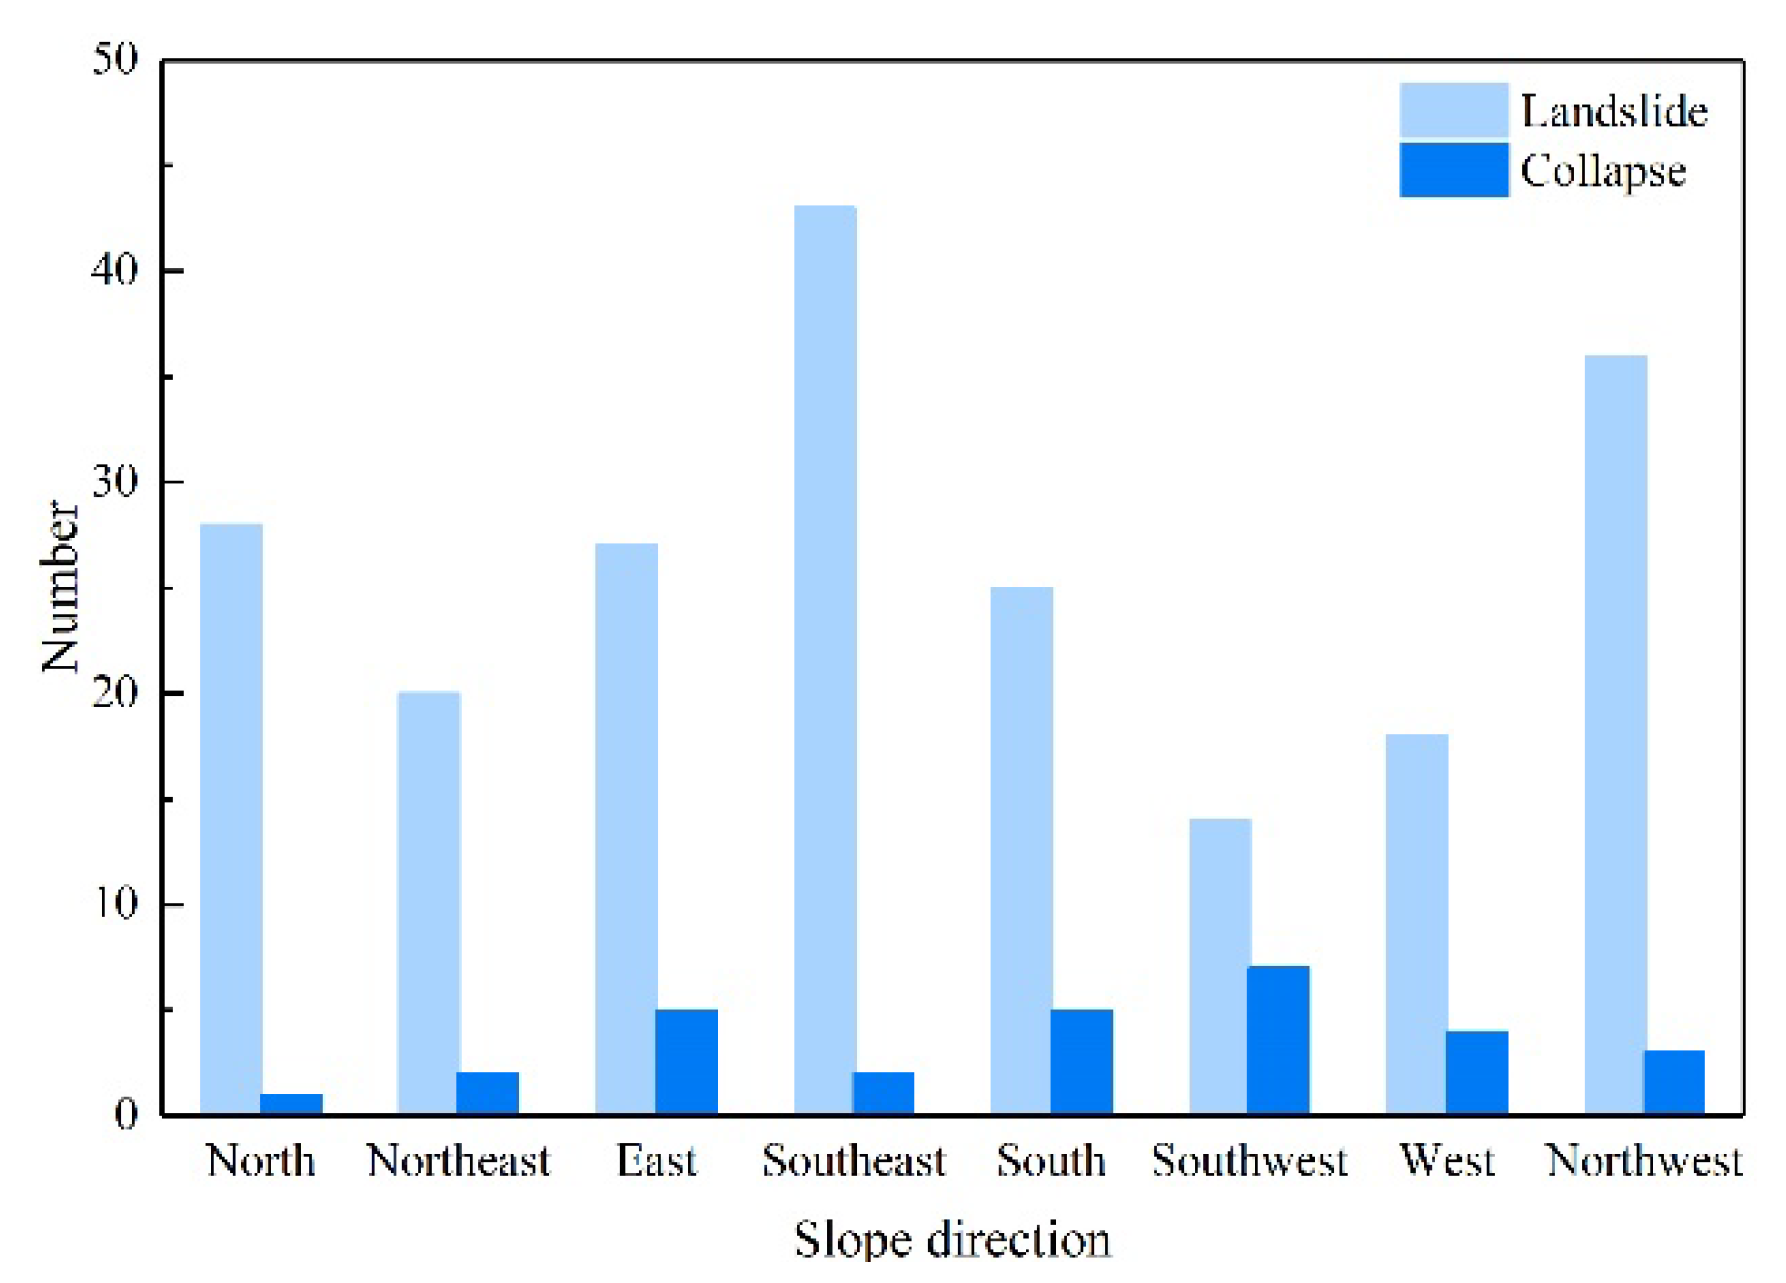
To facilitate statistical research, the slope direction in the area was equally divided with 45° as a unit to carry out statistics of the slope direction of each geological disaster. According to Figure 4, it was concluded that the slope directions of landslide development were mainly southeast, northwest, and north, and there were 43, 36, and 28 places, respectively, accounting for 20.4%, 17.1%, and 13.3% of the total. The slope direction of collapse development was mainly southwest, with a total of seven places, accounting for 24.1% of the total. According to the statistical table of the relationship between geological disasters and slope directions, the slope directions of geological disasters in Mayang County had certain regularity, mainly southeast and northwest.
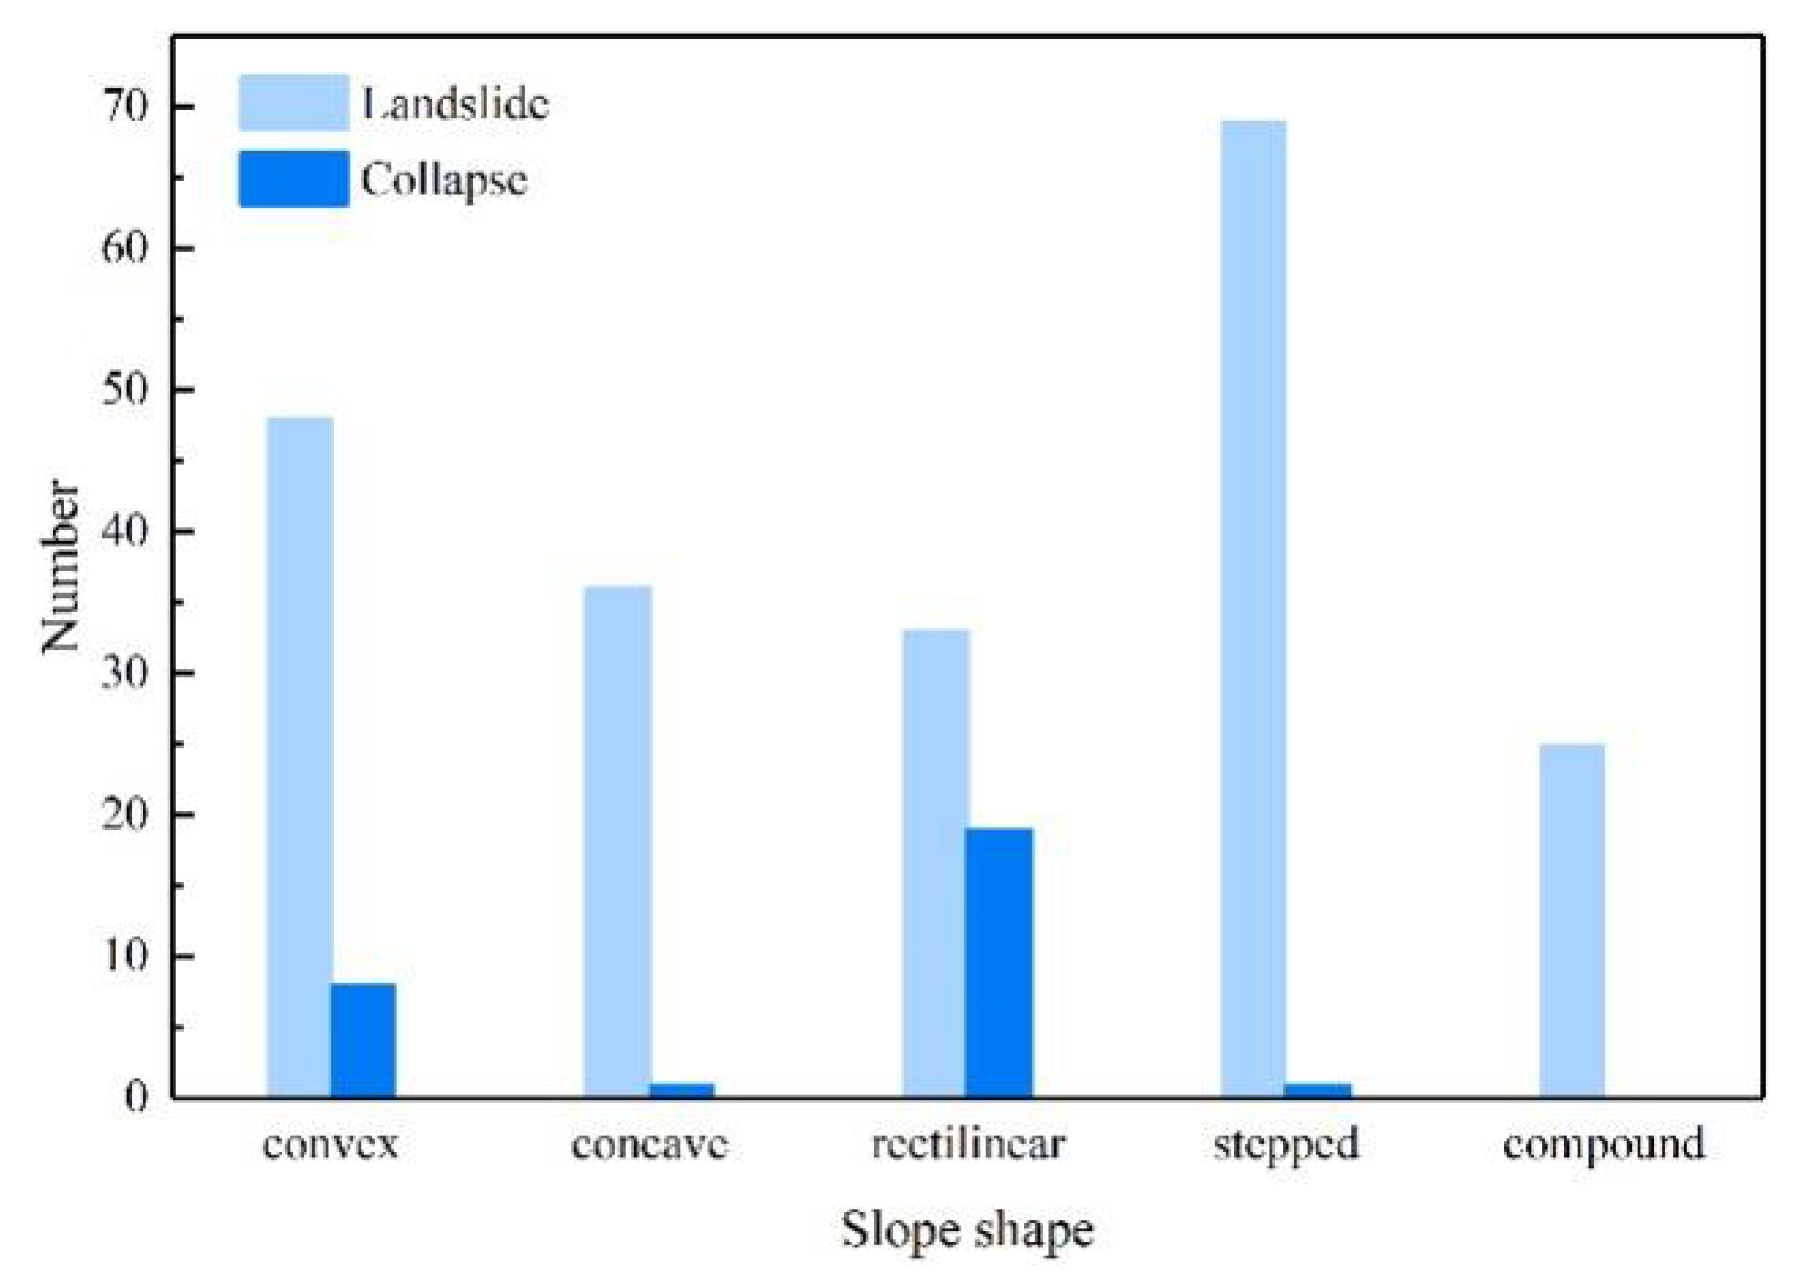
The relationship between landslide, collapse, and slope shape was statistically analyzed, as shown in Figure 5. The slope shape of Mayang landslides mainly presents ladder-shaped and convex-shaped, and collapses mostly occur on flat and convex slopes. Convex slopes with a flat upper and a steep lower, and concave–convex stepped steep slopes are more likely to form landslide geological disasters. The rock mass on the straight or convex slope is mostly broken by a tensile fracture to form a collapse. The lower part of the rock slope is mostly a concave rock cavity, and the upper dangerous rock is prominent.
3.1.2. Rock–Soil Mass Types
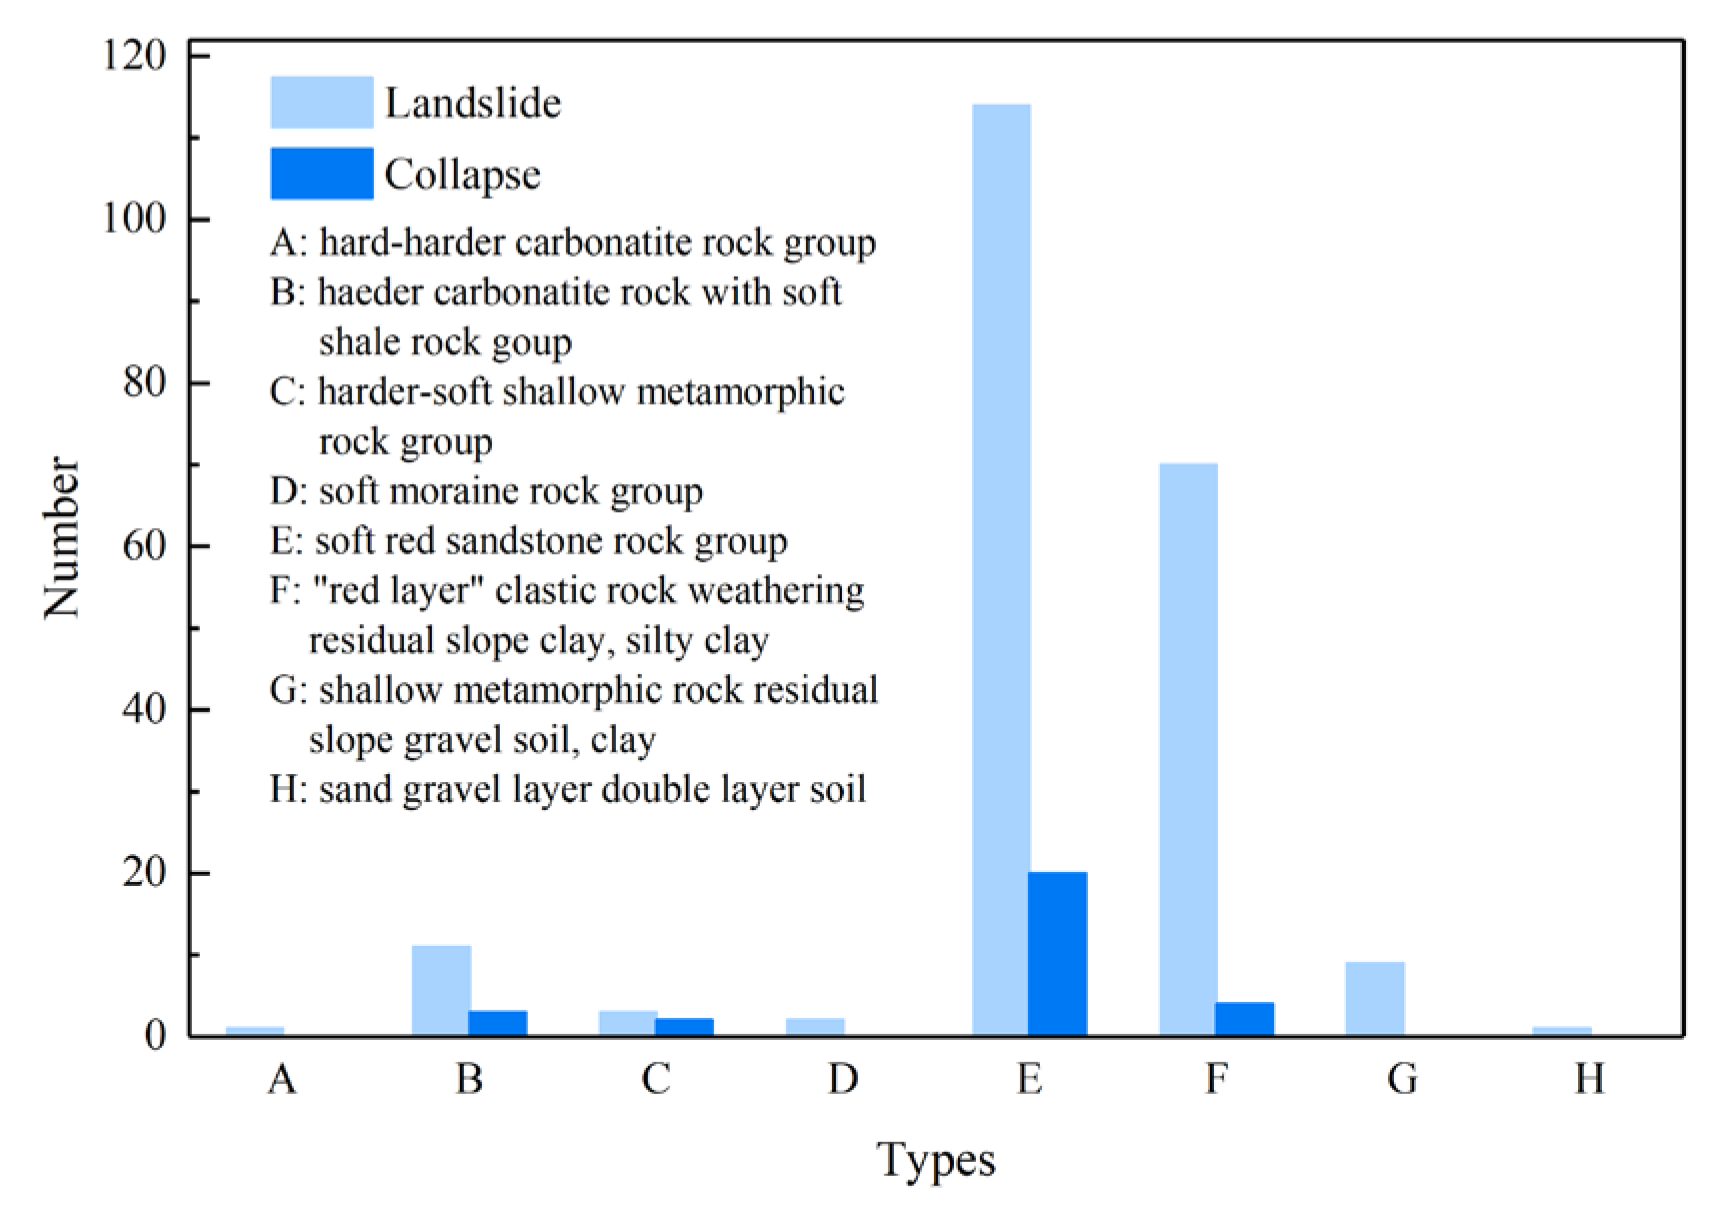
Rock and earth mass type is the material basis for the formation of geological disasters, which has a control effect on geological disasters. The engineering geological properties of rock and earth mass in Mayang County are complex and diverse, and the rock mass can be divided into five engineering geological rock groups: hard–harder carbonatite rock group (A), harder carbonatite rock with soft shale rock group (B), harder–soft shallow metamorphic rock group (C), soft moraine rock group (D), and soft red sandstone rock group (E). The earth mass can be divided into three categories: “red layer” clastic rock weathering residual slope clay, silty clay (F); shallow metamorphic rock residual slope gravel soil, clay (G); sand gravel layer double layer soil (H).
There is a very close relationship between the landslide and the engineering geological characteristics of the rock and soil. From the number of landslide development (Figure 6), the soft red sandstone rock group (E) and “red layer” clastic rock weathering residual slope clay, silty clay (F) are the most developed. The red layer has poor weathering resistance and low mechanical strength, so under the action of various internal and external geological forces, the rock structure is easily destroyed. In particular, once the mudstone is exposed to the surface under the action of rainfall infiltration (soaking), erosion, temperature change, and weathering for less than ten days, it will be fragmented and granular. Meanwhile, in the case of water, the rock is easy to soften into mud or its strength will be further reduced, so it is easy to form landslide disasters when there is an external force. Therefore, most landslide disasters are developed in “red layer” clastic rock.
Collapse disasters in Mayang County mainly occur in the soft red clastic rock group (E), and they are significantly controlled by the cracks of the parent rock of the red clastic rock. The various cracks developed in the rock mass are relatively strong in the shallow part of the surface so that the rock mass is easily destroyed along the crack surface.
3.1.3. Geological Structure
By analyzing the development of geological disasters in the vicinity of the main fracture zones in the territory, it can be concluded that geological disasters are mostly distributed along the syncline in Mayang, compressive fault in Jinhe, and compressive-shear fault tectonic belt in Mayang, showing obvious laws. The structural plane of rock mass is often formed by tectonic movement, while the structural plane of rock mass is often the controlling structural plane of collapses and rock landslides.
3.1.4. Rainfall
Precipitation has the following effects on geological disasters: first of all, the water-rich weight of the soil increases, thus enhancing the sliding force; secondly, precipitation softens the soil and reduces the structural strength; thirdly, water infiltration lubricates the sliding surface, thereby reducing friction. The red beds in Mayang County are mostly formed by weathering of mudstone and sandstone. They are easy to soften and muddy in water, and the stability of slopes decreases rapidly, which may lead to geological disasters. Therefore, strong rainfall is an important geological stress that shapes landforms and changes slope stability in nature.
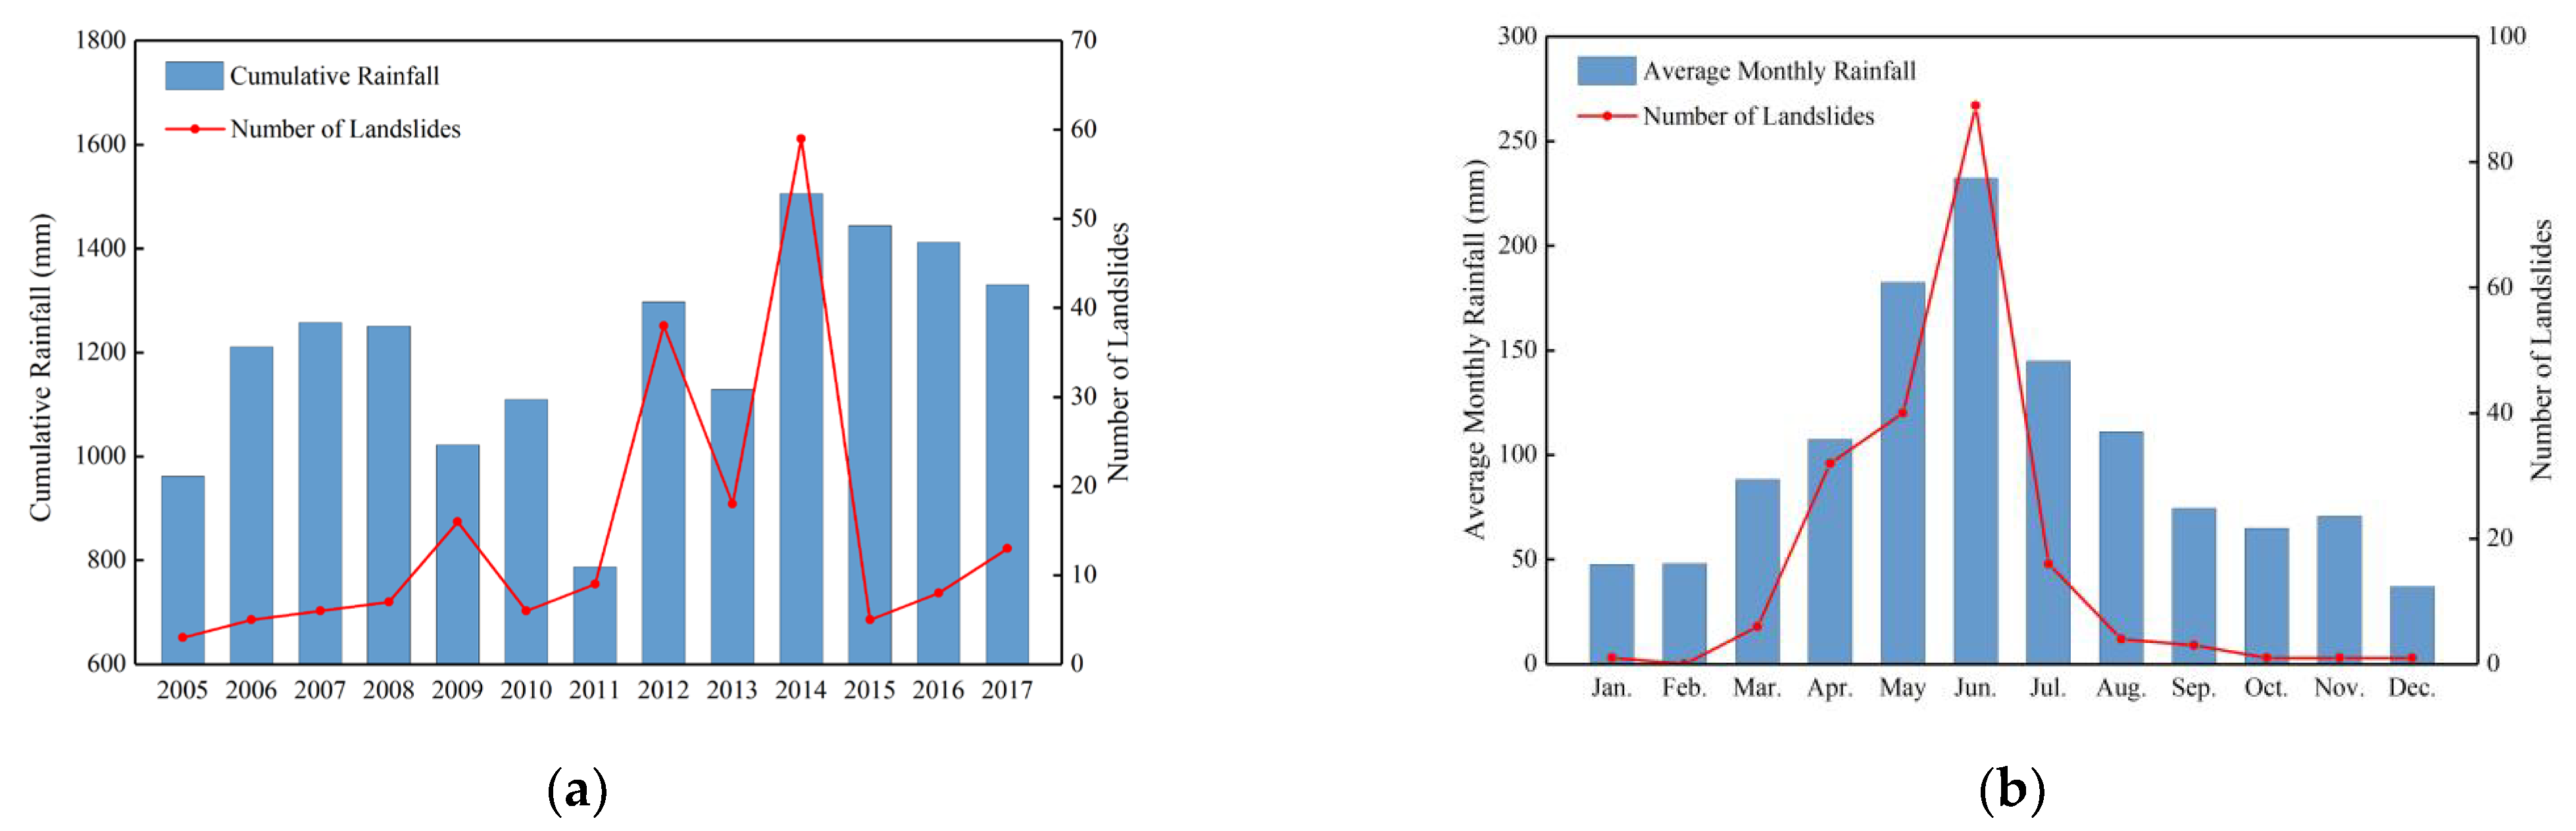
Figure 7 shows the annual and monthly distribution of landslide occurrences from 2005 to 2018 and the distribution of corresponding rainfall. As shown in Figure 7a, the number of shallow landslides from 2005 to 2017 ranged from 1 to 59, with an average of 14 disasters each year. In the figure, there was no obvious relationship between the number of disasters and the annual rainfall, and the cumulative annual rainfall in 2008, 2011, and 2016 was quite different, but the number of landslide disasters did not change much. The reason for this phenomenon is that the occurrence of landslides is caused by many factors, including earthquakes, topography, and human activities, and rainfall is not the only factor affecting slope stability. The highest number of landslides occurred in 2014, mainly because there were extreme rainfall events in June 2014. Therefore, it can be seen that rainfall is an important factor in rainfall-induced shallow landslides. Figure 7b analyzed the monthly average rainfall and the number of landslides from 2005 to 2017. Studies have shown that the vast majority of landslide disasters occur in the rainy season of one year, which is positively correlated with the amount of rainfall, indicating that rainfall plays a vital role in the occurrence of landslides.
3.2. Risk Analysis
3.2.1. Determination of Slope Unit
Based on remote sensing interpretation, the division of slope units was completed by means of ground verification. Generally, the recognized slope units should have the following characteristics: ①basically consistent geomorphological characteristics; ②relatively similar attitude of rock; ③basically the same lithology; ④basically consistent joint fissure development degree; ⑤moderate size range.
Using indoor remote sensing images, slope units were divided preliminarily by GIS software. As for the specific division method, firstly, the curvature watershed method was adopted to calculate the positive and negative curvature of the terrain through the DEM data of remote sensing image, and the positive and negative curvature of the terrain was obtained. Then, according to the curvature change relationship, the watershed was segmented and the area was calculated, and the convex and concave geomorphic elements were extracted. Later, the convex and concave geomorphic elements were vectorized and merged to form slope units, and the preliminary slope unit division was obtained.
As for the field investigation work, combined with the development laws of geological disasters in Mayang County and topography and lithology zoning characteristics, the slope units generated by GIS were corrected in the site. The fieldwork should pay special attention to the identification and characterization of the disaster of the slope unit, and determine whether the slope was a geological disaster. It mainly identified whether the slope unit had the inherent control structural plane (sliding surface) from the perspective of survey data such as topography, existing profile, and drilling or trenching data. If there was an inherent controlling structural plane, it would be used as a geological disaster for risk investigation and evaluation; on the contrary, if there was no, the risk investigation and evaluation would be carried out as a slope unit. The survey evaluation area was divided into 354 slope units in total.
3.2.2. The Method of Hazard Assessment
The risk of geological disasters is a complex problem in the process of geological disaster risk assessment. According to the risk calculation formula proposed by Varnes, the risk of geological disasters is jointly determined by the time probability, spatial probability, and scale probability of disasters. The calculation formula is as follows [39]:
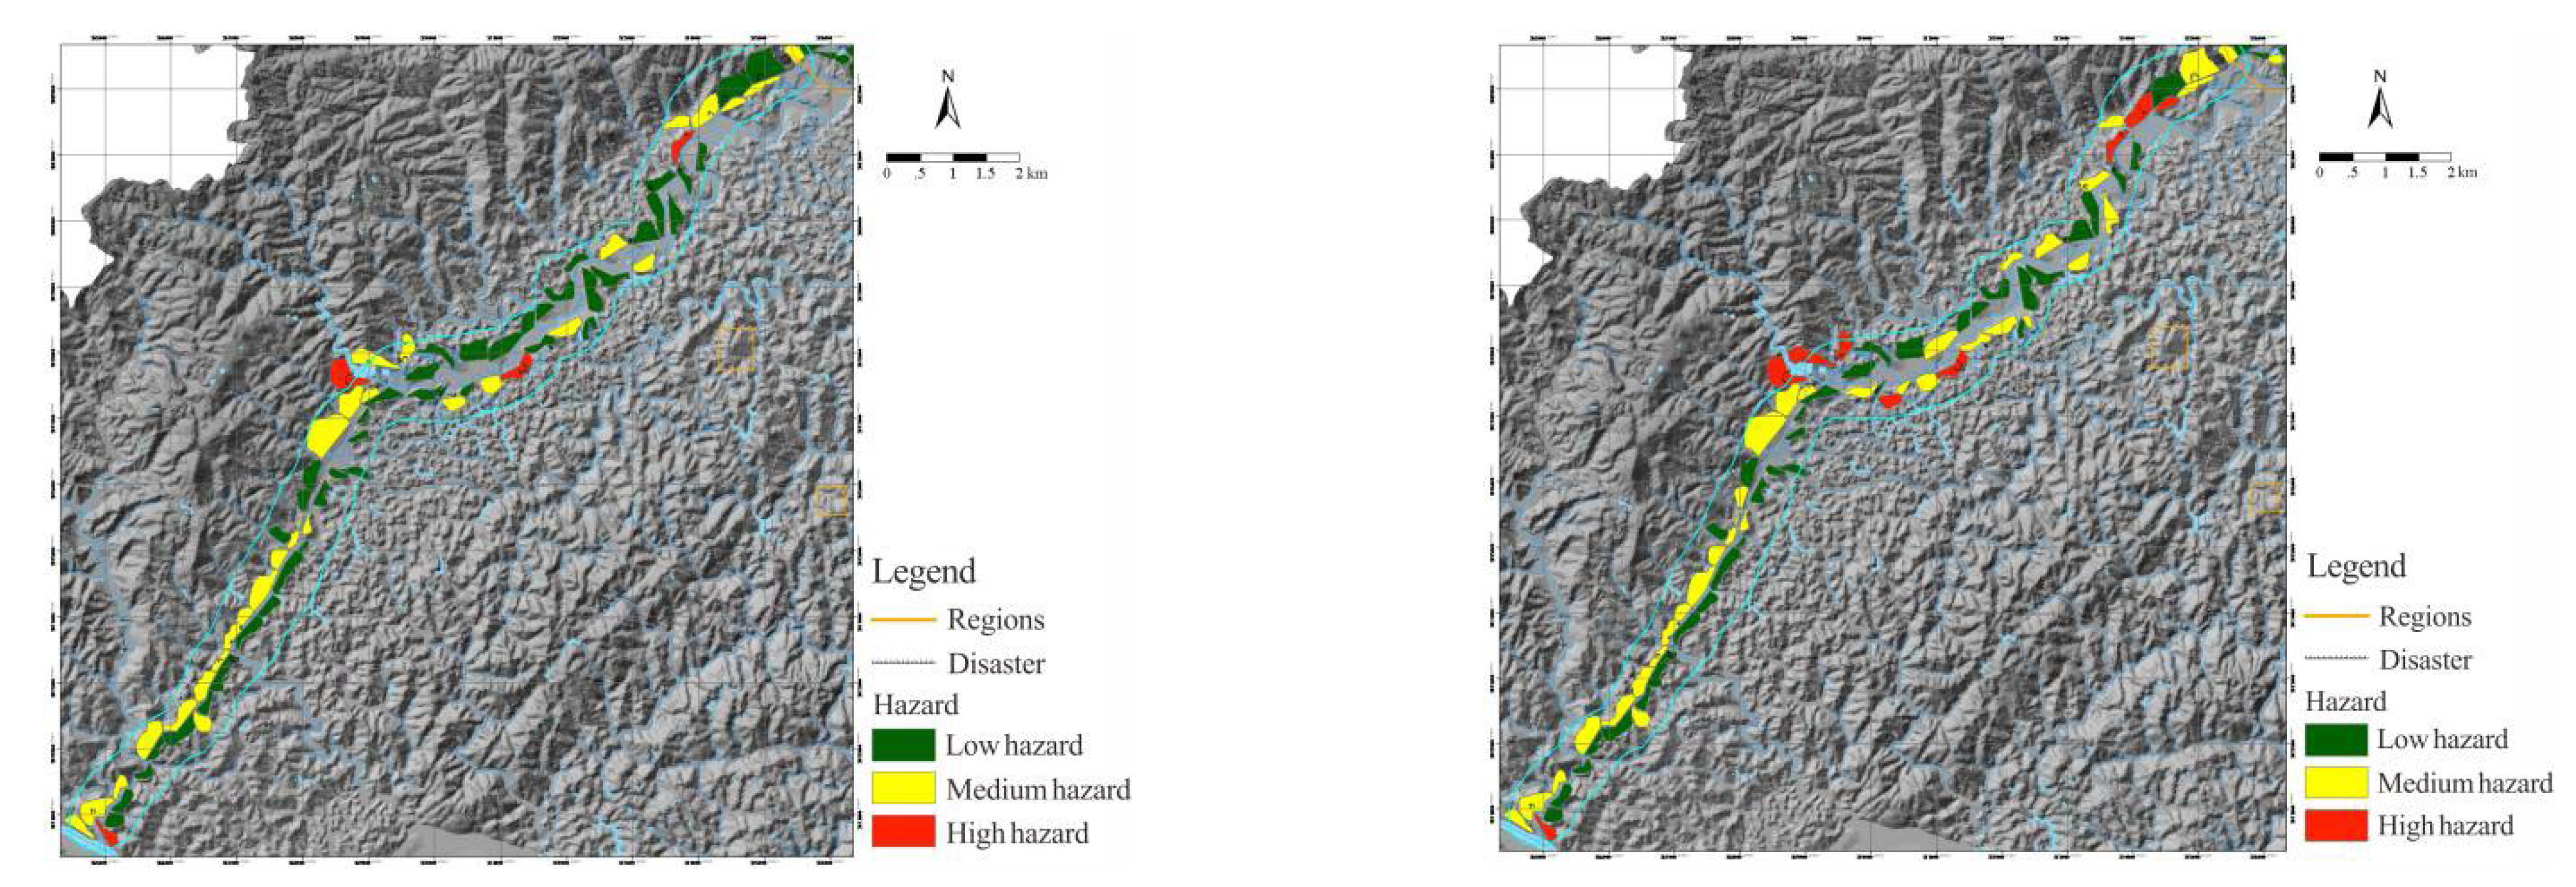
where represents the time probability, that is, the exceeding probability of landslide occurrence in different reappearing periods; P(S) represents the common determinant of spatial probability and scale probability. In this paper, the reappearing period of evaluation was 10 years and 20 years, and the evaluation results are shown in Figure 8, Figure 9, Figure 10 and Table 1.
HL = P(NL) × P(S)
It can be seen from the risk assessment results that the high-risk units of slope geological disasters in the key areas of Mayang County are scattered along the line; medium-risk units are contiguous, mainly aiming to avoid the impact of housing construction excavation and highway and railway construction on slopes, so related protection should be carried out.
3.2.3. The Method of Vulnerability Assessment
The content of the vulnerability assessment is mainly to investigate the extent of possible losses of the objects affected by the potential danger of geological disasters in slope units. The project mainly evaluates the economy and personnel. As it is difficult to accurately calculate the data of economic value and population attributes in practical work, the project intends to use a quantitative method similar to the qualitative method to calculate its vulnerability.
Economic vulnerability mainly considers the value of the damaged structure. The vulnerability of the structure within the scope of the disaster is proportional to the square of the velocity and the density of the disaster mass. However, as there is a lack of slope unit stability simulation, it is impossible to predict the velocity of the landslide mass. Only the influence range is considered. According to the conclusion drawn by Du Juan et al., the definition of structural vulnerability is shown in Table 2 [19].
Personnel vulnerability is the probability of death caused by disasters, which is closely correlated with the age structure, education level, disaster prevention, and mitigation publicity, as well as early warning and forecasting. The research results that are widely used in the survey work are to reduce vulnerability from the perspective of population age structure, education level, propaganda intensity, and integrity of the early warning system. To facilitate the actual operation and calculation, the evaluation objects only consider the risk of the indoor static population. Referring to the existing research results, the population vulnerability on the sliding body is uniformly assigned to 1.0. In the landslide-affected zone, the vulnerability assessment of the indoor personnel based on building vulnerability mainly considers the degree of casualties of indoor personnel under different structural types of buildings at different damage levels. The vulnerability value is shown in the Table 3.
3.2.4. Risk Assessment and Characteristics Analysis
The geological hazard risk assessment model [40] was used to calculate the economic and population risks of geological disasters, and the calculation formula is as follows:
where E is the value of hazard-bearing bodies, such as the net value of houses, roads, factories, etc.; H is the probability of disaster occurrence in a specific time period; V is the vulnerability value, which is the vulnerability of the disaster-bearing object.
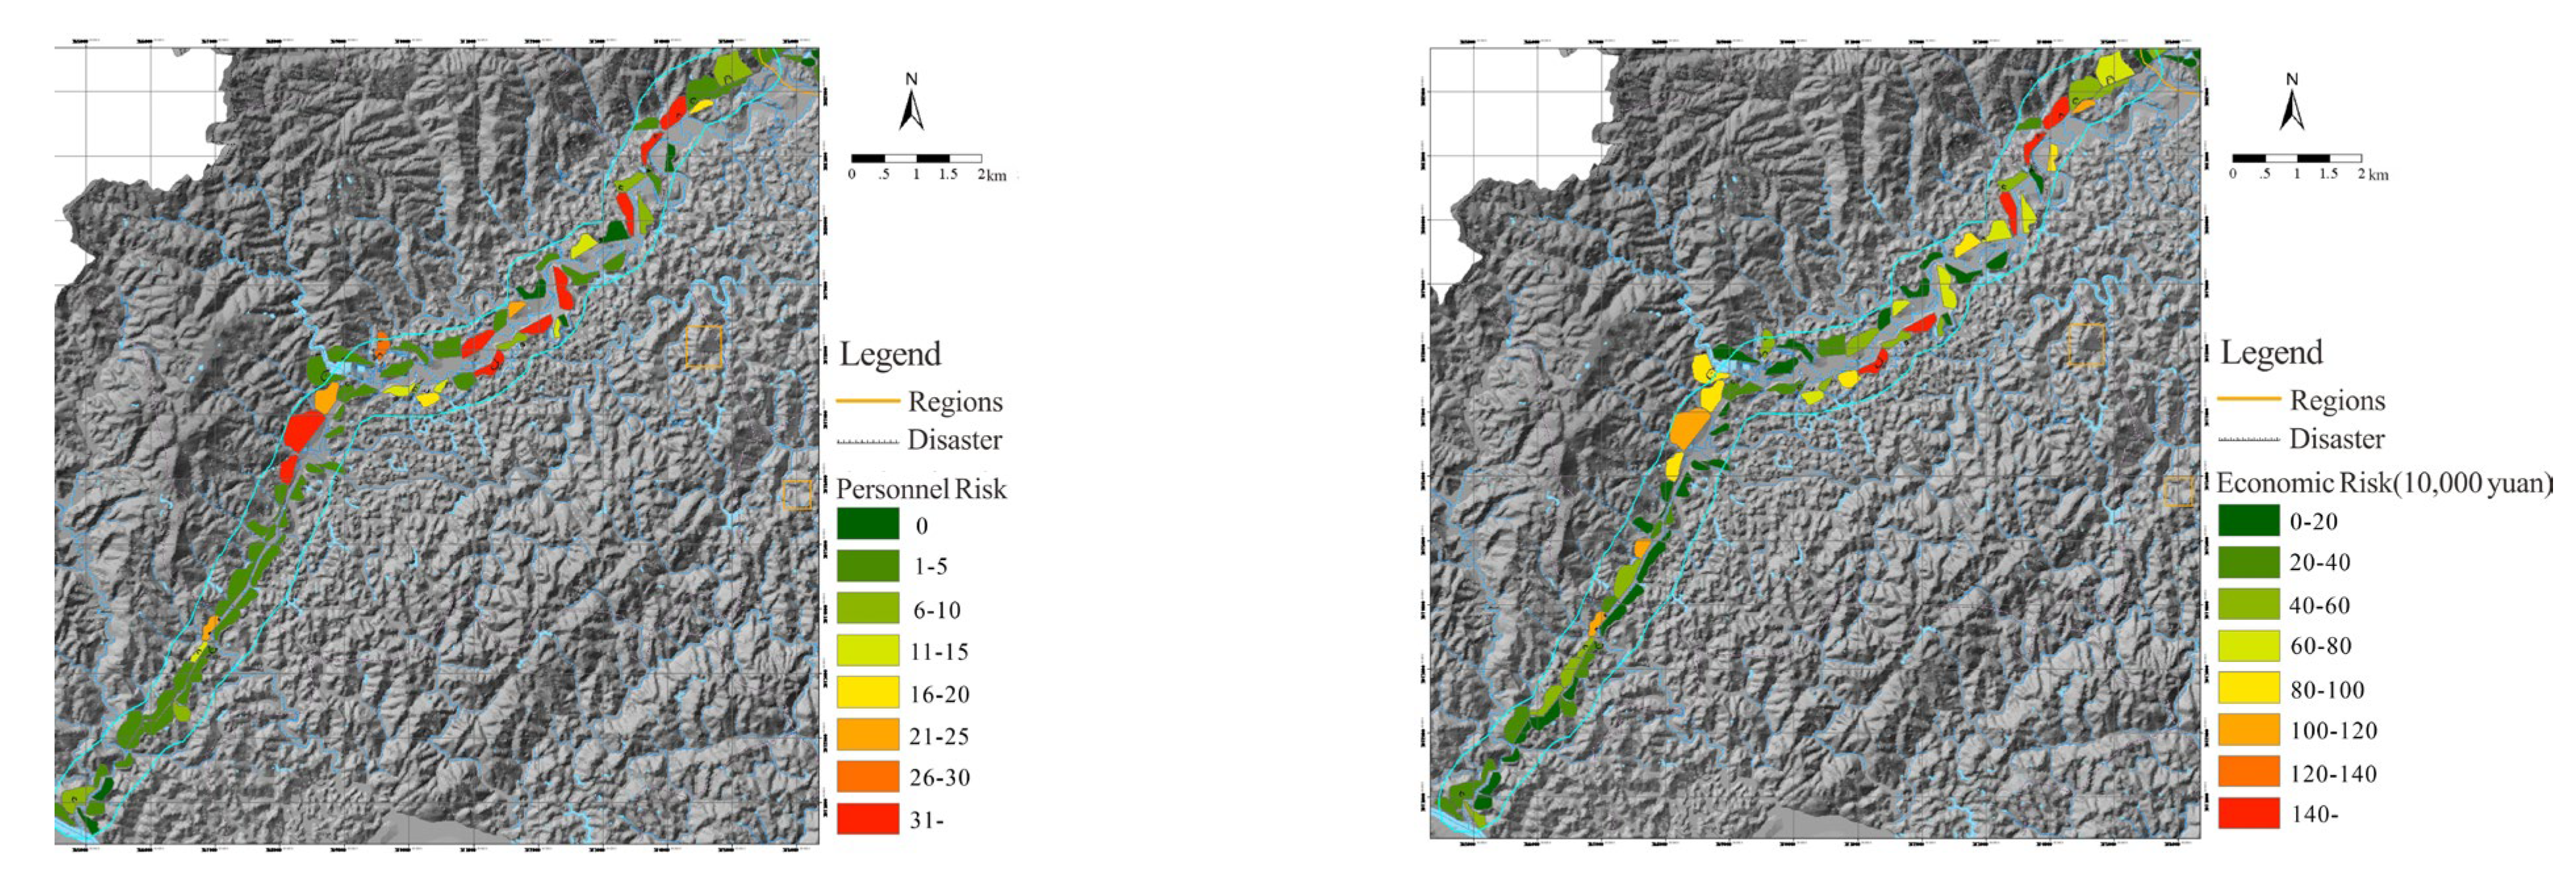
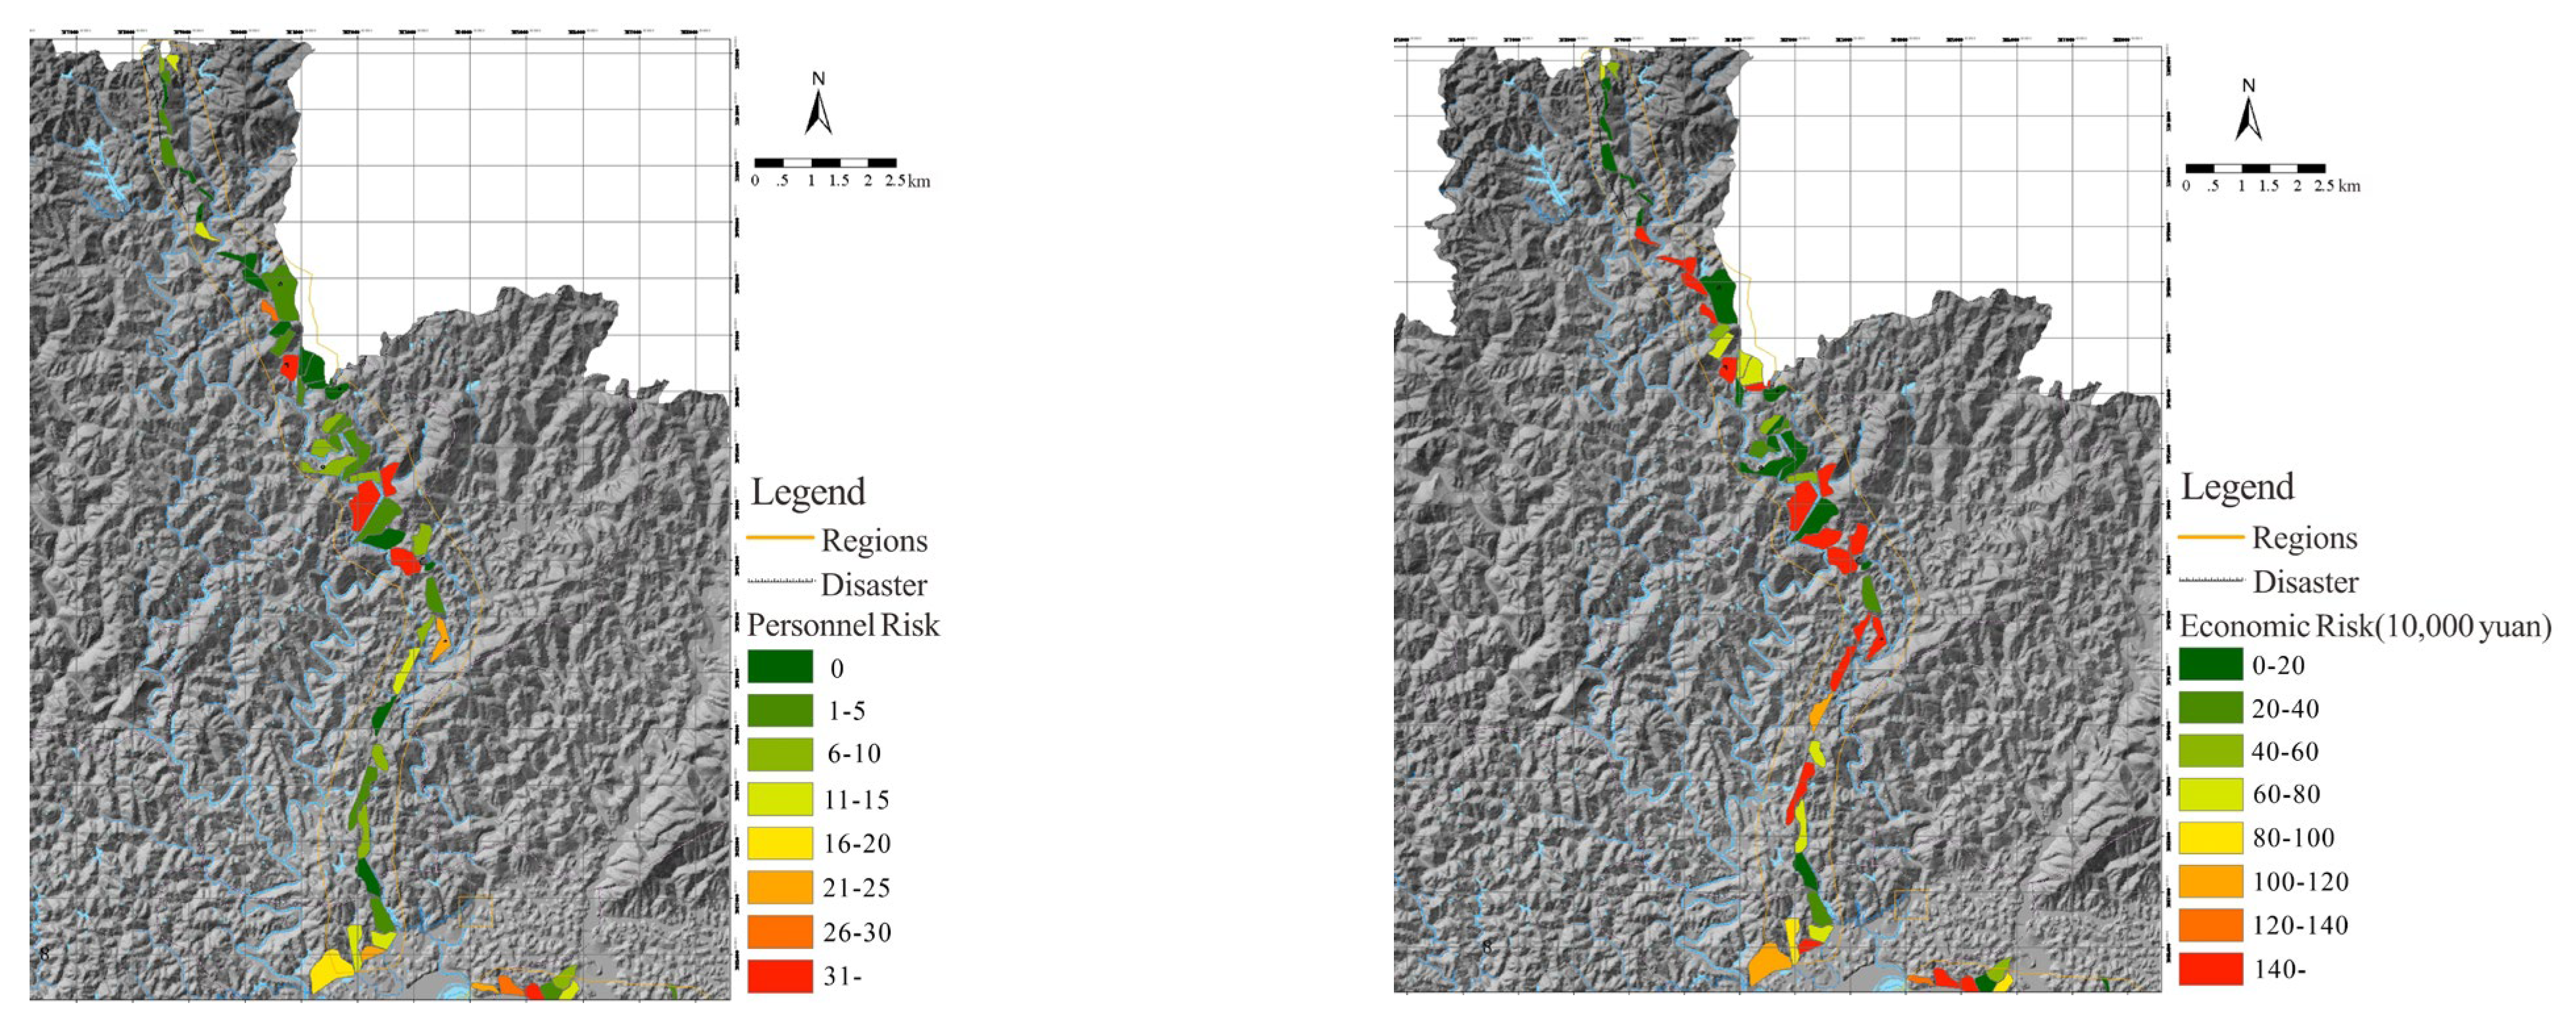
Based on the above disaster risk analysis, the vulnerability analysis of landslide disaster-bearing bodies, as well as the analysis of the number or economic value of landslide disaster-bearing bodies, the economic and population losses of slope geological disasters in the key areas in Mayang County were analyzed and calculated by using the disaster risk quantitative assessment model (using the risk quantitative destruction probability). Due to data limitations, in this paper, only the demographic and economic risks of a 20-year reappearing period were analyzed, as shown in Figure 11, Figure 12 and Figure 13.
The results revealed that there are 45 slope units with a high risk of slope geological disasters in the key area in the next 20 years, accounting for 12.5% of the total slope units, 195 medium-risk slope units, accounting for 54.3% of the total, and 119 low-risk slope units, accounting for 33.1% of the total. From the perspective of the spatial distribution range, high-risk areas are scattered throughout the key areas, but they are highly distributed in Shiyangshao Township–Yanmen Town–Changtan Village Yanmen Town, where the prevention and control of geological disasters should be done well. In these areas, highway and railway construction mainly affects slopes, so the relevant party protection work should be carried out to prevent the occurrence of geological disasters. The medium-risk slope units are mainly distributed in Shiyangshao Township–Yanmen Town, Chongqing–Huaihua Railway, which is mainly due to the structural control of natural slopes and the disturbance of human activities, so attention should be paid to the impact of monitoring and engineering activities; the low-risk areas are scattered throughout the key areas, mainly distributed in areas with a small slope, low impact of human activities, or low population density, and less impact of geological disasters.
4. Individual Landslide Risk Assessment
4.1. Landslide Features
The geographic position and overall view of the Shiyantan Landslide site are shown in Figure 14. The landform in the landslide area belongs to low mountains and hills, with a complex structure. The area is a weak earthquake zone, with a mild climate and abundant rainfall from April to July, and less precipitation in winter and spring. The relative height difference of the landslide is about 57 m, the boundary range is clear, and the plane is a “horseshoe” shape. The width of the landslide front edge is about 188 m, the oblique length is about 130 m, and the area is about 2.5 × 10⁴ m2. The vegetation on the landslide slope is more developed and mainly covered by shrubs and citrus trees. The material composition of the landslide is mainly residual slope sedimentary silty clay, siltstone, and silty mudstone. The slip mass is mainly strongly weathered silty mudstone. The altitude of the rock is 330°∠28°. The joint fissures are extremely developed and open, and the average occurrence is about 162°∠65°. It is speculated that the sliding surface is rock mass level. The seasonal variation of groundwater level and water volume in the landslide area is strong, and the water volume varies greatly with atmospheric precipitation.
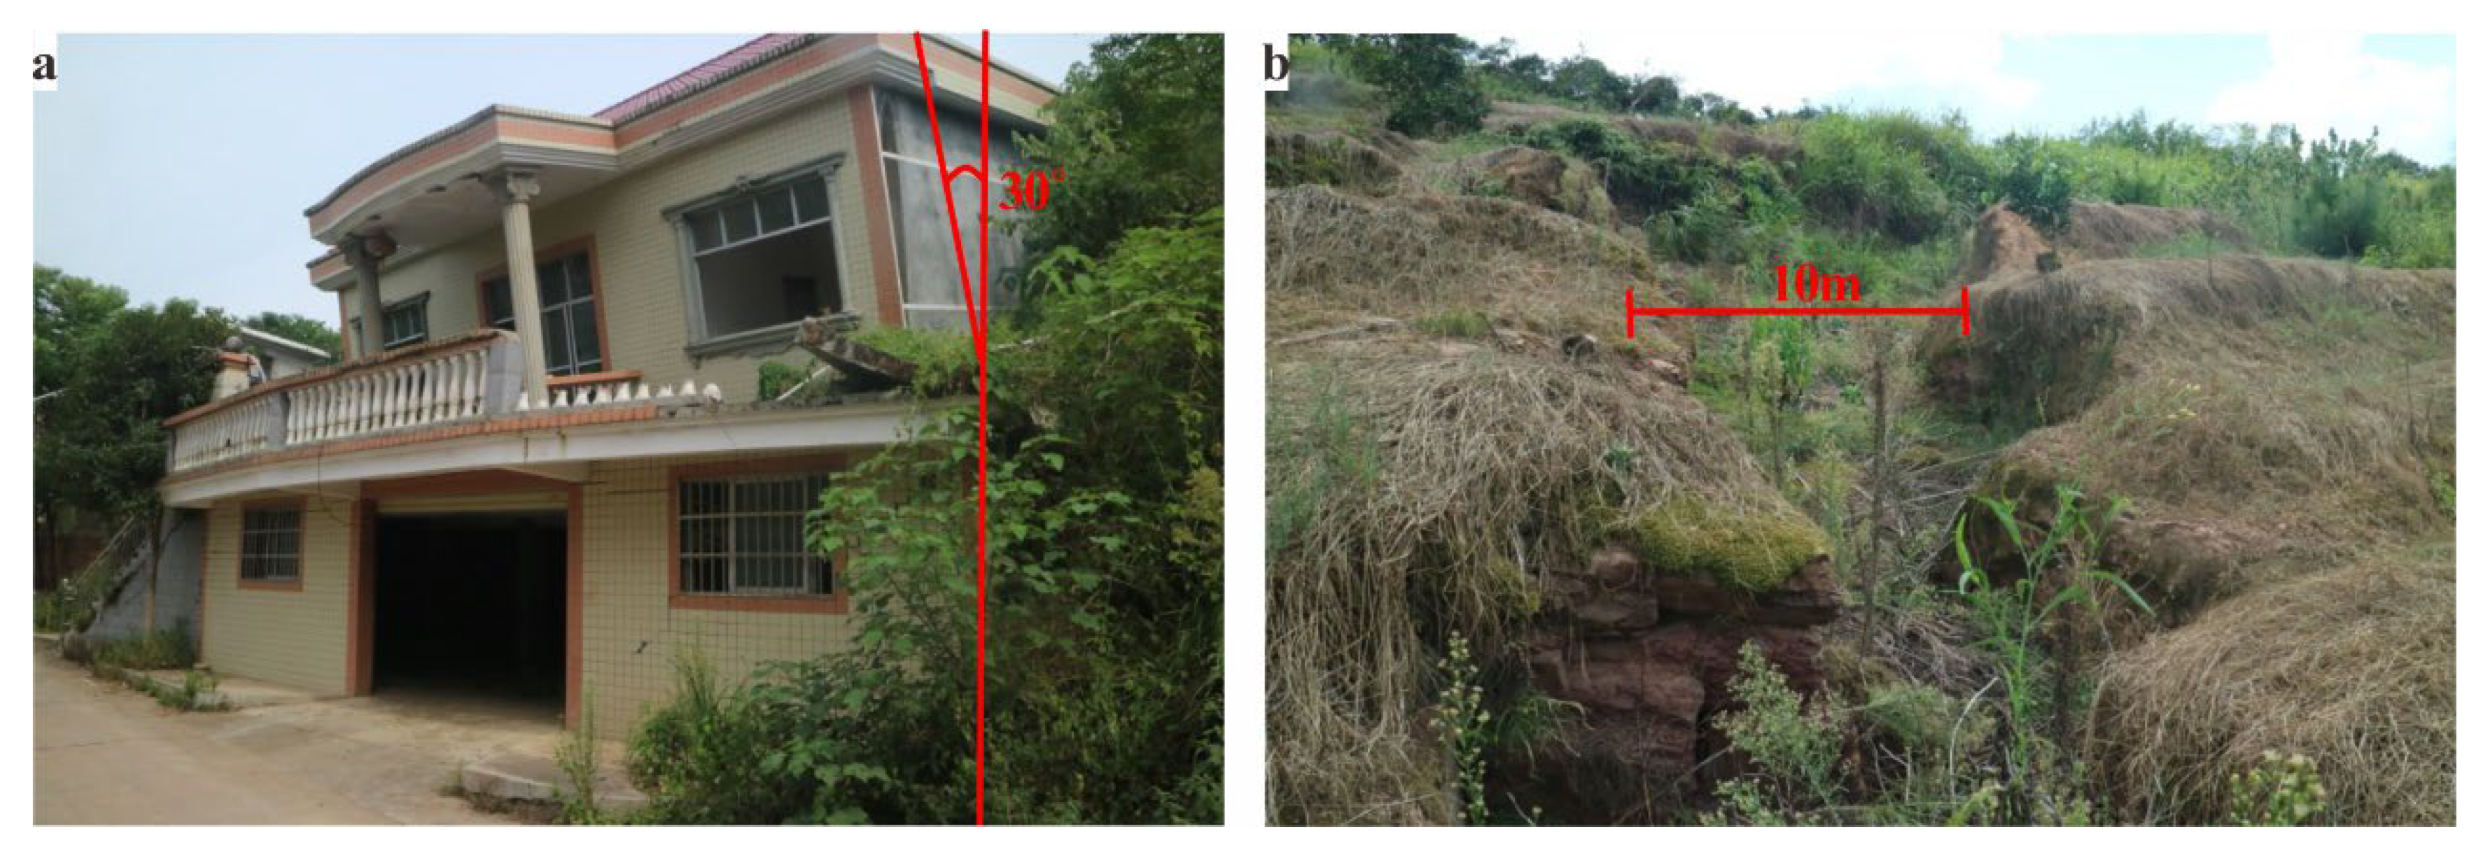
The Shiyantan landslide has not been stable in recent years due to rainfall and engineering construction. This slope had suffered obvious deformation and failure due to the continuous heavy rainfall, resulting in two deaths and a direct economic loss of 5.76 million yuan in June 2014. Some distinguishing sliding phenomena can be observed around the landslide at present; for example, the houses and township roads in the village have been severely deformed and damaged (Figure 15). Some cracks have occurred in the slope; they exhibit a relatively uniform distribution and are parallel to the main slide direction. At the back edge of the landslide, a scarp with a length of nearly 100 m, a height of 5–8 m, and a slope of 60–70 can be seen.
4.2. Probability Analysis of Extreme Rainfall
The main inducing factor of deformation and failure of the Shiyantan Landslide is rainfall, and the capacity and dynamic change process of rainfall have an important impact on the stability of the slope. The significant deformation and instability of the landslide are often induced by extreme rainfall processes. The reliability calculation of landslide stability, in the complete sense, can be achieved by analyzing the probability of extreme rainfall in a certain period of time and the possibility of landslide occurrence under this extreme rainfall condition.
It is rainy from June to August in the study area. The Shiyantan Landslide is a shallow rock landslide, where the influence of rainfall is mainly slope infiltration [41]. In this paper, the Pearson-III distribution was used to study extreme rainfall, and the probability density function is [42,43,44]:
where x is the rainfall data; a0, α, and β are the location parameter, shape, and scale of Pearson III distribution, respectively, which can be expressed as , ; E (x) is the mathematical expectation; CV and Cs are the off-potential coefficient and skewness coefficient. The density function can be determined after a0, α, and β are determined.
The exceeding cumulative probability of x can be expressed as
Let , be the variance yield, then the above formula can be transferred into
It can be seen that P is a function of α and . After transformation, it is not difficult to find that the rainfall frequency curve can be obtained after knowing E(x), Cv, and Cs.
In this paper, the annual maximum method was employed to select the samples, and the maximum value of the rainfall extreme value index from 2005 to 2018 was used for frequency distribution statistics. The extreme value index was the maximum cumulative rainfall of 1 day, 3 days, 5 days, and 7 days, and the reappearing period was 10 years, 50 years, and 100 years. Then, the parameters under different rainfall durations were obtained by using the curve-fitting method to fit the Pearson III curve, as shown in Table 4.
Based on the above calculation, the Green-Ampt model was used to calculate the rainfall infiltration intensity under certain rainfall intensities [38].
where y is the infiltration depth, t is the rainfall time, q is the rainfall intensity, α is the slope gradient, is the saturated water content, and is the initial water content. The calculation of rainfall infiltration depth in different reappearing periods is shown in Table 5.
4.3. Risk Assessment of Landslide
The thickness of the sliding body of the Shiyantan Landslide is about 7–8 m. According to the analysis of the calculation results in Table 4, the calculation conditions of the landslide stability were divided into the following three types: 1. Only considering the weight of the sliding body, that is, the natural state; 2. Considering the weight of the sliding body and once rainfall in 10 years and 3-day rainstorm, that is, the semi-saturated state; 3. Considering the weight of the sliding body, that is, once 7-day rainfall in 50 years, that is, the complete saturation state. In this paper, Geo-studio/Seep and slope modules were used to calculate the stability and failure probability of the slope under the above conditions. The results are shown in Table 6. The slope is relatively stable under normal conditions (natural state). When rainfall causes the rock and soil to be semi-saturated, the slope is stable. However, in the case of rare continuous heavy rainfall, with the increase in the rainfall intensity and reappearing period, the depth of rainwater infiltration will gradually increase, so that the rock and soil will be completely saturated, the weight will increase, the cohesion and internal friction angle will decrease, the stability of the slope will decrease, and the probability of instability will increase abruptly. Meanwhile, houses are built at the foot of the slope without taking any reinforcement measures, which causes a serious threat to the life and property safety of residents at the foot of the slope.
To evaluate the vulnerability of the disaster-bearing body, the influence range of the landslide should be first determined. The influence range of the landslide was mainly determined by the farthest sliding distance. According to the actual investigation and calculation, its farthest sliding distance was 170.8 m. Based on the structural characteristics of the slope, the affected area of the landslide was divided into four zones: the landslide mass was Zone 1, the region from the foot of the landslide slope to the first row of buildings is Zone 2, the region from the highway and the second row of buildings to 170.8 m of the leading edge of the landslide is Zone 3, and the post-expansion range of the landslide is Zone 4. The post-expansion range of the landslide was obtained according to the topography, field investigation, and engineering geological experience, as shown in Figure 16.
Uzielli et al. proposed the formula for calculating the vulnerability of hazard-bearing bodies, as follows:
where I refers to the action intensity of the landslide disaster; represents the vulnerability of the hazard-bearing body; , , represent the structural type, maintenance condition, service life of the building, and the included angle between the direction of the landslide force and the axial direction of the building; represents the impact force index of the landslide; represents the thickness index of the moving sliding mass.
V = I × S
For Zone 1, the buildings on the landslide body were easy to collapse due to the overall damage of the landslide mass, and the vulnerability of personnel increased with the increase in the vulnerability of the buildings, so the vulnerability was taken as 1.
In Zone 2, there were dense buildings, and most of them were 1–3-floor rural houses with brick or brick and wood structures. Their maintenance condition was general, and the included angle between the impact direction of the sliding mass and the axial direction of the building was close to 0–5°. Using the engineering category method and related empirical parameters, specific parameters and building vulnerability results are shown in Table 7; In Zone 2, the landslide at the foot of the slope was the direct impact zone, and the time for indoor personnel to avoid disasters was short, so the vulnerability of personnel was 0.45.
Due to the obstruction of buildings in Zone 2, the impact force on buildings in Zone 3 would be reduced, and the vulnerability value of buildings in Zone 3 would also be reduced. After a comprehensive analysis, the vulnerability of buildings in this zone was 0.45, and the vulnerability of personnel was 0.05.
Since there were no buildings at the trailing edge of the landslide in Zone 4, the building vulnerability and personnel vulnerability were not considered.
Landslide risk is generally defined as the casualties and property losses caused by landslide disasters in a certain period of time. Therefore, the quantitative risk determination of geological disasters mainly involves the frequency analysis of geological disasters and the vulnerability calculation of hazard-bearing bodies. In this paper, the most frequently used economic risk calculation model was adopted to calculate the economic risk, and the calculation formula is as follows:
where is the economic risk; is the annual probability of landslide instability; is the probability that the landslide reaches the disaster-bearing body, which needs to consider the sliding distance and sliding direction of the landslide; is the space-time distribution probability of the hazard-bearing body, and it can be 1.0 for houses and other buildings located in fixed positions; is the vulnerability value; E is the value of the hazard-bearing body, such as the net value of houses, roads, factories, etc.
For the loss of human life, the individual risk can be calculated by the following formula:
where is the individual risk value; is the vulnerability of personnel; the definition of , is similar to economic risk.
According to the field investigation, the disaster-bearing bodies within the slope scope of the Shiyantan Landslide were mainly considered economic disaster-bearing bodies (buildings, roads, and farmland) and indoor personnel. The landslide mainly threatened rural self-built residential buildings, residents, village roads, and 103 residents on and at the foot of the slope. The specific economic values are shown in Table 8. According to the estimation in the scene, the average distance between the building and the leading edge of the landslide was about 17 m, and the arrival probability of the landslide mass was . As for the space-time probability, the buildings were the fixed hazard-bearing bodies, so their space-time probability was 1; the space-time probability of people in the houses could be obtained through the investigation, and it could be known that in one of the houses, people lived 305 days a year and stayed 18 h a day, so the space–time probability of people was P (S:T) = (305/365) * (18/24) = 0.627.
Thus, the risk determination of the Shiyantan Landslide was carried out, and the results are shown in the Table 9.
At present, the Shiyantan landslide has undergone emergency treatment, including drainage ditches and retaining walls, but there are still some problems. Therefore, the following prevention and control suggestions are put forward: (1) Anti-slide piles. The inclined house plays the role of presser feet, but it has a greater risk. It is recommended to strengthen it. At the same time, anti-slide piles are used to support the shallow part of the front of the landslide. The pile ends should be embedded in the bedrock to a certain depth. (2) The intercepting ditch should be built at the trailing edge of the landslide. It forms an organic whole with the annular intercepting ditch on both sides and in the middle of the landslide, so that the surface water in the landslide area can be fully and effectively discharged during the rainy season to reduce the softening effect of the rock and soil in the landslide area. (3) It is necessary to pack the cracks on the landslide to prevent rainwater from seeping into the landslide. (4) Residents threatened by the sliding body have been partially relocated, but there are still many residents on the leading edge, so they should be relocated in time. In addition, the continuous deformation signs of the landslide shall be monitored continuously, and warning signs shall be set on both sides of it. The water level of the Jinjiang River shall be monitored. When the water level reaches or exceeds the historical maximum water level of 177 m, the front edge of the landslide is soaked by the river water to prevent the secondary sliding of the landslide.
In conclusion, this article takes Mayang County as an example to quantitatively characterize the landslide disaster risk, which provides an example for the follow-up landslide risk assessment and prevention work. In addition, there are still many defects in the research. It is hoped that in the following research, the vulnerability analysis can be more systematic and in-depth, for example, considering the age structure of personnel, building infrastructure, etc.
5. Conclusions
- (1)
- According to a large amount of statistical data analysis, the main influencing factors of landslide disasters in Mayang County are topography, geological lithology, geological structure, and rainfall. Controlled by formation lithology in space, most of them are developed in the distribution area of red clastic rocks; controlled by rainfall distribution in time, they mainly occur from April to July and have a positive correlation with rainfall.
- (2)
- In this paper, taking slope units as the basic evaluation unit, the risk calculation formula proposed by Varnes was used to evaluate the risk of slopes and the vulnerability of the disaster-bearing bodies. Comprehensively considering the population and economic risks, the geological disaster risk assessment of regions in Mayang County was completed. From the perspective of spatial distribution, there were 45 slope units in high-risk areas, which were scattered throughout the key areas and more distributed in Shiyangshao Township–Yanmen Town–Changtan Village Yanmen Town; there were 195 medium-risk slope units, which were mainly distributed in Shiyangshao Township–Yanmen Town; there were 119 low-risk slope units.
- (3)
- In this paper, taking the Shiyantan Landslide in Hunan Province as an example, the landslide disaster risk assessment was carried out. Landslides are generally stable in natural and half-saturated conditions, but slopes are highly likely to cause damages in case of extreme rainfall (e.g., five consecutive five days of rainfall in 50 years). In this case, the Shiyantan Landslide has low economic risk and high life risk, so it is necessary to formulate relevant measures to alleviate the risk.
The preliminary application of the rainfall-induced landslide risk assessment method provided a basis for subsequent landslide risk assessment and later maintenance. The landslide risk value calculated in this paper only represented the quantitative estimation in a certain period of time under specific landslide conditions.
Author Contributions
Conceptualization, H.S. and R.H.; methodology, H.S.; software, H.S.; formal analysis, D.W. and T.S.; investigation, D.W. and Z.Z.; writing—original draft preparation, H.S.; writing—review and editing, H.S.; supervision, T.S.; project administration, T.S.; funding acquisition, T.S. All authors have read and agreed to the published version of the manuscript.
Funding
This research was funded by National Key Research and Development Program of China, grant number 2021YFB3202901.
Data Availability Statement
The study did not report any data.
Conflicts of Interest
The authors declare no conflict of interest.
References
- Zhen, Z.; Shihai, L.; Li, M. Probability analysis of relationship between landslide and rainfall in Chongqing Area. Chin. J. Rock Mech. Eng. 2005, 24, 3185–3191. [Google Scholar]
- Zhang, M.; Hu, R.; Tan, R. State-of-the-art study on landslides due to rainfall and the prospect. Geotech. Investig. Surv. 2009, 37, 11–17. [Google Scholar]
- Tang, H.M.; Wei, L.; Tang, Y.H.; Gao, Y. Correlation analysis and prediction model for rainfallinduced landslide in Chongqing area. Chin. J. Geol. Hazard Control 2013, 24, 16–22. [Google Scholar]
- Caine, N. The Rainall intensity: Duration control of shallow landslides and debris flows. Geogr. Annaler. Ser. A Phys. Geogr. 1980, 62, 23–27. [Google Scholar]
- Chen, C.; Saito, H.; Oguchi, T. Rainfall intensity-duration conditions for mass movements in Taiwan. Prog. Earth Planet. Sci. 2015, 2, 1–13. [Google Scholar] [CrossRef] [Green Version]
- Aleotti, P. A warning system for rainfall-induced shallow failures. Eng. Geol. 2004, 73, 247–265. [Google Scholar] [CrossRef]
- Zhou, H.; Sun, S.; Shang, W.; Huang, Y. Analysis of the soil slope stability influenced by rainfall pattern and intensity. Sci. Technol. Eng. 2012, 12, 2602–2606. [Google Scholar]
- Zhao, L.; Li, D.; Tan, H.; Cheng, X.; Zuo, S. Characteristics of failure area and failure mechanism of a bedding rockslide in Libo County, Guizhou, China. Landslides 2019, 16, 1367–1374. [Google Scholar] [CrossRef]
- Yuming, W.U.; Hengxing, L.A.; Xing, G.A.; Langping, L.I. Rainfall threshold of storm-induced landslides in typhoon areas: A case study of Fujian Province. J. Eng. Geol. 2014, 22, 255–262. [Google Scholar]
- Ma, T.; Li, C.; Sun, L.; Li, W.; He, C. Rainfall intensity-duration thresholds for landslides in Zhejiang region, China. Chin. J. Geol. Hazard Control 2011, 22, 20–25. [Google Scholar]
- Xing, Q.; Qiang, X.; Liang, S.; Xu, S.; Zhang, T. Research overview on early warning of precipitation-induced loess landslides. Geol. Sci. Technol. Inform. 2014, 33, 219–225. [Google Scholar]
- Ke-qiang, H.; Dong, G.; Peng, Z.; Lu, G.; Guo-dong, Z. The vertical displacement direction rate of landslides induced by rainfall and its early warning destabilized criterion. Rock Soil Mech. 2017, 38, 3649–3659. [Google Scholar]
- Zhang, J.; Lu, T.; Xue, J.F.; Zheng, W.T. Modified Green-Ampt model for analyzing rainfall infiltration in slopes. Rock Soil Mech. 2016, 37, 2451–2457. [Google Scholar]
- Tang, Y.M.; Zhang, M.S.; Xue, Q.; Bi, J.B. Landslide monito-ring and early-warning: An overview. Geol. Rev. 2012, 58, 533–541. [Google Scholar]
- Yin, K.L.; Chen, L.X.; Zhang, G.R. Regional landslide hazard warning and risk assessment. Earth Sci. Front. 2007, 14, 85–97. [Google Scholar] [CrossRef]
- Nguyen, B.Q.V.; Kim, Y.T. Regional-scale landslide risk assessment on Mt. Umyeon using risk index estimation. Landslides 2021, 18, 2547–2564. [Google Scholar] [CrossRef]
- Cross, M. Landslide susceptibility mapping using the Matrix Assessment Approach: A Derbyshire case study. Geol. Soc. Lond. Eng. Geol. Spec. Publ. 1998, 15, 247–261. [Google Scholar] [CrossRef]
- Dai, F.C.; Lee, C.F.; Ngai, Y.Y. Landslide risk assessment and management: An overview. Eng. Geol. 2002, 64, 65–87. [Google Scholar] [CrossRef]
- Du, J. Risk Assessment of Individual Landslide; China University of Geosciences: Wuhan, China, 2012. [Google Scholar]
- Fell, R.; Corominas, J.; Bonnard, C.; Cascini, L.; Leroi, E.; Savage, W.Z. Guidelines for landslide susceptibility, hazard and risk zoning for land use planning. Eng. Geol. 2007, 102, 85–98. [Google Scholar] [CrossRef] [Green Version]
- Tyagi, A.; Tiwari, R.K.; James, N. GIS-based landslide hazard zonation and risk studies using MCDM. In Local Site Effects and Ground Failures; Springer: Singapore, 2021; pp. 251–266. [Google Scholar]
- Xiang, X.Q.; Huang, R.Q. Risk assessment and risk management for slope geohazards. J. Geol. Hazards Environ. Preserv. 2000, 11, 38–41. [Google Scholar]
- Ma, Y.S.; Zhang, Y.C.; Zhang, C.S.; Wang, J.S. Theory and approaches to the risk evaluation of geological hazards. J. Geomech. 2004, 10, 7–18. [Google Scholar]
- Tang, C.; Zhu, J. Approach for urban debris flow risk assessment. Adv. Water Sci. 2006, 17, 383–388. [Google Scholar]
- Wu, S.R.; Shi, J.S.; Zhang, C.S.; Wang, T. Preliminary discussion on technical guideline for geohazard risk assessment. Geol. Bull. China 2009, 28, 995–1005. [Google Scholar]
- Ruilin, H.; Linfeng, F.; Shanshan, W.; Lichao, W.; Xueliang, W. Theory and method for landslide risk assessment-current status and future development. J. Eng. Geol. 2013, 21, 76–84. [Google Scholar]
- Chen, L.X.; Yin, K.L.; Wang, Y. Discussion on risk prediction for single landslide. J. Nat. Disasters 2008, 17, 65–70. [Google Scholar]
- Wang, N.; Peng, K.; Li, Q.; Zhao, X.; Li, Y.; He, J. Quantitative evaluation of geological disaster liability based on RS & GIS analysis: A case study of Wufeng County, Hubei Province. Earth Sci. Front. 2012, 19, 221–229. [Google Scholar]
- Yang, Z.H.; Zhang, Y.S.; Guo, C.B. Landslide hazard rapid assessment in the Ms8.1 nepal earthquake-impacted area, based on Newmark model. J. Geomech. 2017, 23, 115–124. [Google Scholar]
- Li, X.; Xue, G.C.; Liu, C.Z. Evaluation of geohazard susceptibility based on information value model and information value-logistic regression model: A case study of the central mountainous area of Hainan Island. J. Geomech. 2022, 28, 294–305. [Google Scholar]
- Glade, T. Vulnerability assessment in landslide risk analysis. Beitrag Zur Erdsystemforschung 2003, 134, 123–146. [Google Scholar]
- Yin, K.L.; Zhang, G.R. Risk zonation of geo-hazards and its comprehensive control. Saf. Environ. Eng. 2003, 10, 32–35. [Google Scholar]
- Uzielli, M.; Nadim, F.; Lacasse, S.; Kaynia, A.M. A conceptual framework for quantitative estimation of physical vulnerability to landslides. Eng. Geol. 2008, 102, 251–256. [Google Scholar] [CrossRef]
- Hungr, O.; McDougall, S. Two numerical models for landslide dynamic analysis. Comput. Geo-Sci. 2009, 35, 978–992. [Google Scholar] [CrossRef]
- Anderson, M.G.; Holcombe, E.; Esquivel, M.; Toro, J.; Ghesquiere, F. The efficacy of a programme of landslide risk reduction in areas of unplanned housing in the Eastern Caribbean. Environ. Manag. 2010, 45, 807–821. [Google Scholar] [CrossRef]
- Papathoma-Köhle, M.; Kappes, M.; Keiler, M.; Glade, T. Physical vulnerability assessment for alpine hazards: State og the art and future needs. Nat. Hazards 2011, 58, 645–680. [Google Scholar] [CrossRef]
- Fotopoulou, S.; Pitilakis, K. Vulnerability assessment of reinforced concrete buildings subjected to seismically triggered slow-moving earth slides. Landslides 2013, 10, 563–582. [Google Scholar] [CrossRef]
- Guanyu, L.I.; Peng, L.I.; Min, G.U.O. Application of cluster analysis method in geological hazard risk assessment: A case study of Hancheng City. Sci. Technol. Eng. 2021, 21, 10629–10638. [Google Scholar]
- Zhang, Y.; Wu, J.; Xu, B. Human health risk assessment of groundwater nitrogen pollution in Jinghui canal irrigation area of the loess region, northwest China. Environ. Earth Sci. 2018, 77, 273. [Google Scholar] [CrossRef]
- Varnes, D.J.; IAEG. Commission on Landslide and Other Mass Movement on Slopes; Landslide hazard zonation: A review of principles and practice; The UNESCO Press: Paris, France, 1984; 63p. [Google Scholar]
- Chung, M.C.; Tan, C.H.; Chen, C.H. Local rainfall thresholds for forecasting landslide occurrence: Taipingshan landslide triggered by Typhoon Saola. Landslides 2017, 14, 19–33. [Google Scholar] [CrossRef]
- Benson, M.A. Uniform Flood-Frequency Estimating Methods for Federal Agencies. Water Resour. Res. 1968, 4, 891–908. [Google Scholar] [CrossRef]
- Li, P.; He, X.; Li, Y.; Xiang, G. Occurrence and Health Implication of Fluoride in Groundwater of Loess Aquifer in the Chinese Loess Plateau: A Case Study of Tongchuan, Northwest China. Expo Health 2019, 11, 95–107. [Google Scholar] [CrossRef]
- Li, P.; He, X.; Guo, W. Spatial groundwater quality and potential health risks due to nitrate ingestion through drinking water: A case study in Yan’an City on the Loess Plateau of northwest China. Hum. Ecol. Risk Assess. 2019, 25, 11–31. [Google Scholar] [CrossRef]
Figure 1.
Geographical location map of study area.

Figure 2.
Map of the study area with terrain elevation and the distribution of landslides.

Figure 3.
Relationship between geological hazards and slope.

Figure 4.
Relationship between geological hazards and slope direction.

Figure 5.
Relationship between geological hazards and slope shape.

Figure 6.
Relationship between geological hazards and rock and soil types.

Figure 7.
The distribution of landslide occurrence and rainfall over the study period 2005 to 2017, (a) for yearly distribution and (b) for monthly distribution.
Figure 7.
The distribution of landslide occurrence and rainfall over the study period 2005 to 2017, (a) for yearly distribution and (b) for monthly distribution.

Figure 8.
Slope assessment map of Yanmen town to Changtan village (10 years, 20 years).

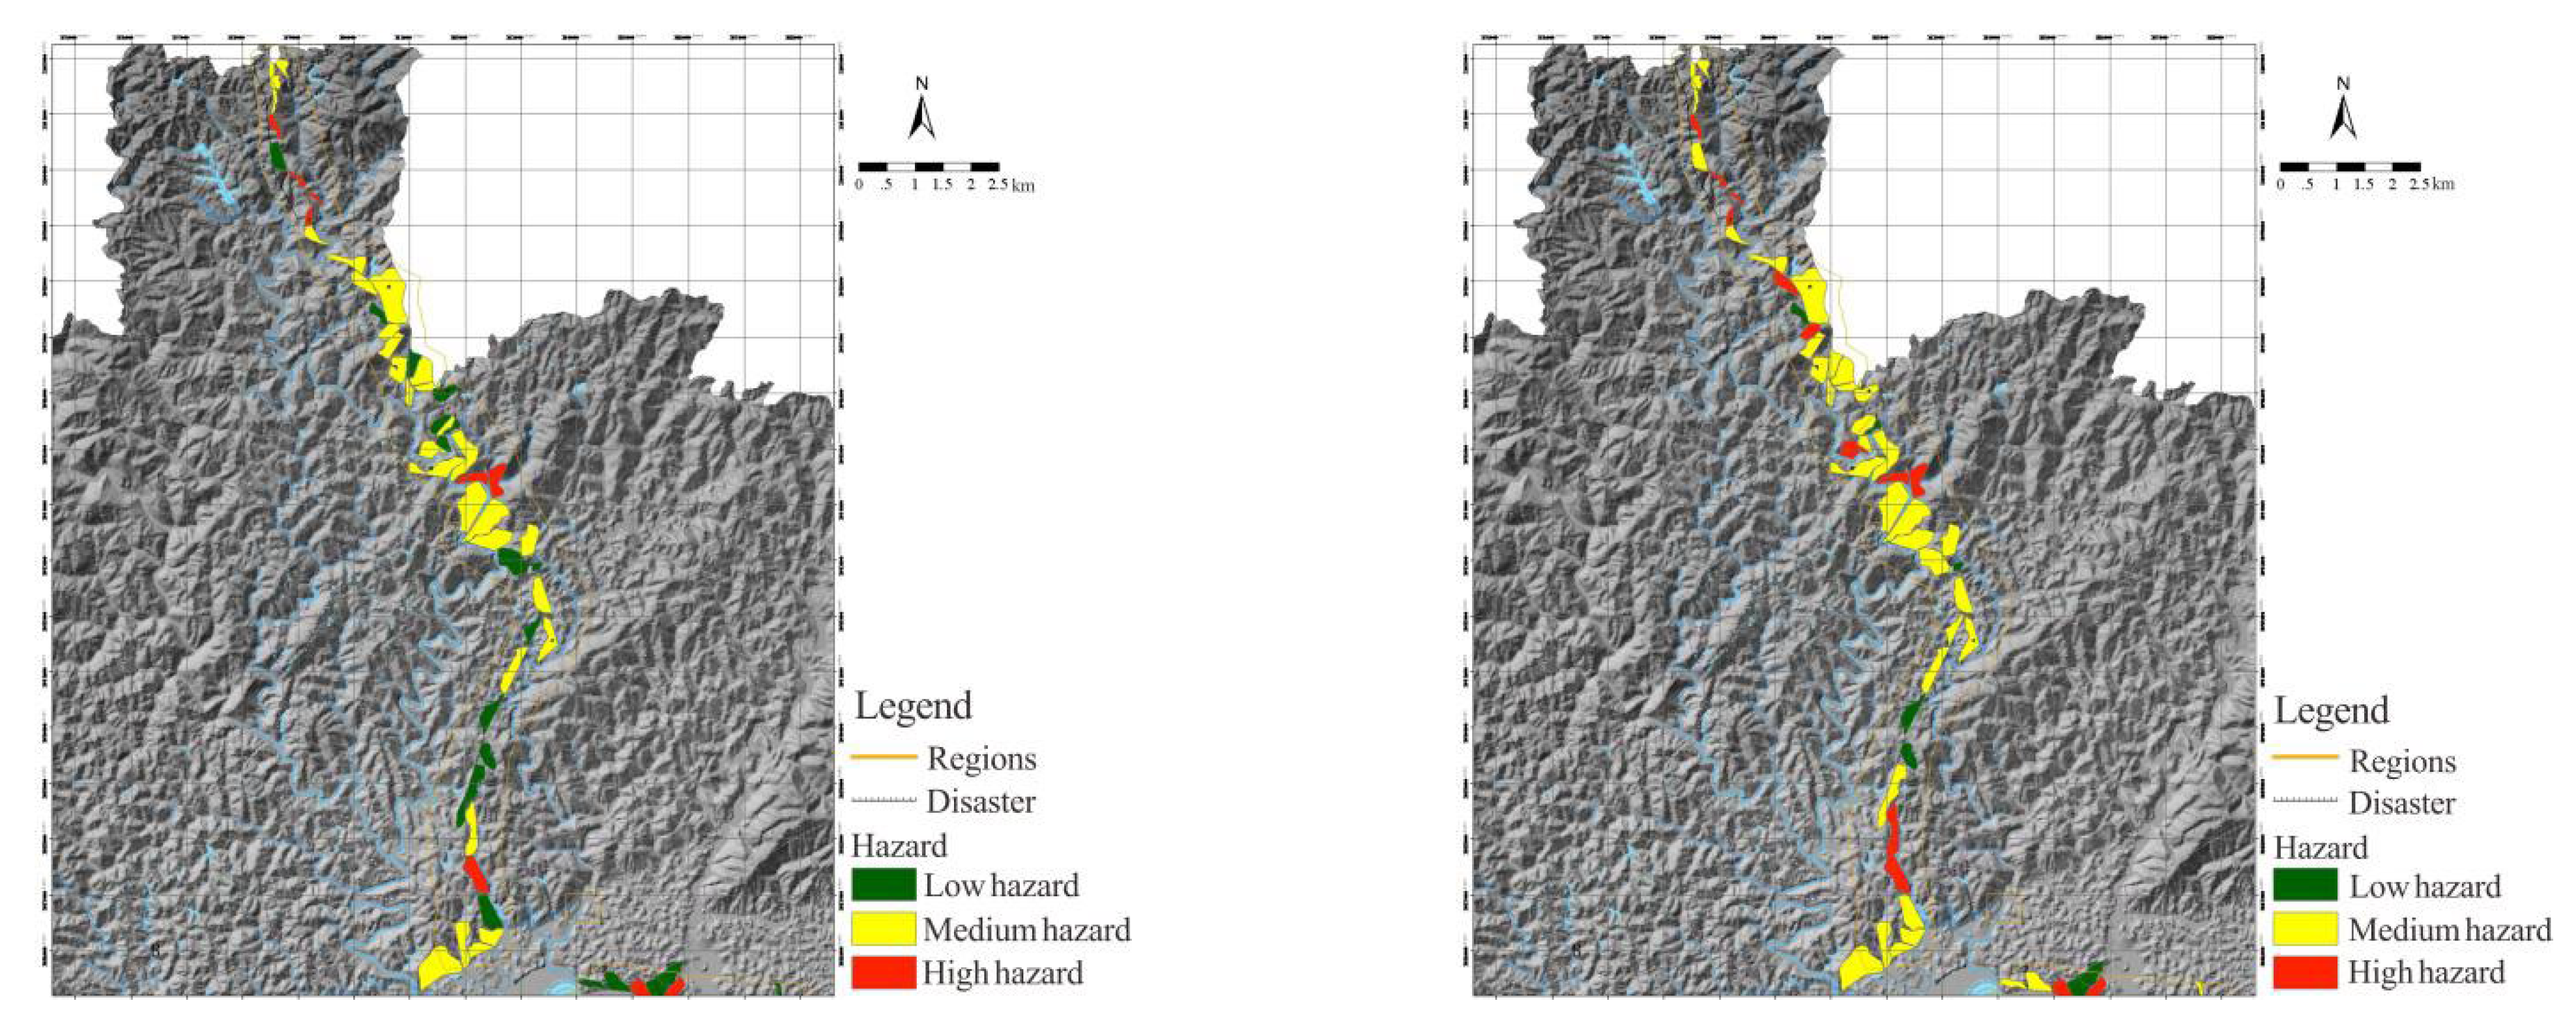
Figure 9.
Slope assessment map of Shiyangshao township to Yanmen town (10, 20 years).

Figure 10.
Slope assessment map of Jiaozhou Liuzhou Railway Section (10, 20 years).

Figure 11.
Slope personnel risk map and economic risk map of Yanmen town to Changtan village.

Figure 12.
Slope personnel risk map and economic risk map of Shiyangshao township to Yanmen town.

Figure 13.
Slope personnel risk map and economic risk map of Jiaozhou Liuzhou Railway Section.

Figure 14.
The geographic location and geomorphology of Shiyantan landslide.

Figure 15.
Photos of the Shiyantan landslide ((a) damaged house at the leading edge of the landslide (b) tensile crack).
Figure 15.
Photos of the Shiyantan landslide ((a) damaged house at the leading edge of the landslide (b) tensile crack).

Figure 16.
Geological map of Shiyantan landslide.


Table 1.
Statistical table of slope assessment in key areas of Mayang County.
| Degree | Reappearing Period of 10 Years | Reappearing Period of 20 Years | ||
|---|---|---|---|---|
| The Number of Units | Percentage | The Number of Units | Percentage | |
| High-risk region | 46 | 12.8% | 74 | 20.6% |
| Medium-risk region | 146 | 40.7% | 198 | 55.2% |
| Low-risk region | 167 | 46.5% | 87 | 24.2% |
Table 2.
Landslide disaster impact area vs. building vulnerability.
| Vs | Affected Area | Slip Body |
|---|---|---|
| Soil-wood | 0.9 | 1.0 |
| Brick-wood | 0.7 | 1.0 |
| Brick-concrete | 0.5 | 1.0 |
| Railway | 0.7 | 1.0 |
| Motorway | 0.6 | 1.0 |
| Highway | 0.3 | 1.0 |
| Transmission line | 0.7 | 1.0 |
| Village road | 0.3 | 1.0 |
| Farmland | 0.3 | 1.0 |
| Orchard | 0.3 | 1.0 |
| Wasteland | 0.7 | 1.0 |
| Minerals | 0.6 | 1.0 |
Table 3.
Reference value of indoor personnel vulnerability based on building vulnerability.
| Vulnerability | Soil-Wood | Brick-Wood | Brick-Concrete |
|---|---|---|---|
| 0.1 | 0.00 | 0.00 | 0.00 |
| 0.3 | 0.01 | 0.01 | 0.01 |
| 0.5 | 0.02 | 0.02 | 0.02 |
| 0.8 | 0.08 | 0.13 | 0.13 |
| 1 | 0.24 | 0.45 | 0.45 |
Table 4.
P-III curve parameters under different rainfall durations.
| Different Rainfall Durations/d | E(x)/mm | Cv | Cs |
|---|---|---|---|
| 1 | 99.069 | 0.28622 | 1.15347 |
| 3 | 133.115 | 0.31363 | 1.35802 |
| 5 | 146.385 | 0.25625 | 0.63550 |
| 7 | 169.762 | 0.23527 | 1.32693 |
Table 5.
Infiltration depth (IDe) statistics table for different rainfall return periods (Unit: m).
| Return Periods | IDe (1 Day) | IDe (3 Days) | IDe (5 Days) | IDe (7 Days) |
|---|---|---|---|---|
| 10 | 3.34 | 4.61 | 4.79 | 5.45 |
| 50 | 4.22 | 5.99 | 5.74 | 6.76 |
| 100 | 4.58 | 6.55 | 6.11 | 7.29 |
Note: “IDe (3 days)” means the infiltration depth of accumulated rainfall in 3 days.
Table 6.
Values of stability factor and failure probability in different conditions.
| Conditions | Stability Coefficient | Failure Probability (%) |
|---|---|---|
| 1 | 1.293 | 7.06% |
| 2 | 1.048 | 35.42% |
| 3 | 0.883 | 59.18% |
Table 7.
The values of susceptibility factor and building’s vulnerability.
| Structural Typology | Sstr | Smai | Sser | Sdir | If-dep | Ifai-s | V |
|---|---|---|---|---|---|---|---|
| Brick-concrete | 0.5 | 0.2 | 0.1 | 0.7 | 1.0 | 1.0 | 0.89 |
| Half-timbered | 0.7 | 0.35 | 0.7 | 0.7 | 1.0 | 1.0 | 0.98 |
Table 8.
Valuation of the disaster-bearing body.
| Type | Number | Unit Price (yuan) | Price (104 yuan) | Total (104 yuan) |
|---|---|---|---|---|
| Farmland | 6000 m2 | 30 | 18 | 667.42 |
| Half-timbered building | 672 m2 | 600 | 40.32 | |
| Brick-concrete structural building | 2995 m2 | 1800 | 539.1 | |
| Village road | 300 m | 1000 | 30 | |
| Citrus orchard | 8000 m2 | 50 | 40 |
Table 9.
Risk determination of Shiyantan landslide.
| Most Dangerous Condition | Deadweight + Complete Saturation (50 Years) |
|---|---|
| Annual instability probability (%) | 1.183 |
| Total economic value (104 yuan) | 667.42 |
| Number of people | 103 |
| Societal economic risk(104 yuan) | 4.69 |
| Individual economic risk(104 yuan) | 4.55 × 10⁻² |
| Total life risk | 0.13 |
| Individual life risk | 1.19 × 10⁻³ |
Publisher’s Note: MDPI stays neutral with regard to jurisdictional claims in published maps and institutional affiliations. |
© 2022 by the authors. Licensee MDPI, Basel, Switzerland. This article is an open access article distributed under the terms and conditions of the Creative Commons Attribution (CC BY) license (https://creativecommons.org/licenses/by/4.0/).
Share and Cite
MDPI and ACS Style
Sui, H.; Su, T.; Hu, R.; Wang, D.; Zheng, Z. Study on the Risk Assessment Method of Rainfall Landslide. Water 2022, 14, 3678. https://doi.org/10.3390/w14223678
AMA Style
Sui H, Su T, Hu R, Wang D, Zheng Z. Study on the Risk Assessment Method of Rainfall Landslide. Water. 2022; 14(22):3678. https://doi.org/10.3390/w14223678
Chicago/Turabian StyleSui, Haoyue, Tianming Su, Ruilin Hu, Dong Wang, and Zhengwei Zheng. 2022. "Study on the Risk Assessment Method of Rainfall Landslide" Water 14, no. 22: 3678. https://doi.org/10.3390/w14223678
Note that from the first issue of 2016, this journal uses article numbers instead of page numbers. See further details here.