

Monthly Runoff Interval Prediction Based on Fuzzy Information Granulation and Improved Neural Network
State Key Laboratory of Eco-Hydraulics in Northwest Arid Region, Xi’an University of Technology, Xi’an 710048, China
*
Authors to whom correspondence should be addressed.
Water 2022, 14(22), 3683; https://doi.org/10.3390/w14223683
Submission received: 24 September 2022
/
Revised: 24 October 2022
/
Accepted: 11 November 2022
/
Published: 15 November 2022
(This article belongs to the Section Hydrology)
Abstract
:High-precision monthly runoff prediction results are of great significance to regional water resource management. However, with the changes in human activity, climate, and underlying surface conditions, the runoff sequence presents highly nonlinear and random characteristics. In order to improve the accuracy of runoff prediction, this study proposed a runoff prediction model based on fuzzy information granulation (FIG) and back propagation neural network (BPNN) improved with genetic algorithm (FIG-GA-BP). First, FIG was used to process the original runoff data to generate three sequences of minimum, average, and maximum that can reflect the rule of runoff changes. Then, genetic algorithms (GA) were used to obtain the optimal initial weights and thresholds of the BPNN through selection, crossover, and mutation. Finally, BPNN was used to predict the generated three sequences separately to obtain the prediction interval. The proposed model was applied to the monthly runoff interval prediction of Linjiacun and Weijiabu hydrological stations in the main stream of the Wei River and Zhangjiashan hydrological station on Jing River, a tributary of the Wei River. Compared with the interval prediction model FIG-BP, FIG-WNN, and traditional BP model. The results show that the FIG-GA-BP interval prediction model had a good prediction effect, with higher prediction accuracy and a narrower range of prediction intervals. Therefore, this model has superiority and practicability in monthly runoff interval prediction.
1. Introduction
Water is a necessary condition for human survival and development. The water cycle system makes water resources ‘infinitely’ used, and runoff is the basic link of the water cycle. In the narrow sense of water resources, runoff is a water resource that can be exploited and utilized for a long time under current technical conditions. Therefore, runoff has attracted great attention. It plays a vital role in estimating future available water resources. Accurate runoff prediction plays a key role in water resource planning, management, development, and utilization, such as providing a decision-making basis for flood control, irrigation, reservoir operation [1].
In recent years, a large number of experts and scholars at home and abroad have carried out research on runoff forecasting model [2,3]. At present, the models applied to runoff forecasting can basically be divided into process-driven model and data-driven model. The process-driven model is established by describing and analyzing the physical processes of runoff and confluence in the catchment. Xinanjiang three-source model, Tank model, HBV model and so on are common process-driven models. For example, Yao used three different conceptual hydrological models (HBV, HyMod and Xin’an River) to simulate daily runoff in Xiangshuibao watershed of Haihe River. The results show that the three hydrological models have good application in daily flow simulation of Xiangshuibao watershed and can achieve the purpose of flood forecasting [4]. The application of process-driven models requires a large number of accurate and complex data. At present, the application of process-driven models in runoff prediction is not widespread. Data-driven models usually do not describe the physical process of runoff formation, but build a runoff prediction model that can reach a certain accuracy by seeking the optimal mathematical formula between input data (such as early runoff data, rainfall data, etc.) and output data (such as annual runoff data, monthly runoff data, etc.) Data-driven models can be divided into traditional prediction models and modern intelligent prediction models. Traditional prediction models include multiple linear regression model (MLR), principal component analysis model, periodic analysis model, etc. Modern intelligent prediction models mainly include artificial neural network model, wavelet analysis model, etc. For example, Cheng put forward several artificial neural network (ANN) models to predict Manwan Reservoir’s runoff, and the experimental results indicate that the ANN has better prediction accuracy [5]. Zhang improved the grey self-memory model by selecting BP neural network to reduce the prediction error and improve the prediction accuracy [6]. Guo proposed an improved support vector machine (SVM) model to predict the daily reservoir inflow of the Three Gorges Reservoir [7]. For the same prediction problem, the results predicted by different models are different. Based on the characteristics of nonlinearity and complexity of runoff series, it is difficult for a single model to obtain all effective information of hydrological series. The combined prediction model formed by combining multiple single models has become a research hotspot, which is proposed for purpose of improving prediction accuracy. Kisi put forward a hybrid wavelet and SVM model for hydrological prediction and proved that this model provides better prediction than the conventional support vector regression model [8]. Badrzade used four different hourly-scale prediction methods, ANN, adaptive network-based fuzzy inference system (ANFIS), WNN, ANFIS-WNF to conduct runoff prediction research. The results show that the prediction effect of the combined forecasting method is better [9]. It can be seen from the above examples that the combined prediction model has a good effect on runoff prediction.
Most current runoff prediction models focus on point prediction of runoff series, but the heterogeneity of hydrological components and its non-linear behavior make runoff process a complicated phenomenon, and it is difficult to accurately describe the uncertainty of runoff with point prediction results. Prediction interval (PI) has attracted much attention in flow forecasting due to its characteristics of quantitative uncertainty. PI technology can overcome the characteristics of unmeasurable uncertainty in runoff forecasting, understand the variation range of runoff series, and provide a basis for better water resources management. Common interval prediction models include Bootstrap method, Bayesian method etc. Zhao proposed a transcend probability Bayesian discriminant analysis method for monthly and seasonal runoff prediction, which improved the accuracy [10]. Ma established the Bayesian probability prediction model, which uses the distribution function to express the uncertainty of the hydrological prediction. The results show that the model has advantages in the uncertainty of runoff prediction and improved the accuracy of runoff prediction [11]. Yuan proposed an interval prediction model (C-BPELM-WOAM) for daily runoff series. Taking the Astor River Basin as an example, the results show that the C-BPELM-WOAM model achieves a high quality of daily runoff prediction interval [12]. The above models usually need to obtain the deterministic forecast results first, and then establish the uncertainty interval of the forecast results by assuming that the forecast error follows a certain distribution on the basis of the deterministic forecast results. The above runoff forecast interval models need to rely on probability density functions, which require more parameters, data, high complexity, and poor applicability. It is of great research value to study the direct interval prediction model which is not based on the prior distribution assumption. Therefore, it is necessary to find a more effective method to establish runoff PI model. Runoff data has the characteristics of time, strong volatility, instability and randomness. Therefore, it is better to predict the range of the data in the future than to predict a specific value. Information granulation just meets this requirement, so a method of fuzzy information granulation (FIG) is put forward. This method was originally proposed by Professor Zadeh [13] and is mostly used in interval forecasting of wind power, photovoltaic output, wind speed, etc. For example, Chen proposed a fuzzy interval prediction model of photovoltaic output based on CSO-SVM and fuzzy information granulation theory. The results show that the model can get better point prediction value and prediction interval [14]. He proposed an interval prediction method based on fuzzy information granularity and support vector regression. The results show that the method provides high quality point prediction and interval prediction [15]. Zhang established a PV short-term output interval prediction model based on similar day fuzzy information granulation and Elman neural network. Through example simulation, the results show that the proposed interval prediction method has high prediction accuracy and practical value [16].
In order to improve the accuracy of runoff prediction and the adaptability of the model, this study proposes a monthly runoff interval prediction model based on fuzzy information granulation and improved BP neural network (FIG-GA-BP). First, the FIG method is used to process the historical runoff data into three sequences of minimum, average, and maximum, the sequences can reflect the runoff change rule, so as to obtain the effective information and change trend of runoff data. Then, the initial optimal weight and threshold of BP neural network are determined by GA, because the GA can obtain the optimal solution. Finally, BPNN is used to predict the processed three sequences to obtained the prediction result interval. To test the availability of the model, the model was applied to the Linjiacun and Weijiabu hydrological stations in the main stream of the Wei River and Zhangjiashan Hydrological Station in the tributary Jing River in the Wei River Basin. The monthly runoff prediction was carried out and compared with FIG-BP, FIG-WNN and traditional BP model.
2. Materials and Methods
2.1. Study Area and Data Sources
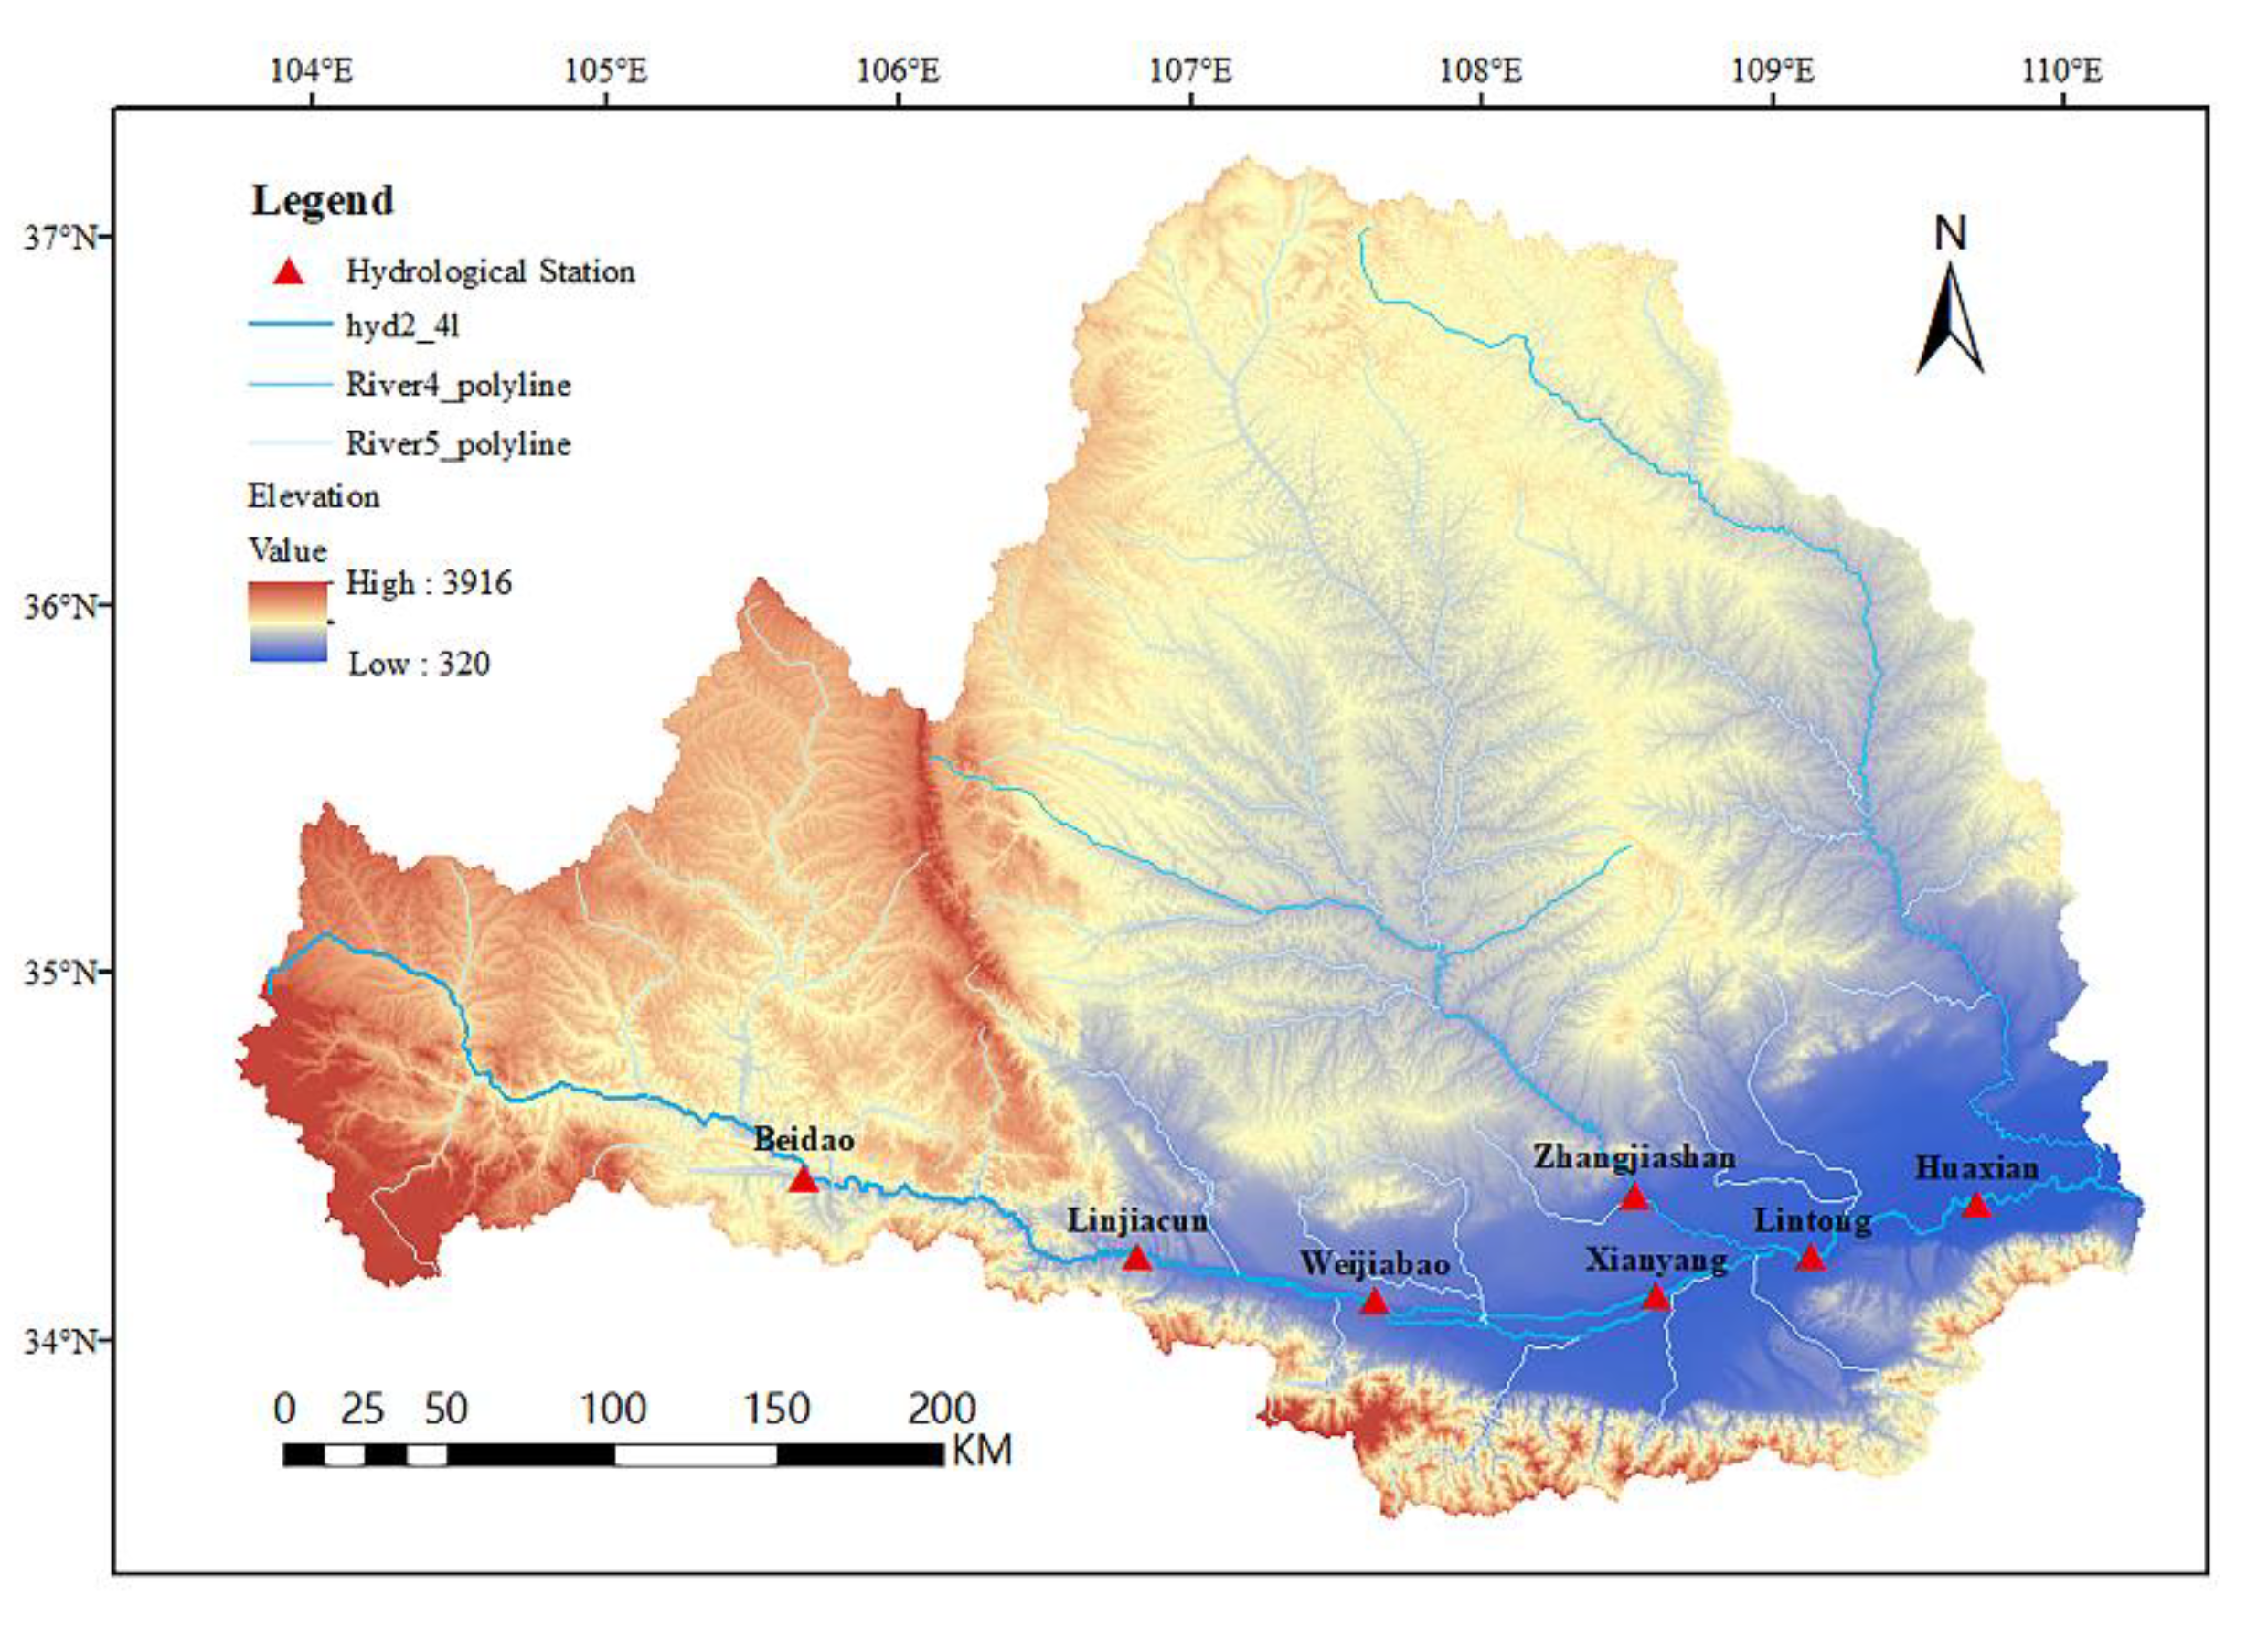
The research was conducted in the Wei River basin, the largest river in Shaanxi Province. It is also the largest tributary of the Yellow River. The Wei River originates from Bird and Mouse Mountain in Dingxi City, Gansu Province, and flows through central and southeast Gansu Province and central Shaanxi Province until it enters the Yellow River at Weinan City in Tongguan County. The total length of the Wei River is 818 km, and the basin area is 134,766 km2. A schematic diagram of Wei River Basin is shown in Figure 1.
The Wei River basin is in a semi-humid zone and is a temperate continental monsoon climate, where 60% of the annual precipitation is concentrated in July–October, the average runoff for many years is 7.57 billion cubic meters. The spatial distribution of runoff in the Wei River basin is uneven; the basic trend is to decrease from south to north, and the seasonal change in runoff is obvious, with autumn runoff being the greatest.
The data in this section are from the monthly runoff data for Weijiabu and Linjiacun hydrological stations in the main stream of the Wei River and Zhangjiashan Hydrological Station in the tributary Jing River from January 1950 to December 2018. The basic runoff data of each hydrological station are shown in Table 1. All runoff data were obtained from the hydrological yearbook. Linjiacun Hydrological Station is located 1000 m downstream of Baoji Gorge Dam on the Wei River, and the water catchment area is 30,661 km2, which is an important control station upstream of the Wei River. Weijiabu Hydrological Station is located in Meixian City, Baoji City, with a catchment area of 37,006 km2, and is an important control station in the middle reaches of the Wei River. Zhangjiashan Hydrological Station is located on the tributary Jing River, which is a key observation station in China.
2.2. Methods
2.2.1. Fuzzy Information Granulation
Runoff data have strong volatility, instability, and randomness; therefore, a range of forecast data in a future period is better than a specific value. Information granulation can meet this requirement [17]. Information granulation divides a complete information data set into several equal parts according to the similarity and indivisibility of information, and each part is an information granule [18]. There are three kinds of information granulation models: fuzzy-set-based, rough-set-based, and quotient-space-based. In this study, the information granulation model based on fuzzy set is selected to better reflect the various characteristics of the runoff series. The specific steps are as follows:
Step 1. Window segmentation: The original runoff time series are segmented according to certain rules to determine the size of the window.
Step 2. Information granulation: Determine the granularity rules required for the original data and select appropriate subordination functions.
The most important part of the granulation process is the selection of fuzzy granulation methods. This article uses Pedrycz’s fuzzy granulation [19]. The fuzzification process is described as follows:
Presuming that the original runoff time series is defined as X, after determining the size of the window, the runoff time series is divided into multiple windows according to the design requirements, and each window is represented by W; after that, each window that was divided is fuzzified. A fuzzy particle g is established to describe the fuzzy concept G [13]. The relationship between the fuzzy particle and the fuzzy concept is as follows:
where x is an element of the runoff time series X.
After the window segmentation is completed, it is indispensable to select the appropriate window membership function to predict the data changes in the window. Common window membership functions include trigonometric, Gaussian, parabolic, and ladder [20]. Because the window runoff time data have strong volatility and instability, we need to predict the range of runoff changes during design, that is, we need to obtain the maximum and minimum values after the information is fuzzy and granulated. Therefore, this study selects the triangular membership function, in which the expression is as follows:
where l represents the minimum in runoff data changes; m represents the intermediate value; and u represents the maximum.
2.2.2. BP Neural Network Improved by Genetic Algorithm
The BP algorithm was first proposed by Rumelhart, and its main principle is signal forward propagation and error back propagation BPNN is a multilayer feedforward neural network with forwarding information propagation and error back-propagation functions [21]. One of its main advantages is that it can learn the general approximation of continuous functions with the precision expected by anyone, as well as the characteristics of clear concepts and strong nonlinear mapping capabilities. BPNN includes three layers: input layer, intermediate layer (or hidden layer), and output layer. The basic theory is to adjust the weight and threshold of neurons at each layer by selecting the gradient drop method, so that the error between the predicted output and the target output is gradually reduced; finally, stop training when the required accuracy is achieved [22]. The design steps of the BPNN are as follows:
Step 1. Normalization of runoff data. A set of runoff time series data is divided into input data and target data. In order to improve the degree of convergence, calculation speed, and simulation accuracy and avoid overfitting, the values of input variables need to be standardized and normalized before training the neural network. The normalized formula is:
where xi′ represents the runoff data after standardized; Xi represents the original runoff data.
Step 2. BP network initialization. In [−1, 1], give the connection weight and the hidden and output layer threshold a small value randomly. Determine the structure and parameter setting of BPNN.
Step 3. BPNN training. First, the initial weights and thresholds are drawn up based on experience. Then set up the input data and output data. Finally, start training and the forward iterative calculation is performed to calculate the predicted output value.
Step 4. Error correction. First, the error between the target value and the predicted output value is calculated. Then, the weight and threshold of BPNN are adjusted by gradient descent. Finally, the error is minimized through the back-propagation of the error.
Step 5. If the error size meets the required error accuracy requirements, stop training and save the trained network.
John Holland in the United States first proposed genetic algorithm [23]. It stimulates the elimination of survival of the fittest in the biological world. Through the coding, under limited and reasonable conditions, individuals with excellent fitness values are selected for replication, crossover, and mutation, so that the individuals that meet the goals can effectively multiply to the next generation, and the final effect is better under the conditions of continuous competition. Conversely, individuals with poorer effects will be naturally eliminated, and the optimal solution will be searched through successive iterations.
The traditional BPNN uses the gradient descent method to continuously adjust the weights and thresholds of each layer of the network. When performing complex calculations, it will fall into the dilemma of local minimums. In order to avoid this problem, the GA is used to search for the best fit individuals in the population using the characteristics of global optimization. Then, iteratively find the optimal initial thresholds and weights of the BPNN through operations such as crossover and mutation. A GA-BP model is established to compensate the shortcomings of traditional model.
2.3. Modeling and Evaluation
2.3.1. FIG-GA-BP Prediction Model Construction
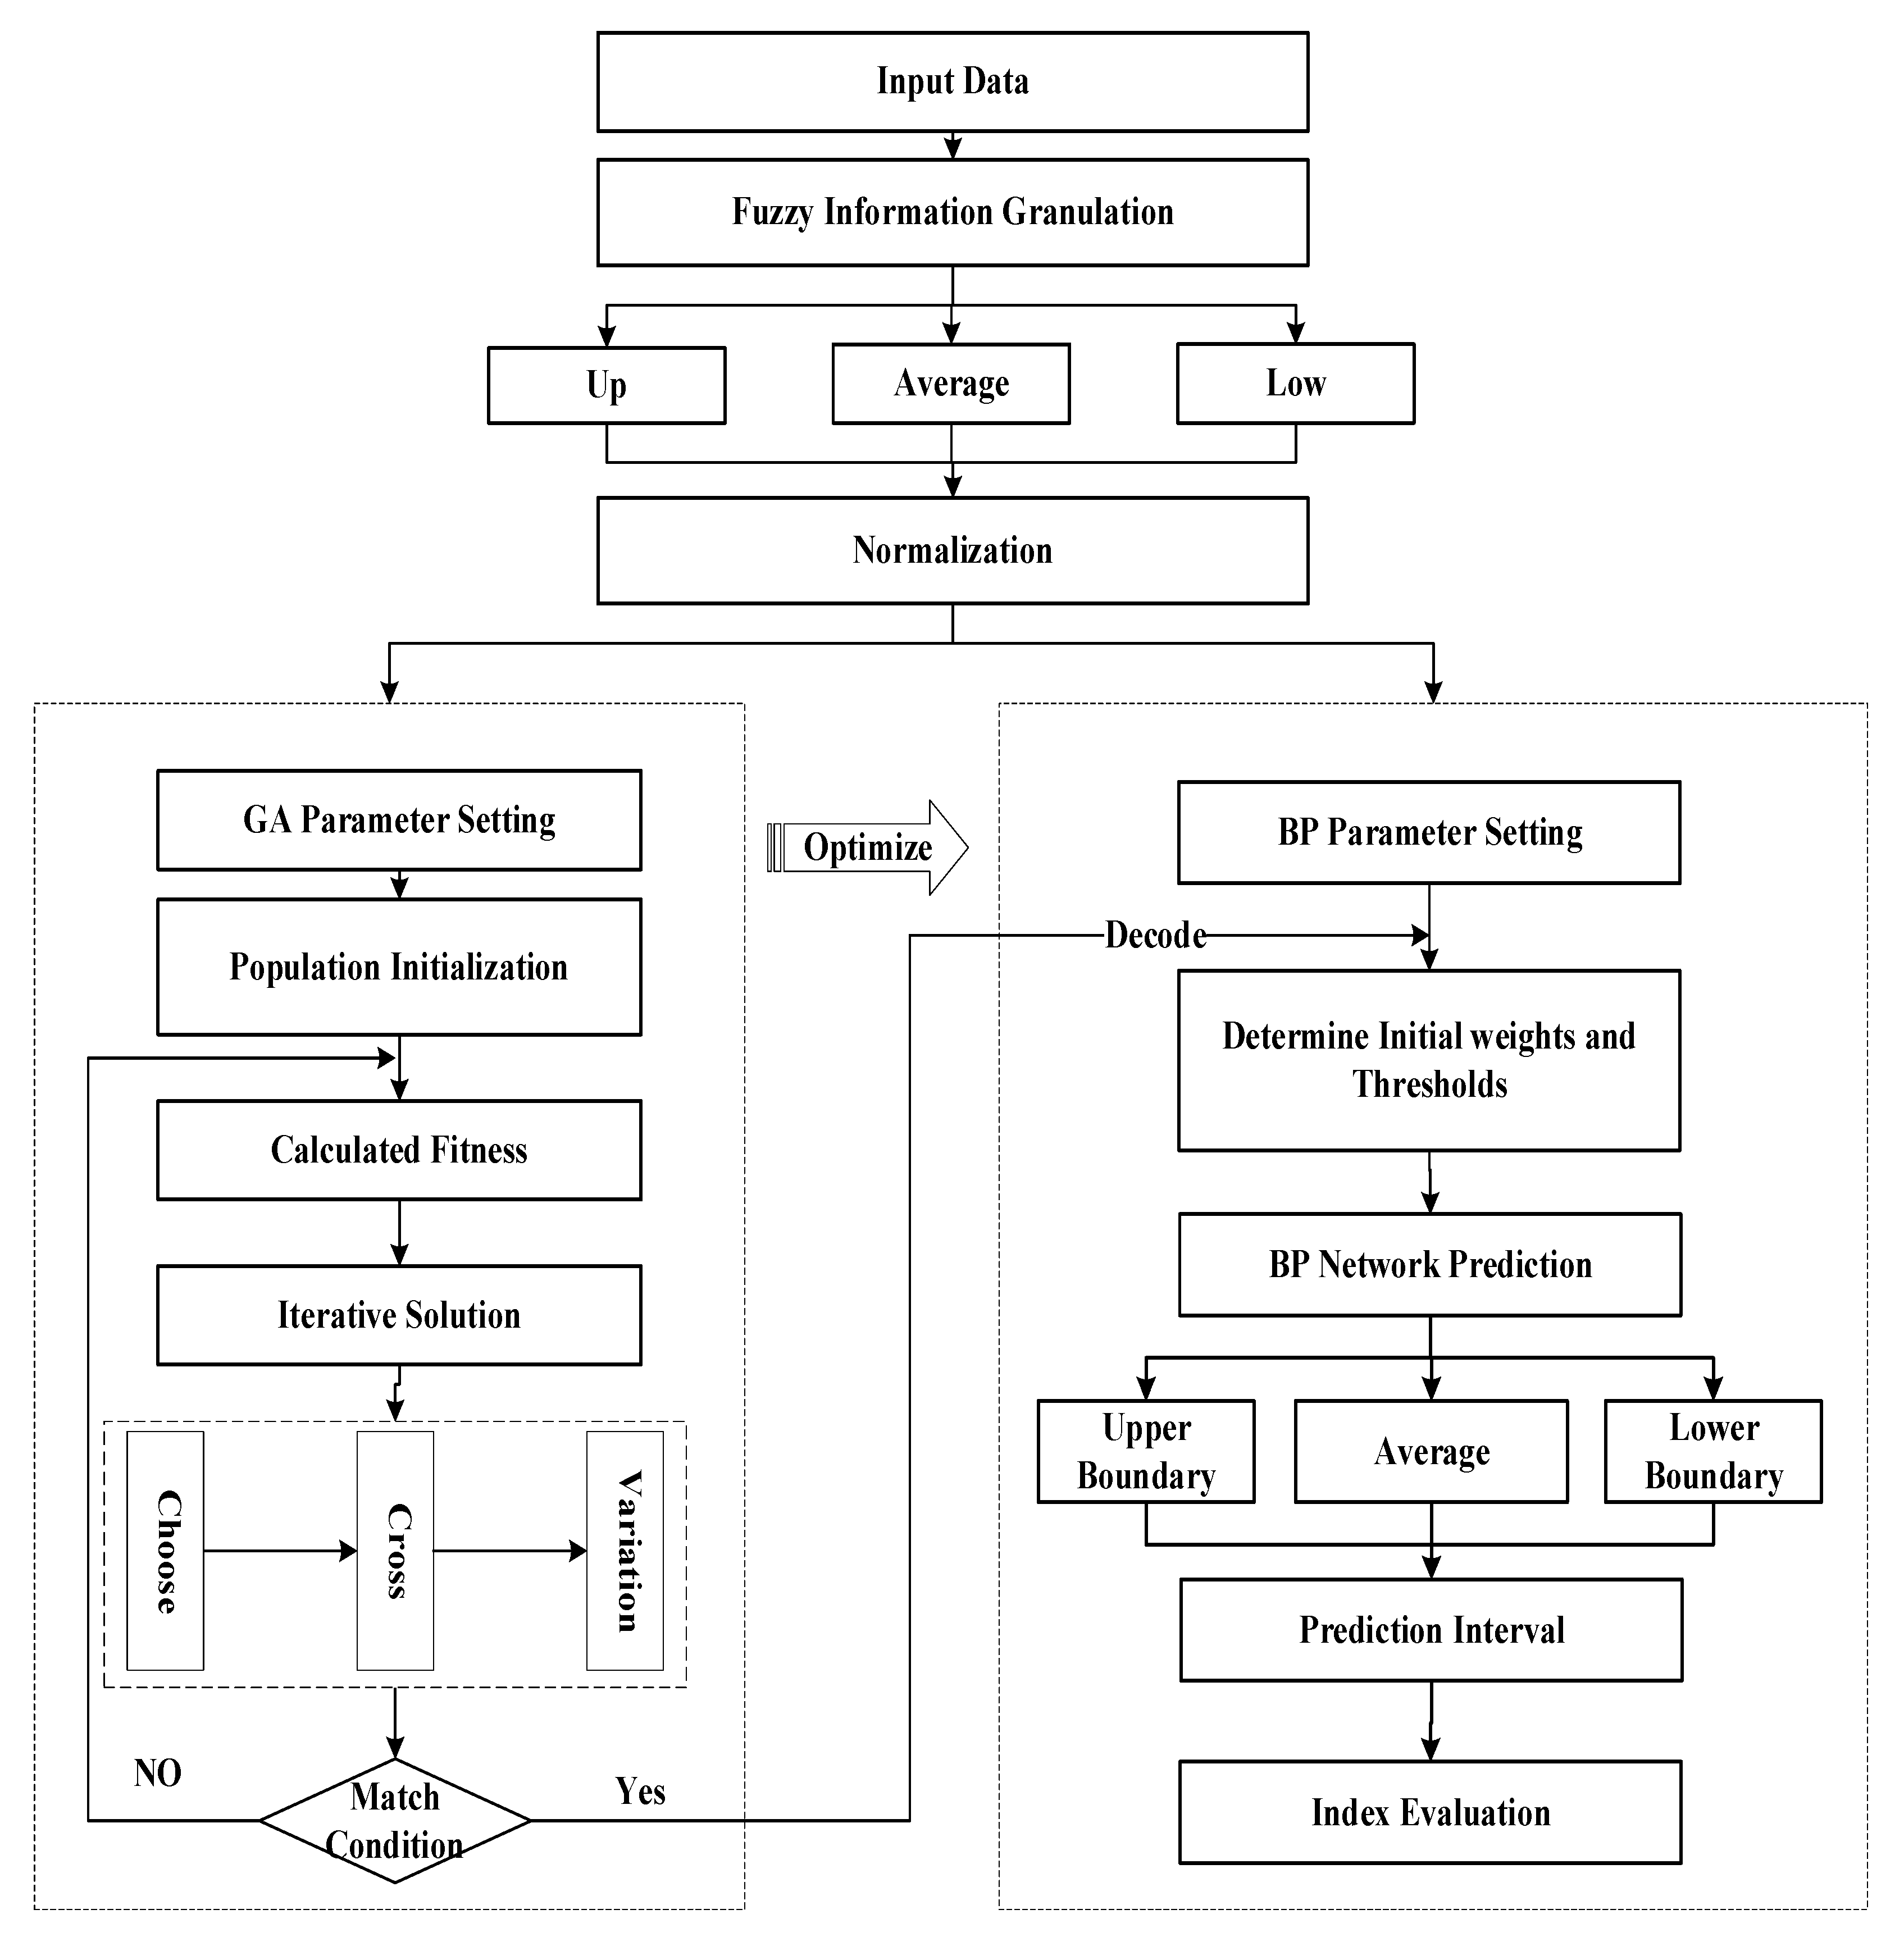
When predicting a runoff sequence with highly nonlinear and uncertain characteristics, first use the FIG to preprocess the data to obtain effective information of the hydrological series. Then, the GA is used to optimize the initial weights and thresholds of the BPNN. Finally, the BPNN is used to predict, and the FIG-GA-BP runoff interval prediction model is established. The model building process is as follows:
Step 1. Fuzzy information granulation processing. Select historical runoff data as samples for fuzzy information granulation processing. First, determine the size of the window and the scale of prediction, and then use the membership function to generate the minimum (Low), average (R), and maximum (Up) sequences that can reflect the rule of runoff change.
Step 2. Data normalization processing. Use mapminmax function to normalize the three sequences generated after the fuzzy granulation of runoff data and limit the value of input data to [0, 1].
Step 3. Parameter setting and population initialization. First, determine the various parameters in the genetic algorithm, such as population size, number of iterations, crossover probability, mutation probability, etc. At the same time, in order to determine the initial weight and threshold of the BP neural network, it is necessary to determine the number of neurons in each layer through a trial algorithm.
Step 4. Genetic algorithm iteratively solves the optimal initial weight and threshold. Firstly, the fitness function is established to select the best chromosome in the population by calculating the fitness, then perform operations such as crossover and mutation to find the individual with the best fitness and obtain the optimal initial weight and threshold of the BP network under GA optimization.
Step 5. BPNN prediction. BPNN was used to predict the three normalized sequences and the predicted results were obtained.
Step 6. Model verification and evaluation. According to the measured runoff data, the model is analyzed and evaluated by comparing the predicted value with the measured value by the model evaluation index.
Figure 2 shows the construction process of FIG-GA-BP runoff interval prediction model.
2.3.2. Interval Prediction Evaluation Index
In order to more accurately judge the prediction results of the FIG-GA-BP model through observation and data analysis, this study chooses Forecasting Interval Coverage Percentage (FICP), Forecasting Interval Average Width (FIAW) as evaluation indicators to verify the prediction accuracy of the algorithm [24,25].
- (1)
- FICP
FICP represents the total amount of measured runoff falling within the prediction interval (PI). The larger the FICP value, the more the actual runoff value falling into PI, and the higher the prediction accuracy. The FICP design formula is shown in Formula (4):
where is the total amount of runoff forecast data; ; and is calculated by Formula (5):
where represents the lower bounds of PI; represents the upper bounds of PI; is the measured runoff.
- (2)
- FIAW
FIAW can make up for the problem that there is no limit to the prediction bandwidth due to the single pursuit of reliability. For example, a large PICP (or even close to 100%) can be easily achieved through a very wide prediction interval, but such prediction results are meaningless [26]. Therefore, FIAW is introduced to evaluate the effectiveness of the model. The smaller the FIAW is, the narrower the width of PI, and the prediction effect is better. The FIAW calculation formula is as follows:
To facilitate comparison, this study uses the forecasting interval normalized average width (FINAW) as the evaluation index. FINAW is calculated by Formula (7):
where represents the range of interval widths.
2.4. Data Pre-Processing
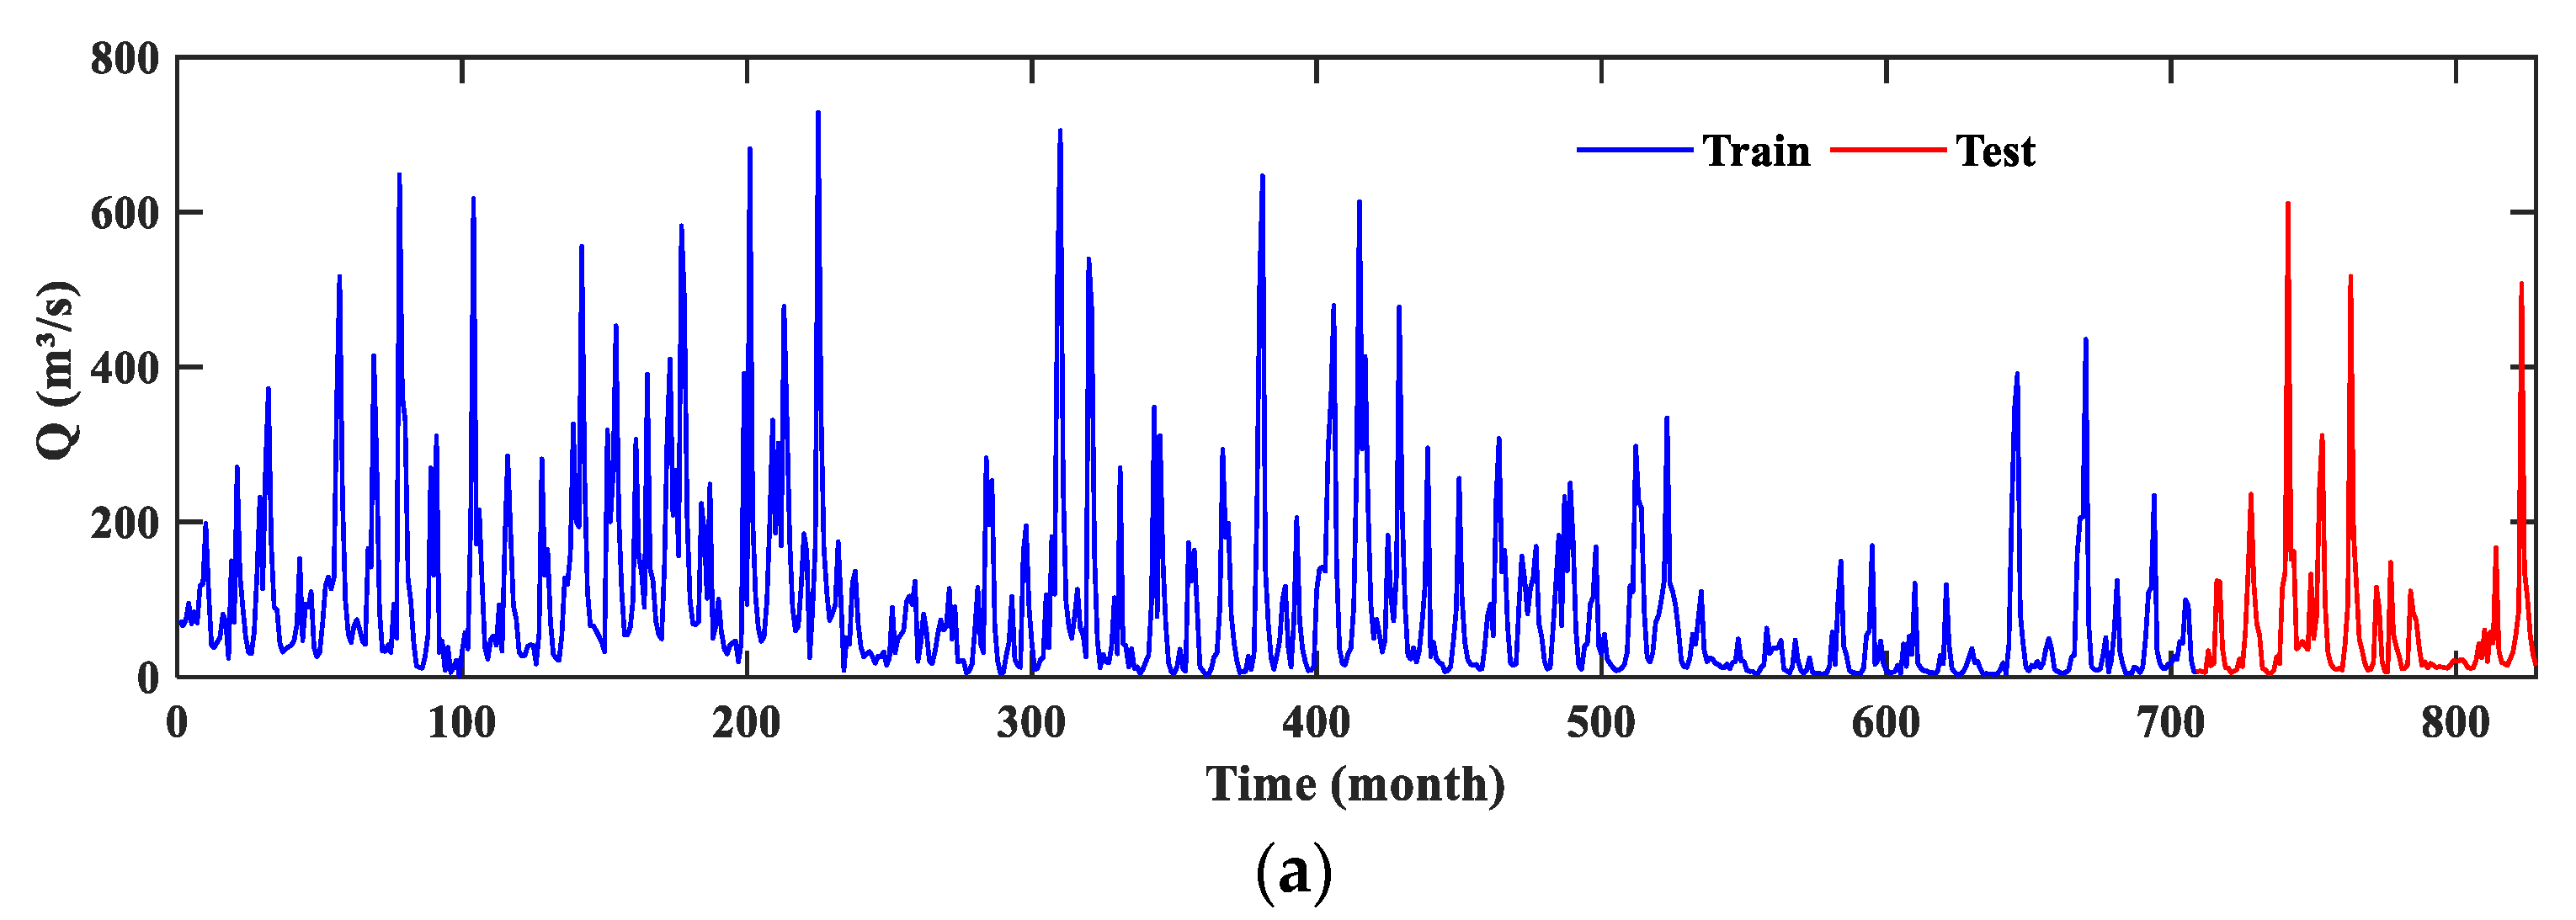
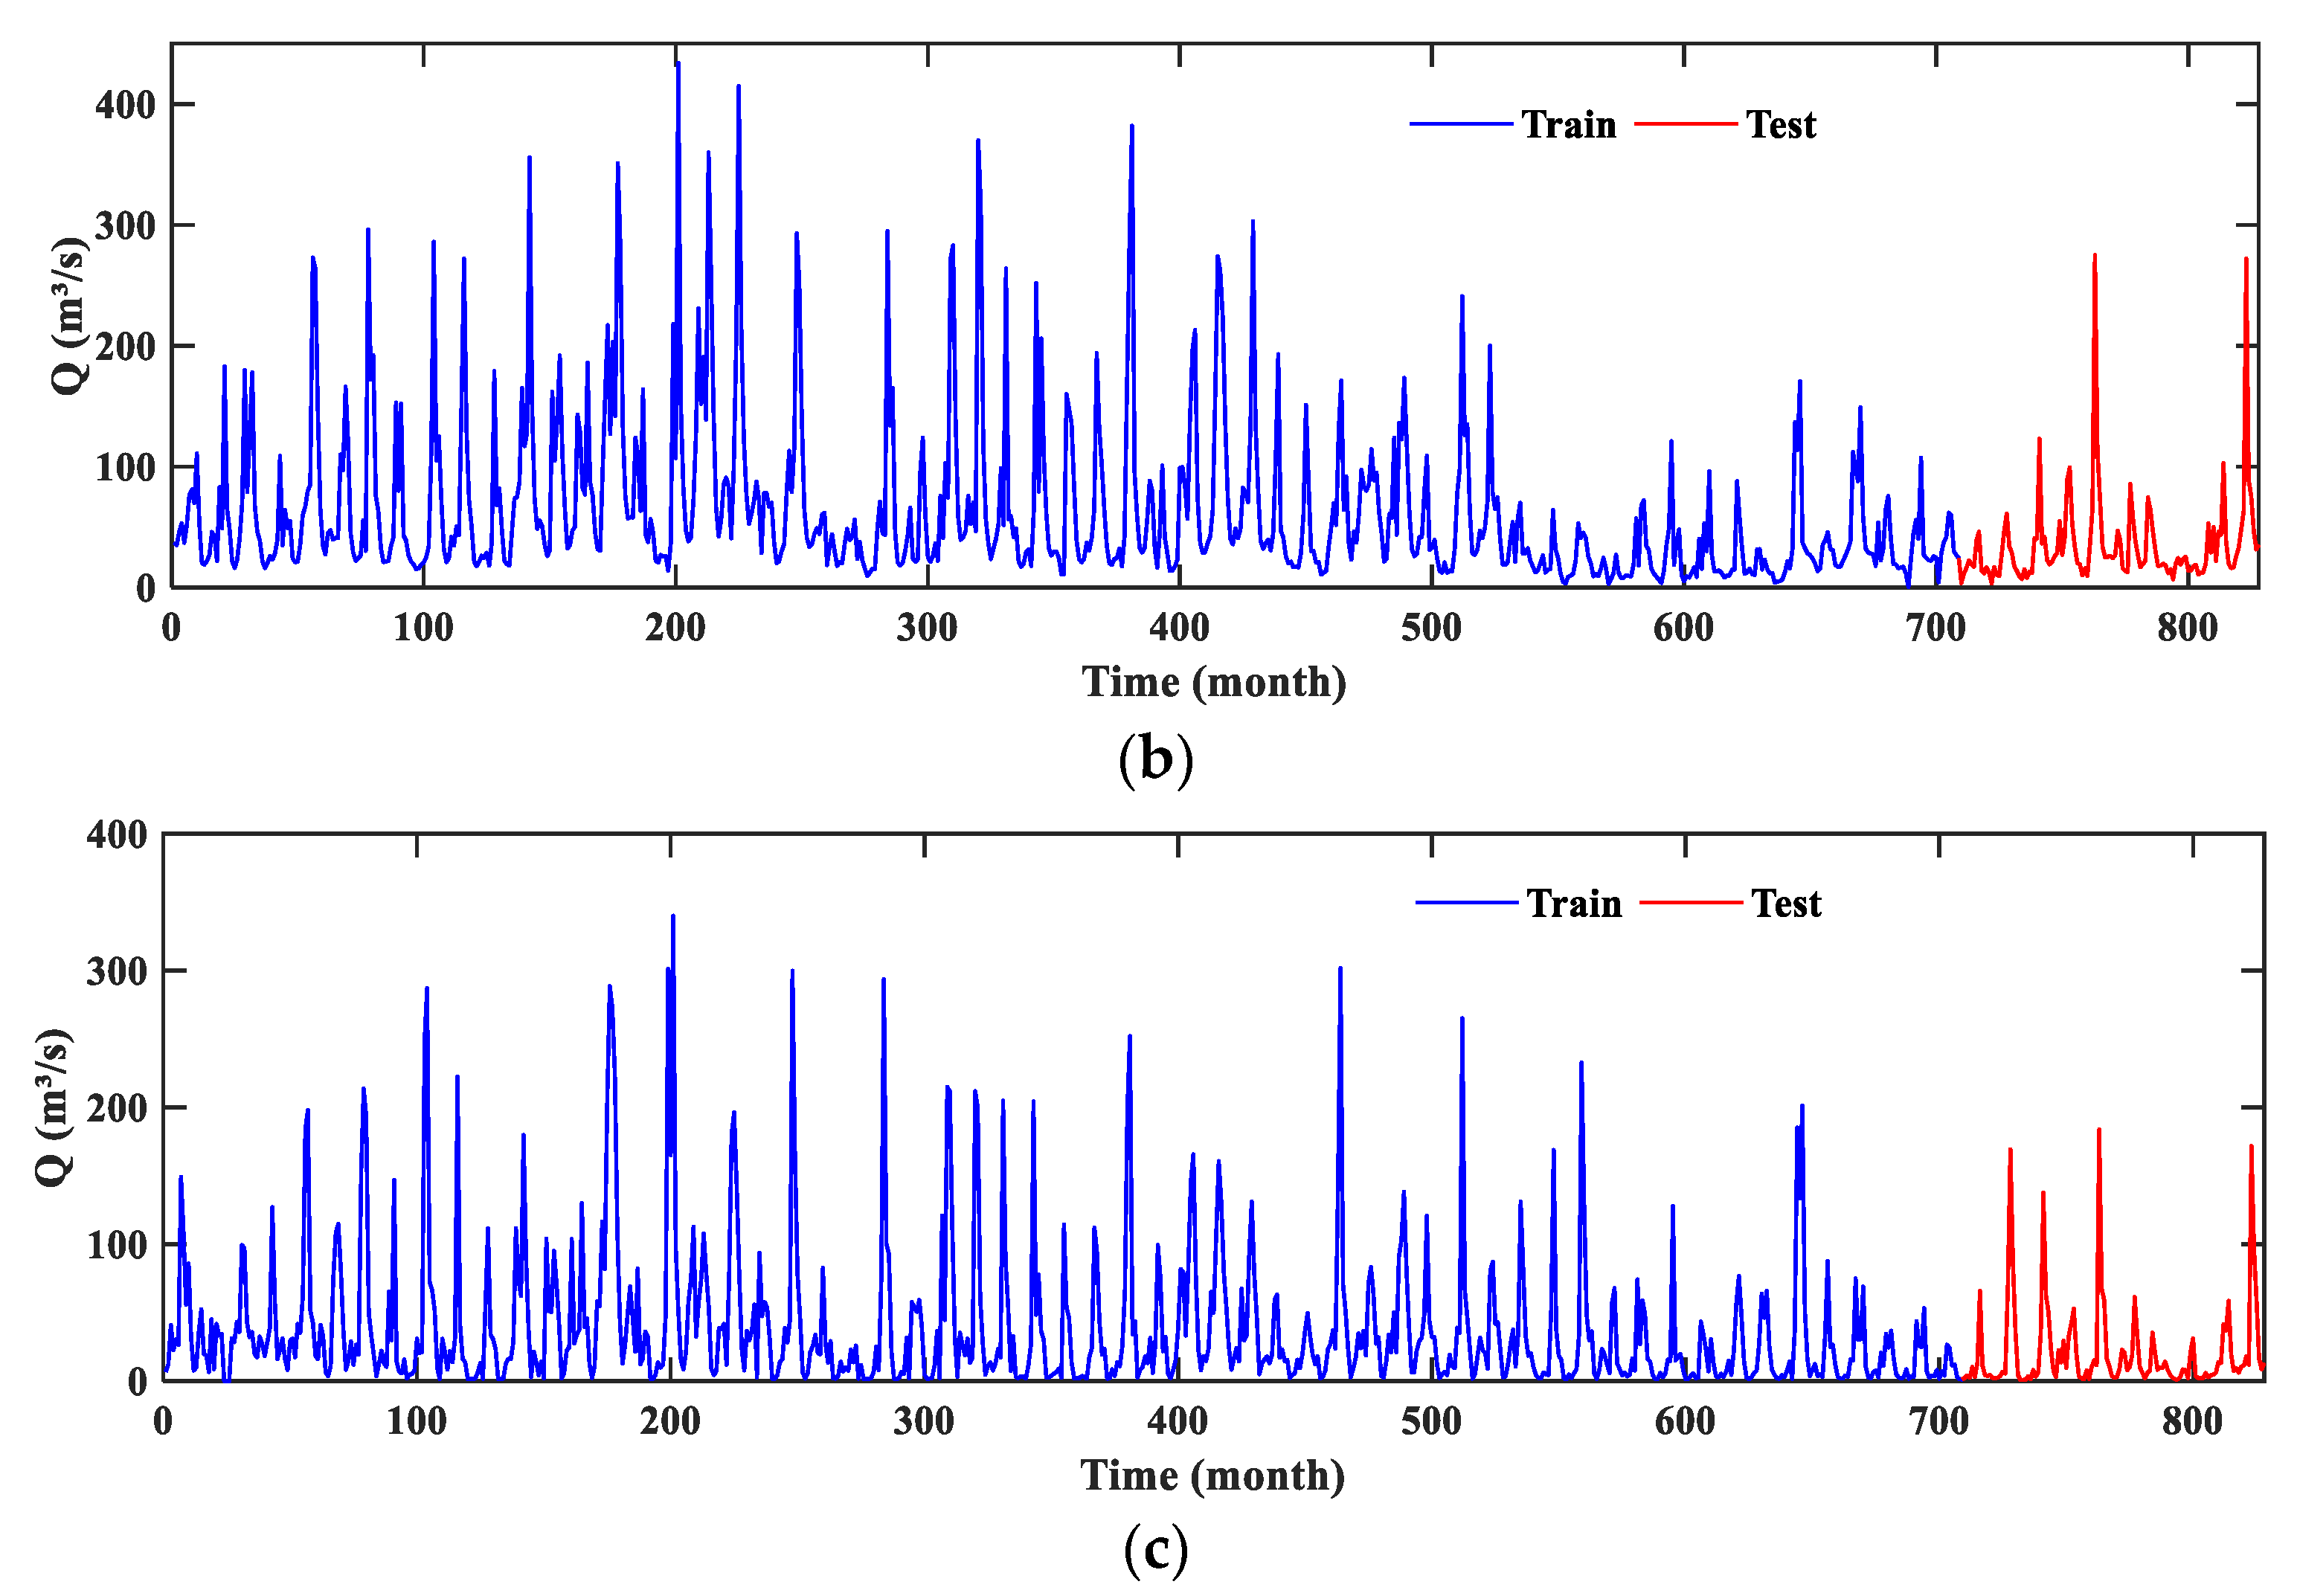
The Linjiacun and Weijiabu hydrological stations in the main stream of the Wei River and Zhangjiashan Hydrological Station in the tributary Jing River were taken as examples to demonstrate the model proposed in this study. A total of 708 monthly runoff data from January 1950 to December 2008 were used as the training set, and a total of 120 monthly runoff data points from January 2009 to December 2018 were used as the test set. All runoff data were obtained from the hydrological yearbook. Figure 3 show the basic situation and variation trend in the original data on monthly runoff in Weijiabu, Linjiacun, and Zhangjiashan.
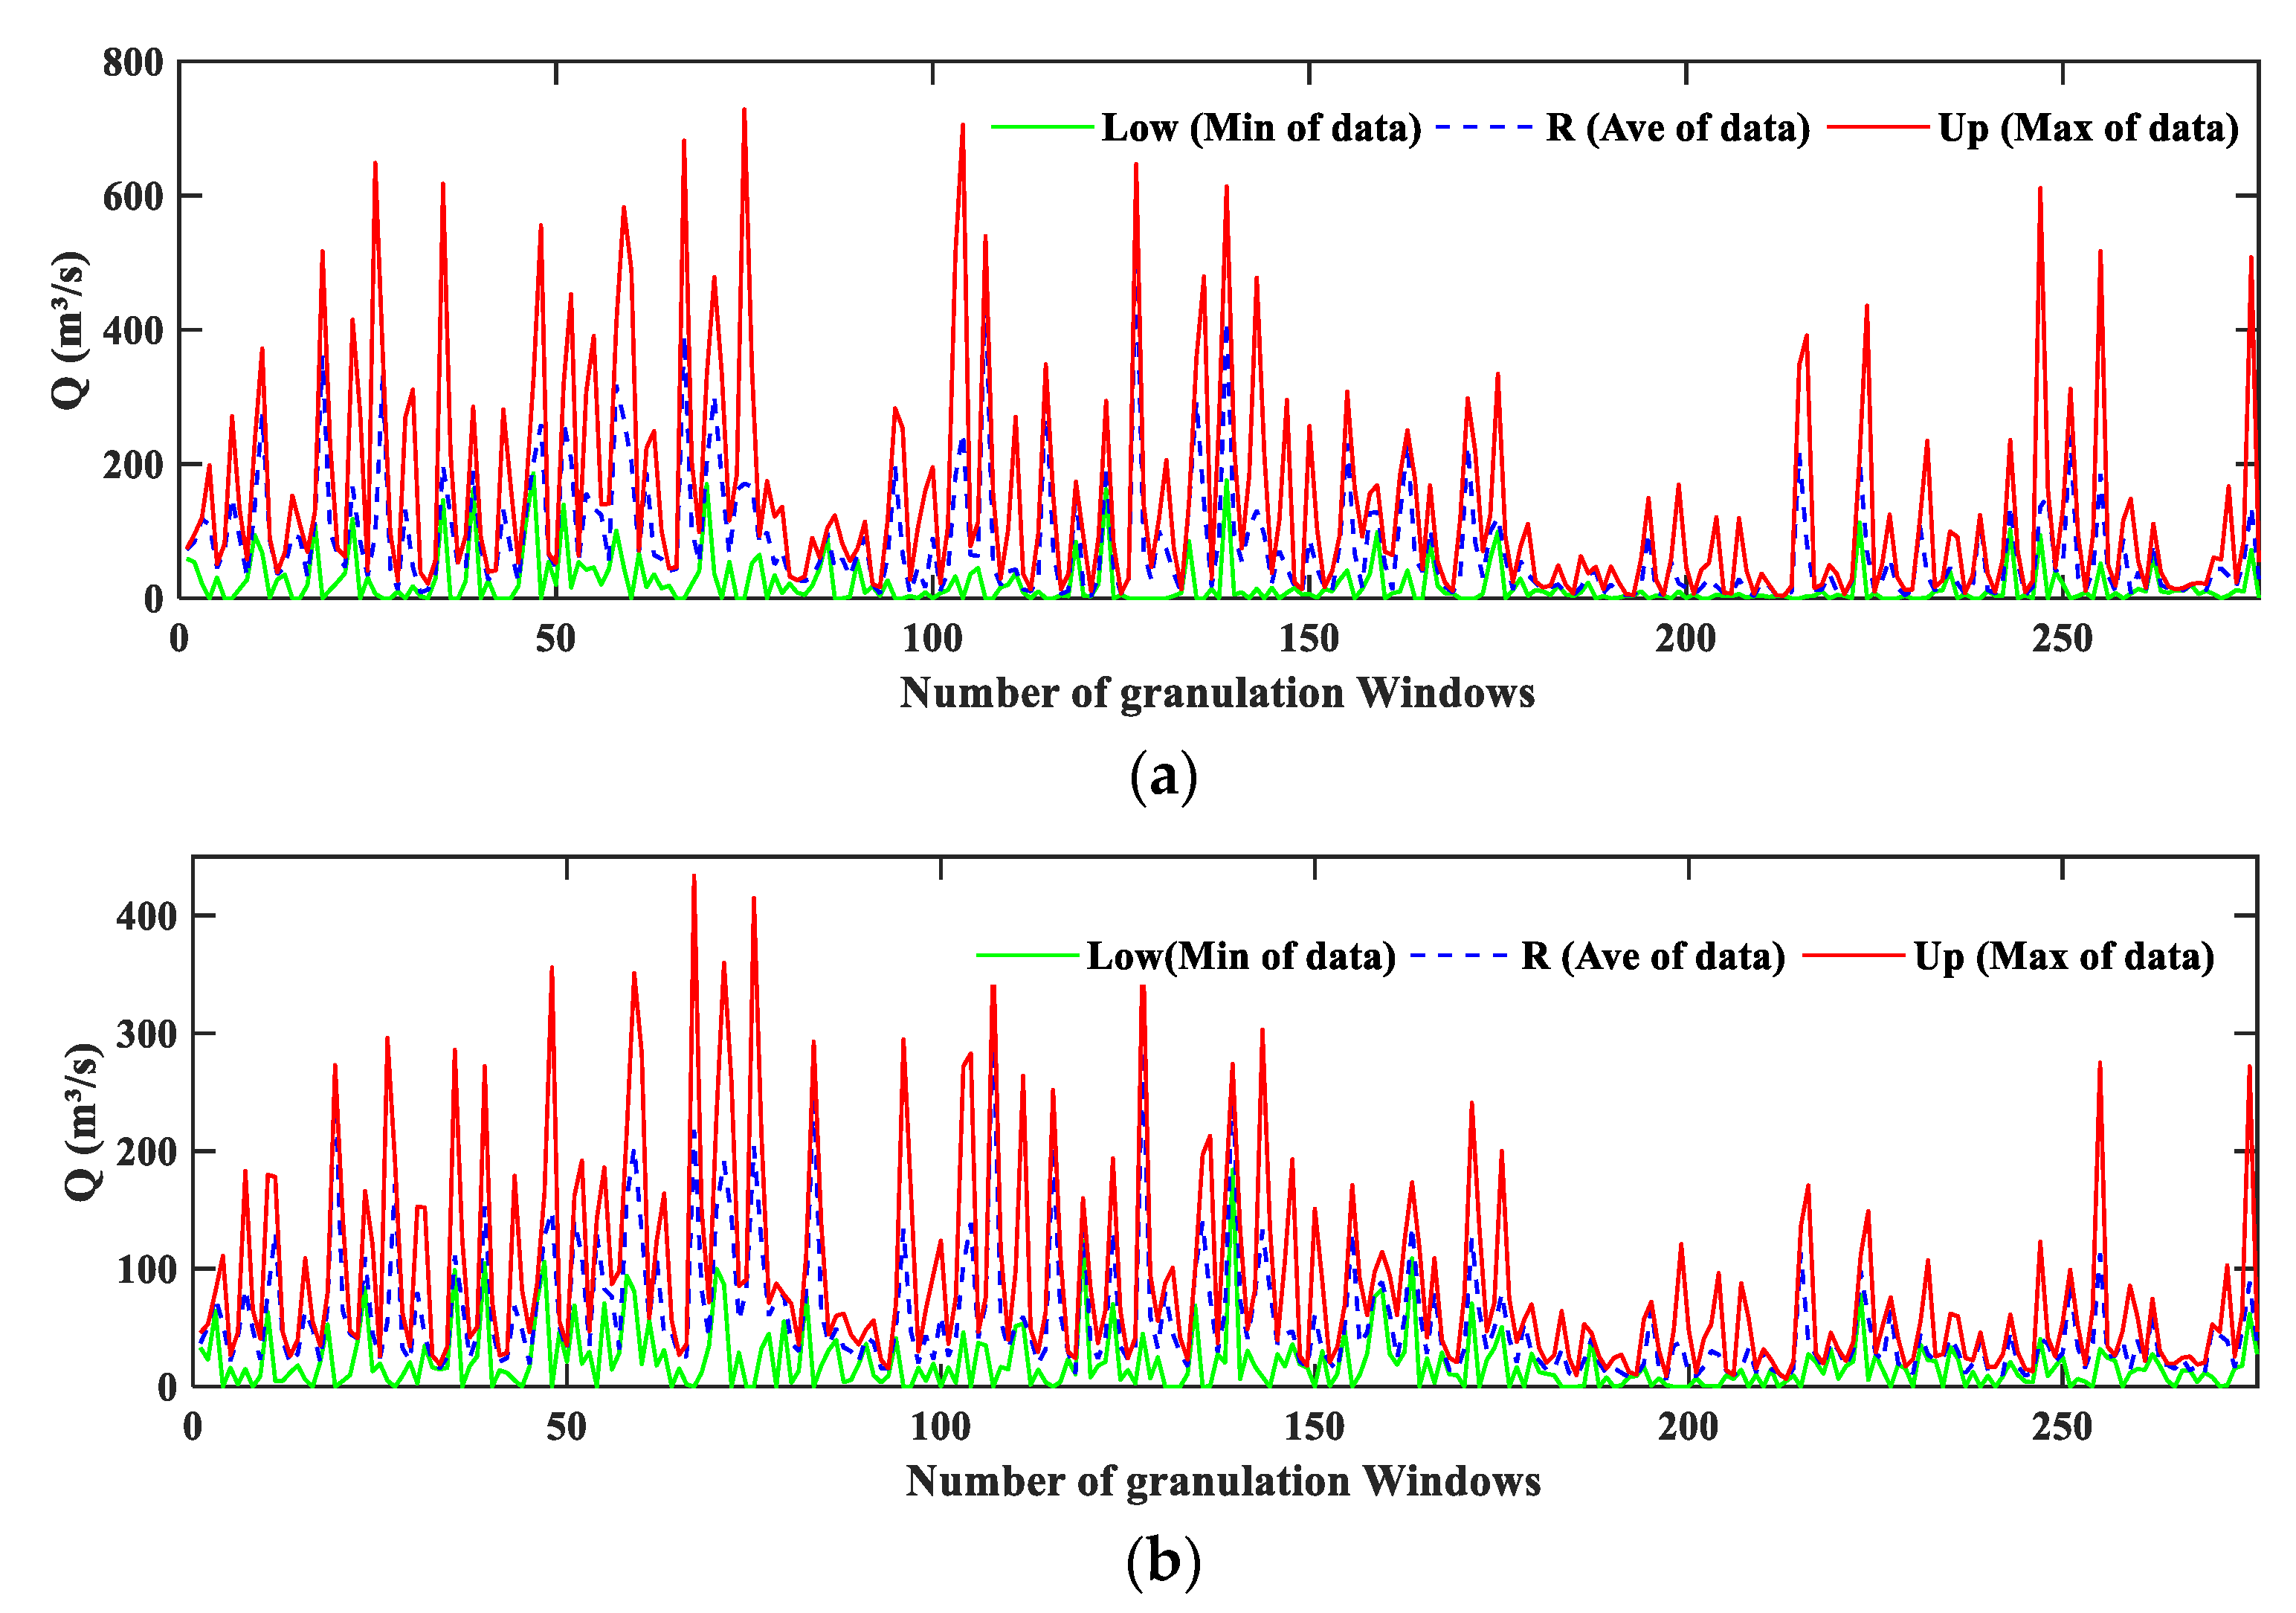
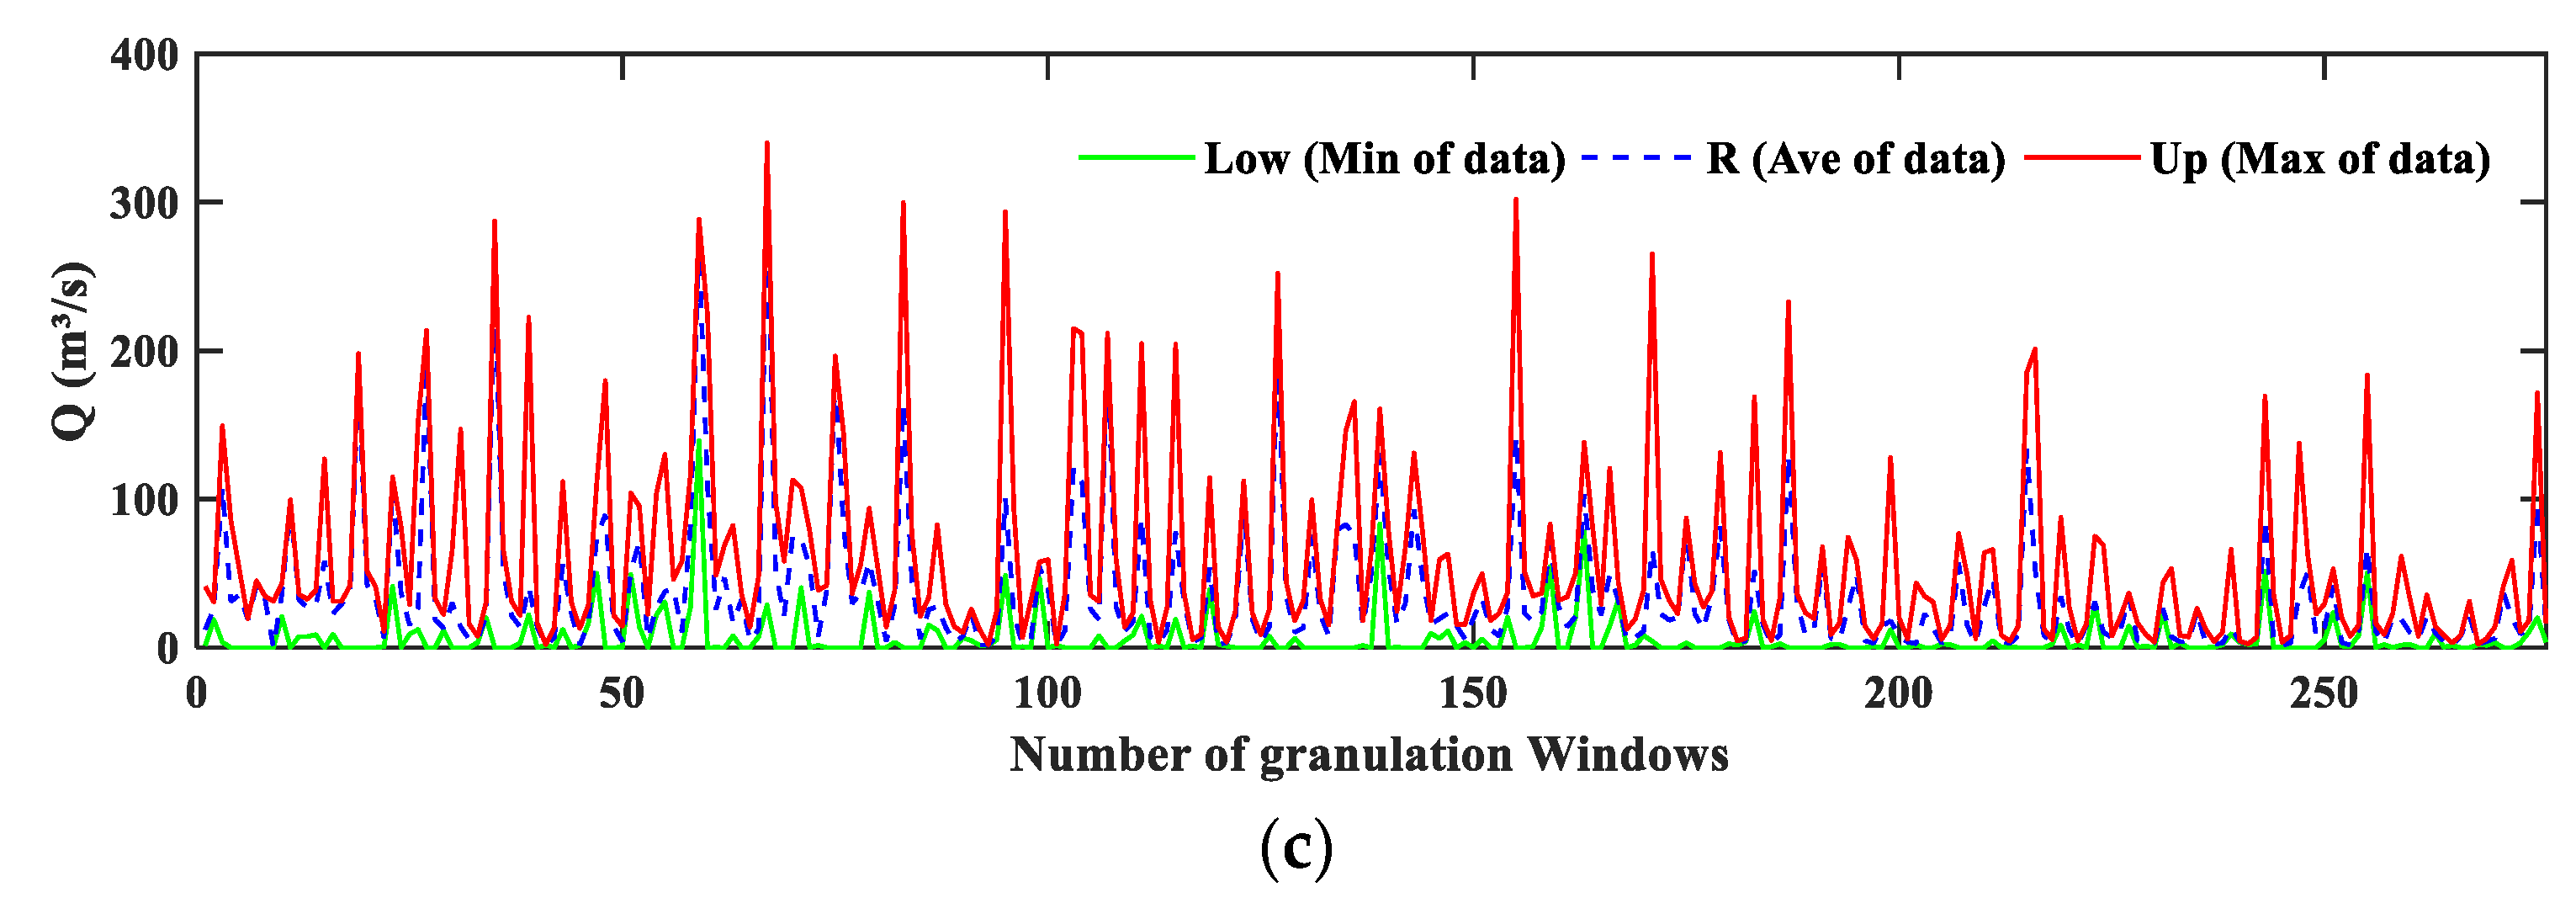
The historical monthly runoff series of Weijiabu, Linjiacun, and Zhangjiashan hydrological stations were processed with FIG. Taking the runoff data from every three months as an information granulation window, and the data were processed into three groups of time series: Low, R, and Up, representing the minimum, mean, and maximum values of the runoff data, respectively. Figure 4 show the results of Weijiabu, Linjiacun, and Zhangjiashan sample data after granulation.
3. Results
This study selected the measured monthly runoff data of Weijiabu, Linjiacun, and Zhangjiashan hydrological stations from 1950 to 2018 as the research object, in which the monthly runoff data from 1950 to 2008 were used as the training set, and the monthly runoff data from 2009 to 2018 were used as the test set.
3.1. Feature Selection
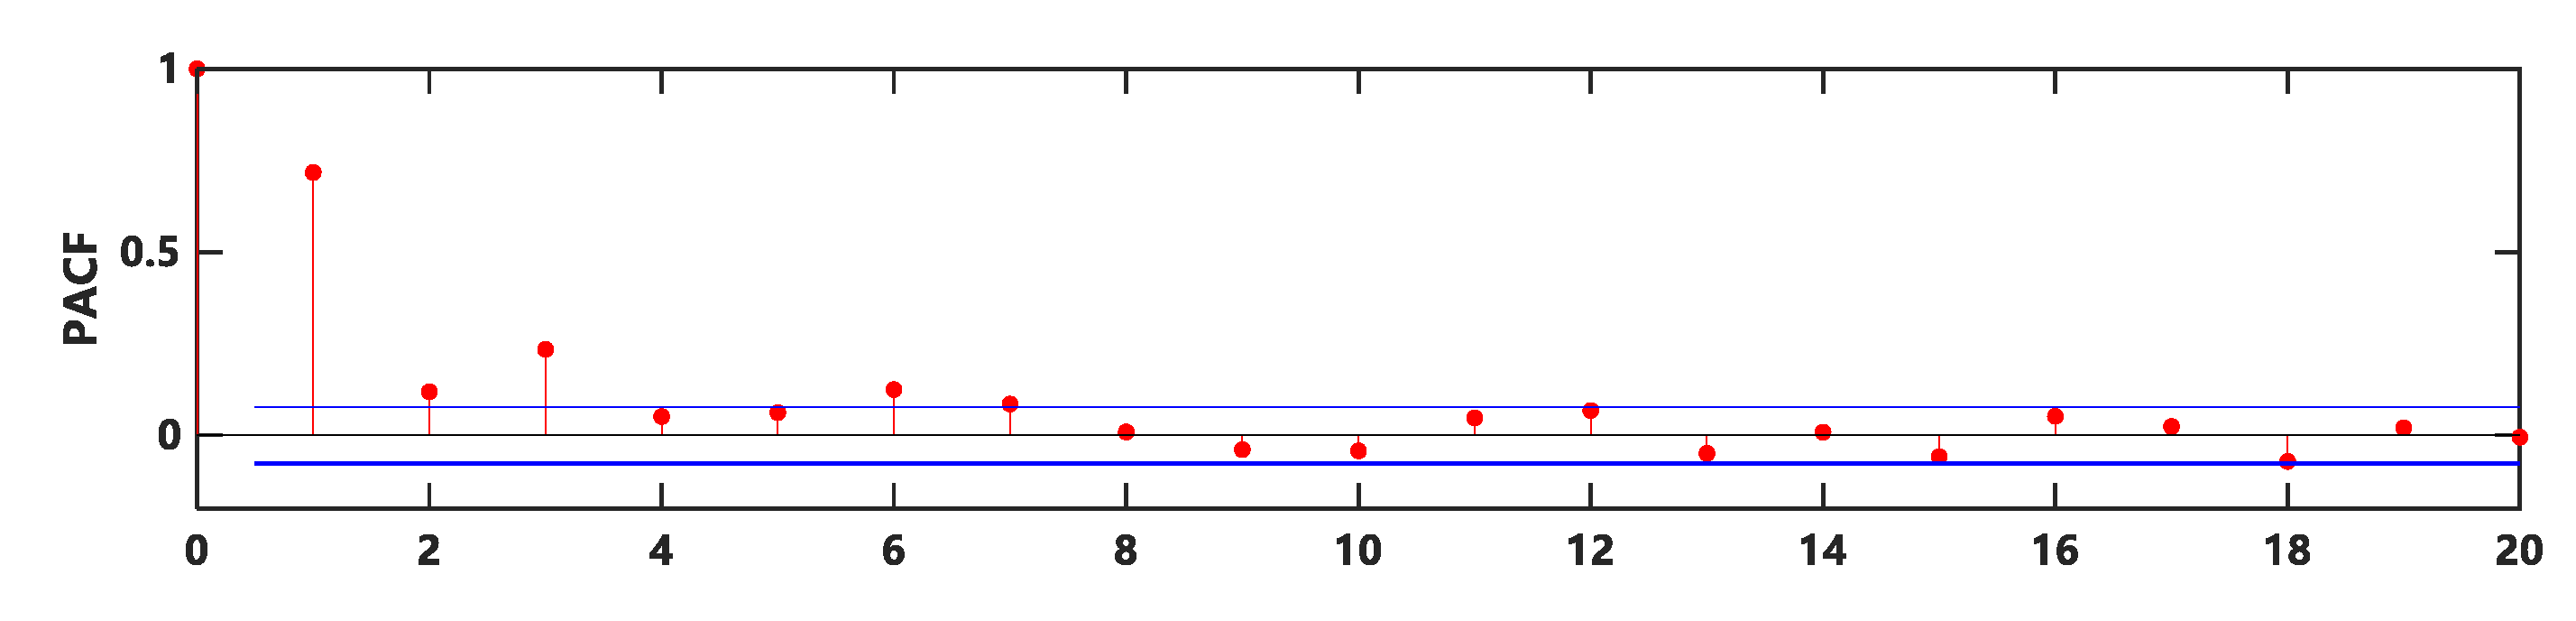
The key parameters such as the number of input variables, the number of hidden layers, and the number of hidden layer nodes are the prerequisite to determine the structure of BP network. The number of hidden layers and the number of hidden layer nodes are determined by trial algorithm. Partial autocorrelation function (PACF) is an method that can effectively solve the constraints of input quantity and then obtain the number of input quantity. If the delay length of PACF is within the confidence interval range, the required number of inputs is the previous lag length. Taking Weijiabu as an example, as shown in Figure 5, the optimal number of input variables of Weijiabu station is three by analyzing the lag length.
Through the above analysis, the runoff data from every adjacent three months are taken as a group of input, and the data of the next month is taken as the output when making runoff prediction in Weijiabu station. The structure of BP neural network is 3-7-1 by trial algorithm.
3.2. Results Analysis
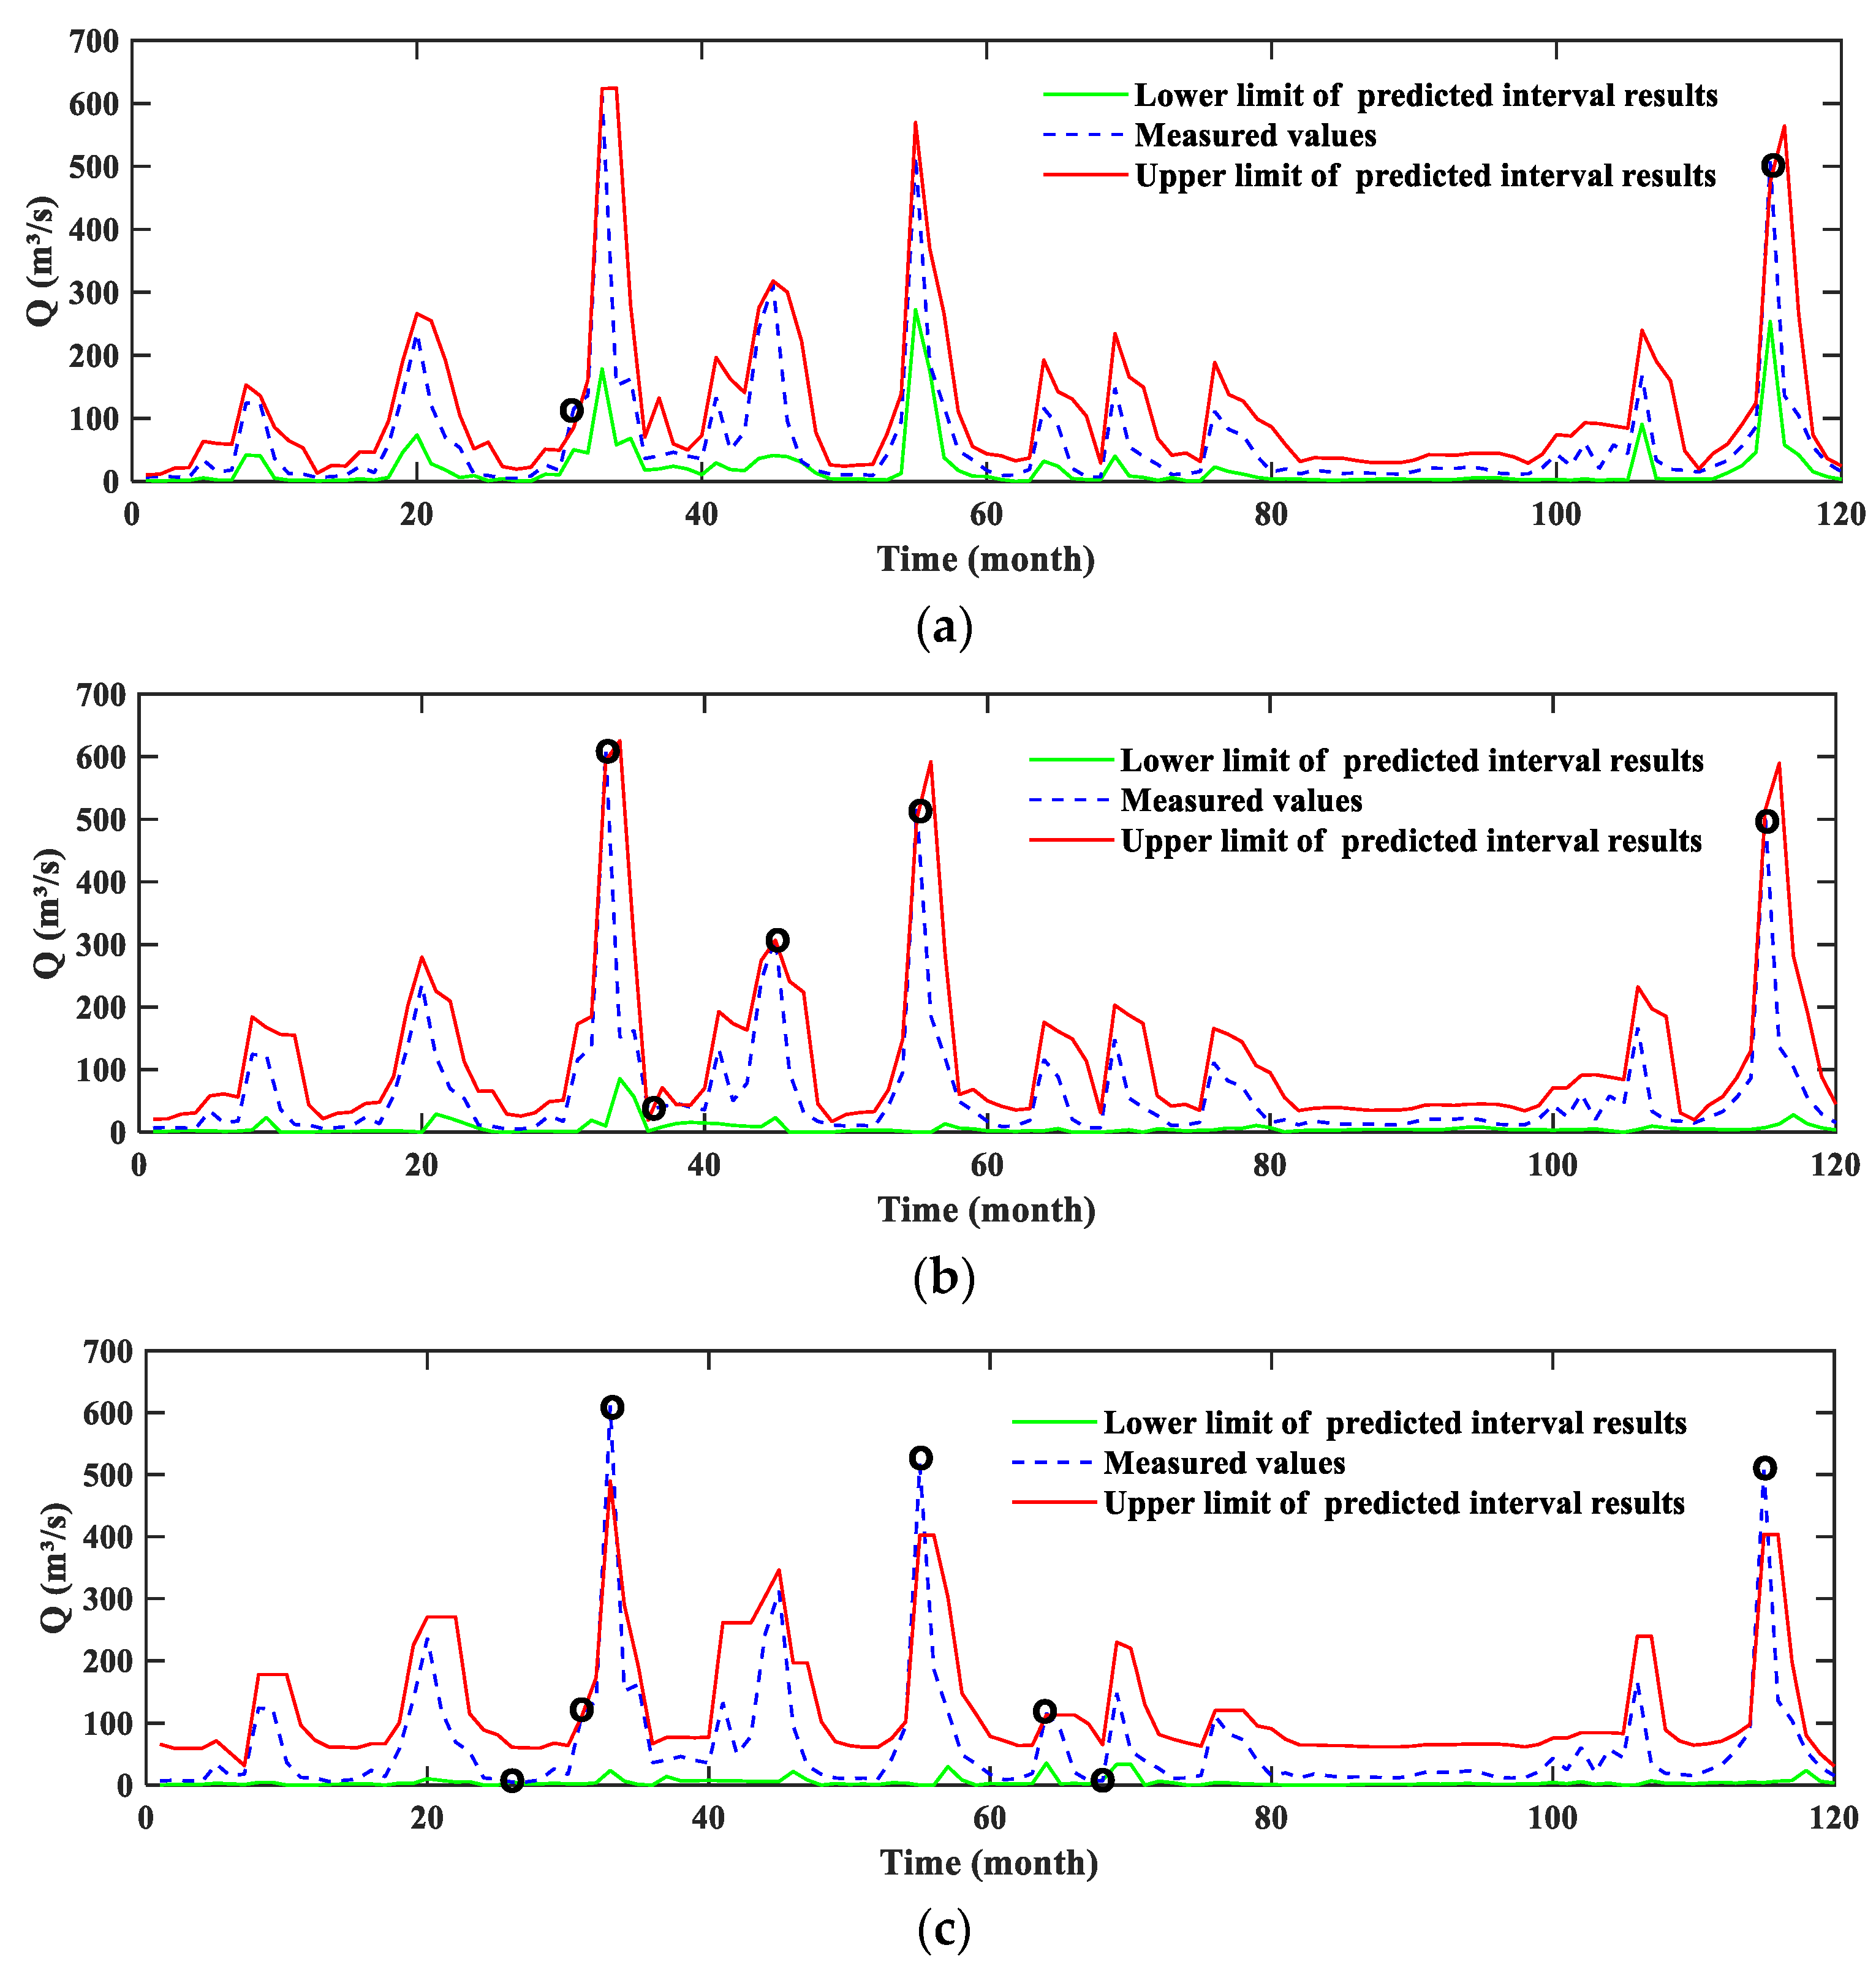
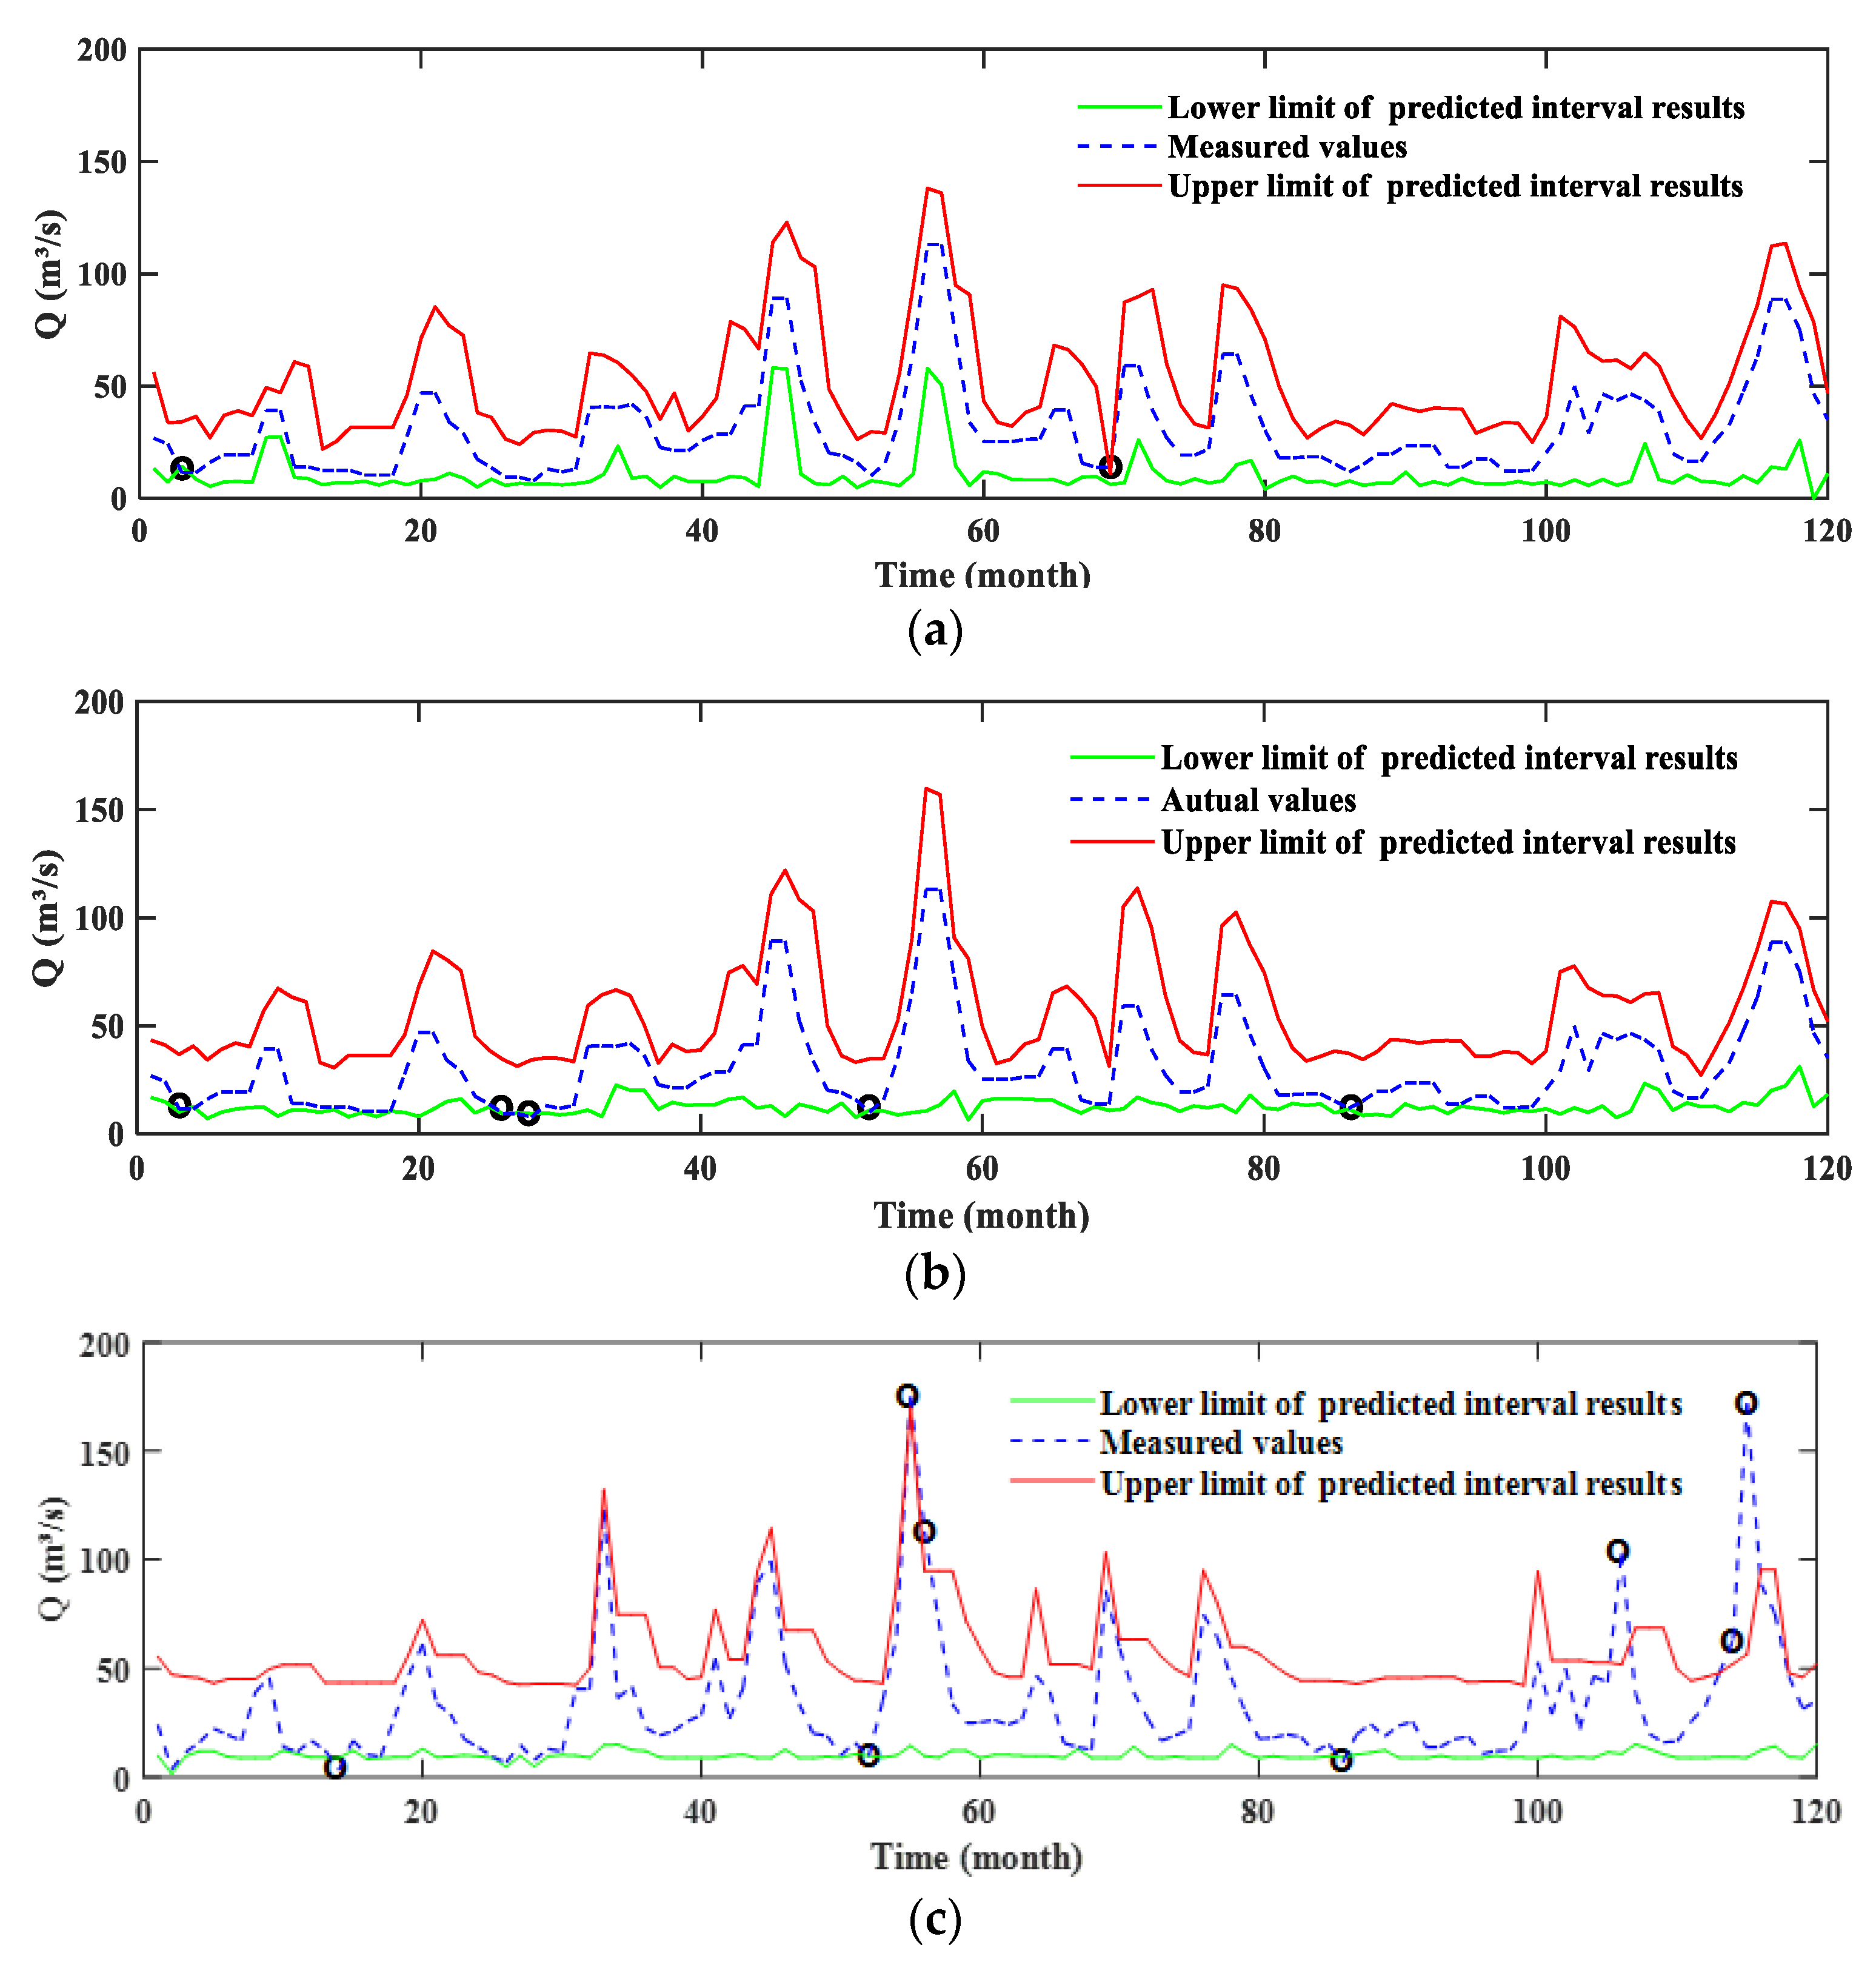
In order to verify the model proposed in this study, FIG-BP and FIG-WNN were introduced for comparison. The FIG-BP model is consistent with FIG-GA-BP model except for initial weight and threshold. BP neural network adopts the structure of 3-7-1. In addition, an interval prediction model (FIG-WNN) based on wavelet neural network and fuzzy information granulation is introduced. Set each neighboring three data points as a group, each group of three points of data as input neurons, and the next month’s data as output neurons and establish a hidden layer, which constitutes a 3-6-1 wavelet neural network; the activation function takes the wavelet function. Figure 6 shows the prediction results.
It can be clearly observed from Figure 6, we can see that the prediction effects of the three prediction models are good, and the measured values fall into the prediction interval formed by the red line and the green line. It can be observed from Figure 6a that the predicted value of 2 months exceeds the upper limit of the prediction interval; in Figure 6b, the predicted value of 5 months exceeds the upper limit of the prediction interval, and in Figure 6c, the measured value of 5 months exceeds the upper limit of the prediction interval, the measured value of 2 months is lower than the lower limit of the prediction interval, and the measured value of 7 months in total is not in the prediction interval. Therefore, more points meet the requirements in the prediction results of the FIG-GA-BP model, and the prediction interval range is narrower, indicating that the prediction effect of the FIG-GA-BP model is the best. The lower limit of the prediction interval of the FIG-GA-BP model is closer to the measured values, the predicted values have higher consistency with the measured values, and the change trend has higher fitting ability. In addition, the prediction accuracy of the FIG-GA-BP model at the mutation point is significantly better than that of the FIG-BP model and FIG-WNN model, and FIG-WNN has the worst predictive effect at runoff break point. The above analysis shows that the FIG-GA-BP model can make full use of the information contained in the runoff sequence, and the prediction effect of the FIG-GA-BP model is the best.
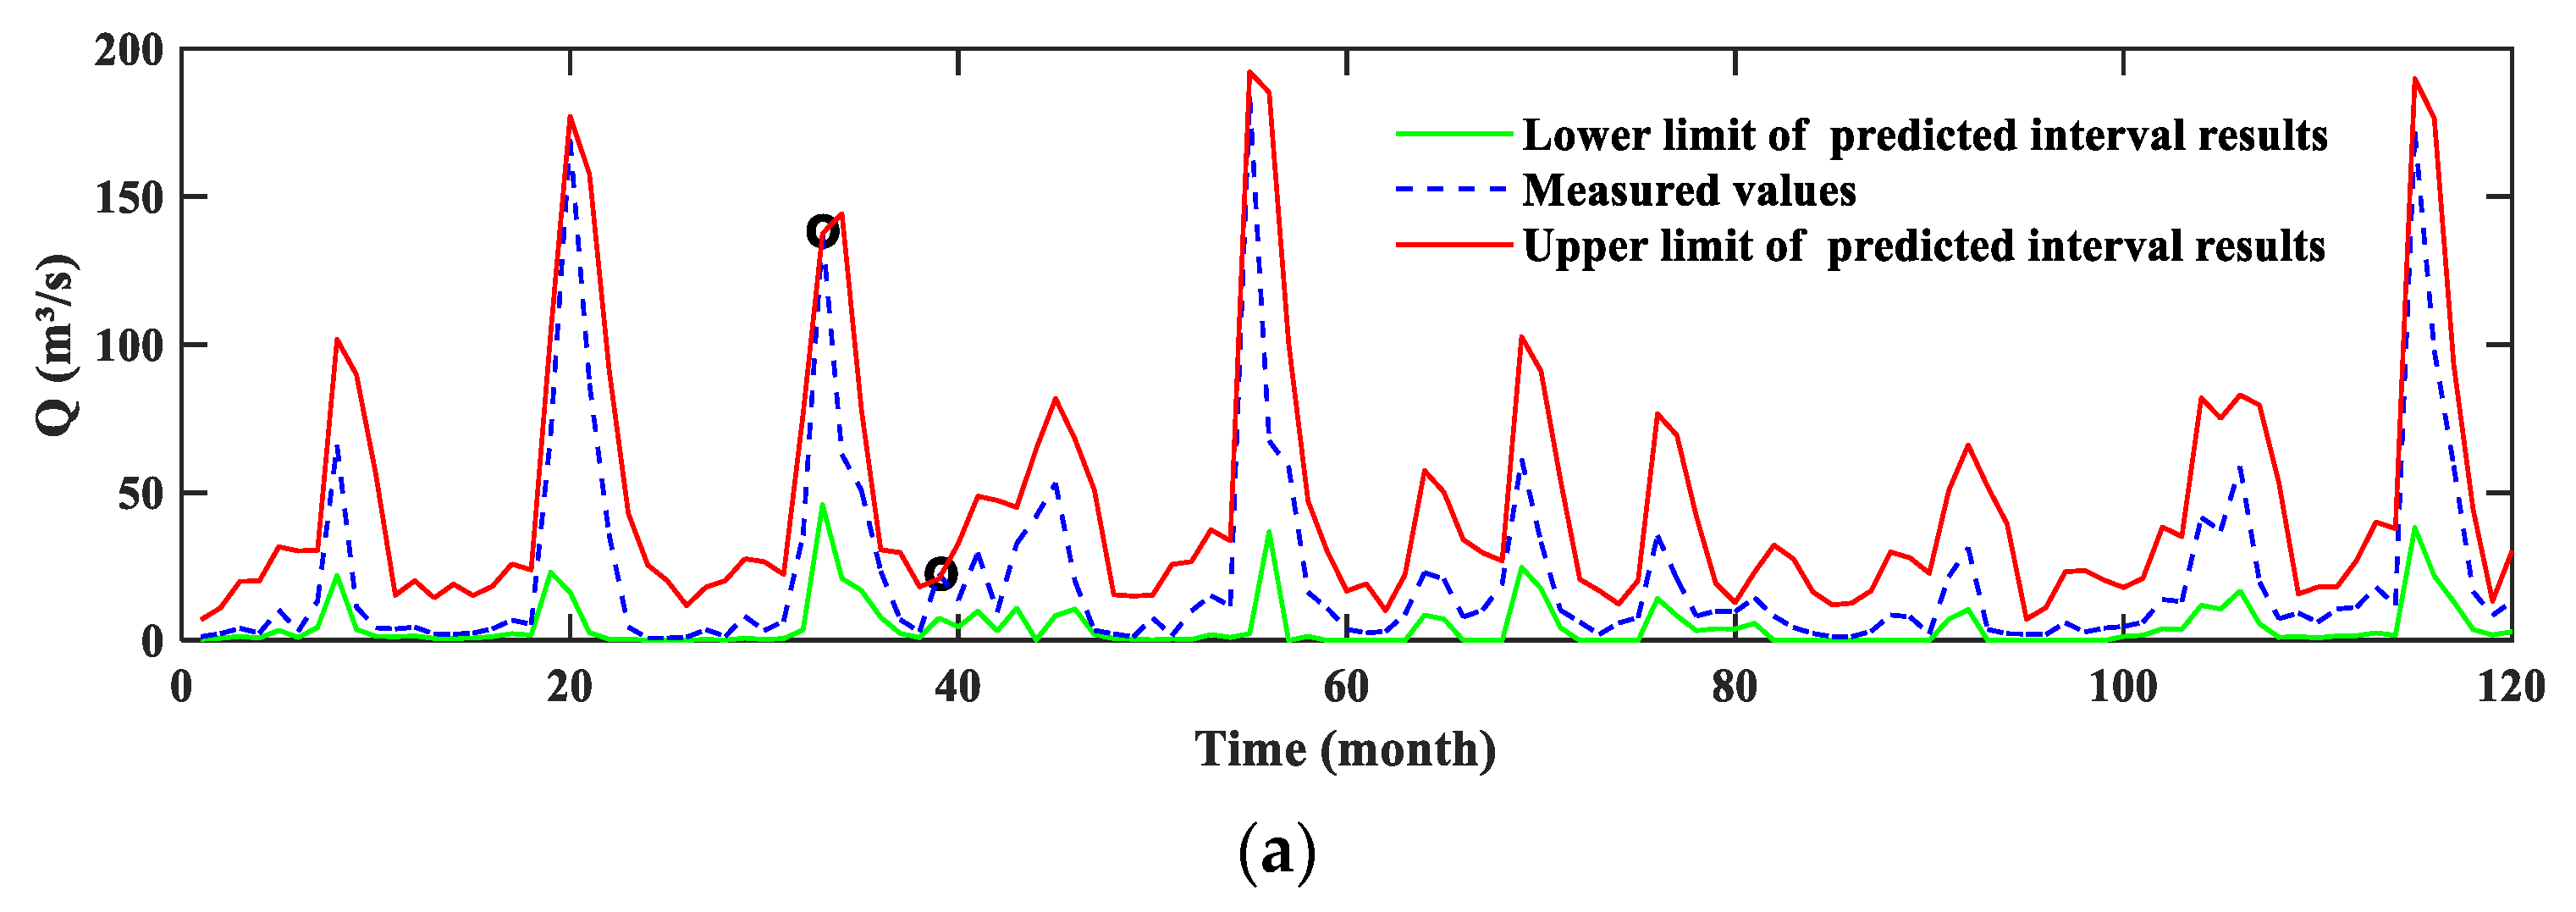
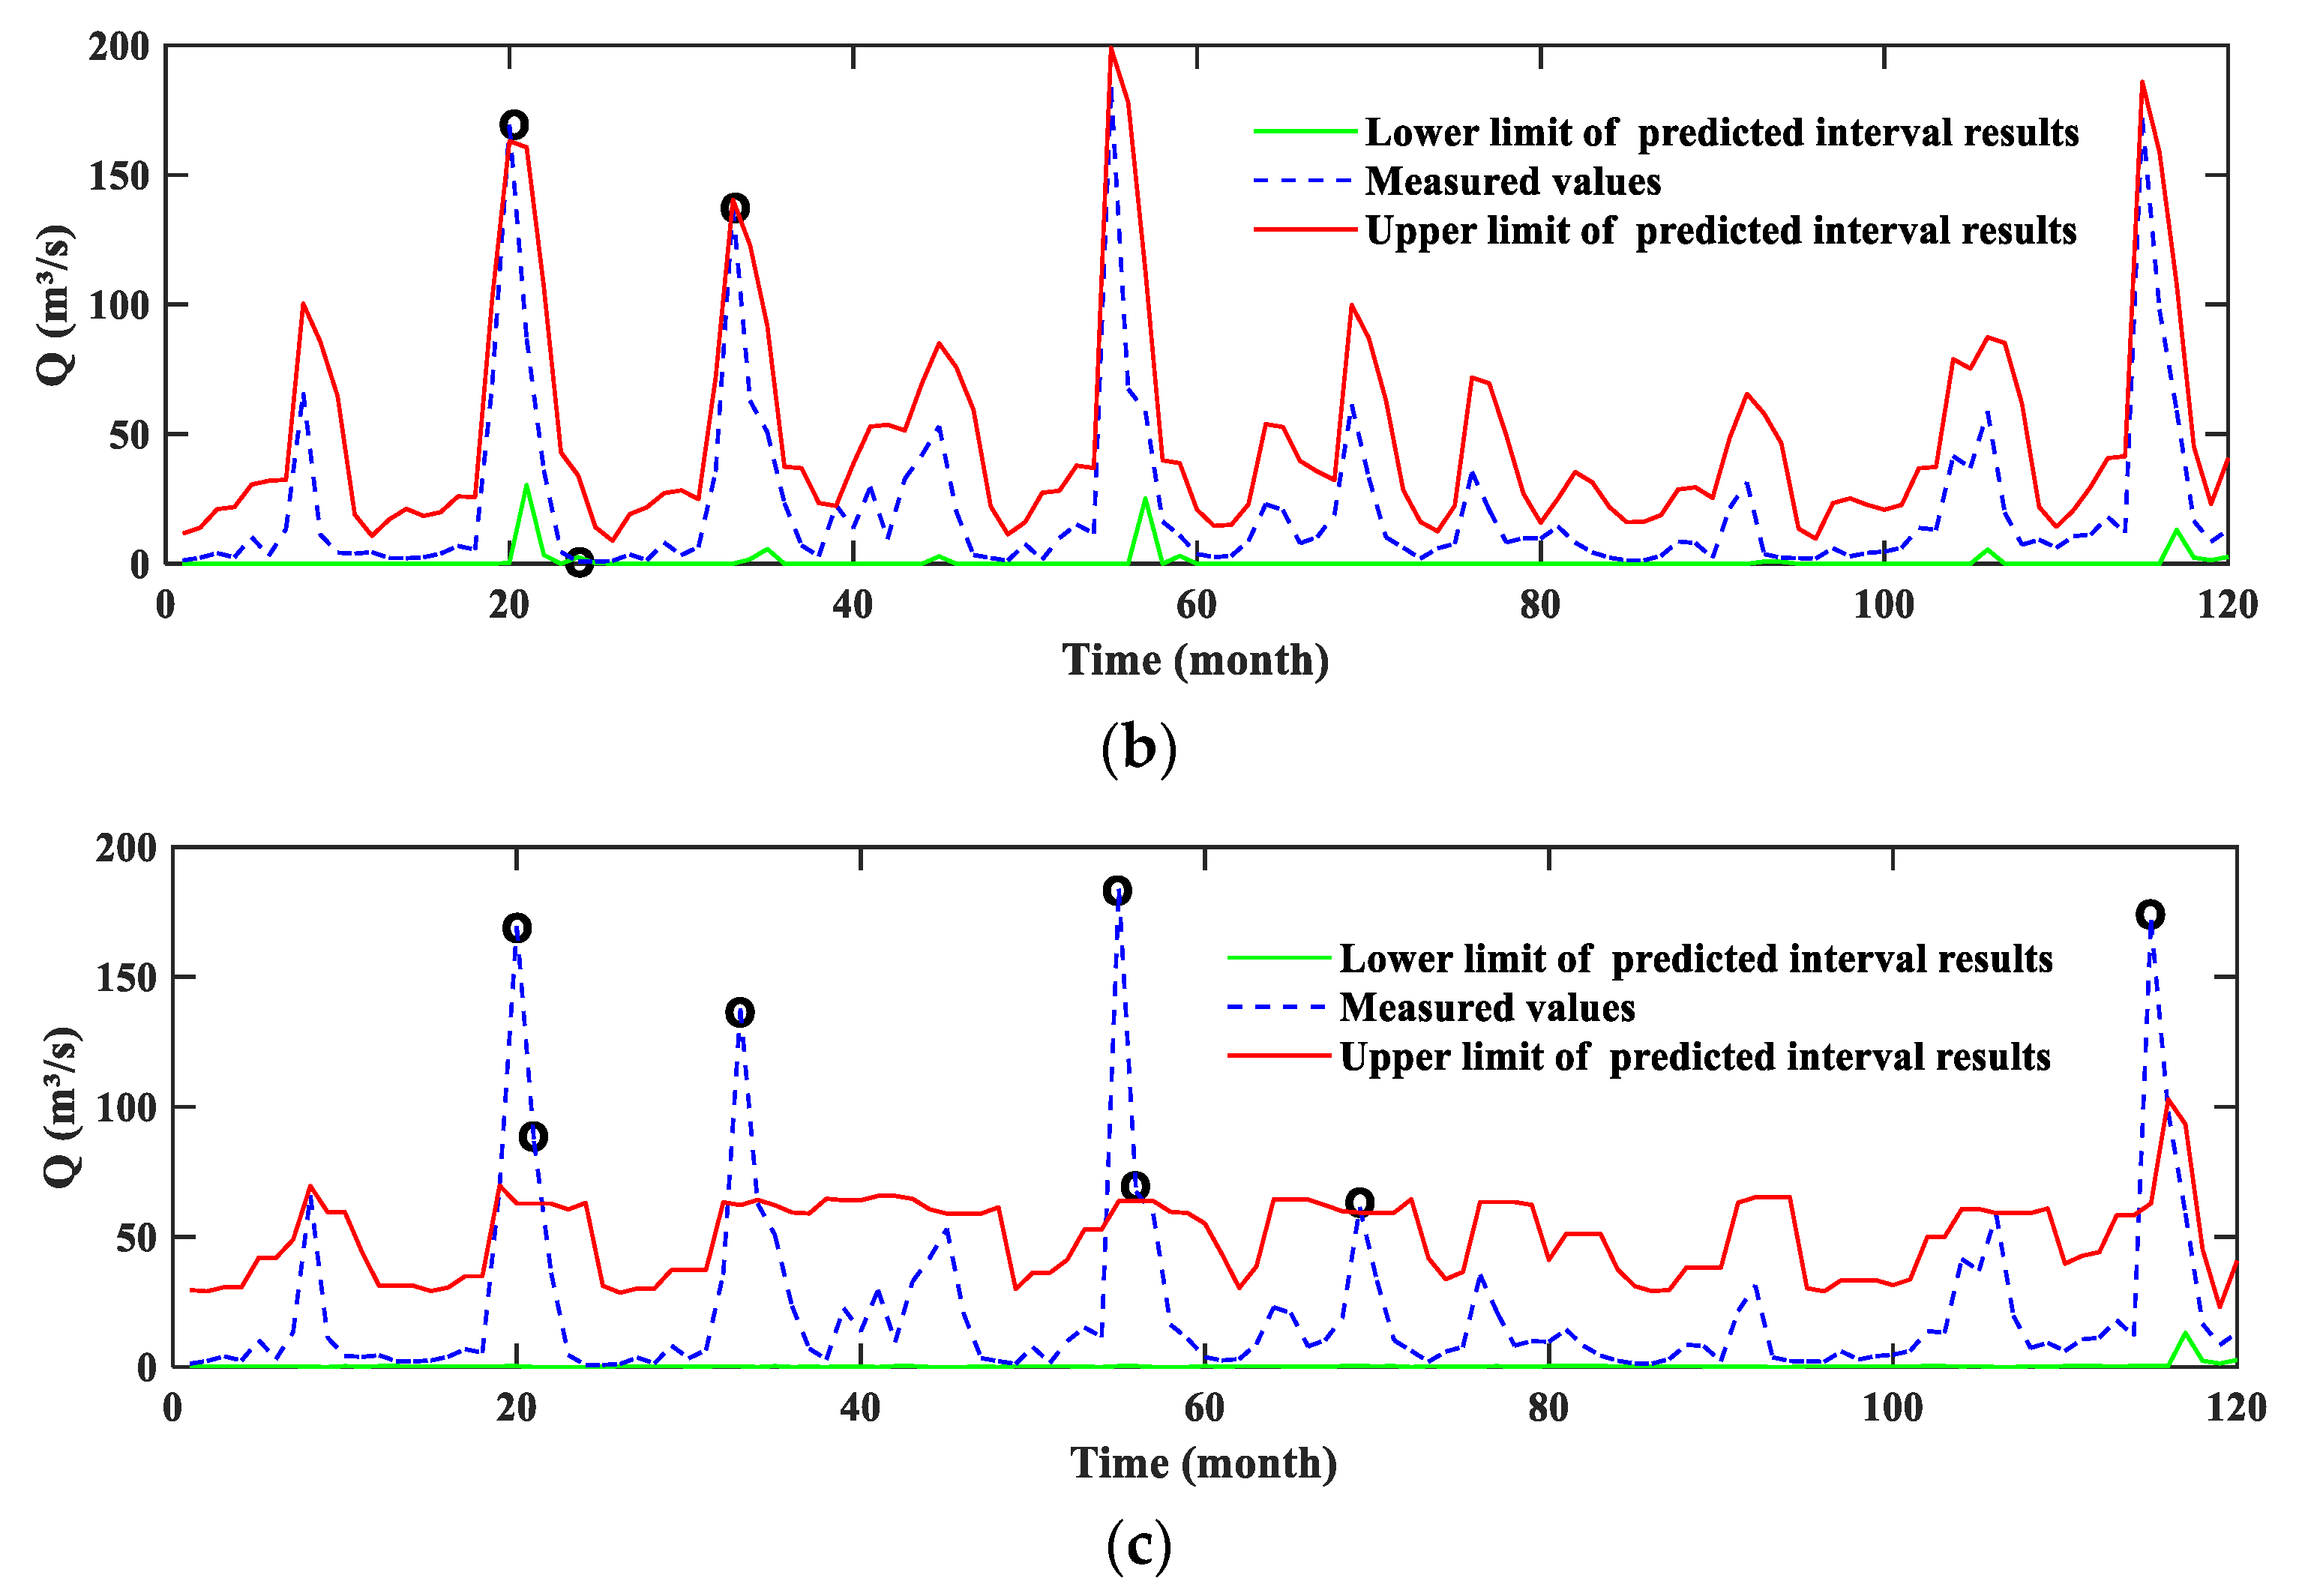
In order to further verify the applicability and feasibility of the model, the monthly runoff data from January 1950 to December 2018 of Linjiacun hydrological station in the upstream of Weijiabu Station and Zhangjiashan hydrological station on the tributaries of Jing River were selected for research. The division of training and testing sets was consistent with that of Weijiabu Station. Figure 7 and Figure 8 show the prediction results.
By observing and analyzing Figure 7, we can see that the prediction effects of the three prediction models are good, and the measured values fall into the prediction interval formed by the red line and the green line. It can be observed from Figure 7a that the measured value of one month exceeds the upper limit of the prediction interval, the measured value of one month is lower than the lower limit of the prediction interval, and the measured value of two months in total is not in the prediction interval. In Figure 7b, the predicted value of 5 months is lower than the lower limit of the prediction interval, and in Figure 7c, the measured value of 5 months exceeds the upper limit of the prediction interval, the measured value of 3 months is lower than the lower limit of the prediction interval, and the measured value of 8 months in total is not in the prediction interval. Therefore, more points meet the requirements in the prediction results of the FIG-GA-BP model and the prediction interval range is narrower, indicating that the prediction effect of the FIG-GA-BP model is the best. Furthermore, the lower limit of the prediction interval of the FIG-GA-BP model is closer to the measured values, the predicted values have higher consistency with the measured values, and the change trend has higher fitting ability. In addition, the prediction accuracy of the FIG-GA-BP model at the mutation point is significantly better than that of the FIG-WNN model. The above analysis shows that the FIG-GA-BP model makes full use of the information contained in the runoff sequence, its prediction effect is the best.
By observing and analyzing Figure 8, we can see that the prediction effects of the three prediction models are good, and the measured values fall into the prediction interval formed by the red line and the green line. It can be observed from Figure 8a that the measured values from two months exceed the upper limit of the prediction interval. In Figure 8b, the predicted value of 2 months exceeds the upper limit of the prediction interval, the measured value of 1 month is lower than the lower limit of the prediction interval, and the measured value of 3 months in total is not in the prediction interval. In Figure 8c, the measured value of 7 months exceeds the upper limit of the prediction interval. Therefore, more points meet the requirements in the prediction results of the FIG-GA-BP model, and the prediction interval range is narrower, indicating that the prediction effect of the FIG-GA-BP model is the best. The lower bound of the prediction results of the FIG-GA-BP model is closer to the measured value. It indicates that the FIG-GA-BP model has better prediction ability when the flow is small. In addition, the prediction accuracy of the FIG-GA-BP model at the mutation point is significantly better than that of the FIG-BP model and the FIG-WNN model, and FIG-WNN has the worst predictive effect at runoff break point. The above analysis shows that the FIG-GA-BP model makes full use of the information contained in the runoff sequence to achieve better prediction effect.
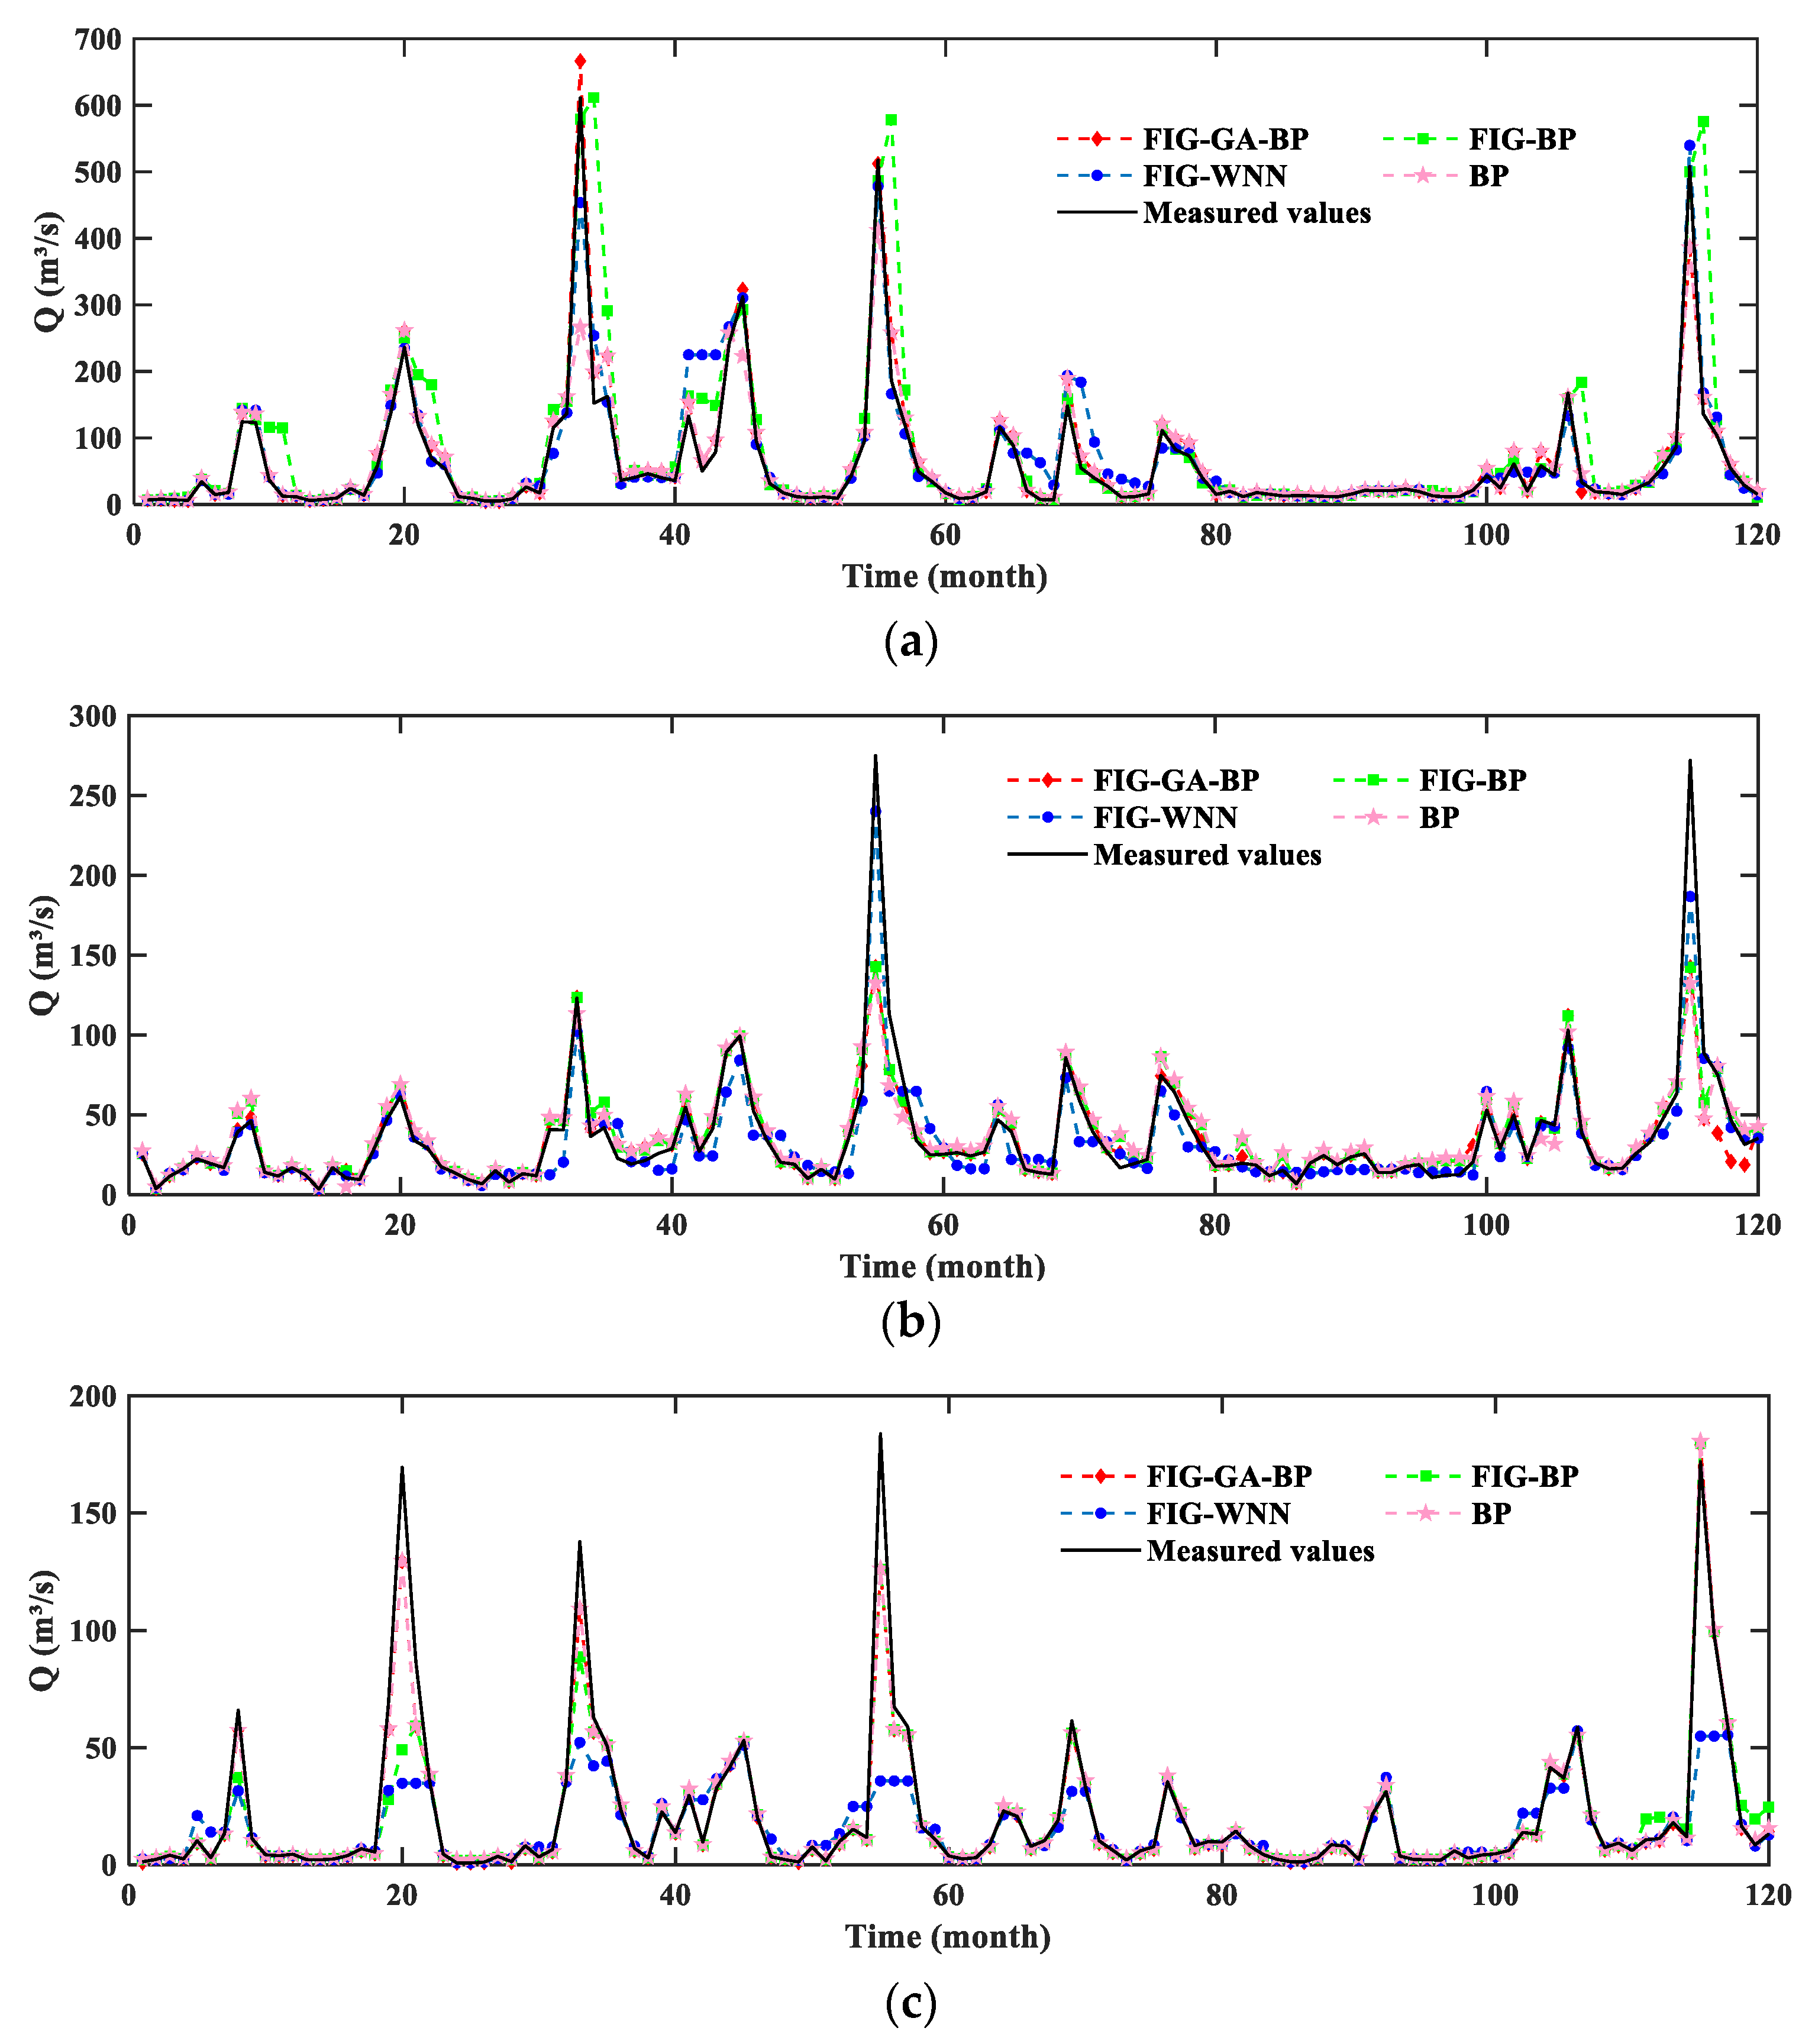
The center of the prediction interval can be used as the result of point value prediction and compared with the traditional BP model. The division of training and test sets is the same as above. The prediction results are shown in Figure 9.
By observing and analyzing Figure 9, we can see that it is reasonable to use the center value of the prediction interval as the point prediction result; the prediction effect of all models is relatively ideal, and the simulation value and the measured value are highly consistent. We can intuitively see that the prediction effect of the three models based on BP neural network is better than that based on wavelet neural network, especially in the months with large fluctuations. The FIG-GA-BP model has the best prediction effect. Therefore, the center of interval prediction can be used as the result of point value prediction.
4. Discussion
In order to understand the accuracy of the model proposed in this paper more accurately and intuitively, FICP and FINAW are used to quantitatively evaluate the interval prediction results of the above model. In addition, the qualification rate (QR), average relative error (ARE), and root mean square error (RMSE) are used as evaluation indicators of point prediction results to evaluate the above models. The qualification rate is calculated according to China’s Standard for Hydrological Information and Hydrological Forecasting. When the relative error of hydrological forecast is less than 20%, that is, only when the relative error of simulated value to measured value is less than 20%, can it be determined as qualified. When the qualification rate is more than or equal to 85%, the prediction accuracy level is Class A; when the qualification rate is between 70% and 84%, the prediction accuracy is Class B; and when the qualification rate is between 60% and 69%, the prediction accuracy is Class C. The evaluation indexes of the prediction results of different models are shown in Table 2.
As shown in Table 2, in the three hydrological stations, the FICP values of each model are all greater than 0.9, indicating that the prediction effect of these models is good, and the model based on fuzzy information granulation can be applied to the runoff prediction of different hydrological stations. Compared with FIG-BP and FIG-WNN, it can be seen that the FICP of the FIG-GA-BP model is larger and the corresponding FINAW is smaller, which indicates that more actual runoff values fall into the prediction interval and the width of the interval is the narrowest. The prediction effect of the FIG-GA-BP model is best. It can be seen from the table that in the three hydrological stations, the qualification rate of each model is more than 60%, indicating that the simulation results are ideal. The qualification rate of the predicted results of the three models based on BP neural network is more than 70%, which indicates that the reliability of the results of BP network training is stronger than that of the wavelet neural network. The qualification rate of FIG-GA-BP model proposed in this paper is more than 80% in 3 hydrological stations, and the forecast accuracy of the model reaches Class B, with satisfactory results. In addition, the average relative error of simulation results of each model is less than 20%, which meets the requirements of predicting. Compared with the other three models, the average relative error of the FIG-GA-BP model is the smallest and the mean square root error is the smallest, which indicates that the predictive results of the FIG-GA-BP model are the best in the four models mentioned above.
Through the above analysis and comparison, it can be found that compared with the traditional probability model, the method based on fuzzy information granulation does not need to use the probability density function, requires fewer parameters, reduces the prediction workload, and can be used as a nonlinear and random monthly runoff interval prediction method. In addition, the center of interval prediction can be used as the result of point value prediction.
Due to the effects of climate change and human activities, there are many driving factors that affect the change of runoff. This paper only considers the historical runoff data. Therefore, further research can consider the hydrological factors such as rainfall, underlying surface conditions and vegetation that affect the change of runoff into the construction process of the prediction model. In addition, the algorithm to improve the neural network can choose other algorithms such as particle swarm optimization and can make more attempts to achieve the best adaptability as the standard free combination, in order to obtain better prediction results.
5. Conclusions
Due to the uncertainty and randomness of the runoff sequence, accurate point prediction is relatively difficult. In this study, the runoff prediction method of BPNN is improved to solve this problem. A monthly runoff interval prediction model based on FIG and BP-GA is proposed. The proposed model is applied to the monthly runoff interval prediction of Weijiabu, Linjiacun, and Zhangjiashan hydrological stations. Through the above analysis and discussion, the following conclusions can be drawn:
- (1)
- The interval prediction method based on fuzzy information granulation can be applied to runoff prediction. In the three hydrological stations, the FICP values are greater than 0.9 for both the FIG-GA-BP model and the FIG-BP model, reflecting good prediction effect. Compared with the traditional probability model, it does not need to use the probability density function, requires fewer parameters, and reduces the prediction workload.
- (2)
- The prediction effect of the FIG-GA-BP model in Weijiabu, Linjiacuan, and Zhangjiashan hydrologic stations is better than that of FIG-BP model, and the FICP is 0.98, which is greater than 0.95. The overall prediction performance is good. The results show that the interval prediction model based on fuzzy information granulation is an effective tool for predicting nonstationary time series data and is a new method for solving the uncertainty in runoff prediction. The prediction interval of runoff enables decision makers to better recognize the uncertainty of runoff and thus make more reasonable decisions for water resource management.
- (3)
- The FIG-GA-BP model proposed in this paper is more suitable for the interval prediction of runoff series and can provide information support for decision makers of water resource management. Furthermore, the center of the prediction interval can be used as the result of point value prediction.
Author Contributions
Conceptualization, X.Y., X.Z. (Xiao Zhang) and J.X.; methodology, X.Y. and X.Z. (Xiao Zhang); validation, X.Y., X.Z. (Xu Zhang) and S.L.; formal analysis, X.Y.; data curation, J.X.; writing—original draft preparation, X.Y.; writing—review and editing, X.Z. (Xiao Zhang); visualization, X.Y., X.Z. (Xiao Zhang) and X.Z. (Xu Zhang); supervision, X.Z. (Xiao Zhang) and J.X. All authors have read and agreed to the published version of the manuscript.
Funding
This work was supported by Natural Science Basic Research Program of Shaanxi Province (Grant No. 2019JLZ-16), Science and Technology Program of Shaanxi Province (Grant No. 2019slkj-13, 2020slkj-16), Shaanxi Education Department research plan project (Grant No. 20JT055), and Research Fund of the State Key Laboratory of Eco-hydraulics in Northwest Arid Region, Xi’an University of Technology (Grant No. 2019KJCXTD-5).
Institutional Review Board Statement
Not applicable.
Informed Consent Statement
Not applicable.
Data Availability Statement
Not applicable.
Acknowledgments
The authors thank the editor and anonymous reviewers for their comments and suggestions.
Conflicts of Interest
The authors declare that they have no known competing financial interest or personal relationship that could have appeared to influence the work reported in this paper.
References
- Zhang, J.W.; Chen, X.H.; Khan, A.; Zhang, Y.K.; Kuang, X.X.; Liang, X.Y.; Taccari, M.L.; Nuttall, J. Daily runoff forecasting by deep recursive neural network. J. Hydrol. 2021, 596, 126067. [Google Scholar] [CrossRef]
- Kalteh, A.M. Improving forecasting accuracy of streamflow time series using least squares support vector machine Coupled with data-preprocessing techniques. Water Resour. Manag. 2016, 30, 747–766. [Google Scholar] [CrossRef]
- Ji, C.M.; Li, R.B.; Zhang, Y.K.; Liu, D.; Zhang, P.; Du, L. Projection purchasing autoregressive combination model based on wavelet decomposition and its application to annual runoff prediction. J. Hydroelectr. Eng. 2015, 34, 27–35. [Google Scholar]
- Yao, Y.M.; Liu, M.Y.; Chen, Y.; Li, Z.J. Uncertainty analysis and application of daily runoff simulation in Haihe River Basin. Water Conserv. Plan. Des. 2019, 12, 14–17+22. [Google Scholar]
- Cheng, C.T.; Chau, K.; Sun, Y.G.; Lin, J.Y. Long-term prediction of discharges in Manwan Reservoir using artificial neural network models. Lect. Notes Comput. 2005, 3498, 1040–1045. [Google Scholar]
- Zhang, X.W.; Shen, B.; Huang, L.M. Grey self-memory runoff prediction model based on BP neural network. J. Hydroelectr. Eng. 2009, 28, 68–71. [Google Scholar]
- Guo, J.; Zhou, J.Z.; Qin, H.; Zou, Q.; Li, Q.Q. Monthly streamflow forecasting based on improved support vector machine model. Expert Syst. Appl. 2011, 38, 13073–13081. [Google Scholar] [CrossRef]
- Kisi, O.; Cimen, M. A wavelet-support vector machine conjunction model for monthly streamflow forecasting. J. Hydrol. 2011, 399, 132–140. [Google Scholar] [CrossRef]
- Badrzadeh, H.; Sarukkalige, R.; Jayawardena, A.W. Hourly runoff forecasting for flood risk management: Application of various computational intelligence models. J. Hydrol. 2015, 529, 1633–1643. [Google Scholar] [CrossRef]
- Zhao, T.T.G.; Yang, D.W.; Li, M.L. Transcendental probability Bayesian discriminant analysis and its application in medium-long-term runoff forecast. J. Hydraul. Eng. 2011, 42, 692–699. [Google Scholar]
- Ma, Z.K.; Li, Z.J.; Zhang, M.; Fan, Z.W. Bayesian Statistic Forecasting Model for Middle-Term and Long-Term Runoff of a Hydropower Station. J. Hydrol. Eng. 2013, 18, 1458–1463. [Google Scholar] [CrossRef]
- Yuan, X.H.; Chen, C.; Yuan, Y.B.; Zhang, B.Q. Runoff Prediction Based on Hybrid Clustering with WOA Intervals Mapping Model. J. Hydrol. Eng. 2021, 26, 04021019. [Google Scholar] [CrossRef]
- Zadel, L.A. Towards a theory of fuzzy information granulation and its centrality in human reasoning and fuzzy logic. Fuzzy Sets Syst. 1997, 90, 111–127. [Google Scholar] [CrossRef]
- Chen, Y.L.; Yin, H.; Huang, Q.; Zhou, Y.W. Fuzzy interval forecasting of photovoltaic output. Ningxia Electr. Power 2017, 5, 39–44. [Google Scholar]
- He, Y.Y.; Yan, Y.D.; Wang, X.; Wang, C. Uncertainty Forecasting for Streamflow based on Support Vector Regression Method with Fuzzy Information Granulation. Energy Procedia 2019, 158, 6189–6194. [Google Scholar] [CrossRef]
- Zhang, N.; Wang, S.X.; Ge, L.J.; Wang, Z.H. A prediction method for short term output interval of photovoltaic. Acta Energ. Sol. Sin. 2020, 41, 173–179. [Google Scholar]
- Luo, C.; Wang, H.Y. Fuzzy forecasting for long-term time series based on time-variant fuzzy information granules. Appl. Soft Comput. 2020, 88, 106046. [Google Scholar] [CrossRef]
- Yang, L. Machine Learning Classification and Regression Prediction Analysis Based on Information Granulation; Beijing Normal University: Beijing, China, 2009. [Google Scholar]
- Pedrycz, W. Granular Computing: An Introduction; Physica: Heidelberg, Germany, 2000; pp. 309–328. [Google Scholar]
- Zhu, H. VRP problem with fuzzy time and demand based on improved particle swarm optimization. Logist. Technol. 2017, 36, 84–89. [Google Scholar]
- Han, X.; Wei, Z.; Zhang, B.Z.; Li, Y.N.; Du, T.S.; Chen, H. Crop evapotranspiration prediction by considering dynamic change of crop coefficient and the precipitation effect in back-propagation neural coefficient and the precipitation effect in back-propagation neural network model. J. Hydrol. 2021, 596, 126104. [Google Scholar] [CrossRef]
- Li, J.Q.; Wang, S. Medium- and long-term runoff forecast based on ESMD-BP neural network combination model. J. Appl. Basic Eng. Sci. 2020, 28, 817–832. [Google Scholar] [CrossRef]
- Li, Y.P.; Jia, M.; Han, X.; Bai, X.S. Towards a comprehensive optimization of engine efficiency and emissions by coupling artificial neural network (ANN) with genetic algorithm (GA). Energy 2021, 225, 120331. [Google Scholar] [CrossRef]
- Khosravi, A.; Nahavandi, S.; Creighton, D. Construction of optimal prediction intervals for load forecasting problems. IEEE Trans. Power Syst. 2010, 25, 1496–1503. [Google Scholar] [CrossRef] [Green Version]
- Vahid, N.; Nardin, J.P.; Elnaz, S.; Abbas, K. Estimation of prediction interval in ANN-based multi-GCMs downscaling of hydro-climatologic parameters. J. Hydrol. 2019, 579, 124226. [Google Scholar] [CrossRef]
- Zhang, G.; LI, Z.X.; Zhang, K.S.; Zhang, L.; Hua, X.; Wang, Y.Q. Multi-objective interval prediction of wind power based on conditional copula function. Clean Energy 2019, 7, 802–812. [Google Scholar] [CrossRef]
Figure 1.
The schematic diagram of Wei River Basin.

Figure 2.
The general framework of runoff prediction based on FIG-GA-BP.

Figure 3.
Historical monthly runoff series: (a) Weijiabu, (b) Linjiacun, (c) Zhangjiashan.


Figure 4.
Granulation results: (a) Weijiabu (b) Linjiacun (c) Zhangjiashan.


Figure 5.
PACF value of runoff data of Weijiabu. The blue lines indicates the upper and lower bounds of the autocorrelation coefficient, and the part beyond the boundary indicates that there is a correlation.
Figure 5.
PACF value of runoff data of Weijiabu. The blue lines indicates the upper and lower bounds of the autocorrelation coefficient, and the part beyond the boundary indicates that there is a correlation.

Figure 6.
Prediction results in Weijiabu from three models: (a) FIG-GA-BP; (b) FIG-BP; (c) FIG-WNN. The black circle represents prediction failure.
Figure 6.
Prediction results in Weijiabu from three models: (a) FIG-GA-BP; (b) FIG-BP; (c) FIG-WNN. The black circle represents prediction failure.

Figure 7.
Prediction results in Linjiacun from three models: (a) FIG-GA-BP; (b) FIG-BP; (c) FIG-WNN. The black circle represents prediction failure.
Figure 7.
Prediction results in Linjiacun from three models: (a) FIG-GA-BP; (b) FIG-BP; (c) FIG-WNN. The black circle represents prediction failure.

Figure 8.
Prediction results in Zhangjiashan from three models: (a) FIG-GA-BP; (b) FIG-BP; (c) FIG-WNN. The black circle represents prediction failure.
Figure 8.
Prediction results in Zhangjiashan from three models: (a) FIG-GA-BP; (b) FIG-BP; (c) FIG-WNN. The black circle represents prediction failure.


Figure 9.
Point prediction results in hydrologic station by four models: (a) Weijiabu; (b) Linjiacun; (c) Zhangjiashan.
Figure 9.
Point prediction results in hydrologic station by four models: (a) Weijiabu; (b) Linjiacun; (c) Zhangjiashan.


Table 1.
Basic statistics of monthly runoff.
| Hydrological Station | Min | Mean | Max | SD |
|---|---|---|---|---|
| Weijiabu | 1.61 | 87.71 | 728.42 | 113.752 |
| Linjiacun | 0.40 | 60.33 | 434.00 | 63.77 |
| Zhangjiashan | 0 | 37.10 | 340.07 | 51.38 |
Table 2.
Predict evaluation indexes of different models.
| Hydrological Station | Model | FICP | FINAW | QR (%) | ARE (%) | RMSE |
|---|---|---|---|---|---|---|
| Weijiabu | FIG-GA-BP | 0.98 | 0.46 | 81 | 12 | 18.51 |
| FIG-BP | 0.95 | 0.69 | 72 | 18 | 74.40 | |
| FIG-WNN | 0.94 | 0.72 | 76 | 17 | 33.95 | |
| BP | \ | \ | 77 | 15 | 38.47 | |
| Linjiacun | FIG-GA-BP | 0.98 | 0.63 | 84 | 14 | 18.63 |
| FIG-BP | 0.94 | 0.87 | 80 | 13 | 18.42 | |
| FIG-WNN | 0.93 | 0.76 | 64 | 25 | 23.12 | |
| BP | \ | \ | 78 | 18 | 20.32 | |
| Zhangjiashan | FIG-GA-BP | 0.98 | 0.23 | 89 | 11 | 7.64 |
| FIG-BP | 0.97 | 0.57 | 82 | 18 | 14.23 | |
| FIG-WNN | 0.94 | 0.66 | 67 | 30 | 24.56 | |
| BP | \ | \ | 81 | 14 | 7.68 |
Publisher’s Note: MDPI stays neutral with regard to jurisdictional claims in published maps and institutional affiliations. |
© 2022 by the authors. Licensee MDPI, Basel, Switzerland. This article is an open access article distributed under the terms and conditions of the Creative Commons Attribution (CC BY) license (https://creativecommons.org/licenses/by/4.0/).
Share and Cite
MDPI and ACS Style
Yang, X.; Zhang, X.; Xie, J.; Zhang, X.; Liu, S. Monthly Runoff Interval Prediction Based on Fuzzy Information Granulation and Improved Neural Network. Water 2022, 14, 3683. https://doi.org/10.3390/w14223683
AMA Style
Yang X, Zhang X, Xie J, Zhang X, Liu S. Monthly Runoff Interval Prediction Based on Fuzzy Information Granulation and Improved Neural Network. Water. 2022; 14(22):3683. https://doi.org/10.3390/w14223683
Chicago/Turabian StyleYang, Xinyu, Xiao Zhang, Jiancang Xie, Xu Zhang, and Shihui Liu. 2022. "Monthly Runoff Interval Prediction Based on Fuzzy Information Granulation and Improved Neural Network" Water 14, no. 22: 3683. https://doi.org/10.3390/w14223683
Note that from the first issue of 2016, this journal uses article numbers instead of page numbers. See further details here.