
A Vegetation Assessment of the Kearl Treatment Wetland following Exposure to Oil Sands Process-Affected Water

1
School of Resource and Environmental Management, Simon Fraser University, Burnaby, BC V5A 1S6, Canada
2
Advisian, Worley Group, Denver, CO 80112, USA
3
Upstream Research, Imperial Oil Resources Limited, Calgary, AB T2C 5R2, Canada
*
Author to whom correspondence should be addressed.
Water 2022, 14(22), 3686; https://doi.org/10.3390/w14223686
Submission received: 6 October 2022
/
Revised: 8 November 2022
/
Accepted: 9 November 2022
/
Published: 15 November 2022
(This article belongs to the Special Issue Applied Ecology Research for Water Quality Management)
Abstract
:Treatment wetlands have emerged as a potential option for the treatment of oil sands process-affected water (OSPW). The long-term viability of these treatment systems relies, in part, on the health and productivity of wetland vegetation. The aim of this study is to investigate the physiological and community-level effects on wetland vegetation at the Kearl Treatment Wetland (KTW) following exposure to different OSPW sources. Annual vegetation assessments were performed during 2016–2021 to monitor species composition, total percent cover, species richness, species morphology (plant stem density, leaf length, and leaf width), and plant vigor in the KTW. Cattail was found to dominate the deep-water zones whereas water sedge was found to dominate the shallow-water zones of the wetland. Species richness in the KTW decreased with time which is typical of constructed wetlands receiving industrial effluents. No changes in plant stem density of cattails or water sedge were observed; however, leaf length decreased from 2019 to 2021, and leaf width decreased from 2020 to 2021. Plant vigor ratings increased in the KTW each year suggesting that the vegetation does not show any major signs of phytotoxicity from OSPW exposure. These results demonstrate the complex dynamics and resiliency of the vegetative community in treatment wetlands, but continued efforts to monitor plant uptake and accumulation are needed to fully assess the phytotoxic effects of OSPW exposure.
1. Introduction
Oil sands process-affected water (OSPW) is generated through the mining and extraction of bitumen. In the Alberta Oil Sands region of Canada, OSPW broadly refers to all water that has come in contact with oil sands including mine pit water, plant site runoff, drainage pond water, and tailings pond water [1]. The chemistry of OSPW is therefore highly variable, but generally consists of a complex mixture of water, solids, organic, and inorganic contaminants, and is subject to a zero-discharge policy across the industry to prevent undue risk to the environment [2,3,4]. Currently, there are over 1 billion m3 of OSPW detained in tailings ponds in the Alberta Oil Sands region [5]. In the path towards closure, industry operators require a suite of reliable and sustainable water treatment technologies to effectively treat and safely release water to the environment [6].
Treatment wetlands have emerged as a potential treatment technology to assist in the reclamation and remediation of OSPW and tailings areas [7,8,9,10,11]. These constructed ecosystems utilize the natural biogeochemical mechanisms of wetlands to treat wastewaters. The removal of contaminants from OSPW in treatment wetlands is facilitated by a combination of interconnected physical, chemical, and biological mechanisms to which wetland vegetation is essential [12,13]. Wetland vegetation are known to aerate water and sediment to promote aerobic environments [14,15], create surface area for biofilm growth where microbial degradation is prominent [16], and enhance the sedimentation of particulates [17]. Wetland vegetation can also sequester and accumulate wastewater contaminants in their tissues [18,19] where biotransformation through plant-mediated enzymatic mechanisms might occur [20]. The success of treatment wetlands within the oil sands industry therefore relies, in part, on the ability of wetland vegetation to support these mechanisms of pollutant removal. However, due to the complex nature of OSPW chemistry, toxicological effects on wetland vegetation may reduce their effectiveness in treatment wetlands [2,21]. Therefore, the response of wetland vegetation to OSPW exposure and changes to the vegetative community must be examined to fully assess the feasibility of treatment wetlands for OSPW remediation.
The aim of this study is to investigate the physiological and community-level effects on wetland vegetation at the Kearl Treatment Wetland (KTW) following exposure to OSPW from 2016 to 2021. OSPW from three different sources on the Kearl Oil Sands site were introduced consecutively into the KTW throughout the five years to present a variety of OSPW chemistries to the wetland vegetation. The objectives of this study are to characterize the community of wetland vegetation in the KTW each operational season, evaluate how wetland vegetation respond to OSPW exposure, and identify ecological indicators for vegetation in wetlands used to treat OSPW. To do so, annual vegetation assessments were performed to monitor species composition, total percent cover, species richness, species morphology (plant stem density, leaf length, and leaf width), and plant vigor in the KTW following exposure to OSPW.
2. Materials and Methods
2.1. Site Description
The Kearl Treatment Wetland (KTW) is located in the northwest corner of the Kearl Oil Sands site in Alberta, Canada. The KTW was the first pilot-scale treatment wetland within the Alberta Oil Sands region and has demonstrated the removal of polycyclic aromatic hydrocarbons [8] and O2-naphthenic acids [9] from OSPW. Further details of the KTW configuration and operation can be found in Cancelli and Gobas [8,9], and photos of the KTW are available in the Supplementary Materials (Figure S1). In brief, the KTW consists of three shallow cells (0.4 m) and three deep cells (1.7 m). Shallow and deep cells are separated by overflow banks that are designed to flood during periods of high water but are dry for most of the season. The KTW slopes at 0.014% to permit the hydrologic flow of water through all six cells. Common cattail (Typha latifolia; herein further referred to as ‘cattail’), hardstem bulrush (Schoenoplectus acutus), and small-fruited bulrush (Scirpus microcarpus) were harvested locally and introduced by seed into the KTW in October 2013.
The KTW operates seasonally from May to September. OSPW was pumped into the KTW each year (~6200 m3 of OSPW) from sources located on the Kearl Oil Sands site and was operated as a closed system of OSPW with a recirculation flow rate of 5 L/s. The KTW was drained at the start of each operational season to a water depth of <0.5 m in the deep cells. In 2016 and 2017, OSPW was sourced from a nearby retention pond collecting rainfall runoff from an overburden storage area (i.e., plant site runoff). Plant site runoff OSPW is considered the least influenced by oil sands operations in our study since contact was only with overburden and not with any oil sands deposits. In 2018 and 2019, OSPW was sourced from a drainage pond situated next to a tailings pond. Drainage pond OSPW is considered moderately influenced by oil sands operations in our study and is generally considered to contain higher concentrations of contaminants than plant site runoff, but lower concentrations than tailings water. In 2020, no OSPW was introduced into the KTW due to logistical and operational limitations from COVID-19; however, sufficient water was received from seasonal precipitation to maintain wetland functionality. Water in the KTW in 2020 was therefore considered not to be influenced by oil sands operations. In 2021, OSPW was sourced directly from an on-site tailings pond (i.e., tailings pond water). Tailings pond OSPW is considered the most influenced by oil sands operations in our study since this OSPW was collected directly from the primary wastewater detention pond on the Kearl Oil Sands site. By introducing various OSPW into the KTW, a dose–response scenario is created to monitor wetland vegetation exposed to a range of contaminant concentrations in OSPW.
2.2. Environmental and Water Quality Monitoring
Aqueous samples were collected from the KTW throughout each operational season. Samples were analyzed by Bureau Veritas (formerly known as Maxxam Analytics) for total and dissolved metals, trace elements, total Petroleum Hydrocarbons, Total Dissolved Solids, total Kjeldahl nitrogen, total phosphorus, orthophosphate, and naphthenic acids. The analysis of naphthenic acids by Bureau Veritas was performed by FT-IR following the method described in Jivraj et al. [22] and extensively used in other studies [23,24,25]. Additional OSPW samples were collected in 2018, 2019, and 2021 for analysis of naphthenic acids by SGS Axys Analytical Services (Sidney, BC, Canada) using high performance liquid chromatography with triple quadrupole mass spectrometer detection (LC-MS/MS) closely following methods described in Woudneh et al. [26] but using solid-phase extraction. Measurements of pH, conductivity, dissolved oxygen, and temperature were recorded in situ during sample collection events using a YSI® Professional Plus Multiparameter instrument, and turbidity was measured using an Orbeco-Hellige® TB200TM Turbidimeter. Details of this collection and analysis are available in Cancelli and Gobas [8,9]. A select number of OSPW contaminants were described herein because of their contribution to OSPW toxicity, relevance to water quality, and potential to cause adverse ecotoxicological effects in wetlands [4,27,28].
Water quality data presented in this study were collected prior to the vegetation assessment each year to represent the growing conditions in the KTW leading up to the vegetation assessment. In 2016, 2018 and 2020, only one sample (n = 1) was collected prior to the vegetation assessment so means and standard deviations were not determined for those water quality parameters. Total and dissolved metal concentration measurements represent summed concentrations for the five metals known for their enrichment in bitumen and commonly associated with OSPW (vanadium [V], nickel [Ni], molybdenum [Mo], rhenium [Re], and selenium [Se]; [29]).
Local daily temperatures and total rainfall were recorded at the Kearl Lake Weather station, approximately 15 km SSW from the KTW. Monthly average, minimum, and maximum daily temperatures, and total rainfall for the KTW operational season (May to September) each year were compared to 30-year climate normals at the Fort McMurray weather station (1981–2010; [30]). The Kearl Lake Weather station was offline for maintenance from 14 July 2016 to 31 August 2016, so the missing local data were supplemented with data from the Mildred Lake Weather station (approx. 50 km SW of the KTW [31]).
2.3. Vegetation Assessment
Vegetation at the KTW was assessed annually in peak growing season (June-August) from 2016 to 2021 using multiple vegetation plots in each shallow and deep cells. Emergent and submergent vegetation in the shallow cells were more persistent and conspicuous than the submergent vegetation in the deep cells in the KTW, so only vegetation data from the shallow cells are described in this study. Vegetation assessments were completed on 6 July 2016; 18 August 2017; 28 June 2018; 20 July 2019; 29 July 2020; and 29 July 2021. Vegetation assessments were completed using both 4 × 4 m vegetation plots (2016–2021) to monitor community composition and structural layers, and 1 × 1 m vegetation plots (2019–2021) to measure specific physiological characteristics of the dominant emergent species. The locations of the vegetation plots are shown in Figures S2 and S3.
At each 4 × 4 m vegetation plot, vegetation species were identified and percent foliar cover was estimated to the nearest 1%. The sum of vegetation species percent cover may add up to greater than 100% where layers of vegetation overlap. Percent cover of living vegetation layers (vascular and non-vascular species) were measured independently from one another. Each species was assigned a vigor rating as a measure of plant health, categorized according to Alberta Environment and Sustainable Resources Development [32] (Table S1). Species richness was determined as the sum of the total number of species observed in each vegetation plot. Sampling of the 4 × 4 m vegetation plots originally followed a temporary plot approach without strict adherence to a defined sampling area. Permanent 4 × 4 plot-based sampling was initiated in 2020 to standardize sampling to a georeferenced area and improve long-term monitoring. All 4 × 4 m vegetation plots were placed in the deep-water zone of the shallow cells of the wetland [33].
At each 1 × 1 m vegetation plot, percent foliar cover, stem density (count per m2), leaf length (cm), and leaf width (mm) were recorded for the dominant emergent vegetation species. Leaf length and leaf width were measured for five plants randomly selected in each of the 1 × 1 m vegetation plots. All 1 × 1 m plots were placed in the shallow-water zone of the shallow cells of the wetland [33].
2.4. Statistical Methods
All exploratory data analysis was conducted using JMP Pro 16.1 [34]. In addition to characterizing the community of wetland vegetation in the KTW over time, changes in wetland vegetation as a function of location relative to the treatment wetland inlet was assessed. To do this, three locations (Location 2 [cell 2], Location 3 [cell 3], and Location 4 [cell 4]) were identified with Location 2 close to the wetland inlet and Location 4 furthest from the inlet (Figure S2). This results in a two-level nested structure with the 1 × 1 m Plots nested within Location, and Plants nested within Plots. We performed a mixed ANOVA on the nested data structure as implemented in JMP Pro 16.1 to test the effect of Location, time, and their interaction, with appropriate degrees of freedom [35]. Location and Year were included as fixed effects while Plot and Plant were considered random effects. The Tukey HSD test at a significance level of α = 0.05 was used for all post hoc comparisons when treatment effects were significant.
3. Results and Discussion
3.1. Water Quality and Environmental Data
Water quality data collected from the KTW are presented in Table 1. The concentrations of Σtotal metals and Σdissolved metals in OSPW in the KTW increased each operational season, except for 2020 when OSPW was not introduced into the KTW. The concentrations of Σtotal metals and Σdissolved metals in the KTW were greatest in 2021 and reached 46 and 40.3 mg/L, respectively. Specific water quality guidelines for the protection of aquatic life [36] are not available for Σtotal metals and Σdissolved metals; however, guidelines for nickel range from 140–170 mg/L (chronic) and 1260–1520 mg/L (acute) at a total hardness (expressed as CaCO3) of 320–675 mg/L. Therefore, Σtotal metals and Σdissolved metals are not expected to significantly enhance the toxicity of OSPW on aquatic organisms in the KTW.
The concentrations of Ni, Mo, and Se in OSPW were also compared to Canadian Council of Ministers of the Environment (CCME) guidelines for the long-term protection of aquatic life [37,38]. No concentration measurements of these metals in OSPW in this study exceeded these CCME guidelines (all below 50% of the guideline), suggesting that these metals are not a risk driver for phytotoxicity in the KTW. No CCME guidelines for Re or V exist; however, all OSPW samples collected in the KTW had non-detectable concentrations of Re. With regards to V, Aihemaiti et al. [39] reported concentrations up to 47 mg/L of V in soil solution actually enhance shoot accumulation of phosphorus (P), potassium (K), and magnesium (Mg) in Setaria viridis (green foxtail grass). Further, stem height increased with increasing V concentrations in soil solution up to 23.8 mg/L and then decreased with V concentrations in soil solution above 36.7 mg/L. Therefore, at concentrations of V in OSPW of up to 3.45 ug/L, V is unlikely to contribute to phytotoxicity in this study.
Naphthenic acids are considered to be the primary toxic component [40] in OSPW and concentrations in OSPW in the KTW ranged from <2.0 mg/L in 2016 to 21 mg/L in 2021 (analyzed by FT-IR; and 47.6 mg/L analyzed by LC/MS/MS in 2021). Concentrations of naphthenic acids in tailings water throughout the industry typically range from 40–80 mg/L (FT-IR; [23,41]). Marantette et al. [4] report an EC50 (hatch success, fathead minnows) for naphthenic acids in OSPW of 5–12 mg/L (analyzed by LC/QToF). Therefore, despite being within the lower range of concentrations for the industry, the concentration of naphthenic acids in OSPW from tailings pond water in our study has the potential for adverse effects on aquatic life.
The concentration of total PHCs in OSPW entering the KTW remained relatively low throughout much of the study. The highest concentration of total PHCs in OSPW was observed in 2021 (4.3 mg/L); however, this concentration is not expected to pose significant risk to aquatic life given that the regulatory criteria for PHCs F1 and F2 are 150 and 110 mg/L, respectively [36].
The concentration of TDS in OSPW ranges from 520–1250 mg/L. Concentrations of TDS in OSPW have been measured up to 2421 mg/L [41] but has been found to increase over the duration of mining operations due to continuous recycling of OSPW for bitumen extraction processes. TDS measurements offer good indication of the salinity of the OSPW in the KTW which can have severe effects on wetland vegetation [42,43]. The relatively high TDS in the KTW across all seasons compared to natural surface waters (<400 mg/L) [44] indicates the requirement for wetland vegetation to be relatively tolerant to elevated concentrations of TDS and salinity even with OSPW that is not heavily influenced by oil sands activities (e.g., [45]).
The highest Total Kjeldahl Nitrogen (TKN), Total Phosphorus (TP), and orthophosphate (ortho-P) concentrations in OSPW entering the KTW was 0.94 mg/L (2021), 0.029 mg/L (2016), and 0.006 mg/L (2017), respectively. Concentrations of ammonium up to 18.4 mg/L (1.02 mmol/L) have been observed in tailings pond water [46] suggesting TKN concentrations in this study are relatively low compared to measurements of other OSPW within the industry. TP concentrations in OSPW in our study are consistent with concentration measurements from other studies with OSPW (e.g., [28]), whereas TKN is slightly elevated, TP is slightly lower, and ortho-P is consistent in this study relative to surface water concentrations from the Lower Athabasca River [47].
In general, the pH remained slightly alkaline, which is typical of OSPW due to the bitumen extraction process that often relies on the addition of caustic agents for enhanced separation of bitumen [48]. However, even when no OSPW was added to the KTW in 2020, the pH in the KTW remained slightly alkaline. The alkalinity levels in the different OSPWs and precipitation waters from 2020 were within field-measured pH ranges found in natural regional waterbodies [49]. Specific conductivity, turbidity, and dissolved oxygen (DO) were lowest in 2016 and 2017 when OSPW was sourced from a plant site runoff retention pond and increased in 2018 when OSPW was sourced from a drainage pond situated next to a tailings pond. DO was particularly low in 2017 and was slightly below the acute DO guideline for surface water of 5 mg/L [36]. Typically, DO remains moderately high due to the aeration that occurs as the OSPW flows over the interior berms of the KTW [9].
In most years, the OSPW introduced into the KTW contains relatively low concentrations of contaminants compared to industry averages for tailings pond water. However, the variety of OSPW used in this study presents a range of contaminant concentrations to the KTW. The highest concentrations of Σtotal metals, Σdissolved metals, naphthenic acids, and PHCs in OSPW were observed in 2021 when OSPW was sourced directly from a tailings pond on the Kearl Oil Sands site. The lowest concentrations were generally observed in 2020 when no OSPW was introduced into the KTW.
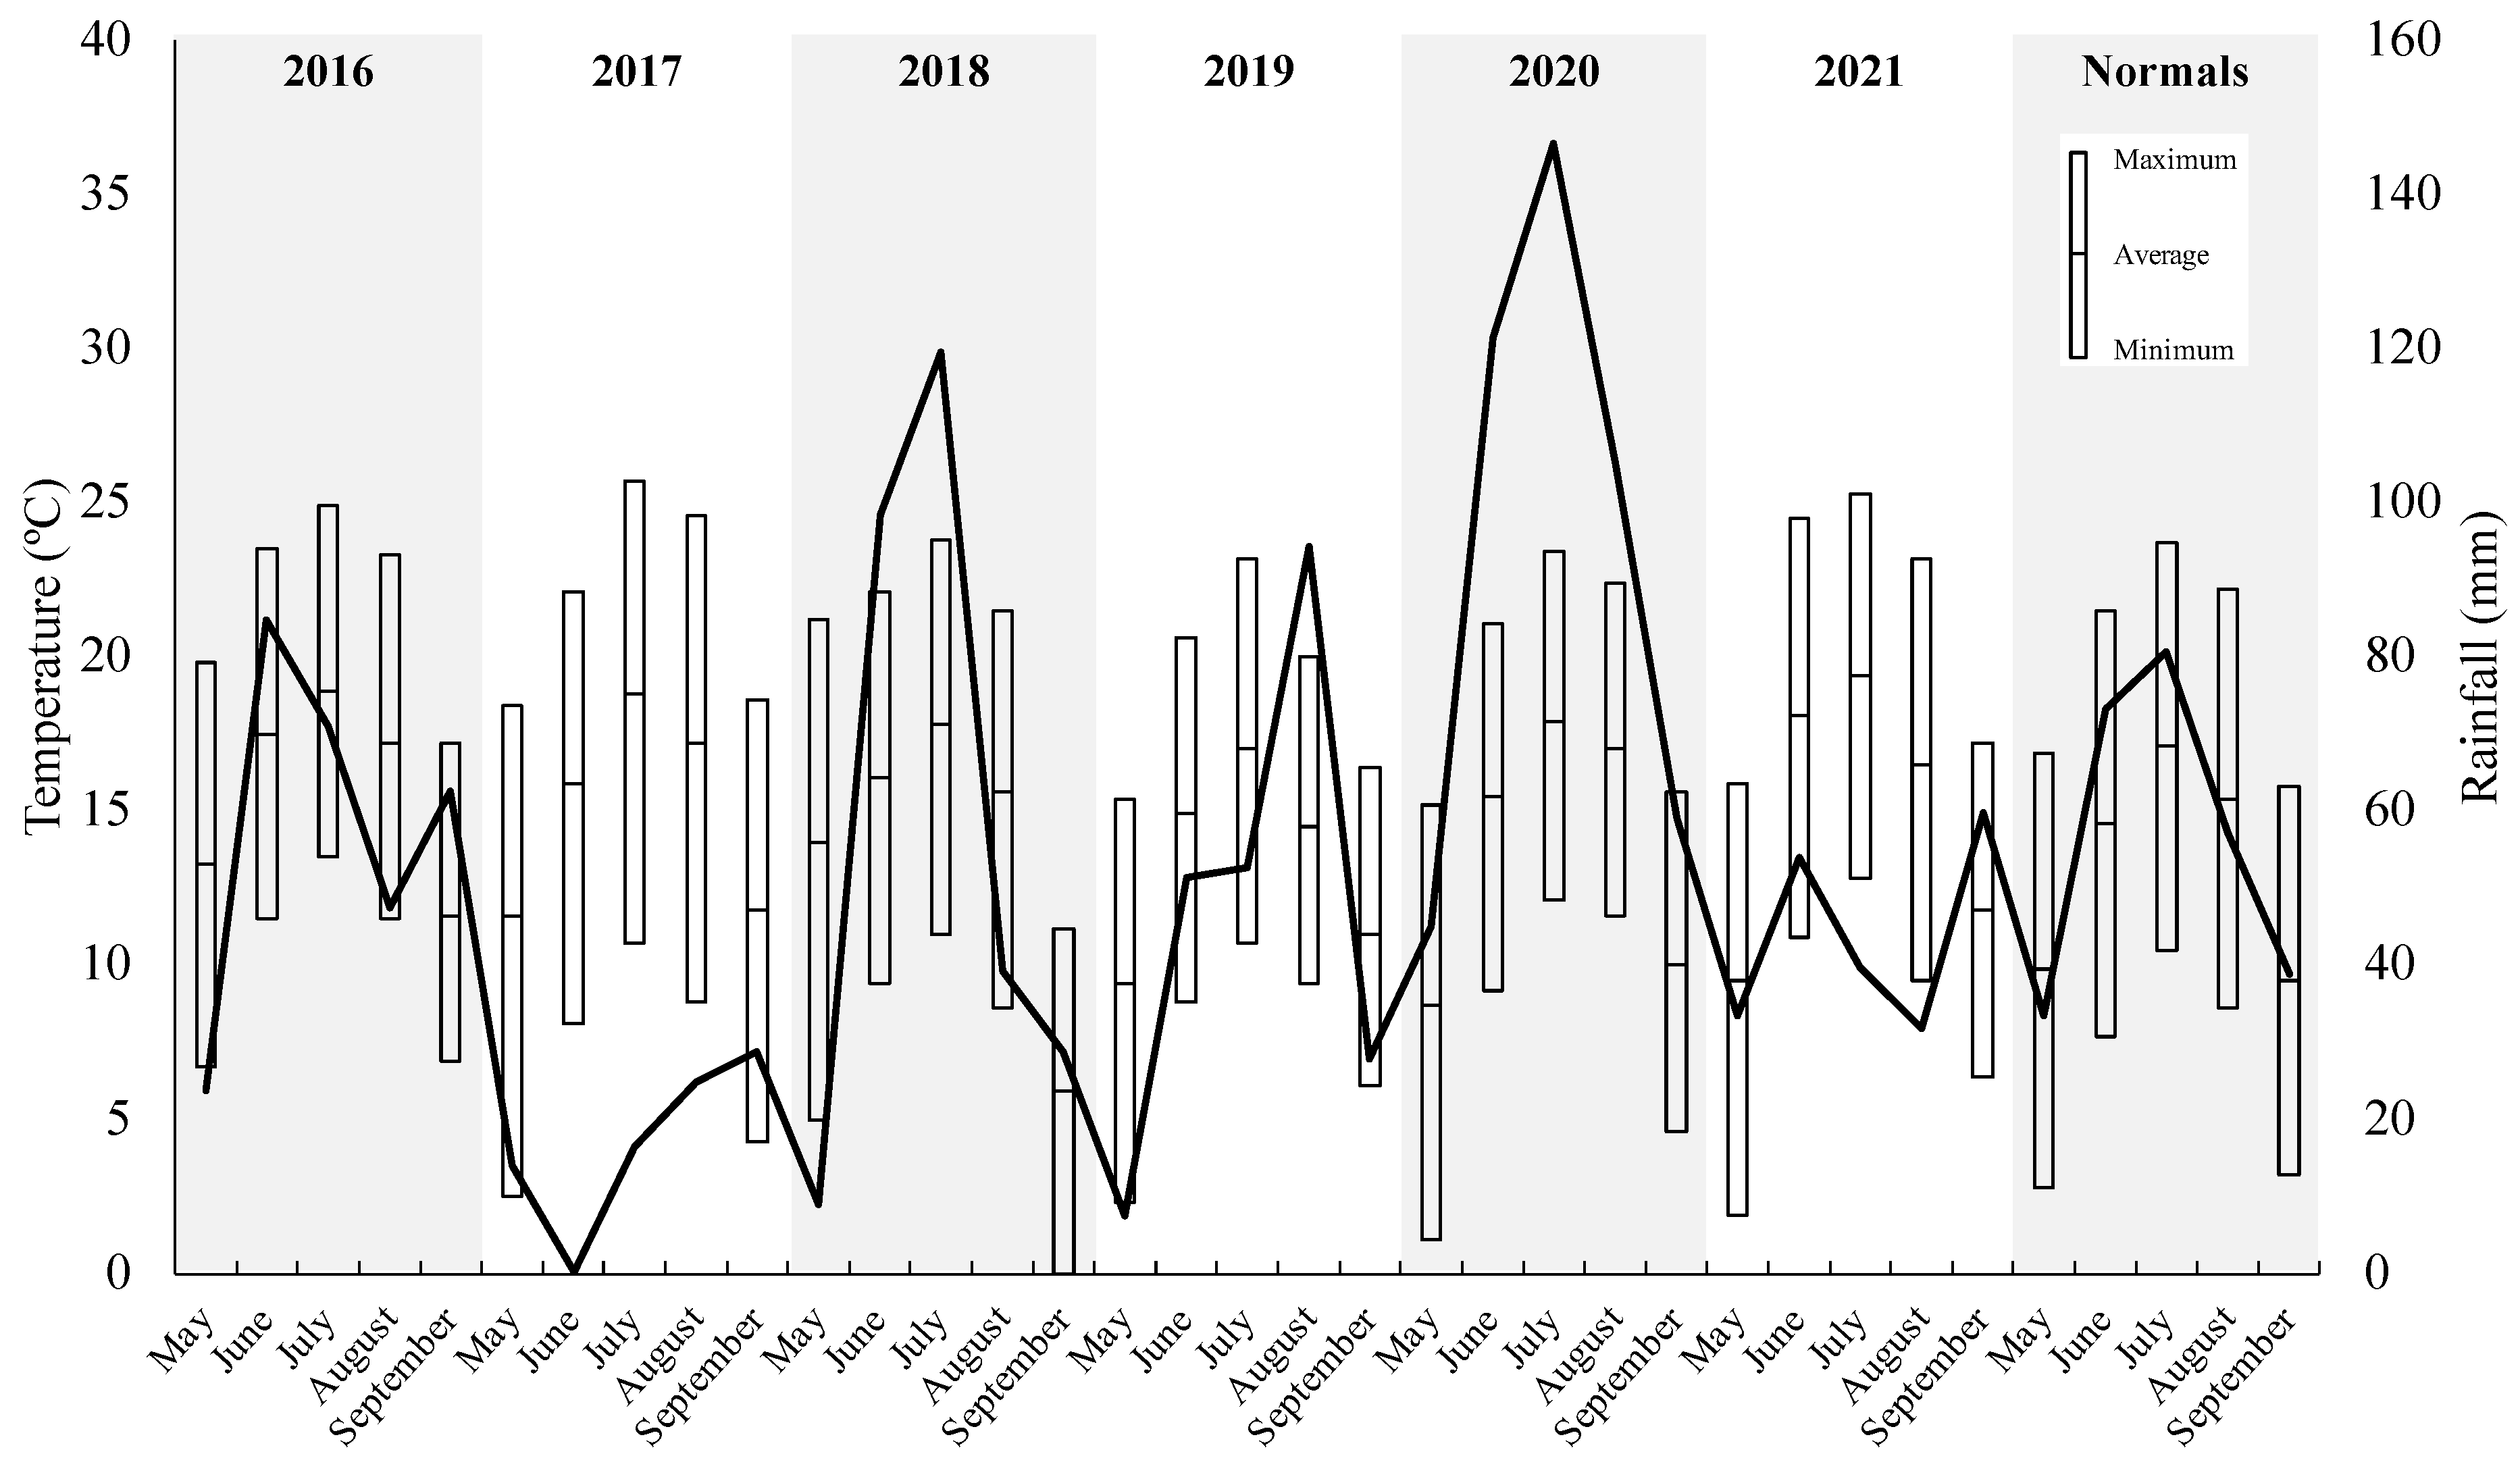
Figure 1 shows the monthly average, average monthly minimum and average monthly maximum temperatures and the total monthly rainfall at the Kearl Lake Weather Station from May to September of each KTW operational season. Average monthly temperatures were comparable to regional normals, particularly June to August. However, May and September temperatures were much more variable. For example, May and September in 2016 and 2017 were, on average, warmer than climate normals for the region, but September 2018 was the coldest month recorded in this study, averaging 4.5 °C compared to 9.5 °C regional normals. July was consistently the warmest month in the region, and July 2021 was the warmest month on record for this study, averaging 19.4 °C compared to 17.1 °C regional normal.
Rainfall is shown to be highly variable from year-to-year. Total rainfall during our 2016 and 2019 seasons followed a normal rainfall profile and was comparable to regional normal, whereas total rainfall in 2018 and 2020 was greater than regional normal and total rainfall in 2017 and 2021 were lower than regional normal. The 2017 season was particularly dry (total rainfall (May–September) = 84 mm), totaling only 30% of the seasonal normal (283 mm) and averaging approximately 2 °C warmer each month. Total rainfall in June 2017 was only 0.2 mm whereas the regional normal is 73.3 mm. Total rainfall was greatest during the 2020 season (477 mm) mostly because of heavy precipitation in June (121 mm) and July (147 mm). No source water was added to the KTW in 2020, so the above average rainfall and average seasonal temperatures likely mitigated any effects on the vegetation from a lack of supplemental water inputs. Total precipitation and evapotranspiration estimates in the KTW from May to the vegetation assessment are provided in Table S2.
3.2. Community Composition and Cover Types
Only three plant species (cattail, hardstem bulrush, and small-fruited bulrush) were planted in the KTW in 2013. By 2016, natural recruitment processes expanded the KTW vegetation community to 52 recorded plant species. From 2016 to 2021, a total of 100 different plant species have been identified across the entire KTW including banks, deep cells, and shallow cells. These include four trees, 16 shrubs, 50 forbs (herbaceous broadleaf flowering plants that are not grass-like), and 30 graminoids (grass-like plants (grasses, rushes, and sedges)), 37 of which are listed as culturally important plants. Mosses and algae also have been observed but were not identified to species. Of the vascular plant species identified, 15 are commonly used in treatment wetlands [12,50,51]. Design reports for the KTW state that softstem bulrush (S. tabernaemontani) was seeded in the KTW; however, hardstem bulrush (Schoenoplectus acutus) has been identified in vegetation assessments since 2016, suggesting possible misidentification at the time of seeding. These two species are similar in morphology (distinguished primarily by soft or hard stems (internal air space size) and scale awn length (0.2–0.8 mm for S. tabernaemontani and 0.5–2 mm for S. acutus)) [52,53] and function, so they are discussed as equivalents.
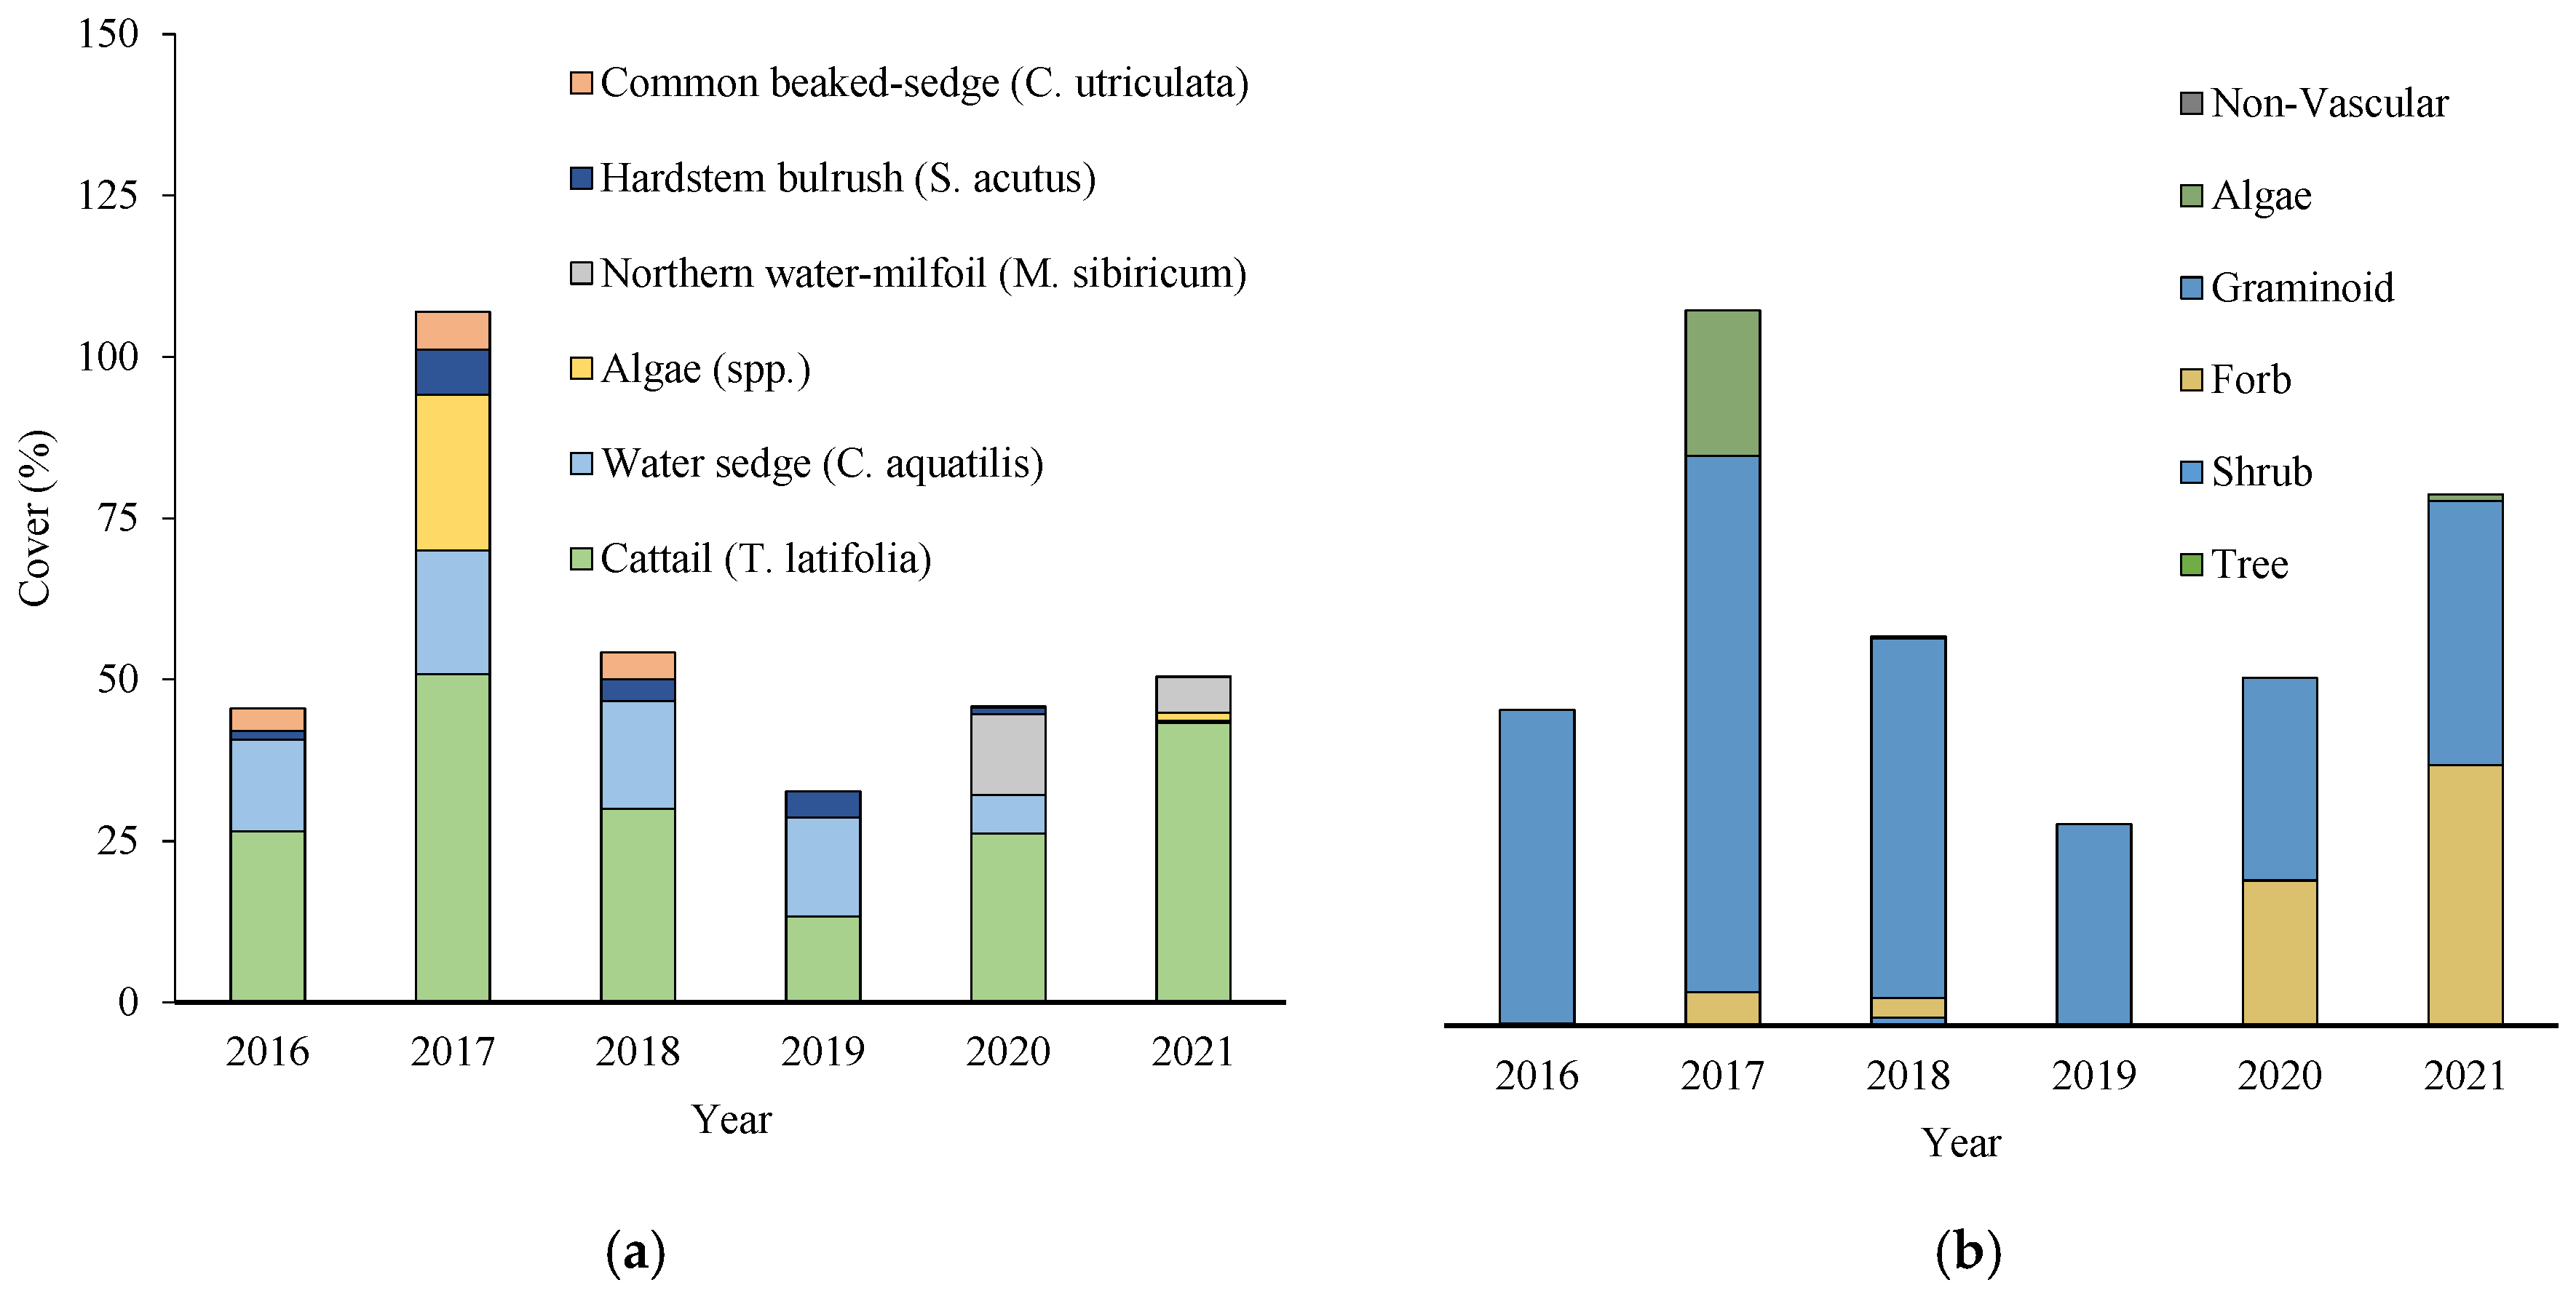
Treatment wetlands are typically dominated by only a few plants that are more adapted to the source water quality and conditions of the artificial ecosystems constructed [54]. The KTW is primarily dominated by cattail and water sedge (Carex aquatilis), with sub-dominance by hardstem bulrush, common beaked sedge (Carex utriculata), and northern watermilfoil (Myriophyllum sibiricum; Figure 2). These five species are commonly found in treatment wetlands [12,49,50]; however, cattails (e.g., [10,11,55,56]) and water sedge (e.g., [7,57]) are most widely reported as the primary species in a variety of treatment wetland applications. Cattails have been shown to be a robust species capable of adapting to OSPW and maintaining growth even in polluted wastewaters [21,58]. Water sedge was recently found to be more effective in treatment wetlands at reducing the toxicity of OSPW compared to cattail and bullrush [59]. Therefore, having both cattails and water sedge present in the KTW provides strong support for OSPW treatment.
Cattail and water sedge contribute an average of 31% (standard deviation [sd] 13%) and 12% (sd 7%) of total cover in the shallow cells of the KTW, respectively, across all years. Crowe et al. [60] has found that both cattails and water sedge are strong competitors in wetlands and that both species will typically co-dominate. Despite their dominance, both species have varied in abundance over the study period. The decrease in cattail cover in 2018 and 2019 followed a hot and dry year in 2017, and then a change in source water in 2018 (i.e., from plant site runoff to drainage pond OSPW; Figure 2a). Water sedge quickly dominated the shallow cells by 2016 and maintained substantial cover until 2020. In 2021, water sedge cover decreased to <1%. This shift follows a very wet (high precipitation) 2020 season and coincides with an increase in overall forb cover (Figure 2b) and more specifically an increase in cattail cover (Figure 2a), potentially suggesting a decline in water sedge from higher water levels and increased competition. Photos of the KTW in Figure S1 from 2021 indicate that water sedge dominates the perimeter of the shallow cells where water levels are lower, and cattails dominate the central, deeper areas of the cells. This explains why water sedge cover appears to decrease in the 4 × 4 m plots which were placed in more central locations within the shallow cells.
Figure 2b shows that graminoids make up the majority of the vegetation in the KTW, but their cover in the shallow cells has been variable. Total graminoid cover in the shallow cells ranged from 34% (2019 and 2020) to 90% (2017). Graminoids in the KTW consist mainly of cattails, water sedge, common beaked sedge, and hardstem bulrush. The variability is not particularly unusual as changes in emergent plant cover are typical in wetlands with frequent seasonal or interannual water level fluctuation [61] like the KTW.
Forb cover is low from 2016 to 2019 as the shallow cells were consistently dominated by graminoids. The recruitment of submerged aquatic vegetation species in the shallow cells mainly occurred in 2020 with the prevalence of northern watermilfoil, and to a lesser extent, hornwort (Ceratophyllum demersum). A brief emergence of small-leaf pondweed (Potamogeton pusillus) occurred in 2017 but was not identified in any other seasons. Average cover by forbs from 2016 to 2019 was 2.3%, but forb cover increased to 24% in 2020, and increased again to 43% in 2021, suggesting that a community of submerged vegetation is continuing to develop in the KTW. Submerged aquatic vegetation are susceptible to changes in water quality and light availability, which can be influenced by physical obstruction by other plants/algae or suspended sediment [62]. Low turbidity in the KTW in 2020 compared to other seasons suggests suspended sediment may have inhibited the growth of submerged vegetation in previous years. Lower species diversity of submerged aquatic plants also has been observed in constructed wetlands with OSPW compared to natural wetlands in Alberta’s oil sands region [63]. Having submerged vegetation in treatment wetlands is, however, beneficial to the overall treatment performance, especially for complex mixtures such as OSPW. Further investigation would be required to determine tolerances of submerged aquatic plants to elevated concentrations of contaminants in OSPW.
Tree and shrub cover is negligible in the shallow cells, with only a few instances recorded throughout the study, mainly in 2017 and 2018. Average cover in vegetation plots were less than 3% for Bebb’s willow (Salix bebbiana) and Sandbar willow (Salix exigua), and less than 1% for tamarack (Larix laricina), white spruce (Picea glauca), balsam poplar (Populus balsamifera), northern redcurrant (Ribes triste), green alder (Alnus viridis), and shrubby cinquefoil (Dasiphora fruticosa). An algal bloom also occurred in 2017 but quickly subsided in 2018. However, a small algal bloom was also observed in 2021 (1.2% cover).
The variability in vegetation cover between years suggests that cover metrics may not be a suitable ecological indicator for the overall ecological health of the vegetative community. However, cover changes in certain dominant species or vegetation type may indicate adaptation of the vegetative community in response to OSPW exposure. Further monitoring is needed to define the specific cover metrics that are most suitable as ecological indicators in treatment wetlands.
3.3. Species Richness
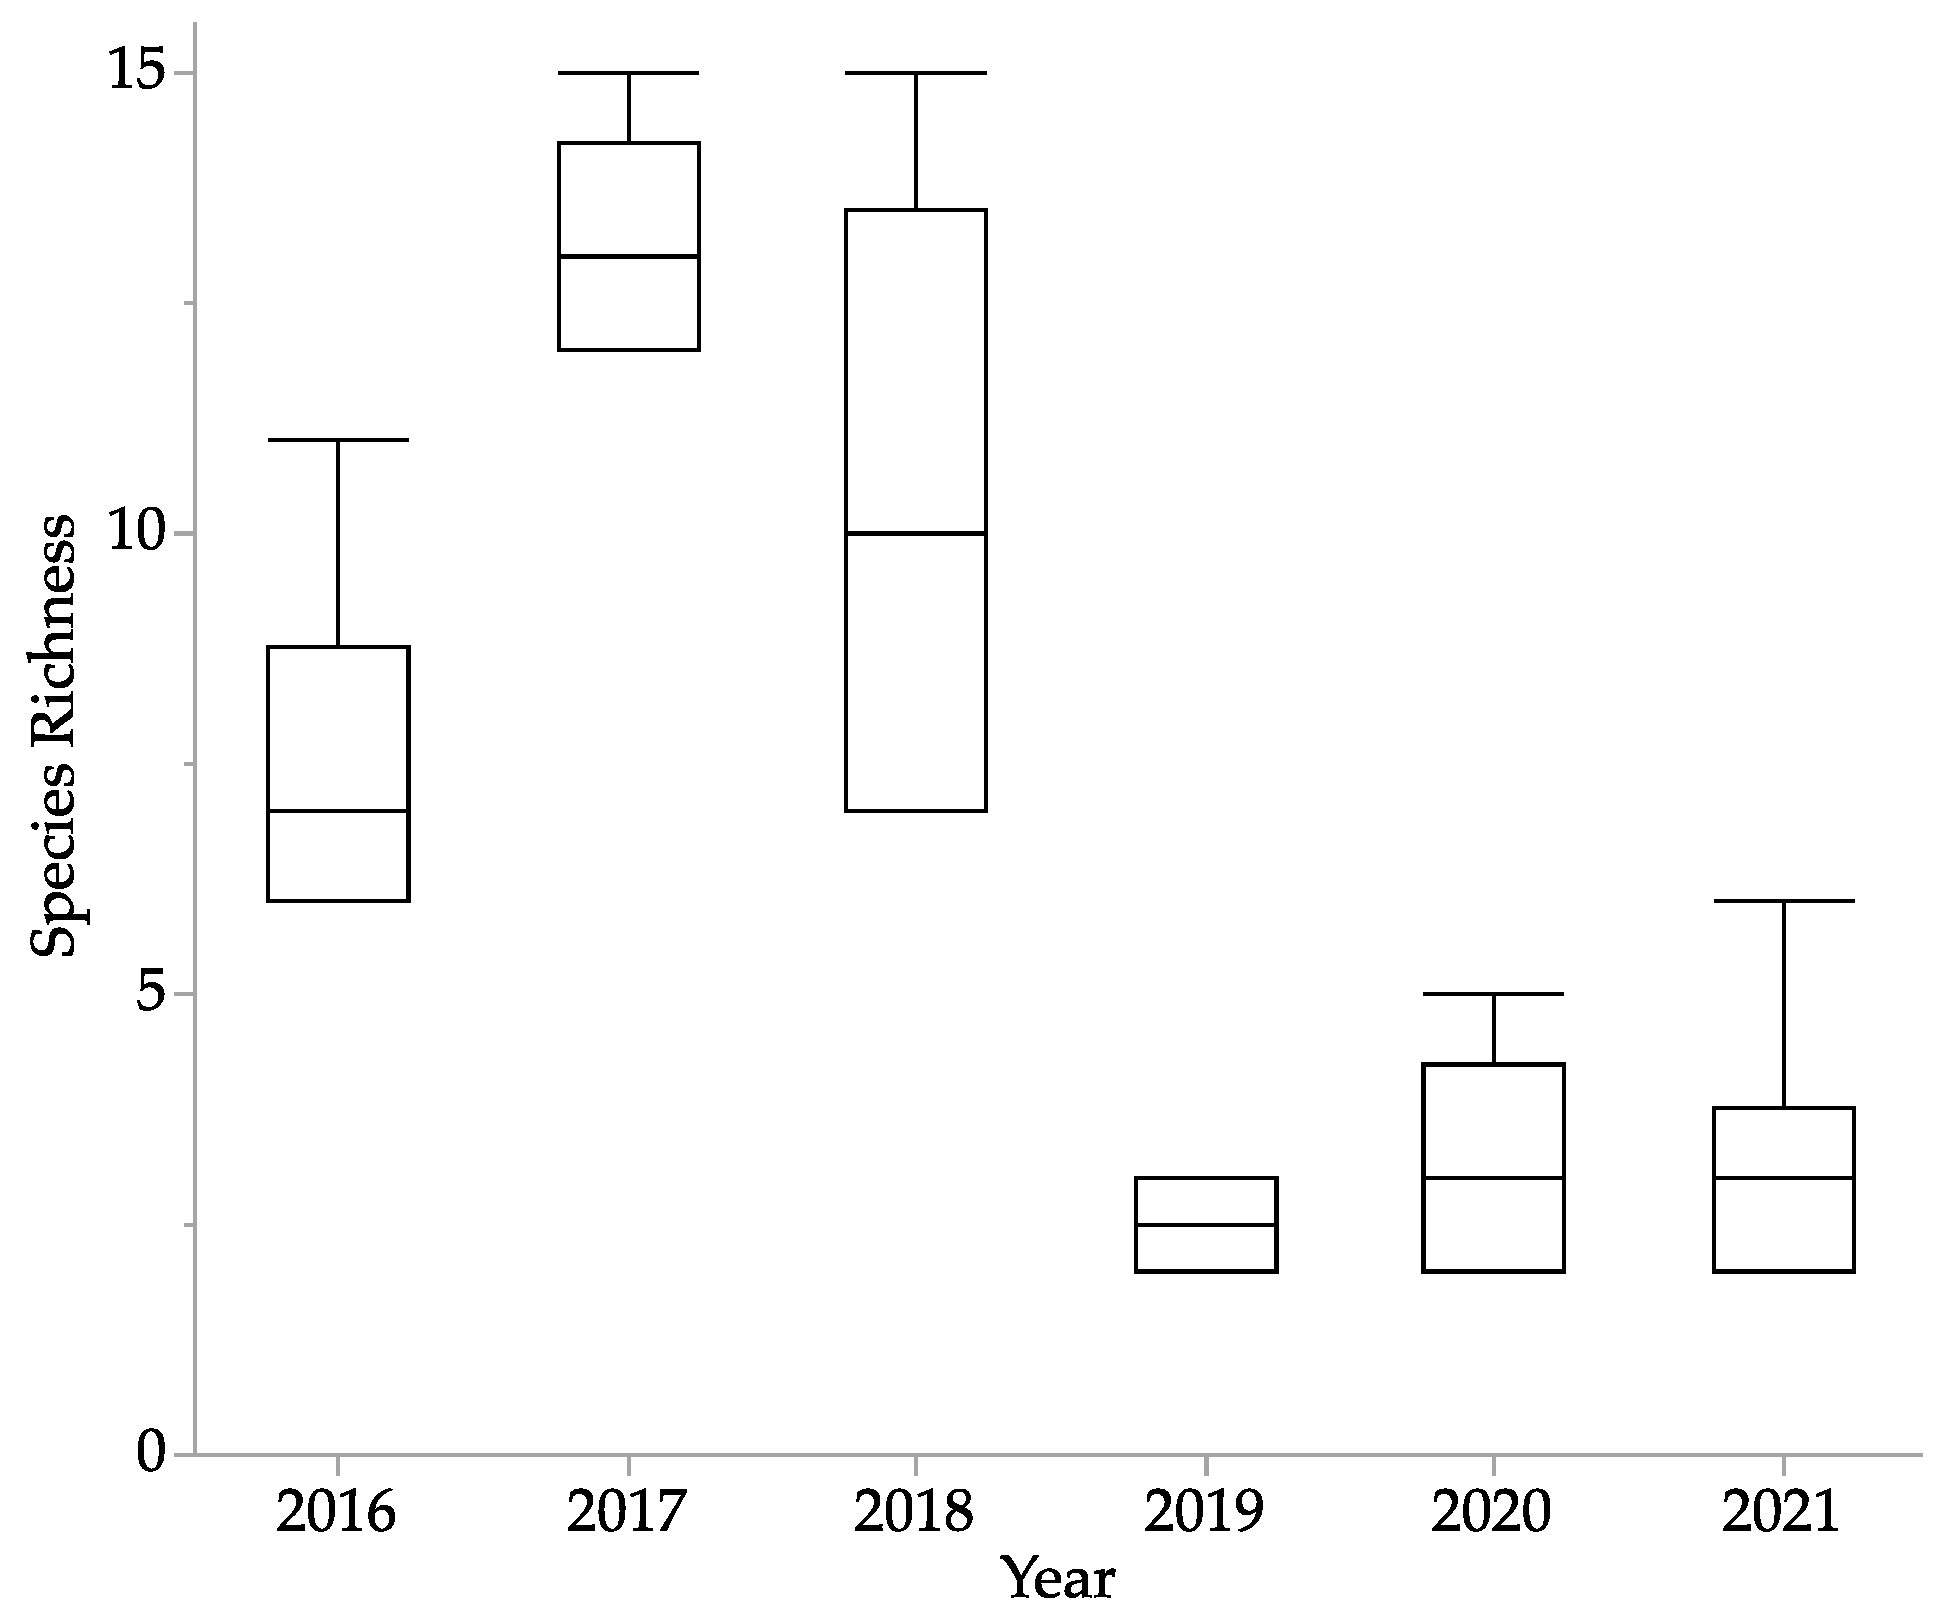
Figure 3 shows the range of species richness in the vegetation plots in the shallow cells of the KTW from 2016 to 2021. Species richness was greatest in 2017 (mean = 13.2, sd = 1.2) and 2018 (mean = 10.3, sd = 3.3) due to a diverse group of both graminoid and forb species present. In both years, 15 different species were identified in one of the vegetation plots (n = 6 per year). Species richness declined substantially in 2019 and remained low in 2020 and 2021 due to the persistence of common emergent graminoids such as cattail, beaked sedge, and water sedge, and the common submerged forbs hornwort and northern watermilfoil. From 2019 to 2021, 14 of 16 vegetation plots contained cattails, and 7 of 16 vegetation plots contained only two species. The second species was either water sedge or northern watermilfoil. Overall, the species richness in the KTW is low compared to natural marsh wetland communities in the surrounding area [64].
The variability in species richness may be related to environmental factors that influence germination and growth of wetland vegetation. Galinato and Van der Valk [42] demonstrated a reduction in cattail germination at 1000 mg/L NaCl. The concentration of TDS, which is assumed to largely represent dissolved salts in OSPW, reaches 1250 (sd 58) mg/L in 2019 and corresponds with a reduction in species richness in the KTW. Further, species richness in the KTW was found to decrease with increasing concentrations of TDS in OSPW (p < 0.01; R2 = 0.54) which supports the findings by Trites and Bayley [43]. Relatively high concentrations of TDS remain in 2020 and 2021 suggesting that germination rates remained relatively low and only the most salt-tolerant species endured.
Species diversity in constructed wetlands is typically lower than natural wetlands [60] and species richness was found to decrease with closer proximity to industrial sources of emissions [65]. Therefore, the reduction in species richness observed in the KTW may be the result of wetland maturation occurring from repeated exposure to OSPW, and progressively higher contaminant loads into the KTW. This may be the natural progression of the constructed wetland to adapt to OSPW. Given the response of species richness to OSPW exposure, this may be a helpful ecological indicator to monitor vegetation health in treatment wetlands.
For treatment wetlands, it is generally beneficial to encourage a diverse plant assemblage to better tolerate seasonal and water quality changes and cultivate interspecies variability in removal efficacies for different contaminants [66], variability in seasonal productivity [67], and greater capacity to oxygenate open water to promote aerobic degradation [68]. Increased diversity and structural layers (emergent and submerged vegetation) may create resiliency in the KTW and help maintain ecological productivity during exposure to industrial contaminants [66,69,70]. However, it is also advisable to avoid too much diversity of dominant plants to limit interspecies competition, which can reduce treatment capacity [71]. In addition, it is important to acknowledge that in the operation of treatment wetlands, operators do not manage for species richness, but manage mainly for treatment efficiency.
3.4. Morphology of Dominant Emergent Plants
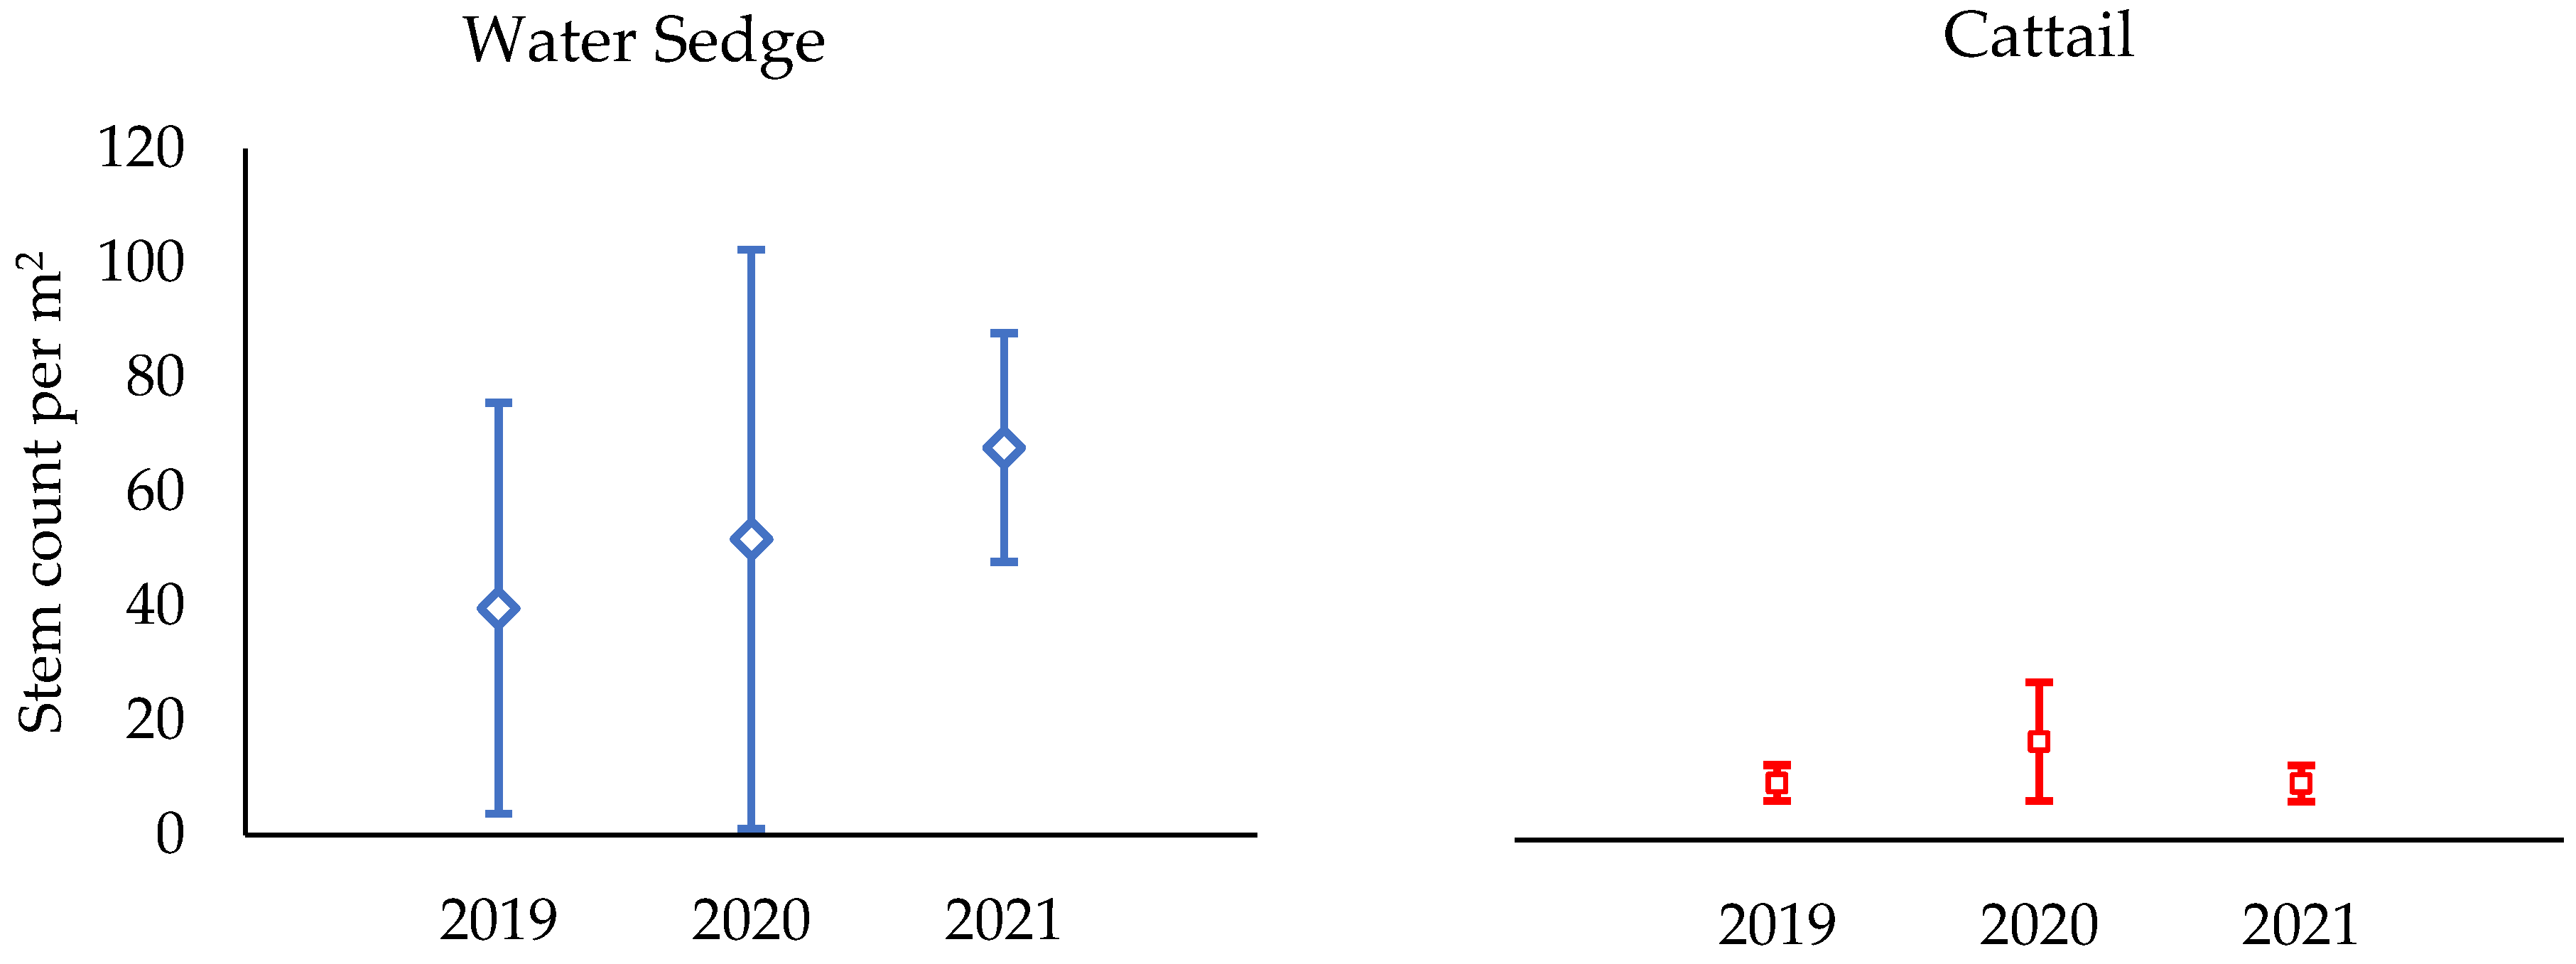
Figure 4 shows the range of stem counts per 1 m2 for water sedge (mean 53.1, sd 14.1) and cattail (mean 12.3, sd 4.2) in the shallow cells of the KTW. Mean stem counts increased for water sedge from 2019 to 2021 but remained relatively constant for cattail. No statistically significant changes in stem counts were observed for either species. However, both species showed the greatest variability of stem counts in 2020, likely responding to more variable environmental conditions from high seasonal precipitation and lack of supplemented water. Changes in OSPW source in 2019 and 2021 do not appear to have affected the density of plants in the shallow cells and therefore stem count does not appear to be a sensitive indicator of macrophyte health in treatment wetlands.
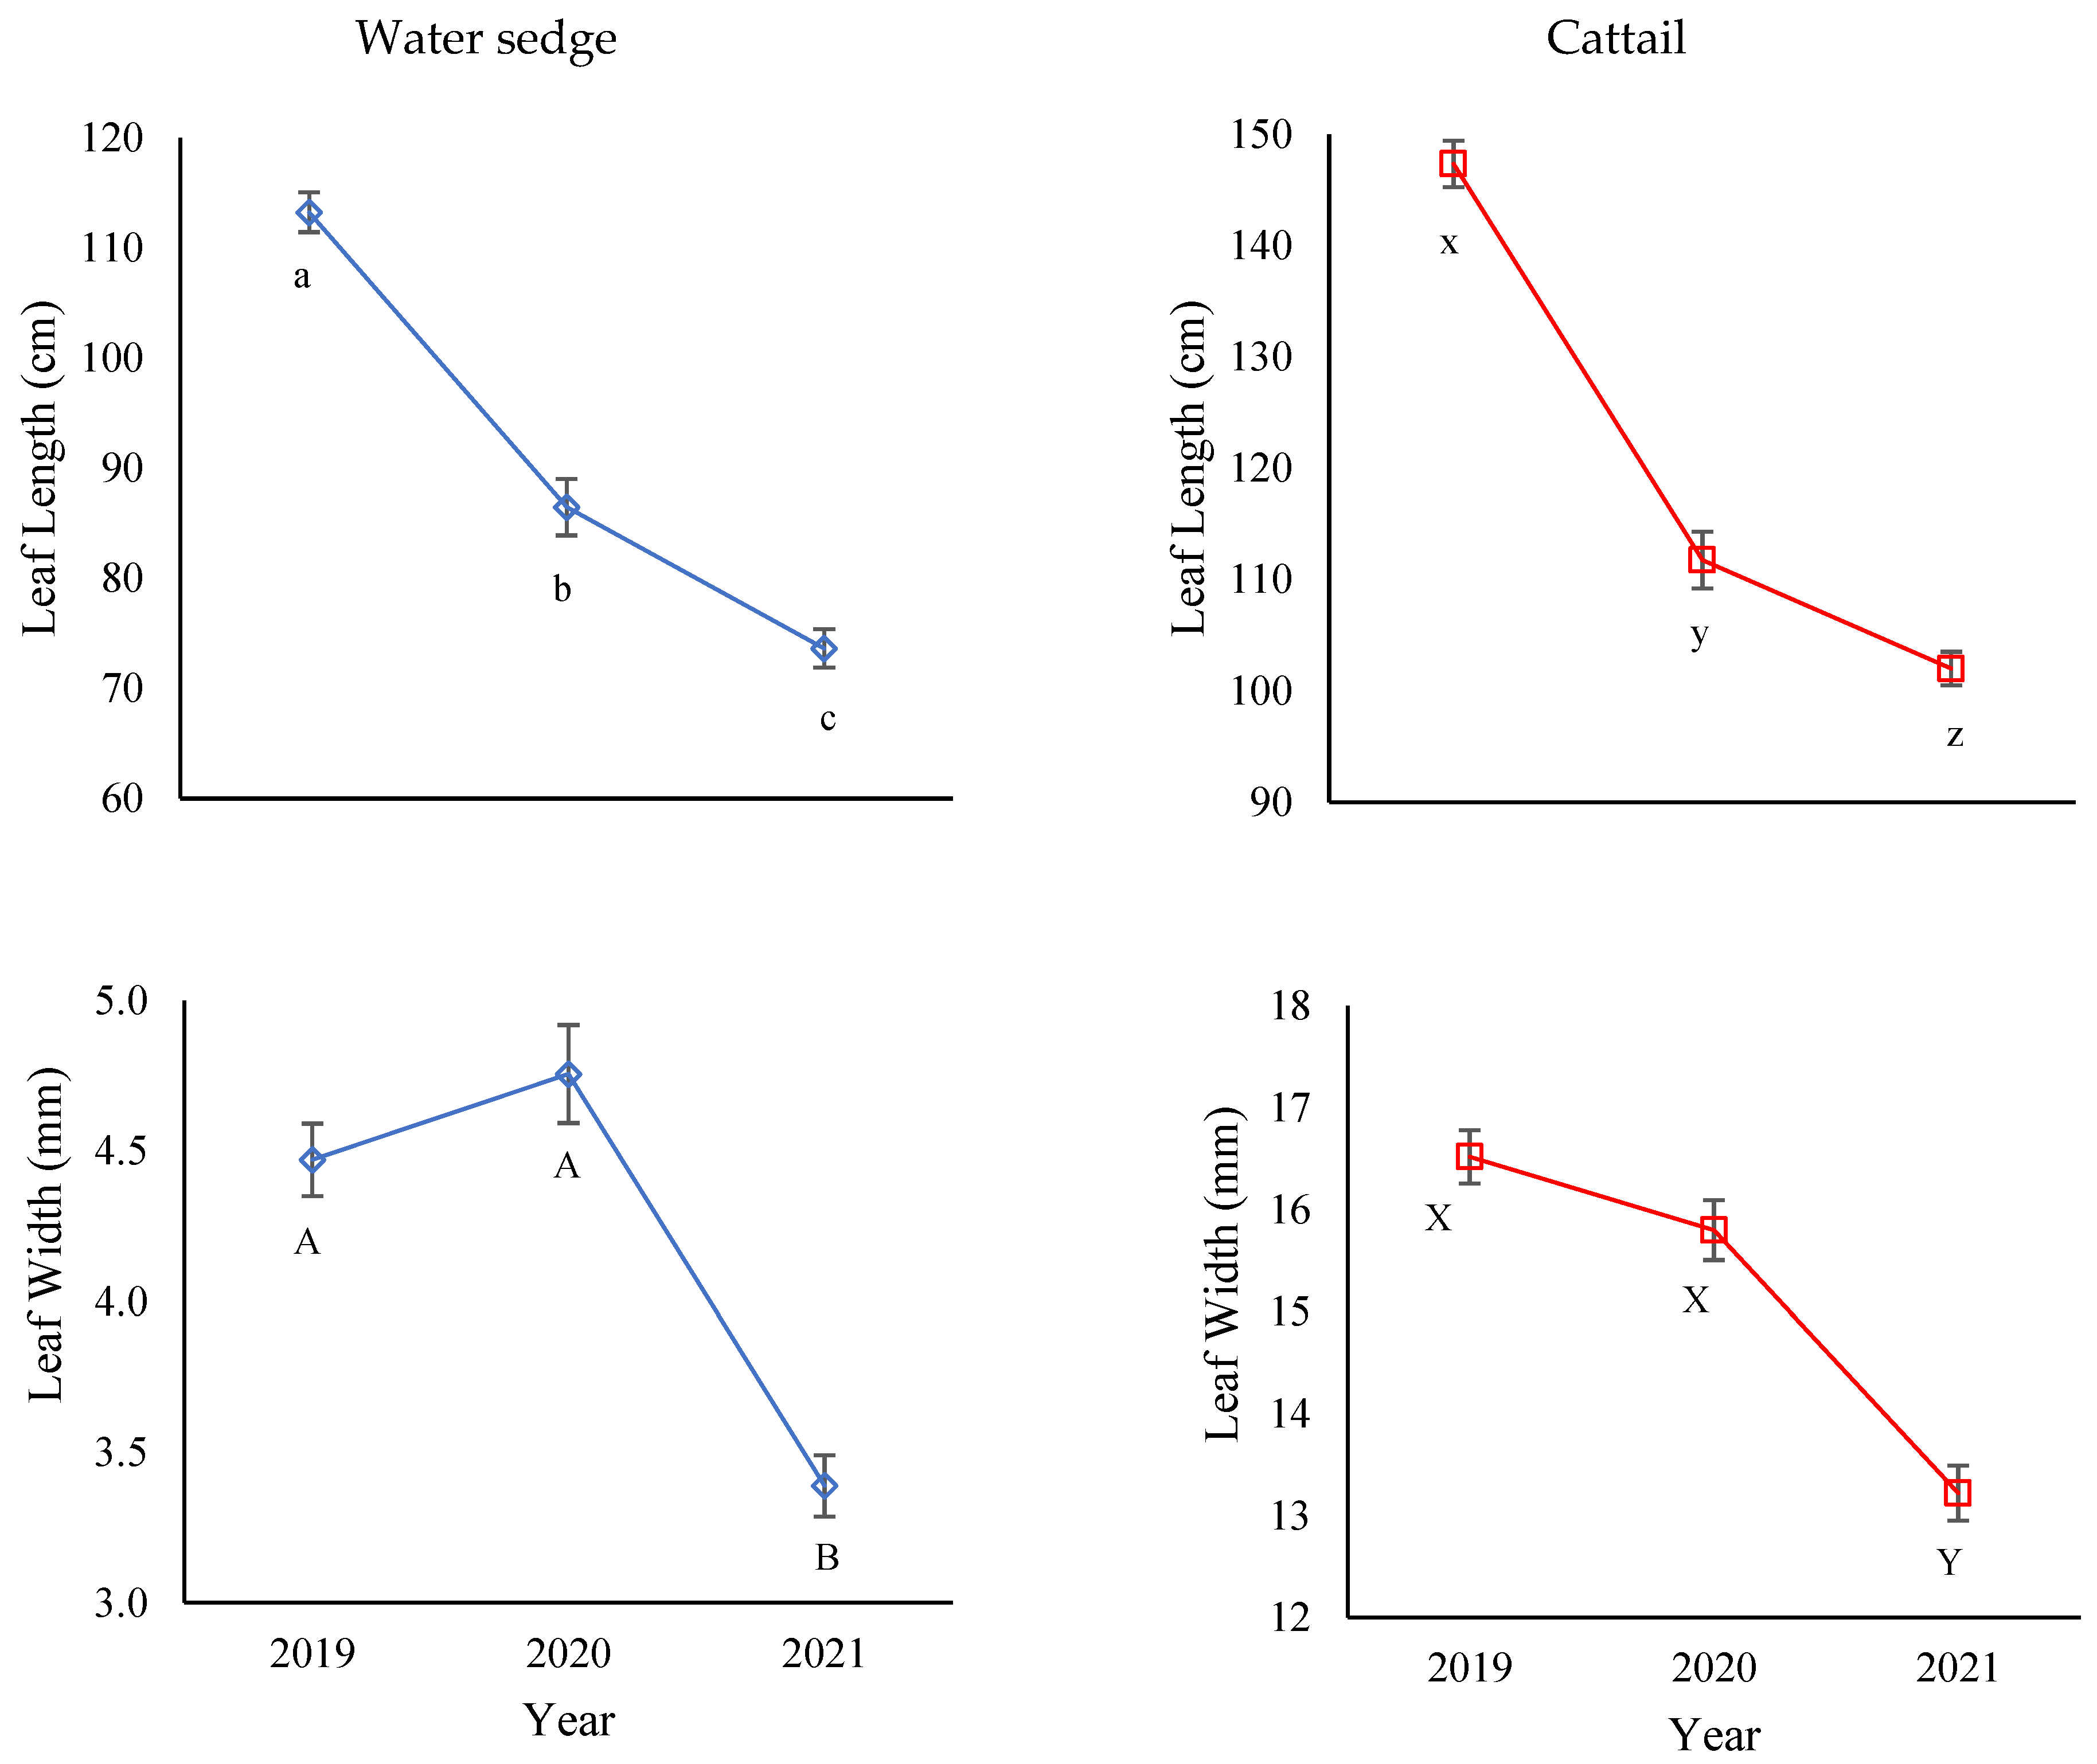
Figure 5 shows that leaf length of water sedge and cattail in the KTW consistently decreased over time (p < 0.0001), whereas a significant decrease in leaf width for water sedge and cattail occurred only in 2021. Data from three locations were pooled together because the effect of Location were not significant (α − 0.05) both for leaf length and leaf width of water sedge and cattail. Similar effects are reported in Mollard et al. [57] which showed that water sedge had shorter culm heights and leaf lengths when grown in OSPW compared to natural growth. Given the statistically significant reduction observed for both leaf length and width for water sedge and cattails, these measurements may be useful metrics of ecological health in treatment wetlands or as a phytotoxic response to OSPW exposure.
The effects of OSPW contaminants on wetland vegetation have been explored in a few studies. For example, Armstrong et al. [2] report a lowest observed adverse effects level of 30 mg/L of naphthenic acids (determined by LC/MS/MS) in OSPW on water uptake by cattail and common reed (Phragmites australis). However, only two treatment groups (30 mg/L and 60 mg/L) were tested, so the exact lower end of a toxicological threshold was not determined. Kamaluddin and Zwiazek [72] have demonstrated the effects of commercial naphthenic acids on aspen (Populus tremuloides) seedlings, showing that hydraulic conductance and stomatal conductance were significantly decreased after 3–5 weeks of root exposure. However, similarly, the lowest concentration tested was only 75 mg/L of naphthenic acids in a nutrient solution (concentration estimated based on commercial mixture, not confirmed by analysis) making it difficult to relate to the conditions of the KTW plants in this study. Armstrong et al. [73] report lower fresh weight gains and water uptake by common reed (P. australis) exposed to mature fine tailings from the oil sands region and show that higher concentrations of naphthenic acids are associated with lower fresh weight gains. However, even though growth was reduced, growth of the vegetation still occurred suggesting this wetland vegetation may still remain productive components of the wetland during OSPW treatment.
3.5. Species Vigor
Figure 6 shows plant vigor ratings in the KTW from 2016 to 2021. The results indicate that plant vigor is consistently rated above fair (vigor rating 2) across all years. Average vigor in 2020 and 2021 was 3.5 (sd 0.14) which illustrates plant health rated from ‘good’ (3) to ‘excellent’ (4). A plant vigor rating of 3 indicates that plant species size and color are slightly above average, and only minor chlorosis, necrosis, or yellowing (5 to 10%) are present [31]. The high measure of plant health in the KTW occurs despite perennial exposure to OSPW. Vigor ratings remain high even in 2021 when tailings pond OSPW was introduced to the KTW. The percentage of chlorosis and necrosis on plant tissue by species generally remained ≤1% in all years, aside from 2017 when some shrubs and graminoids were observed to have higher percentages (~3–6%) which coincides with a hot and dry year in 2017. Plant species that exhibited the higher percentages of necrosis in 2017 included rough hairgrass (Agrostis scabra), sloughgrass (Beckmannia syziganche), northern wheatgrass (Elymus lanceolatus), cattail, and water sedge.
The consistently high plant vigor ratings in the KTW suggests that the emergent vegetation do not show signs of adverse phytotoxicity from OSPW exposure. Improving plant vigor ratings may also reflect the dynamics of wetland ecosystems to adapt to environmental conditions. High plant vigor may persist as more tolerant species emerge, and more sensitive species are lost or replaced. These shifts in species composition also seem to be occurring at the community level with decreases in species richness and variation in community composition across years. The species and community appear adaptable to changes and highlight the resiliency of wetland vegetation and potential longevity of treatment wetlands for OSPW remediation.
The resiliency of wetland vegetation exposed to OSPW has also been demonstrated in Pouliot et al. [74] which found no signs of phytotoxicity in water sedge over two growing seasons following exposure to concentrations of naphthenic acids of 54 mg/L and concentrations of sodium of 569 mg/L in OSPW (methods of analysis not reported). This is consistent with our findings which provide little indication of any adverse phytotoxic effects on wetland vegetation at the concentration of naphthenic acids measured in OSPW in this study.
Further, Vitt et al. [75] found that functional and structural characteristics of water sedge did not change up to sodium concentrations of 1079 mg/L but suggests an effects threshold exists somewhere between 1079 and 2354 mg/L of sodium in OSPW. Therefore, at a concentration of TDS in OSPW of 1250 mg/L, it is unlikely that sodium concentrations are high enough in OSPW to affect functional or structural characteristics of water sedge in the wetland. Although, the higher concentration of TDS in 2019 may have affected the more sensitive species in the KTW leading to greater variability in overall plant vigor. The reduction in TDS concentration in the KTW in 2020 and the slight increase in average plant vigor ratings also suggest prolonged effects from high TDS concentrations is not likely. As a result, plant vigor ratings may not be a suitable ecological indicator among the ones measured in this study to identify potential phytotoxicity effects from OSPW exposure. However, continued monitoring of the KTW vegetation is needed to see if more chronic phytotoxic effects emerge following multiple years of exposure to tailings pond OSPW that is considered the most influenced by oil sands operations.
3.6. Effects of Water Level on Species Characteristics
Water depth was found to contribute significantly to several species’ characteristics in the KTW. Stem density and percent cover of water sedge decreased exponentially with increasing water depth (log(stem count per m2) = 4.73 − 0.045 * water depth, p < 0.001, R = 0.36; log(cover) = 3.59 − 0.04 * water depth, p < 0.001, R = 0.36) and stem density and percent cover of cattail increased exponentially with increasing water depth (log(stem count per m2) = 2.0 + 0.02 * water depth, p < 0.001, R = 0.28; log(cover) = 2.14 + 0.01 * water depth, p = 0.003, R = 0.17; Figure S4). Therefore, water sedge density and abundance were greater in shallower waters whereas cattail density and abundance were greater in deeper waters. This helps to explain some of the variability observed in community composition within the KTW and changes to the proportion of water sedge and cattails throughout the study. Interestingly, leaf length and leaf width of both water sedge and cattail exhibit a significant relationship with water depth; however, water sedge best fit a second degree quadratic relationship where maximum leaf length and width occurs at a water depth of 25–35 cm (p < 0.001; R2 (length) = 0.07; R2 (width) = 0.07), whereas cattail show a positive exponential relationship with water depth in the KTW (p < 0.002; R2 (length) = 0.05; R2 (width) = 0.07) (Figure S5). Therefore, increasing water depth may inhibit the growth of new water sedge and reduce density, but still provide adequate water and nutrients needed for existing plants to continue to grow and emerge from the water column up to a water depth of approximately 30 cm.
This correlation of water depth with stem counts and vegetation cover for water sedge and cattails is also observed when comparing data from the 1 × 1 m and 4 × 4 m plots. Since 1 × 1 m plots were placed mainly around the perimeter of the shallow cells and therefore within the shallow-water zones [33] and 4 × 4 m plots were placed in more central areas of the shallow cells in the deep-water zones, we capture vegetation data at two different water depths. As a result, the 4 × 4 m plots of vegetation cover show a decrease in water sedge in 2021 as water level increases, whereas the 1 × 1 m plots indicate stem counts of water sedge increase each year where water levels remain lowest in the shallow cells.
Morphological changes (phenotypic plasticity) can help emergent plants adapt to wide ranges of water table depths and seasonal fluctuations [76]. Similar to our results with water sedge, reed canary grass also exhibits phenotypic plasticity in response to water depth, producing fewer stems in deeper waters [61]. The change is coupled with a reduction in below-ground biomass, change in rooting structure, and potentially decreased nutrient absorption [63]. Cattails also have been shown to be less dense when water is deeper than 60 cm [76], which is 50% greater than the depths the in shallow cells at the KTW, but were also found to have longer and wider leaves in deeper waters [77] which is consistent with our findings.
Despite some significant relationships, water depth only explains ~3–13% of the proportion of the variance for stem count and cover by a single parameter best-fit regression analysis. This suggests that other variables or interactions are influencing the distribution of community vegetation in the KTW and are contributing to the unexplained variance between the species’ characteristics and water levels. The effects of OSPW are likely to contribute to the observed variability in stem count and percent cover between seasons. Morphological features can vary when plants are exposed to process-affected waters, as shown in water sedge that had reduced leaf length with increasing sodium concentrations [57]. In addition to water table depth, duration and frequency of water table fluctuations or high-water events can influence species composition, abundance, and distribution [61]; therefore, tracking water levels over the season (e.g., daily measures and volume of source water inputs) would improve our understanding of hydrologic dynamics that could affect treatment efficacy in the KTW.
4. Conclusions
The KTW offers novel insight into the application of treatment wetlands to better manage OSPW throughout the industry. Our assessment of wetland vegetation suggests ecological viability of wetland vegetation after continued exposure to OSPW from 2016–2021. Various sources of OSPW ranging from plant site runoff to fresh tailings pond OSPW presented a range of chemistries to the KTW and wetland vegetation. Only three plant species (cattail, common great bulrush, and small-fruited bulrush) were planted in the KTW in 2013. By 2016, 52 plant species were recorded in the KTW as a result of natural recruitment processes. From 2016 to 2021, a total of 100 different plant species have been identified in the KTW.
Cattail and water sedge dominate the shallow areas of the KTW, and some submerged aquatic vegetation has emerged in the KTW including small-leaf pondweed, hornwort, and northern watermilfoil. However, species richness has decreased since 2016 once OSPW began to be introduced into the KTW. This decrease in species richness is typical of constructed wetlands receiving industrial effluents. Low species richness suggests wetland maturation as the more tolerant species capable of adapting to environmental conditions and OSPW exposure persist. Water level in the KTW was also found to influence the density and cover of water sedge and cattails within the KTW where water sedge prefers lower water depths and cattails prefer higher water depths.
Plant vigor ratings have steadily increased in the KTW, and the wetland vegetation appear tolerant of OSPW contaminants. Therefore, not only does a multi-year exposure to OSPW not dramatically impact these ecological indicators of plant health, but our observations of plant vigor suggest plant health is actually improving. This continued maturation of the KTW ecosystem highlights the resiliency of wetland vegetation and potential durability of treatment wetlands for OSPW remediation.
Our assessment of wetland vegetation suggests that leaf length, leaf width, leaf area index, and species richness are strong indicators of macrophyte response to OSPW exposure. Stem count and plant vigor, while important indicators of wetland health and useful in vegetation assessments, may not be sensitive enough to observe toxicological effects of OSPW exposure and are therefore not strong ecological indicators in this scenario. Future assessments to monitor macrophyte health should focus on characteristics of vegetation growth such as leaf length and leaf width as ecological indicators in treatment wetlands. In addition, physiological characteristics (e.g., photosynthesis, evapotranspiration, leaf area index) of wetland vegetation may be helpful in future assessments to better monitor macrophyte health in treatment wetlands.
The dynamic nature of wetlands in response to changing environmental conditions and the highly variable OSPW chemistries throughout the industry supports the need for continued long-term monitoring of these systems. Our findings indicate that multiyear exposures to OSPW do not dramatically impact plant health in the KTW. Future work is needed to identify toxicity thresholds for water sedge and cattails, and to better understand the cumulative effects of OSPW contaminants. This will help to properly design and operate constructed treatment wetlands for a variety of applications but is especially important with complex wastewaters such as OSPW.
Supplementary Materials
The following supporting information can be downloaded at: https://www.mdpi.com/article/10.3390/w14223686/s1, Figure S1: Photos of the shallow areas at the Kearl Treatment Wetland; Figure S2: Overview of (4 × 4 m) vegetation plot locations; Figure S3: Overview of emergent plant growth (1 × 1 m) plot locations; Figure S4: Effects of water depth on species characteristics at the Kearl Treatment Wetland, 2019–2021; Figure S5: Leaf length and leaf width of water sedge and cattail vs. water depth in the Kearl Treatment Wetland, 2019–2021; Table S1: Definition of plant vigor ratings used in vegetation assessments at the KTW; Table S2: Water budget estimates from the KTW in each year of wetland operation; Table S3: Plant vigor ratings in the KTW, 2016–2021; Table S4: Stem density, leaf length and leaf width of water sedge and cattails in the shallow cells of the KTW, 2019–2021; Table S5: Water level (cm) in the shallow cells of the KTW, 2019–2021.
Author Contributions
Conceptualization, A.M.C. and A.B.; Methodology, A.M.C., A.B. and A.K.B.; Formal Analysis, A.M.C., A.B. and A.K.B.; Investigation, A.M.C. and A.K.B.; Resources, A.B.; Data Curation, A.M.C., A.B. and A.K.B.; Writing—Original Draft Preparation, A.M.C.; Writing—Review and Editing, A.B. and A.K.B.; Visualization, A.M.C.; Funding Acquisition, A.M.C. and A.B. All authors have read and agreed to the published version of the manuscript.
Funding
This research was funded by Imperial Oil Resources Limited.
Data Availability Statement
The data presented in this study are available in the Supplementary Material.
Acknowledgments
The authors greatly appreciate all the Mikisew Advisian Environmental staff who supported the operation and sampling of Kearl treatment wetland over the years.
Conflicts of Interest
A. M. Cancelli has received research grants from Imperial Oil Resources Limited. A. Bekele is an employee of Imperial Oil Resources Limited. A. Borkenhagen has been involved as a consultant with Imperial Oil Resources Limited.
References
- Miskimmin, B.; Fedorak, P.M.; Lauman, R.; Vinke, K. Oil Sands Water Toxicity: A Critical Review; Report No. 2010-089 (INT); Natural Resources Canada—CanmetENERGY: Devon, AB, Canada, 2010. [Google Scholar]
- Armstrong, S.A.; Headley, J.V.; Peru, K.M.; Germida, J.J. Phytotoxicity of oil sands naphthenic acids and dissipation from systems planted with emergent aquatic macrophytes. J. Environ. Sci. Health Part A 2007, 43, 36–42. [Google Scholar] [CrossRef] [PubMed]
- Bartlett, A.J.; Frank, R.A.; Gillis, P.L.; Parrott, J.L.; Marentette, J.R.; Brown, L.R.; Hewitt, L.M. Toxicity of naphthenic acids to invertebrates: Extracts from oil sands process-affected water versus commercial mixtures. Environ. Pollut. 2017, 227, 271–279. [Google Scholar] [CrossRef] [PubMed]
- Marentette, J.R.; Frank, R.A.; Bartlett, A.J.; Gillis, P.L.; Hewitt, L.M.; Peru, K.M.; Parrott, J.L. Toxicity of naphthenic acid fraction components extracted from fresh and aged oil sands process-affected waters, and commercial naphthenic acid mixtures, to fathead minnow (Pimephales promelas) embryos. Aquat. Toxicol. 2015, 164, 108–117. [Google Scholar] [CrossRef] [PubMed]
- Alberta Energy Regulator. Water Use Performance. 2020. Available online: https://www.aer.ca/protecting-what-matters/holding-industry-accountable/industry-performance/oil-sands-mining-water-use (accessed on 4 March 2020).
- Martin, J.W. The challenge: Safe release and reintegration of oil sands process-affected water. Environ. Toxicol. Chem. 2015, 34, 2682. [Google Scholar] [CrossRef] [Green Version]
- Ajaero, C.; Peru, K.M.; Simair, M.; Friesen, V.; O’Sullivan, G.; Hughes, S.A.; Headley, J.V. Fate and behavior of oil sands naphthenic acids in a pilot-scale treatment wetland as characterized by negative-ion electrospray ionization Orbitrap mass spectrometry. Sci. Total Environ. 2018, 631, 829–839. [Google Scholar] [CrossRef]
- Cancelli, A.M.; Gobas, F.A.P.C. Treatment of Polycyclic Aromatic Hydrocarbons in Oil Sands Process-Affected Water with a Surface Flow Treatment Wetland. Environments 2020, 7, 64. [Google Scholar] [CrossRef]
- Cancelli, A.M.; Gobas, F.A.P.C. Treatment of naphthenic acids in oil sands process-affected waters with a surface flow treatment wetland: Mass removal, half-life, and toxicity-reduction. Environ. Res. 2022, 213, 113755. [Google Scholar] [CrossRef]
- McQueen, A.D.; Hendrikse, M.; Gaspari, D.P.; Kinley, C.M.; Rodgers, J.H.; Castle, J.W. Performance of a hybrid pilot-scale constructed wetland system for treating oil sands process-affected water from the Athabasca oil sands. Ecol. Eng. 2017, 102, 152–165. [Google Scholar] [CrossRef]
- Hendrikse, M.; Gaspari, D.P.; McQueen, A.D.; Kinley, C.M.; Calomeni, A.J.; Geer, T.D.; Castle, J.W. Treatment of oil sands process-affected waters using a pilot-scale hybrid constructed wetland. Ecol. Eng. 2018, 115, 45–57. [Google Scholar] [CrossRef]
- Kadlec, R.H.; Wallace, S.D. Treatment Wetlands; CRC Press: Boca Raton, FL, USA, 2008. [Google Scholar]
- Thullen, J.S.; Sartoris, J.J.; Nelson, S.M. Managing vegetation in surface-flow wastewater-treatment wetlands for optimal treatment performance. Ecol. Eng. 2005, 25, 583–593. [Google Scholar] [CrossRef]
- Marzocchi, U.; Benelli, S.; Larsen, M.; Bartoli, M.; Glud, R.N. Spatial heterogeneity and short-term oxygen dynamics in the rhizosphere of Vallisneria spiralis: Implications for nutrient cycling. Freshw. Biol. 2019, 64, 532–543. [Google Scholar] [CrossRef]
- Toscano, A.; Langergraber, G.; Consoli, S.; Cirelli, G.L. Modelling pollutant removal in a pilot-scale two-stage subsurface flow constructed wetlands. Ecol. Eng. 2009, 35, 281–289. [Google Scholar] [CrossRef]
- Zhao, R.; Cheng, J.; Yuan, Q.; Chen, Y.; Kim, Y. Contributions of emergent vegetation acting as a substrate for biofilms in a free water surface constructed wetland. Membr. Water Treat. 2019, 10, 57–65. [Google Scholar] [CrossRef]
- Karathanasis, A.D.; Potter, C.L.; Coyne, M.S. Vegetation effects on fecal bacteria, BOD, and suspended solid removal in constructed wetlands treating domestic wastewater. Ecol. Eng. 2003, 20, 157–169. [Google Scholar] [CrossRef]
- Shelef, O.; Gross, A.; Rachmilevitch, S. Role of Plants in a Constructed Wetland: Current and New Perspectives. Water 2013, 5, 405–419. [Google Scholar] [CrossRef]
- Alberts, M.E.; Wong, J.; Hindle, R.; Degenhardt, D.; Krygier, R.; Turner, R.J.; Muench, D.G. Detection of naphthenic acid uptake into root and shoot tissues indicates a direct role for plants in the remediation of oil sands process-affected water. Sci. Total Environ. 2021, 795, 148857. [Google Scholar] [CrossRef]
- Cancelli, A.M.; Gobas, F.A.P.C.; Wang, Q.; Kelly, B.C. Development and evaluation of a mechanistic model to assess the fate and removal efficiency of hydrophobic organic contaminants in horizontal subsurface flow treatment wetlands. Water Res. 2019, 151, 183–192. [Google Scholar] [CrossRef]
- Bendell-Young, L.I.; Bennett, K.E.; Crowe, A.; Kennedy, C.J.; Kermode, A.R.; Moore, M.M.; Plant, A.L.; Wood, A. Ecological characteristics of wetlands receiving an industrial effluent. Ecol. Appl. 2000, 10, 310–322. [Google Scholar] [CrossRef]
- Jivraj, M.N.; MacKinnon, M.; Fung, B. Naphthenic Acid Extraction and Quantitative Analysis with FT-IR Spectroscopy. In Syncrude Analytical Manuals; Syncrude Canada Ltd.: Edmonton, AB, USA, 1995. [Google Scholar]
- Holowenko, F.M.; MacKinnon, M.D.; Fedorak, P.M. Characterization of naphthenic acids in oil sands wastewaters by gas chromatography-mass spectrometry. Water Res. 2002, 36, 2843–2855. [Google Scholar] [CrossRef]
- Leung, S.S.; MacKinnon, M.D.; Smith, R.E.H. The ecological effects of naphthenic acids and salts on phytoplankton from the Athabasca oil sands region. Aquat. Toxicol. 2003, 62, 11–26. [Google Scholar] [CrossRef]
- Hughes, S.A.; Huang, R.; Mahaffey, A.; Chelme-Ayala, P.; Klamerth, N.; Meshref, M.N.A.; Ibrahim, M.D.; Brown, C.; Peru, K.M.; Headley, J.V.; et al. Comparison of methods for determination of total oil sands-derived naphthenic acids in water samples. Chemosphere 2017, 187, 376–384. [Google Scholar] [CrossRef] [PubMed]
- Woudneh, M.B.; Coreen Hamilton, M.; Benskin, J.P.; Wang, G.; McEachern, P.; Cosgrove, J.R. A novel derivatization-based liquid chromatography tandem mass spectrometry method for quantitative characterization of naphthenic acid isomer profiles in environmental waters. J. Chromatogr. A 2013, 1293, 36–43. [Google Scholar] [CrossRef] [PubMed]
- Collier, T.K.; Anulacion, B.F.; Arkoosh, M.R.; Dietrich, J.P.; Incardona, J.P.; Johnson, L.L.; Myers, M.S. Effects on Fish of Polycyclic Aromatic Hydrocarbons (PAHs) and Naphthenic Acid Exposures. Fish Physiol. 2013, 33, 195–255. [Google Scholar]
- McQueen, A.D.; Kinley, C.M.; Hendrikse, M.; Gaspari, D.P.; Calomeni, A.J.; Iwinski, K.J.; Castle, J.W.; Haakensen, M.C.; Peru, K.M.; Headley, J.V.; et al. A risk-based approach for identifying constituents of concern in oil sands process-affected water from the Athabasca Oil Sands region. Chemosphere 2017, 173, 340–350. [Google Scholar] [CrossRef]
- Shotyk, W.; Bicalho, B.; Cuss, C.; Donner, M.; Grant-Weaver, I.; Javed, M.B.; Noernberg, T. Trace elements in the Athabasca Bituminous Sands: A geochemical explanation for the paucity of environmental contamination by chalcophile elements. Chem. Geol. 2021, 581, 120392. [Google Scholar] [CrossRef]
- Government of Alberta. Canadian Climate Normals 1981–2010 Station Data. Fort McMurray, Alberta Station. 2020. Available online: https://climate.weather.gc.ca/climate_normals/index_e.html (accessed on 4 March 2020).
- Alberta Climate Information Service. Current and Historical Alberta Weather Station Data Viewer. Mildred Lake Weather Station. Data Provided by Alberta Agriculture and Forestry, Alberta Environment and Parks and Environment Canada. Government of Alberta. 2020. Available online: https://acis.alberta.ca/weather-data-viewer.jsp (accessed on 1 November 2016).
- Alberta Environment and Sustainable Resources Development. Ecological Land Survey Site Description Manual, 2nd ed.; Resource Data Branch, Strategic Corporate Services Division; Alberta Sustainable Resource Development: Edmonton, AB, USA, 2003. [Google Scholar]
- Stewart, R.E.; Kantrud, H.A. Classification of Natural Ponds and Lakes in the Glaciated Prairie Region; Resource Publication; US Bureau of Sport Fisheries and Wildlife: Washington, DC, USA, 1971; pp. 57–92.
- JMP®, Version 16; SAS Institute Inc.: Cary, NC, USA, 1989–2021.
- Hummel, R.M.; Claassen, E.A.; Wolfinger, R.D. JMP for Mixed Models; SAS Institute: Cary, NC, USA, 2021. [Google Scholar]
- Government of Alberta. Environmental Quality Guidelines for Alberta Surface Waters; Water Policy Branch, Alberta Environment and Parks: Edmonton, AB, USA, 2018.
- CCREM (Canadian Council of Resource and Environment Ministers). Canadian Water Quality Guidelines; Prepared by the Task Force on Water Quality Guidelines; CCREM: Winnipeg, MB, Canada, 1987.
- Canadian Council of Ministers of the Environment. Canadian water quality guidelines for the protection of aquatic life, Molybdenum. In Canadian Environmental Quality Guidelines; Canadian Council of Ministers of the Environment: Winnipeg, MB, Canada, 1999. [Google Scholar]
- Aihemaiti, A.; Jiang, J.; Gao, Y.; Meng, Y.; Zou, Q.; Yang, M.; Xu, Y.; Han, S.; Yan, W.; Tuerhong, T. The effect of vanadium on essential element uptake of Setaria viridis seedlings. J. Environ. Manag. 2019, 237, 399–407. [Google Scholar] [CrossRef] [PubMed]
- Toor, N.S.; Franz, E.D.; Fedorak, P.M.; MacKinnon, M.D.; Liber, K. Degradation and aquatic toxicity of naphthenic acids in oil sands process-affected waters using simulated wetlands. Chemosphere 2013, 90, 449–458. [Google Scholar] [CrossRef]
- Mahaffey, A.; Dubé, M. Review of the composition and toxicity of oil sands process-affected water. Environ. Rev. 2017, 25, 97–114. [Google Scholar] [CrossRef]
- Galinato, M.I.; Van Der Valk, A.G. Seed germination traits of annuals and emergents recruited during drawdowns in the Delta Marsh, Manitoba, Canada. Aquat. Bot. 1986, 26, 89–102. [Google Scholar] [CrossRef]
- Trites, M.; Bayley, S.E. Vegetation communities in continental boreal wetlands along a salinity gradient: Implications for oil sands mining reclamation. Aquat. Bot. 2009, 91, 27–39. [Google Scholar] [CrossRef]
- Headley, J.V.; Crosley, B.; Conly, F.M.; Quagraine, E.K. The Characterization and Distribution of Inorganic Chemicals in Tributary Waters of the Lower Athabasca River, Oilsands Region, Canada. J. Environ. Sci. Health Part A 2005, 40, 1–27. [Google Scholar] [CrossRef] [PubMed]
- Klomjek, P.; Nitisoravut, S. Constructed treatment wetland: A study of eight plant species under saline conditions. Chemosphere 2005, 58, 585–593. [Google Scholar] [CrossRef] [PubMed]
- Lai, J.W.S.; Pinto, L.J.; Kiehlmann, E.; Bendell-Young, L.I.; Moore, M.M. Factors that affect the degradation of naphthenic acids in oil sands wastewater by indigenous microbial communities. Environ. Toxicol. Chem. 1996, 15, 1482–1491. [Google Scholar] [CrossRef]
- Hicks, K.; Scrimgeour, G. Summary of Enhanced Monitoring of the Lower Athabasca River; Government of Alberta, Ministry of Environment and Parks, 2018. Available online: open.alberta.ca/publications/9781460145371 (accessed on 10 April 2022)ISBN 978-1-4601-4537-1.
- Allen, E.W. Process water treatment in Canada’s oil sands industry: II. A review of emerging technologies. J. Environ. Eng. Sci. 2008, 7, 499–524. [Google Scholar] [CrossRef]
- Regional Aquatics Monitoring Program. Query Water Quality Data. RAMP Water Quality Data Report for all Sites from 1997 to 2009. 2022. Available online: http://www.ramp-alberta.org/data/Water/waterquality/water.aspx (accessed on 15 March 2022).
- Bhatia, M.; Goyal, D. Analyzing Remediation Potential of Wastewater Through Wetland Plants: A Review. Environ. Prog. Sustain. Energy 2013, 33, 9–27. [Google Scholar] [CrossRef]
- Leguizamo, M.A.; Gomez, W.D.F.; Sarmiento, M. Native herbaceous plant species with potential use in phytoremediation of heavy metals, spotlight on wetlands—A review. Chemosphere 2017, 168, 1230–1247. [Google Scholar] [CrossRef]
- Smith, S.G. Schoenoplectus. Flora of North America Association. Available online: http://floranorthamerica.org/Schoenoplectus (accessed on 10 April 2022).
- Allen, L.; Kershaw, L. Vascular Flora of Alberta: An Illustrated Guide; Amazon Digital Services LLC-KDP Print US. 2020. Available online: https://www.amazon.com/Vascular-Flora-Alberta-Illustrated-Guide/dp/1777244102 (accessed on 10 April 2022).
- Weisner, S.E.; Thiere, G. Effects of vegetation state on biodiversity and nitrogen retention in created wetlands: A test of the biodiversity–ecosystem functioning hypothesis. Freshw. Biol. 2010, 55, 387–396. [Google Scholar] [CrossRef]
- Hadad, H.R.; Maine, M.A.; Bonetto, C.A. Macrophyte growth in a pilot-scale constructed wetland for industrial wastewater treatment. Chemosphere 2006, 63, 1744–1753. [Google Scholar] [CrossRef]
- Wang, Q.; Kelly, B.C. Occurrence, distribution and bioaccumulation behaviour of hydrophobic organic contaminants in a large-scale constructed wetland in Singapore. Chemosphere 2017, 183, 257–265. [Google Scholar] [CrossRef]
- Mollard, F.P.O.; Roy, M.C.; Frederick, K.; Foote, L. Growth of the dominant macrophyte Carex aquatilis is inhibited in oil sands affected wetlands in Northern Alberta, Canada. Ecol. Eng. 2012, 38, 11–19. [Google Scholar] [CrossRef]
- AU Crowe, B Han, AR Kermode, LI Bendell-Young, and AL Plant, Effects of oil sands effluent on cattail and clover: Photosynthesis and the level of stress proteins. Environ. Pollut. 2001, 113, 311–322. [CrossRef]
- Simair, M.C.; Parrott, J.L.; le Roux, M.; Gupta, V.; Frank, R.A.; Peru, K.M.; Headley, J.V. Treatment of oil sands process affected waters by constructed wetlands: Evaluation of designs and plant types. Sci. Total Environ. 2021, 772, 145508. [Google Scholar] [CrossRef] [PubMed]
- Crowe, A.U.; Plant, A.L.; Kermode, A.R. Effects of an industrial effluent on plant colonization and on the germination and post-germinative growth of seeds of terrestrial and aquatic plant species. Environ. Pollut. 2002, 117, 179–189. [Google Scholar] [CrossRef]
- Vretare, V.; Weisner, S.E.; Strand, J.A.; Granéli, W. Phenotypic plasticity in Phragmites australis as a functional response to water depth. Aquat. Bot. 2001, 69, 127–145. [Google Scholar] [CrossRef]
- Kemp, W.M.; Batleson, R.; Bergstrom, P.; Carter, V.; Gallegos, C.L.; Hunley, W.; Karrh, L.; Koch, E.W.; Landwehr, J.M.; Moore, K.A.; et al. Habitat requirements for submerged aquatic vegetation in Chesapeake Bay: Water quality, light regime, and physical-chemical factors. Estuaries 2004, 27, 363–377. [Google Scholar] [CrossRef]
- Rooney, R.C.; Bayley, S.E. Setting reclamation targets and evaluating progress: Submersed aquatic vegetation in natural and post-oil sands mining wetlands in Alberta, Canada. Ecol. Eng. 2011, 37, 569–579. [Google Scholar] [CrossRef]
- Whitehouse, H.E.; Bayley, S.E. Vegetation patterns and biodiversity of peatland plant communities surrounding mid-boreal wetland ponds in Alberta, Canada. Can. J. Bot. 2005, 83, 621–637. [Google Scholar] [CrossRef]
- Narayan, D.; Agrawal, M.; Pandey, J.; Singh, J. Changes in vegetation characteristics downwind of an aluminum factory in India. Ann. Bot. 1994, 73, 557–565. [Google Scholar] [CrossRef]
- Brisson, J.; Chazarenc, F. Maximizing pollutant removal in constructed wetlands: Should we pay more attention to macrophyte species selection? Sci. Total Environ. 2009, 407, 3923–3930. [Google Scholar] [CrossRef]
- Taylor, C.R.; Hook, P.B.; Stein, O.R.; Zabinski, C.A. Seasonal effects of 19 plant species on COD removal in subsurface treatment wetland microcosms. Ecol. Eng. 2011, 37, 703–710. [Google Scholar] [CrossRef] [Green Version]
- Terry, N.; Banuelos, G.S. Phytoremediation of Contaminated Soil and Water, 1st ed.; CRC Press: Boca Raton, FL, USA, 2000. [Google Scholar]
- Geng, Y.; Ge, Y.; Luo, B.; Chen, Z.; Min, Y.; Schmid, B.; Chang, J. Plant diversity increases N removal in constructed wetlands when multiple rather than single N processes are considered. Ecol. Appl. 2019, 29, e01965. [Google Scholar] [CrossRef]
- Griffiths, L.N.; Haupt, T.N.; Zhang, L.; Mitsch, W.J. Role of emergent and submerged vegetation and algal communities on nutrient retention and management in a subtropical urban stormwater treatment wetland. Wetl. Ecol. Manag. 2021, 29, 245–264. [Google Scholar] [CrossRef]
- Haakensen, M.; Pittet, V.; Spacil, M.M.; Castle, J.W.; Rodgers, J.H., Jr. Key aspects for successful design and implementation of passive water treatment systems. J. Environ. Solut. Oil Gas Min. 2015, 1, 59–81. [Google Scholar] [CrossRef]
- Kamaluddin, M.; Zwiazek, J.J. Naphthenic acids inhibit root water transport, gas exchange and leaf growth in aspen (Populus tremuloides) seedlings. Tree Physiol. 2002, 22, 1265–1270. [Google Scholar] [CrossRef] [PubMed] [Green Version]
- Armstrong, S.A.; Headley, J.V.; Peru, K.M.; Mikula, R.J.; Germida, J. Phytotoxicity and naphthenic acid dissipation from oil sands fine tailings treatments planted with the emergent macrophyte Phragmites australis. J. Environ. Sci. Health Part A 2010, 45, 1008–1016. [Google Scholar] [CrossRef] [PubMed]
- Pouliot, R.; Rochefort, L.; Graf, M.D. Impacts of oil sands process water on fen plants: Implications for plant selection in required reclamation projects. Environ. Pollut. 2012, 167, 132–137. [Google Scholar] [CrossRef]
- Vitt, D.H.; Glaeser, L.C.; House, M.; Kitchen, S.P. Structural and functional responses of Carex aquatilis to increasing sodium concentrations. Wetl. Ecol. Manag. 2020, 28, 753–763. [Google Scholar] [CrossRef]
- Grace, J.B. Effects of water depth on Typha latifolia and Typha domingensis. Am. J. Bot. 1989, 76, 762–768. [Google Scholar] [CrossRef]
- Grace, J.B.; Wetzel, R.G. Niche differentiation between two rhizomatous plant species: Typha latifolia and Typha angustifolia. Can. J. Bot. 1982, 60, 46–57. [Google Scholar] [CrossRef]
Figure 1.
Average temperature range (bars; minimum, average, maximum; °C) and total rainfall (line; mm) for May–September 2016–2021 recorded at the Kearl Lake Weather Station. The 30-year climate normals (1981–2010) at the Fort McMurray station are shown (right).
Figure 1.
Average temperature range (bars; minimum, average, maximum; °C) and total rainfall (line; mm) for May–September 2016–2021 recorded at the Kearl Lake Weather Station. The 30-year climate normals (1981–2010) at the Fort McMurray station are shown (right).

Figure 2.
Average percent cover of species (a) and vegetation type (b) in the shallow cells of the Kearl Treatment Wetland from 2016–2021. Total percent covers may add up to greater than 100% where layers of (vascular and non-vascular) vegetation overlap.
Figure 2.
Average percent cover of species (a) and vegetation type (b) in the shallow cells of the Kearl Treatment Wetland from 2016–2021. Total percent covers may add up to greater than 100% where layers of (vascular and non-vascular) vegetation overlap.

Figure 3.
Vegetation plot species richness in the shallow cells of the Kearl Treatment Wetland, 2016–2021. Boxes represent 1st, 2nd, and 3rd quartiles. Whiskers represent minimum and maximum.
Figure 3.
Vegetation plot species richness in the shallow cells of the Kearl Treatment Wetland, 2016–2021. Boxes represent 1st, 2nd, and 3rd quartiles. Whiskers represent minimum and maximum.

Figure 4.
Mean stem counts for water sedge and cattail per 1 m2 plot observed in the shallow cells of the Kearl Treatment Wetland in 2019–2021. Error bars represent standard deviations (n = 18) for each species, each year.
Figure 4.
Mean stem counts for water sedge and cattail per 1 m2 plot observed in the shallow cells of the Kearl Treatment Wetland in 2019–2021. Error bars represent standard deviations (n = 18) for each species, each year.

Figure 5.
Leaf length (cm) and leaf width (mm) of water sedge and cattail in shallow cells over time (n = 18) in the KTW from 2019–2021. Means within each figure with the same letter are not significantly different (Tukey’s test, α = 0.05).
Figure 5.
Leaf length (cm) and leaf width (mm) of water sedge and cattail in shallow cells over time (n = 18) in the KTW from 2019–2021. Means within each figure with the same letter are not significantly different (Tukey’s test, α = 0.05).

Figure 6.
Average plant vigor ratings for all species assessed in the shallow cells at the KTW from 2016 to 2021.
Figure 6.
Average plant vigor ratings for all species assessed in the shallow cells at the KTW from 2016 to 2021.


Table 1.
Water quality parameters for OSPW in the Kearl Treatment Wetland from samples collected prior to the vegetation assessments in 2016–2021. Standard deviation in brackets where applicable. Runoff—plant site runoff from an overburden storage area; DPW—Drainage Pond Water; TPW—Tailings Pond Water. TM—Total Metals, TDM—Total Dissolved Metals, PHC—Petroleum Hydrocarbon, NA—naphthenic acid, TDS—Total Dissolved Solids, TKN—Total Kjedahl Nitrogen, TP—Total Phosphorus, Ortho-P—orthophosphate, SC—Specific Conductivity, DO—Dissolved Oxygen.
| Laboratory Measurements | Field Measurements | ||||||||||||||
|---|---|---|---|---|---|---|---|---|---|---|---|---|---|---|---|
| Year | OSPW Source | ΣTM | ΣTDM | PHCs | NAs | TDS | TKN | TP | Ortho-P | pH | SC | Turbidity | DO | ||
| ug/L | ug/L | ug/L | mg/L | mg/L | mg/L | mg/L | mg/L | n | -- | µS/cm | NTU | mg/L | n | ||
| 2016 | Runoff | 4.65 | 3.83 | <500 | <2.0 a | 520 | 0.93 | 0.029 | -- | 1 | 8.2 | 750 | 11 | -- | 0 * |
| 2017 | Runoff | 6.67 (2.54) | 6.55 (2.53) | 55 | 3.1 a (0.87) | 610 (99) | 0.47 | 0.008 (0.002) | 0.006 (0.006) | 2 | 7.9 (0.04) | 883 (101) | 0.84 (0.14) | 4.83 (0.37) | 2 |
| 2018 | DPW | 5.4 | 4.4 | 150 | 19.7 b | 560 | 0.66 | 0.013 | 0.003 | 1 | 7.0 | 1343 | 65.6 | 8.02 | 1 |
| 2019 | DPW | 17.7 (19.0) | 17.4 (19.9) | 45 | 20.7 b (0.28) | 1250 (58) | 0.59 | 0.007 (0.005) | 0.004 (0.002) | 4 | 7.5 (0.4) | 1515 (280) | 19.6 (6.8) | 7.76 (1.76) | 10 |
| 2020 | † | 5.9 | 5.1 | <500 | <2.0 a | 1000 | 0.71 | 0.004 | -- | 1 | 7.8 | 1118 | 1.0 | 7.46 | 1 |
| 2021 | TPW | 46 (37) | 40.3 (38) | 4328 (3307) | 47.6 b (8.2) | 858 (36) | 0.94 | 0.022 (0.005) | 0.005 (0.003) | 4 | 8.0 (0.2) | 1226 (72) | 10.2 (1.5) | 7.37 (1.8) | 4 |
† No OSPW was introduced into the KTW in 2020, * 2016 field measurements not available. Data taken from laboratory measurements of OSPW samples—data not available; no samples collected prior to vegetation assessment, <—concentrations not detected at laboratory method detection limits, a—concentration of naphthenic acids measured by FT-IR, b—concentration of naphthenic acids measured by LC/MS/MS.
Publisher’s Note: MDPI stays neutral with regard to jurisdictional claims in published maps and institutional affiliations. |
© 2022 by the authors. Licensee MDPI, Basel, Switzerland. This article is an open access article distributed under the terms and conditions of the Creative Commons Attribution (CC BY) license (https://creativecommons.org/licenses/by/4.0/).
Share and Cite
MDPI and ACS Style
Cancelli, A.M.; Borkenhagen, A.K.; Bekele, A. A Vegetation Assessment of the Kearl Treatment Wetland following Exposure to Oil Sands Process-Affected Water. Water 2022, 14, 3686. https://doi.org/10.3390/w14223686
AMA Style
Cancelli AM, Borkenhagen AK, Bekele A. A Vegetation Assessment of the Kearl Treatment Wetland following Exposure to Oil Sands Process-Affected Water. Water. 2022; 14(22):3686. https://doi.org/10.3390/w14223686
Chicago/Turabian StyleCancelli, Alexander M., Andrea K. Borkenhagen, and Asfaw Bekele. 2022. "A Vegetation Assessment of the Kearl Treatment Wetland following Exposure to Oil Sands Process-Affected Water" Water 14, no. 22: 3686. https://doi.org/10.3390/w14223686
Note that from the first issue of 2016, this journal uses article numbers instead of page numbers. See further details here.