
Statistical Analysis of the Potential of Landslides Induced by Combination between Rainfall and Earthquakes
 ,
, 
Abstract
:1. Introduction
2. Research Methods
2.1. RF
2.2. Texture Analysis
2.3. Accuracy Assessment
2.4. Receiver Operating Characteristic Curve
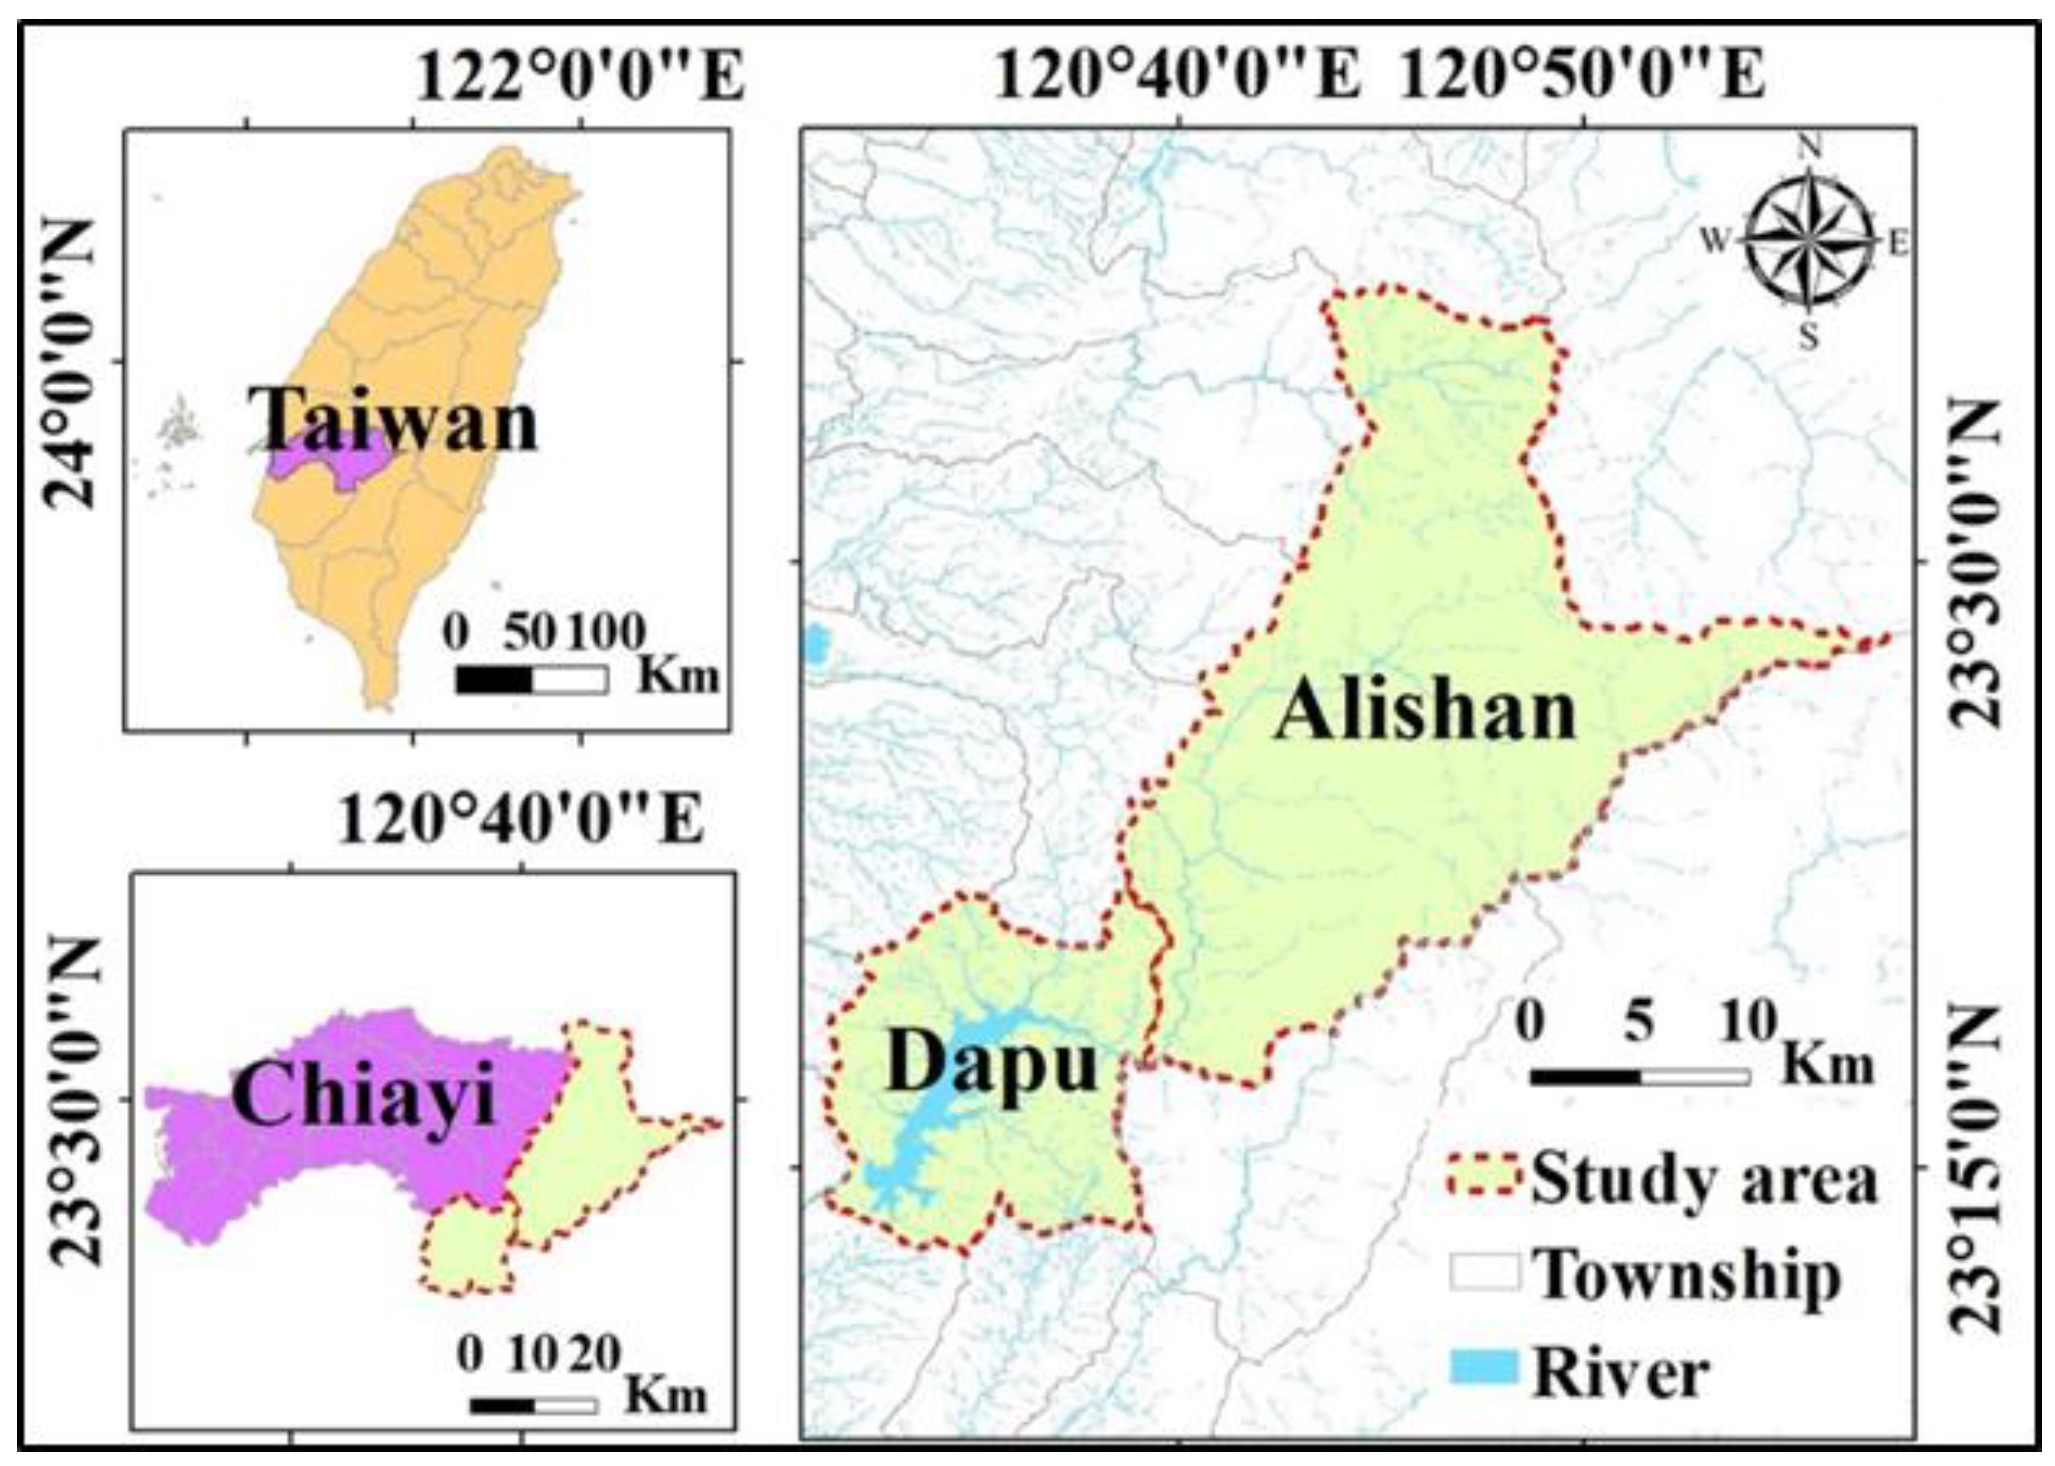
3. Study Areas
4. Potential of the Induction of Landslides by the Interaction between Rainfall and Earthquakes
4.1. Interpretation and Classification of Satellite Images before and after Rainfall or Earthquakes in the Study Area and Extraction of Landslide Data
4.2. Selection of Landslide Hazard Factors
4.2.1. Natural Environmental Factors
- Elevation
- B.
- Slope
- C.
- Aspect
- D.
- Distance from the river
- E.
- Geology
- F.
- Distance from the fault
4.2.2. Disturbance Factor of Slope Land Utilization
4.2.3. Rain Trigger Factors
4.2.4. Earthquake Trigger Factors
4.3. Weight Analysis of Hazard-Causing Factors
4.4. Establishment and Discussion of Hazard Indicators of the Interactive Correlation between Rainfall- and Earthquake-Induced Landslides
4.4.1. Establishment of Hazard Indicators of Interaction between Rainfall and Earthquakes
- F(TR): Standardized values of rainfall factors in each basic grid
- F(TE): Standardized values of seismic factors in each basic grid
- CR: Estimated score value for a single rainfall-induced landslide
- CE: Estimated score value for a single earthquake-induced landslide
- CRE: Score value calculated for a postrainfall earthquake-induced landslide
- CER: Score value calculated for a postearthquake rainfall-induced landslide
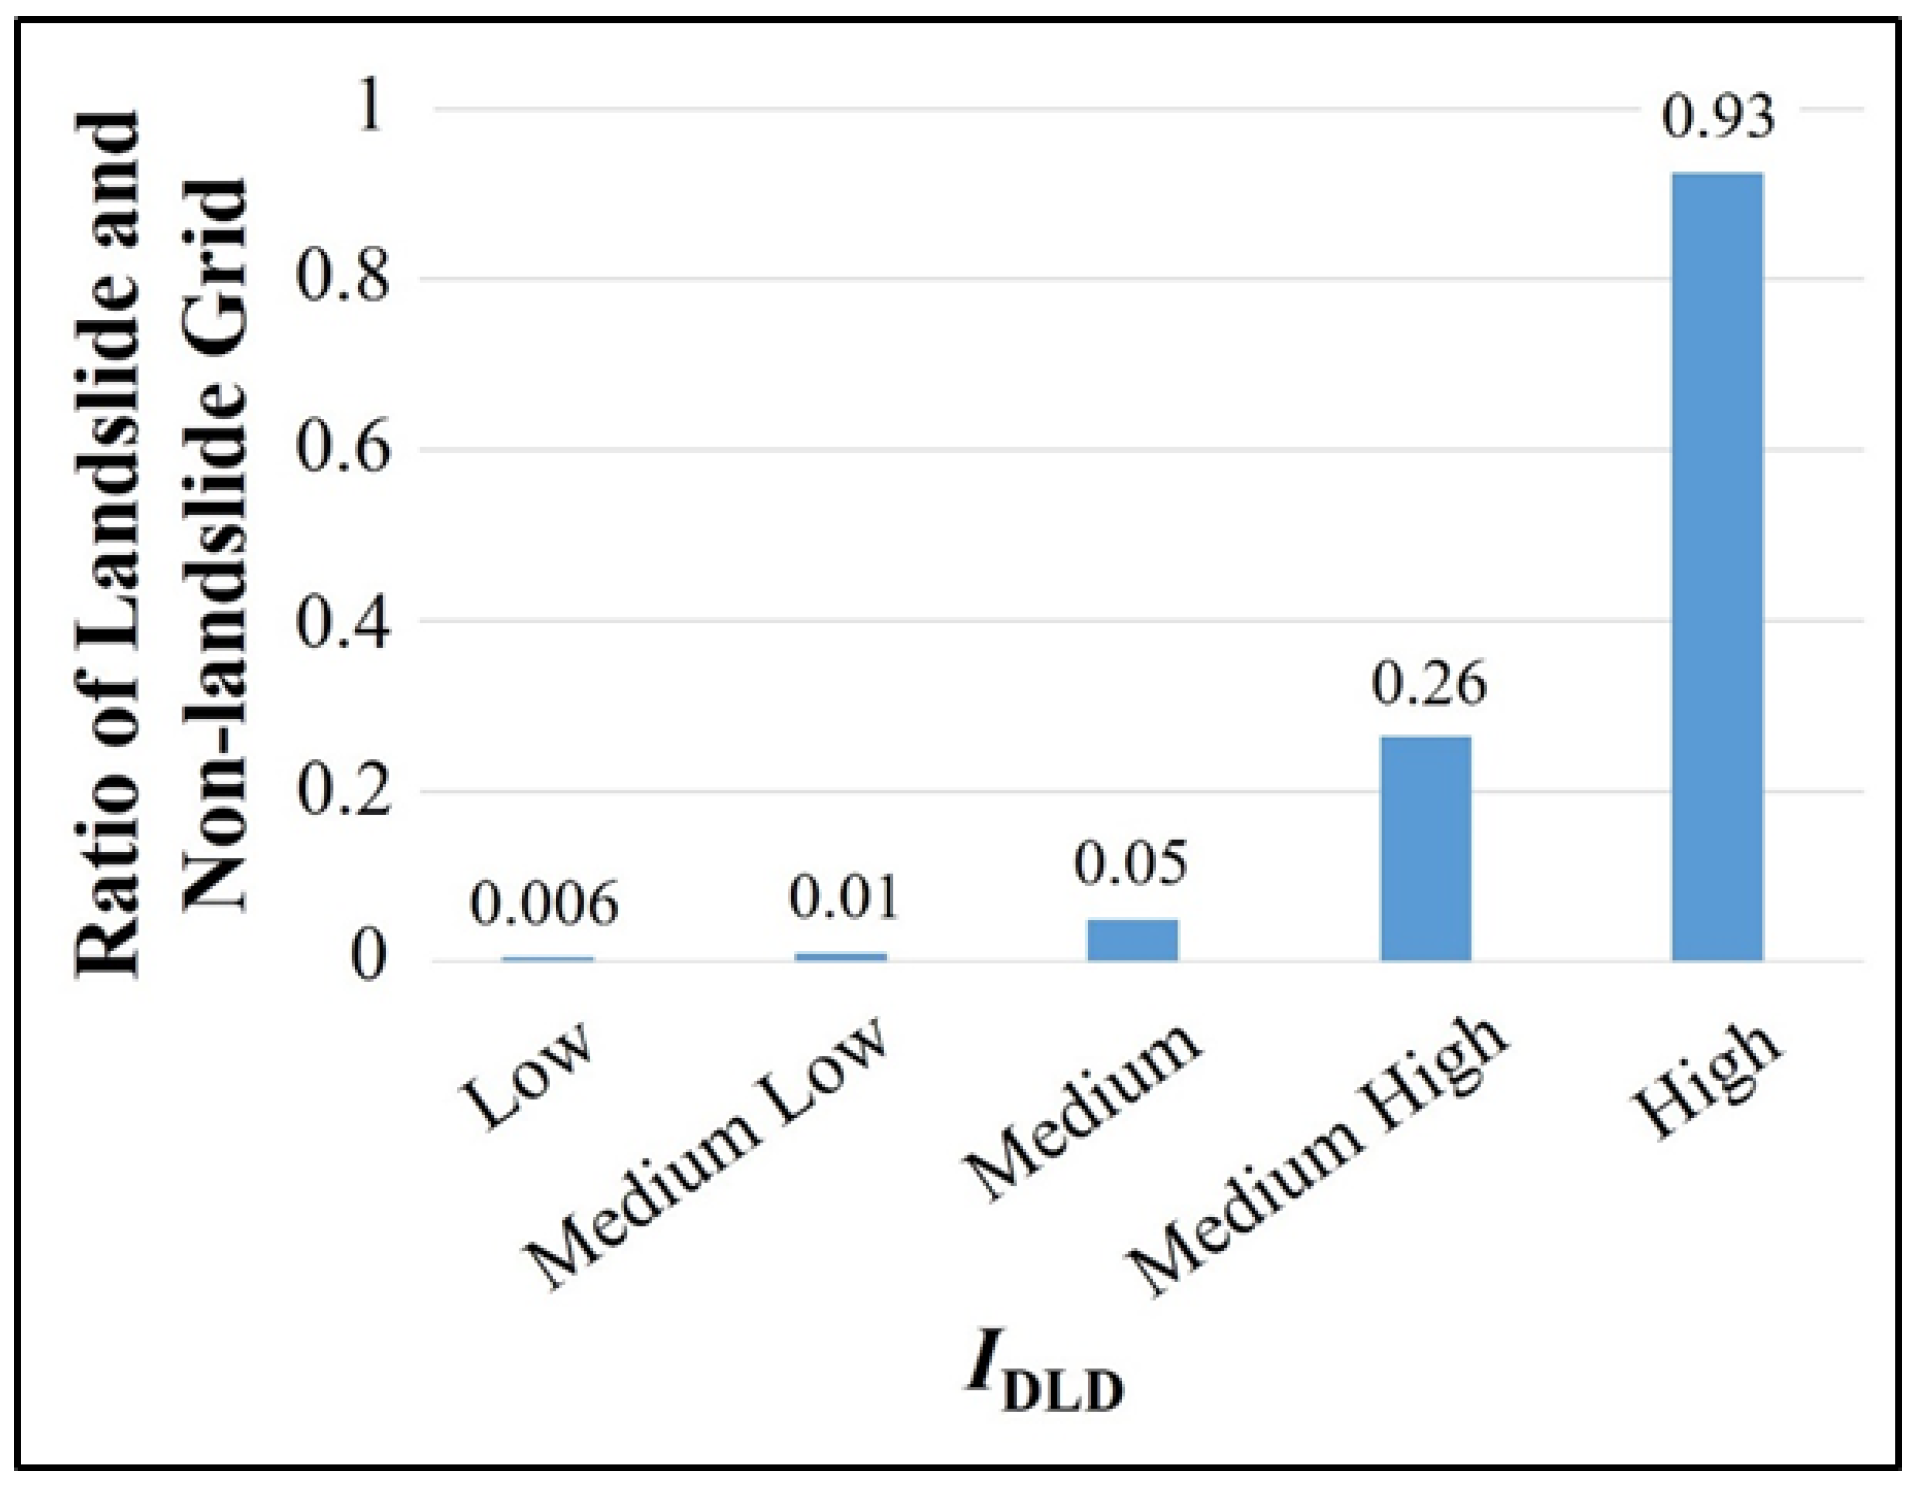
4.4.2. Classification of Slope Land Use Disturbance Degree and Its Influence on Landslides in the Study Area
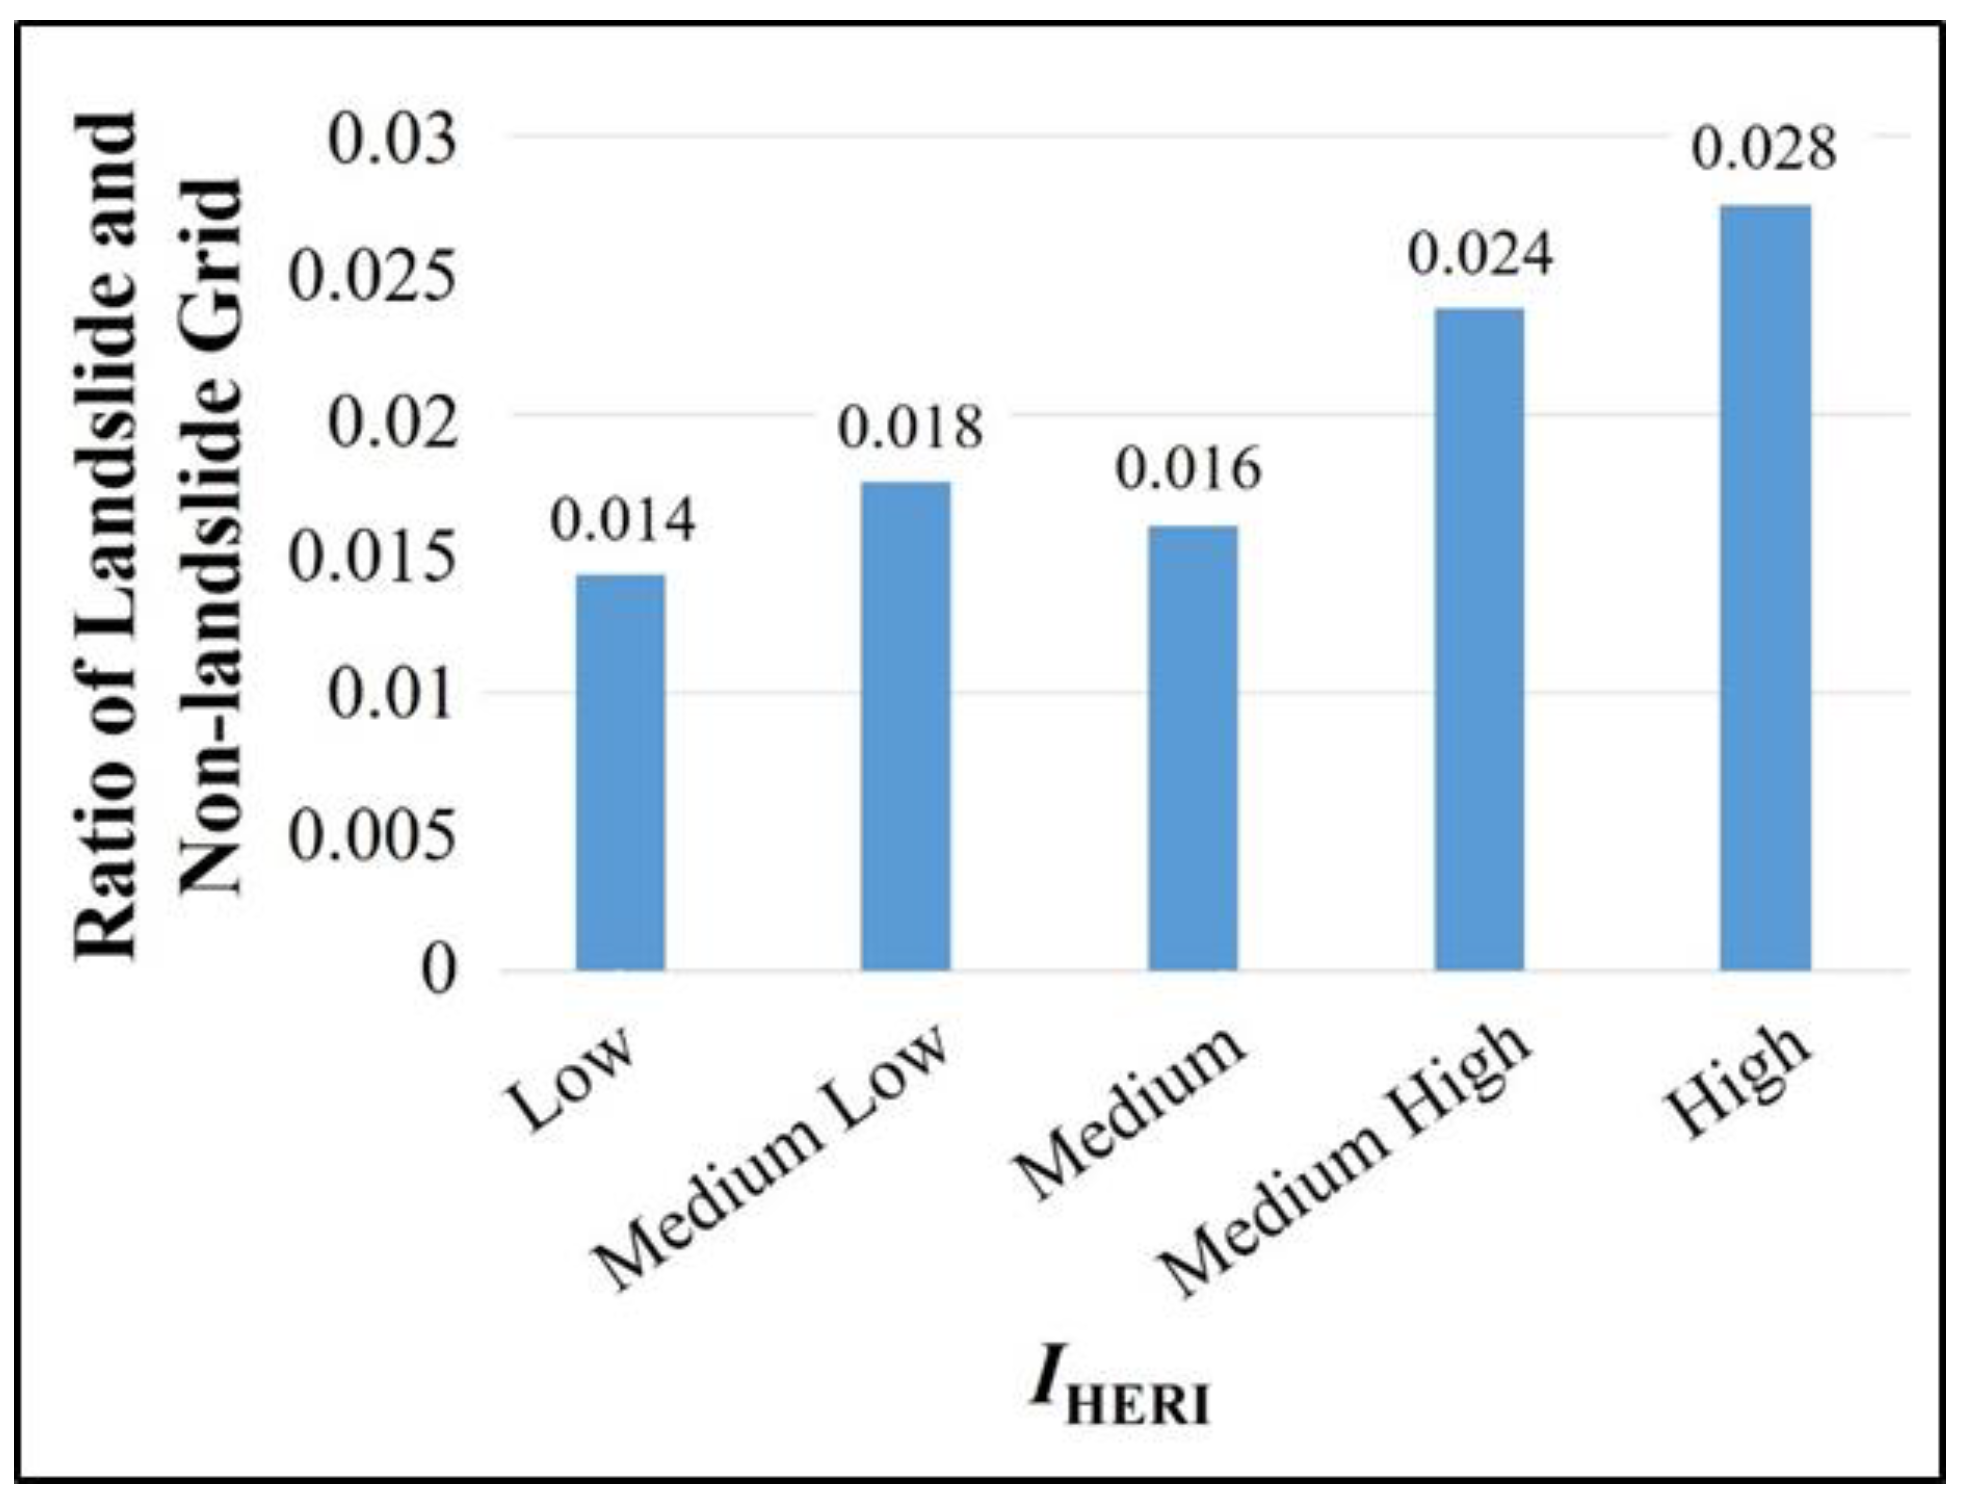
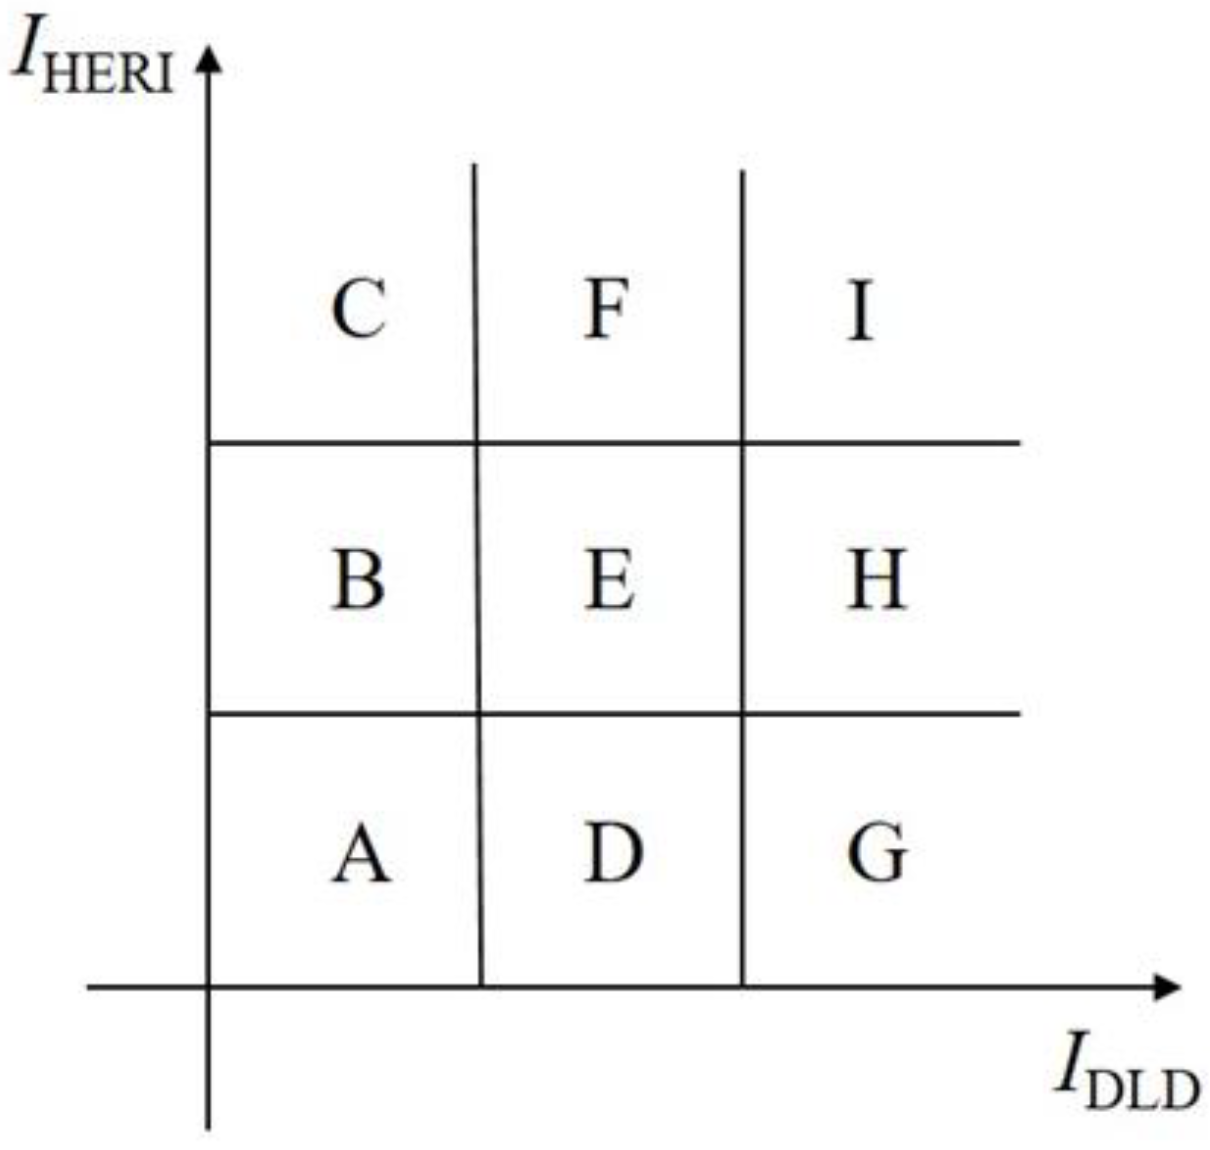
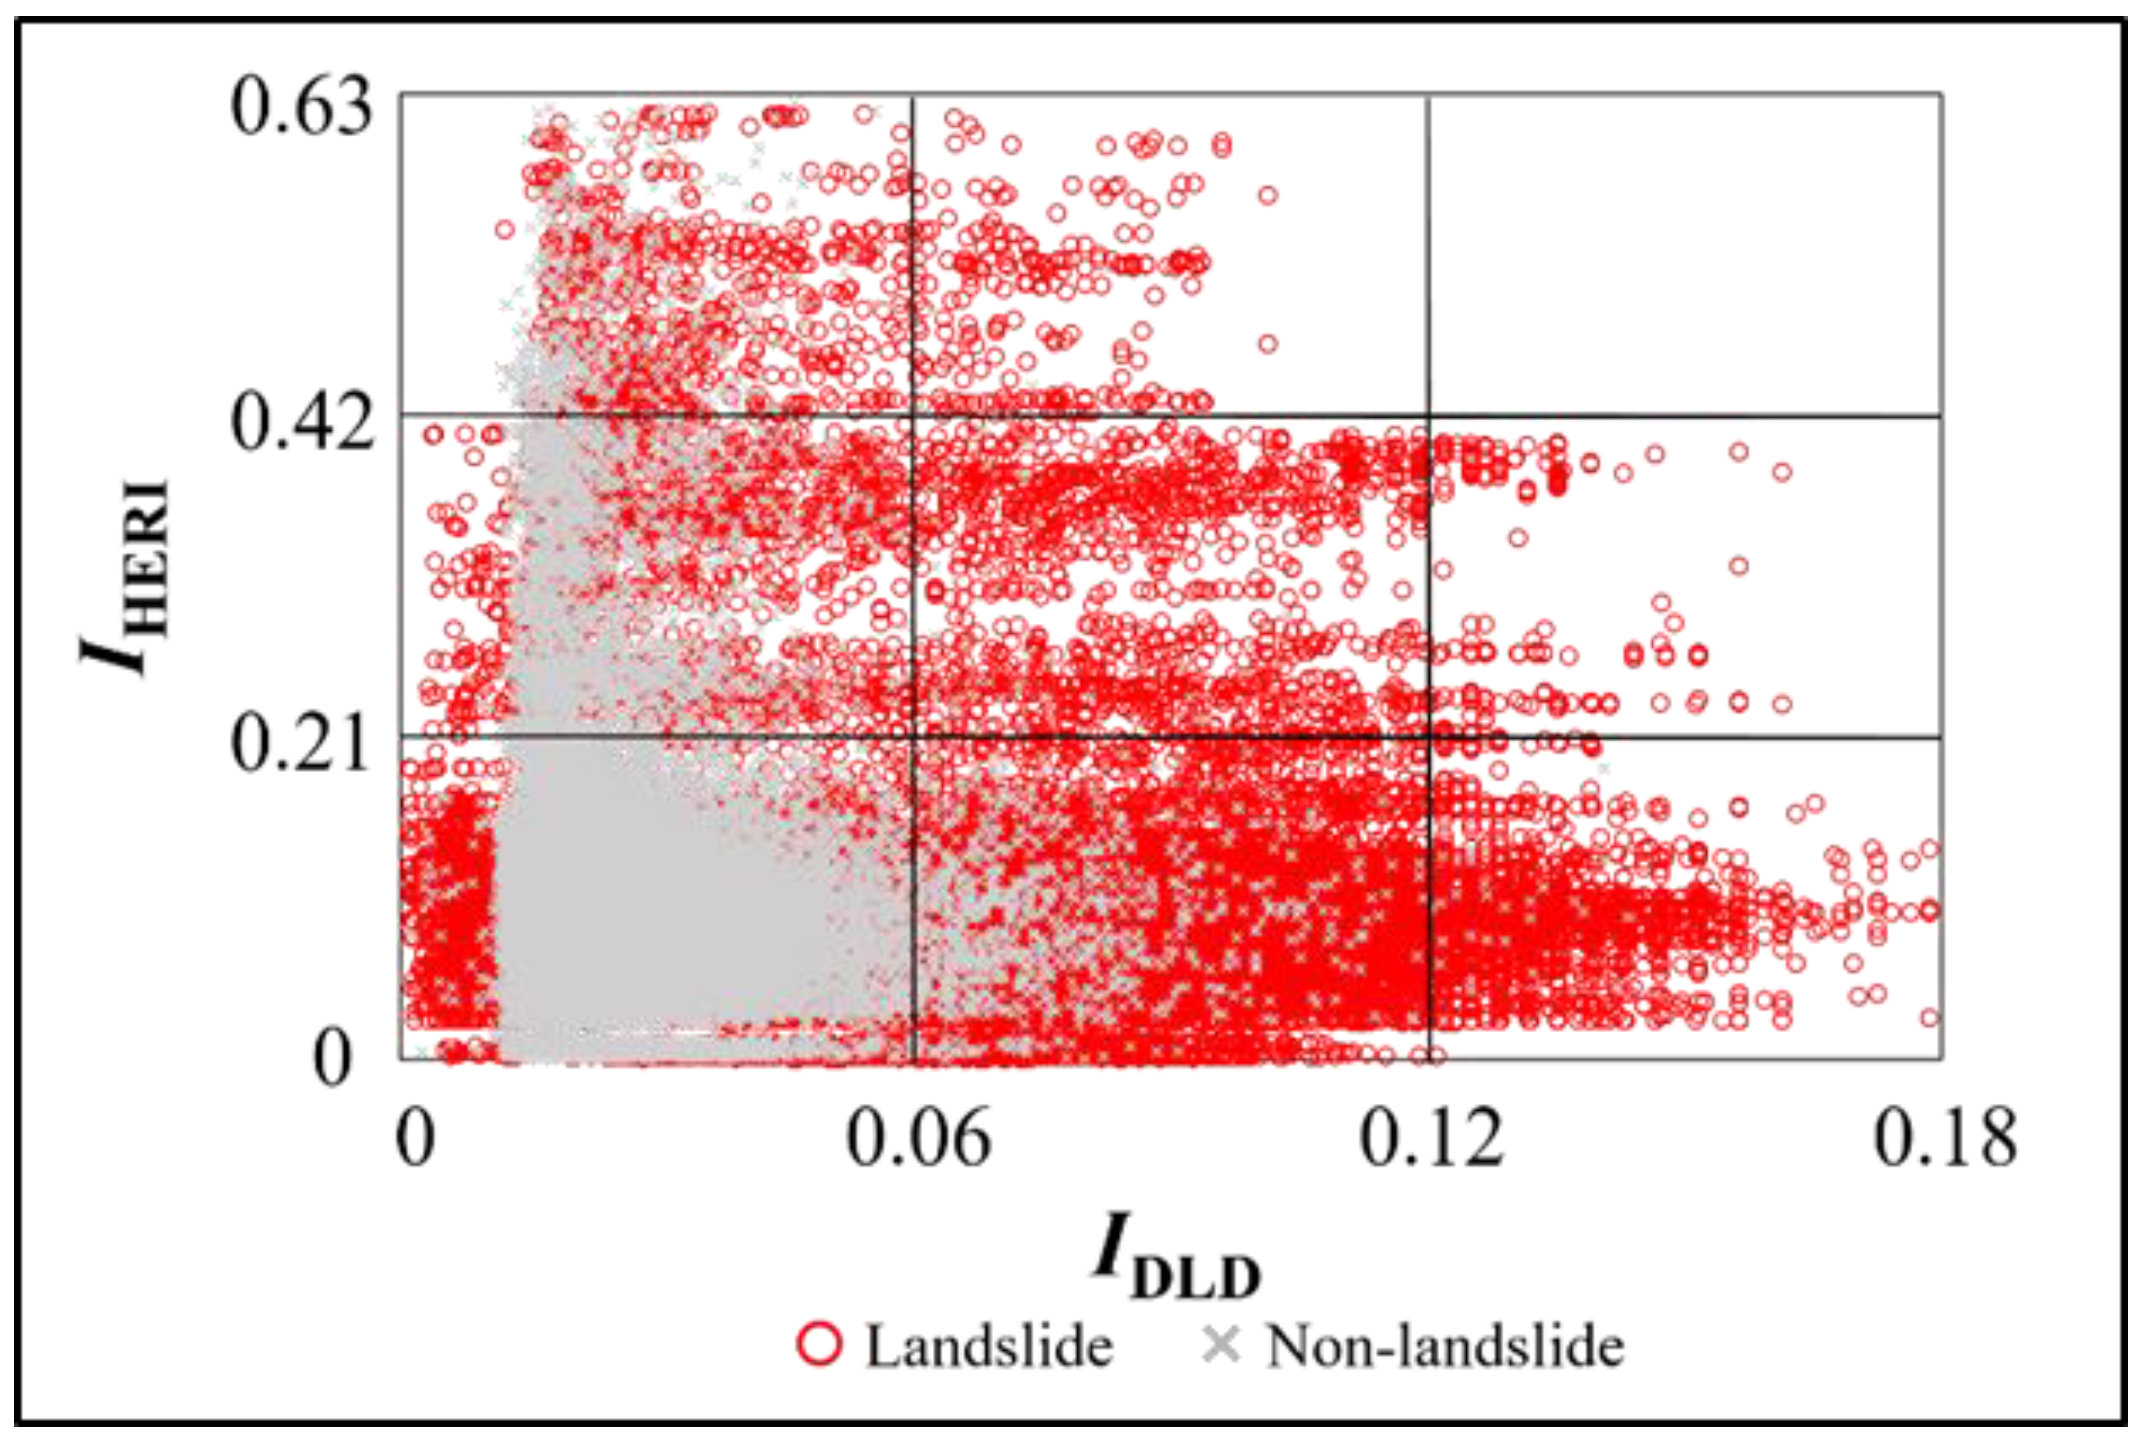
4.4.3. Interaction between the Hazard Indexes of Rainfall- and Earthquake-Induced Landslides and the Index of the Degree of Slope Land Use Disturbance
4.5. Establishment and Verification of Rainfall- and Earthquake-Induced Landslide Potential Assessment Models and Potential Map Drawing
4.5.1. Establishment of a Landslide Potential Assessment Model
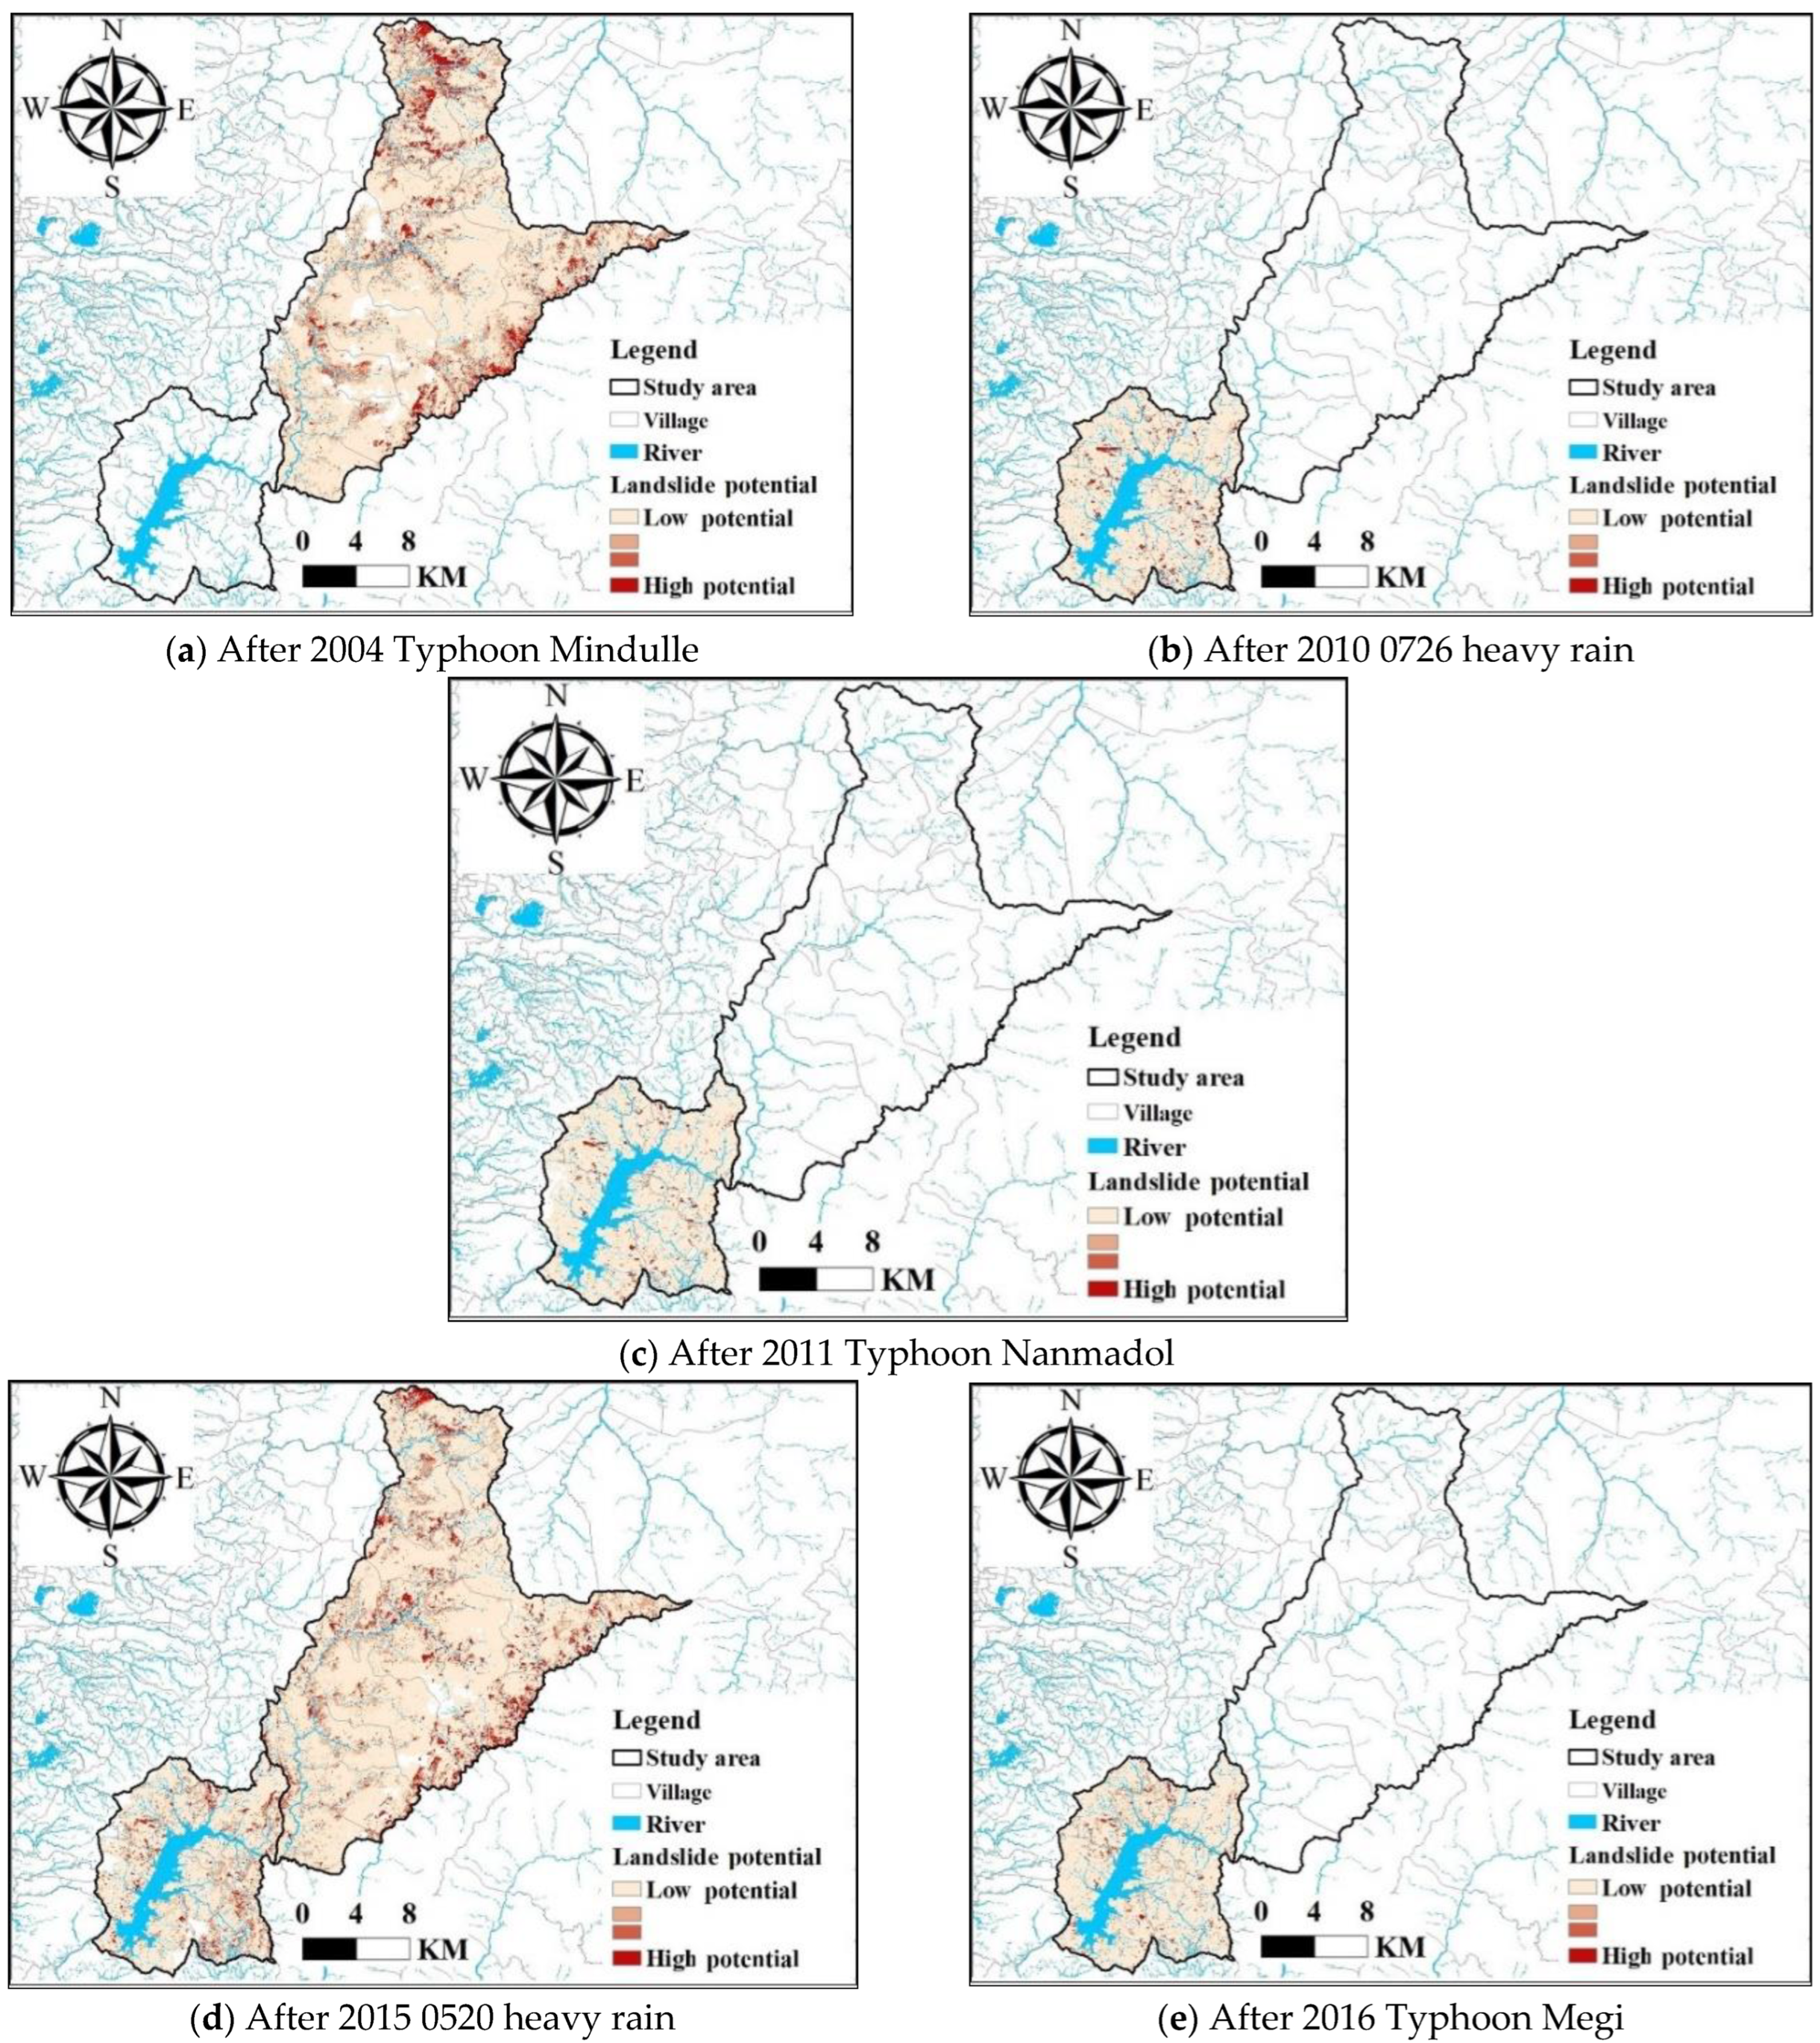
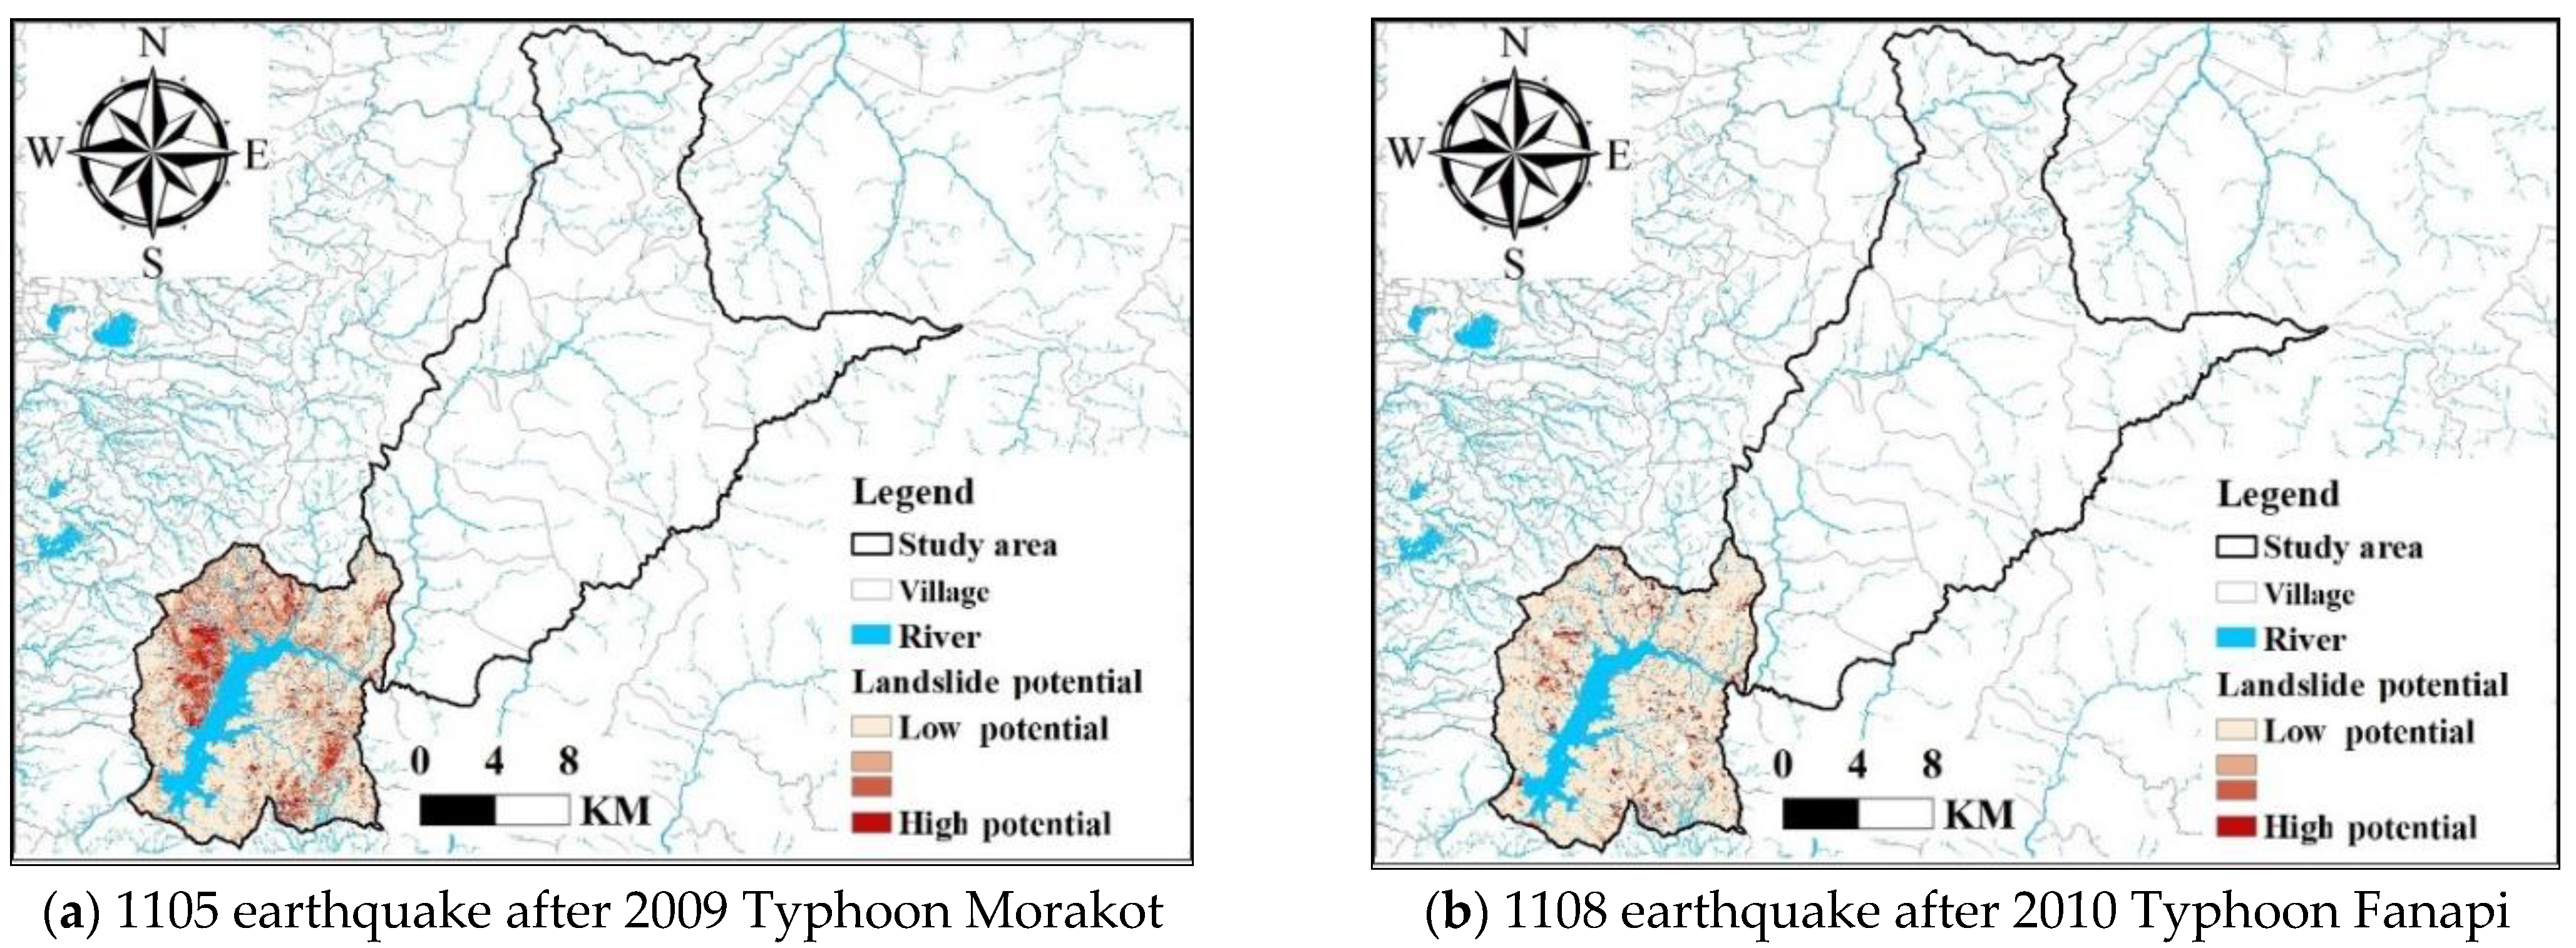
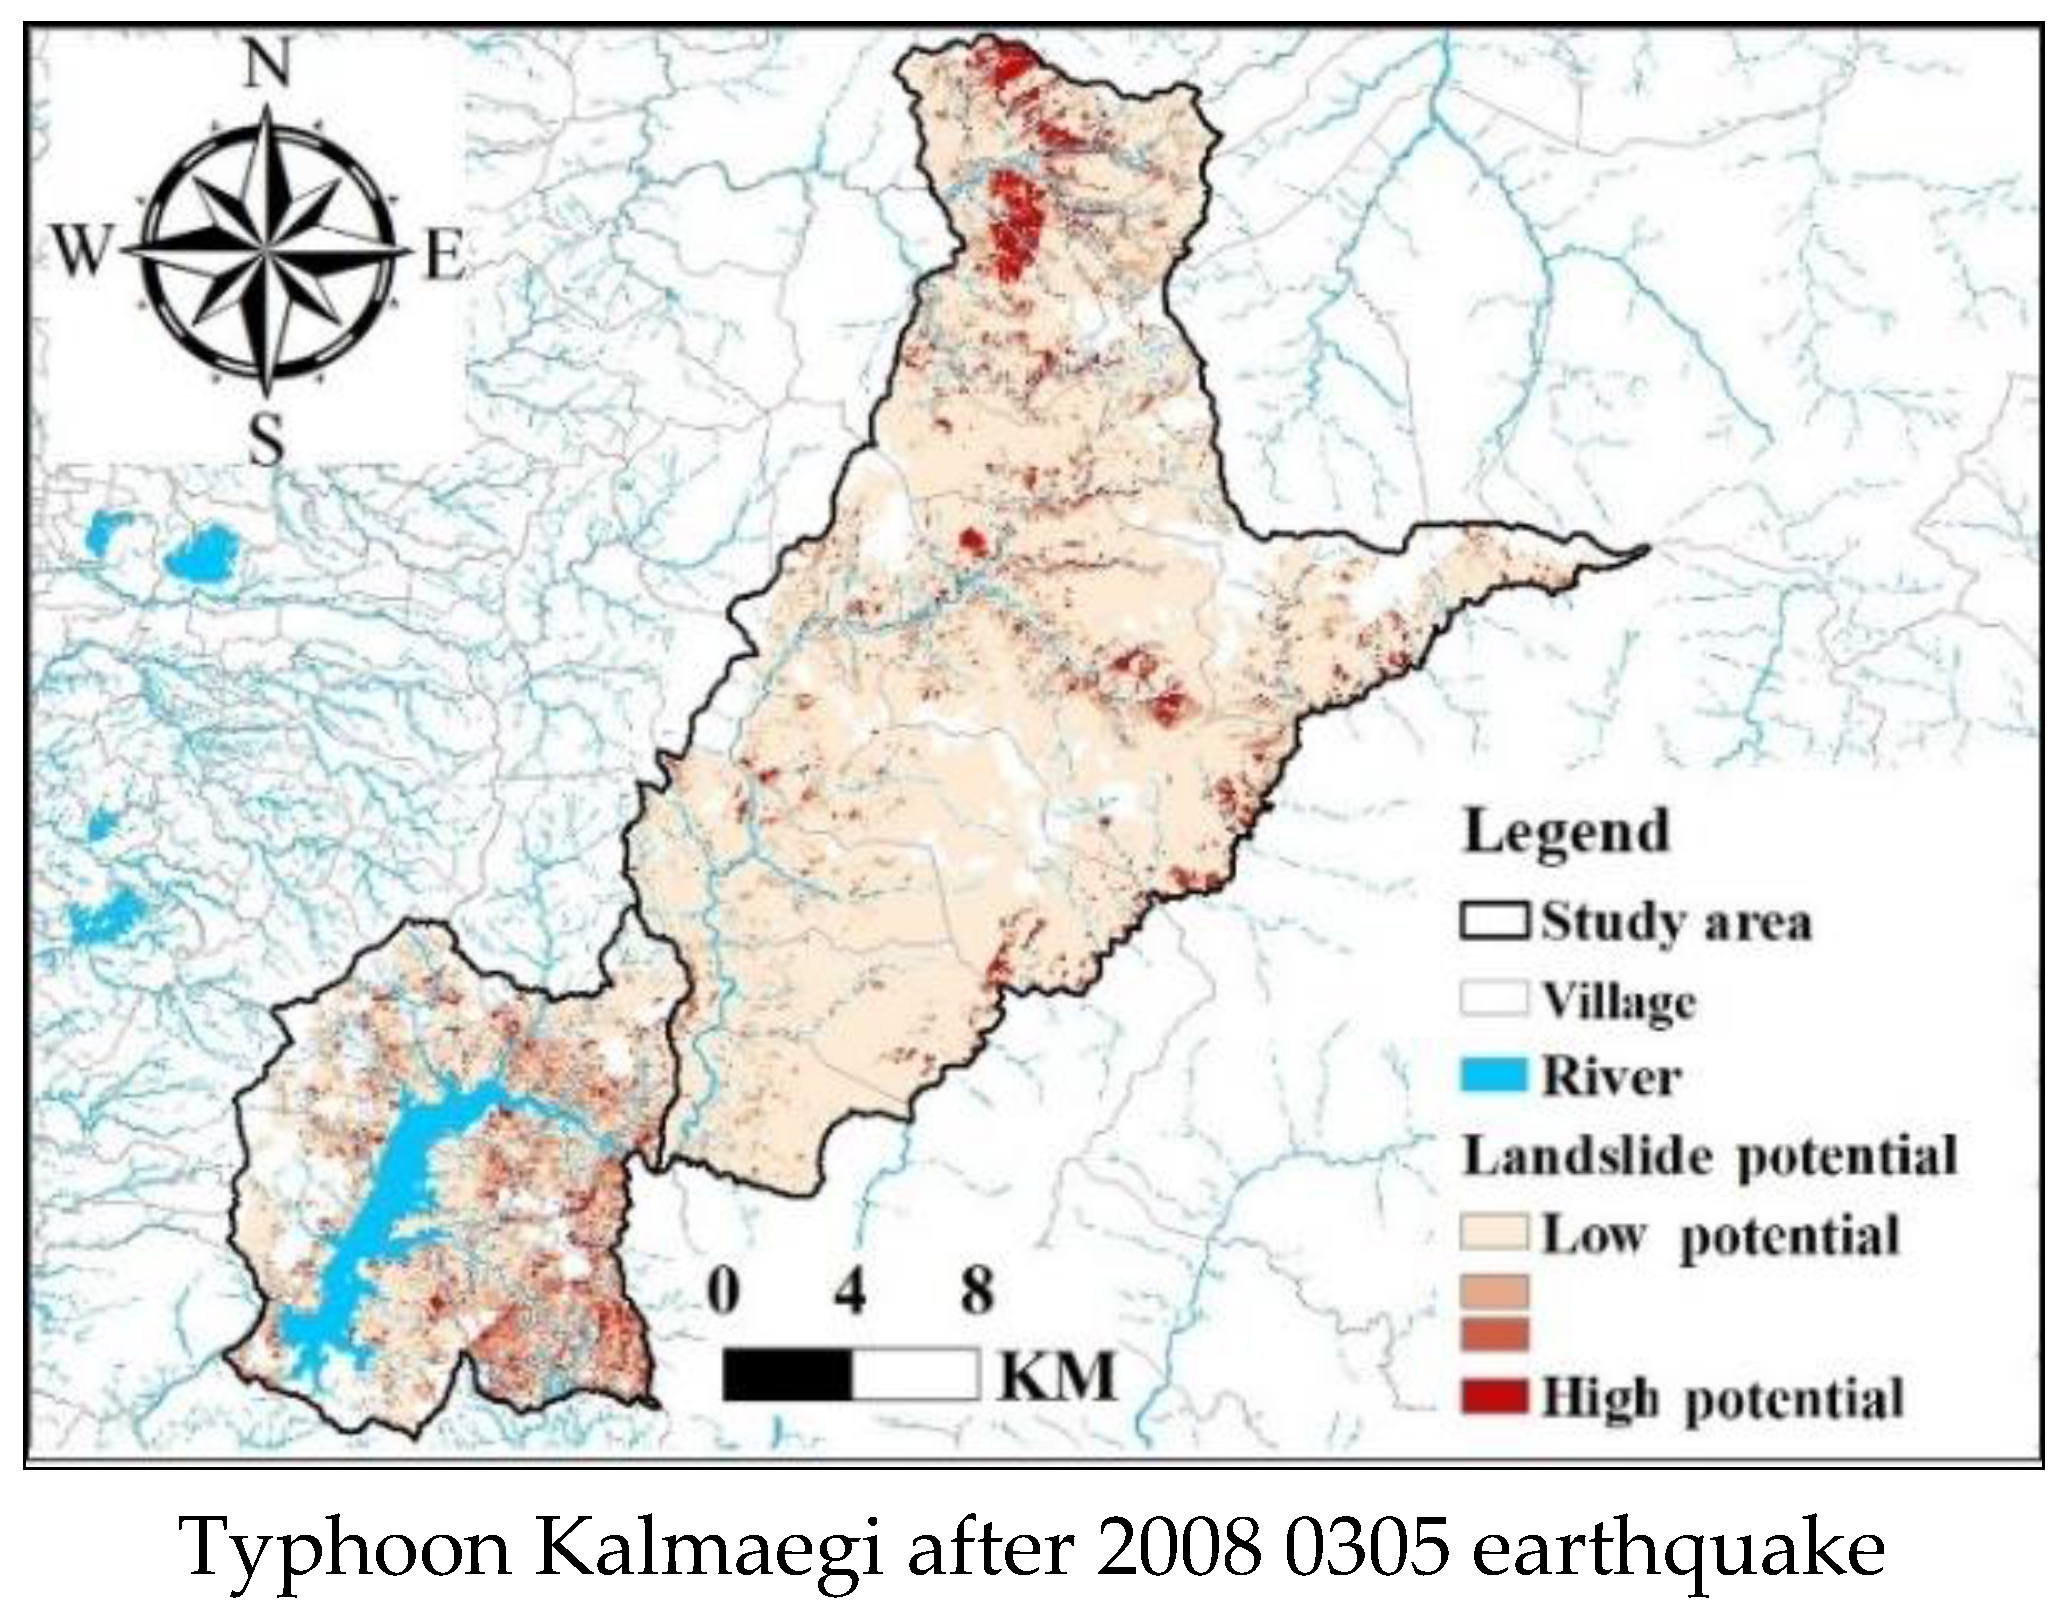
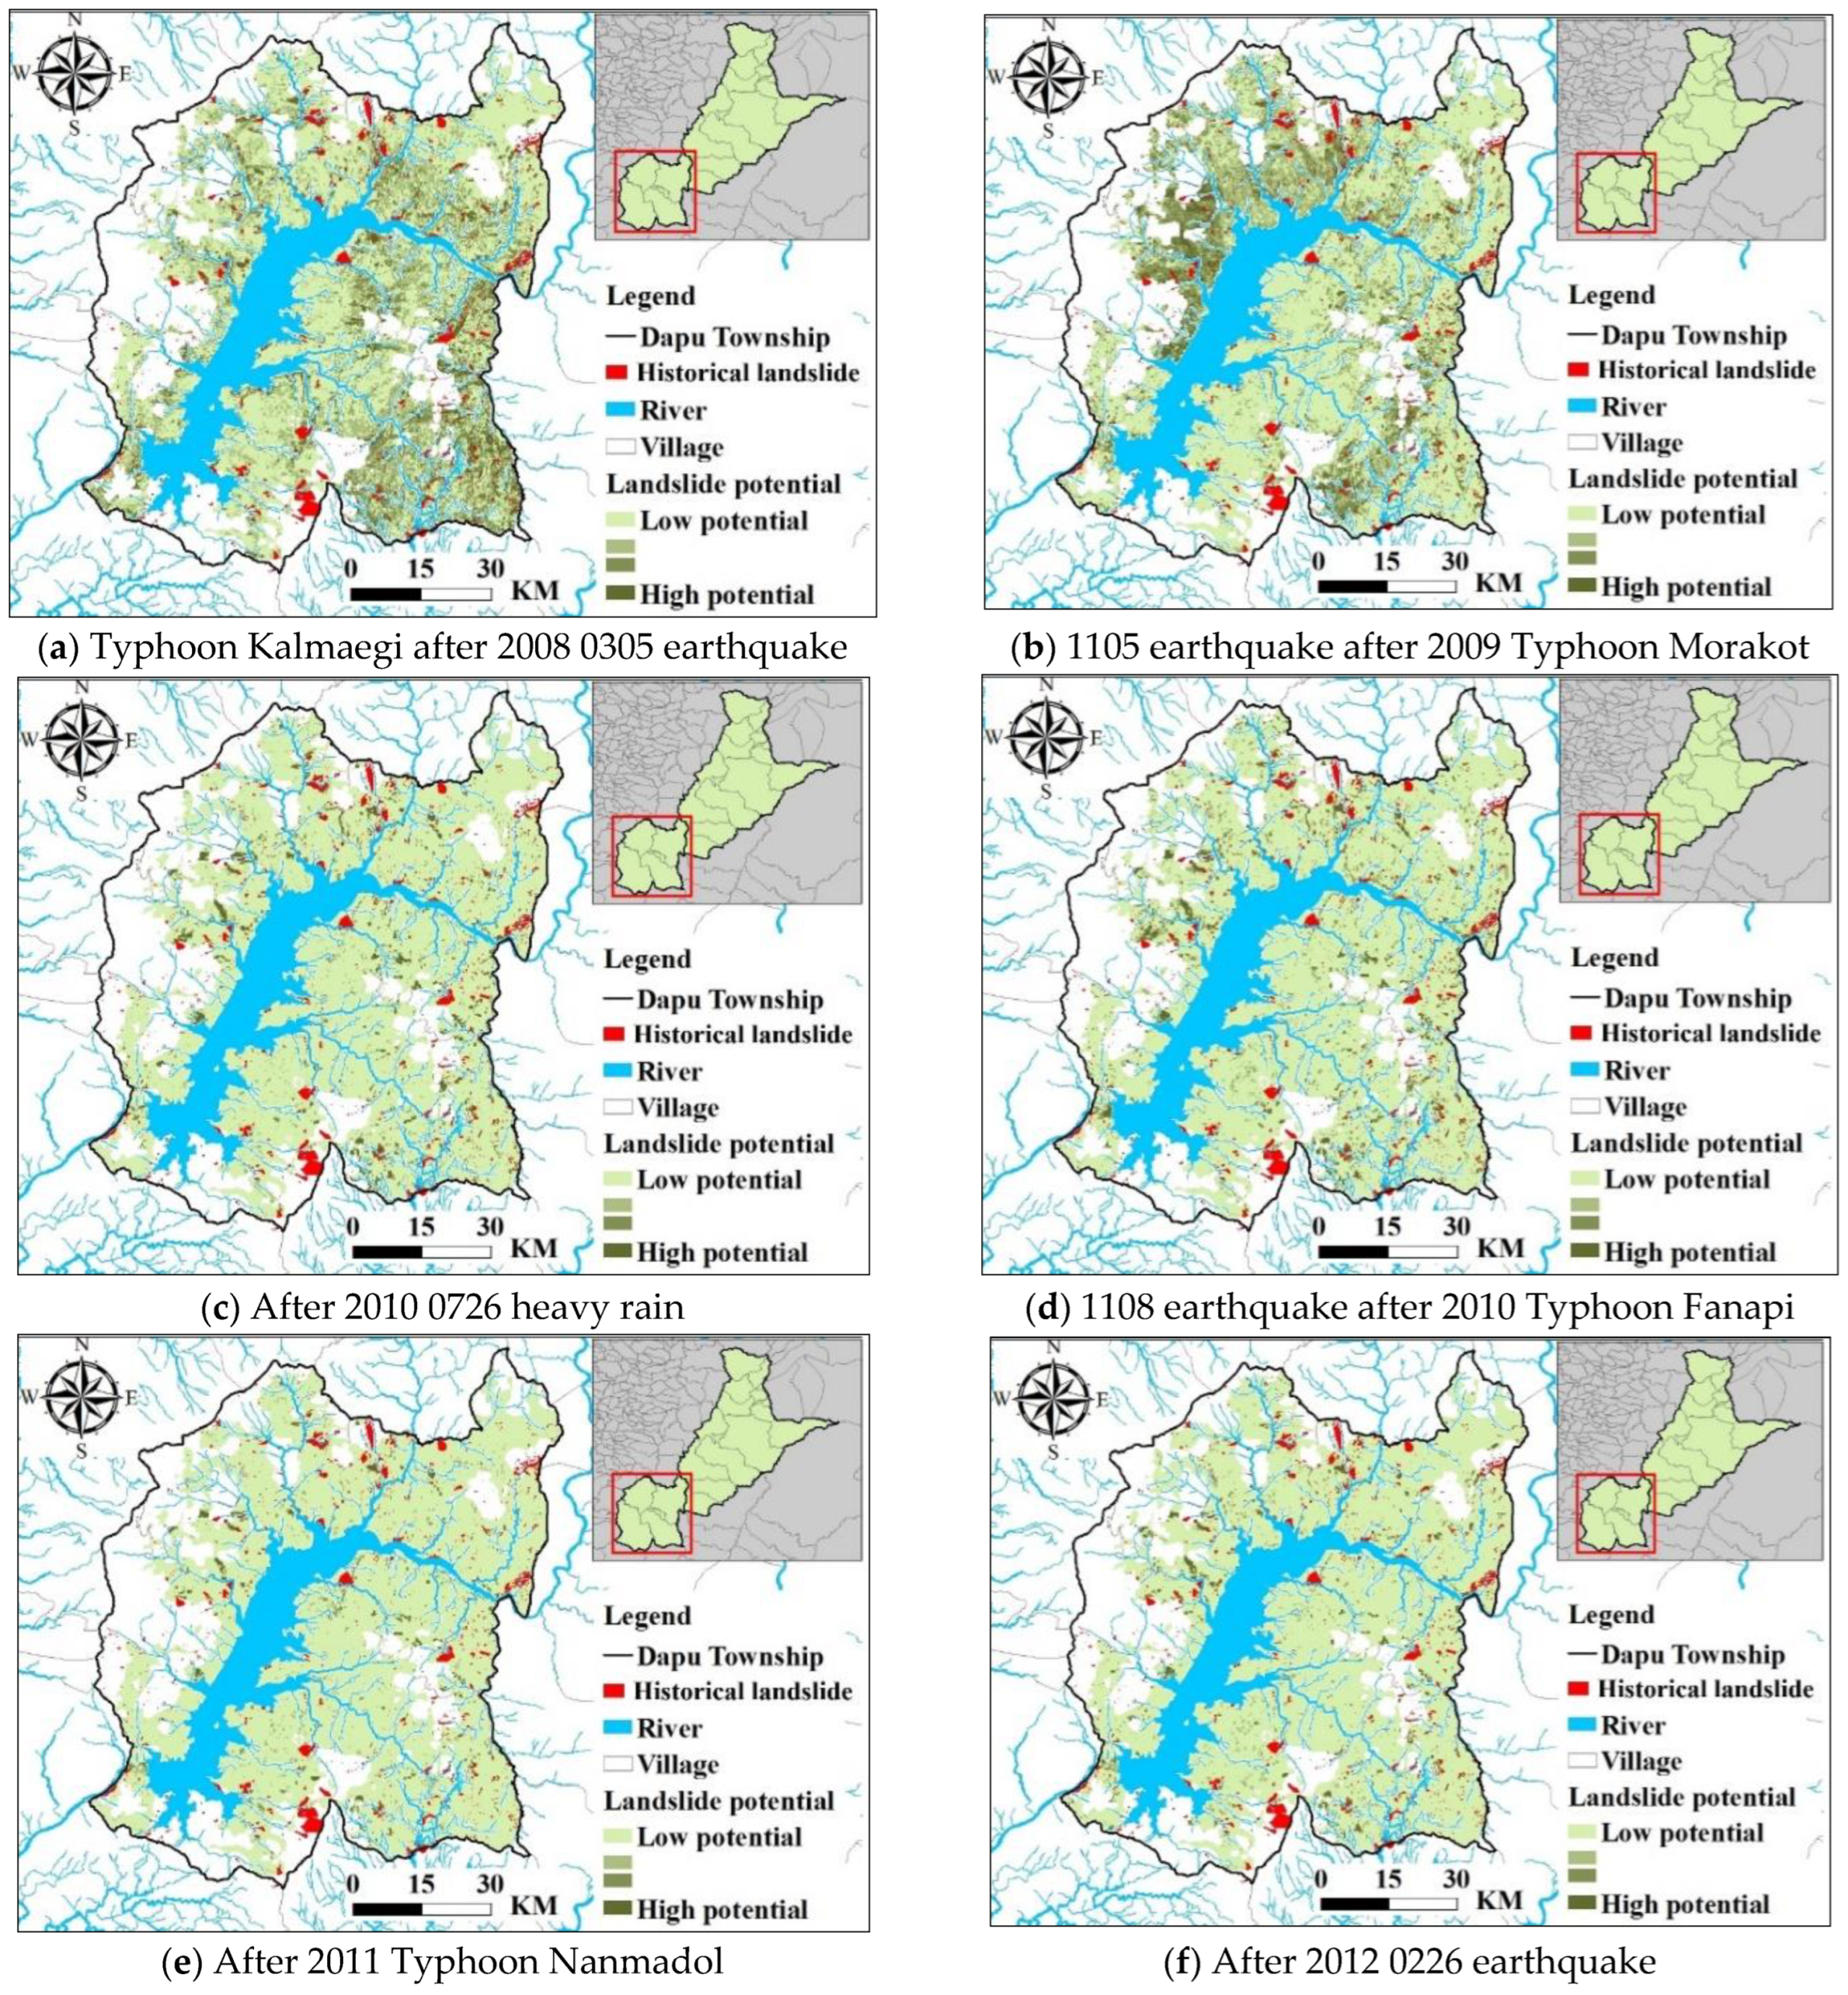
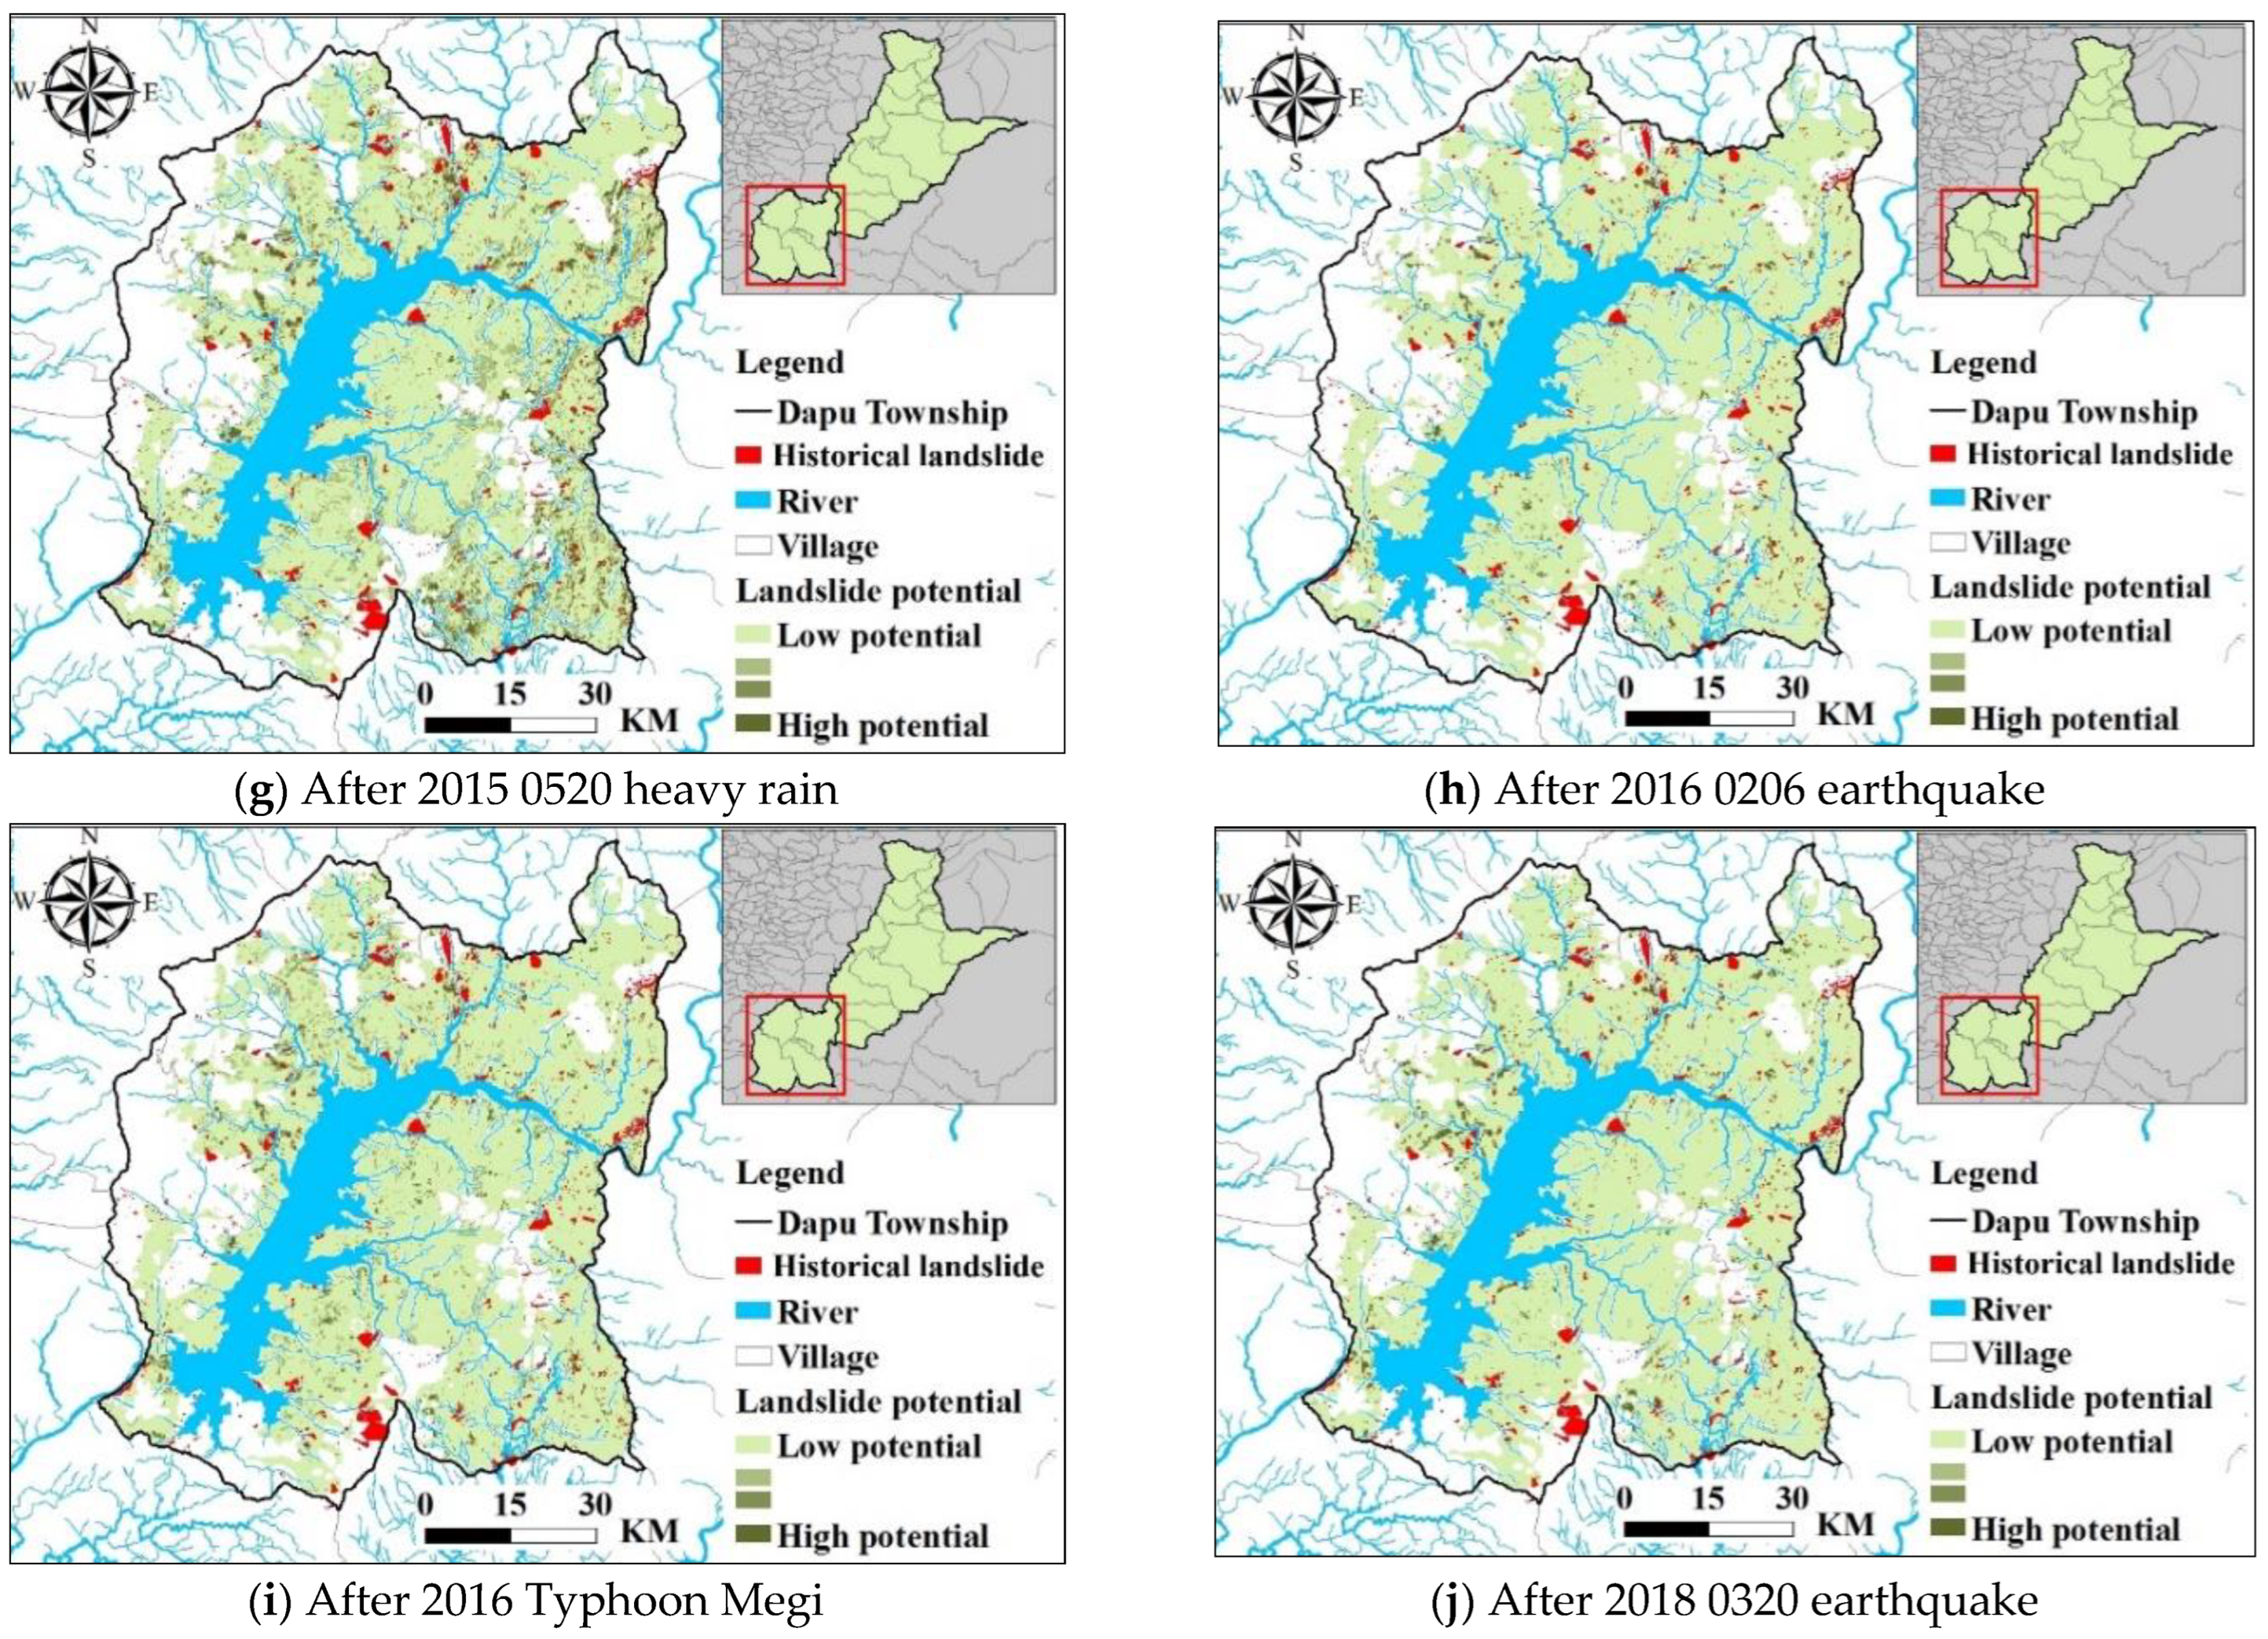
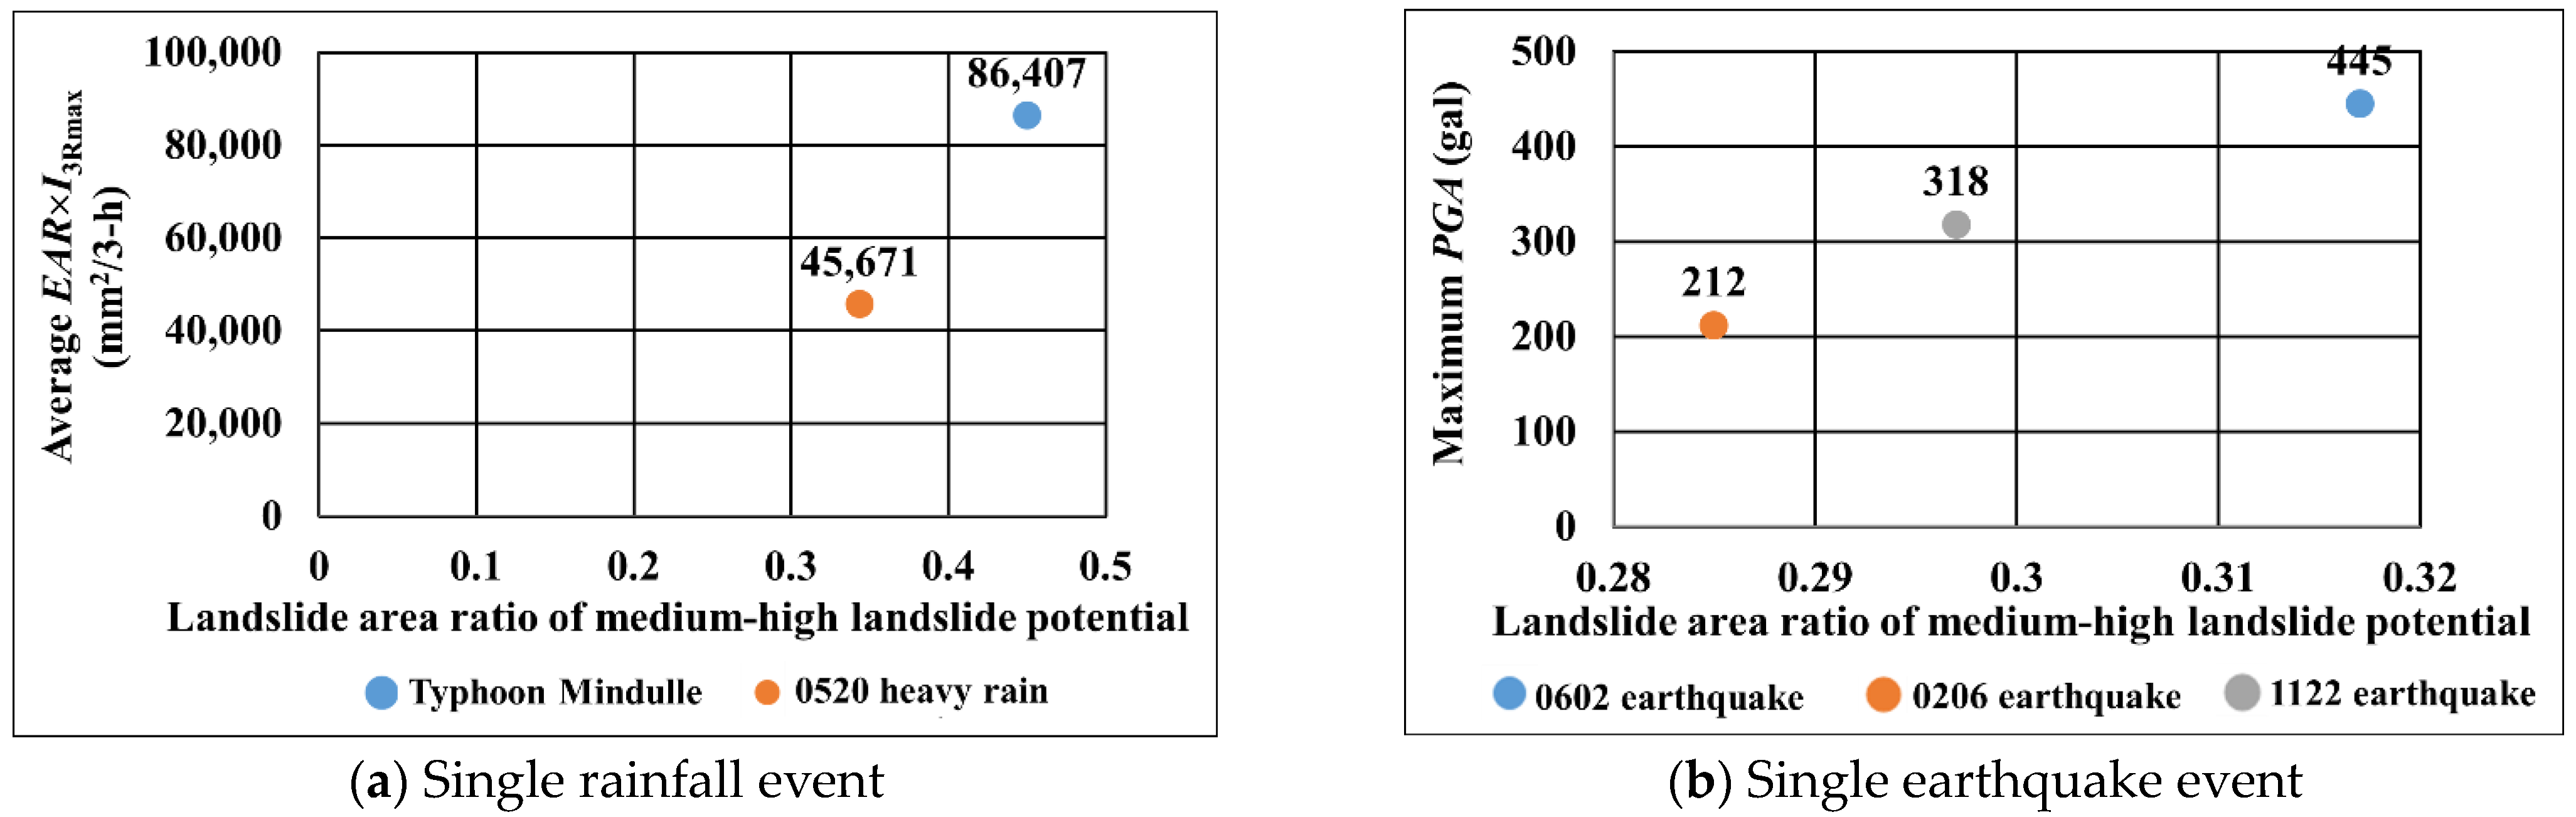
4.5.2. Verification of the Landslide Potential Assessment Model and Drawing of a Potential Map
5. Conclusions
Author Contributions
Funding
Institutional Review Board Statement
Informed Consent Statement
Data Availability Statement
Conflicts of Interest
References
- Chen, Y.R.; Chen, J.W.; Hsieh, S.C.; Ni, P.N. The Application of Remote Sensing Technology to the Interpretation of Land Use for Rainfall-Induced Landslides Based on Genetic Algorithms and Artificial Neural Networks. IEEE J. Sel. Top. Appl. Earth Obs. Remote Sens. 2009, 2, 87–95. [Google Scholar] [CrossRef]
- Chue, Y.S.; Chen, J.W.; Chen, Y.R. Rainfall-Induced Slope Landslide Potential and Landslide Distribution Characteristics Assessment. J. Mar. Sci. Technol. 2015, 23, 705–716. [Google Scholar] [CrossRef]
- Chen, Y.C.; Chang, K.T.; Lee, H.Y.; Chiang, S.H. Average landslide erosion rate at the watershed scale in southern Taiwan estimated from magnitude and frequency of rainfall. Geomorphology 2015, 228, 756–764. [Google Scholar] [CrossRef]
- Feng, Q.; Liu, J.; Gong, J. UAV Remote Sensing for Urban Vegetation Mapping Using Random Forest and Texture Analysis. Remote Sens. 2015, 7, 1074–1094. [Google Scholar] [CrossRef] [Green Version]
- Stumpf, A.; Malet, J.P.; Delacourt, C. Correlation of satellite image time-series for the detection and monitoring of slow-moving landslides. Remote Sens. Environ. 2017, 189, 40–55. [Google Scholar] [CrossRef]
- Zhong, Y.Y. Comparison on the Characteristics of Rainfall-Induced Landslides before and after the Chi-Chi Earthquake. Master’s Thesis, National Taiwan University, Taipei, Taiwan, 2005. (In Chinese). [Google Scholar] [CrossRef]
- Lin, C.W.; Liu, S.H.; Lee, S.Y.; Liu, C.C. Impacts of the Chi-Chi earthquake on subsequent rainfall-induced landslides in central Taiwan. Eng. Geol. 2006, 86, 87–101. [Google Scholar] [CrossRef]
- Tang, C.; Zhu, J.; Qi, X.; Ding, J. Landslides induced by the Wenchuan earthquake and the subsequent strong rainfall event: A case study in the Beichuan area of China. Eng. Geol. 2011, 122, 22–23. [Google Scholar] [CrossRef]
- Huang, H.P.; Yang, K.C.; Lin, B.W. Statistical evaluation of the effect of earthquake with other related factors on landslide susceptibility: Using the watershed area of Shihmen reservoir in Taiwan as a case study. Environ. Earth Sci. 2013, 69, 2151–2166. [Google Scholar] [CrossRef]
- Chen, Y.R.; Tsai, K.J.; Hsieh, S.C.; Ho, Y.L. Evaluation of Landslide Potential due to Land Use in the Slope. Electron. J. Geotech. Eng. 2015, 20, 4277–4292. [Google Scholar]
- Yang, Z.H.; Lan, H.X.; Geo, X.; Li, L.P.; Meng, Y.S.; Wu, Y.M. Urgent landslide susceptibility assessment in the 2013 Lushan earthquake-impacted area, Sichuan Province, China. Nat. Hazards 2015, 75, 2467–2487. [Google Scholar] [CrossRef]
- Jan, C.D.; Yang, S.Y.; Su, Y.W.; Haung, W.S. Investigation about rainfall-induced shallow landslides in CYL and TWR watersheds, Taiwan. Environ. Earth Sci. 2016, 75, 898. [Google Scholar] [CrossRef]
- Li, C.; Wang, M.; Liu, K. A decadal evolution of landslides and debris flows after the Wenchuan earthquake. Geomorphology 2018, 323, 1–12. [Google Scholar] [CrossRef]
- Tseng, C.M.; Chen, Y.R.; Wu, S.M. Scale and spatial distribution assessment of rainfall-induced landslides in a catchment with mountain roads. Nat. Hazards Earth Syst. Sci. 2018, 18, 687–708. [Google Scholar] [CrossRef] [Green Version]
- Wistuba, M.; Malik, I.; Krzemień, K.; Gorczyca, E.; Sobucki, M.; Wrońska-Wałach, D.; Gawior, D. Can low-magnitude earthquakes act as a triggering factor for landslide activity? Examples from the Western Carpathian Mts, Poland. CATENA 2018, 171, 359–375. [Google Scholar] [CrossRef]
- Chen, C.W.; Tung, Y.S.; Liou, J.J.; Li, H.C.; Cheng, C.T.; Chen, Y.M.; Oguchi, T. Assessing landslide characteristics in a changing climate in northern Taiwan. CATENA 2019, 175, 263–277. [Google Scholar] [CrossRef]
- Valagussa, A.; Marc, O.; Frattini, P.; Crosta, G.B. Seismic and geological controls on earthquake-induced landslide size. Earth Planet. Sci. Lett. 2019, 506, 268–281. [Google Scholar] [CrossRef]
- Quesada-Román, A.; Fallas-López, B.; Hernández-Espinoza, K.; Stoffel, M.; Ballesteros-Cánovas, J.A. Relationships between earthquakes, hurricanes, and landslides in Costa Rica. Landslides 2019, 16, 1539–1550. [Google Scholar] [CrossRef]
- Ruggeri, P.; Fruzzetti, V.M.E.; Ferretti, A.; Scarpelli, G. Seismic and Rainfall Induced Displacements of an Existing Landslide: Findings from the Continuous Monitoring. Geosciences 2020, 10, 90. [Google Scholar] [CrossRef] [Green Version]
- Bontemps, N.; Lacroix, P.; Larose, E.; Jara, J.; Taipe, E. Rain and small earthquakes maintain a slow-moving landslide in a persistent critical state. Nat. Commun. 2020, 11, 780. [Google Scholar] [CrossRef] [Green Version]
- Liu, S.; Hu, K.; Zhang, Q.; Zhang, S.; Hu, X.; Tang, D. Quantitative Analysis of the Effects of an Earthquake on Rainfall Thresholds for Triggering Debris-Flow Events. Front. Earth Sci. 2021, 9, 417. [Google Scholar] [CrossRef]
- Breiman, L. Random Forests. Mach. Learn. 2001, 45, 5–32. [Google Scholar] [CrossRef] [Green Version]
- Colditz, R.R. An Evaluation of Different Training Sample Allocation Schemes for Discrete and Continuous Land Cover Classification Using Decision Tree-Based Algorithms. Remote Sens. 2015, 7, 9655–9681. [Google Scholar] [CrossRef] [Green Version]
- Belgiu, M.; Drăguţ, L. Random forest in remote sensing: A review of applications and future directions. ISPRS J. Photogramm. Remote Sens. 2016, 114, 24–31. [Google Scholar] [CrossRef]
- Lagomarsino, D.; Tofani, V.; Segoni, S.; Catani, F.; Casagli. A Tool for Classification and Regression Using Random Forest Methodology: Applications to Landslide Susceptibility Mapping and Soil Thickness Modeling. Environ. Model. Assess. 2017, 22, 201–214. [Google Scholar] [CrossRef]
- Taalab, K.; Cheng, T.; Zhang, Y. Mapping landslide susceptibility and types using Random Forest. Big Earth Data 2018, 2, 159–178. [Google Scholar] [CrossRef]
- Catani, F.; Lagomarsino, D.; Segoni, S.; Tofani, V. Landslide susceptibility estimation by random forests technique: Sensitivity and scaling issues. Nat. Hazards Earth Syst. Sci. 2013, 13, 2815–2831. [Google Scholar] [CrossRef] [Green Version]
- Goetz, J.N.; Brenning, A.; Petschko, H.; Leopold, P. Evaluating machine learning and statistical prediction techniques for landslide susceptibility modelling. Comput. Geosci. 2015, 81, 1–11. [Google Scholar] [CrossRef]
- Steger, S.; Brenning, A.; Bell, R.; Petschko, H.; Glade, T. Exploring discrepancies between quantitative validation results and the geomorphic plausibility of statistical landslide susceptibility maps. Geomorphology 2016, 262, 8–23. [Google Scholar] [CrossRef]
- Chen, W.; Li, Y.; Tsangaratos, P.; Shahabi, H.; Ilia, I.; Xue, W. Groundwater spring potential mapping using artificial intelligence approach based on kernel logistic regression, random forest, and alternating decision tree models. Appl. Sci. 2020, 10, 425. [Google Scholar] [CrossRef] [Green Version]
- Ercanoglu, M. Landslide susceptibility assessment of SE Bartin (West Black Searegion, Turkey) by artificial neural networks. Nat. Hazards Earth Syst. Sci. 2005, 5, 979–992. [Google Scholar] [CrossRef]
- Shahabi, H.; Khezri, S.; Ahmad, B.B.; Hashim, M. Landslide susceptibility mapping at central Zab basin, Iran: A comparison between analytical hierarchy process frequency ratio and logistic regression models. Catena 2014, 115, 55–70. [Google Scholar] [CrossRef]
- Ho, T.K. The random subspace method for constructing decision forests. IEEE Trans. Pattern Anal. Mach. Intell. 1998, 20, 832–844. [Google Scholar] [CrossRef] [Green Version]
- Efron, B. Computers and the Theory of Statistics: Thinking the Unthinkable. SIAM Rev. 1979, 21, 460–480. [Google Scholar] [CrossRef]
- Cutler, A.; Cutler, D.R.; Stevens, J.R. Random Forests. In Ensemble Machine Learning; Zhang, C., Ma, Y., Eds.; Springer: Boston, MA, USA, 2012; pp. 157–175. [Google Scholar]
- Zhang, H.; Wu, P.B.; Yin, A.J.; Yang, X.H.; Zhang, M.; Gao, C. Prediction of soil organic carbon in an intensively managed reclamation zone of eastern China: A comparison of multiple linear regressions and the random forest model. Sci. Total Environ. 2017, 592, 704–713. [Google Scholar] [CrossRef]
- Youssef, A.M.; Pourghasemi, H.R.; Pourtaghi, Z.S.; Al-Katheeri, M.M. Landslide susceptibility mapping using random forest, boosted regression tree, classification and regression tree, and general linear models and comparison of their performance at Wadi Tayyah Basin, Asir Region, Saudi Arabia. Landslides 2016, 13, 839–856. [Google Scholar] [CrossRef]
- Chen, W.; Peng, J.B.; Hong, H.Y.; Shahabi, H.; Pradhan, B.; Liu, J.Z.; Zhu, A.; Pie, X.; Duan, Z. Landslide susceptibility modelling using GIS-based machine learning techniques for Chongren County, Jiangxi Province, China. Sci. Total Environ. 2018, 626, 1121–1135. [Google Scholar] [CrossRef]
- Wang, Y.L. The Assessment of Rainfall-induced Landslides Using Data Mining Techniques. Master’s Thesis, Chang Jung Christian University, Tainan, Taiwan, 2018. [Google Scholar]
- Sklansky, J. Image Segmentation and Feature Extraction. IEEE Trans. Syst. Man Cybern. 1978, 8, 238–247. [Google Scholar] [CrossRef]
- ERDAS. ERDAS IMAGINE® Tour Guide; ERDAS World Headquarter: Atlanta, GA, USA, 2011. [Google Scholar]
- Verbyla, D.L. A gentic adaptive neural network approach to pricing options: A simulation analysis. J. Comput. Intell. Financ. 1995, 6, 13–23. [Google Scholar]
- Chen, Y.R.; Ni, P.N.; Tsai, K.J. Construction of a sediment disaster risk assessment model. Environ. Earth Sci. 2013, 70, 115–129. [Google Scholar] [CrossRef]
- Landis, J.R.; Koch, G.G. The measurement of observer agreement for categorical data. Biometrics 1977, 33, 159–174. [Google Scholar] [CrossRef] [Green Version]
- Fawcett, T. An introduction to ROC analysis. Pattern Recognit. Lett. 2006, 27, 861–874. [Google Scholar] [CrossRef]
- Central Weather Bureau. 2021. Available online: https://www.cwb.gov.tw (accessed on 1 January 2021).
- Water Resources Agency, Ministry of Economic Affairs. 2021. Available online: https://www.wra.gov.tw/ (accessed on 1 January 2021).
- Moayedi, H.; Khari, M.; Bahiraei, M.; Foong, L.K.; Bui, D.T. Spatial assessment of landslide risk using two novel integrations of neuro-fuzzy system and metaheuristic approaches; Ardabil Province, Iran. Geomat. Nat. Hazards Risk 2020, 11, 230–258. [Google Scholar] [CrossRef] [Green Version]
- Hong, H.; Pradhan, B.; Jebur, M.N.; Bui, D.T.; Xu, C.; Akgun, A. Spatial prediction of landslide hazard at the luxi area (China) using support vector machines. Environ. Earth Sci. 2016, 75, 40. [Google Scholar] [CrossRef]
- Central Geological Survey, Ministry of Economic Affairs. 2021. Available online: https://www.moeacgs.gov.tw/ (accessed on 1 January 2021).
- ISRM. Rock Characterization, Testing and Monitoring; Pergamon Press: Oxford, UK, 1981. [Google Scholar]
- Torkashvand, A.M.; Irani, A.; Sorur, J. The preparation of landslide map by landslide numerical risk factor (LNRF) model and geographic information system (GIS). Egypt. J. Remote Sens. Space Sci. 2014, 17, 159–170. [Google Scholar] [CrossRef] [Green Version]
- Guo, C.; Montgomery, D.R.; Zhang, Y.; Wang, K.; Yang, Z. Quantitative assessment of landslide susceptibility along the xianshuihe fault zone, tibetan plateau, China. Geomorphology 2015, 248, 93–110. [Google Scholar] [CrossRef]
- Seismological Center, Central Weather Bureau. 2021. Available online: https://scweb.cwb.gov.tw/zh-tw/earthquake/data (accessed on 1 January 2021).
- SPSS. SPSS 14.0 Brief Guide; SPSS Inc.: Chicago, IL, USA, 2005. [Google Scholar]
- Chen, Y.R.; Chang, C.M.; Tseng, C.M.; Hung, M.Z.; Hsieh, S.C. New model of hazard potential index based on slope land disturbance and regional carrying capacity: A case study of Namaxia District in Kaohsiung City, Taiwan. Environ. Earth Sci. 2021, 80, 440. [Google Scholar] [CrossRef]
- Soil and Water Conservation Bureau, Council of Agriculture, Executive Yuan. 2021. Available online: https://246.swcb.gov.tw/ (accessed on 1 January 2021).


| Satellite Image | Kappa | OA (%) | Kappa (Mosaic) | OA (%) (Mosaic) | ||||
|---|---|---|---|---|---|---|---|---|
| No | Year | Date | Before/After Event | Township | ||||
| 1 | 2004 | 10 Feb. | Before Typhoon Mindulle | Alishan | 0.60 | 65.7 | ||
| 2 | 2004 | 10 July | After Typhoon Mindulle | Alishan | 0.75 | 77.1 | ||
| 3 | 2008 | 5 Jan. | Before the 0305 Earthquake and Typhoon Kalmaegi | Alishan | 0.65 | 68.0 | 0.65 | 67.5 |
| 4 | 2008 | 10 Jan. | Before the 0305 Earthquake and Typhoon Kalmaegi | Alishan | 0.64 | 66.9 | ||
| 5 | 2008 | 21 July | After the 0305 Earthquake and Typhoon Kalmaegi | Alishan | 0.75 | 77.1 | ||
| 6 | 2008 | 5 Jan. | Before the 0305 Earthquake and Typhoon Kalmaegi | Dapu | 0.63 | 68.0 | ||
| 7 | 2008 | 21 July | After the 0305 Earthquake and Typhoon Kalmaegi | Dapu | 0.70 | 73.1 | ||
| 8 | 2009 | 12 Apr. | Before Typhoon Morakot and the 1105 earthquake | Dapu | 0.66 | 70.3 | ||
| 9 | 2009 | 6 Nov. | After Typhoon Morakot and the 1105 earthquake | Dapu | 0.62 | 66.9 | ||
| 10 | 2010 | 11 Apr. | Before the 0726 heavy rain | Dapu | 0.67 | 70.9 | ||
| 11 | 2010 | 4 Aug. | After the 0726 heavy rain | Dapu | 0.67 | 71.4 | ||
| 12 | 2010 | 4 Aug. | Before Typhoon Fanapi and the 1108 Earthquake | Dapu | 0.65 | 69.1 | ||
| 13 | 2010 | 27 Dec. | After Typhoon Fanapi and the 1108 Earthquake | Dapu | 0.65 | 69.1 | ||
| 14 | 2011 | 27 July | Before the Typhoon Nanmadol | Dapu | 0.71 | 74.9 | 0.68 | 72.0 |
| 15 | 2011 | 16 Aug. | Before the Typhoon Nanmadol | Dapu | 0.64 | 69.1 | ||
| 16 | 2011 | 27 Sep. | After the Typhoon Nanmadol | Dapu | 0.61 | 66.9 | ||
| 17 | 2012 | 10 Feb. | Before the 0226 earthquake | Dapu | 0.78 | 80.0 | ||
| 18 | 2012 | 7 Mar. | After the 0226 earthquake | Dapu | 0.66 | 70.2 | ||
| 19 | 2013 | 2 June | Before the 0602 earthquake | Alishan | 0.68 | 71.4 | ||
| 20 | 2013 | 29 June | After the 0602 earthquake | Alishan | 0.62 | 65.7 | 0.63 | 66.3 |
| 21 | 2013 | 4 July | After the 0602 earthquake | Alishan | 0.63 | 66.9 | ||
| 22 | 2015 | 28 Feb. | Before the 0520 heavy rain | Alishan | 0.66 | 68.6 | ||
| 23 | 2015 | 10 June | After the 0520 heavy rain | Alishan | 0.68 | 70.9 | ||
| 24 | 2015 | 5 Mar. | Before the 0520 heavy rain | Dapu | 0.73 | 74.9 | ||
| 25 | 2015 | 10 June | After the 0520 heavy rain | Dapu | 0.70 | 73.1 | ||
| 26 | 2015 | 28 Nov. | Before the 0206 earthquake | Alishan | 0.61 | 65.7 | ||
| 27 | 2016 | 14 Feb. | After the 0206 earthquake | Alishan | 0.64 | 66.9 | 0.68 | 70.3 |
| 28 | 2016 | 30 Mar. | After the 0206 earthquake | Alishan | 0.72 | 73.7 | ||
| 29 | 2015 | 28 Nov. | Before the 0206 earthquake | Dapu | 0.63 | 68.0 | ||
| 30 | 2016 | 30 Mar. | After the 0206 earthquake | Dapu | 0.66 | 70.3 | ||
| 31 | 2016 | 30 Mar. | Before Typhoon Megi | Dapu | 0.66 | 69.7 | ||
| 32 | 2016 | 19 Nov. | After Typhoon Megi | Dapu | 0.64 | 68.6 | ||
| 33 | 2017 | 18 Oct. | Before the 1122 earthquake | Alishan | 0.60 | 64.6 | 0.62 | 66.3 |
| 34 | 2017 | 17 Nov. | Before the 1122 earthquake | Alishan | 0.64 | 68.0 | ||
| 35 | 2018 | 16 Jan. | After the 1122 earthquake | Alishan | 0.66 | 69.7 | ||
| 36 | 2017 | 17 Nov. | Before the 0320 earthquake | Dapu | 0.65 | 68.6 | ||
| 37 | 2018 | 9 Apr. | After the 0320 earthquake | Dapu | 0.72 | 74.3 | ||
| Total Average | Kappa = 0.66 OA = 70.1% | |||||||
| (a) Slope Land Use Disturbance Factor | |||
|---|---|---|---|
| Item | Degree of Influence of Characteristic Variables | ||
| Mean Decrease Accuracy | Explanatory Power | Correlation Value | |
| Road Density | 39.88 | 0.15 | 0.39 |
| Building Density | 37.59 | 0.14 | 0.37 |
| Bare Density | 48.00 | 0.18 | 0.42 |
| Crop Density | 61.42 | 0.22 | −0.48 |
| Green Coverage | 84.35 | 0.31 | −0.56 |
| Total | 271.24 | 1 | |
| (b) Natural Environment Factors | |||
| Item | Degree of Influence of Characteristic Variables | ||
| Mean Decrease Accuracy | Explanatory Power | Correlation Value | |
| Elevation Code | 103.09 | 0.13 | −0.36 |
| Slope Code | 235.93 | 0.29 | −0.54 |
| Aspect Code | 90.90 | 0.11 | −0.33 |
| Geology Code | 117.76 | 0.14 | 0.37 |
| Distance Code from Water system | 150.72 | 0.18 | −0.42 |
| Distance Code from Fault | 120.81 | 0.15 | 0.39 |
| Total | 819.21 | 1 | |
| Slope Use Disturbance Factor | Green Coverage | Crop Density | Building Density | Road Density | Bare Density |
|---|---|---|---|---|---|
| Score | 1 | 2 | 3 | 4 | 5 |
| Natural Environment Factors | Distance Code from Fault | Geology Code | Aspect Code | Elevation Code | Distance Code from Water System | Slope Code |
|---|---|---|---|---|---|---|
| Score | 1 | 2 | 3 | 4 | 5 | 6 |
| Trigger Factor | Index | Influence Degree of Characteristic Variables | ||
|---|---|---|---|---|
| Mean Decrease Accuracy | Explanatory Power | Score | ||
| Single Rain | EAR × I3Rmax | 90.97 | 0.27 | 0.27 |
| Single Earthquake | PGA | 54.28 | 0.16 | 0.16 |
| Post-Earthquake Rainfall | EAR × I3Rmax | 48.34 | 0.14 | 0.32 |
| PGA | 60.88 | 0.18 | ||
| post-rainfall Earthquake | EAR × I3Rmax | 45.50 | 0.13 | 0.25 |
| PGA | 39.34 | 0.12 | ||
| Total | 339.31 | 1 | ||
| Interval No. | Number of Grids with Landslide | Number of Grids without Landslide | Landslide Grid Ratio | |
|---|---|---|---|---|
| Number of Grids with Landslide/ Number of Grids without Landslide | Number of Grids with Landslide/ Total Number of Grids in the Interval | |||
| A | 16,373 | 33,326 | 0.49 | 0.33 |
| B | 1656 | 2297 | 0.72 | 0.42 |
| C | 644 | 489 | 1.32 | 0.57 |
| D | 14,795 | 1001 | 14.80 | 0.94 |
| E | 1132 | 47 | 24.10 | 0.96 |
| F | 216 | 6 | 36.00 | 0.97 |
| G | 2205 | 30 | 73.50 | 0.99 |
| H | 176 | 1 | 176.00 | 0.99 |
| I | 0 | 0 | — | — |
| Trigger Factor | (a) Single Rainfall | (b) Single Earthquake | |||
|---|---|---|---|---|---|
| Accuracy | Training | Testing | Training | Testing | |
| PA of Grids with Landslide | 91.61% | 83.14% | 98.66% | 95.96% | |
| PA of Grids without Landslide | 99.40% | 92.17% | 99.90% | 95.63% | |
| Overall Accuracy | 100% | 89.84% | 99.92% | 95.70% | |
| Trigger Factor | (c) Post-rainfall Earthquake | (d) Post-earthquake Rainfall | |||
| Accuracy | Training | Testing | Training | Testing | |
| PA of Grids with Landslide | 98.23% | 87.02% | 96.26% | 89.99% | |
| PA of Grids without Landslide | 99.68% | 88.01% | 98.21% | 92.22% | |
| Overall Accuracy | 100% | 88.27% | 99.84% | 91.67% | |
| Single Typhoon or Rainfall | Typhoon Mindulle | 0726 Heavy Rain | Typhoon Nanmadol | ||||
|---|---|---|---|---|---|---|---|
| Coverage | Alishan Township | Dapu Township | Dapu Township | ||||
| Evaluation Result | |||||||
| Landslide | Non-landslide | Landslide | Non-landslide | Landslide | Non-landslide | ||
| Actual Situation | Landslide | 6083 | 919 | 697 | 2 | 522 | 1 |
| Non-landslide | 20,948 | 225,031 | 3993 | 77,505 | 2279 | 76,647 | |
| PA of Grids with Landslide | 86.88% | 99.71% | 99.81% | ||||
| PA of Grids without Landslide | 91.48% | 95.10% | 97.11% | ||||
| Overall Accuracy | 91.36% | 95.14% | 97.13% | ||||
| Single Rainfall or Earthquake | 0520 Heavy Rain | 0520 Heavy Rain | Typhoon Megi | ||||
| Coverage | Alishan Township | Dapu Township | Dapu Township | ||||
| Evaluation Result | |||||||
| Landslide | Non-landslide | Landslide | Non-landslide | Landslide | Non-landslide | ||
| Actual | Landslide | 3958 | 467 | 1012 | 177 | 577 | 38 |
| Non-landslide | 18,868 | 242,051 | 5341 | 70,094 | 3296 | 78,541 | |
| PA of Grids with Landslide | 89.45% | 85.11% | 93.82% | ||||
| PA of Grids without Landslide | 92.77% | 92.92% | 95.96% | ||||
| Overall Accuracy | 92.71% | 92.80% | 95.96% | ||||
| Single Earthquake | 0226 Earthquake | 0602 Earthquake | 0206 Earthquake | ||||
|---|---|---|---|---|---|---|---|
| Coverage | Dapu Township | Alishan Township | Alishan Township | ||||
| Evaluation Result | |||||||
| Landslide | Non-landslide | Landslide | Non-landslide | Landslide | Non-landslide | ||
| Actual Situation | Landslide | 687 | 22 | 6602 | 157 | 3839 | 122 |
| Non-landslide | 3155 | 76,990 | 10,587 | 236,645 | 11,263 | 249,499 | |
| PA of Grids with Landslide | 96.90% | 97.68% | 96.92% | ||||
| PA of Grids without Landslide | 96.06% | 95.72% | 95.68% | ||||
| Overall Accuracy | 96.07% | 95.77% | 95.70% | ||||
| Single Earthquake | 0206 Earthquake | 1122 Earthquake | 0320 Earthquake | ||||
| Coverage | Dapu Township | Alishan Township | Dapu Township | ||||
| Evaluation Result | |||||||
| Landslide | Non-landslide | Landslide | Non-landslide | Landslide | Non-landslide | ||
| Actual Situation | Landslide | 475 | 27 | 3139 | 6 | 484 | 5 |
| Non-landslide | 2197 | 79,731 | 14,714 | 253,350 | 3219 | 76,404 | |
| PA of Grids with Landslide | 94.62% | 99.81% | 98.98% | ||||
| PA of Grids without Landslide | 97.32% | 94.51% | 95.96% | ||||
| Overall Accuracy | 97.30% | 94.57% | 95.98% | ||||
| Post-Rainfall Earthquake | 1105 Earthquake after Typhoon Morakot | 1108 Earthquake after Typhoon Fanapi | |||
|---|---|---|---|---|---|
| Coverage | Dapu Township | Dapu Township | |||
| Evaluation Result | |||||
| Landslide | Non-landslide | Landslide | Non-landslide | ||
| Actual Situation | Landslide | 1568 | 116 | 962 | 24 |
| Non-landslide | 12,975 | 67,610 | 5102 | 74,832 | |
| PA of Grids with Landslide | 93.11% | 97.57% | |||
| PA of Grids without Landslide | 83.90% | 93.62% | |||
| Overall Accuracy | 84.09% | 93.67% | |||
| Post-Earthquake Rainfall | Typhoon Kalmaegi after 0305 Earthquake | Typhoon Kalmaegi after 0305 Earthquake | |||
|---|---|---|---|---|---|
| Coverage | Alishan Township | Dapu Township | |||
| Evaluation Result | |||||
| Landslide | Non-landslide | Landslide | Non-landslide | ||
| Actual Situation | Landslide | 3348 | 184 | 910 | 67 |
| Non-landslide | 15,377 | 221,588 | 10,275 | 52,018 | |
| PA of Grids with Landslide | 94.79% | 93.14% | |||
| PA of Grids without Landslide | 93.51% | 83.51% | |||
| Overall Accuracy | 93.53% | 83.65% | |||
| Trigger | Single Rainfall | Single Earthquake | Post-Earthquake Rainfall | ||||
|---|---|---|---|---|---|---|---|
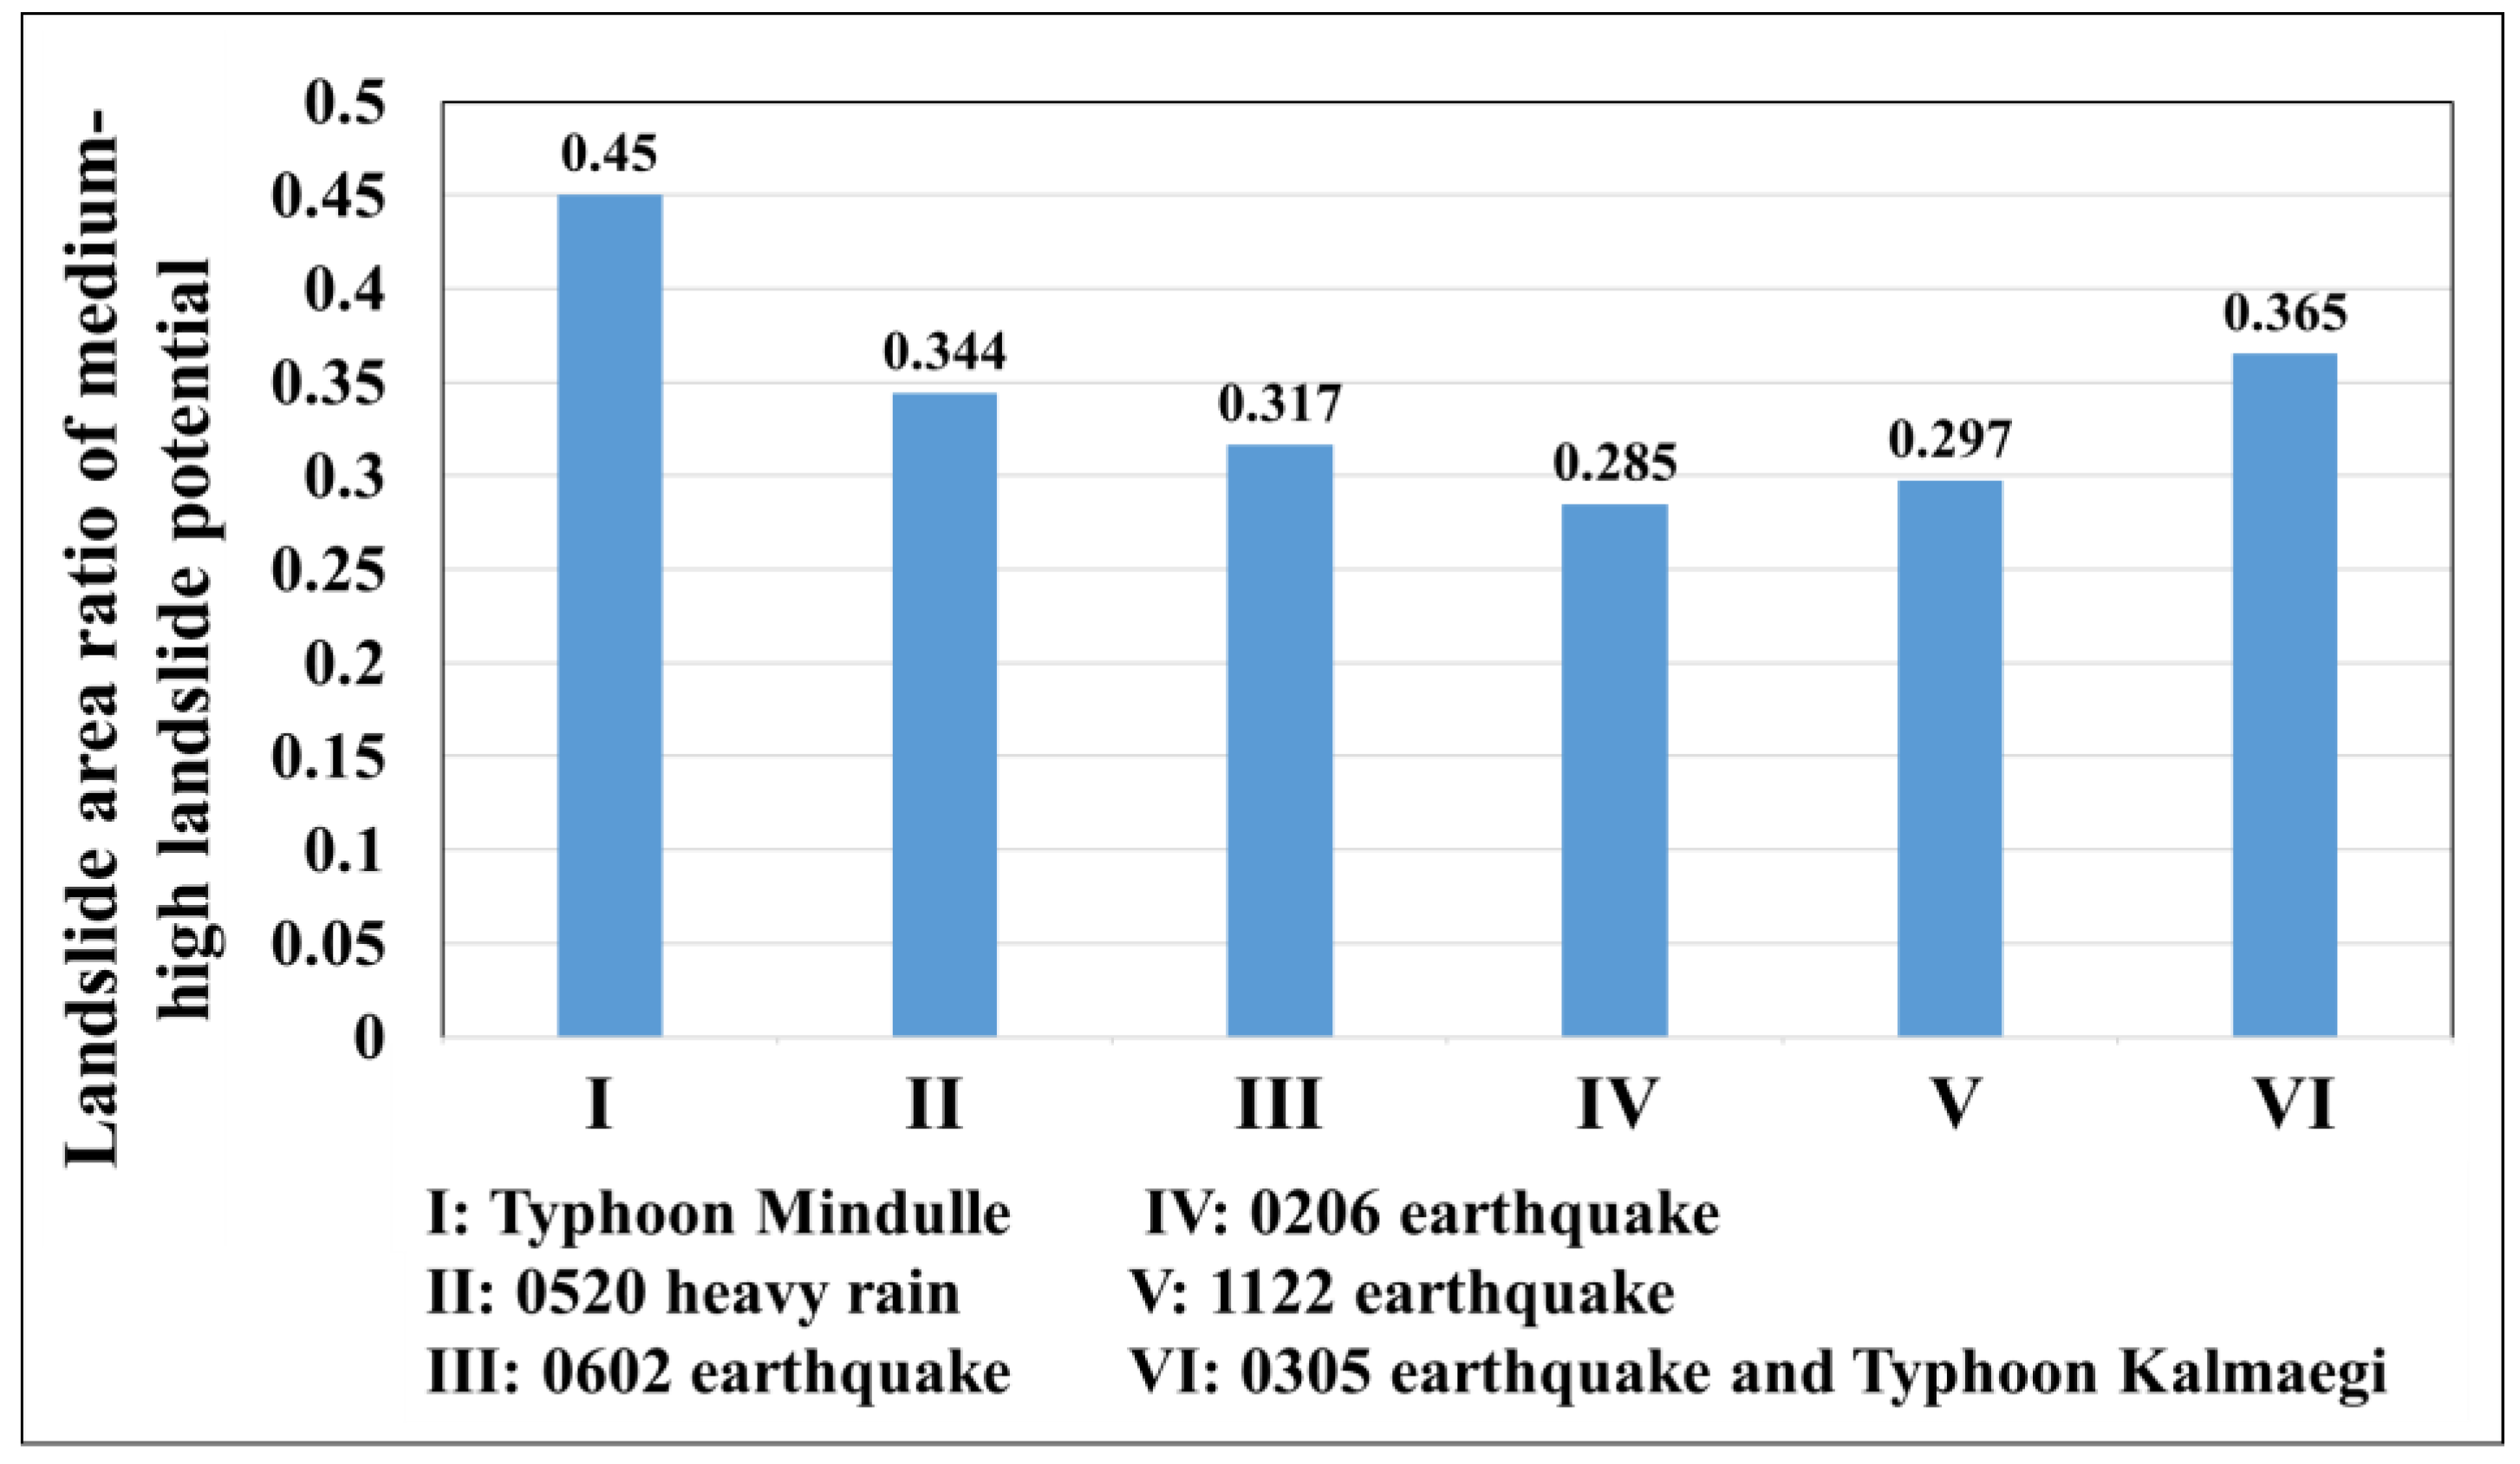
| Landslide Area or Area Ratio | Typhoon Mindulle | 0520 Heavy Rainfall | 0602 Earthquake | 0206 Earthquake | 1122 Earthquake | Typhoon Kalmaegi after 0305 Earthquake | |
| Total area of historical disaster areas (hectares) | 1394.6 | 1394.6 | 1394.6 | 1394.6 | 1394.6 | 1394.6 | |
| Area (hectares) in historical disaster area with medium-high landslide potential | 627.9 | 480.1 | 441.4 | 397.3 | 414.7 | 509.1 | |
| Landslide area ratio of medium-high landslide potential | 0.45 | 0.344 | 0.317 | 0.285 | 0.297 | 0.365 | |
| Trigger | Single Rainfall | Single Earthquake | Post-Earthquake Rainfall | Post-Rainfall Earthquake | |||||||
|---|---|---|---|---|---|---|---|---|---|---|---|
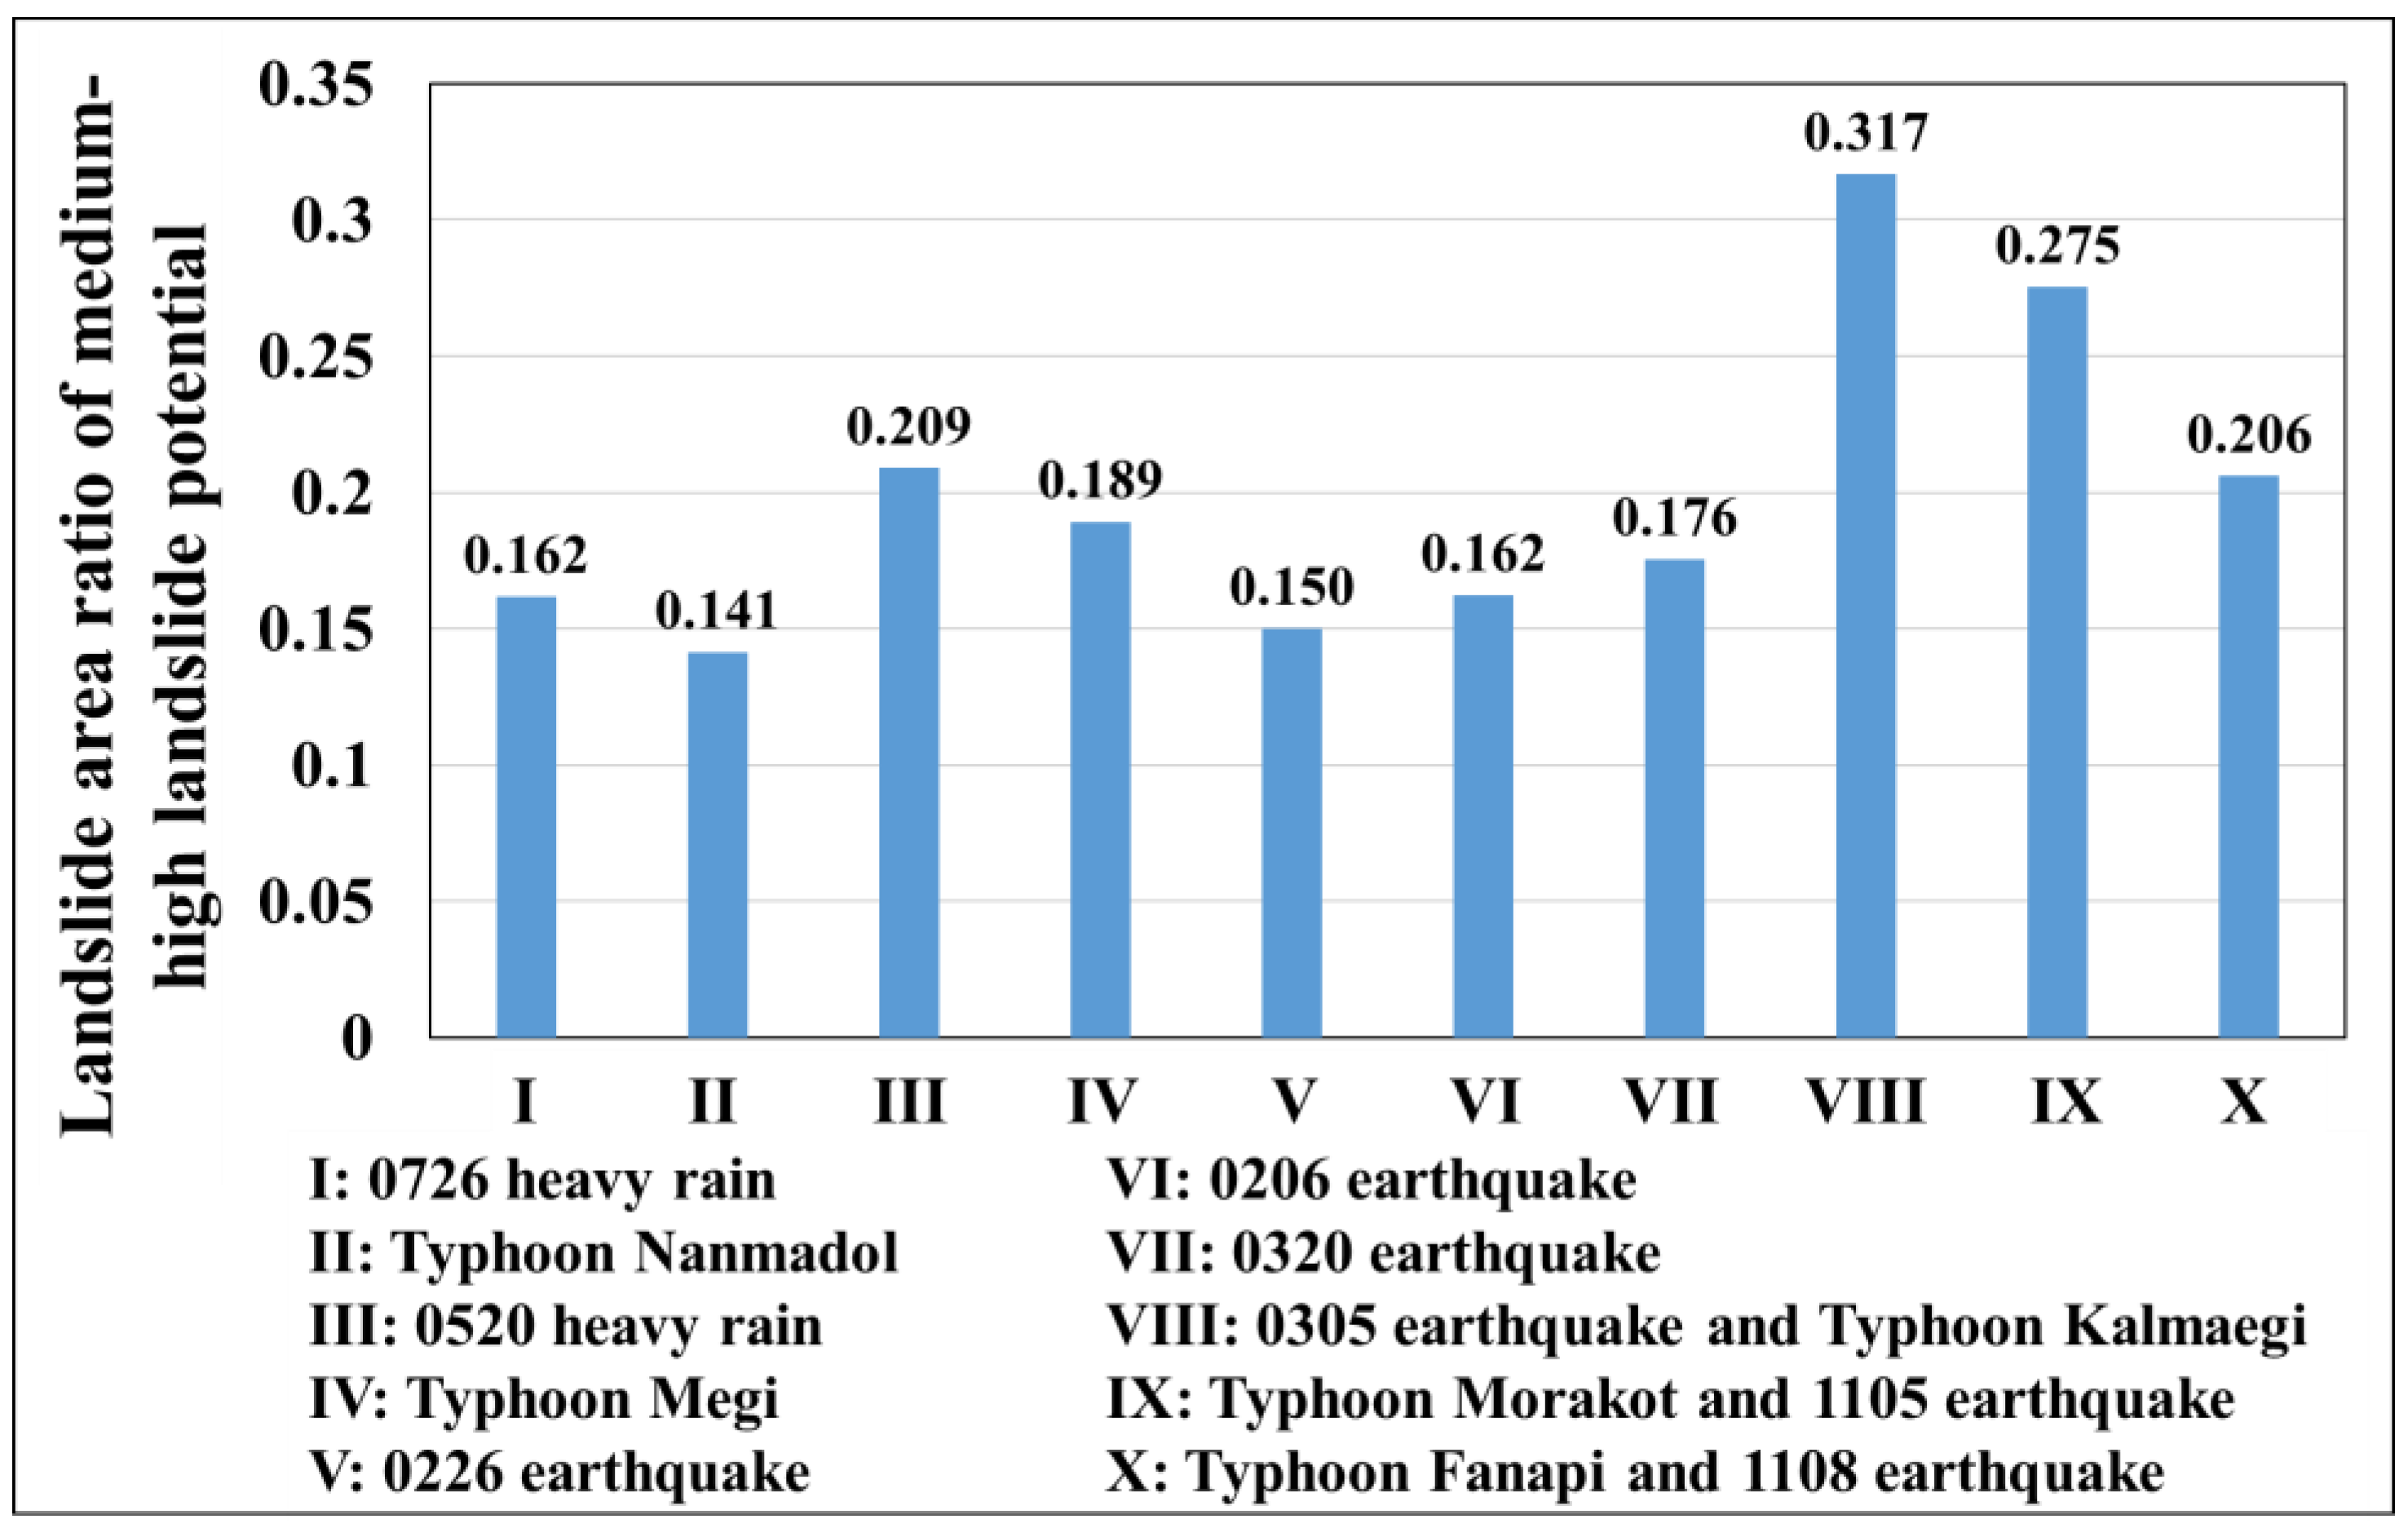
| Landslide Area or Area Ratio | 0726 Heavy Rain | Typhoon Nanmadol | 0520 Heavy Rain | Typhoon Megi | 0226 Earthquake | 0206 Earthquake | 0320 Earthquake | Typhoon Kalmaegi after 0305 Earthquake | 1105 Earthquake after Typhoon Morakot | 1108 Earthquake after Typhoon Fanapi | |
| Total area of historical disaster areas (hectares) | 482.6 | 482.6 | 482.6 | 482.6 | 482.6 | 482.6 | 482.6 | 482.6 | 482.6 | 482.6 | |
| Area (hectares) in historical disaster area with medium-high landslide potential | 78 | 68.2 | 100.8 | 91.3 | 72.4 | 78.3 | 84.7 | 152.9 | 132.9 | 99.4 | |
| Landslide area ratio of medium-high landslide potential | 0.162 | 0.141 | 0.209 | 0.189 | 0.15 | 0.162 | 0.176 | 0.317 | 0.275 | 0.206 | |
| (a) Alishan Township | ||||||||||||
|---|---|---|---|---|---|---|---|---|---|---|---|---|
| Rainfall or (and) Earthquake | EAR × I3Rmax (mm2/3-h) | PGA (gal) | ||||||||||
| Maximum | Minimum | Mean | Maximum | Minimum | Mean | |||||||
| Typhoon Mindulle | 138,449 | 39,993 | 86,407 | |||||||||
| 0520 Heavy Rainfall | 85,608 | 19,767 | 45,671 | |||||||||
| 0602 Earthquake | 445 | 34 | 116 | |||||||||
| 0206 Earthquake | 212 | 52 | 126 | |||||||||
| 1122 Earthquake | 318 | 32 | 94 | |||||||||
| Typhoon Kalmaegi after 0305 Earthquake | 131,572 | 18,518 | 82,081 | 88 | 7 | 35 | ||||||
| (b) Dapu Township | ||||||||||||
| Rainfall or (and) Earthquake | EAR × I3Rmax (mm2/3-h) | PGA (gal) | ||||||||||
| Maximum | Minimum | Mean | Maximum | Minimum | Mean | |||||||
| 0726 Heavy Rainfall | 23,269 | 4713 | 11,161 | |||||||||
| Typhoon Nanmadol | 10,299 | 4856 | 7259 | |||||||||
| 0520 Heavy Rainfall | 67,375 | 40,667 | 58,007 | |||||||||
| Typhoon Megi | 78,593 | 20,659 | 39,822 | |||||||||
| 0226 Earthquake | 68 | 25 | 55 | |||||||||
| 0206 Earthquake | 185 | 72 | 138 | |||||||||
| 0320 Earthquake | 243 | 77 | 146 | |||||||||
| Typhoon Kalmaegi after 0305 Earthquake | 193,711 | 115,644 | 164,877 | 169 | 13 | 55 | ||||||
| 1105 Earthquake After Typhoon Morakot | 437,136 | 158,541 | 295,497 | 68 | 16 | 35 | ||||||
| 1108 Earthquake after Typhoon Fanapi | 35,863 | 9268 | 20,962 | 208 | 23 | 69 | ||||||
Publisher’s Note: MDPI stays neutral with regard to jurisdictional claims in published maps and institutional affiliations. |
© 2022 by the authors. Licensee MDPI, Basel, Switzerland. This article is an open access article distributed under the terms and conditions of the Creative Commons Attribution (CC BY) license (https://creativecommons.org/licenses/by/4.0/).
Share and Cite
Tseng, C.-M.; Chen, Y.-R.; Chang, C.-M.; Yang, Y.-L.; Chen, Y.-R.; Hsieh, S.-C. Statistical Analysis of the Potential of Landslides Induced by Combination between Rainfall and Earthquakes. Water 2022, 14, 3691. https://doi.org/10.3390/w14223691
Tseng C-M, Chen Y-R, Chang C-M, Yang Y-L, Chen Y-R, Hsieh S-C. Statistical Analysis of the Potential of Landslides Induced by Combination between Rainfall and Earthquakes. Water. 2022; 14(22):3691. https://doi.org/10.3390/w14223691
Chicago/Turabian StyleTseng, Chih-Ming, Yie-Ruey Chen, Chwen-Ming Chang, Ya-Ling Yang, Yu-Ru Chen, and Shun-Chieh Hsieh. 2022. "Statistical Analysis of the Potential of Landslides Induced by Combination between Rainfall and Earthquakes" Water 14, no. 22: 3691. https://doi.org/10.3390/w14223691