
Agroclimatic Zone-Based Analysis of Rainfall Variability and Trends in the Wabi Shebele River Basin, Ethiopia

1
Institute of Hydrosciences, Faculty of Civil Engineering and Environmental Sciences, Universität der Bundeswehr München, 85579 Neubiberg, Germany
2
School of Water Resources and Environmental Engineering, Institute of Technology, Haramaya University, Dire Dawa 138, Ethiopia
*
Author to whom correspondence should be addressed.
Water 2022, 14(22), 3699; https://doi.org/10.3390/w14223699
Submission received: 8 August 2022
/
Revised: 21 October 2022
/
Accepted: 11 November 2022
/
Published: 16 November 2022
(This article belongs to the Section Water and Climate Change)
Abstract
:The amount and annual distribution of rainfall caused a major socioeconomic and environmental problem where rainfed agriculture is predominant. This study assessed the long-term variability and trends of rainfall in the Wabi Shebele River Basin (WSRB), Ethiopia. The basin was discretized into 9 local agroclimatic zones (ACZ) based on annual rainfall and elevation. The coefficient of variation (CV) was used to check the variability of rainfall while modified Mann-Kendall (MK) and Innovative Trend Analysis (ITA) methods were used to detect rainfall trends. For each ACZ, stations with long-term records and less than 10% of missing data were selected for further analysis. The mean annual rainfall in the basin ranges from 227.2 mm to 1047.4 mm. The study revealed most of the ACZs showed a very high variation in Belg/Spring rainfall (CV% > 30) than Kiremt/Summer and annual rainfall. Seasonal and annual rainfall trend analysis revealed that no uniform trend was detected in all ACZs. However, most of ACZs in the arid and semi-arid areas showed a non-significant decreasing trend in annual rainfall. From seasonal analysis, Belg and Kiremt rainfall showed relatively decreasing and increasing trends respectively. In comparison, a similar result was observed using MK and ITA methods.
1. Introduction
Climate change is already affecting every inhabited region across the globe with human influence contributing to many observed changes in weather and climate extremes [1]. In many regions, agricultural production is being adversely affected by rising and variability of temperatures, changes in amounts and frequency of precipitation, the increasing intensity of extreme weather events, rising sea levels, and the salinization of arable land and freshwater [2]. Africa is one of the most vulnerable regions highly affected and to be affected by the impacts of climate change [3]. Due to its low adaptive capacity and high sensitivity to socio-economic systems. Similarly, Ethiopia relies on subsistence rainfed agriculture as the main source of national income; consequently, the importance of the timing and amount of rainfall that occurs cannot be overstated [4].
Besides, Ethiopia generates most of the energy needed from hydropower plants which depend on the amount of water stored in the reservoirs. The government of Ethiopia is currently implementing large-scale investments in hydropower and irrigation projects along the major river basins [5]. Thus, the country is vulnerable to climate variability, and climate change is likely to increase the frequency and magnitude of climate disasters [6,7,8]. These have made the country most susceptible to famine usually caused by drought [7]. As a result, climate variability and trend analysis at appropriate spatial and temporal scales are crucial for understanding and mitigating problems in hydrology and water resources, such as water resource development, environmental protection, and ecological balance [9,10,11].
In the past three decades, climate variability and trend analysis in hydro-meteorological data has been conducted by numerous researchers using different methods, data sources, and spatial and temporal scales. Among the methods, the Mann–Kendall test is the most widely used test for detecting monotonic upward or downward trends in hydro-meteorological and environmental data on the assumption that the observations in the time series are independent [12]. Accordingly, checking autocorrelation in the time series became a common practice before any analysis of trend detection is performed using the MK test. This test is mostly supported by Sen’s slope estimator for estimating the magnitude of a trend in the time series [13]. Both tests are non-parametric tests that do not require the data set to be normally distributed. A score of studies used this method to estimate temporal trends for different climatic variables [6,7,11,14,15,16,17,18,19,20,21,22].
Recently, Ref. [23] developed the innovative trend analysis (ITA) method to avoid all the restrictive requirements for the statistical test in the MK trend test. The basis of the approach rests on the fact that, if two-time series are identical to each other, their plot against each other shows scatters of points along 1:1 (45°) line on the Cartesian coordinate system [23,24]. National and international researchers have used the ITA method in different parts of the world [24,25,26,27,28]. The main limitation of the ITA method is that it does not allow the determination of the differences between each point and the 1:1 line is statistically significant [28].
In addition to the methods, studies used different spatial frames for trend analysis including stations [6,14,16,18,19,25,28,29], agroecosystem zonation [15,30,31], temperature-based zonation [14], and subbasin [6,14,16,18,19,25,28,29]. Similarly, the sources of the data used for the trend analysis also vary based on availability and accessibility. Observed station data is the most common source of data in climatic variabilities and trend analysis studies [7,14,16,24,28,30,32]. In recent years, reanalyzed gridded satellite climatic data have been used in different studies [6,9,15,18,29,31,33].
Numerous studies were conducted on climate variability and trend analysis in Ethiopia River basins. Some of the studies include, in Abay basin [6,15,25,34,35], in Awash basin [7,30,36,37,38], in Omo Gibe basin [5,21,31], and Tekeze basin [19,32,39]. Those studies revealed that the variabilities and trends of rainfall vary at different localities. The rainfall amount showed a general statistically decreasing trend [6,7,14,15,19,33], insignificant trends [16,36], and increasing trend [9]. In general, these studies revealed that there is no uniform temporal and spatial rainfall pattern in Ethiopia’s river basins.
Even though climate variability and change have location-specific impacts especially in Ethiopia due to high spatial and temporal variation of rainfall and topography effect, few studies have been carried out regarding rainfall variabilities and trends in the Wabi Shebele River basin. Ref. [26] assessed the spatiotemporal distribution and variability of rainfall in seasonal and annual time series in the Upper Wabi Shebele river basin using station data in MK and ITA tests. In the northern district of WSRB, Ref. [18] investigated the spatiotemporal variability and trends of rainfall and its association with Pacific Ocean SST using satellite-based rainfall data and the Mann-Kendall trend test. Because of the uneven distribution of rainfall recording stations in the basin, a study based on station data may not be sufficient for planning and decision-making. Therefore, this study investigated variations and trends in maximum daily, rainy seasons and annual rainfall in the WSRB, at the local agroclimatic zone, using modified MK and ITA methods. In general, a study based on local agroclimatic zonation overcomes the data scarcity challenge and simplifies sharing the findings with the local community.
2. Materials and Methods
2.1. Study Area
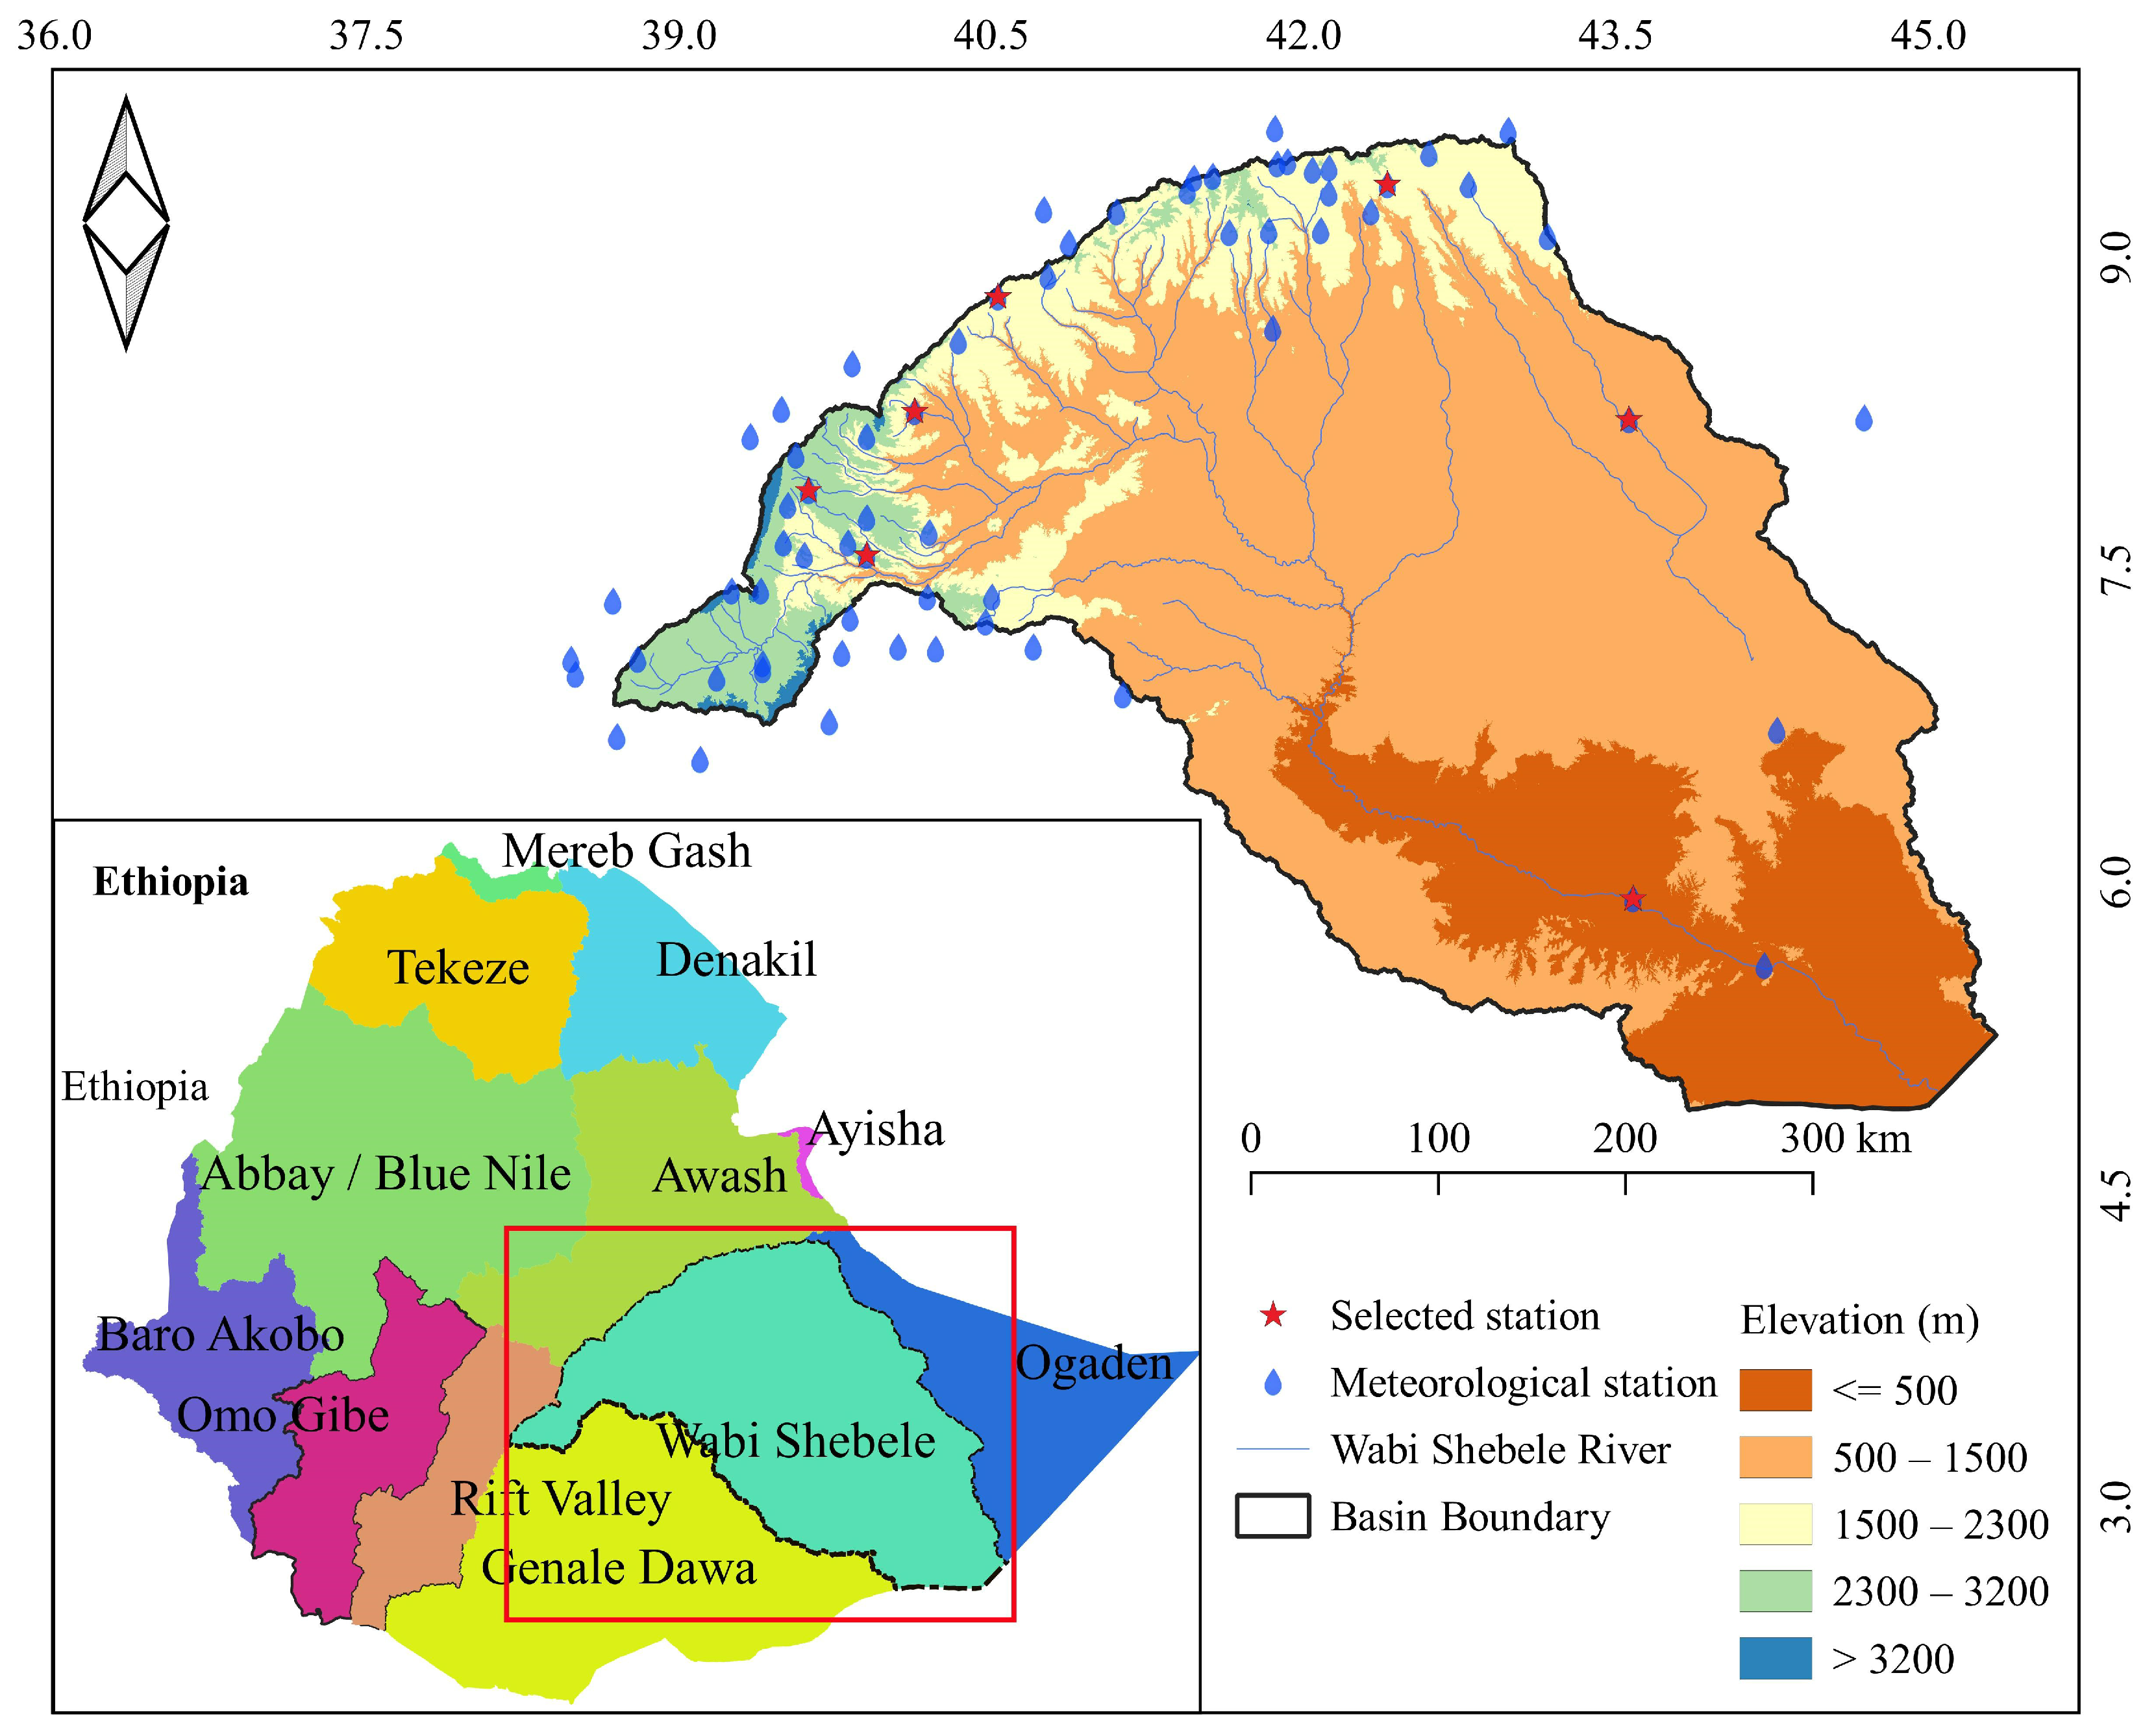
Wabi Shebele River Basin (WSRB) is one of the largest river basins in Ethiopia in terms of area coverage. The basin, which occupies a total area of 189,655 km2 comprising nearly 17% of the country’s total land area, lies between 4.91°–9.59° N latitude and 38.69°–45.33° E longitude Figure 1. The elevations of the basin vary from 179 m.a.s.l along the Ethio-Somalia border in the south to more than 4188 m.a.s.l in the northwest part of the Bale mountains. More than 80% of the area has an elevation of less than 1500 m and was considered low land (arid and semi-arid). The upstream of the basin is characterized by steep valley slopes while the lowland has gentle slopes. Annual average rainfall over the basin varies from 227 mm in the southeast to 1240 mm in the northwest. Similarly, the minimum and maximum average temperatures are 6.29 °C in the northwest and 35.98 °C in the southeast respectively. Due to bimodal rainfall distribution in the basin, there are two rainy seasons, the main rainy season (Kiremt/Summer) spans from June to September and the short rainy season (Belg/Spring) extends from March to May. The dominant soil types are Gypsisols, Calcisols, and Leptosols covering 68% of the basin. A large percentage of the population in the highlands depends on crop cultivation while the lowlanders, in general, are pastoralists.
2.2. Methods
2.2.1. Data Source and Preparation
For this study, the observed daily rainfall data of 43 stations located in the basin and 21 of its surrounding for the period from 1987 to 2016 was obtained from the National Meteorology Agency (NMA).
For each observation station, high-resolution (4 km) satellite-gauge merged rainfall data was collected from NMA. The missing data were filled in using satellite-gauge merged rainfall data because of the unpredictability of the climate in the tropical zone and the lack of reference stations to use statistical methods. For the analysis, the daily rainfall records were added to seasonal and annual rainfall. Also, daily maximum rainfall was extracted from daily rainfall data.
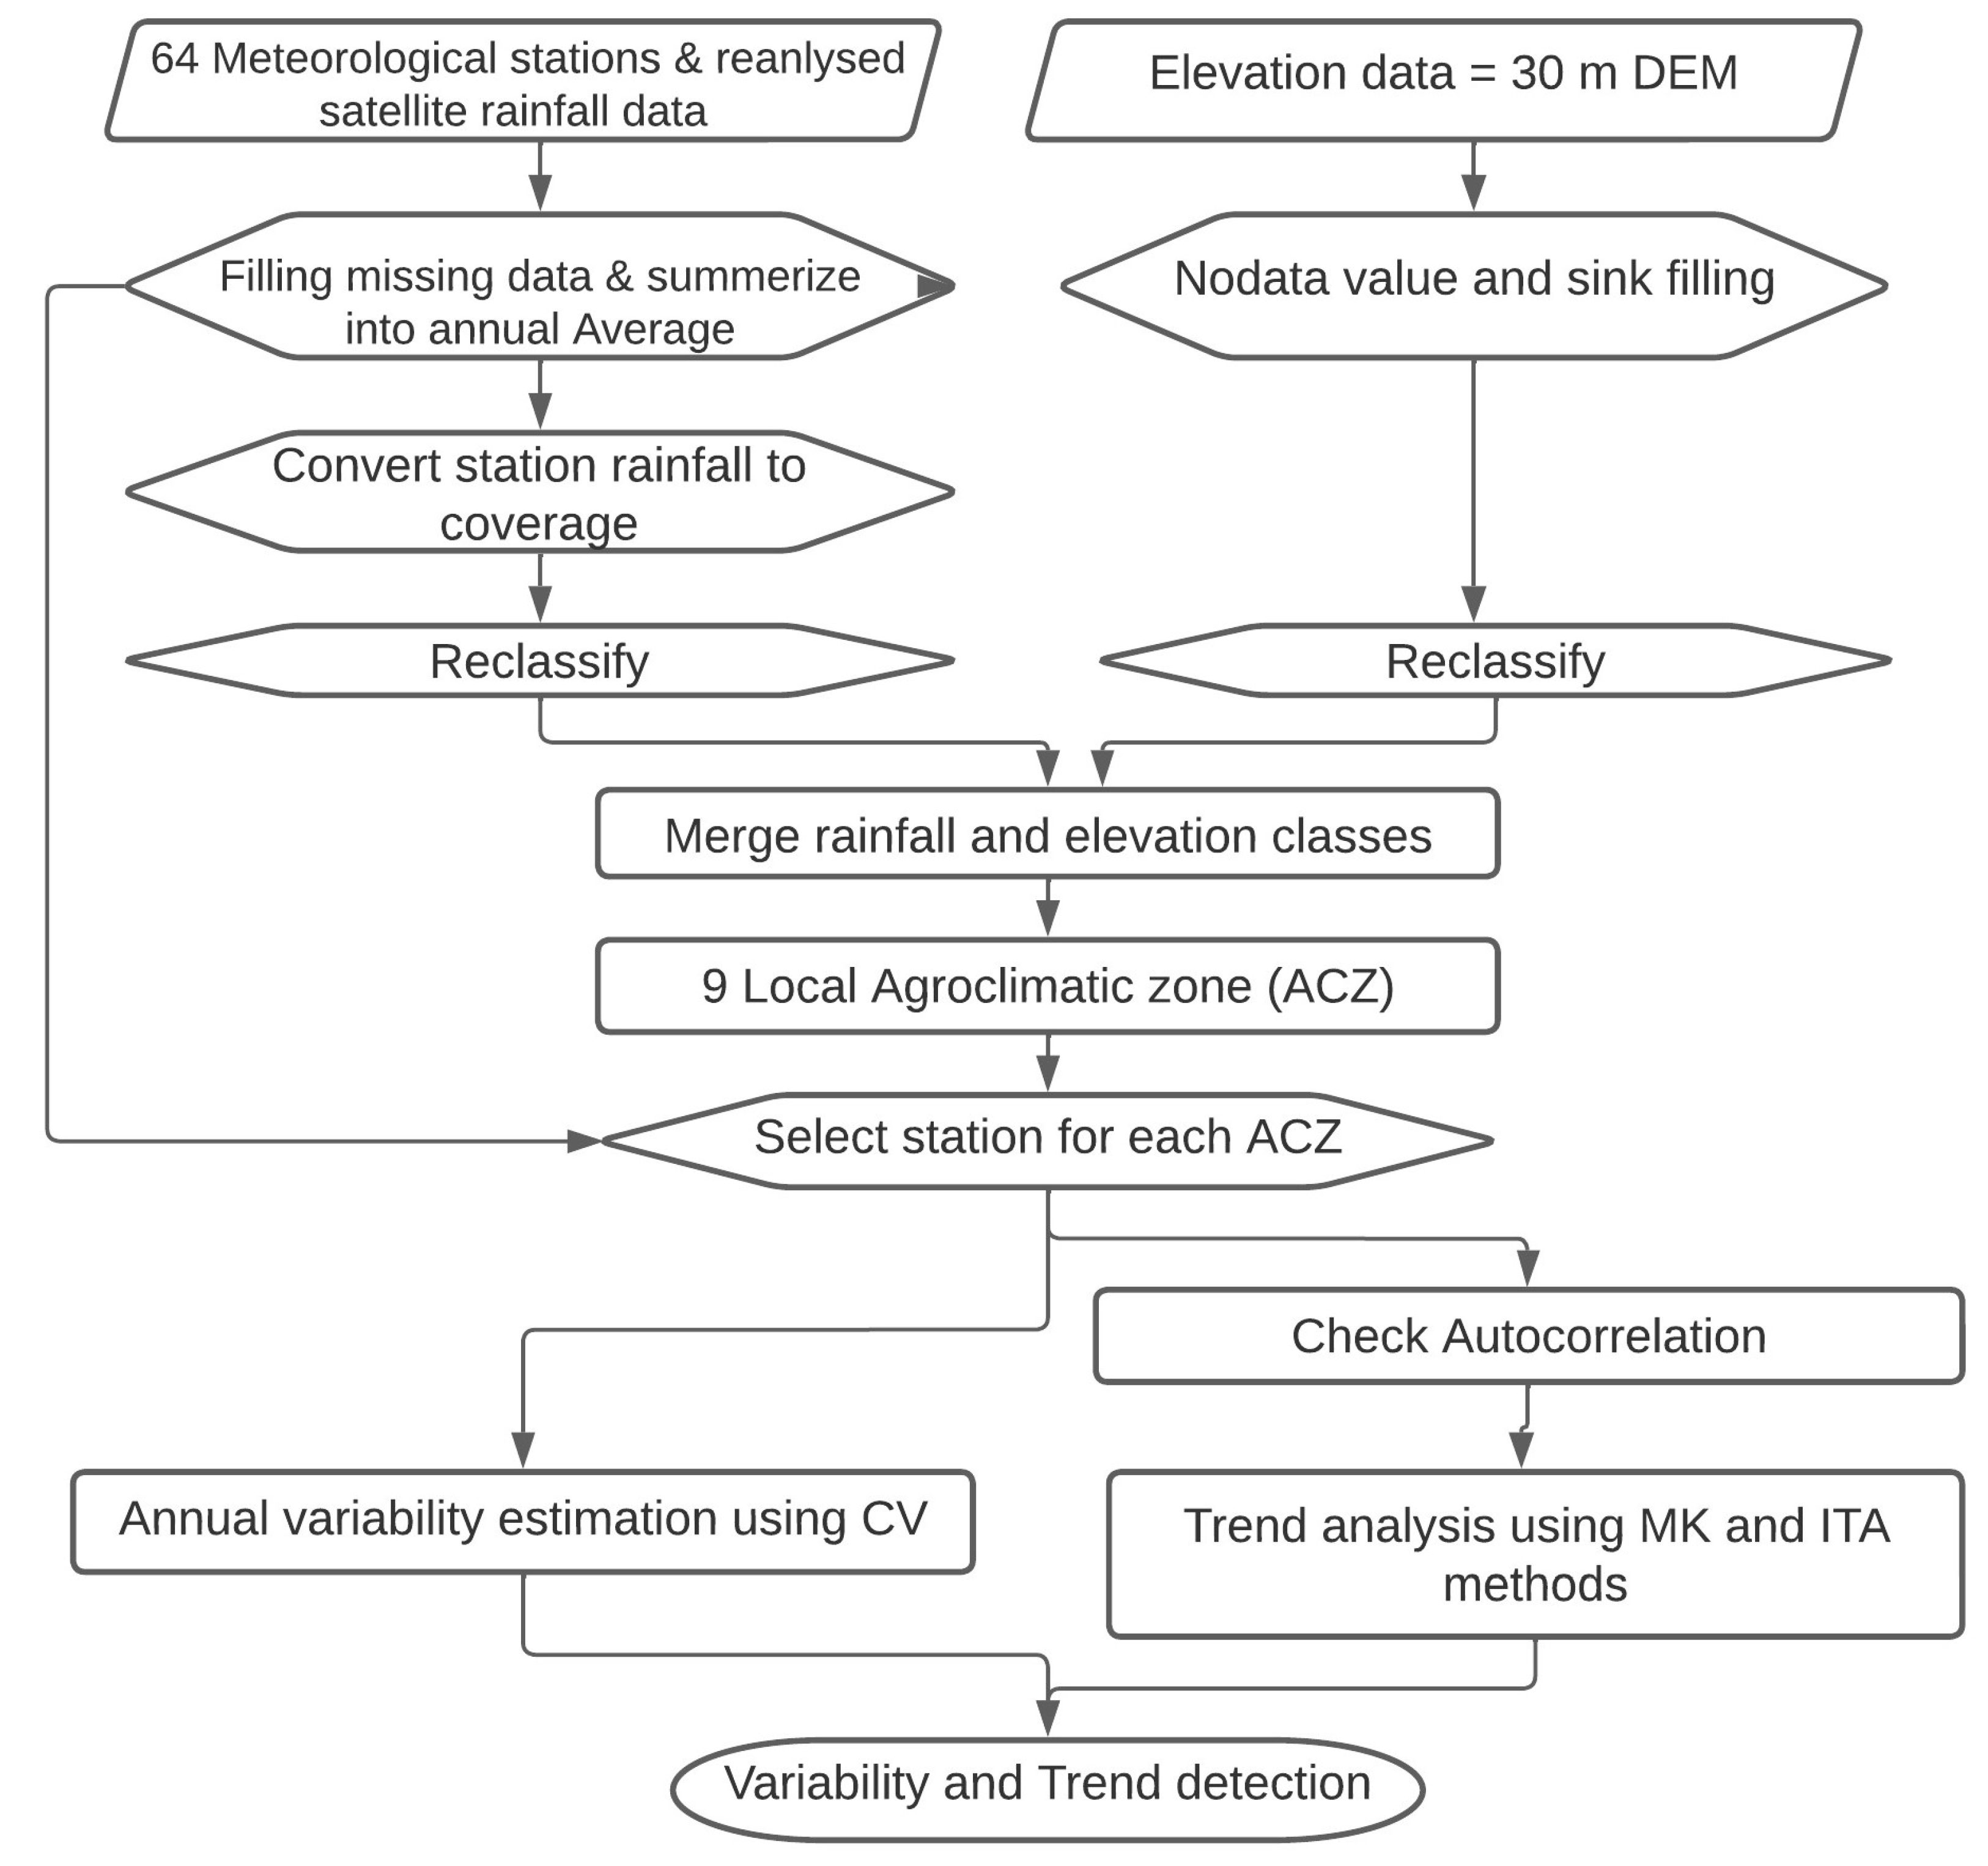
2.2.2. Agroclimatic Zonation
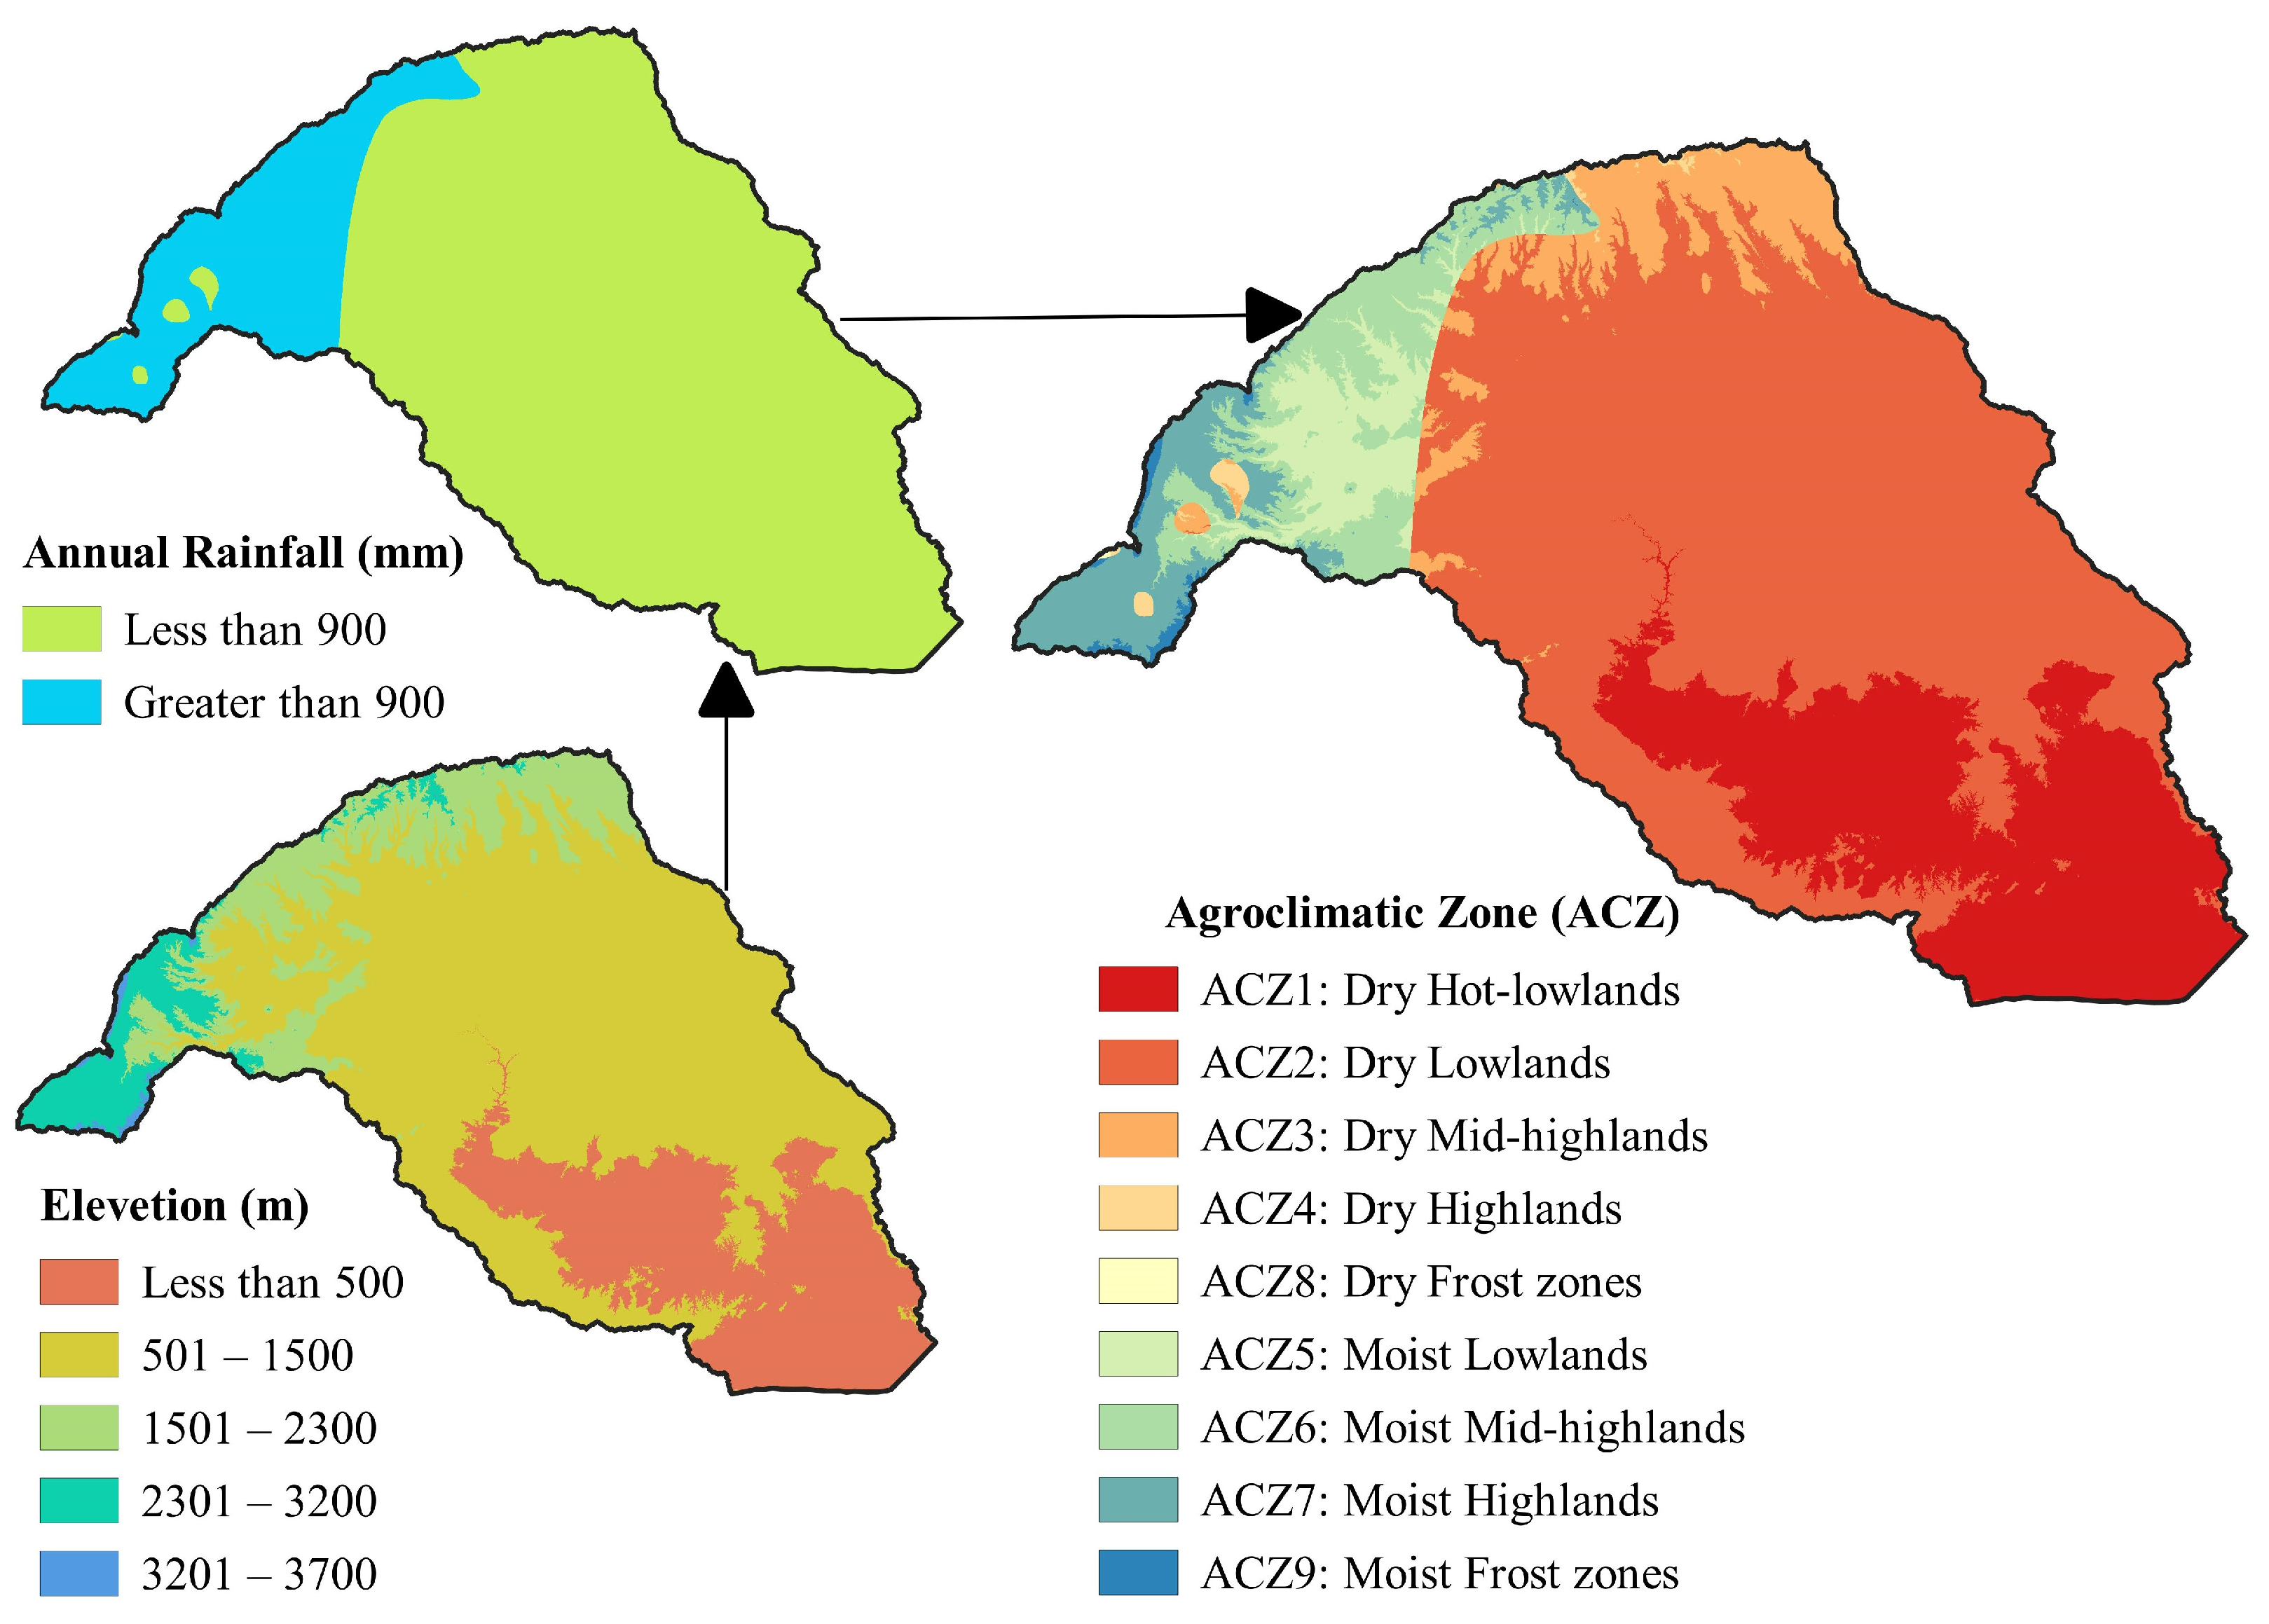
There are 17 local agroclimatic zones (ACZs) in Ethiopia based on the annual average rainfall (AARF) amount and elevation of the area [40]. Similarly, DEM of 30 m grid size and annual average rainfall were used for agroclimatic zonation of WSRB. No data and sink values of the DEM were filled using the QGIS tool. The annual average station rainfall data was converted to a spatial rainfall map using an interpolation algorithm in the QGIS environments. The elevation (filled DEM) and rainfall spatial data were reclassified based on the value range given in Table 1. Then, the reclassified maps merged to create new classes representing the unique agroclimatic zone. The basin consists of 9 out of 17 ACZs in Ethiopia. The spatial coverage and characteristic of each ACZ are presented in Figure 2 and Table 1 respectively. Based on annual rainfall amount, ACZ1, ACZ2, ACZ3, and ACZ4 are categorized as dry regions covering 81.21% of the basin whereas ACZ5, ACZ6, and ACZ7 are categorized as humid regions covering only 18.79% of the basin. This makes the basin significantly vulnerable to climatic-related issues, especially drought. On other hand, ACZs are grouped as Low land (ACZ1, ACZ2, and ACZ5), Mid-Highland (ACZ3 and ACZ6), and Highland (ACZ4, ACZ8, ACZ7, ACZ9) based on the elevation.
After local agroclimatic zonation, one station from each ACZ was selected based on the long-term availability of records and less than 10% of missing records. Dry Wurch and humid Wurch agroclimatic zone were excluded from the analysis due to the unavailability of a rainfall recording station. Besides, these zones cover less than 0.6% of the basin. Thus, rainfall data representing only 7 ACZs were considered for further analysis. The location and spatial distribution of selected stations are shown in Figure 1. The details of the meteorological stations used in this study are presented in Table 1. The reliability and quality of the data to be used in the analysis should be checked statistically. In this study, Standard Normal Homogeneity Test (SNHT) [41] and Pettitt tests [42] were used for detecting the inhomogeneity of seasonal and annual rainfall data. Due to uneven distribution and scarcity of stations in the study area, only the station found inhomogeneous in each test was eliminated from further analysis. The result of the SNHT and Pettitt test is summarized in Table 2.
2.2.3. Rainfall Seasonal and Annual Variability
For each ACZ, descriptive statistics for the long-term rainfall data were computed using standard statistical procedures using Microsoft Excel, including mean, minimum, maximum, variance, standard deviation (SD), and Coefficient of Variation (CV). The CV is a commonly used statistical measure to examine the inter-annual variation of rainfall. In this study also, the inter-annual variability of daily maximum, rainy seasons, and annual rainfall was evaluated using CV. Greater values of CV indicate larger variability, and vice versa. The CV (%) value for each series can be computed as follows:
where is the standard deviation and is the mean of time series data. In the literature, the degree of variability of rainfall based on CV classified as low (CV < 20), moderate (20 < CV < 30), and high (CV > 30) [6,15,43].
2.2.4. Rainfall Trend Analysis
Two non-parametric (Mann-Kendall and Sen’s slope estimator) and the ITA methods were used to assess the rainfall temporal trend in the Wabi Shebele River basin. The detail of these methods presented in consecutive subsections.
Modified Mann-Kendall (MK) test
The Mann–Kendall test [12] is perhaps the most widely used non-parametric test for detecting trends in hydro-meteorological and environmental data. It detects monotonic trends where data is either consistently increasing or decreasing over time. MK test does not assume the data to be normally distributed and it is flexible to outliers. While the test requires time series data to be serially independent. The test assumes a null hypothesis, , of no trend and an alternate hypothesis, , of increasing or decreasing monotonic trend. The mathematical equations for Mann-Kendall statistics S, the variance associated with S V(S), and standardized test statistics Z are as follows [12,14,44].
In these equations, and are the time-series observations in chronological order, n is the length of the time series, is the number of ties for the pth value, and q is the number of tied values. A positive (negative) value of Z indicates that the data tend to increase (decrease) with time. The strength of the trend is proportional to the magnitude of the Mann–Kendall Statistic. The null hypothesis of no trend is rejected if the absolute value of Z is greater than 1.96, and 2.58 at 5%, and 1% significance levels respectively.
Sen’s Slope Estimates
Sen developed a more robust and non-parametric procedure for estimating the magnitude of a trend in the time series [13]. The slope of data value pairs was calculated to get Sen’s slope by the relationship:
where and are the data values at times j and k (). If there is only one datum in each period, then , where n is the number of periods. However, if there are multiple observations in one or more periods, then , where n is the total number of observations.
The N values of are ranked from smallest to largest and the median of slope or Sen’s slope estimator is computed as:
Positive/negative values of indicate an increasing/decreasing trend, respectively, while its value indicates the magnitude of the trend.
Simulation experiments demonstrated that the existence of serial correlation alters the variance of the estimate of the Mann–Kendall (MK) statistic; and the presence of a trend alters the estimate of the magnitude of serial correlation [45]. Several pre-whitening procedures have been proposed by different authors to remove the influence of the autocorrelation including variance correction [46], effective sample size [47], and trend-free pre-whitening (TFPW) [44,45]. In this study, Ref. [46] procedure was applied to check and eliminate the autocorrelation before performing trend analysis. Serial autocorrelation was checked with an autocorrelation function in the modifiedmk R package [48]. Numerous researchers have also used this approach to eliminate serial correlation in time series data [7,14,17].
Innovative Trend Analysis (ITA)
Recently, Ref. [23] developed the ITA method to avoid all the restrictive requirements for a statistical trend test such as the MK test. In this trend analysis method, graphs are used as templates. The basis of the approach rests on the fact that, if two time series are identical to each other (no trend), their plot against each other shows scatters of points along 1:1 (45) line on the Cartesian coordinate system [23,24]. In this method, the time series is divided into two equal parts, which are separately sorted in ascending order. Then, the first and the second half of the time series are plotted on the X-axis and the Y-axis, respectively. If data points are located in the lower triangular area of the no-trend line, there is a decreasing trend in the time series, and vice versa [23,27]. In this study, the ITA method was applied to the daily maximum, rainy seasons, and annual rainfall from 1987 to 2016. The rainfall data were divided into two sub-series 1987–2001 (the first half) and 2002–2016 (the second half). R ‘Trendchange’ package was used to investigate the trend developed by [49]. The rainfall data points are further divided into “low”, “medium”, and “high” categories based on the position in the ITA graph. Strong trends of extreme (“high” and “low”) rainfall are associated with floods and drought (Alifujiang et al., 2020). Besides, to illustrate graphically the distance of the data points from the 1:1 line, in this paper, a confidence band (0.05 and −0.05) has been plotted. This is to help the reader to better realize the differences between the data points and the trendless line, without any statistical implications [24]. A flowchart was presented showing major activities in the methodology Figure 3.
3. Results
3.1. Rainfall Distribution and Variability
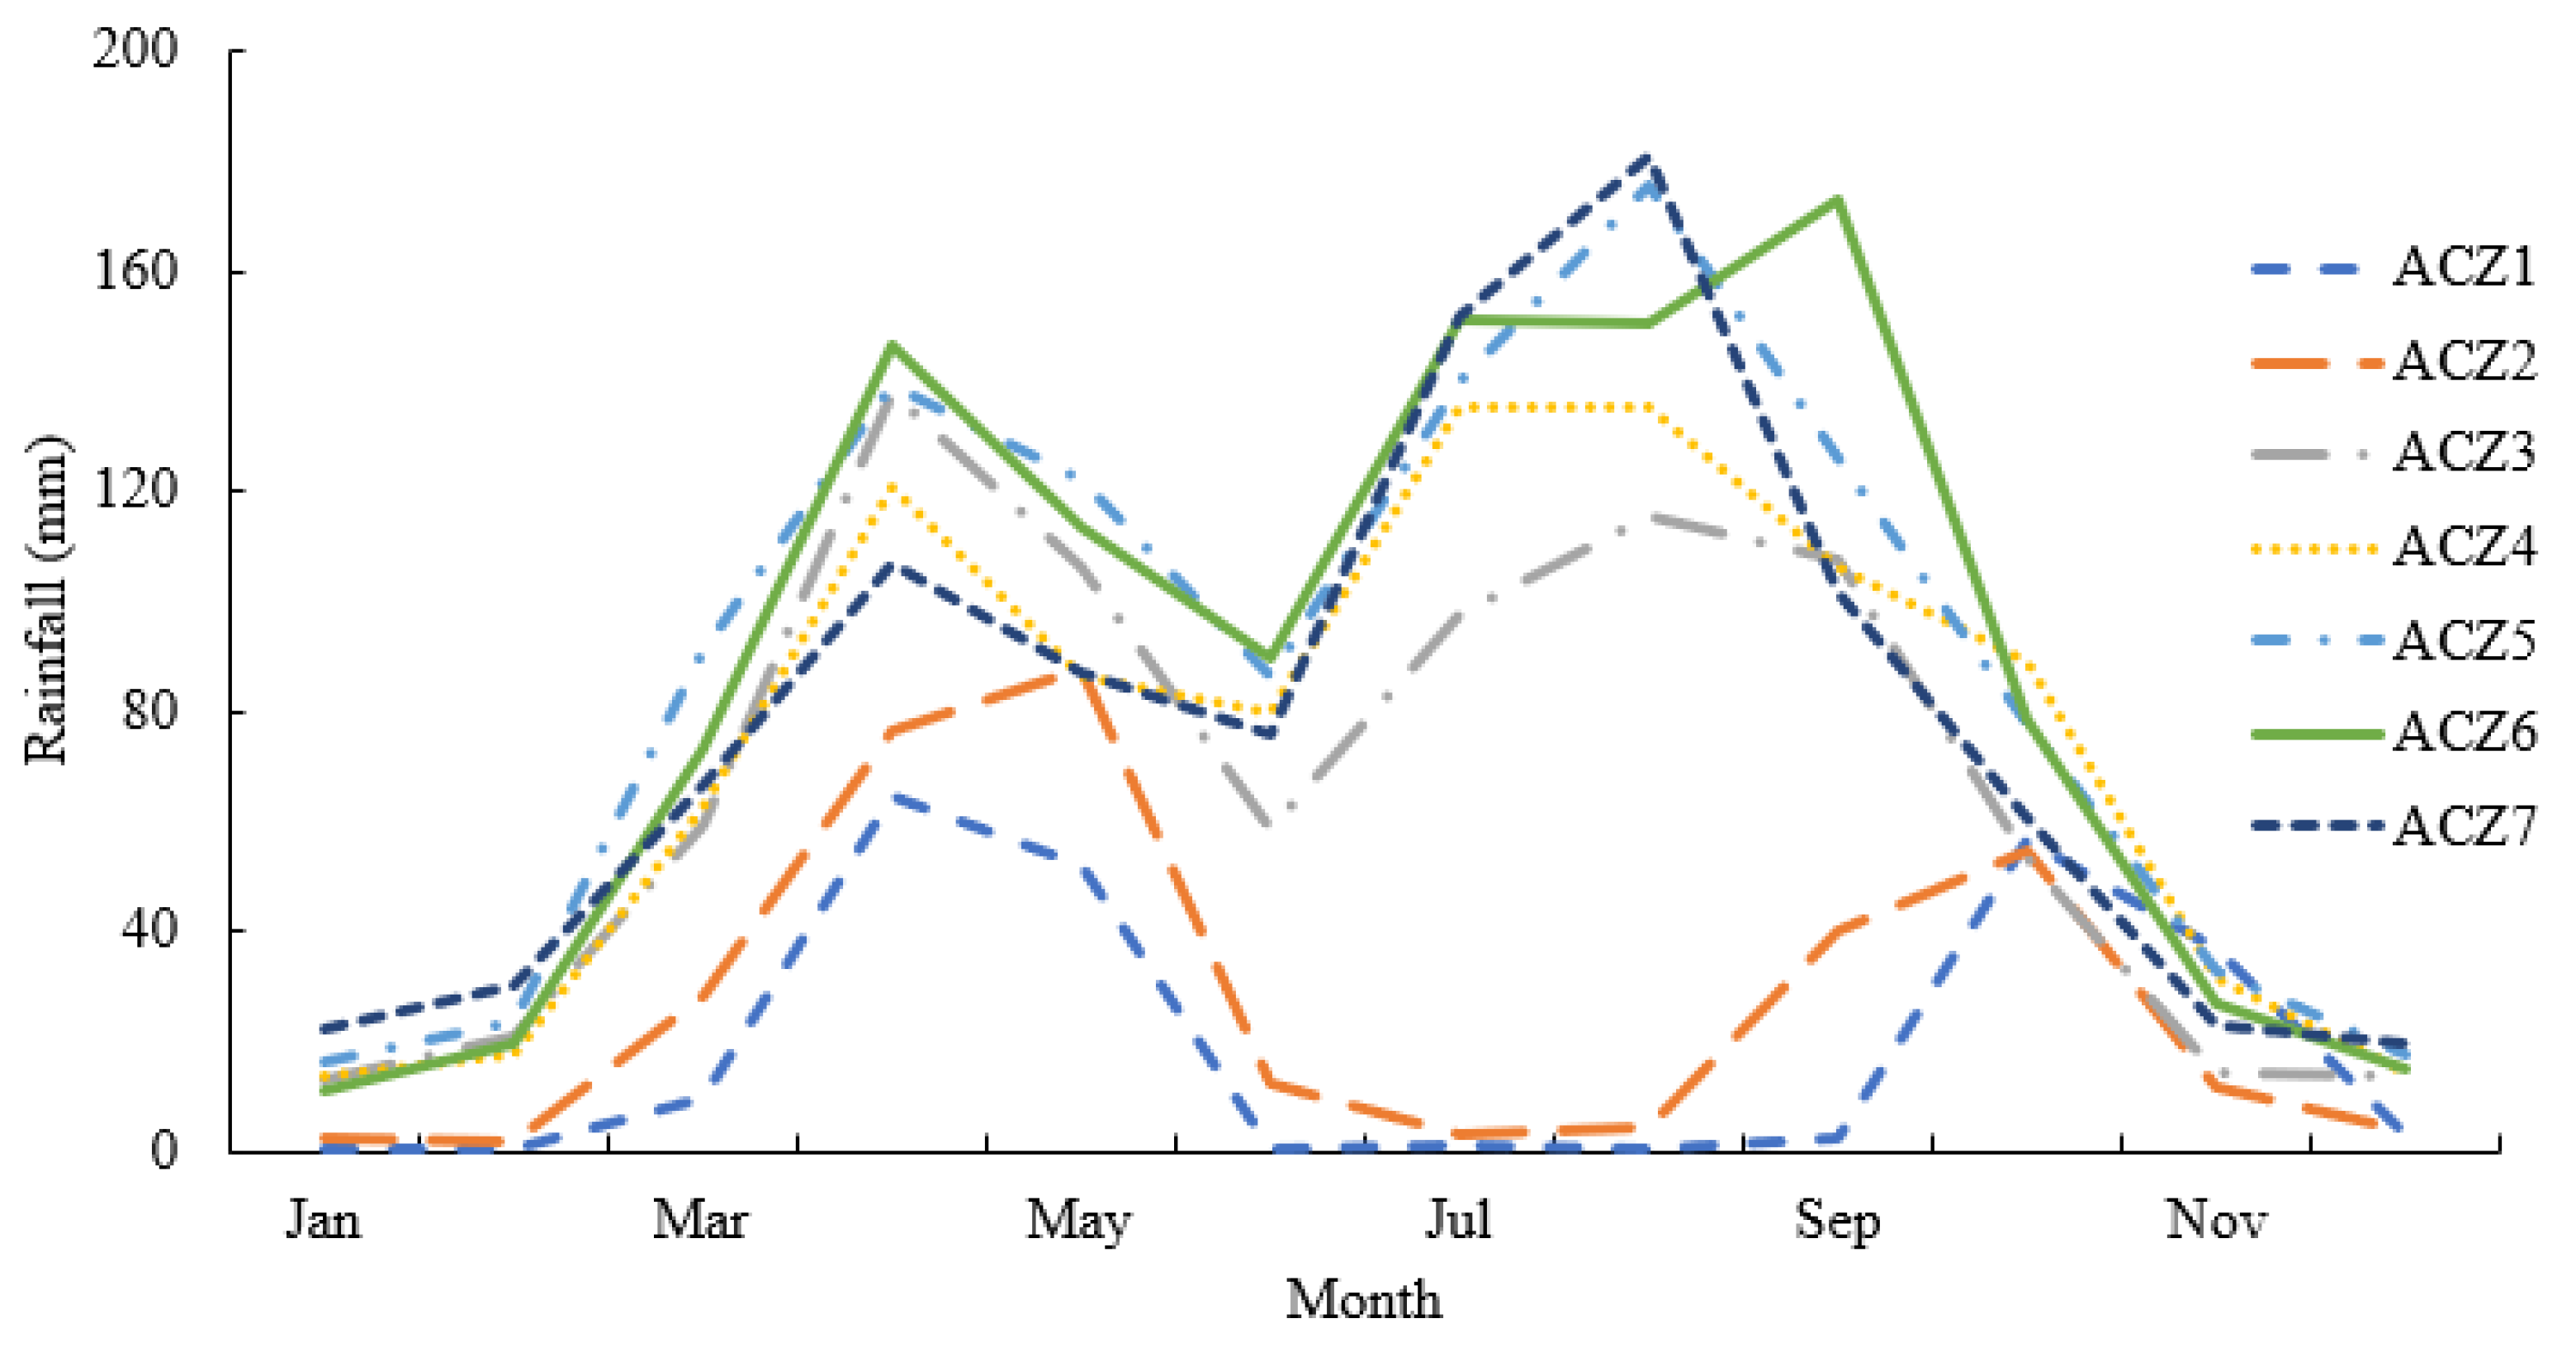
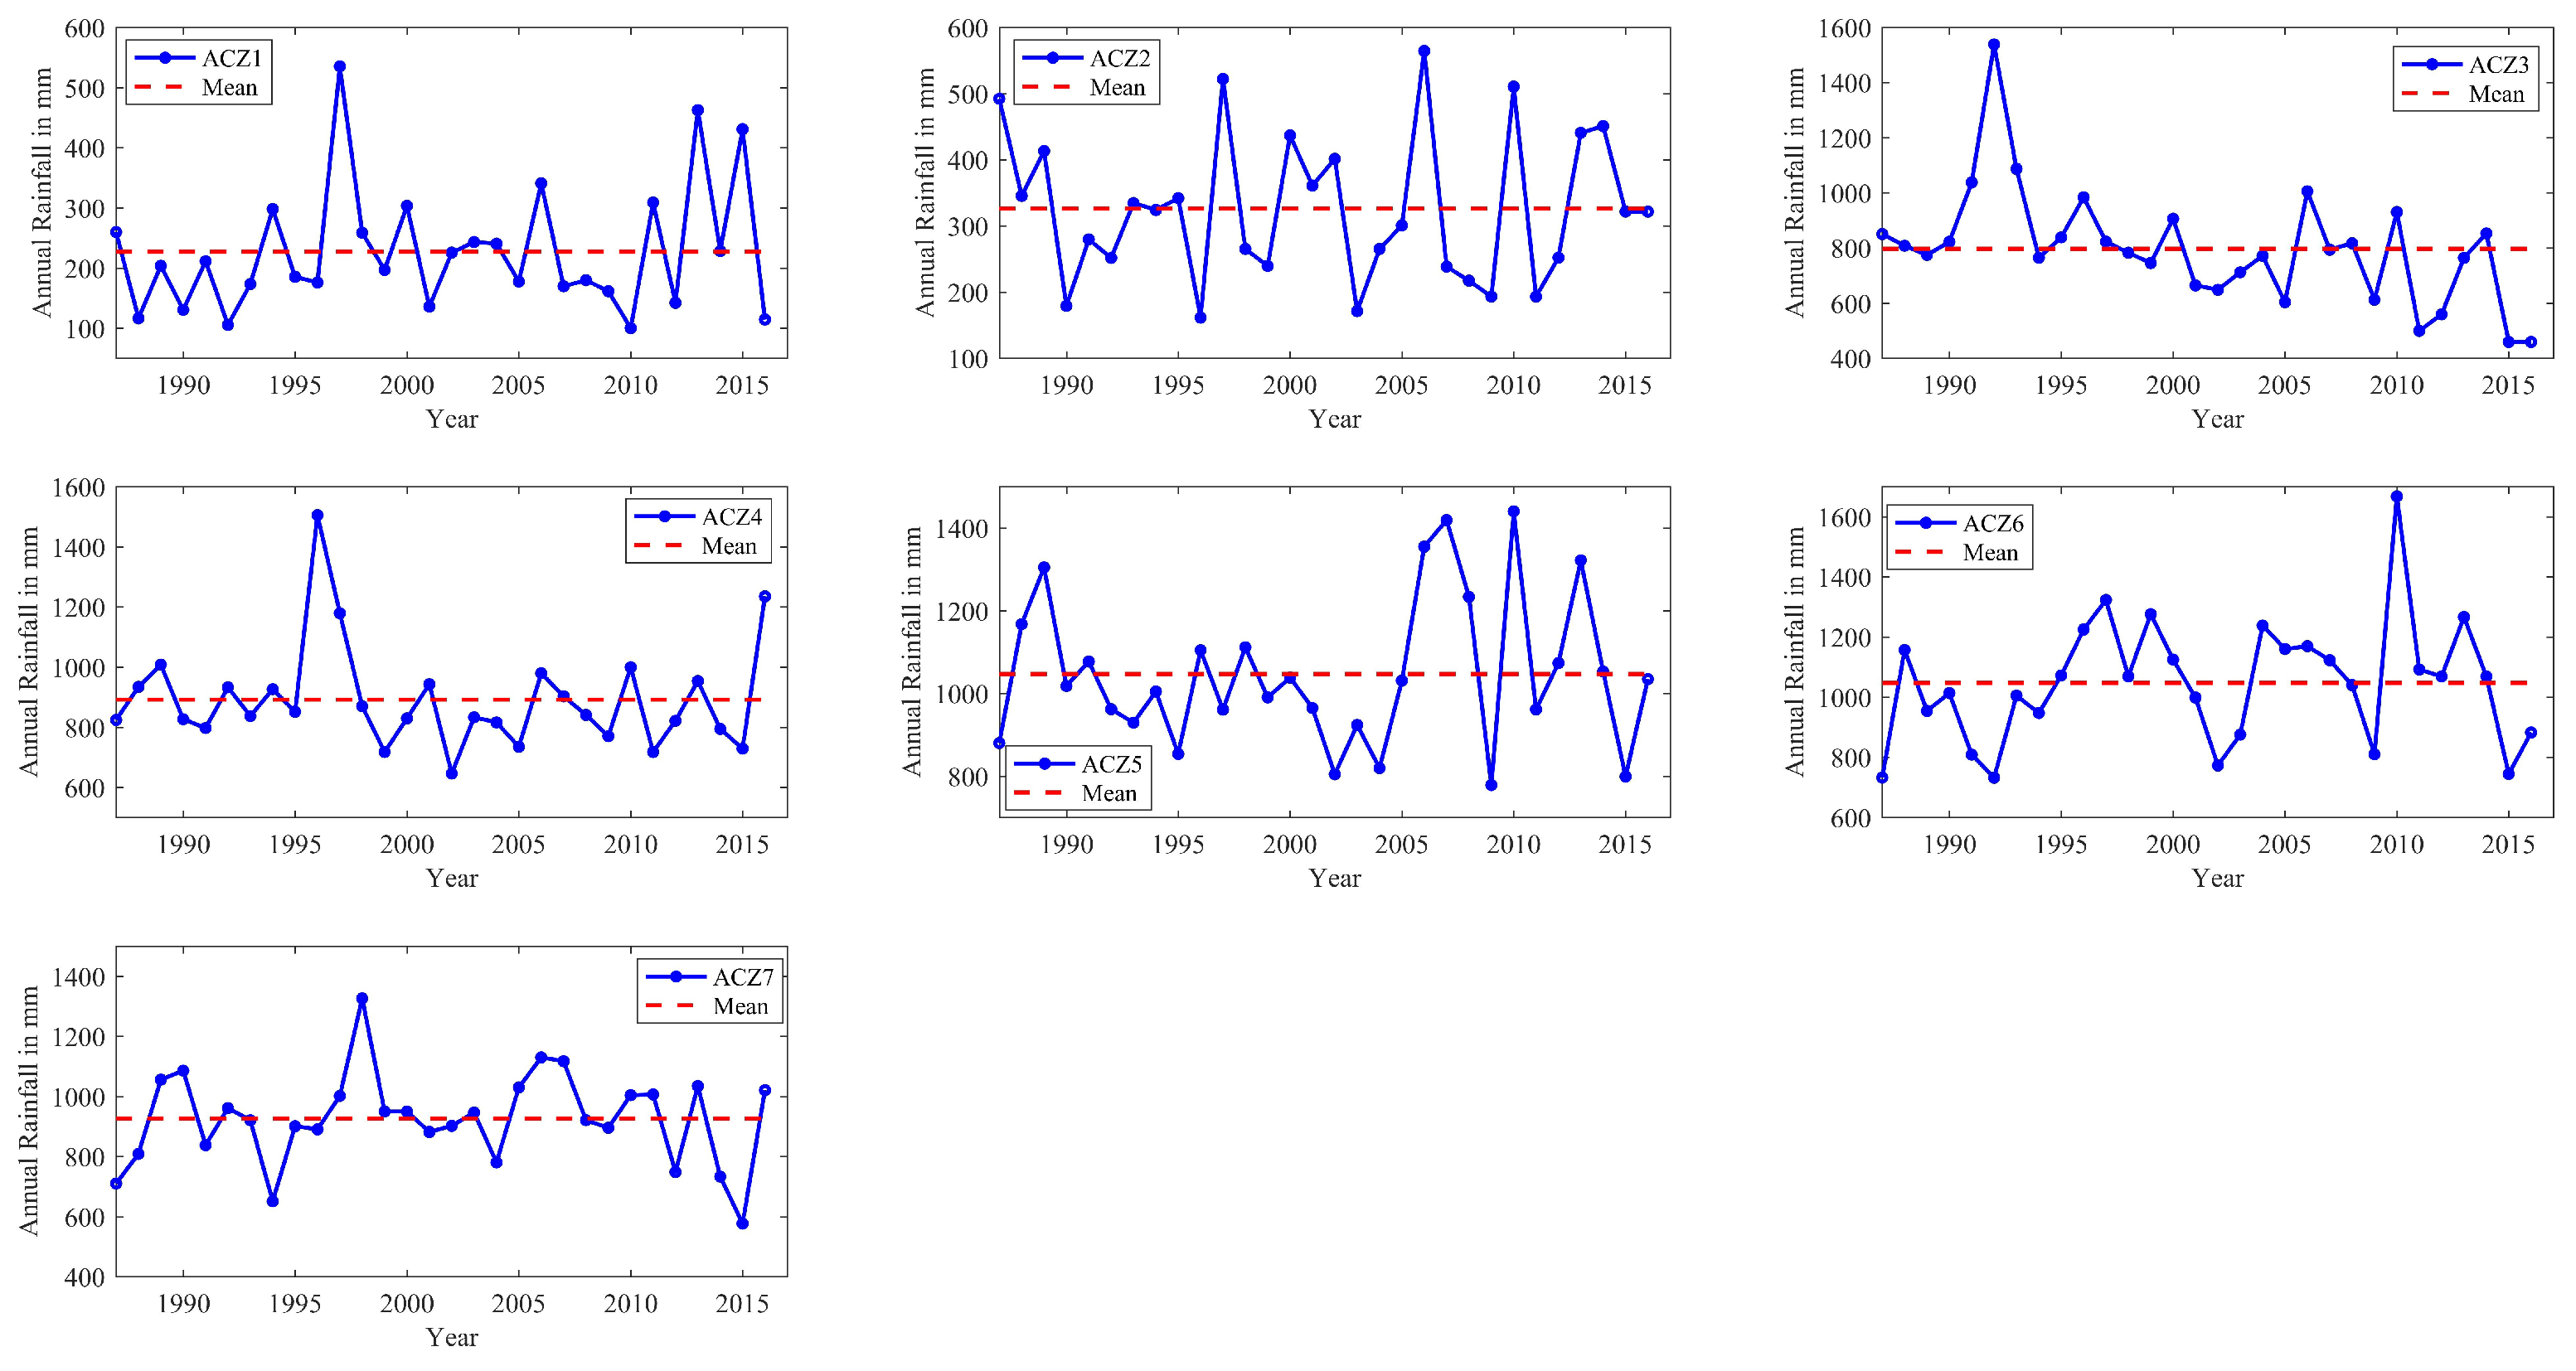
In WSRB, the annual rainfall distribution is bimodal with two rainy seasons Figure 4. The first one is the short rainy season (Spring) which starts from March to May months is locally called ‘Belg’. The second one is the long rainy season (Summer) which spans from June to September locally called ‘Kiremt’. However, the amount of Belg rainfall was found higher than Kiremt rainfall in ACZ1-3. In this document Spring or Belg and Summer or Kiremt are used interchangeably. The temporal annual rainfall pattern at each agroclimatic zone is shown in Figure 5. A clear decrease in rainfall was observed in ACZ3 in the analysis period.
For each ACZ, the rainfall statistical analysis results are presented in Table 3. The minimum mean annual rainfall recorded was 227.2 mm in ACZ1 whereas the maximum mean annual rainfall recorded was 1047.6 mm in ACZ 6. Seasonally, a high amount of rainfall was observed in Summer except in ACZ1 and ACZ2. Based on the CV result, the annual rainfall CV ranges between 16.7% and 46.7%, these shows high inter-annual variability of annual rainfall in the basin. Seasonally, Belg/Spring rainfall showed the highest inter-annual variability in all ACZs. But, the maximum inter-annual variability was detected in Kiremt rainfall in ACZ1 (87.4%) and ACZ2 (68.9%). In comparison, annual rainfall showed a lower value of CV in all ACZs.
3.2. Trend Analysis
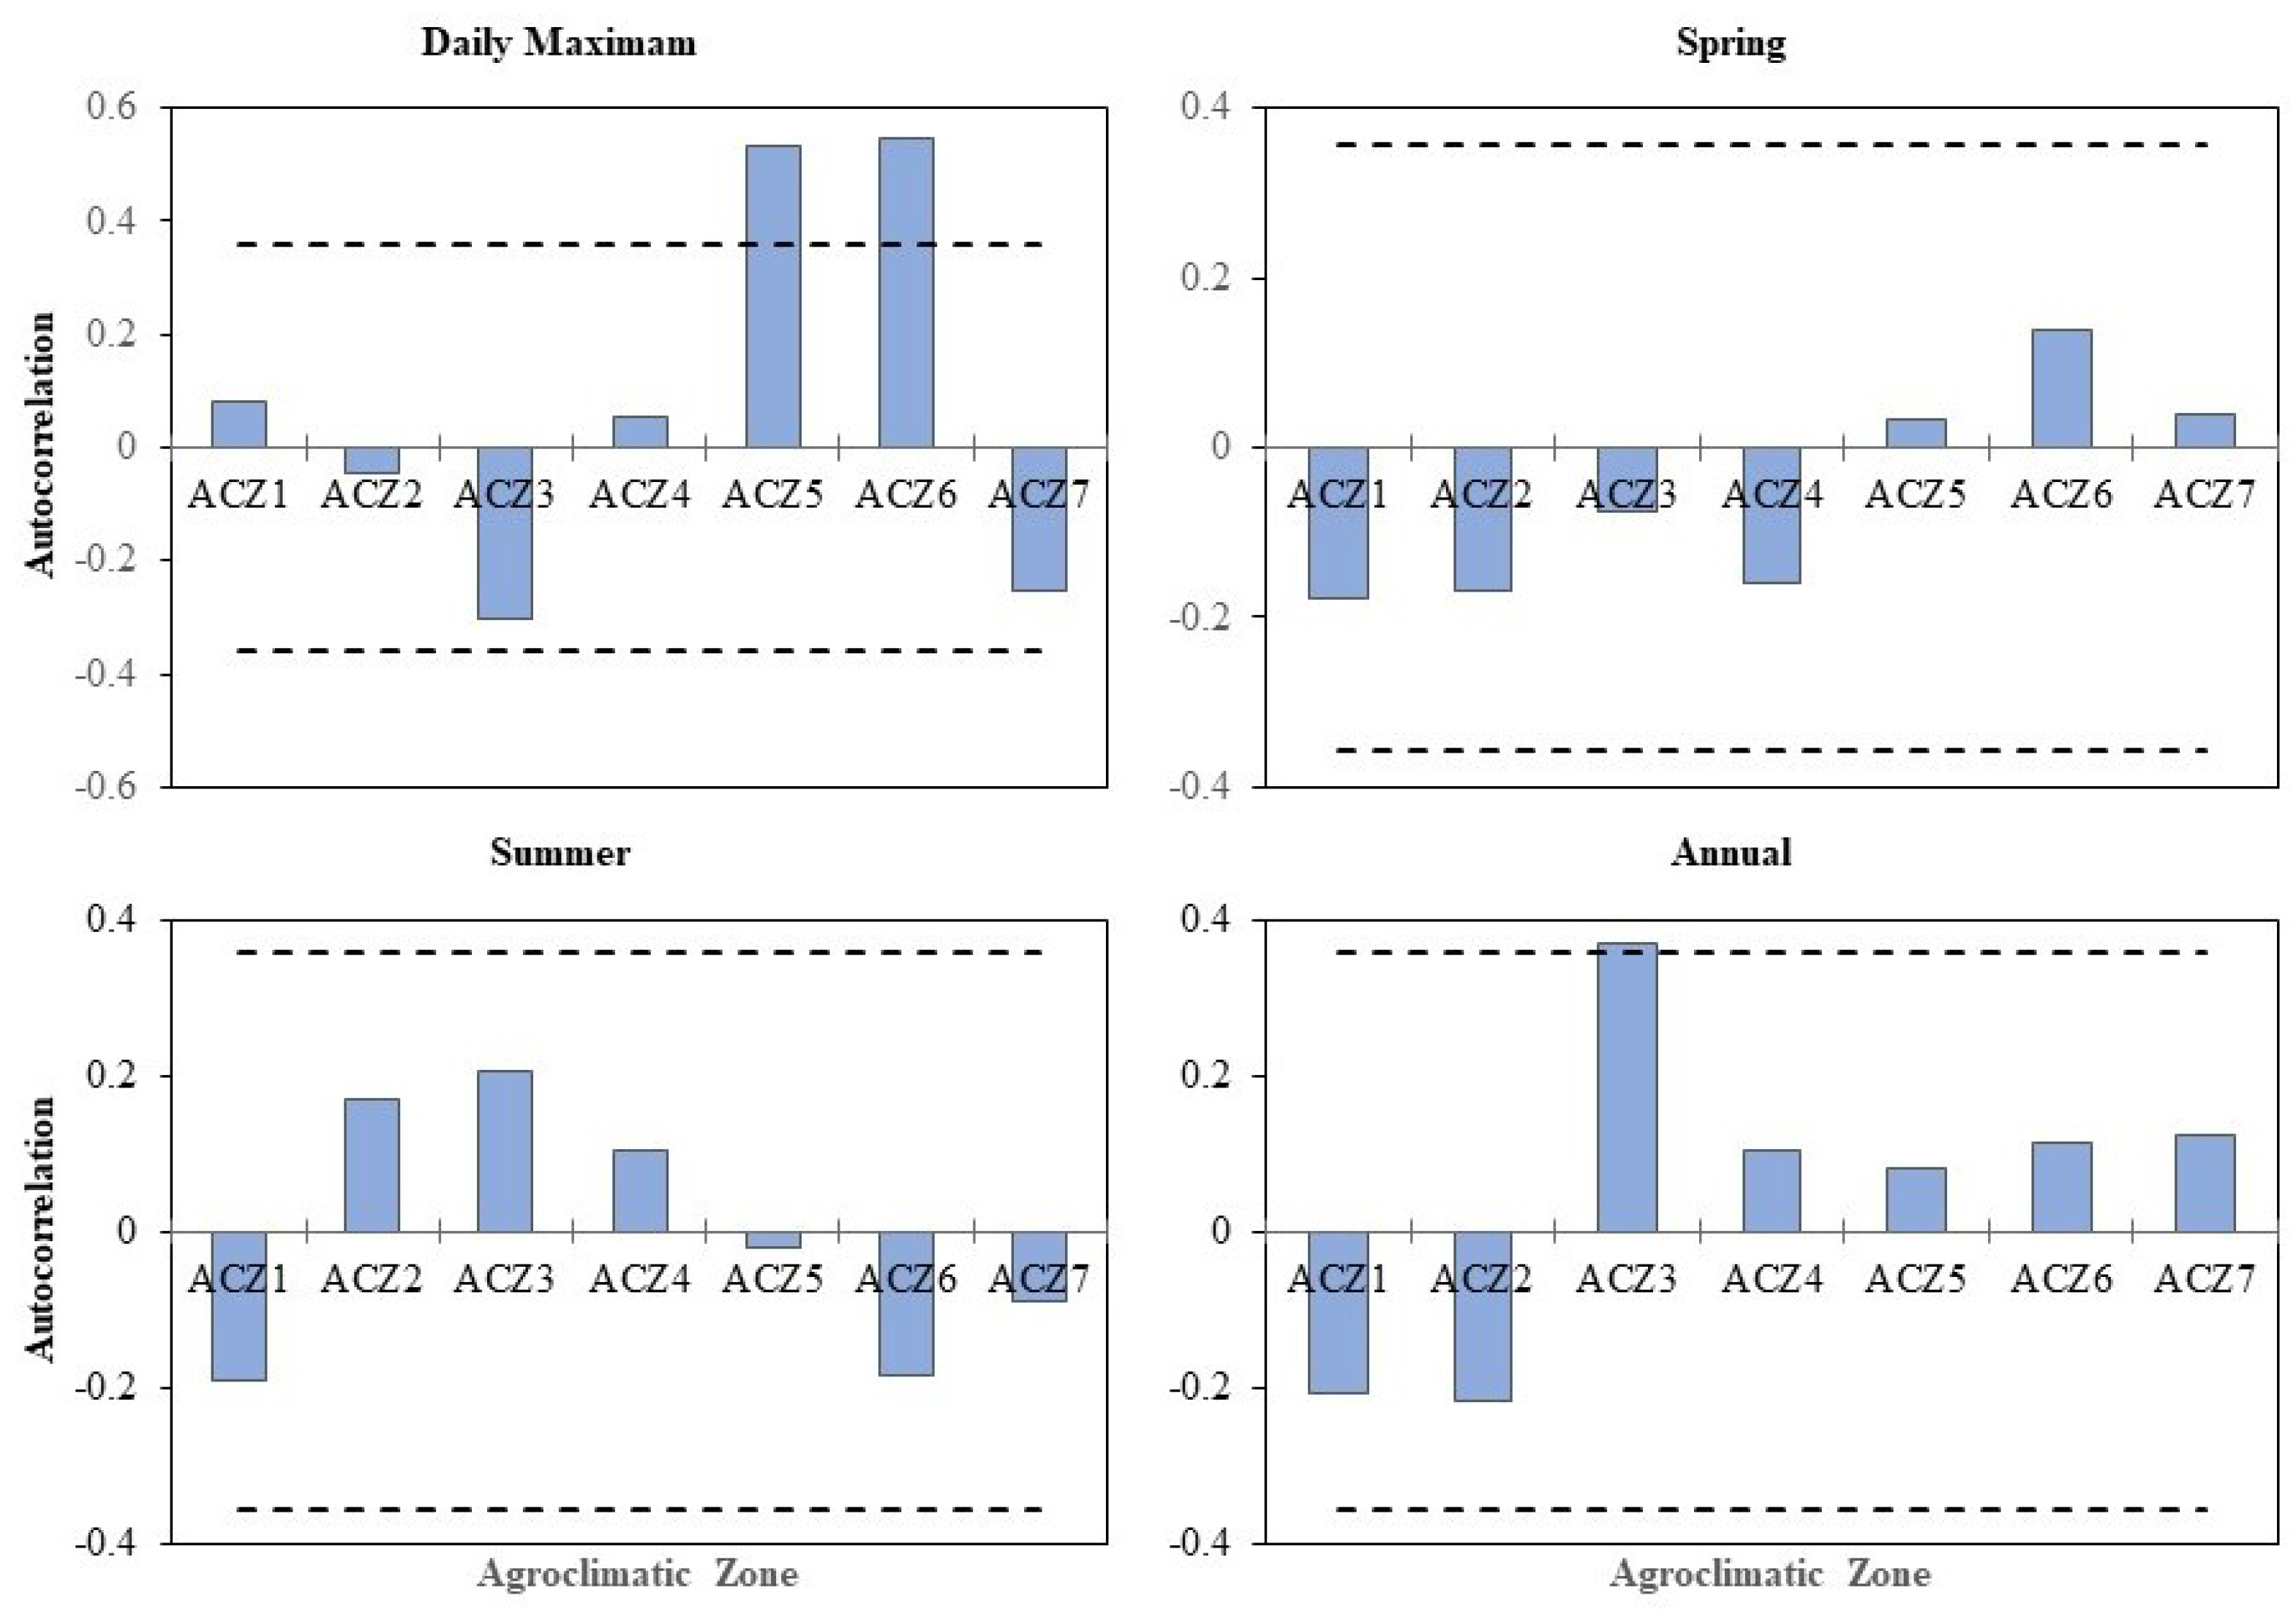
To detect the trend in a time series, the statistical tests assume the subsequent data in the series to be independent. Serial autocorrelation was checked for the data series of daily maximum, Belg (short rainy season), Kiremt (heavy rain season), and annual rainfall. For a series with 30 observations, the critical value is ±0.358 at the 95% confidence interval. Autocorrelation analysis indicated only three series were affected by autocorrelation two in daily maximum rainfall and one in annual rainfall Figure 6. Both Belg and Kiremt rainfall were found serially independent. Thus, pre-whitening of the data series was conducted before using it for trend analysis.
3.2.1. MK and Sen’s Slope Test
Results of MK and Sen’s slope analysis on the daily maximum, spring, summer, and annual rainfall for each ACZ in the basin are shown in Table 4. From trend analysis result, daily maximum rainfall has shown statistically significant increase in ACZ1, ACZ5, and ACZ6, an insignificant increase in ACZ4 and ACZ7, and an insignificant decrease in ACZ2 and ACZ3.
As depicted in Table 4, the declining trend of Belg/Spring rainfall is not statistically significant in all ACZs except ACZ4 where rainfall is statistically significant decreasing by −4.11 mm/year. In Kiremt/Summer rainfall, only one ACZ showed a significantly decreasing trend at a 5% significance level, on the contrary, the remaining ACZs showed a statistically insignificant increase. The analysis of annual rainfall showed a statistically insignificant decrease (ACZ2 and ACZ4) or increase (ACZ1, ACZ5, ACZ6, and ACZ7) in the trend. ACZ3 which is a dry middle elevation zone showed a nonsignificant decrease in daily maximum and Belg/Spring rainfall, a significant decreasing trend in Kiremt/Summer, and annual average rainfall.
3.2.2. ITA Method
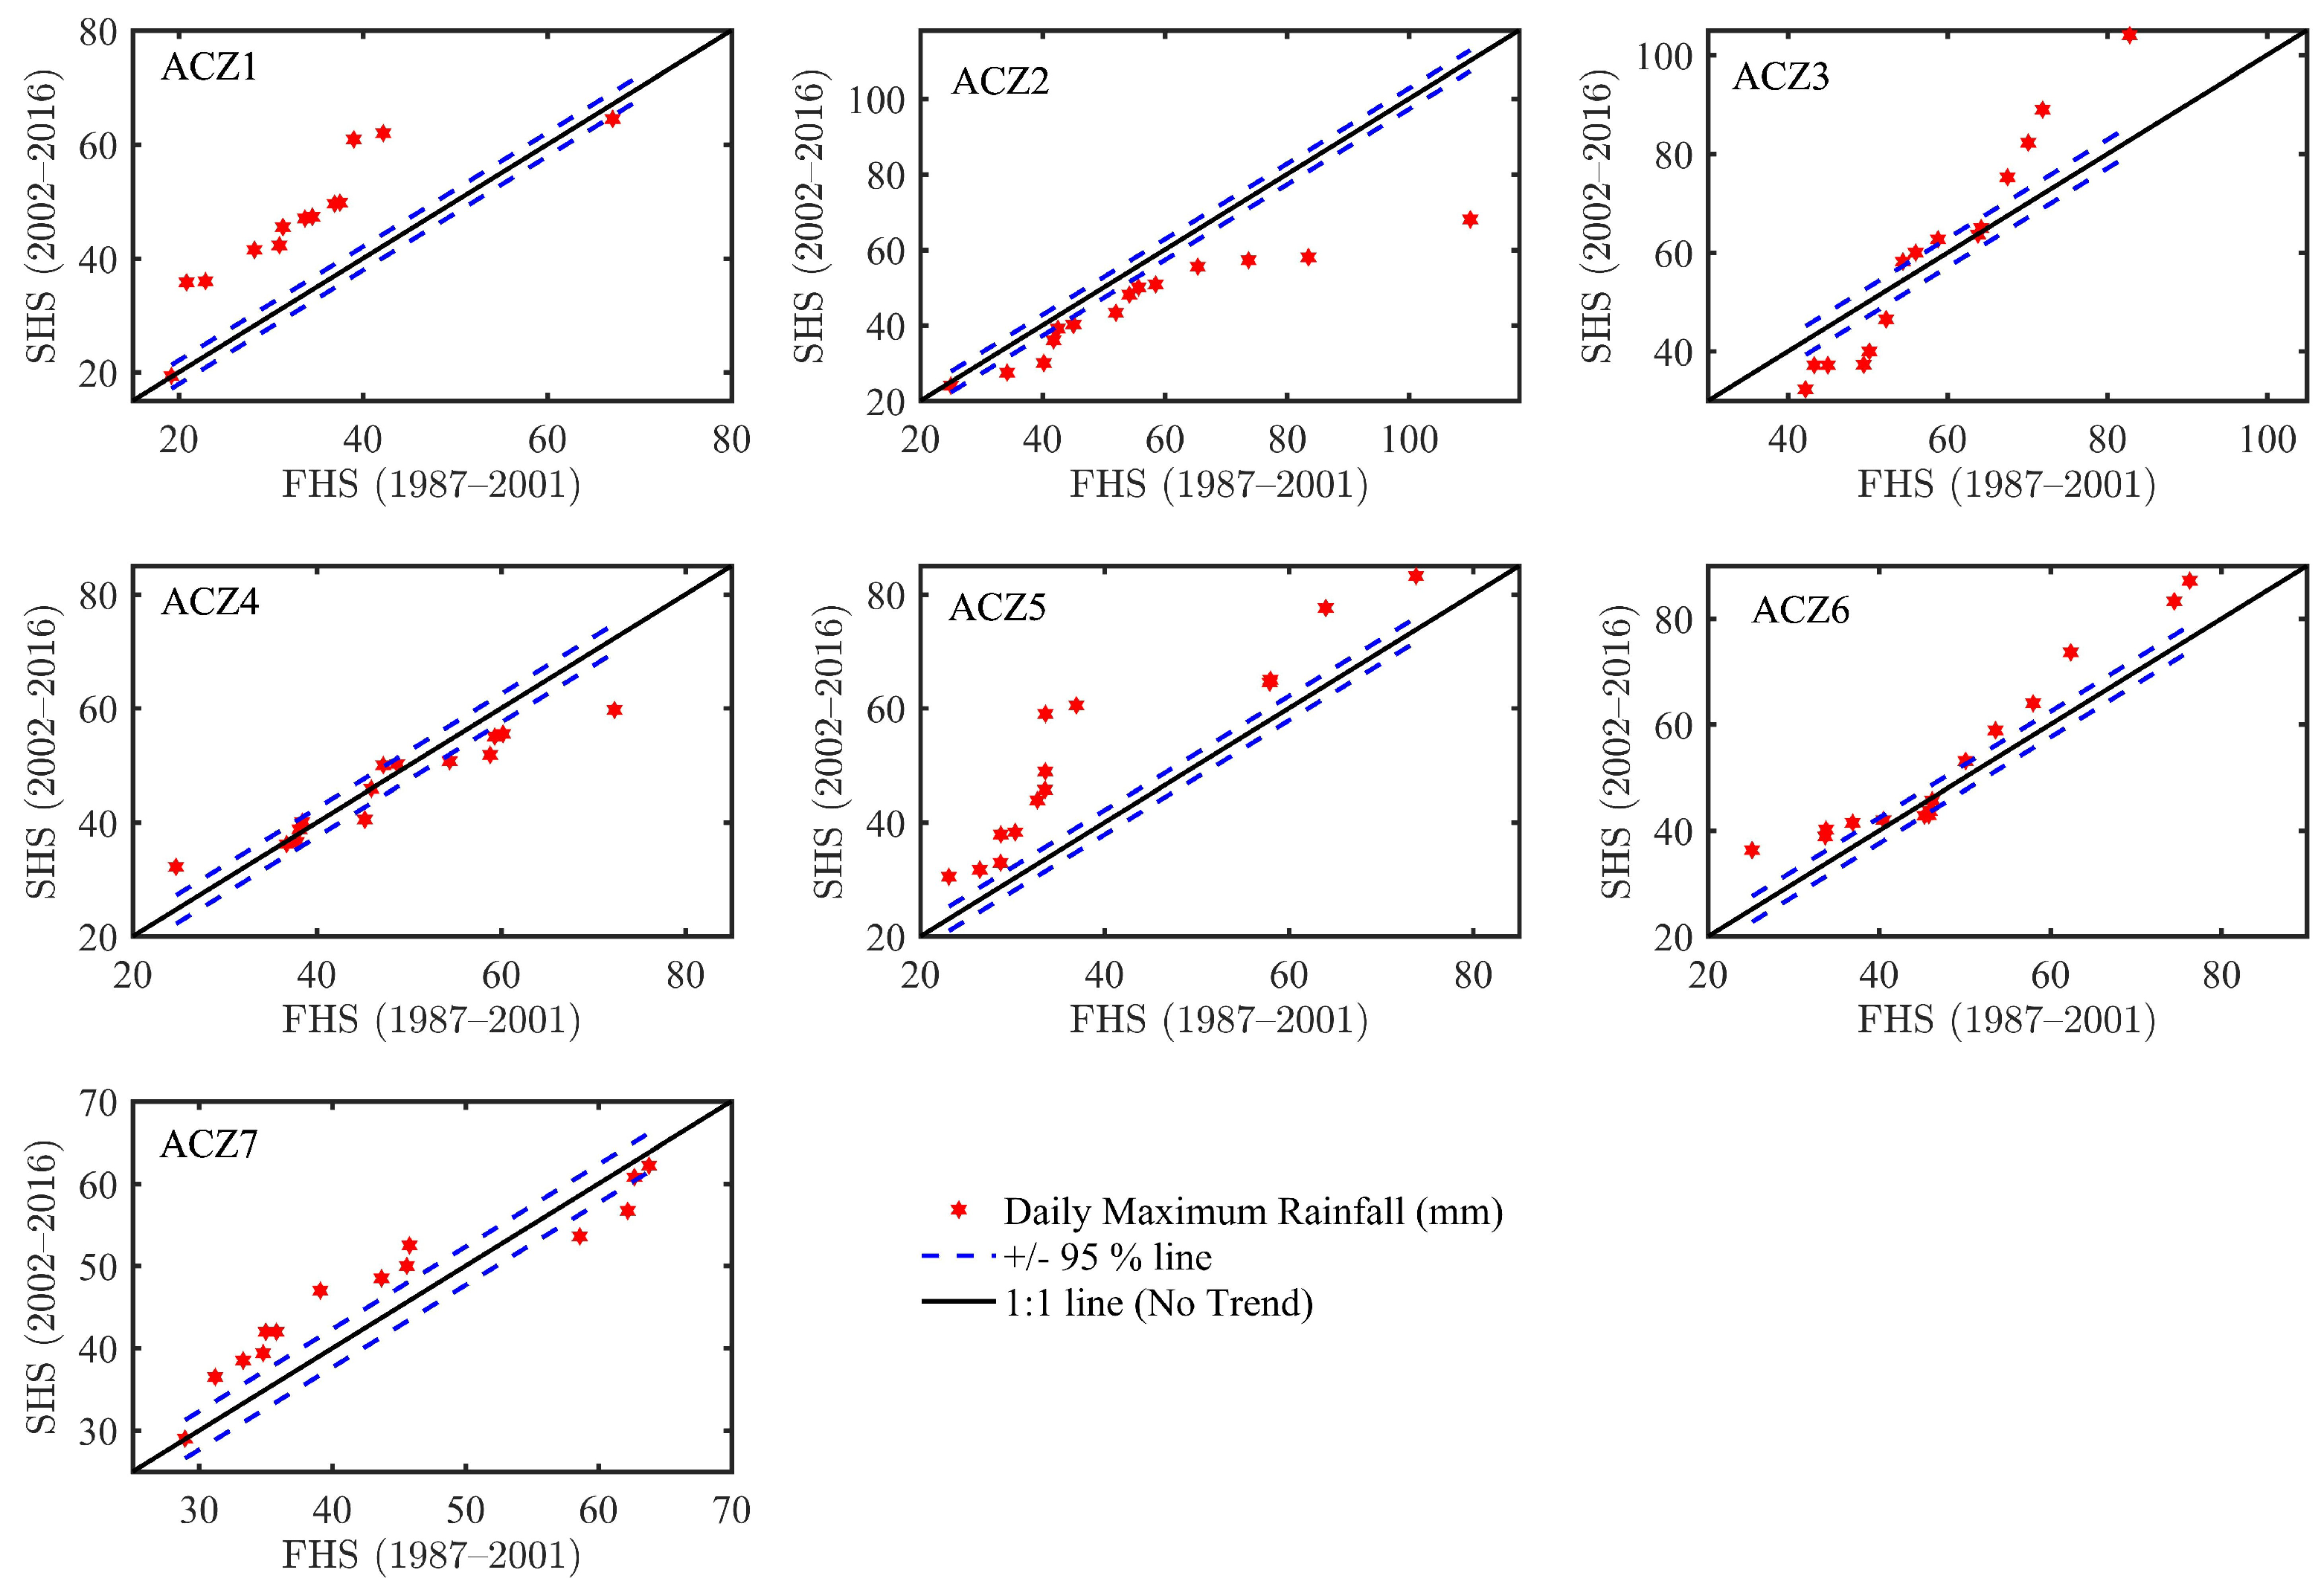
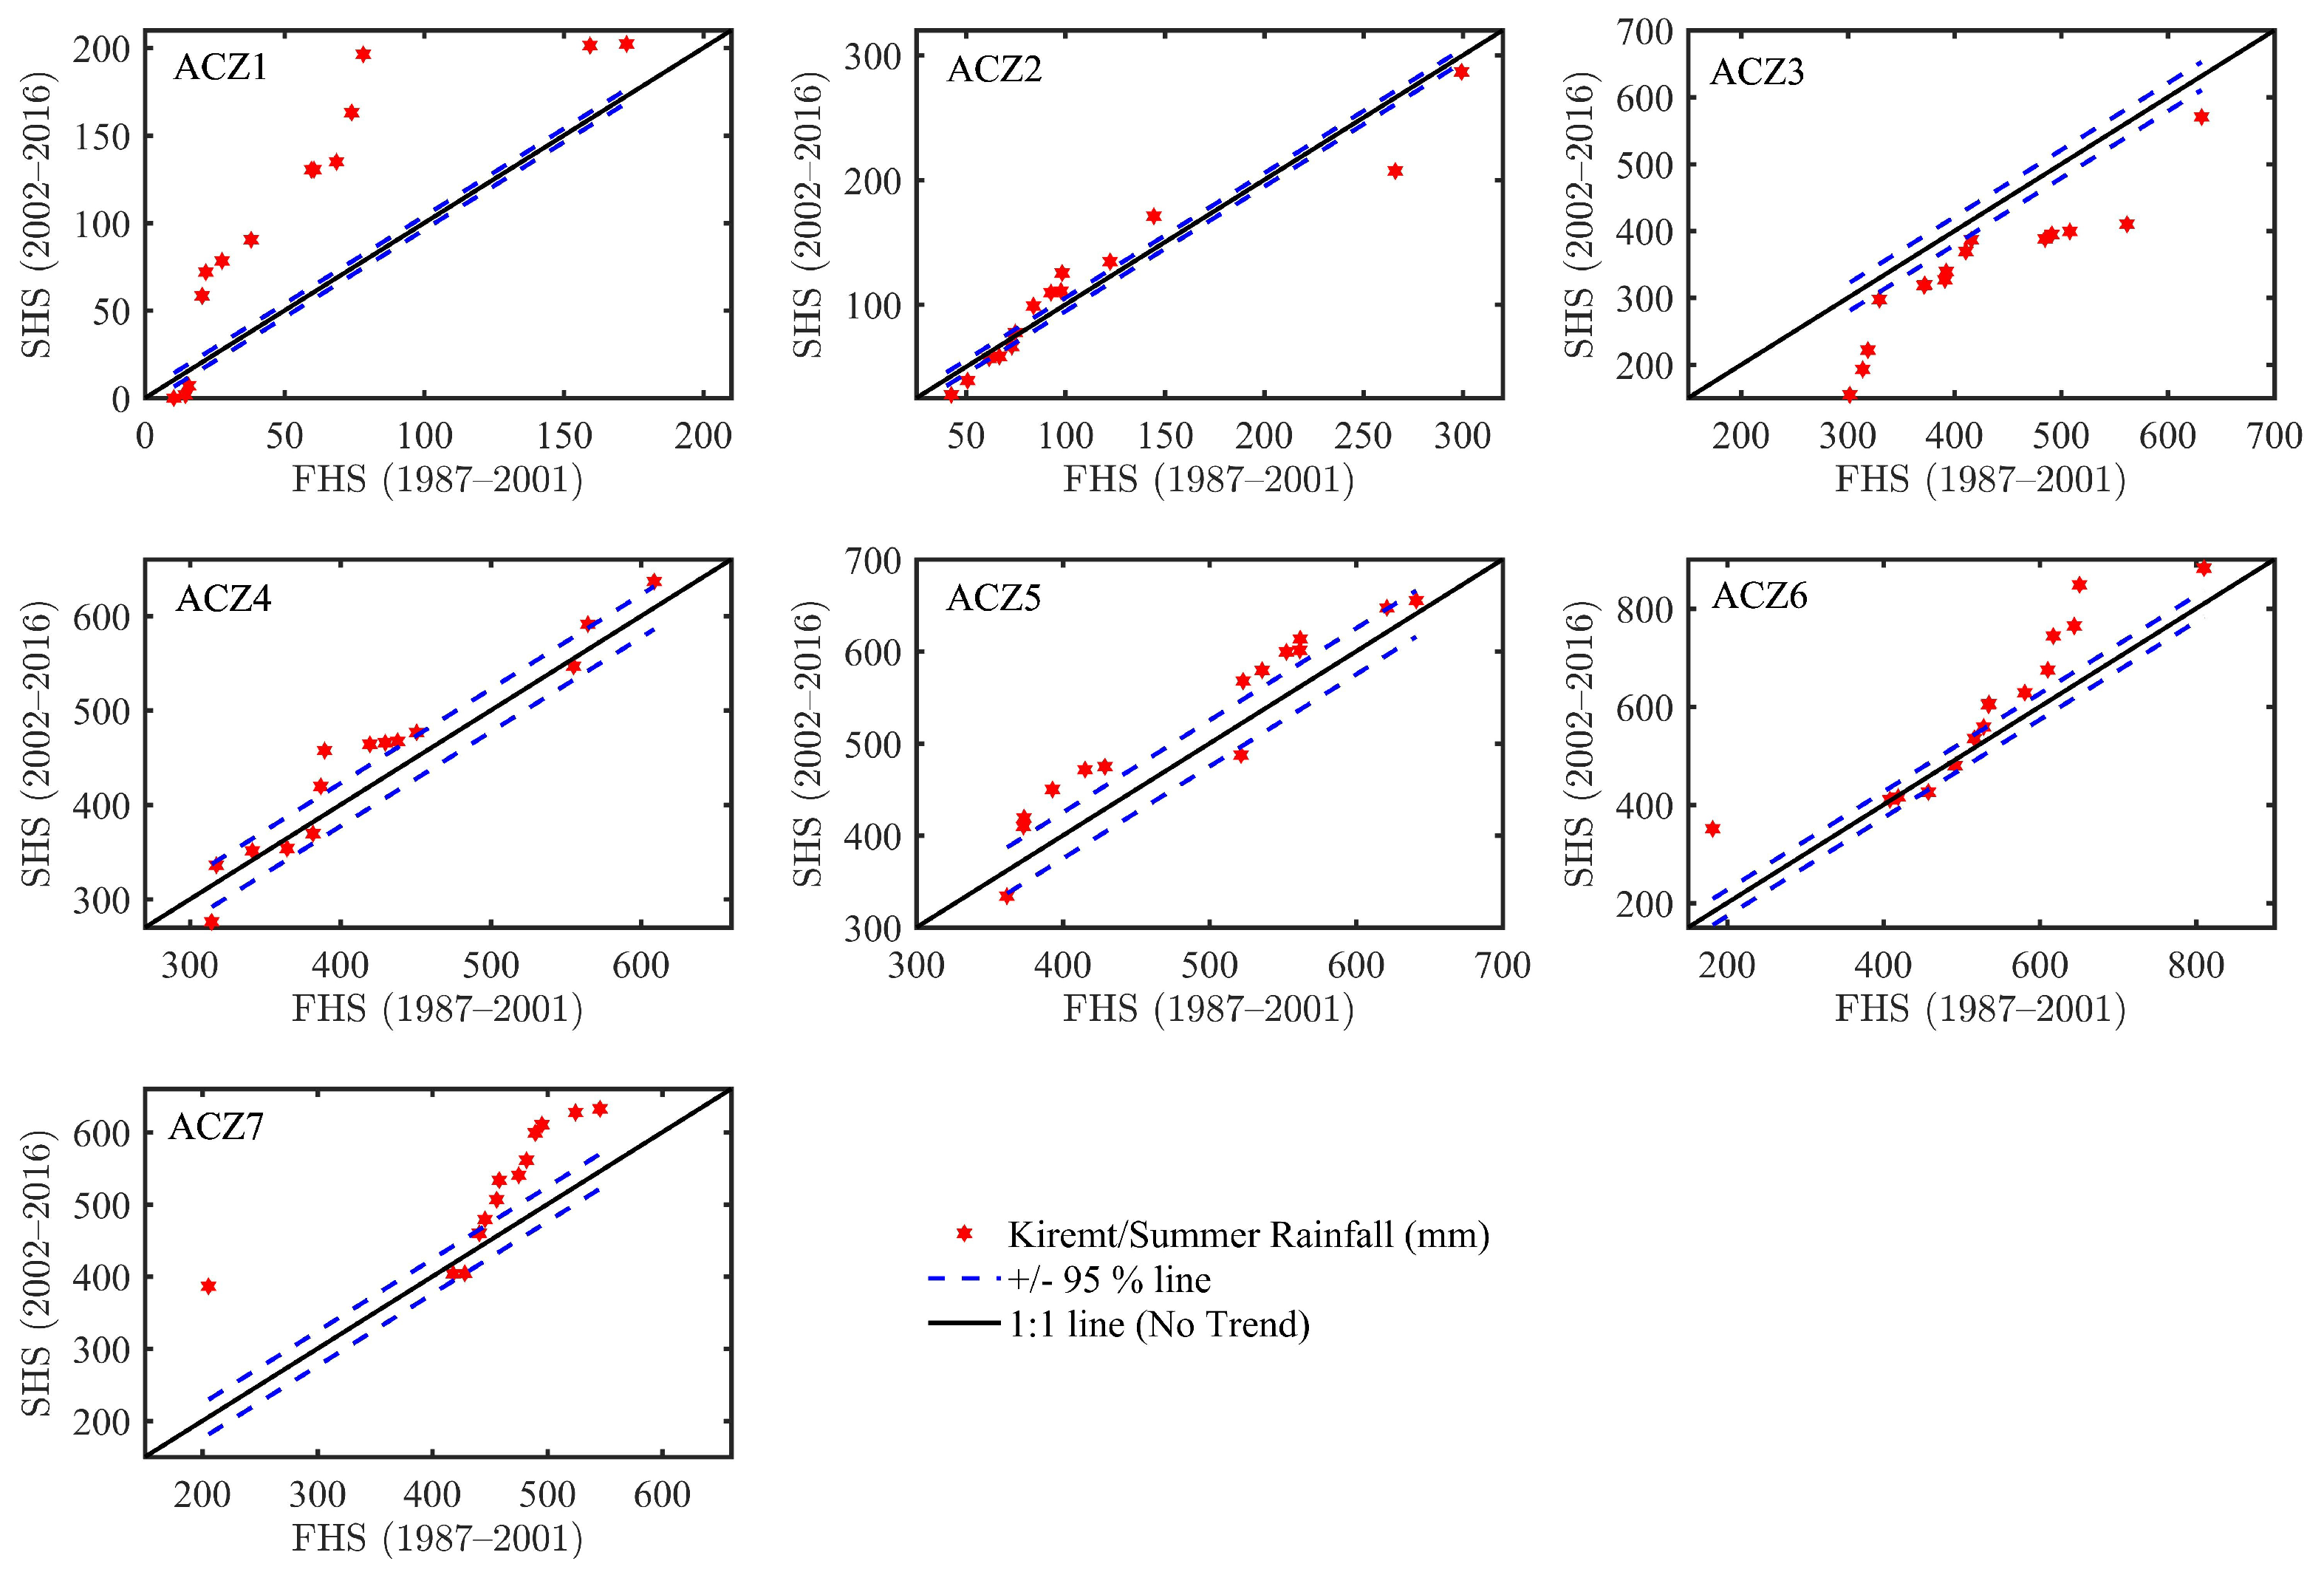
Figure 7, Figure 8, Figure 9 and Figure 10 shows the results of the ITA method applied to the seven ACZs of the research area on daily maximum, spring, summer, and annual rainfall. ITA result of daily maximum rainfall Figure 7, the rainfall indicated an increasing trend in all rainfall categories in ACZ1 and ACZ5. Contrary, maximum daily rainfall showed a strong decreasing trend in ACZ2. All of the other ACZs showed a quite distinct pattern in each rainfall category. All humid ACZs showed that most rainfall data points fall above the trendless line, implying an overall increasing trend. However, dry ACZs indicated an increase in ACZ1 and decreasing in ACZ2 and ACZ4 trends. Whereas, ACZ3 showed a decreasing trend in low and an increasing trend in high rainfall categories.
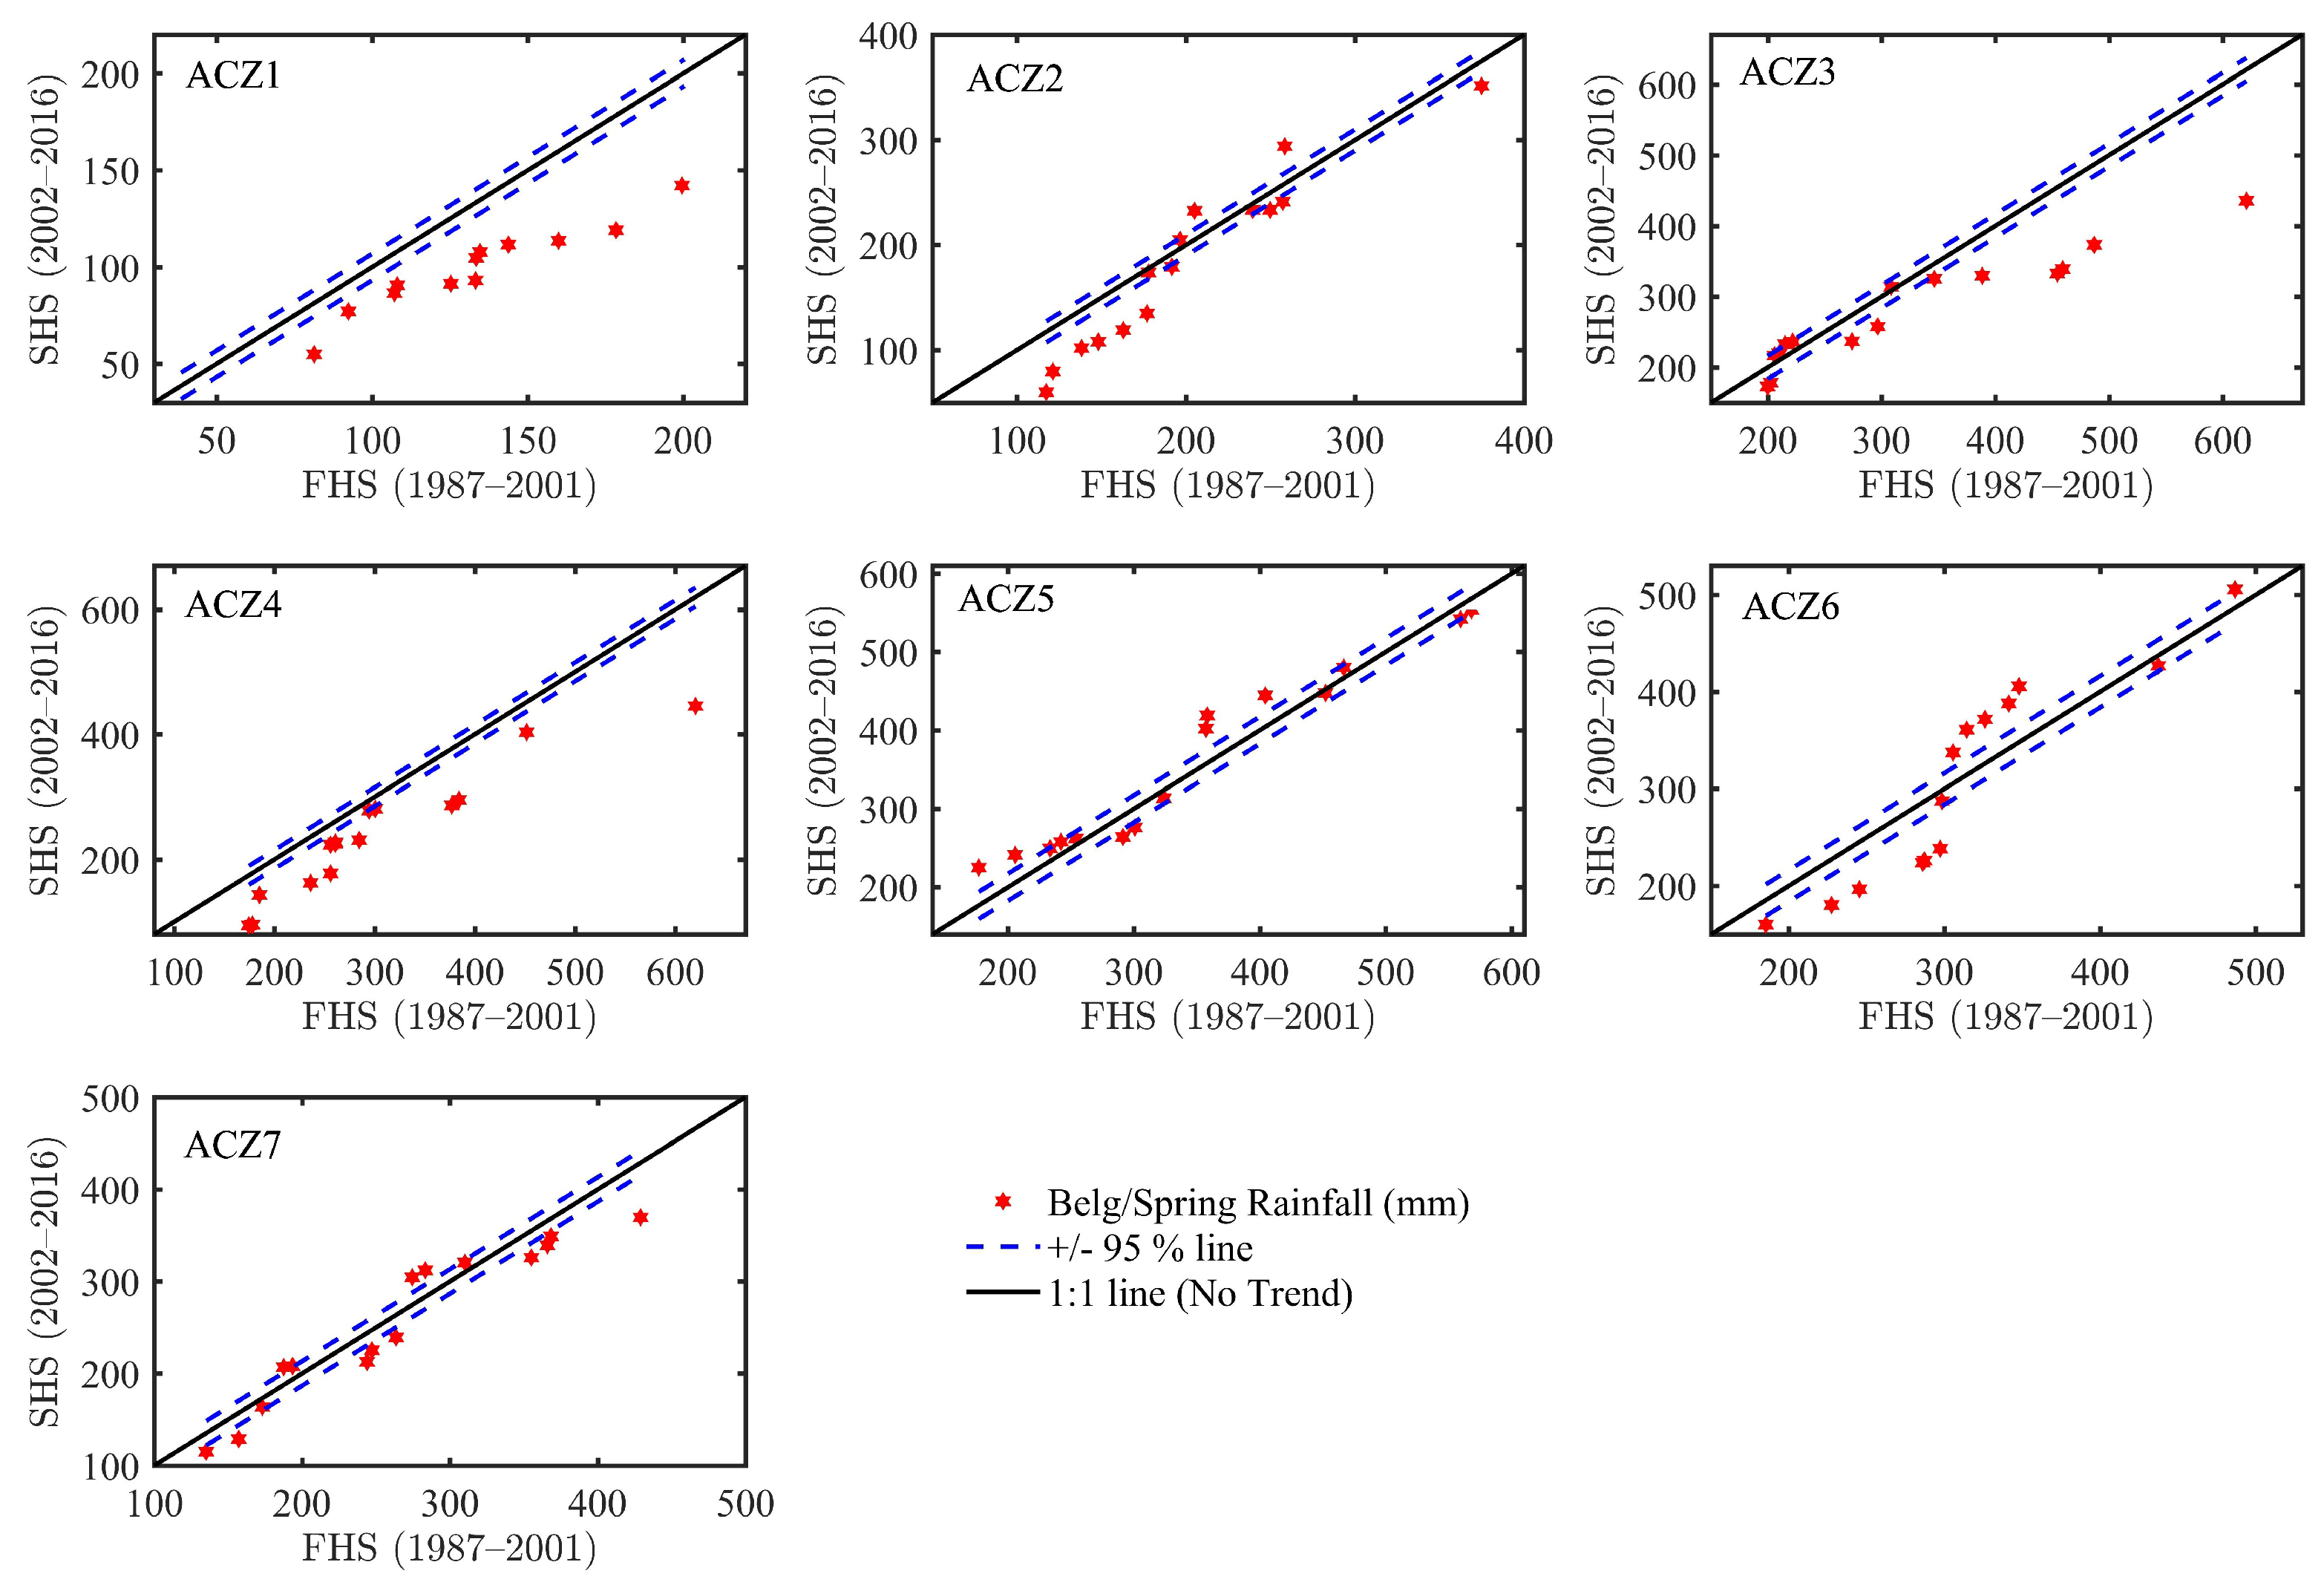
At the seasonal scale Figure 8 and Figure 9, a decreasing trend was observed in ACZ1 and ACZ4 in all categories of Belg rainfall Figure 8. No clear trend was detected in ACZ2, ACZ5, and ACZ7. Negative patterns were detected in ACZ3, for the medium and the high values. In ACZ6, negative patterns were detected, but only for the low and the high rainfall values. In Summer, a strong negative trend was observed in ACZ3 with all the values positioned below the 0.05 relative band limit. In ACZ1 the data points show an increasing trend in medium and high rainfall categories whereas decreasing in low rainfall categories Figure 9. A contrasting pattern was found in ACZ2 and ACZ5. In ACZ2 medium rainfall categories showed an increasing trend whereas low and high rainfall categories showed a decreasing pattern. The opposite pattern was detected in ACZ5. In ACZ6 and ACZ7, an increasing trend was observed in the medium and high rainfall categories. Overall, an increasing trend was detected in dominant ACZs WSRB in Summer rainfall. However, a negative pattern was observed in Belg rainfall as a result of the majority of the data points located below no trend line.
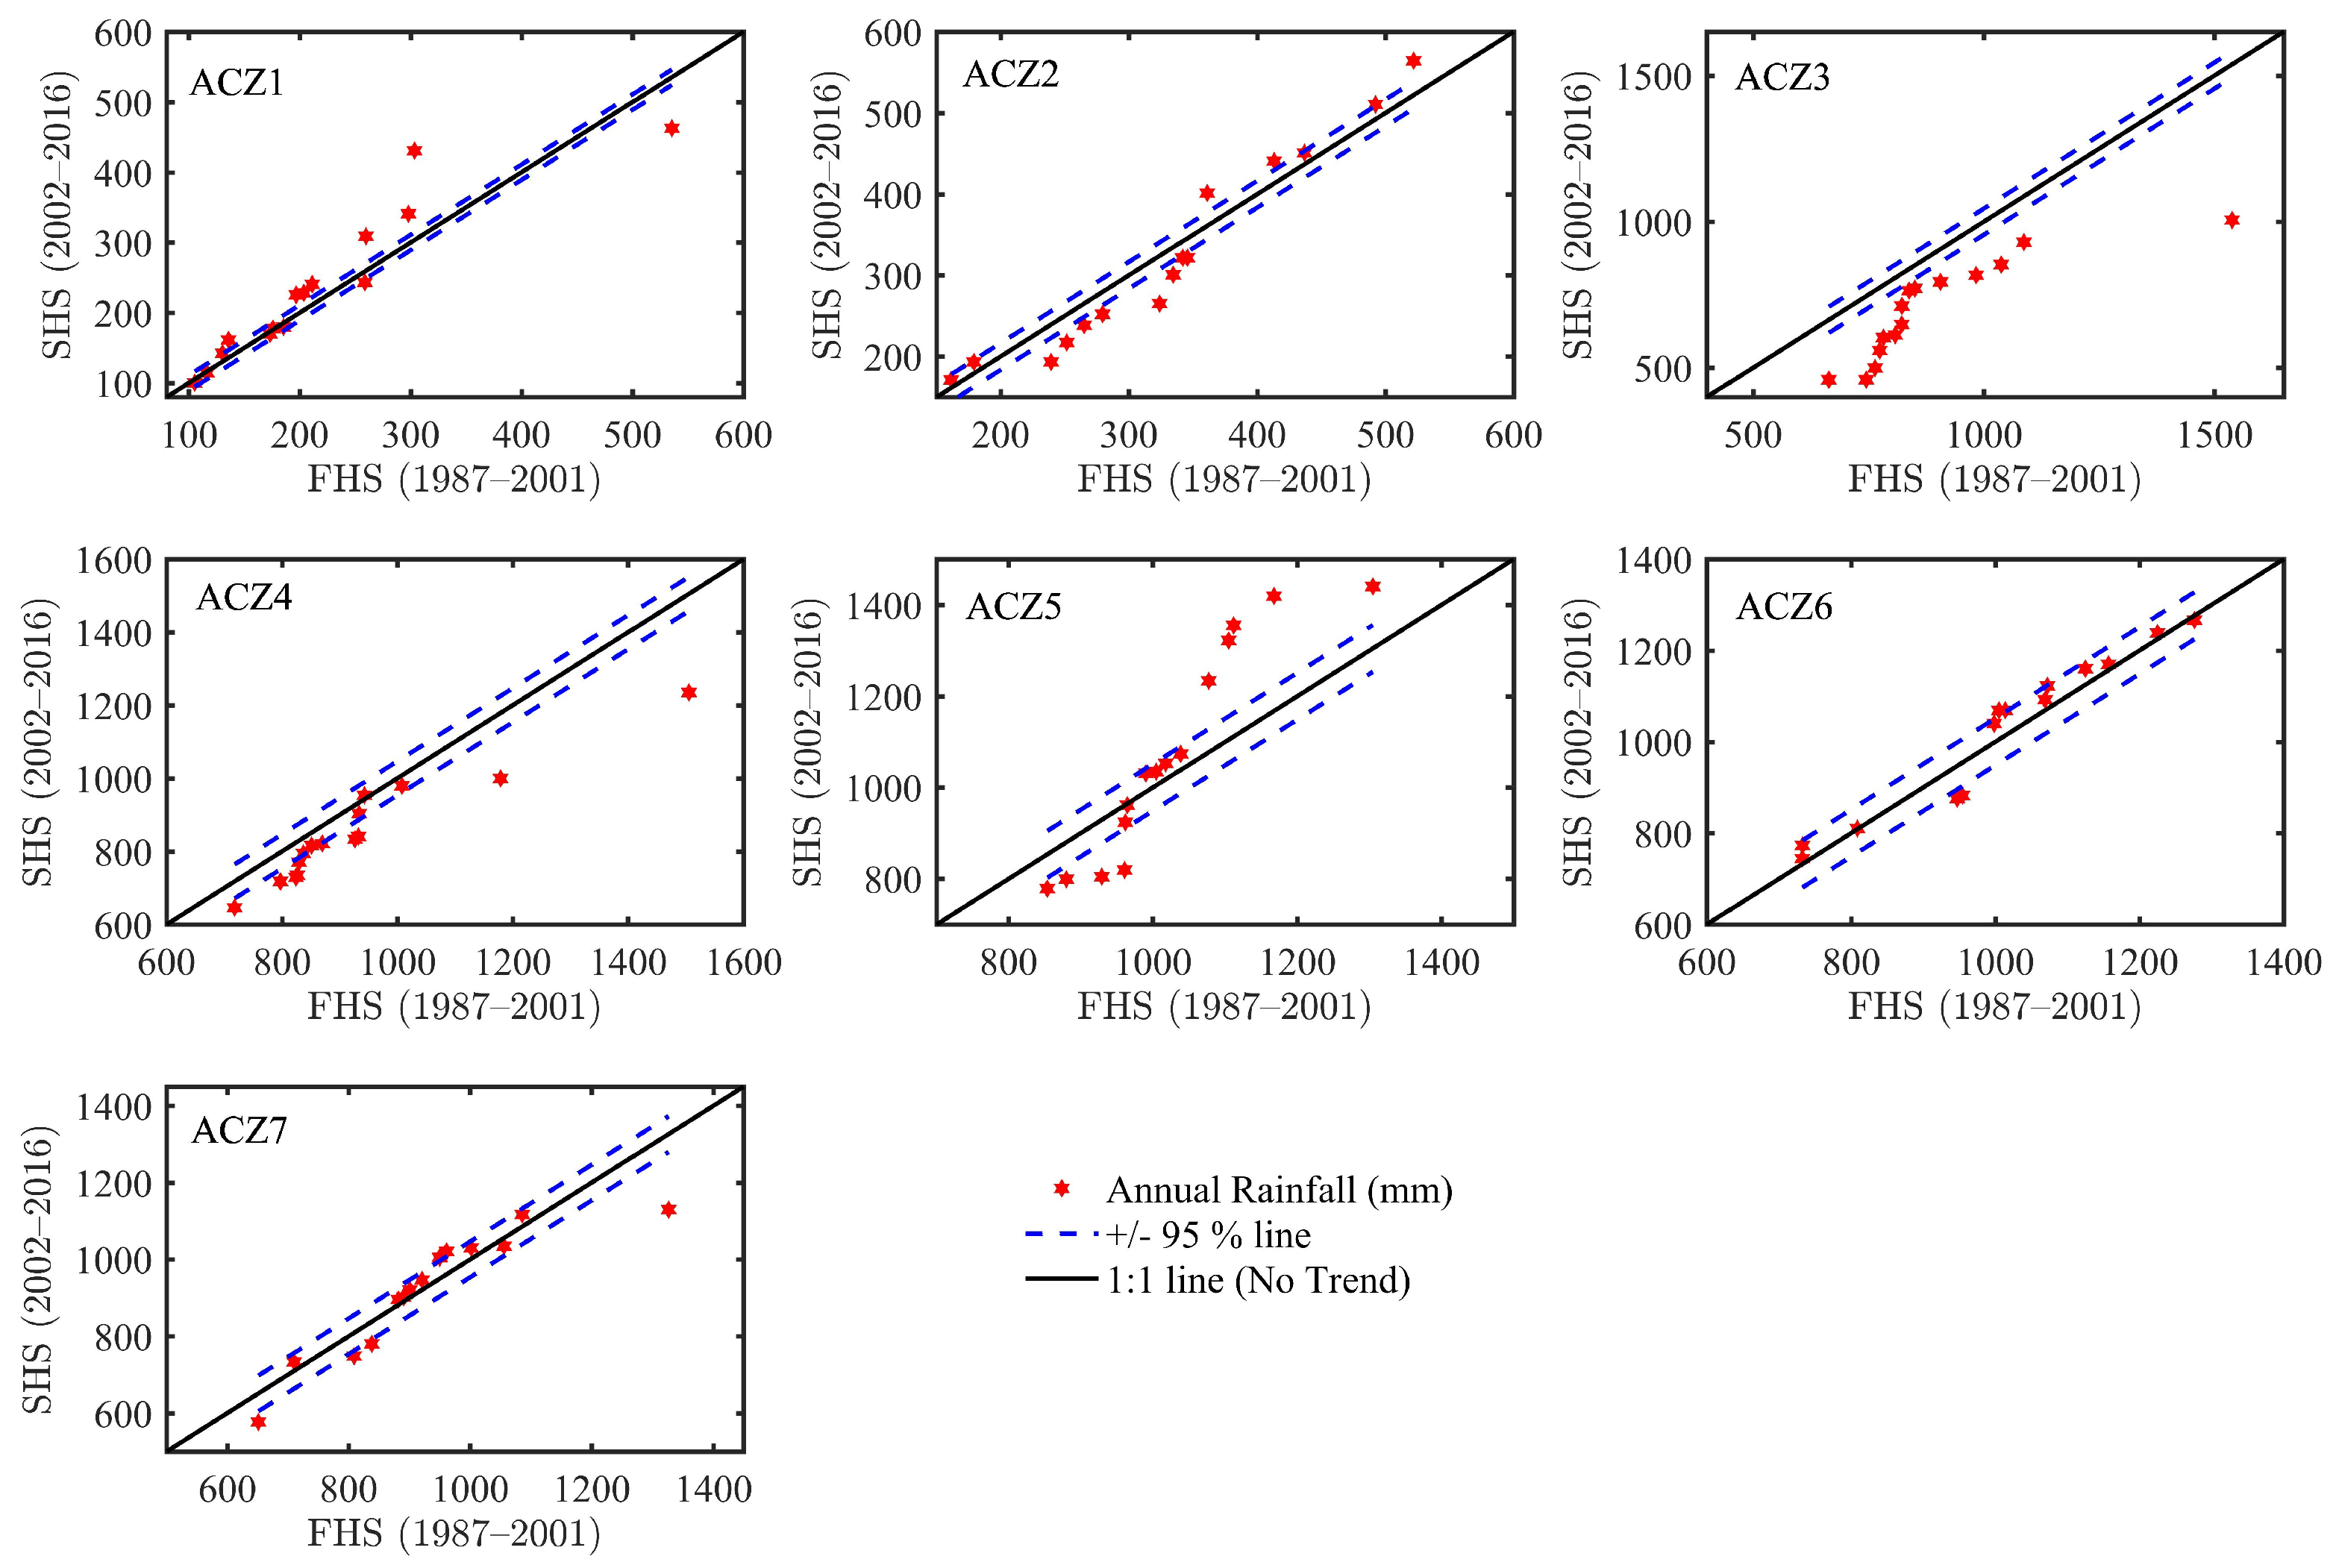
On an annual scale Figure 10, a prevailing negative trend for all categories of rainfall (low, medium, and high) has been detected in ACZ3 and ACZ4 with almost all values exceeding the 0.05 relative band limit in ACZ3. In ACZ2 and ACZ6, medium rainfall categories showed decreasing trend whereas low and high rainfall categories showed an increasing trend. In ACZ5, the data points show an increasing trend in medium and high rainfall categories whereas decreasing in low rainfall categories. Relatively, ACZ7 showed unclear trend with the value concentrated within the 0.05 band limit.
4. Discussion
4.1. Rainfall Variability in the Basin
From the monthly distribution of annual rainfall, Kiremt/Summer rainfall is the main rainfall season for the area with an elevation greater than 1500 m.a.s.l. On the contrary, Belg/Spring rainfall is the main rainfall season in the area less than 1500 m.a.s.l. Comparing the value of CV, ACZ1 showed a higher seasonal and annual variability of rainfall. Relatively, most of the ACZs in higher elevations showed lower inter-annual variation (CV < 20%) whereas ACZs in lower elevations showed moderate to high variation (CV > 20%) of annual rainfall. Higher inter-annual variability of maximum daily and Belg rainfall was observed in all ACZs. The results of this study are generally consistent with others research findings that were conducted in different parts of the country. These research documents reported that rainfall in Belg/Spring exhibits higher inter-annual variability than Kiremt/Summer rainfall [25,29,36,43]. Similarly, previous studies found that the areas with high rainfall amounts exhibit a low coefficient of variations at different time series [4,15,26,31,36,43].
4.2. Rainfall Trend
From MK analysis, in daily maximum rainfall a statistically significant increasing trend was detected in ACZ1, ACZ5, and ACZ6 with increases of 1.02, 0.72, and 0.52 mm/year, respectively. In addition, seasonal and annual trend tests showed a mix of increasing and decreasing trends in different ACZs. Analysis of Belg rainfall indicated that all of the ACZ in the study basin showed a decreasing trend over the last 30 years (1987–2016). The maximum rate of change in Belg/Spring rainfall was −2.22, −2.38, and −4.11 mm/year in ACZ7, ACZ3, and ACZ4, respectively. The Kiremt rainfall, however, showed a non-significant increasing trend for all ACZs except ACZ3 showed a significantly decreasing trend at a 0.05 significance level. The analysis also revealed that three ACZs (ACZ2-4) depicted decreasing trends of annual rainfall, besides ACZ3, which is statistically significant. The maximum annual decreasing rate was observed in ACZ2, ACZ4, and ACZ3 at −0.59, −1.96, and −12.3 mm respectively between 1987 and 2016. Among the highland ACZs, ACZ6 showed the maximum increase in annual rainfall with 3.73 mm/year.
In the WSRB, non-uniform trend was detected among ACZs that were considered at different temporal scales using the MK method. The finding agrees with previous studies conducted in the different river basins of the country [25,26,30,36,37,38,43]. In Lake Tana Sub-basin, Ref. [6] revealed a general decreasing trend in annual rainfall. Ref. [15] reported dominantly decreasing trends in small and main rain seasons and annual rainfall in the Choke Mountain Watersheds (1981–2016). Ref. [36] found an increasing trend in the Kiremt season and annual rainfall in most of the stations investigated, however, the Belg season rainfall showed a non-significant declining trend in four of the five representative stations in Modjo River Watershed, Awash River Basin of Ethiopia. Similarly, Ref. [19] reported a decreasing trend in all stations located in the semi-arid areas of Western Tigray, Ethiopia. Ref. [26] found mixed results of increasing and decreasing seasonal and annual rainfall in the Upper Wabe Shebelle River Basin, Ethiopia. On the contrary, Ref. [9] found annual and seasonal rainfall totals showed increasing trends in the Alwero watershed, in western Ethiopia.
In this study, the ITA method was also applied to investigate the existence of a statistical trend in maximum daily, rainy season, and annual rainfall. The advantage of ITA over the MK method is that detailed trend evaluation can be made by dividing the rainfall into three categories that are “low”, “medium”, and “high”. Uniform trends were not detected in rainfall in all ACZs. Except for ACZ2, all ACZs showed more points above the no-trend line implying an overall increasing trend of daily maximum rainfall. On seasonal rainfall, a decreasing trend was detected in ACZs based on the percentage of data points located below the no-trend line. On other hand, Kiremt rainfall showed a generally increasing trend in all ACZs except for ACZ3. Similarly, ACZ3 showed decreasing trend in annual rainfall in low, middle, and high categories. In the annual time series, the data points are concentrated within the ±0.05 band line. Even though a limited documents were found on trend analysis using the ITA method, the finding of this study is consistence with previous studies that showed a non-uniform trend result [24,26,28].
MK and ITA Method Comparison
The results of the ITA have been compared with the ones obtained through the MK method. In this study, all statistically significant increasing or decreasing trends at 0.05% of the level of significance using the MK method showed a similar trend in all categories of rainfall using the ITA method. On the contrary, even though most of the data points fall above the no-trend line in all categories, there is no significant increasing or decreasing trend detected in the time series data using the MK method. In general, a similar result was observed using the MK and ITA method. But, an in-depth assessment of rainfall trends in the low, middle, and high categories was only possible using the ITA method. Because of the higher variability of rainfall in the basin, the ITA method is more complex to decide the existence of a trend at a different period than the statistical method. The data points are very scattered in the plot. Even though ITA has the advantage of estimating hidden trends at three categories of the data point, in this study, it was found that defining the boundary of low, middle, and high data values is not as simple as stated in the initial work [23].
5. Conclusions
This study investigated variability and trend in maximum daily, rainy seasons, and annual rainfall in the Wabi Shebele River basin over 30 years (1987–2016) using MK and ITA methods. From the agroclimatic zonation of the WSRB, arid and semi-arid climates cover 81% of the area whereas only 19% are considered humid climates. The distribution of annual rainfall in the basin is bimodal. In this study, lowland and low rainfall areas tend to experience high rainfall variability than highland and higher annual rainfall areas. The findings indicate that, according to the dataset and methods used in this study, annual rainfall in WSRB shows a mixed upward or downward trend with respect to time. The analysis of trends in seasonal rainfall for different parts of the basin found that while the highly variable Belg rain displayed any insignificant decrease over the study period, the Kiremt rain was insignificant increasing. In line with this, agricultural practices in Belg/Spring season will be affected if a similar trend continues particularly in lowland areas where Belg is the main rainy season. In general, the amount of annual rainfall shows a decreasing trend with higher interannual variability. Coupled with climate change, a decreasing trend of rainfall severely impacts the livelihoods of the rural communities relying on subsistence rainfed agriculture.
Finally, the findings of this study provide valuable information on the distribution and variability of rainfall in the WSRB essential for planning and designing sustainable water management strategies and minimizing the impact of droughts and floods. Further study should be conducted to predict the future pattern of the rainfall in the basin using an appropriate climate model under different projection scenarios. Data scarcity was the major limitation of this study in that each agroclimatic zone is represented by one meteorological station. Thus, maximum effort should be made to establish new meteorological stations, especially in the middle and lower part of the basin.
Author Contributions
A.T.T. collected and analyzed data, and wrote the original manuscript; A.M. major supervisor and A.K.K. co-supervisor supervised and instructed the analyses of the results and modified the manuscript. This research article is part of PhD research for the first author. All authors have read and agreed to the published version of the manuscript.
Funding
This PhD study was funded by the German Academic Exchange Service (DAAD) (EECBP HomeGrown PhD Scholarship Programme) and the Universität der Bundeswehr München (Scholarship and Support Program for Foreign Students and Doctoral Candidates (STIBETIII)).
Institutional Review Board Statement
Not applicable.
Informed Consent Statement
Not applicable.
Data Availability Statement
Data will be available upon request to the authors.
Acknowledgments
The authors would like to thank the National Meteorological Service Agency of Ethiopia for providing the raw meteorological data. We acknowledge financial support by Universität der Bundeswehr München. We extend our thanks to Johanna Schmidt and Yonas Abebe for language editing, and technical improvements.
Conflicts of Interest
The authors declare no conflict of interest.
References
- IPCC. Summary for Policymakers. In Climate Change 2021: The Physical Science Basis. Contribution of Working Group I to the Sixth Assessment Report of the Intergovernmental Panel on Climate Change; Masson-Delmotte, V., Zhai, P., Pirani, A., Connors, S.L., Péan, C., Eds.; Technical Report; Cambridge University Press: Cambridge, UK, 2021; in press. [Google Scholar]
- FAO. The State of Food and Agriculture: Climate Change, Agriculture and Food Security; Report; Food and Agriculture Organization of the United Nations: Rome, Italy, 2016. [Google Scholar]
- IPCC. Climate Change 2014: Impacts, Adaptation, and Vulnerability; Part A: Global and Sectoral Aspects. Contribution of Working Group II to the Fifth Assessment Report of the Intergovernmental Panel on Climate Change; Technical Report; Cambridge University Press: Cambridge, UK; New York, NY, USA, 2014. [Google Scholar]
- Cheung, W.H.; Senay, G.B.; Singh, A. Trends and spatial distribution of annual and seasonal rainfall in Ethiopia. Int. J. Climatol. 2008, 28, 1723–1734. [Google Scholar] [CrossRef]
- Degefu, M.A.; Bewket, W. Variability, trends, and teleconnections of stream flows with large-scale climate signals in the Omo-Ghibe River Basin, Ethiopia. Environ. Monit. Assess 2017, 189, 142. [Google Scholar] [CrossRef] [PubMed]
- Addisu, S.; Selassie, Y.G.; Fissha, G.; Gedif, B. Time series trend analysis of temperature and rainfall in lake Tana Sub-basin, Ethiopia. Environ. Syst. Res. 2015, 4, 1–12. [Google Scholar] [CrossRef] [Green Version]
- Admassu, S.; Seid, A.H. Analysis of rainfall trend in Ethiopia. Eth. J. Sci. Technol. 2006, 3, 15–30. [Google Scholar]
- NMSA. Climate Change National Adaptation Programme of Action (NAPA) of Ethiopia; Technical Report; National Meteorological Agency: Addis Ababa, Ethiopia, 2007.
- Alemayehu, A.; Maru, M.; Bewket, W.; Assen, M. Spatiotemporal variability and trends in rainfall and temperature in Alwero watershed, western Ethiopia. Environ. Syst. Res. 2020, 9, 22. [Google Scholar] [CrossRef]
- Yang, N.; Men, B.H.; Lin, C.K. Impact analysis of climate change on water resources. Procedia Eng. 2011, 24, 643–648. [Google Scholar]
- Hänsel, S.; Petzold, S.; Matschullat, J. Precipitation trend analysis for Central Eastern Germany. In Bioclimatology and Natural Hazards; Springer: Dordrecht, The Netherlands, 2009; pp. 29–38. [Google Scholar]
- Mann, H.B. Non-Parametric Test Against Trend. Econometrica 1945, 13, 245–259. [Google Scholar] [CrossRef]
- Sen, P.K. Estimates of the Regression Coefficient Based on Kendall’s Tau. JASA 1968, 63, 1379–1389. [Google Scholar] [CrossRef]
- Aamir, E.; Hassan, I. Trend analysis in precipitation at individual and regional levels in Baluchistan, Pakistan. IOP Conf. Ser. Mater. Sci. Eng. 2018, 414, 012042. [Google Scholar] [CrossRef] [Green Version]
- Ademe, D.; Ziatchik, B.F.; Tesfaye, K.; Simane, B.; Alemayehu, G.; Adgo, E. Climate trends and variability at adaptation scale: Patterns and perceptions in an agricultural region of the Ethiopian Highlands. Weather. Clim. Extrem. 2020, 29, 100263. [Google Scholar] [CrossRef]
- Ahmad, I.; Tang, D.; Wang, T.; Wang, M.; Wagan, B. Precipitation trends over time using Mann-Kendall and spearman’s Rho tests in swat river basin, Pakistan. Adv. Meteorol. 2015, 2015, 431860. [Google Scholar] [CrossRef] [Green Version]
- Alemu, Z.A.; Dioha, M.O. Climate change and trend analysis of temperature: The case of Addis Ababa, Ethiopia. Environ. Syst. Res. 2020, 9, 27. [Google Scholar] [CrossRef]
- Bayable, G.; Amare, G.; Alemu, G.; Gashaw, T. Spatiotemporal variability and trends of rainfall and its association with Pacific Ocean Sea surface temperature in West Harerge Zone, Eastern Ethiopia. Environ. Syst. Res. 2021, 10, 7. [Google Scholar] [CrossRef]
- Berhane, A.; Hadgu, G.; Worku, W.; Abrha, B. Trends in extreme temperature and rainfall indices in the semi-arid areas of Western Tigray, Ethiopia. Environ. Syst. Res. 2020, 9, 3. [Google Scholar] [CrossRef] [Green Version]
- Chattopadhyay, S.; Edwards, D.R. Long-term trend analysis of precipitation and air temperature for Kentucky, United States. Climate 2016, 4, 10. [Google Scholar] [CrossRef]
- Degefu, M.A.; Bewket, W. Trends and spatial patterns of drought incidence in the Omo-Ghibe River Basin, Ethiopia. Geogr. Ann. Ser. Phys. Geogr. 2015, 97, 395–414. [Google Scholar] [CrossRef]
- Orke, Y.A.; Li, M.H. Hydroclimatic variability in the bilate watershed, ethiopia. Climate 2021, 9, 98. [Google Scholar] [CrossRef]
- Şen, Z. Innovative Trend Analysis Methodology. J. Hydrol. Eng. 2012, 17, 1042–1046. [Google Scholar] [CrossRef]
- Alifujiang, Y.; Abuduwaili, J.; Maihemuti, B.; Emin, B.; Groll, M. Innovative trend analysis of precipitation in the Lake Issyk-Kul Basin, Kyrgyzstan. Atmosphere 2020, 11, 332. [Google Scholar] [CrossRef] [Green Version]
- Gedefaw, M.; Yan, D.; Wang, H.; Qin, T.; Girma, A.; Abiyu, A.; Batsuren, D. Innovative trend analysis of annual and seasonal rainfall variability in Amhara Regional State, Ethiopia. Atmosphere 2018, 9, 326. [Google Scholar] [CrossRef] [Green Version]
- Harka, A.E.; Jilo, N.B.; Behulu, F. Spatial-temporal rainfall trend and variability assessment in the Upper Wabe Shebelle River Basin, Ethiopia: Application of innovative trend analysis method. J. Hydrol. Reg. Stud. 2021, 37, 100915. [Google Scholar] [CrossRef]
- Şen, Z. Hydrological trend analysis with innovative and over-whitening procedures. Hydrol. Sci. J. 2017, 62, 294–305. [Google Scholar] [CrossRef]
- Caloiero, T. Evaluation of rainfall trends in the South Island of New Zealand through the innovative trend analysis (ITA). Theor. Appl. Climatol. 2020, 139, 493–504. [Google Scholar] [CrossRef]
- Asfaw, A.; Simane, B.; Hassen, A.; Bantider, A. Variability and time series trend analysis of rainfall and temperature in northcentral Ethiopia: A case study in Woleka sub-basin. Weather. Clim. Extrem. 2018, 19, 29–41. [Google Scholar] [CrossRef]
- Taye, M.; Simane, B.; Zaitchik, B.F.; Selassie, Y.G.; Setegn, S. Rainfall variability across the agro-climatic zones of a tropical highland: The case of the jema watershed, northwestern ethiopia. Environments 2019, 6, 118. [Google Scholar] [CrossRef] [Green Version]
- Esayas, B.; Simane, B.; Teferi, E.; Ongoma, V.; Tefera, N. Trends in extreme climate events over three agroecological zones of Southern Ethiopia. Adv. Meteorol. 2018, 2018, 7354157. [Google Scholar] [CrossRef]
- Beyene, A.N. Precipitation and Temperature Trend Analysis in Mekelle city, Northern Ethiopia, the Case of Illala Meteorological Station. J. Earth Sci. Clim. Chang. 2015, 7, 46–52. [Google Scholar] [CrossRef] [Green Version]
- Banerjee, A.; Chen, R.; Meadows, M.E.; Singh, R.B.; Mal, S.; Sengupta, D. An analysis of long-term rainfall trends and variability in the uttarakhand himalaya using google earth engine. Remote Sens. 2020, 12, 709. [Google Scholar] [CrossRef] [Green Version]
- Tekleab, S.; Mohamed, Y.; Uhlenbrook, S. Hydro-climatic trends in the Abay/Upper Blue Nile basin, Ethiopia. Phys. Chem. Earth 2013, 61, 32–42. [Google Scholar] [CrossRef]
- Weldegerima, T.M.; Zeleke, T.T.; Birhanu, B.S.; Zaitchik, B.F.; Fetene, Z.A. Analysis of Rainfall Trends and Its Relationship with SST Signals in the Lake Tana Basin, Ethiopia. Adv. Meteorol. 2018, 2018, 5869010. [Google Scholar] [CrossRef] [Green Version]
- Eshetu, M. Hydro-Climatic Variability and Trend Analysis of Modjo River Watershed, Awash River Basin of Ethiopia. Hydrol. Curr. Res. 2020, 11, 1–8. [Google Scholar]
- Shawul, A.A.; Chakma, S. Trend of extreme precipitation indices and analysis of long-term climate variability in the Upper Awash basin, Ethiopia. Theor. Appl. Climatol. 2020, 140, 635–652. [Google Scholar] [CrossRef]
- Tadese, M.T.; Kumar, L.; Koech, R.; Zemadim, B. Hydro-climatic variability: A characterisation and trend study of the Awash River Basin, Ethiopia. Hydrology 2019, 6, 35. [Google Scholar] [CrossRef]
- Gebrehiwot, T. Assessing the evidence of climate variability in the northern part of Ethiopia. J. Dev. Agric. Econ. 2013, 5, 104–119. [Google Scholar] [CrossRef] [Green Version]
- Bekele-Tesemma, A. Useful Trees and Shrubs for Ethiopia: Identification, Propagation and Management in 17 Agro-Ecological Zones; Technical Report; RELMA in ICRAF Project: Nairobi, Kenya, 2007. [Google Scholar]
- Alexandersson, H. A homogeneity test applied to precipitation data. Int. J. Climatol. 1986, 6, 661–675. [Google Scholar] [CrossRef]
- Pettitt, A.N. A Non-Parametric Approach to the Change-Point Problem. J. R. Stat. Soc. Ser. C Appl. Stat. 1979, 28, 126–135. [Google Scholar] [CrossRef]
- Elzopy, K.A.; Chaturvedi, A.K.; Chandrana, K.M.; Gopinath, G.; Naveena, K.; Surendran, U. Trend analysis of long-term rainfall and temperature data for Ethiopia. S. Afr. Geogr. J. 2020, 103, 381–394. [Google Scholar] [CrossRef]
- Hamed, K.H. Enhancing the effectiveness of prewhitening in trend analysis of hydrologic data. J. Hydrol. 2009, 368, 143–155. [Google Scholar] [CrossRef]
- Yue, S.; Pilon, P.; Phinney, B.; Cavadias, G. The influence of autocorrelation on the ability to detect trend in hydrological series. Hydrol. Process. 2002, 16, 1807–1829. [Google Scholar] [CrossRef]
- Hamed, K.H.; Rao, A.R. A modified Mann-Kendall trend test for autocorrelated data. J. Hydrol. 1998, 204, 182–196. [Google Scholar] [CrossRef]
- Yue, S.; Pilon, P. A comparison of the power of the t test, Mann-Kendall and bootstrap tests for trend detection. Hydrol. Sci. J. 2004, 49, 21–37. [Google Scholar] [CrossRef]
- Patakamuri, S.K.; O’Brien, N. Modified Versions of Mann Kendall and Spearman’s Rho Trend Tests; R Package ‘Modifiedmk’. 2021. Available online: https://cran.r-project.org/web/packages/modifiedmk/index.html (accessed on 7 August 2022).
- Patakamuri, S.K.; Das, B. R Package ‘Trendchange’: Innovative Trend Analysis and Time-Series Change Point Analysis Version 1.2. 2022. Available online: https://www.skpatakamuri.com/_files/ugd/8339fc_71634dfc92794ccea524fa36bfb1d529.pdf?index=true (accessed on 7 August 2022).
Figure 1.
Location map of Wabi Shebele River Basin (WSRB).

Figure 2.
Agroclimatic zone map of WSRB.

Figure 3.
Flowchart showing the methodology of the study.

Figure 4.
Rainfall monthly distribution in WSRB agroclimatic zones.

Figure 5.
Annual rainfall pattern in agroclimatic zones from 1987 to 2016.

Figure 6.
Lag−1 autocorrelation plot of daily maximum, spring, summer, and annual rainfall.

Figure 7.
Daily maximum rainfall trend using the ITA method.

Figure 8.
Belg/Spring rainfall trend using the ITA method.

Figure 9.
Kiremt/Summer rainfall trend using the ITA method.

Figure 10.
Annual rainfall trend using the ITA method.


Table 1.
Agroclimatic zones and selected stations.
| ACZ: Agroclimatic Zones | MAR (mm) | Elevation (m) | Area | Selected Station | ||||
|---|---|---|---|---|---|---|---|---|
| Km2 | % | Site | Latitude | Longitude | Elevation (m) | |||
| ACZ1: Dry Bereha (Hot-lowlands) | Less than 900 (Dry = Arid and Semi-Arid) | <500 | 42,113.71 | 22.20 | Gode | 5.92 | 43.58 | 290 |
| ACZ2: Dry Kolla (Lowlands) | 500–1500 | 104,350.7 | 55.00 | Degahabour | 8.22 | 43.56 | 1070 | |
| ACZ3: Dry Weyna Dega (Midlands) | 1500–2300 | 11,973.94 | 6.31 | Gursum | 9.35 | 42.4 | 1900 | |
| ACZ4: Dry Dega (Highlands) | 2300–3200 | 795.35 | 0.42 | Indeto | 7.57 | 39.9 | 2416 | |
| ACZ8: Dry Wurch (Frost zones) | 3200–3700 | 37.46 | 0.02 | Not Available | ||||
| ACZ5: Moist Kolla (Lowlands) | Greater than 900 (Moist = humid) | 500–1500 | 7599.37 | 4.01 | Gololcha | 8.26 | 40.13 | 1372 |
| ACZ6: Moist Weyna Dega (Midlands) | 1500–2300 | 12,489 | 6.59 | Bedessa | 8.91 | 40.77 | 1703 | |
| ACZ7: Moist Dega (Highlands) | 2300–3200 | 9335.57 | 4.92 | Arsi Robe | 7.88 | 39.62 | 2441 | |
| ACZ9: Moist Wurch (Frost zones) | 3200–3700 | 960.6 | 0.51 | Not Available | ||||
| Total Area | 189,655.7 | 100 | ||||||
Table 2.
Summary of homogeneity test result.
| Zone | Spring | Summer | Annual | |||
|---|---|---|---|---|---|---|
| Pettitt | SNHT | Pettitt | SNHT | Pettitt | SNHT | |
| ACZ1 | 0.19 | 0.36 | 0.3 | 0.21 | 0.74 | 0.63 |
| ACZ2 | 0.51 | 0.08 | 0.56 | 0.69 | 0.21 | 0.78 |
| ACZ3 | 0.31 | 0.14 | 0.25 | 0.04 * | 0.02 * | 0.11 |
| ACZ4 | 0.04 * | 0.13 | 0.27 | 0.46 | 0.54 | 0.35 |
| ACZ5 | 0.53 | 0.13 | 0.69 | 0.49 | 0.82 | 0.42 |
| ACZ6 | 0.02 * | 0.93 | 0.68 | 0.11 | 0.29 | 0.36 |
| ACZ7 | 0.73 | 0.33 | 0.23 | 0.04 * | 0.41 | 0.59 |
Note: * Non-homogeneous at a 5% significant level.
Table 3.
Statistical summary of daily maximum, rainy seasons, and annual rainfall (mm).
| Temporal Scale | Spatial Zone | Minimum | Maximum | Mean | Variance | SD | CV (%) |
|---|---|---|---|---|---|---|---|
| Daily Maximum | ACZ1 | 19.2 | 106.6 | 47.0 | 485.7 | 22.0 | 46.9 |
| ACZ2 | 24.0 | 110.0 | 49.8 | 324.1 | 18.0 | 36.1 | |
| ACZ3 | 32.3 | 104.0 | 58.8 | 289.7 | 17.0 | 29.0 | |
| ACZ4 | 24.7 | 84.0 | 49.2 | 182.8 | 13.5 | 27.5 | |
| ACZ5 | 23.1 | 90.6 | 48.4 | 379.8 | 19.5 | 40.3 | |
| ACZ6 | 25.1 | 95.0 | 51.5 | 291.2 | 17.1 | 33.2 | |
| ACZ7 | 28.9 | 129.6 | 50.0 | 385.2 | 19.6 | 39.2 | |
| Belg/Spring | ACZ1 | 26.9 | 300.4 | 126.4 | 3378.2 | 58.1 | 46.0 |
| ACZ2 | 59.9 | 374.8 | 192.1 | 5597.7 | 74.8 | 39.0 | |
| ACZ3 | 172.7 | 620.8 | 302.9 | 11,528.2 | 107.4 | 35.4 | |
| ACZ4 | 94.3 | 620.1 | 269.6 | 12,519.6 | 111.9 | 41.5 | |
| ACZ5 | 176.7 | 568.1 | 352.4 | 13,764.8 | 117.3 | 33.3 | |
| ACZ6 | 160.0 | 818.4 | 333.3 | 17,183.4 | 131.1 | 39.3 | |
| ACZ7 | 115.0 | 429.0 | 260.3 | 7020.0 | 83.8 | 32.2 | |
| Kiremt/Summer | ACZ1 | 0.0 | 338.8 | 95.5 | 6966.1 | 83.5 | 87.4 |
| ACZ2 | 16.7 | 299.3 | 106.7 | 5397.0 | 73.5 | 68.9 | |
| ACZ3 | 154.8 | 631.7 | 379.4 | 11,143.4 | 105.6 | 27.8 | |
| ACZ4 | 275.9 | 851.3 | 456.0 | 15,727.2 | 125.4 | 27.5 | |
| ACZ5 | 334.0 | 1009.7 | 527.8 | 17,850.9 | 133.6 | 25.3 | |
| ACZ6 | 181.5 | 882.2 | 563.7 | 23,640.9 | 153.8 | 27.3 | |
| ACZ7 | 205.3 | 801.4 | 510.2 | 12,350.2 | 111.1 | 21.8 | |
| Annual | ACZ1 | 100.1 | 535.3 | 227.2 | 11,275.1 | 106.2 | 46.7 |
| ACZ2 | 161.4 | 564.3 | 326.3 | 12,731.6 | 112.8 | 34.6 | |
| ACZ3 | 459.1 | 1538.4 | 797.2 | 45,085.9 | 212.3 | 26.6 | |
| ACZ4 | 646.1 | 1505.2 | 892.0 | 29,667.9 | 172.2 | 19.3 | |
| ACZ5 | 778.4 | 1440.3 | 1047.2 | 33,181.4 | 182.2 | 17.4 | |
| ACZ6 | 732.4 | 1667.5 | 1047.4 | 42,891.4 | 207.1 | 19.8 | |
| ACZ7 | 576.9 | 1326.3 | 926.0 | 23,943.1 | 154.7 | 16.7 |
Note: ACZ = Agroclimatic Zone, SD = Standard Deviation, CV = Coefficient of Variation.
Table 4.
Trend analysis results for different time series.
| No | Zones | Daily Maximum | Spring | Summer | Annual | ||||
|---|---|---|---|---|---|---|---|---|---|
| Z-Value | Sen’s Slope | Z-Value | Sen’s Slope | Z-Value | Sen’s Slope | Z-Value | Sen’s Slope | ||
| 1 | ACZ1 | 2.78 ** | 1.02 | −0.82 | −1.00 | 1.53 | 3.27 | 0.46 | 0.85 |
| 2 | ACZ2 | −1.62 | −0.53 | −0.62 | −0.85 | 0.14 | 0.16 | −0.29 | −0.59 |
| 3 | ACZ3 | −0.66 | −0.28 | −1.03 | −2.38 | −2.00 * | −3.97 | −8.59 ** | −12.3 |
| 4 | ACZ4 | 0.80 | 0.15 | −2.32 * | −4.11 | 1.46 | 3.36 | −0.86 | −1.96 |
| 5 | ACZ5 | 2.66 ** | 0.72 | −0.25 | −0.47 | 1.46 | 3.33 | 0.21 | 0.97 |
| 6 | ACZ6 | 3.28 ** | 0.52 | −0.36 | −1.1 | 1.36 | 5.84 | 0.77 | 3.73 |
| 7 | ACZ7 | 0.57 | 0.18 | −0.86 | −2.22 | 1.61 | 3.65 | 0.32 | 1.54 |
Note: *, ** statistically significant at 0.05 and 0.01 significance level.
Publisher’s Note: MDPI stays neutral with regard to jurisdictional claims in published maps and institutional affiliations. |
© 2022 by the authors. Licensee MDPI, Basel, Switzerland. This article is an open access article distributed under the terms and conditions of the Creative Commons Attribution (CC BY) license (https://creativecommons.org/licenses/by/4.0/).
Share and Cite
MDPI and ACS Style
Toni, A.T.; Malcherek, A.; Kassa, A.K. Agroclimatic Zone-Based Analysis of Rainfall Variability and Trends in the Wabi Shebele River Basin, Ethiopia. Water 2022, 14, 3699. https://doi.org/10.3390/w14223699
AMA Style
Toni AT, Malcherek A, Kassa AK. Agroclimatic Zone-Based Analysis of Rainfall Variability and Trends in the Wabi Shebele River Basin, Ethiopia. Water. 2022; 14(22):3699. https://doi.org/10.3390/w14223699
Chicago/Turabian StyleToni, Abebe Teklu, Andreas Malcherek, and Asfaw Kebede Kassa. 2022. "Agroclimatic Zone-Based Analysis of Rainfall Variability and Trends in the Wabi Shebele River Basin, Ethiopia" Water 14, no. 22: 3699. https://doi.org/10.3390/w14223699
Note that from the first issue of 2016, this journal uses article numbers instead of page numbers. See further details here.