Article

Influence of Seawater Salinity on the Survival, Growth, Development and Neonate Production of Scapholeberis mucronata (O. F. Müller) (Crustacea: Cladocera)

1
Third Institute of Oceanography, Ministry of Natural Resources P.R.C., Xiamen 361005, China
2
College of Fisheries and Life Science, Dalian Ocean University, Dalian 116023, China
3
School of Forest, Fisheries, and Geomatics Sciences, Institute of Food and Agricultural Sciences, University of Florida, Ruskin, FL 33570, USA
4
College of Ocean and Earth Sciences, Xiamen University, Xiamen 361105, China
*
Author to whom correspondence should be addressed.
Water 2022, 14(22), 3706; https://doi.org/10.3390/w14223706
Submission received: 19 October 2022 / Revised: 10 November 2022 / Accepted: 12 November 2022 / Published: 16 November 2022
(This article belongs to the Special Issue Ecosystems of Inland Saline Waters)

Abstract

:
The effect of salinity on the survival, growth, development and neonate production of the cladoceran Scapholeberis mucronata (O. F. Müller) was studied by using Chlorella pyrenoidosa as feed at 1, 2, 3, 4 salinity gradients and control group according to the pre-experiment and median lethal concentration experiment. The acute effect of salinity on this species indicated that 4 and 4.5 was its limit superior of reproduction and survival. The survival rate and growth rate of individuals reared at 1 and 2 salinity gradients were higher than that of those reared at the other gradients. The mean size of the female adult decreased from 820 to 743 μm when the salinity increased from 1 to 4. Among individuals reared at 1 and 2, the intrinsic rate of natural increase (rm) of population was 1.021 and 0.903, respectively; the rate of egg production was 1.281 and 1.390, respectively; the cumulative egg production was 83.2 and 106.0 and the mean life span was 16.05 and 17.30, respectively. These values of life history parameters were higher than those of individuals reared at 3. No eggs were produced by females reared at 4 during the whole experiment. Furthermore, individuals reared at 1 and 2 had faster embryonic development. The above results implied that S. mucronata is relatively well adapted to low-salinity conditions (1–2). Resting egg formation and sexual reproduction did not occur at all the tested salinity gradients.

1. Introduction

Cladocerans constitute one of the most important components of most zooplankton communities in the freshwater ecosystem [1]. This implies the importance of cladocerans in utilizing primary resources and, in turn, influencing the turnover of higher trophic levels. The functional roles of cladocerans in terms of their secondary production and energetic links has been well documented in lakes and seas [2,3,4]. Because of its importance to the aquatic system, the effect of some environment factors, including temperature, salinity, light and photoperiod, on Cladocera has been studied extensively. However, there are few studies on the salinity tolerance of Cladocera, the freshwater aquatic organisms, relative to the pressure of temperature and food. Due to the osmotic pressure of their body and various environmental factors, Cladocera is usually poor in salinity tolerance [5]. In order to find out the optimum salinity for the survival, growth, development and reproduction, recently, there have been some studies on the effect of salinity on Cladocera [5,6,7,8], especially on freshwater species, such as Moina rectirostris Leydig [9], Moina salina Daday [10,11], Daphnia magna Straus [12,13], Moina macrocopa Straus [14], Diaphanosoma celebensis Stingelin [15]. According to the above study, many species of Cladocera respond to salinity, and there are great differences in the tolerance and optimum salinity of different species.
Scapholeberis mucronata is a cosmopolitan eurythermal cladoceran. Compared with other species, few quantitative studies have been carried out [16]. Lemke and Benke (2003) studied the biology of S. mucronata, which found that the growth rate increased with temperature and slowed down with the increase of body length and that the number of eggs was positively correlated with temperature [17]. In the previous study, the relationship between the body length and the dry weight of S. mucronata was in the middle level relative to the other seven species of cladocerans [18]. In the present study, to learn more about its growth and reproductive behavior under different salinity gradients and to figure out whether it could be used as a live aquaculture food, experiments were designed to evaluate the effect of salinity variation on parthenogenetic reproduction, growth rates and development of this species with reference to the ecology in the aquatic system. This study not only enriched the knowledge of the ecology of Cladocera but also provided some reference information for the salinity acclimation of Cladocera.

2. Materials and Methods

2.1. Animal Incubation and Preparation

S. mucronata was collected from an aquaculture pond in Biliuhe Reservoir Fisheries Co., and then it was cultured in Key Laboratory of Hydrobiology in Liaoning Province. Laboratory-reared parthenogenetic females of S. mucronata whose juvenile age was less than 2 h were used for the experiment. A monoculture of Chlorella pyrenoidosa (was taken from Key Laboratory of Hydrobiology in Liaoning Province, in the exponential phase of growth) was offered as food, which was sufficiently supplied to maintain a slight green tint of the water. Desired salinity gradients were prepared by diluting autoclaved, aerated and nucleopore-filtered (Millipore, 0.22 μm) sea water (FSW) of 32 with the required volume of distilled water, and culture water was changed every other day. Due to the small volume of each culture unit, DO and pH were determined before each replacement of the culture medium. All the experiments were conducted at 25 ± 0.5 °C controlled by the water bath chamber. A photoperiod of light: dark (14 h: 10 hwas maintained for culturing and testing.

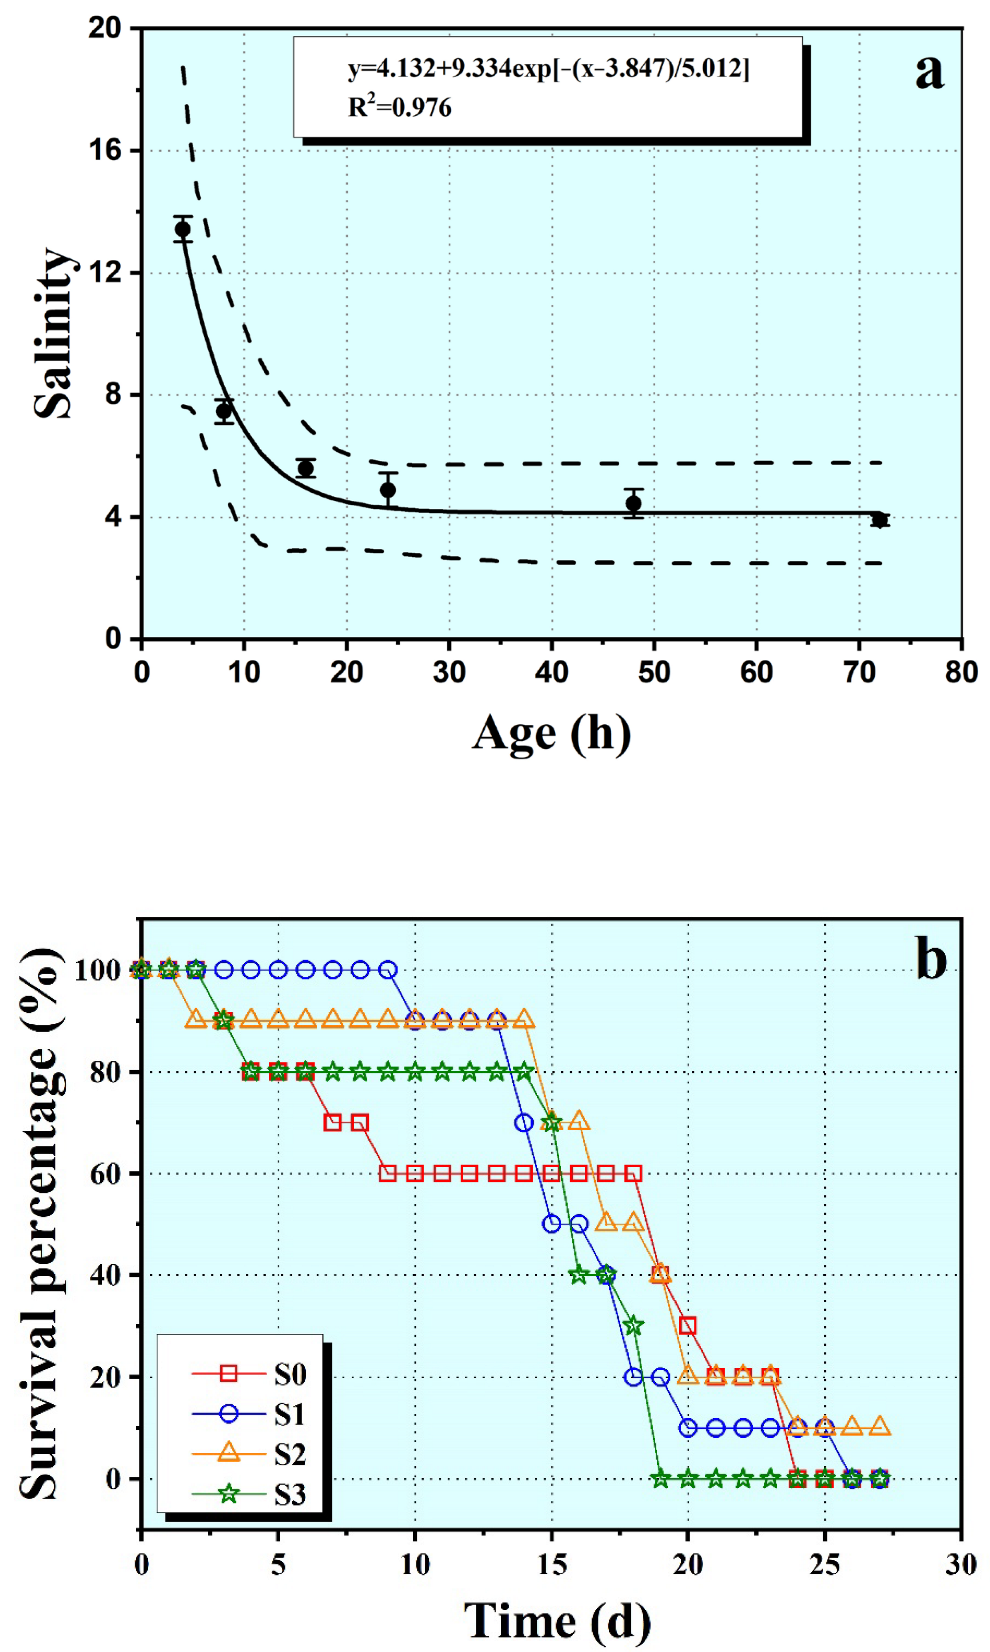
2.2. Median Lethal Concentration (LC50) Experiment

Aiming to assess the acute effect of salinity on S. mucronata, the bioassay consisted of ten newborn juveniles at each group of six different salinity gradients (3.79, 4.15, 4.55, 4.99, 5.47, 6.00). The experiment was conducted in glass-stoppered bottles (60 mL), and each bottle contained 50 mL of culture water. The experimental setup consisted of five such bottles for each salinity treatment. Juveniles were monitored for mortality over 96 h periods. Survival data were used to calculate the LC50: the salinity resulting in 50% mortality over a given time. LC50s were calculated for 1, 2, 4, 8, 16, 24, 48, 72, 96 h using the Probit Method, and the NOAEL (no observed adverse effect level, the highest concentration producing no adverse effects significantly different from the control, Nebeker and Schuytema, 1998) can be assessed based on the results [19].

2.3. Life Table Analysis and Reproduction

To determine the influence of salinity on growth, life span and neonate production, long-term experiments were carried out at four salinity gradients (1, 2, 3, 4) and in a control medium (freshwater). In all, 325 newborn neonates (<2 h) were transferred, 1 to each bottle (50 mL), and 15 such bottles were maintained for each salinity treatment. Meanwhile, ten juveniles were introduced in one bottle, and five such bottles were prepared for each salinity treatment, which was used to compute the rm of S. mucronata. Survival, growth, maturity instars and neonate production in each bottle were recorded three times daily, and fresh algae liquid bait was supplemented, with more or less freshwater to maintain the stability of the salinity. The increase in the length (μm) of each live specimen was measured every day with an ocular scale under an Olympus microscope (40×). The experiments lasted until the death of all animals.
According to the results, life tables under every salinity gradient were tabled. Then the rm was calculated based on the equation ∑(lxbxermx) = 1, which was solved iteratively to obtain a more precise solution for rm [20], where x was age (days), lx was the proportion of the individuals surviving at the beginning of each interval (x) and bx was the number of juveniles produced per female during that interval (x).

2.4. Embryonic Development

About 400 parthenogenetic females were reared individually in 24-well cell plates in order to study the different embryonic stages under different salinity treatments. It was not possible to clearly follow the details of embryonic development in the brood chamber itself in view of the dark color and opacity of the carapace. Hence, a few parthenogenetic females were sacrificed at fixed time intervals, and their brood chamber was carefully dissected to release the developing eggs, showing the distinct stages of development.

2.5. Statistical Analysis

Duncan’s multiple comparison combined with one-way ANOVA was used to compare the difference between two groups. All the statistical analyses were carried out with OriginPro 2022 (OriginLab Corporation©, Northampton, MA, USA). OriginPro 2022 was used to plot the figures.

3. Results

3.1. Survival

During the experiment to determine the acute effect of salinity on S. mucronata, individuals did not appear to die within two hours. However, from the fourth hour after the beginning, death emerged. The LC50s of juveniles exposed to salinity exhibited at 4, 8, 16, 24, 48 and 72 h were 13.43, 7.47, 5.60, 4.88, 4.45 and 3.91, respectively. According to Figure 1a, it could be assessed that the safe salinity for living S. mucronata was under 4.00. Moreover, the limit superior of reproduction and survival for S. mucronata was 4 and 4.5, respectively. Under all salinity treatments, the curve of the survival rate of S. mucronata followed Deevey I’s pattern, namely low death rate of population at the prophase of culture and high death rate at anaphase.
During 14~15 d after the beginning of the experiment, the survival percentage of S. mucronata reared at 1 and 2 remained above 90%, which was obviously higher than that of those reared at other treatments. However, from 16 to 17 d, the survival percentage of S. mucronata reared at all salinity gradients rapidly declined until death (Figure 1b).

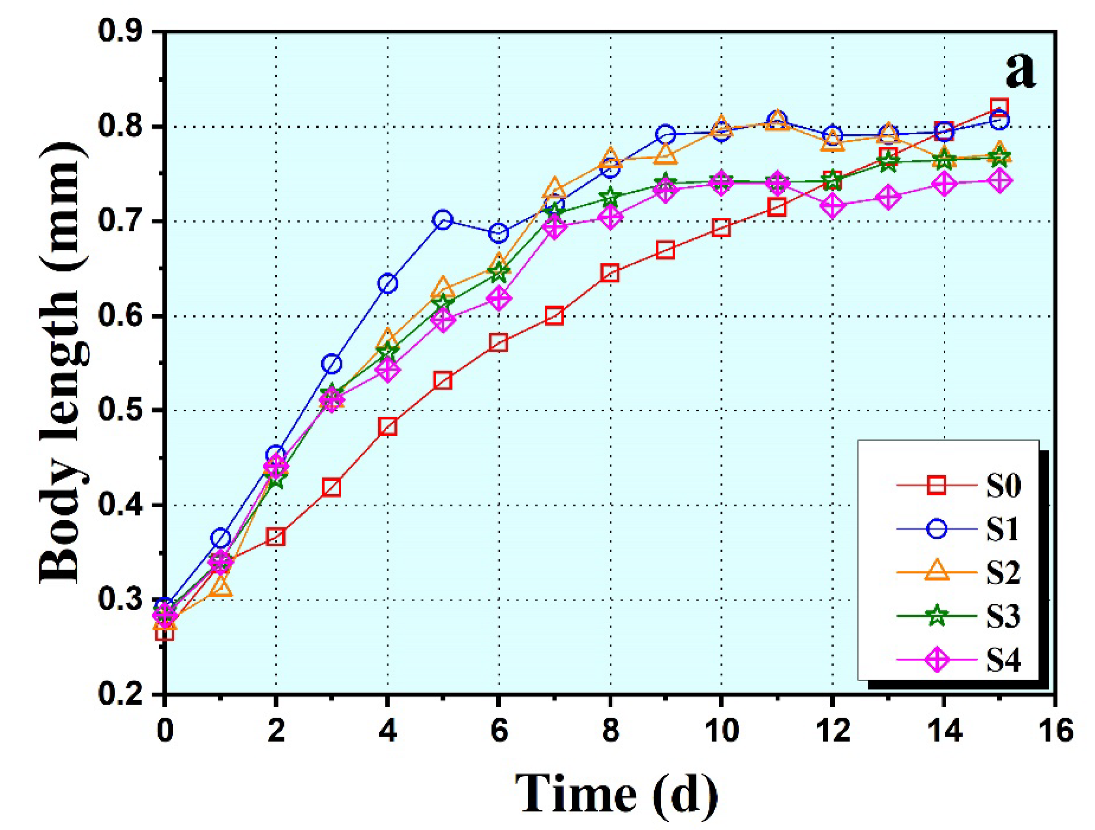
3.2. Growth and Reproduction

Mean initial body length (0.28 ± 0.01 mm) was not significantly different across salinity gradients for S. mucronata juveniles. Initially, the body length increased at a rate that did not correspond with salinity (Figure 2a). Juveniles grew faster in the initial stages of the experiment at all treatments, and then slowed down at higher salinity treatments. The juveniles at 1 grew faster than those at other gradients. The size attainment of female adults showed a significant inverse relation (p < 0.05) with salinity (mean size: 820 μm at 1 and 743 μm at 4). Females reared at 3 reproduced significantly later than those reared at salinity ≤2 (p < 0.05), although the age at first reproduction (AR) did not differ significantly between control, 1 and 2 (Table 1). Mean intervals between clutches appeared to follow a similar trend. S. mucronata individuals reared at 3 produced significantly fewer clutches per female, number of eggs per female and number of eggs per clutch than those reared at other treatments (Table 1). At the same time, these parameters of reproduction were not different among control, 1 and 2 (Table 1). Egg production was high initially for females reared at 1 but began to level off at 72.3 eggs per female after eighth maturity instars (Figure 2b). However, females reared at 2 continued to produce eggs and reached a maximum of 106.0 eggs per female. Cumulative egg production corresponded to maximum of 83.2, 73.1 and 31.7 eggs per female at 1, control and 3, respectively. The number of eggs per female for individuals reared at 1 reached the maximum value at the fifth adult instars, whereas at 2 and control, they reached the maximum value at the sixth, respectively. Interestingly, after reaching the maximum value, number of eggs per female for individuals reared at all treatments presented a wave-shaped change until death (Figure 2c). The cumulative egg production of this species was plotted against adult instar number showing the rates of egg production, which was the angle of slope of the regression line [21].
The rates of egg production were 1.281, 1.390, 1.324 and 0.921 for 1, 2, control and 3, respectively (Table 1, Figure 2b). The reproductive value (VX) is important to determine the contribution that an individual female will make to the future population [22]. The reproductive value of S. mucronata at all treatments reached the maximum value after 5~7 d from the beginning of production. The VX of a specimen reared at 2 was significantly greater than that of those reared at other treatments (Figure 2d).

3.3. Life Table

The instar number is the number of times of desquamation, while the duration of the instar gives the interval of desquamation. Under all treatments, S. mucronata had three pre-adult instars conformably, but it had a different number of adult instars. At 2, there were thirteen adult instars, whereas at other treatments, there were eleven adult instars. The duration of each instar and the cumulative duration of each instar were significantly longer for individuals reared at control compared with those reared at salinity ≥1 (p < 0.05), while specimens reared at 1, 2, 3 and 4 did not differ and corresponded to a cumulative duration of each instar of 24.5, 18.4, 23.3, 18.0 and 18.6 d per female for individuals reared at control, 1, 2, 3 and 4, respectively. In conformity with normalcy, the first adult instar, during which the females were primiparous, was distinctly longer than the longest pre-adult instar observed at all treatments. Mean lifespan did not differ among individuals reared at all treatments, although those reared at 2 exhibited an obviously longer mean lifespan than other groups (Table 1). The intrinsic rate of population (rm) increase was not related to salinity and differed from 0.481 to 1.021. The value of rm was highest at 1 (Table 2). Mean generation time (G) was not related to the salinity. S. mucronata reared at 1 and 3 had shorter mean generation times than those reared at control and 2. The net reproductive rate (R0) increased with salinity from 34.6 at control to 60.6 at 2, but R0 did not increase at salinity ≥3 (Table 2). The finite rate of increase (λ) decreased from 2.78 at 1 to 1.62 at 3, while it was 2.18 at control (Table 2).

3.4. Embryonic Development

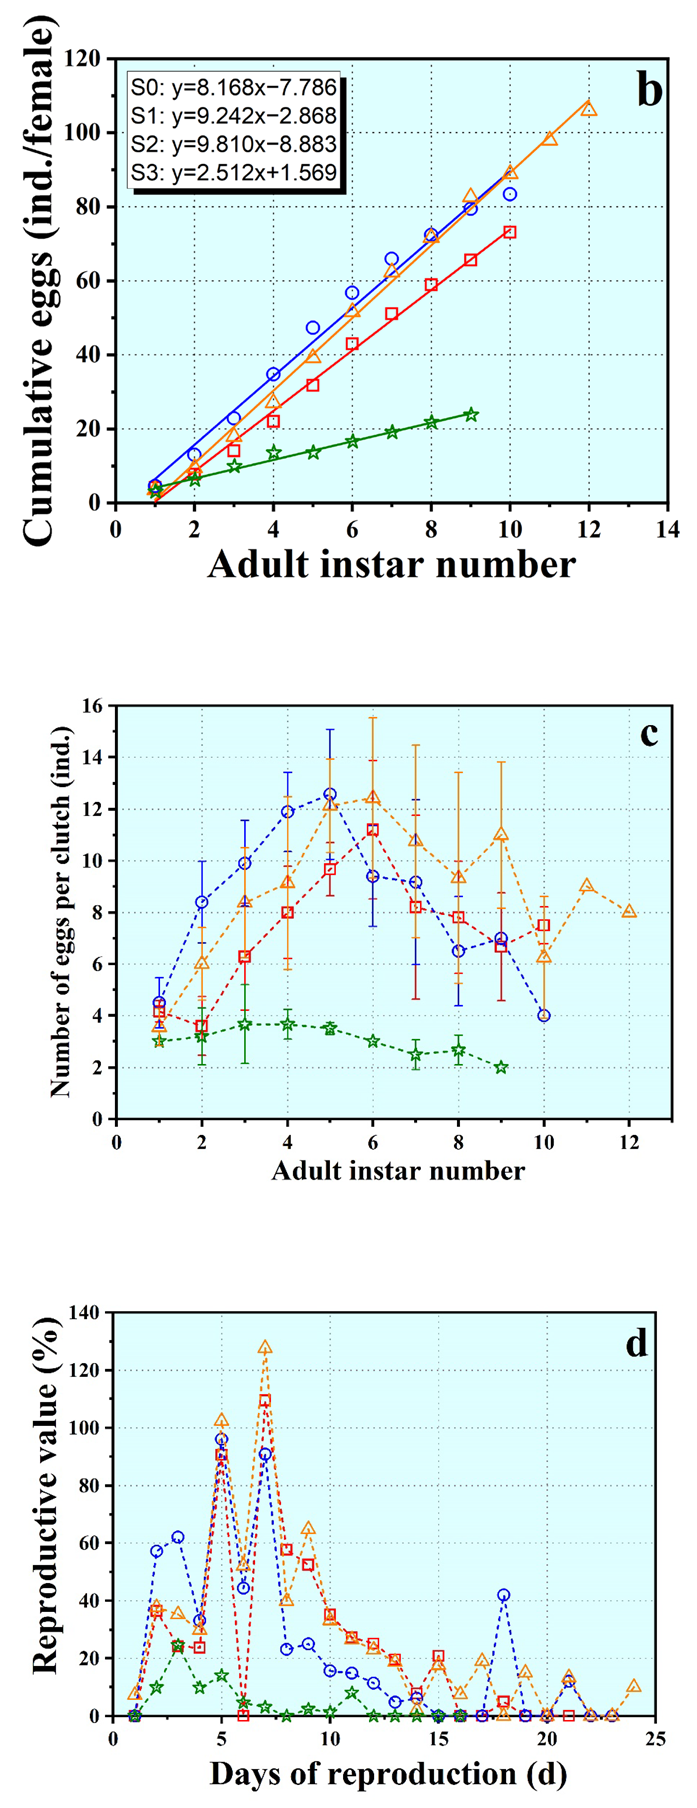
3.4.1. Embryonic Development Process of S. mucronata

The embryonic development of cladocerans was divided into eight, five or four stages for different cladoceran species (Green, 1956; Murugan, 1975; Gulbrandsen et al., 1990). In the present study, the salient morphological features characteristics of the distinctive embryonic stages of S. mucronata were divided into 15 stages (Table 3 and Figure 3).
The time from egg release from the ovaries to deposition in the brood chamber was very short (Supplementary Materials Video S1). In freshwater, at 25 °C, this time was about 20 s per egg releasing, and usually, all eggs were released within 2–4 min. The time of egglessness means the interval between after releasing the last juvenile from brood chamber to the environment and before discharging the first egg from ovaries to brood chamber. This time of egglessness is usually short, and is only 1–4% of the time of embryonic development [23]. In present study, this time was about 15.5 min, which was shorter than that for other species [24].
Stages in embryonic development of S. mucronata are briefly described here:
  • Stage 1–2: The egg changed from elongate columniform to oval, and the ovoplasm changed from even to translucent with a transparent peripheral zone. The central region of the egg had fat cells surrounded by cleaved peripheral granulated cells. At this stage, both the outer egg membrane as well as the inner naupliar membrane were seen (Figure 3a–c).
  • Stage 3–6: The egg divided from one cell to multiple cells. The vegetal and the animal pole appeared, and cell differentiation began (Figure 3d–g).
  • Stage 7–8: The blastula and gastrula formed in order (Figure 3h,i).
  • Stage 9–11: The antennae elongated and formed a “T”-type embryo. The head rudiment was formed. Then, distinct head and limb rudiments were formed, but the eyes were not apparent (Figure 3j–l).
  • Stage 12–13: The embryo had two very small pink eyes, but these rapidly increased in size and became two large black eyes. Then, a distinct single compound eye was formed, and the embryonic heart began to beat. Juveniles in the brood chamber turned around usually (Figure 3m,n).
  • Stage 14–15: The egg membrane was cast off, and characteristics of adult morphology such as the straight ventral margin of the shell ending posteriorly in a spine, the quadrate shape, the fine short setae on the ventral margin of the shell and the reddish color developed. Then juveniles were released from the brood chamber and moved freely (Figure 3o-3q).
Parthenogenetic and ephippium females of S. mucronata (Figure 3r,s).
Ephippium of S. mucronata (Figure 3t).

3.4.2. Embryonic Development at Different Salinities

The speed of embryonic development was significantly faster for females reared at 2 compared with those reared at other treatments (p < 0.05), and the cumulative duration of each phase for individuals reared at 3 was longer than those reared at other treatments (p < 0.05). The cumulative duration of each phase corresponded to a mean of 25.4, 24.8, 23.2 and 28.0 h per female for individuals reared at control, 1, 2 and 3, respectively (Table 3).

4. Discussion

Most studies on the effect of salinity on cladocerans provide important physiological information and insight into ecological differences. The present study indicated that S. mucronata was a freshwater zooplankton that has higher tolerance to low salinity, but it varied across different geographical populations such as Daphnia magna Straus [25]. He et al. (1989) found that S. mucronata lived in a small wetland with a salinity of 1.73 in a salty lake in the southern Shanxi province [26]. According to Alonso et al. (1990), S. mucronata appeared and formed populations in a salty lake in Spain which had a salinity of 40 [27]. It was suggested that S. mucronata belonged to halophiles species, whose salinity amplitude of appearance was from 10 to 60 according to Williams (1983) [28]. However, Pennak (1989) pointed out that this species was broadly distributed in the U.S.A., but they could only settle down in freshwater [29]. These differences were brought about by the habitat in which they lived and by geographical isolation and were imposed by their genetic makeup.
Reproduction is a major physiological activity in any living organism, and it is influenced by the prevailing environmental conditions [30]. In this study, salinity was the only variable factor in the experiment, and it obviously had a direct impact on the growth and neonate production. Females reared at lower salinity (1~2) had longer lifespans; higher rm, R0 values and neonate production; and a faster growth rate. These observations were in close agreement with a previous study [15]. Age at first reproduction and the size of the first clutch were two determining factors affecting the rm value [31,32,33,34].
The individuals of S. mucronata reared at all treatments had a uniform number of pre-adult instars, but they had different number of eggs of the first clutch. S. mucronata reared at salinity 1 and 2 reproduced 12.57 ± 0.74 and 12.43 ± 0.27 eggs in their first clutch, which was more than that of other treatments. The population at 1 and 2 had a higher rm value. The rate of egg production (a value) is a reflection of many synthetical factors, which strongly relates with adult instar numbers and number of eggs per clutch [35]. Because of higher number of eggs per clutch, individuals reared at 1 and 2 had higher rates of egg production. From results of the present study, 1~2 could be considered the optimum salinity amplitude for the population of S. mucronata.
There have been few studies about the effect of salinity on the embryonic development of cladocerans. In the present study, there were variations in the duration of the embryonic period at different treatments. The rate of development was relatively faster for individuals reared at 1 and 2 than for those reared at other salinities, which proved that this species was suitable for life in low-salinity water.
It is known that a slight increase of salinity in freshwater can stimulate the metabolism, growth and reproduction of freshwater animals. Daphnia magna reared at 2~3 had the highest feeding rate and rates of food assimilation, while the rate of oxygen consumption was lowest for individuals reared at 2 [36]. These results indicated that the physiological activity of D. magna was stimulated by the environment conditions of 2–3. In addition, in a study on the effect of salinity on standard metabolism and energy budget of carp, it was found that the feeding rate, rates of growth and rates of energy transformation for individuals reared at salinity between 3 and 7 were all higher than those reared in freshwater, while standard metabolism and rate of oxygen consumption were lowest at 3 [37]. In the present study, the rate of growth and embryonic development were faster for S. mucronata reared at 1-2 than for those reared at other salinities. These findings were in keeping with the results mentioned above. According to previous studies, salinity does have a significant effect on the polyunsaturated fatty acids (PUFAs) of copepods and other zooplankton, and PUFA, as an important indicator of physiological metabolism in crustaceans, is often associated with their reproductive indicators [38,39]. Unfortunately, we did not use PUFA as an indicator in this study, so we could not directly obtain data to prove its response to salinity and its regulation related to reproduction.
Such a simulative effect could be explained from two aspects of bioenergetics: First, a slight increase of salinity in freshwater can accelerate the capacity of assimilation and absorption of freshwater animals, which enhances the efficiency of energy assimilation. Second, majority of freshwater animals must maintain the stability of concentrations of ions inside their cells by active uptake of ions, and this osmotic regulation function must consume energy. The slight increasing salinity in freshwater reduces the ion gradient inside and outside of cells; thereby, freshwater animals decrease energy consumption due to osmoregulation and increase energy consumption for growth and production.
Females with resting eggs were not observed during the present study. The production of resting eggs was probably a genetically acquired trait to overcome the extreme temperature changes experienced during a glacial period [40]. However, no study has so far yielded any evidence to show that salinity extremes induce resting egg formation in invertebrates.
From the present study, we know that populations of S. mucronata have higher rm and tolerance to low salinity, and their adult body length is less than 1 mm. In other words, it can potentially be used as a live aquaculture feed.

5. Conclusions

The acute effect of salinity on S. mucronata indicated that 4 and 4.5 was its limit superior of reproduction and survival. The survival and growth rate of individuals reared at 1 and 2 were higher than that of those reared at other salinity gradients. The mean size of adult females decreased from 820 to 743 μm when the salinity increased from 1 to 4. For individuals reared at 1 and 2, the rm of the population was 1.021 and 0.903; the rate of egg production was 1.281 and 1.390; the cumulative egg production was 83.2 and 106.0 and the mean life span was 16.05 and 17.30, respectively. These values of life history parameters were higher than those of individuals reared at 3. No eggs were produced by females reared at 4 during the whole experiment. Furthermore, specimens reared at 1 and 2 displayed faster embryonic development. The above results showed that S. mucronata prefer an environment with lower salinity (1–2). Resting egg formation and sexual reproduction did not occur at all the tested salinity gradients. In conclusion, the salinity acclimation of S. mucronata has a certain prospect. It can be used as an open feed for low-salt and brackish water species and has a certain application prospect in the aquaculture industry.

Supplementary Materials

The following supporting information can be downloaded at: https://www.mdpi.com/article/10.3390/w14223706/s1, Video S1: Eggs released from ovaries to the brood chamber.

Author Contributions

Conceptualization, W.Z.; methodology, Y.H.; software, L.W.; validation, J.W., S.W. and Y.W.; formal analysis, L.W. and Y.H.; investigation, X.Y. and Y.H.; resources, W.Z.; data curation, L.W.; writing—original draft preparation, L.W.; writing—review and editing, W.Z.; visualization, L.W.; supervision, W.Z.; project administration, W.Z.; funding acquisition, W.Z. All authors have read and agreed to the published version of the manuscript.

Funding

This study was supported by the Special Program for Key Basic Research of the Ministry of Science and Technology, China (No. 2014FY210700).

Data Availability Statement

Data are available on request to the authors.

Acknowledgments

We are grateful for the graphic processing software of Origin 2022 (OriginLab Corporation ©, Northampton, MA, USA) used for statistical analysis.

Conflicts of Interest

The authors declare no conflict of interest.

References

  1. Dodson, S.I.; Frey, D.G. Cladocera and other Branchiopoda. In Ecology and Classification of North American Freshwater Invertebrates; Thorp, J.H., Covich, A.P., Eds.; Academic Press: San Diego, CA, USA, 1991; pp. 723–786. [Google Scholar]
  2. Lemly, A.D.; Dimmick, J.F. Growth of young-of-the-year and yearling centrarchids in relation to zooplankton in the littoral zone of lakes. Copeia 1982, 2, 305–321. [Google Scholar] [CrossRef]
  3. Mengestou, S.; Fernando, C.H. Biomass and production of the major dominant crustacean zooplankton in a tropical Rift Valley lake, Awasa, Ethiopia. J. Plankton Res. 1991, 13, 831–851. [Google Scholar] [CrossRef]
  4. Mavuti, K.M. Durations of development and production estimates by two crustacean zooplankton species Thermocyclops oblongatus Sars (Copepoda) and Diaphanosoma excisum Sars (Cladocera), in Lake Naivasha, Kenya. Hydrobiologia 1994, 272, 185–200. [Google Scholar] [CrossRef]
  5. Aladin, N.V. Salinity tolerance and morphology of the osmoregulation organs in Cladocera with special reference to Cladocera from the Aral sea. Hydrobiologia 1991, 225, 291–299. [Google Scholar] [CrossRef]
  6. Hart, B.T.; Bailey, P.; Edwards, R.; Hortle, K.; James, K.; McMahon, A.; Meredith, C.; Swadling, K. A Review of salt sensitivity of the Australian freshwater biota. Hydrobiologia 1991, 210, 105–144. [Google Scholar] [CrossRef]
  7. Williams, W.D. Salinity as a determinant of the structure of biological communities in salt lakes. Hydrobiologia 1998, 381, 191–201. [Google Scholar] [CrossRef]
  8. Latta, L.C.; Weider, L.J.; Colbourne, J.K.; Pfrender, M.E. The evolution of salinity tolerance in Daphnia: A functional genomics approach. Ecol. Lett. 2012, 15, 794–802. [Google Scholar] [CrossRef]
  9. He, Z.; An, S. Effects of salinity of seawater on the Moina rectirostris (Cladocera). J. Zool. 1986, 21, 25–27. (In Chinese) [Google Scholar]
  10. Shadrin, N.; Yakovenko, V.; Anufriieva, E. Gammarus aequicauda and Moina salina in the Crimean saline waters: New experimental and field data on their trophic relation. Aquac. Res. 2020, 51, 3091–3099. [Google Scholar] [CrossRef]
  11. Shadrin, N.V.; Yakovenko, V.A.; Anufriieva, E.V. Appearance of a New Species of Cladocera (Anomopoda, Chydoridae, Bosminidae) in the Hypersaline Moynaki Lake, Crimea. Biol. Bull. 2021, 48, 934–937. [Google Scholar] [CrossRef]
  12. Kikuchi, S. The fine structure of the gill epithelium of a fresh-water flea, Daphnia magna (Crustacea: Phyllopoda) and changes associated with acclimation to various salinities. Cell Tissue Res. 1983, 229, 253–268. [Google Scholar] [CrossRef]
  13. Baillieul, M.; Wachter, B.D.; Blust, R. Effect of Salinity on the Swimming Velocity of the Water Flea Daphnia magna. Physiol. Zool. 1998, 71, 703–707. [Google Scholar] [CrossRef]
  14. He, Z. The effects of temperature on neonate production and intrinsic increasing rate (rm) of Moina macrocopa Straus. J. Dalian Fish. Univ. 1983, 5, 13–19. (In Chinese) [Google Scholar]
  15. Achuthankutty, C.T.; Shrivastava, Y.; Mahambre, G.G.; Goswami, S.C.; Madhupratap, M. Parthenogenetic reproduction of Diaphanosoma celebensis (Crustacea: Cladocera): Influence of salinity on feeding, survival, growth and neonate production. Mar. Biol. 2000, 137, 19–22. [Google Scholar] [CrossRef]
  16. Meester, L.D.; Maas, S.; Dierckens, K.; Dumont, H.J. Habitat selection and patchiness in Scapholeberis: Horizontal distribution and migration of S. mucronata in a small pond. J. Plankton Res. 1993, 15, 1129–1139. [Google Scholar] [CrossRef]
  17. Lemke, A.M.; Benke, A.C. Growth and reproduction of three cladoceran species from a small wetland in the south-eastern U.S.A. Freshw. Biol. 2003, 48, 589–603. [Google Scholar] [CrossRef]
  18. Kawabata, K.; Urabe, J. Length–weight relationships of eight freshwater planktonic crustacean species in Japan. Freshw. Biol. 2002, 39, 199–205. [Google Scholar] [CrossRef]
  19. Nebeker, A.V.; Schuytema, G.S. Chronic Effects of the Herbicide Diuron on Freshwater Cladocerans, Amphipods, Midges, Minnows, Worms, and Snails. Arch. Environ. Contam. Toxicol. 1998, 35, 441–446. [Google Scholar] [CrossRef]
  20. Gotelli, N.J. A Primer of Ecology; Sinauer Associates, Inc.: Sunderland, MA, USA, 1995. [Google Scholar]
  21. Murugan, N.; Sivaramakrishnan, K.G. Laboratory studies on the longevity, instar duration, growth, reproduction and embryonic development in Scapholeberis kingi Sars (1903) (Cladocera: Daphnidae). Hydrobiologia 1976, 50, 75–80. [Google Scholar] [CrossRef]
  22. Krebs, C.J. Ecology: The Experimental Analysis of Distribution and Abundance; Harper Collins: New York, NY, USA, 1994. [Google Scholar]
  23. Bottrell, H.H. Generation time, length of life, instar duration and frequency of moulting, and their relationship to temperature in eight species of cladocera from the River Thames, reading. Oecologia 1975, 19, 129–140. [Google Scholar] [CrossRef]
  24. Carmouze, J.P.; Durand, J.R.; Lěvêque, C.L. Lake Chad Ecology and Productivity of a Shallow Tropical Ecosystem; Kluwer Academic Publishers Group: Hague, The Netherlands; Boston, MA, USA; Lancaster, UK, 1983. [Google Scholar]
  25. He, Z.; Zhang, J.; Jiang, H. Effects of salinity of seawater on the survival and intrinsic rate of increase of two populations of Daphnia Magna. J. Dalian Fish. Univ. 1996, 11, 1–7. (In Chinese) [Google Scholar]
  26. He, Z.; Qin, J.; Wang, H. Studies on the saline and hypersaline zooplankton from JinNan and YinChuan regions. Acta Hydrobiol. Sin. 1989, 13, 24–38. (In Chinese) [Google Scholar]
  27. Alonso, M. Anostraca, Cladocera and Copepoda of Spanish saline lakes. Hydrobiologia 1990, 197, 221–231. [Google Scholar] [CrossRef]
  28. Williams, W.D. Life in Inland Waters; Blackwell Scientific Publications: Melbourne, Australia, 1983. [Google Scholar]
  29. Pennak, R.W. Freshwater Invertebrates of the United States, 3rd ed.; John Wiley & Sons: New York, NY, USA, 1989. [Google Scholar]
  30. Vernberg, W.B.; Vernberg, F.J. Environmental Physiological of Marine Animals; Springer: Berlin, Germany, 1972. [Google Scholar]
  31. Cole, L.C. The population consequences of life-history phenomena. Q. Rev. Biol. 1954, 29, 103–137. [Google Scholar] [CrossRef] [PubMed]
  32. Meats, A. The relative importance to population increase of fluctuations in mortality, fecundity and the time variables of the reproductive schedule. Oecologia 1971, 6, 223–237. [Google Scholar] [CrossRef]
  33. Snell, T.W. Fecundity, developmental time, and population growth rate. Oecologia 1978, 32, 119–125. [Google Scholar] [CrossRef]
  34. Lynch, M. The evolution of cladoceran life histories. Q. Rev. Biol. 1980, 55, 23–42. [Google Scholar] [CrossRef]
  35. Huang, X. Effect of temperature on the development, growth and egg production in Moina affinis (Cladocera, Moinidae). Acta Hydrobiol. Sin. 1983, 8, 105–112. (In Chinese) [Google Scholar]
  36. Yang, H.Y. The effect of salinity of salinity on assimilation, metabolism, growth and carbon budget of Daphnia magna. J. Fish. Sci. China 1997, 4, 33–38. (In Chinese) [Google Scholar]
  37. Qiu, Y.D. Effect of salinity on the energy budget of carp. J. Fish. China 1995, 19, 35–42. (In Chinese) [Google Scholar]
  38. Masclaux, H.; Bec, A.; Kainz, M.J.; Desvilettes, C.; Jouve, L.; Bourdier, G. Combined effects of food quality and temperature on somatic growth and reproduction of two freshwater cladocerans. Limnol. Oceanogr. 2009, 54, 1323–1332. [Google Scholar] [CrossRef]
  39. Yuslan, A.; Najuwa, S.; Hagiwara, A.; Ghaffar, M.A.; Suhaimi, H.; Rasdi, N.W. Production Performance of Moina macrocopa (Straus 1820) (Crustacea, Cladocera) Cultured in Different Salinities: The Effect on Growth, Survival, Reproduction, and Fatty Acid Composition of the Neonates. Diversity 2021, 13, 105. [Google Scholar] [CrossRef]
  40. Madhupratap, M.; Nehring, S.; Lenz, J. Resting eggs of zooplankton (Copepoda and Cladocera) from the Kiel Bay and adjacent waters (southwestern Baltic). Mar. Biol. 1996, 125, 77–87. [Google Scholar] [CrossRef]
Figure 1. LC50s (a) between salinity and time and survivorship (b) of S. mucronata cultured at different salinity gradients. Values of LC50 are represented as mean (±SE). S0, S1, S2 and S3 represent control, 1, 2 and 3, respectively.
Water 14 03706 g001
Figure 2. Body length (a), cumulative egg production (b), number of eggs per clutch (c) and reproductive value (d) of S. mucronata reared at different salinity gradients. Body length and number of eggs per clutch curves represent mean (±SE) values. S0, S1, S2, S3 and S4 represent control, 1, 2, 3 and 4, respectively.
Water 14 03706 g002aWater 14 03706 g002b
Figure 3. The process of embryonic development of S. mucronata. (a,b) One-cell stage; (c) membrane lift; (d) 2-cell stage; (e) 4-cell stage; (f) 8-cell stage; (g) multicell stage; (h) blastula stage; (i) gastrula stage; (j) formation of “T”-type embryo; (k) formation of antenna rudiment; (l) formation of pereiopod rudiment; (m) formation of 2 compound eyes; (n) single compound eye stage; (o,p) membrane rive; (q) expulsion from matrix; (r) parthenogenetic female; (s) ephippial female; (t) ephippium.
Water 14 03706 g003
Table 1. The effect of salinity on the population increasing parameters in S. mucronate. Parameters include the mean (±SE) age at first reproduction (AR), lifetime number of clutches and eggs produced per female, number of eggs per clutch, lifespan, mean intervals between clutches and a value.
SalinityARNo. of ClutchesNo. of NeonatesNo. of NeonatesMean LifespanMean Intervala Value
Treatments(Days)Per FemalePer FemalePer Clutch(Days)Between Clutches (Days)
control4.28 a (0.76)7.14 a (2.16)52.00 a (22.46)8.37 a (1.77)14.30 a (8.19)1.75 a (0.18)1.3238
14.00 a (0.00)6.20 b (1.69)54.90 a (16.23)8.84 a (0.85)16.05 a (4.31)1.66 a (0.37)1.2809
24.00 a (0.00)7.67 a (1.94)67.33 a (17.78)8.79 a (0.90)17.30 a (6.72)1.76 a (0.35)1.3902
35.25 b (1.04)2.75 c (2.75)9.38 b (4.17)3.38 b (0.83)14.20 a (6.01)4.48 b (2.23)0.9209
4----14.55 a (5.31)--
a, b, c Mean values designated by different letters are significantly different.
Table 2. The effect of salinity on intrinsic rate of increase, generation time, net reproductive rate and finite rate of increase in S. mucronata.
Salinity TreatmentsrmG (d)R0λ
control0.7774.5634.602.175
11.0213.9455.802.776
20.9034.5560.602.467
30.4813.956.701.617
4----
Table 3. The effect of salinity on intrinsic rate of increase, generation time, net reproductive rate and finite rate of increase in S. mucronata.
Development PhaseDuration of Each Phase Figures
Control123
One-cell stage2~4 min2~4 min2~4 min2~4 min1
0.5~1 min0.5~1 min0.5~1 min0.5~1 min2
Membrane lift2.1 ± 0.4 h2.1 ± 0.6 h1.9 ± 0.7 h2.4 ± 0.8 h3
Two-cell stage1.8 ± 0.4 h1.9 ± 0.4 h1.6 ± 0.5 h1.9 ± 0.4 h4
Four-cell stage2.4 ± 0.5 h2.3 ± 0.5 h2.3 ± 0.8 h2.8 ± 0.7 h5
Eight-cell stage1.6 ± 0.8 h1.5 ± 0.6 h1.5 ± 0.5 h1.8 ± 0.6 h6
Many-cell stage2.5 ± 1.0 h2.4 ± 0.9 h2.2 ± 1.0 h2.8 ± 1.0 h7
Blastula stage2.0 ± 0.6 h1.9 ± 0.5 h1.8 ± 0.8 h2.2 ± 0.3 h8
Gastrula stage1.7 ± 0.5 h1.6 ± 0.3 h1.5 ± 0.4 h1.6 ± 0.4 h9
Formation of “T”-type embryo1.8 ± 1.1 h1.7 ± 1.0 h1.5 ± 0.9 h2.0 ± 0.8 h10
Formation of antenna rudiment2.0 ± 0.8 h2.0 ± 0.8 h2.0 ± 0.6 h2.5 ± 0.8 h11
Formation of pereiopod rudiment1.7 ± 0.3 h1.8 ± 0.4 h1.6 ± 0.5 h1.8 ± 0.5 h12
Formation of 2 compound eyes3.6 ± 1.1 h3.4 ± 1.3 h3.4 ± 1.2 h4.0 ± 0.5 h13
Single compound eye stage1.4 ± 0.3 h1.4 ± 0.4 h1.3 ± 0.4 h1.3 ± 0.5 h14
Membrane rive0.8 ± 0.4 h0.8 ± 0.3 h0.6 ± 0.5 h0.9 ± 0.8 h15~16
Expulsion from matrix2~4 min2~4 min2~4 min2~4 min16
Cumulative duration of each phase25.4 h a24.8 h a23.2 h b28.0 h c-
a, b, c Mean values designated by different letters are significantly different.
Publisher’s Note: MDPI stays neutral with regard to jurisdictional claims in published maps and institutional affiliations.

