
Remote Sensing Retrieval of Total Nitrogen in the Pearl River Delta Based on Landsat8
by
 , , and
Yu Guo
1,
Ruru Deng
1,2,3,*,
Jiayi Li
1,
Zhenqun Hua
1,
Jing Wang
1,
Ruihao Zhang
4,
Yeheng Liang
1 and
Yuming Tang
1 1
School of Geography and Planning, Sun Yat-sen University, Guangzhou 510006, China
2
Guangdong Engineering Research Center of Water Environment Remote Sensing Monitoring, Guangzhou 510006, China
3
Guangdong Province Key Laboratory of Urbanization and Geo-simulation, School of Geography and Planning, Guangzhou 510006, China
4
School of Geography and Tourism, Huizhou University, Huizhou 516007, China
*
Author to whom correspondence should be addressed.
Water 2022, 14(22), 3710; https://doi.org/10.3390/w14223710
Submission received: 18 September 2022
/
Revised: 11 November 2022
/
Accepted: 15 November 2022
/
Published: 16 November 2022
(This article belongs to the Special Issue Water Quality Modeling and Monitoring)
Abstract
:The Pearl River Delta in South China is subject to severe eutrophication, which is significantly exacerbated by the total nitrogen (TN). Remote sensing technology with large-scale synchronous observations in the Pearl River Delta can effectively monitor organic pollution. Statistical methods based on remote sensing images have been widely used in water quality parameter retrieval for inland rivers, reservoirs, and lakes, but have seldom been applied in the Pearl River Delta. TN is also a non-optically active substance, so it is difficult to retrieve TN through analysis methods. This study retrieves the concentration of total nitrogen (TN) based on Landsat8 images of the Pearl River Delta using a statistical method. The stepwise regression function is built by analyzing the TN concentration and the single-band, two-band, and three-band spectral information groups measured by an ASD FieldSpec3 spectrometer. The retrieval results show that the proposed method performs well with a small mean absolute error (MAE) (0.36 mg/L for TN) and high agreement (R2 = 0.61 for TN) between the in situ data and the retrieval concentration. The results demonstrate that the concentration of TN in the east of the Pearl River Delta was higher than in the west. Dachan Bay and Shenzhen Bay had the highest TN concentrations, which were around 3.02 mg/L and 3.67 mg/L. The 750–850 nm band could be an important reference for further exploring the spectral characteristics and retrieval of TN. The retrieval method in this study is easy to implement and convenient for local TN distribution capture, which can provide a timely reference for daily water quality supervision and management in the Pearl River Delta.
1. Introduction
Water quality deterioration has constantly escalated worldwide, especially in river–coastal eutrophication. Fast economic development in coastal areas, estuary reclamation, ship business, and chemical-fertilizer overuse intensify river eutrophication [1]. Eutrophication induces algal blooms, imbalances in the ecological environment, and organic matter pollution aggravation, which lead to water resource scarcity and poor water surroundings [2,3,4]. Previous studies [5,6,7] have shown that total nitrogen (TN) and ammonia–nitrogen are the main organic pollutants involved in aquatic eutrophication. Their conversion and transformation affect the water cycles of the hydrosphere, biosphere, atmosphere, and lithosphere [8]. The traditional method of monitoring TN relies on manual water sampling. However, this method is risky and often involves collecting samples in estuaries and offshore zones, which is time-consuming and cost-ineffective. Remote sensing technology, as a faster, more effective, and more spatially extensive method than traditional manual water sampling methods, has been widely adopted for water quality retrieval in estuaries and offshore zones in recent years [9].
An empirical method is commonly used in the retrieval of TN from remote sensing images. A number of studies have indicated that the spectral information of pixels is strongly correlated with the TN concentration, so the TN concentration can be retrieved from remote sensing images. In general, empirical retrieval methods can be divided into indirect and direct methods. The indirect empirical method calculates TN concentration based on the relationship between it and chlorophyll, suspended sediment (SS), colored organic dissolved matter (CODM), and water temperature [10,11,12]. However, the indirect method is affected by the retrieval accuracy of chlorophyll, SS, CODM, and water temperature. Additionally, this method has only been proven for inland water and may not be applicable in delta areas where water quality variability is complex. The direct empirical method retrieves the TN concentration from the spectral information of pixels based on machine learning, regression functions, and statistical methods. This method is less influenced by regions than the indirect method. For example, the back-propagation neural network algorithm was successfully applied to retrieve the TN and ammonia–nitrogen in the Miyun reservoir in 2013–2018 based on a combination of measured data and Landsat8 remote sensing images [13]. The TN and total phosphorus in the Han River were analyzed and predicted by a series of machine learning models, which explored the potential risk and provided targeted suggestions [14]. The concentration of TN in Jiu Zhaigou Lake was retrieved through a stepwise regression method that was proven to be accurate [15]. A statistical model was also used to predict these two water quality parameters, whose prediction accuracy was over 0.7 [16]. The water quality of lakes, urban rivers, and small-scale watersheds is generally retrieved by the combination of regression functions and statistical methods. It is worth noting that machine learning models have different levels of responsiveness to parameters [17] and parameter selection, and that the setting can cause large errors in the results. Thus, regression functions and statistical methods are most often employed in water quality retrieval and evaluation.
The most common method for the retrieval of water quality parameters in eutrophic water is to construct a linear regression function with characteristic bands of band groups as model parameters [18]. The authors of [19] retrieved the ammonia–nitrogen in Tangxun Lake via a linear quadratic regression function, and the accuracy was about 0.8. The authors of [6] used a single band or the band ratio as the parameters in a linear quadratic regression function to retrieve the TN in an urban river network, and the accuracy was over 0.7. Other researchers have also applied logarithmic and exponential functions as regression functions to retrieve TN and ammonia–nitrogen in urban rivers and to detect the sensitivity of parameters in water quality retrieval [20,21]. These studies concentrated on a single parameter in the regression function and did not combine two or more features. In addition, the regression function and statistical method were also used in the water quality evaluation by building a water quality index or a comprehensive retrieval model [22,23]. Regression functions and statistical methods are currently the main retrieval methods, which are applicable and accurate. However, most previous studies have been concerned with inland waterways, lakes, and reservoirs, where the water quality varies only slightly. Delta areas are affected by both upstream runoff and coastal tides, and the diffusion and distribution of TN are more complicated. Therefore, the application of these two methods in the retrieval of TN concentrations in delta regions requires further research.
The Pearl River Delta (PRD) is a typical delta that contains an intensive river network and eight estuaries with long coastlines [24]. The upstream runoff and downstream tide create a synthetically hydrologic and hydrodynamic environment in the PRD [25]. The authors of [8] predicted that the TN discharge in the Pearl River basin would increase to 9.45 × 105 t by 2030, mainly due to planting. The authors of [18] set up 17 water sampling points in the upstream and middle parts of the Pearl River, and 3 points’ TN concentrations exceeded the standard by more than 90%. The authors of [20] analyzed the water quality of the South China Sea based on Google Earth Engine and identified an increase in eutrophication during 2006–2018. Nevertheless, there are few studies on the statistical remote sensing retrieval of TN in estuary areas of the PRD. The water quality of the PRD has improved in recent years, but it is still grade IV or less in most estuary areas according to the latest sea environment report [26] from the Ministry of Natural Resources of the People’s Republic of China.
This study aims to develop a handy and accurate statistical method for identifying the TN concentration and distribution in the PRD. This study carried out extensive field measurements at evenly distributed sampling sites in the PRD and took boat trips to the sea to obtain very rare actual concentration and spectral data using an ASD FieldSpec3 spectrometer. The measured TN concentration and synchronous spectral data were used to build the regression function. Then the spectral data measured by ASD were transformed to corresponding image band using spectral response function of Landsat8. Bands and band ratios were chosen as regression parameters to obtain the most suitable regression function in the PRD. Then, Landsat8 remote sensing images were fed into a statistical method to retrieve the TN over the full range of the PRD. Compared with chlorophyll, the statistical method used in this study can retrieve the TN level accurately in the PRD. The statistical method in this study combines sampling data with remote sensing data to acquire a reliable and robust retrieval model. This statistical method can also make contributions to management decisions involving similar projects in other deltas.
2. Materials and Methods
2.1. Study Area
The Pearl River Delta in Guangdong Province, China consists of the north, west, and east river deltas approaching the South China Sea through eight estuaries. The PRD has developed import and export trades and flourishing ports, including Guangzhou Port, the fourth biggest port in China. In addition, thriving industry has also contributed to its productivity. These factories and human activities exacerbate water pollution. The most recent report suggests that 2780 square kilometers of the South China sea is classified as harsh water, and this harsh water was mainly distributed in the estuary of the PRD up to the summer of 2011 [26]. The estuary was selected as the study area, as is shown in Figure 1.
The area of the PRD is about 54,700 square kilometers, and it has a 1479 km coastline. The organic pollution in the PRD comes from both point and non-point sources. Electronic and household appliance industries dominate the economy in the PRD, which discharge industrial organic pollution. For example, the nitrogen discharge from non-point source and intercepted overflow waters in Shenzhen Bay during the rainy season can reach 76.2 t [27]. Agriculture along the coast is intensive and flourishing and includes fishing and paddies with significant amounts of fertilizer, which result in agricultural non-point sources. The shipping industry and urban sewage are also non-point sources. There are so many harbors in the PRD with huge annual throughput that oil leakage and other emissions from ships are serious sources of pollution. A dense population also leads to a large amount of domestic sewage being directly disposed of in the delta.
2.2. Field Survey and Spectral Measurements
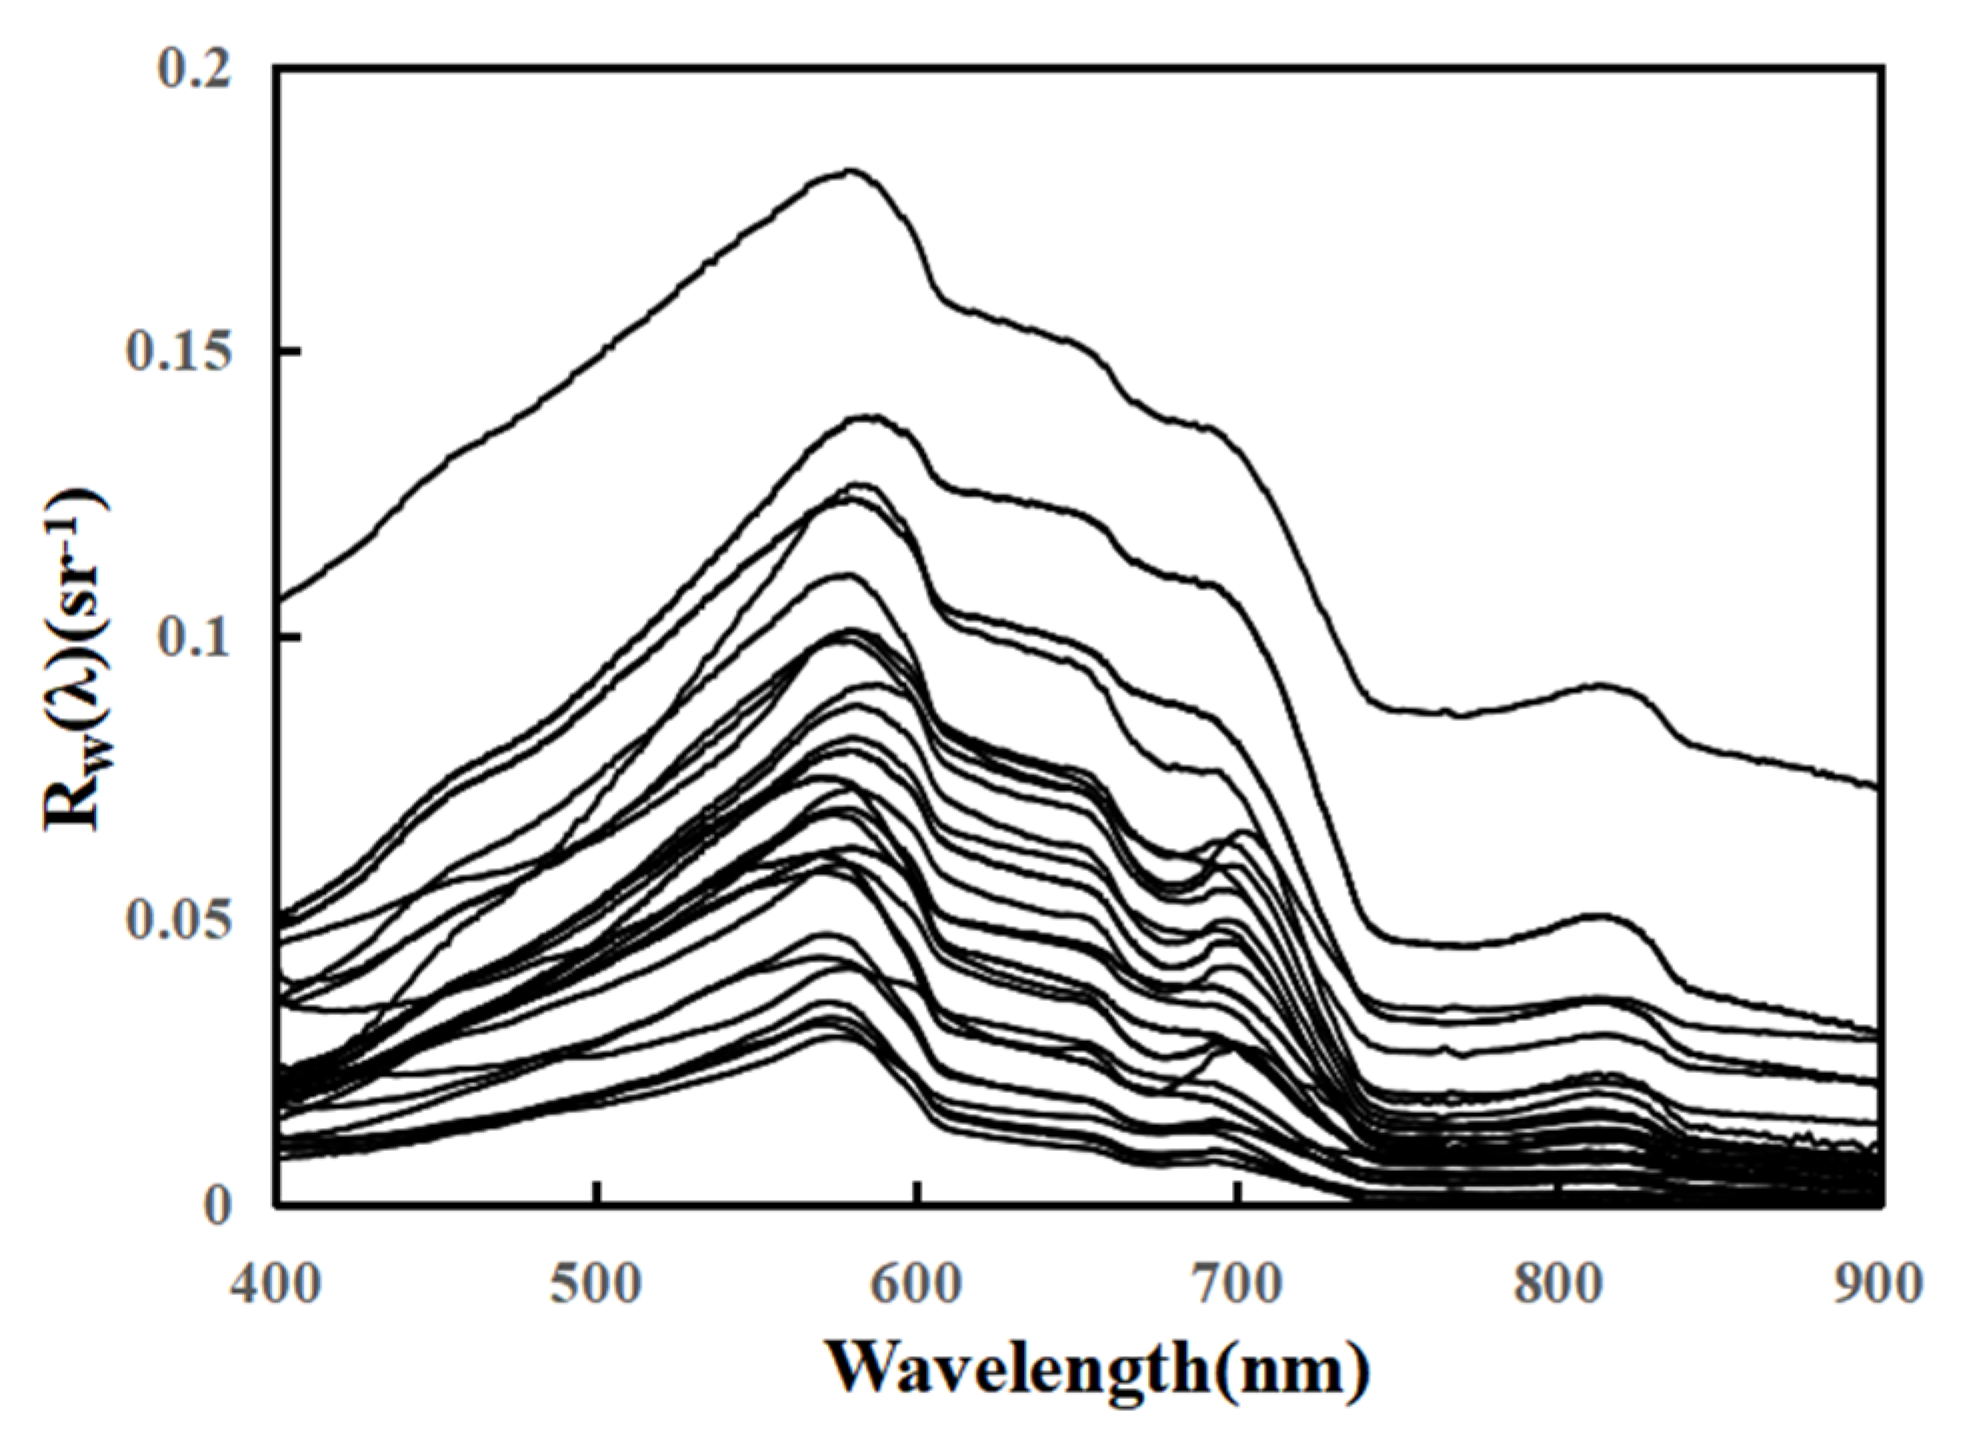
Water quality sampling was performed on 5, 12, and 27 November 2020, 25 September 2019, and 22 August 2019 in estuaries of the PRD. Sampling sites A1–A6 were sampled on 5 November 2020; B1–B10 were sampled on 12 November 2020; C1–C6 were sampled on 27 November 2020; D1–D6 were sampled on 25 September 2019; and E1–E4 were sampled on 22 August 2019. All samples were only taken from the water surface with one sample per site. Due to the limitation of the remote sensing image size, the study area only involves sites B1–B6 from Group B, as is shown in Figure 1. B7–B10 could not be shown in Figure 1. The TN, chlorophyll and suspended sediment concentration of the water samples at each site were collected and analyzed in the laboratory within 24 h by the China National Analytical Center, Guangzhou. Reflectance data were also measured synchronously with a spectrometer (ASD FieldSpec3 spectrometer manufactured by the U.S. Company ASD) during water sampling (Figure 2). An ASD FieldSpec3 spectrometer can detect the reflectance from 350 nm to 2500 nm with a 1 nm interval. The reflectance of water at all sampling sites is shown in Figure 2. The spectral information of sampling sites in five groups was detected by ASD. There was a difference between the different sampling sites, such as reflectance peaks and valleys. The spectra of all sampling sites had a consistent trend of change, and the reflectance peaks were around 580 nm, 710 nm, and 820 nm.
The water quality analysis results of all the sampling sites in the PRD are shown in Table 1. The concentration of TN in the upper and middle parts of the PRD was much higher than in the lower parts according to our results. The highest concentration of TN was 4.1 mg/L, which was found at site D6. The chlorophyll concentration of point A6 was 58 μg/L, which was the highest chlorophyll concentration in the study area.
2.3. Imagery Acquisition and Preprocessing
This study uses Landsat8 images, which are multispectral images taken by the United States Geological Survey (USGS) that can provide maximum coverage of the study area with a 30 m spatial resolution and a 16-day revisit interval. The Landsat8 satellite was launched in 2013, and its images contain a great deal of land and ocean information on a global scale. Landsat8 images have 9 bands of OLI and 2 bands of TIRS. This study constructs band ratio models mainly based on the first 5 bands of OLI, including a coastal band (0.43–0.45 µm), blue (0.45–0.52 µm), green (0.52–0.60 µm), red (0.63–0.68 µm), and NIR (0.85–0.89 µm). Due to the image revisit interval, the image used in this study was from 16 November 2020 and was acquired from the Earth-explore website of the USGS (accessed on 16 March 2022 from https://earthexplorer.usgs.gov). This was the closest available image to the date of the water sampling. The weather condition in the PRD was satisfactory with no precipitation during the three water sampling periods.
The remote sensing image was preprocessed to obtain the reflectance. Firstly, satellite-based observation values of Landsat8 images were converted to radiance. The Gain and Offset parameters from the satellite parameter lists were used to calculate the radiance. The conversion equation is as follows:
where L is converted radiance, DN is the satellite-based observation value, Gain is the calibration slope, and Offset is the offset of the absolute calibration.
Secondly, the influence of the atmosphere correction was carried out using the fast line-of-sight atmospheric analysis of hypercubes (FLAASH) algorithm [28]. The FLAASH algorithm is based on the MODTRAN5 radiative transfer model. This algorithm estimates the attributes of the atmosphere based on the characteristics of the pixels in the image rather than the simultaneous atmospheric parameters. It can effectively eliminate aerosol-scattering effects and smooth spectral noise. Finally, the normalized difference water index (NDWI) was used to extract the water area. The equation of the NDWI is as follows:
where L is reflectance and G and NIR represent the green and NIR bands of the image, respectively.
2.4. Characteristic Bands Groups and Statistical Retrieval Method
2.4.1. Characteristic Bands Groups
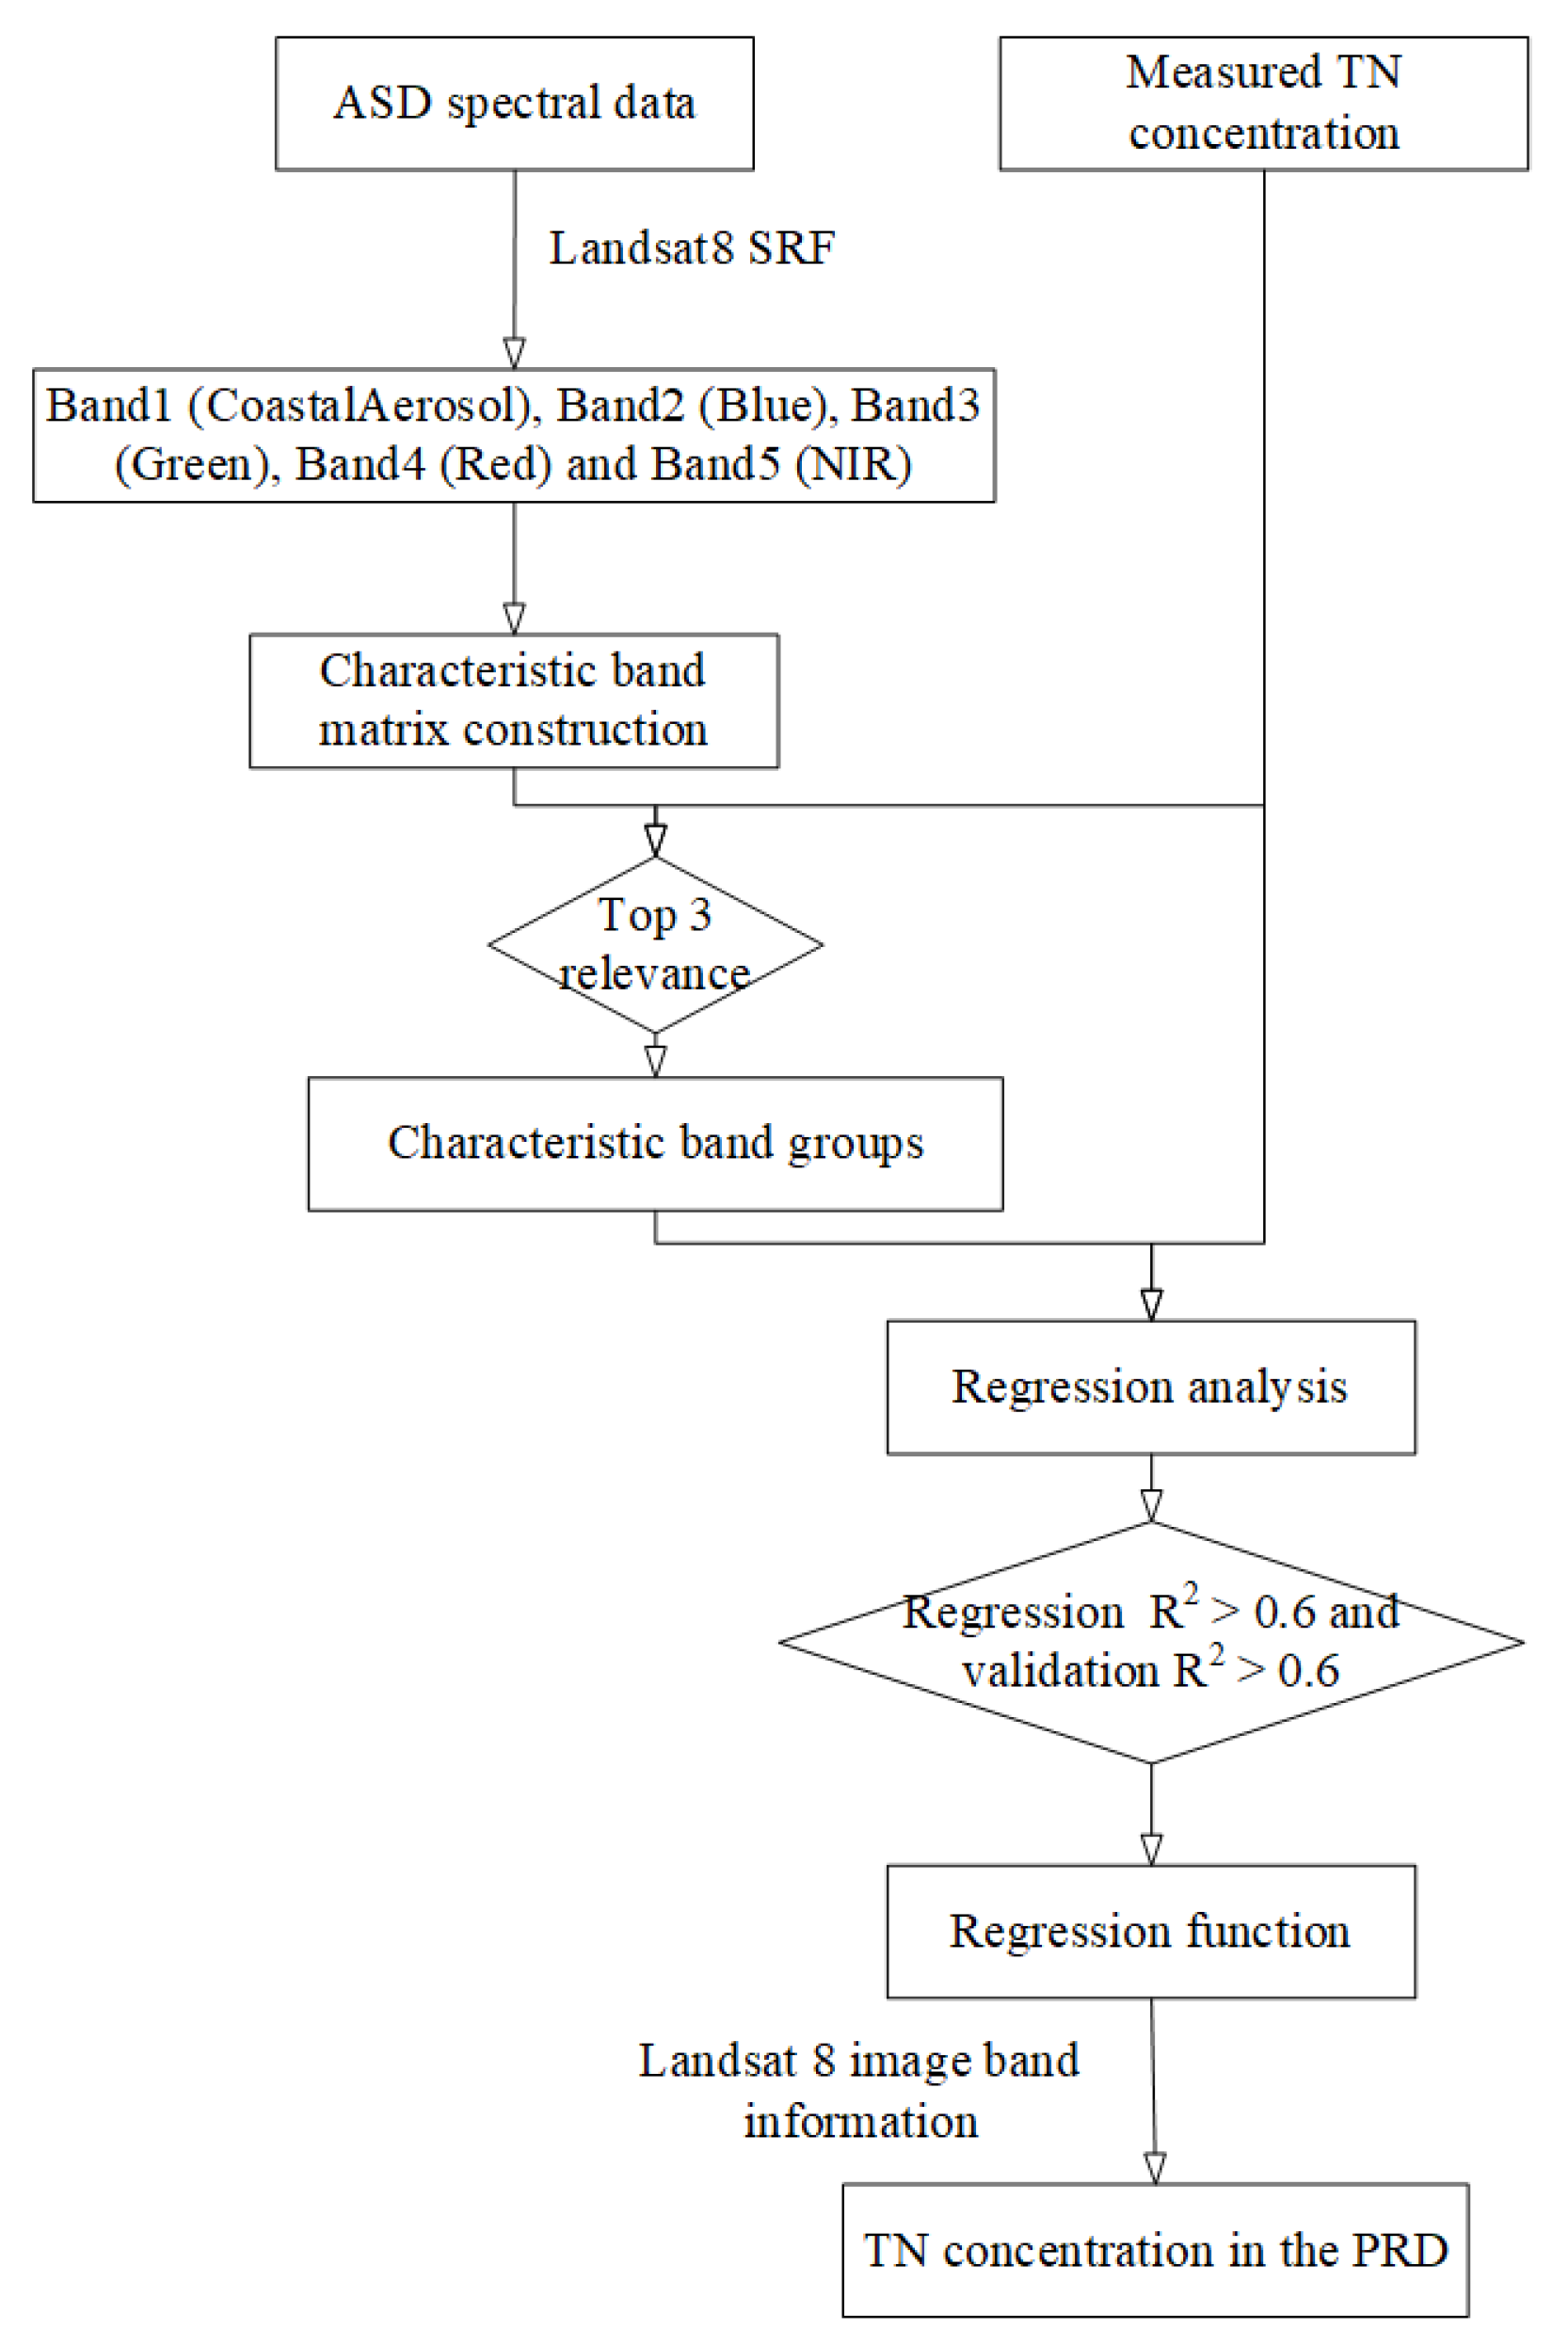
For the most accurate retrieval of TN concentrations, a statistical model should be established based on the relationship between the concentration data and simultaneous spectral data. We used the spectral data measured by ASD to build the regression function of TN concentration and band ratios. The data from ASD were synchronized with the TN concentration at the sampling sites. However, the remote sensing image was not simultaneous. So, we chose the ASD data and measured concentration to construct the statistical model. The spectral response function was applied to convert the ASD narrow-band data to remote sensing wide-band data. The generated band groups contain 85 groups with different combinations of Band1, Band2, Band3, Band4, and Band5 from the ASD spectral data. There is a need to find the characteristic band of the band groups to further establish an accurate statistical retrieval model. Single-band, two-band, and three-band ratios are commonly used in statistical retrieval, so these three kinds of band groups were chosen to detect the characteristic band groups. A characteristic matrix was constructed to collect the characteristic band or band groups. The characteristic matrixes are as follows:
where BRi is the matrix of a single band; BRij is the matrix of two band ratios; and BR(a+b)/j is the matrix of three band ratios. BRj and BRab are intermediate process matrixes.
This study uses the Pearson correlation coefficient to find the characteristic band groups from all 85 groups. The correlation coefficient between the measured concentration and band groups was calculated to decide the characteristic band groups.
2.4.2. Statistical Retrieval Method
According to many previous studies, there is always an empirical relationship between the TN concentration and band ratios. The TN has spectral characteristics in water, and its characteristic band ratios can help to retrieve the TN concentration more precisely. Some bands ratios have been proven to be correlated with the TN concentration and can be used for retrieval in inland water and lakes [6,19]. The measured TN concentrations of 16 random points in all sampling sites were selected to build this regression function, and the remaining points were used for model validation. The three linear primary equations forms are the main retrieval forms for retrieval. This study uses stepwise linear regression analysis to select the most suitable regression function:
where C is the concentration of TN; BRi is the characteristic band group; and a, b, c, and d are regression coefficients.
After the most suitable characteristic band group and regression function are identified, the band information from the Landsat8 image of every pixel is put into the regression function and used to calculate the TN concentration over the entire range. The process of the retrieval of the TN concentration using this statistical method is illustrated in Figure 3.
2.4.3. Error Analysis
The accuracy of the retrieval model can be evaluated by calculating the mean absolute error (MAE) and regression intercept (RI) using the following equations:
where N is the number of water samples, Ci is the retrieval concentration of the water component, Cm is the measured concentration of the water samples, n is the number of elements in the regression function, and Dn is the intercept of the n-th element.
MAE effectively avoids error cancellation. The smaller the MAE, the more accurate the model retrieval is. RI is a common measure of the accuracy of a linear regression. The smaller the RI, the more accurate the model retrieval.
3. Results
3.1. Statistical Retrieval Method Validation
The band combinations with the highest correlations are shown in Figure 4a–c. These band ratios are from ASD spectral data. Most two-band and three-band ratios did not have strong relationships with the measured concentration, so only the top three related band ratios and their R2 values are shown in Figure 4b,c. The correlation between the characteristic bands and the measured TN concentration was detected to choose characteristic band groups and to build regression functions. These band ratios with high correlations were used as alternative variables in the multiple regression.
Some typical regression groups of TN and their correlation coefficients are shown in Table 2. The 16 sites were randomly selected to construct the regression function and calculate the correlation coefficient every time until each site was involved in the screening. In general, the TN concentration was well correlated with most typical band groups. The correlation coefficient between TN concentration and a single band was 0.25 in linear regression equations. For multiple linear regression equations, the correlation coefficient of the retrieved TN concentration from the multi-band group regression function was the highest (up to 0.75). Meanwhile, if only a single band or one band ratio was used as a regression element, the correlation coefficient would decline to below 0.5. The table only shows the band ratios with a high correlation, and other linear regressions that did not show a significant regression relationship are not shown in the table. From Table 2, we can see that the multiple linear regression model can retrieve TN concentrations more accurately than other linear regression methods. Thus, regression functions (5) for TN concentration retrieval were chosen as regression functions. Other regression functions will not be used in TN concentration retrieval.
The residual sampling points were used to validate the statistical model. Figure 4d plots the statistical method retrieval results and measured concentration of TN. The bi-variate linear regression function (5) had better applicability for the measured data and the retrieval statistical model for TN concentration in this study. The statistical model retrieval for TN concentration had an R2 value of 0.61. Additionally, the MAE for TN concentration retrieval was 0.36 mg/L. The RI for TN concentration retrieval was 2.55. According to Figure 2, the measured spectral curves had two reflection peaks in Band3 and Band5 and steep slopes in Band2 and Band4. They also had a reflection valley in Band5. Nitrogen provides nutrients for the photosynthesis of aquatic plants, so chlorophyll tends to be higher in nitrogen-polluted water. Such polluted water is dark green in color with a pungent odor because it reflects green and blue light to a great extent. Meanwhile, red light is absorbed in large quantities. The main features of the reflectance curves are concentrated on four bands, and these band ratios could make features more significant to give accurate relationships between spectral information and TN concentration.
In general, the statistical model showed good performance when predicting TN concentrations. It was usually necessary to screen the characteristic bands of substances before empirical retrieval. However, only five bands can be used to retrieve the concentration of TN. Thus, this study exhausted the band combinations of single bands, two bands, and three bands for the regression analysis. There might be bias if certain bands were not suitable for TN concentration retrieval.
3.2. Remote Sensing Retrieval Results
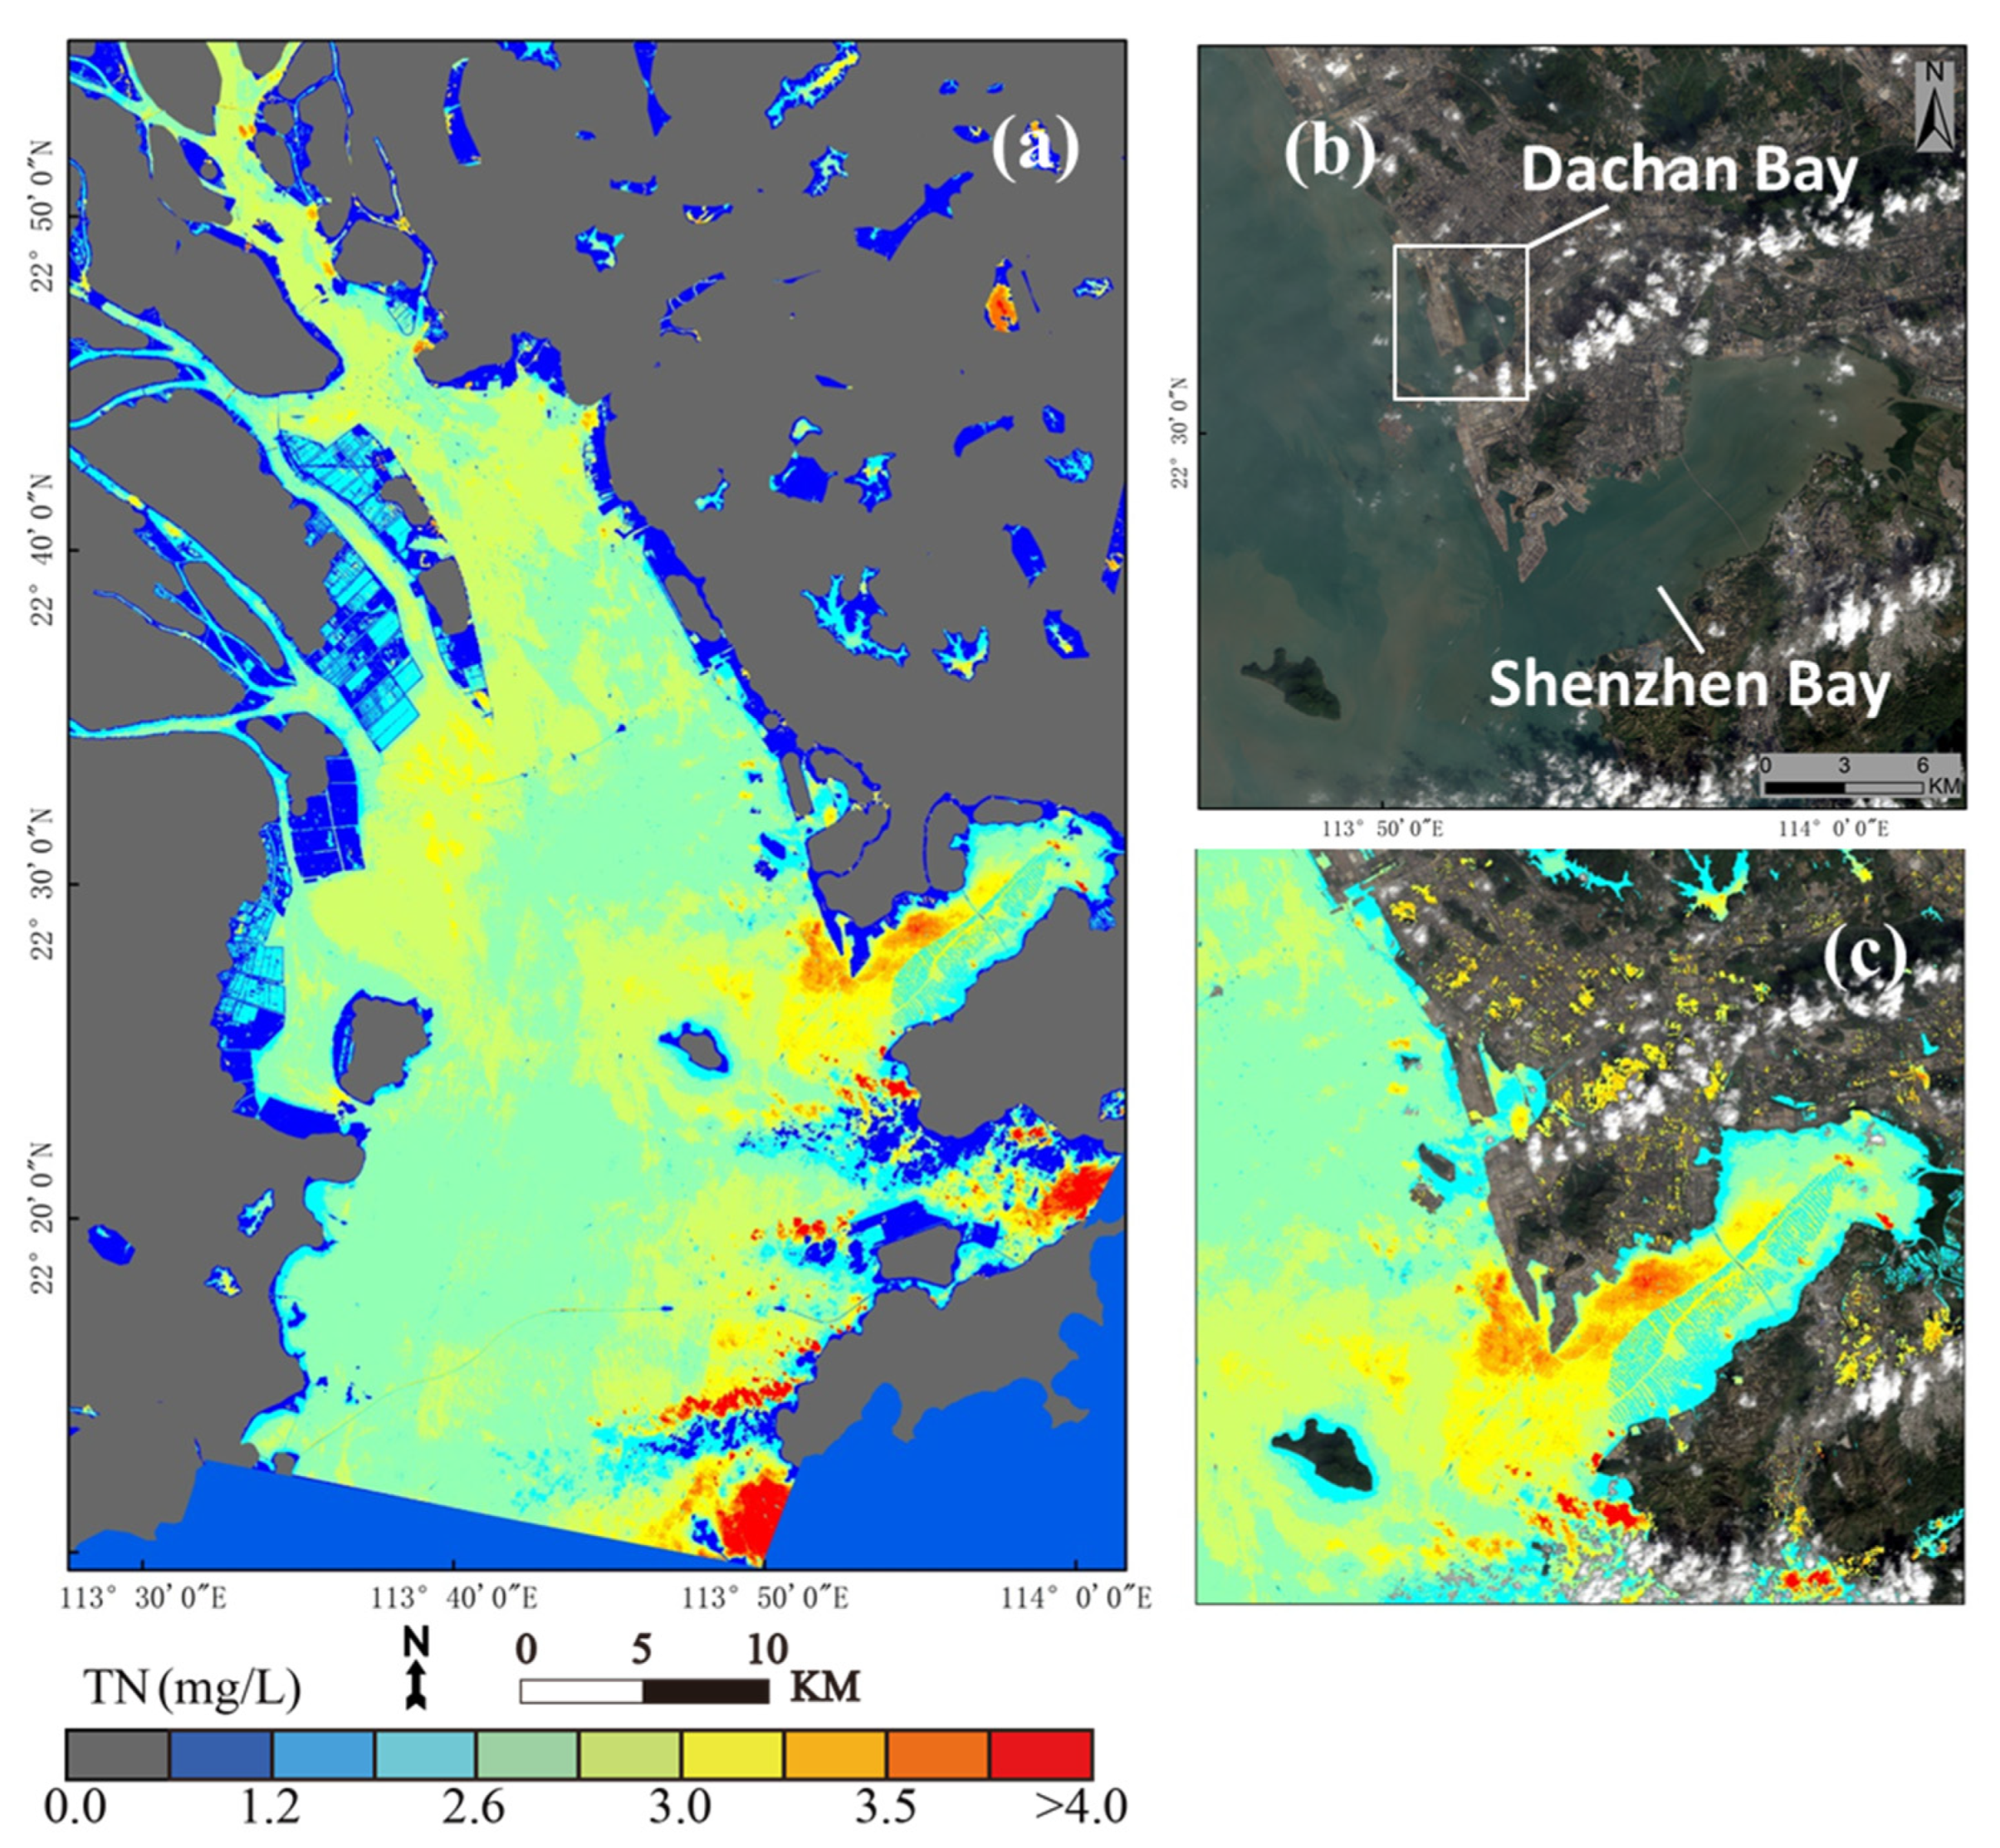
Figure 5a shows the retrieval results of TN in the PRD when using our statistical model. There was a cloud in the southeast of the PRD, so the TN retrieval results were much higher than other parts. We do not analyze the error concentration variation. In general, the coastal region had a high concentration of TN, particularly harbors and bays. The west coastline region of the PRD had a relatively lower concentration of TN compared with the east. The mean concentration of TN was around 2.8 mg/L. The highest concentration of TN was in Shenzhen Bay, which was around 3.67 mg/L. The TN in Dachan Bay was also high at 3.02 mg/L. The mouth of the PRD has rapid water flow and material exchange, so there were fewer residual pollutants and a lower concentration of TN. Figure 5b,c show the details of the TN concentration distribution in Dachan Bay. The concentration of TN over a large area in Dachan Bay was higher than 2.4 mg/L. Only at the mouth of the bay did the concentration of TN reduce, and even then, it was still high over a wide area outside the mouth. Dachan Bay is a world container terminal located in the west of Shenzhen, China. In 2021, Dachan Bay terminal added 10 international shipping lines, and in October, it hit a new high of 173,000 TEU throughout. Dachan Bay had high TN concentration due to intensive anthropogenic activities and ship pollution. The phytoplankton bloomed in abundance due to high TN. Figure 5b,c also show a high concentration of TN in Shenzhen Bay. The coastal concentration of TN was lower than that found in the middle and mouth of Shenzhen Bay. Shenzhen Bay is a semi-enclosed tidal bay located on the east side of the Pearl River estuary, with a depth of about 14 km and an average width of about 5 km [29]. Shenzhen Bay has multiple converging streams with a high level of pollutant discharge. In May 2020, a large-scale algal bloom broke out in Shenzhen Bay with high NH3-N concentration of 2.42 mg/L in the center of the algal bloom [30]. Large inputs of pollutants lead to increased nutrient levels [31,32], and Shenzhen Bay has consistently been identified as Class IV or V water in recent years [27]. The low TN concentration in parts of Shenzhen Bay near the city is due to the measures taken by Shenzhen against water pollution, as well as the surrounding wetlands, which help to improve the water quality [33].
4. Discussion
4.1. Spectral Characteristics of TN
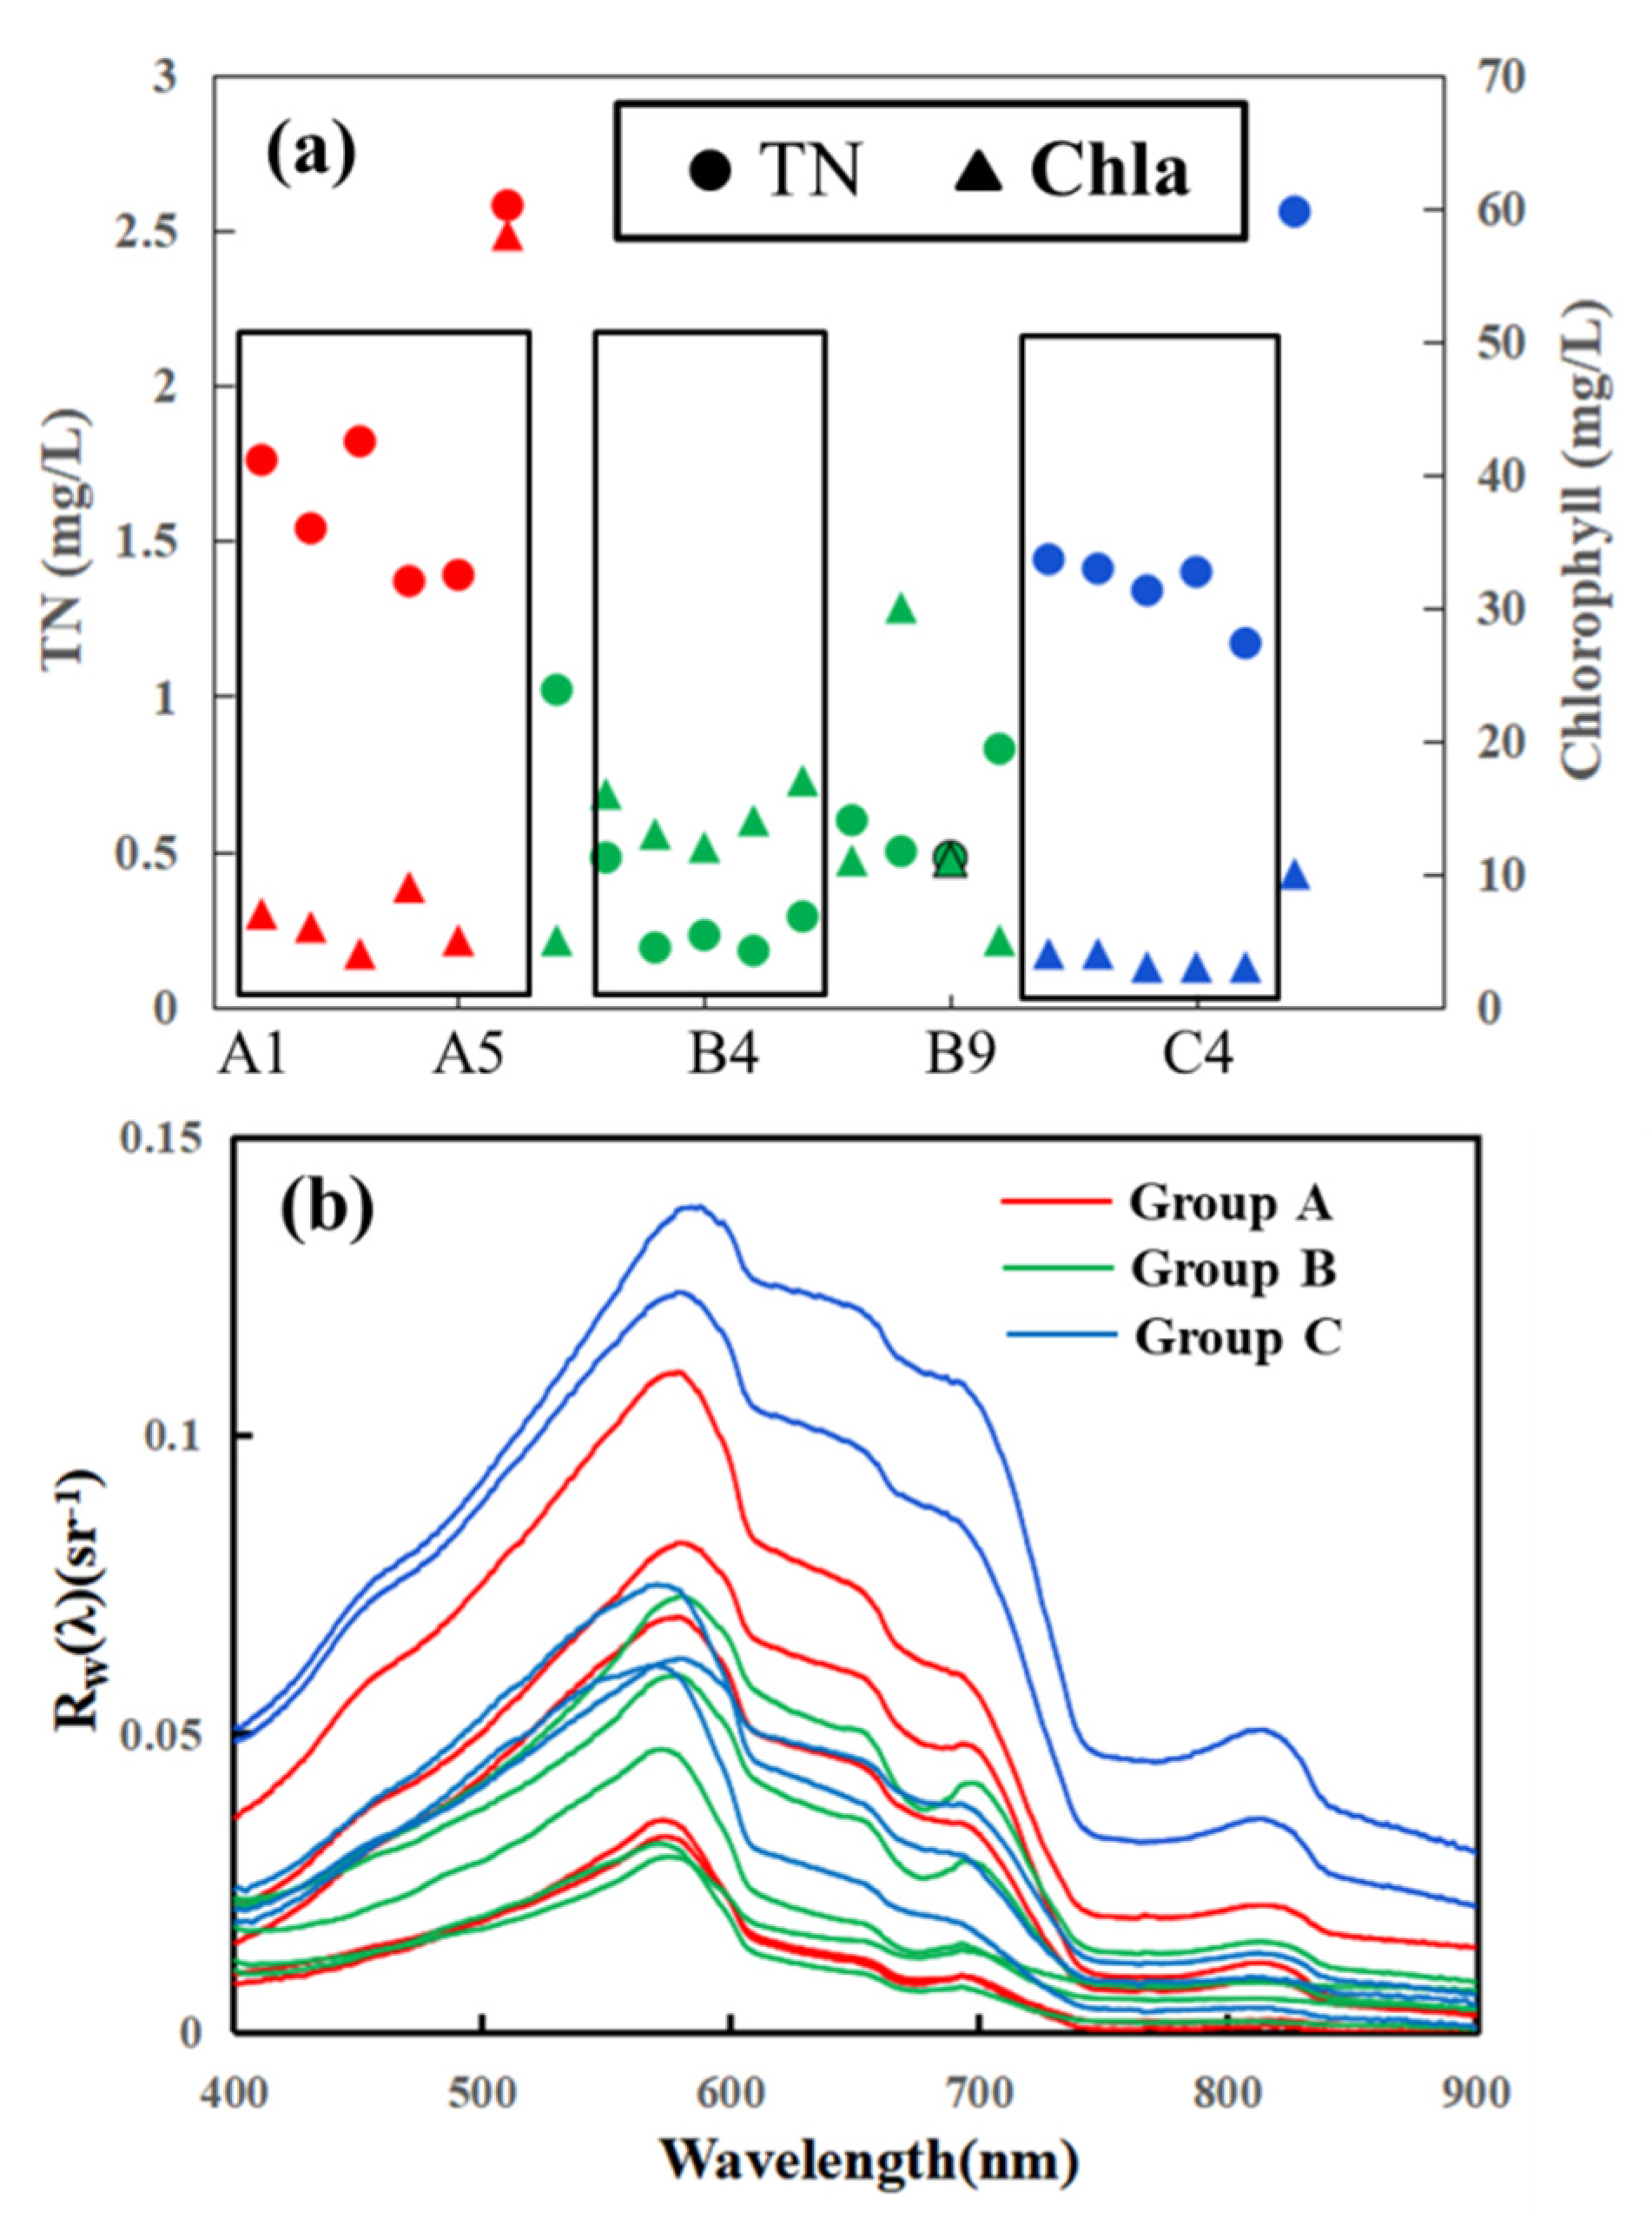
To further explore the spectral characteristics of TN, Figure 6 shows the spectral curves of some typical sample sites. Figure 6a shows the TN and chlorophyll concentrations at sampling sites of groups A, B and C. Sample groups A (sites A1–A6) and C (sites C1–C6), located in the upper and middle parts of the PRD, had high pollution rates. Sampling group B (sites B1–B10) was mainly distributed in the mouth of the PRD and had lower TN and chlorophyll. In general, similar concentration change trends between the two confirmed the correlation between TN and chlorophyll. The red lines in Figure 6b indicate the spectral curves of sites A1–A5, the green lines indicate the spectral curves of sites B2–B6, and the blue lines indicate the spectral curves of sites C1–C5. According to Figure 6b, the water contamination for sampling group B was dominated by chlorophyll, and the green line shows two reflectance peaks. The first peak is the highest green reflectance peak, and the second is the fluorescence peak of chlorophyll. The spectral characteristics of this kind of polluted water were the same as those of chlorophyll. For TN-dominated water, the spectral curves in Figure 6b show some new characteristics. Firstly, the average reflectance at 400–900 nm increased significantly, which shows stronger reflectance compared with chlorophyll-dominated water. Secondly, there were almost no reflectance peaks around 700 nm, so there was only one reflectance peak in the visible band. Finally, there was a high reflectance peak around 820 nm, and this could be one of the sensitive bands of TN. Wang et al. [20] found that the best retrieval characteristic band ratio for ammonia–nitrogen was 740/632 nm. Lin et al. [6] showed that the optimal retrieval band ratios were 787/678 nm. The characteristic band ratios of most organic pollution such as colored dissolved matter, biochemical oxygen demand, total phosphorus and TN always took the band 630–690 nm as the denominator because band 630–690 nm is an absorption range. The numerator of the characteristic band ratios of TN obtained empirically in these studies was always in the vicinity of 750 nm, which is an absorption range in Figure 6b.
The highest reflectance curves in Figure 6b belonged to sites A3, C1, and C3. These three sites were located along the middle of the estuary and had dark green water around them in Figure 1. This part did not have enough suspended sediment to create high scatter, and the amount of colored organic matter was also small according to the field measurement. The effects of the three most significant pollutants were excluded. In addition, the regression functions, including the NIR band, always showed good performance in terms of TN concentration retrieval. In summary, the 750–850 nm band could be an important reference for further exploring the spectral characteristics and retrieval of TN in the future.
4.2. Comparison of TN and Chlorophyll
Nitrogen is an essential nutrient for phytoplankton in water, and the chlorophyll distribution can reflect the distribution of nitrogen to some extent [34,35,36]. Therefore, the chlorophyll in the PRD was also retrieved using the radiative transfer model [37] for comparative analysis with the TN. The radiative transfer model was constructed based on the theory of absorption and scattering of light. The physical relationship between the spectral information and the concentrations of parameters was established by analyzing and calculating the variation in light attenuation in water. From Figure 7a, we can see that the chlorophyll was mainly distributed along the east coastline, especially in Dachan Bay and Shenzhen Bay. The southwest part of the PRD had less chlorophyll, which is in agreement with the distribution of the TN.
The radiative transfer model retrieval result contained much more details regarding water quality when compared with the statistical method. The statistical method depends on a great deal of measured data and has high accuracy in a local area. Meanwhile, the statistical method is based on mathematical theory rather than spectral characteristics, even though the characteristic band groups are picked up. This study involved relatively few sampling sites. Therefore, most of the areas in Figure 5 had a relatively uniform distribution of TN concentration.
4.3. Influence of Suspended Sediment
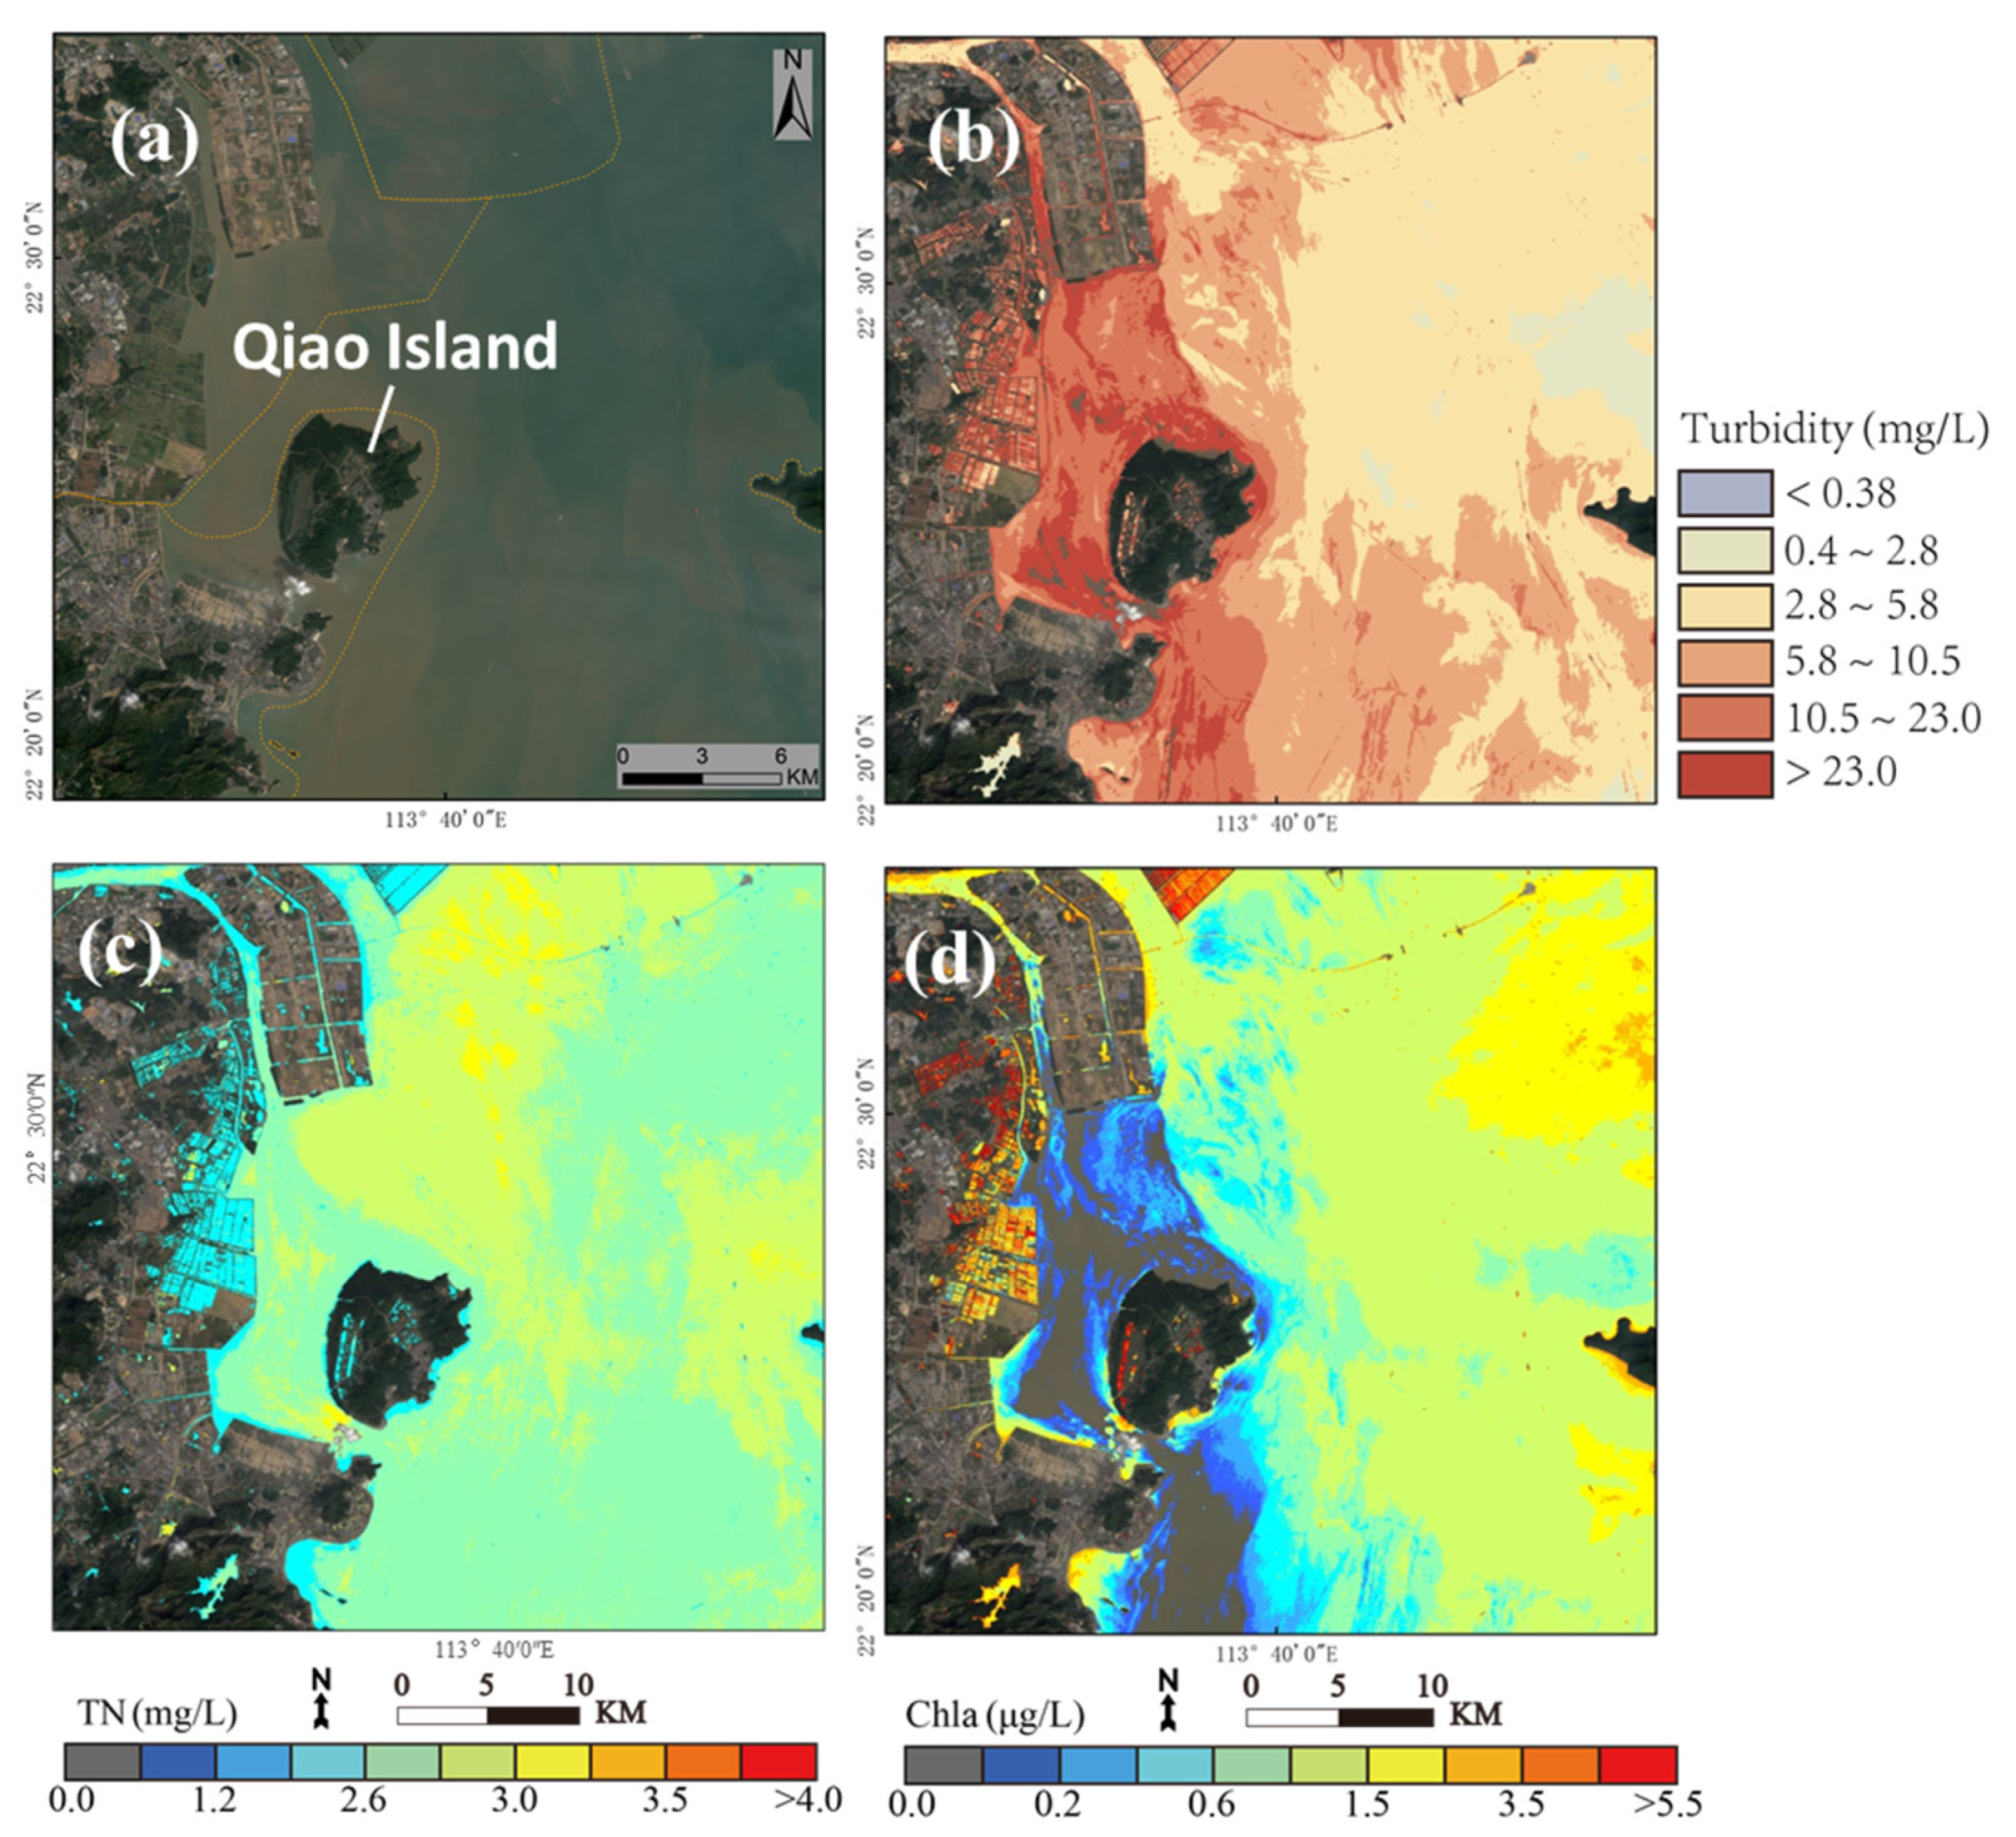
Figure 8c,d show the concentration of TN and chlorophyll around Qiao Island. There are intensive paddy fields on the west and north of Qiao Island. The high concentration of TN was predominantly caused by the fertilization of the paddy fields, which is non-point pollution and is difficult to monitor and control. In addition, the suspended sediment was also retrieved by the radiative transfer model to detect the details of some heavily polluted parts of the PRD (Figure 8b). Here, the chlorophyll concentration was not retrieved well due to the high suspended sediment levels. The effect of suspended sediment is mainly scattering, followed by absorption. Scattering increases the reflectance of the water body and increases the red and NIR band mostly, where the reflection peak of turbid water appears at 0.7 µm [38]. The reflectance of the 0.6–0.7 µm band is almost linearly related to the turbidity of the water body. The reflectance of water containing chlorophyll significantly decreases in the blue band and increases in the green band. The reflectance of eutrophic water has characteristics of both vegetation and water, and the reflectance significantly increases in the NIR band. Thus, a great deal of the suspended sediment resulted in the failure of chlorophyll identification near Qiao Island. Furthermore, the high reflectance of sediment reduces the absorption of TN, and thus the retrieval result may underestimate the concentration near Qiao Island.
In order to further analyze the effect of suspended sediment on the retrieval process of TN concentration, the retrieval accuracy of TN was calculated separately for different concentrations of suspended sediment conditions. Figure 9a,b show the correlation between suspended sediment, TN concentration and the two most correlated three-band ratios. The suspended sediment concentrations in those two figures were lower than 9 mg/L and 9 mg/L was the median concentration. In the water of low suspended sediment, the TN concentration had high correlation with the band ratios used in regression function. However, there was no significant correlation between suspended sediment and the band ratios. Figure 9c,d illustrate the same relationship but in an environment with high suspended sediment concentration. The correlation between TN concentration and two band ratios increased compared with the situation of low suspended sediment. In general, high suspended sediment concentration could affect the scattering of water but could not affect the correlation between TN concentration and band ratios. The two band ratios were more correlated with the TN concentration than the suspended sediment. The statistical model constructed in this study can still effectively retrieve the TN concentration and characterized their variation in most parts of the PRD.
5. Conclusions
Total nitrogen (TN) is the main agent of organic pollution leading to aquatic eutrophication, but manual water sampling and monitoring are time-consuming and costly. This study employs an empirical statistical method to retrieve the concentration of TN through Landsat8 remote sensing images in the Pearl River Delta. The proposed statistical method enables the detection of TN concentration over a wide range with high retrieval accuracy (MAE = 0.36 mg/L and R2 = 0.61 for TN). Nitrogen is the main nutrient for photosynthesis in plants, so the chlorophyll was also calculated using the radiative transfer model for contrast and validation. There was a high degree of consistency between the TN and chlorophyll levels. The TN mainly aggregates along the coastline, and its concentration in the east is much greater than that in the west. Specifically, nitrogen pollution is distributed in Dachan Bay and Shenzhen Bay, which had the highest TN concentrations of about 3.02 mg/L and 3.67 mg/L, respectively. The pollution in Dachan Bay and Shenzhen Bay is mainly the result of ship pollution and industrial and domestic sewage. The distribution of TN can be quickly inverted by means of a statistical method, and the causes of pollution can be identified using remote sensing images. Future work should focus on hyper-spatial, spectral, and even time-resolution remote sensing images for the real-time retrieval of accurate water quality parameters to provide significant recommendations for water quality monitoring and management in the PRD and other similar fluvial deltas.
Author Contributions
Y.G.: Conceptualization, Methodology, Data analysis, Validation, Writing—Original Draft, Writing—Review and Editing. R.D.: Conceptualization, Supervision. R.Z.: Data analysis. Y.L.: Formal analysis. J.L.: Formal analysis. Z.H.: Investigation. J.W.: Investigation. Y.T.: Investigation. All authors have read and agreed to the published version of the manuscript.
Funding
This work was supported by The National Natural Science Foundation of China [grant numbers 41901352 and 41071230]; the Science and Technology Planning Project of Guangdong Province [grant number 2017B020216001]; the Guangdong Basic and Applied Basic Research Foundation [grant number 2020A1515010780]; the Innovation Projects in Water Resource of Guangdong Province [grant number 2016-08] and the Science and Technology Projects in Guangzhou [grant number 202102020454]; the Ecological and Environmental Research and Result Promotion of Zhejiang Province [grant number 2020HT0010].
Data Availability Statement
The Landsat images data in this study are acquired from the Earth-explore website of the USGS (https://earthexplorer.usgs.gov).
Acknowledgments
We thank the editors and reviewers for the time and effort they devoted to the manuscript during this time. Thanks to the reviewers for their valuable comments on revising the manuscript. I thank the language editing staff for revising and helping with the language of the manuscript. Thanks to the USGS for providing data support. Thanks to the instructors and students who participated in this study.
Conflicts of Interest
The authors declare no conflict of interest.
References
- Sinha, E.; Michalak, A.M.; Balaji, V. Eutrophication will increase during the 21st century as a result of precipitation changes. Sci. Am. Assoc. Adv. Sci. 2017, 357, 405–408. [Google Scholar] [CrossRef] [PubMed] [Green Version]
- Wurtsbaugh, W.A.; Paerl, H.W.; Dodds, W.K. Nutrients, eutrophication and harmful algal blooms along the freshwater to marine continuum. WIREs Water 2019, 6, 1373. [Google Scholar] [CrossRef]
- Beaulieu, J.J.; DelSontro, T.; Downing, J.A. Eutrophication will increase methane emissions from lakes and impoundments during the 21st century. Nat. Commun. 2019, 10, 1–5. [Google Scholar] [CrossRef] [Green Version]
- Rodell, M.; Famiglietti, J.S.; Wiese, D.N.; Reager, J.T.; Beaudoing, H.K.; Landerer, F.W.; Lo, M.-H. Emerging trends in global freshwater availability. Nature 2018, 557, 651–659. [Google Scholar] [CrossRef]
- Dodds, W.K.; Smith, V.H. Nitrogen, phosphorus, and eutrophication in streams. Inland Waters 2016, 6, 155–164. [Google Scholar] [CrossRef]
- Lin, J.; Zhang, C. Inversion of Water Quality Parameters of Urban River Network Using Airborne Hyperspectral Remote Sensing. Remote Sens. Inf. 2019, 34, 23–29. [Google Scholar]
- Yu, C.; Huang, X.; Chen, H.; Godfray, H.C.J.; Wright, J.S.; Hall, J.W.; Gong, P.; Ni, S.Q.; Qiao, S.C.; Huang, G.R.; et al. Managing nitrogen to restore water quality in China. Nature 2019, 567, 516–520. [Google Scholar] [CrossRef]
- Xu, P.; Yonghong, L.; Shunshun, Y.; Shengji, L. Input load to river and future projection for nitrogen and phosphorous nutrient controlling of Pearl River Basin. J. Lake Sci. 2017, 29, 1359–1371. [Google Scholar]
- Chu, H.-J.; Kong, S.-J.; Chang, C.-H. Spatio-temporal water quality mapping from satellite images using geographically and temporally weighted regression. Int. J. Appl. Earth Obs. Geoinf. 2018, 65, 1–11. [Google Scholar] [CrossRef]
- Lu, S.; Deng, R.; Liang, Y.; Xiong, L.; Ai, X.; Qin, Y. Remote Sensing Retrieval of Total Phosphorus in the Pearl River Channels Based on the GF-1 Remote Sensing Data. Remote Sens. 2020, 12, 1420. [Google Scholar] [CrossRef]
- Silió-Calzada, A.; Bricaud, A.; Gentili, B. Estimates of sea surface nitrate concentrations from sea surface temperature and chlorophyll concentration in upwelling areas: A case study for the Benguela system. Remote Sens. Environ. 2008, 112, 3173–3180. [Google Scholar] [CrossRef]
- Goes, J.; Saino, T.; Oaku, H.; Jiang, D. A method for estimating sea surface nitrate concentrations from remotely sensed SST and chlorophyll a-a case study for the north Pacific Ocean using OCTS/ADEOS data. IEEE Trans. Geosci. Remote Sens. 1999, 37, 1633–1644. [Google Scholar] [CrossRef]
- Fengkui, M.A.; Qunou, J.; Lidan, X.U.; Yong, L.; Rongcheng, W.; Shuai, S.U. Retrieval of water quality parameters based on BP neural network algorithm in Miyun. Reserv. Ecol. Environ. Sci. 2020, 3, 569–579. [Google Scholar]
- Cheng, B.; Zhang, Y.; Xia, R.; Wang, L.; Zhang, N.; Zhang, X. Spatiotemporal analysis and prediction of water quality in the Han River by an integrated nonparametric diagnosis approach. J. Clean. Prod. 2021, 328, 129583. [Google Scholar] [CrossRef]
- Tang, Z.L.; Zhu, Z.F.; Li, X.H.; Zhong, B.; Xu, L.; Zhuomanta PM, A.; Sun, G. Hyperspectral quantitative inversion model for water quality parameters of lakes in Jiuzhaigou World Natural Heritage Site. Chin. J. Appl. Env. Biol. 2021, 27, 1256–1263. [Google Scholar]
- Zhou, Y.; Hu, J.; Xie, M. Research on Reservoir Water Quality Prediction Based on Grey Model. IOP Conf. Series Earth Environ. Sci. 2021, 621, 012120. [Google Scholar] [CrossRef]
- Lu, H.; Yang, L.; Fan, Y.; Qian, X.; Liu, T. Novel simulation of aqueous total nitrogen and phosphorus concentrations in Taihu Lake with machine learning. Environ. Res. 2021, 204, 111940. [Google Scholar] [CrossRef]
- Liu, Y.; Kai, X.; Hailin, F.; Yiming, F. Inversion of water quality elements in small and micro—size water region using multispectral image by UAV. Acta Sci. Circumstantiae 2019, 4, 1241–1249. [Google Scholar]
- Ma, F.; Gao, Z.; Ye, B. Remote sensing inversion of Tangxun lake water quality based on high score remote sensing satellite image. Water Resour. Dev. Manag. 2021, 5, 69–75. [Google Scholar]
- Wang, X.; Lan, G.; Yong, H.; Li, L.; Jie, H. Spectral Feature Construction and Sensitivity Analysis of Water Quality Parameters Remote Sensing Inversion. Spectrosc. Spect. Anal. 2021, 41, 1880–1885. [Google Scholar]
- Wu, H.; Guo, Q. Study on Water Quality Parameter Inversion based on Landsat8 and Measured Data. Remote Sens. Technol. Appl. 2021, 36, 898–907. [Google Scholar]
- Nong, X.; Shao, D.; Zhong, H.; Liang, J. Evaluation of water quality in the South-to-North Water Diversion Project of China using the water quality index (WQI) method. Water Res. 2020, 178, 115781. [Google Scholar] [CrossRef] [PubMed]
- Zhao, L.; Lu, X.; Tan, H.; Ma, T. Water Quality Monitoring Technology Based on GF-1 Satellite and XGBoost Model. Remote Sens. Inf. 2021, 36, 96–103. [Google Scholar]
- Ji, X.; Zhang, W. Tidal influence on the discharge distribution over the Pearl river Delta, China. Reg. Stud. Mar. Sci. 2019, 31, 100791. [Google Scholar] [CrossRef]
- Wang, X.; Guo, Y.; Ren, J. The Coupling Effect of Flood Discharge and Storm Surge on Extreme Flood Stages: A Case Study in the Pearl River Delta, South China. Int. J. Disaster Risk Sci. 2021, 12, 1–15. [Google Scholar] [CrossRef]
- DNRG. South China Sea Marine Environment Bulletin; Hong Kong Observatory: Hong Kong, China, 2011. [Google Scholar]
- Luo, H.; Chen, X.-H.; Wu, Q.; Luo, N.; Huang, X. Spatio-temporal characteristics of non-point source and sewer overflow pollution and its impacts on water environment in Shenzhen Bay Basin. J. Nat. Resour. 2020, 35, 3018–3028. [Google Scholar] [CrossRef]
- Anderson, G.P.; Felde, G.W.; Hoke, M.L.; Ratkowski, A.J.; Cooley, T.W.; Chetwynd, J.H., Jr.; Gardner, J.A.; Adler-Golden, S.M.; Matthew, M.W.; Berk, A.; et al. MODTRAN4-based atmospheric correction algorithm: FLAASH (fast line-of-sight atmospheric analysis of spectral hypercubes). In Algorithms and Technologies for Multispectral, Hyperspectral, and Ultraspectral Imagery VIII.; Shen, S.S., Lewis, P.E., Eds.; International Society for Optics and Photonics: Bellingham, WA, USA, 2002; Volume 4725, pp. 65–71. [Google Scholar]
- Wan, Y.; Mao, X. Simulation and Evaluation on TIN and PO3-4 -P Reduction in Deep Bay, China. Environ. Sci. 2011, 32, 384–391. [Google Scholar]
- Ye, H.; Tang, D.; Pan, G. Analysis on the key factors for the population evolution and early warning of harmful algal blooms based on an algal bloom in Shenzhen bay, the South China Sea. Ecol. Sci. 2022, 41, 82–89. [Google Scholar] [CrossRef]
- Huan, Q.; Pang, R.; Zhou, Q.; Leng, K. Variation trends of nitrogen and phosphorus and the relationship with HABs in Shenzhen coastal waters. Mar. Environ. Sci. 2016, 35, 908–914. [Google Scholar]
- Tang, J.; Yu, X.; Liu, J.; Zhang, B.; Jiang, J. Study on classification and distribution characteristics and supervision and management measures of sewage outlets entering the sea in Guangdong Province. Mar. Sci. 2018, 45, 3. [Google Scholar]
- Lei, Y.; Yan, H.; Zhong, C.; Feng, P.; Jiang, S. Regime shift recorded by sediments from the Futian mangrove ecosystem in the Shenzhen Bay. Acta Ecol. Sin. 2020, 40, 8539–8548. [Google Scholar]
- Cao, J.; Tian, Z.; Chu, e.; Niu, Y.; Zheng, B. Nitrogen and phosphorus control thresholds of cyanobacterial blooms in Lake Taihu. J. Lake Sci. 2022, 34, 1075–1089. [Google Scholar] [CrossRef]
- Deng, K.; Li, Y.; Fang, F.; Chen, B.; Wang, W.; Xian, Y.; Guo, J. Inluence of nutrients on the in situ growth of algae. J. Civ. Environ. Eng. 2021, 43, 162–175. [Google Scholar] [CrossRef]
- He, W.; Wang, L.; Wang, C. Relationship between chlorophyll a and nitrogen and phosphorus concentrations in different water bodies and eutrophication studies. Anhui Agric. Sci. Bull 2019, 25, 14. [Google Scholar] [CrossRef]
- Deng, R.; Liu, Q.; Ke, R.; Cheng, L.; Liu, X. Model for water pollution remote sensing based on double scattering and its application in the Zhujiang River outfall. Acta Oceanol. Sin. 2004, 23, 119–127. [Google Scholar]
- Gu, Q.; Li, Q.; Zhou, M. Water Quality Monitoring of the Yangtze Estuary by Using GF-5 Hyperspectral Image. IEEE 2019, 89, 5970. [Google Scholar] [CrossRef]
Figure 1.
Study area and 35 water quality sampling points in the Pearl River Delta.

Figure 2.
Reflectance measured at the study sites.

Figure 3.
Flowchart of TN retrieval process.

Figure 4.
The results of the selected characteristic bands and statistical model validation. The correlation between (a) four single bands, (b) two band ratios, and (c) three band ratios and the measured concentration of TN. (d) the correlation coefficients of regression function (5) in Table 2.
Figure 4.
The results of the selected characteristic bands and statistical model validation. The correlation between (a) four single bands, (b) two band ratios, and (c) three band ratios and the measured concentration of TN. (d) the correlation coefficients of regression function (5) in Table 2.

Figure 5.
TN concentrations in the PRD. (a) The whole PRD area. (b) Dachan Bay and Shenzhen Bay. (c) TN concentration in Dachan Bay and Shenzhen Bay.
Figure 5.
TN concentrations in the PRD. (a) The whole PRD area. (b) Dachan Bay and Shenzhen Bay. (c) TN concentration in Dachan Bay and Shenzhen Bay.

Figure 6.
Measured concentration and spectral curves of sampling sites. (a) TN and chlorophyll concentration of typical sampling sites. The horizontal coordinates are the point numbers. (b) Spectral curves of typical sites in black boxes in (a), including A1–A5, B2–B6, and C1–C5. The red lines are the spectral curves of A1–A5 in (a). The green lines are the spectral curves of B2–B6 in (a). The blue lines are the spectral curves of C1–C5 in (a).

Figure 7.
Chlorophyll concentrations in the PRD. (a) The entire PRD. (b) Dachan Bay and Shenzhen Bay. (c) Chlorophyll concentration in Dachan Bay and Shenzhen Bay.
Figure 7.
Chlorophyll concentrations in the PRD. (a) The entire PRD. (b) Dachan Bay and Shenzhen Bay. (c) Chlorophyll concentration in Dachan Bay and Shenzhen Bay.

Figure 8.
Retrieval concentration of suspended sediment, TN, and chlorophyll near Qiao Island. (a) The location near Qiao Island. (b) The suspended sediment concentration near Qiao Island. (c) The concentration of TN near Qiao Island. (d) The concentration of chlorophyll near Qiao Island.
Figure 8.
Retrieval concentration of suspended sediment, TN, and chlorophyll near Qiao Island. (a) The location near Qiao Island. (b) The suspended sediment concentration near Qiao Island. (c) The concentration of TN near Qiao Island. (d) The concentration of chlorophyll near Qiao Island.

Figure 9.
Correlation between suspended sediment, TN concentration and two band ratios used in statistical model. The black symbols are concentration and correlation of suspended sediment. The red symbols are concentration and correlation of TN. (a,b) Correlation between them in situation with suspended sediment concentration below 9 mg/L. (c,d) Correlation between them in situation with suspended sediment concentration above 9 mg/L.


Table 1.
Water quality analysis results of sampling sites. This table contains five sampling groups and their numbers. Each sampling group has statistical data of maximum, minimum, mean and median of material concentrations.
Table 1.
Water quality analysis results of sampling sites. This table contains five sampling groups and their numbers. Each sampling group has statistical data of maximum, minimum, mean and median of material concentrations.
| Sampling Groups | Numbers | Time | TN (mg/L) | Chlorophyll (μg/L) | Suspended Sediment (mg/L) | |||||||||
|---|---|---|---|---|---|---|---|---|---|---|---|---|---|---|
| Max | Min | Mean | Med | Max | Min | Mean | Med | Max | Min | Mean | Med | |||
| A | 6 | 2020-11-05 | 2.58 | 1.37 | 1.74 | 1.65 | 58.00 | 4.00 | 14.83 | 6.50 | 13.00 | 3.00 | 8.50 | 9.00 |
| B | 10 | 2020-11-12 | 1.02 | 0.18 | 0.48 | 0.48 | 30.00 | 5.00 | 13.40 | 12.50 | 24.00 | 8.00 | 14.80 | 14.00 |
| C | 6 | 2020-11-27 | 2.56 | 1.17 | 1.55 | 1.41 | 10.00 | 3.00 | 4.50 | 3.50 | 33.00 | 3.00 | 10.17 | 6.00 |
| D | 6 | 2019-09-25 | 4.10 | 1.21 | 2.27 | 2.10 | 22.10 | 1.82 | 7.89 | 5.72 | 8.50 | 3.30 | 5.60 | 5.35 |
| E | 4 | 2019-08-22 | 2.00 | 1.79 | 1.88 | 1.87 | −57.00 | 6.00 | 28.50 | 25.50 | 17 | 5.00 | 9.50 | 8.00 |
Table 2.
Statistical method retrieval functions of TN. The numbering order of x corresponds to the band ratio.
Table 2.
Statistical method retrieval functions of TN. The numbering order of x corresponds to the band ratio.
| Landsat8 Band/Band Ratio | Regression Equation | R2 |
|---|---|---|
| B1 | (1) | 0.25 |
| B4/B3 | (2) | 0.28 |
| (B4 + B2)/B3 | (3) | 0.37 |
| (B4 + B2)/B3,B1/B5 | (4) | 0.55 |
| (B2 + B4)/B3, B1/B5, B3/B5 | (5) | 0.75 |
Publisher’s Note: MDPI stays neutral with regard to jurisdictional claims in published maps and institutional affiliations. |
© 2022 by the authors. Licensee MDPI, Basel, Switzerland. This article is an open access article distributed under the terms and conditions of the Creative Commons Attribution (CC BY) license (https://creativecommons.org/licenses/by/4.0/).
Share and Cite
MDPI and ACS Style
Guo, Y.; Deng, R.; Li, J.; Hua, Z.; Wang, J.; Zhang, R.; Liang, Y.; Tang, Y. Remote Sensing Retrieval of Total Nitrogen in the Pearl River Delta Based on Landsat8. Water 2022, 14, 3710. https://doi.org/10.3390/w14223710
AMA Style
Guo Y, Deng R, Li J, Hua Z, Wang J, Zhang R, Liang Y, Tang Y. Remote Sensing Retrieval of Total Nitrogen in the Pearl River Delta Based on Landsat8. Water. 2022; 14(22):3710. https://doi.org/10.3390/w14223710
Chicago/Turabian StyleGuo, Yu, Ruru Deng, Jiayi Li, Zhenqun Hua, Jing Wang, Ruihao Zhang, Yeheng Liang, and Yuming Tang. 2022. "Remote Sensing Retrieval of Total Nitrogen in the Pearl River Delta Based on Landsat8" Water 14, no. 22: 3710. https://doi.org/10.3390/w14223710
Note that from the first issue of 2016, this journal uses article numbers instead of page numbers. See further details here.