
A Modified Two-Parameter Monthly Water Balance Model for Runoff Simulation to Assess Hydrological Drought

1
State Key Laboratory of Water Resources and Hydropower Engineering Science, Wuhan University, Wuhan 430072, China
2
Changjiang Survey, Planning, Design and Research Co., Ltd., Wuhan 430010, China
3
Hubei Key Laboratory of Basin Water Security, Wuhan 430010, China
4
Changjiang Water Resources Commission, Wuhan 430010, China
5
School of Resources and Environmental Engineering, Wuhan University of Technology, Wuhan 430070, China
6
School of Environmental Studies, China University of Geosciences, Wuhan 430074, China
*
Authors to whom correspondence should be addressed.
Water 2022, 14(22), 3715; https://doi.org/10.3390/w14223715
Submission received: 12 October 2022
/
Revised: 9 November 2022
/
Accepted: 14 November 2022
/
Published: 16 November 2022
(This article belongs to the Special Issue Characterizing, Monitoring and Prediction of Hydrometeorological Extremes under Climate Change)
Abstract
:Quantitative assessment of the frequency and magnitude of drought events plays an important role in preventing drought disasters and ensuring water security in river basins. In this paper, we modified a parsimonious two-parameter monthly water balance (TPMWB) model by incorporating the generalized proportionality hypothesis with precipitation and potential evapotranspiration as input variables. The modified TPMWB was then used to simulate the monthly hydrological processes of 30 sub-basins in the Han River basin. It is shown that the water balance model can satisfactorily simulate the hydrological regimes in the selected sub-basins. We derived the probability distribution functions of monthly runoff using the principle of maximum entropy to calculate the Standardized Runoff Index (SRI), and assessed the historical hydrological drought conditions. By investigating the correlation between four major drought characteristics (i.e., drought duration, drought severity, drought intensity, and drought inter-arrival time) and four dimensionless parameters representing the climatic and underlying properties of the basin, a conclusion can be drawn that the formation and development of hydrological drought in the Han River basin is mainly controlled by watershed storage factors, and the influence of climatic factors is also significant. The proposed approach provides a potential alternative for regional drought early warning and under changing environmental conditions.
1. Introduction
Drought is a natural hazard that causes huge damage not only to aquatic and terrestrial ecosystems, but also to many economic and social sectors such as agriculture, transportation, and urban water supply. With persistent global warming, droughts have been dramatically increased in terms of frequency and intensity in many parts of the world [1,2,3,4,5,6]. Moreover, increasing pressure of water demand caused by growth in population and expansion of agricultural, energy, and industrial activities will doubtlessly aggravate water scarcity around the world [7,8,9,10,11].
To objectively quantify the characteristics of droughts (e.g., severity, duration, return period), much effort has been devoted to develop robust drought indices for operational use in drought monitoring and early warning [12]. Frequency analysis of drought-related meteorological or hydrological variables is the most convenient tool to provide information about drought magnitude and risk. The Standardized Precipitation Index (SPI) is probably the most popular frequency analysis-based drought index across the world [13]. Following the framework, Tsakiris and Vangelis [14] and Vicente-Serrano et al. [15] proposed, respectively, the similar Reconnaissance Drought Index (RDI) and Standardized Precipitation Evapotranspiration Index (SPEI) to include the effects of temperature variability on drought assessment. When a lack of precipitation develops into a period with insufficient surface or groundwater resources, a hydrological drought is formed, which is likely to reduce the reliability of water supply for urban drinking, irrigation, and hydropower generation, and threatens the survival of fish and hampers navigation [16]. The high dependence of ecosystem and socio-economy on available water resources and the destructive consequences resulting from water shortage have promoted hydrological drought research [17,18,19,20]. Thus, a variety of hydrological drought indices have been derived by applying the same theoretical background of the SPI based on observed surface/sub-surface flow or water level data series, e.g., the Streamflow Drought Index (SDI) [21], the Standardized Streamflow Index (SSI) [22], and the Standardized Groundwater Level Index (SGI) [23].
Unlike the arid climate that controls the long-term climatic variation in specific regions, it is currently widely accepted that drought is a temporary water shortage situation related to an unbalanced hydrological cycle, and may occur at any temporal and spatial scale. Thus, drought indices that proposed simply relying on single meteorological or hydrological variables seem to be insufficient when depicting the dynamic evolution of droughts [24,25]. For mitigating the devastating impacts of droughts on the management of water resources, more attention must be given to understanding the triggering mechanisms, critical thresholds, and driving factors of droughts by tracking back to the hydrological processes. Owing to the fast development of various hydrological models, rainfall–runoff simulation provides an alternative to constructing practical drought indicators by incorporating the water balance perspective. Palmer [26] first proposed the famous Palmer Drought Severity Index (PDSI) by comparing the actual precipitation with the estimated water demand, that is, the so-called “climatically appropriate precipitation for existing conditions” based on a double-layer soil monthly water balance model. Shukla and Wood [27] claimed that modeled runoff is more suitable to derive hydrological drought indices for quantitative drought identification and assessment, and proposed the Standardized Runoff Index (SRI), which is based on the same calculation procedure as SPI after accumulating daily runoff modeled by the macro-scale Variable Infiltration Capacity (VIC) model to several multi-month scales. More recently, Staudinger et al. [28] proposed a Standardized Snow Melt and Rain Index (SMRI) to jointly consider both rain and snowmelt deficits in snow-influenced catchments.
There are at least three advantages of these model-based drought indices. Firstly, future hydrological drought regimes can be forecasted considering both the seasonality and initial condition of runoff generation, which is exactly the shortcoming of most meteorological drought indices. Secondly, compared with most post-processing streamflow naturalization methods, applied to remove potential intervention such as human activities, calibrated hydrological models are more desirable for real-time simulation cases [27]. Lastly, by incorporating the meteorological inputs and runoff generation processes, model-based hydrological drought indices can be more suitable for investigating the impacts of climate or/and other changes on moisture shortage propagation and evolution across the hydrological cycle.
The response time interval for the river system to meteorological anomalies and the minimum duration of droughts usually last to several months. Thus, rainfall–runoff models with a rough time scale, such as monthly water balance models, seem to be promising for regional hydrological drought assessment. During the last few decades, monthly water balance models have been proposed for different purposes with consideration for achieving more physical soundness while preserving acceptable complexity [29,30,31,32,33]. Taking the advantages of their inherent parsimony in terms of data inputs, model structures, and parameters, these monthly water balance models have been widely applied in water resources estimation, streamflow forecasting, climate change impact assessment, and hydraulic project design [34,35]. Though month-scale rainfall–runoff models generally do not separate the runoff generation and routing processes, it is acceptable for drought monitoring and assessment since it can remove most stochastic effects existing in short-term hydrological simulation. Vasiliades et al. [36] and Li et al. [37] applied the UTHBAL model and a two-parameter water balance model, respectively, to analyze the historical hydrological drought conditions of several sub-watersheds. However, the availability and effectiveness of such water balance model-based hydrological drought indices have not yet been widely tested. Further, few studies have focused on exploring the interrelations between drought characteristics and watershed features (both climate and underlying surface properties), which control the regional drought evolution.
The aim of this paper is threefold: (1) to propose a parsimonious conceptual monthly water balance model for runoff simulation and test its applicability with a large set of watersheds, (2) to calculate retrospective hydrological drought index series and analyze historical drought characteristics for these watersheds, (3) to evaluate the correlations among major drought characteristics and several representative indicators representing the watershed climatic and underlying land surface features. The rest of this paper is organized as follows: in Section 2, the methods used in this study are presented, followed in Section 3 by a brief introduction of the study area and data set. The results and discussion are then provided in Section 4. The conclusion is given in Section 5.
2. Methodology
2.1. Modified TPMWB Model
Provided the suitability of a monthly time scale for drought analysis, a revised version of a parsimonious two-parameter monthly water balance model (TPMWB) proposed by Xiong and Guo [29] was applied to transform climatic inputs into runoff through catchment hydrological response.
In the previous TPMWB model, two major modules, i.e., the estimation of actual monthly evapotranspiration (Equation (1)) and the generation of monthly runoff (Equation (2)), are integrated in the model as follows, yielding two parameters to be calibrated:
where Et, PEt, Pt, and Qt represent the monthly actual evapotranspiration, potential evapotranspiration, rainfall, and runoff at the t-th month, respectively. NSt is the generalized effective/net water storage for generating runoff in the month, which can be calculated as (GSt−1 + Pt − Et) with GSt−1 being the generalized water content at the end of the (t − 1)-th month and the beginning of the t-th month, all with a unit of millimeter. tanh(∙) is the hyperbolic tangent function. After the runoff generation, the water content at the end of the t-th month was calculated according to the water conservation law (Equation (3)). C is a dimensionless parameter used to account for the effect of time-scale transformation, while SC is the second parameter representing the maximum soil water capacity of the catchment with a unit of millimeter. Note that water holding capacities of groundwater and unsaturated zone storage were not separated in order to keep the model structure simple without deviation from the runoff formation mechanism at a monthly time scale.
The TPMWB model has proved to be quite efficient in simulating monthly runoff in many small and medium basins [29,37,38]. However, the mathematical derivation of dQ/dNS can be larger than 1.0 when NS/SC > 0.64 [30], and calibrated SC values are too large for some watersheds when considering its similar definition with field capacity [39], both of which to a certain extent weaken the physical soundness of the model.
In the so-called Darwinian hydrological model framework [40], the generalized proportionality hypothesis has been identified as a commonality across a wide range of time scales [41]. Referring to this assumption, we attempt to modify the runoff generation module in the original TPMWB model by simulating the underlying competing relationship between soil water storage GSt and runoff Qt from water availability NSt, as follows:
Combining Equations (1), (3), and (4), the full expression of monthly runoff can be calculated by:
The parameters of the modified TPMWB model are calibrated using the Particle Swarm Optimization algorithm (PSO) [37]. Two criteria are used to justify the performance of the proposed model, that is, the Nash–Sutcliffe efficiency criterion (NSE) and the mean relative error (RE) of the volumetric fit between the observed runoff series and the simulated series, given as:
where Qobs,i and Qsim,i is the observed and simulated runoff, respectively, is the mean value of Qobs,i, and n is length of calibration/validation period.
2.2. Calculation of Standardized Drought Index
Hydrological drought indices based on frequency analysis are commonly calculated by fitting an assumed theoretical probability density function (PDF) to the hydrological series summed/averaged over a time scale of interest to estimate the non-exceedance probability of flow data. The cumulative probability is then transformed into a unit standard normal deviance (quantile) to allow spatial or temporal description and comparison of drought condition. To evaluate the applicability of the modified TPMWB model in assessing hydrological droughts, we use the Standardized Runoff Index (SRI) proposed by Shukla and Wood [27]. The simplicity and predictability of this model-simulation runoff-based drought index have fueled its popularity around the world [42,43,44,45,46].
The procedure for calculating SRI includes the following three steps. Firstly, the time series of monthly runoff of each sub-basin is obtained by continuous hydrological simulation. Secondly, the runoff data of each month are abstracted, and the cumulative probability of the runoff is estimated from a theoretical PDF. It should be noted that the probability distribution of simulated monthly runoff Qsim,t (t = 1, 2,..., 12) is of concern and hereafter denoted as Q for short. In this paper, the traditional curve-fitting method is applied to model the theoretical PDF of simulated monthly runoff. Considering the significant skewness of monthly runoff series, especially in the dry season, together with the potential huge difference among runoff distributions in different months [22], a uniform distribution derived based on the principle of maximum entropy (POME) is adopted to fit the empirical frequencies of monthly runoff, without presupposing any PDF of underlying distributions [47,48].
Boltzmann entropy was introduced by Shannon to quantitatively measure the uncertainty of a random variable [49]. If the PDF of the random variable, referred to monthly runoff Q is fQ(q), then the Shannon entropy H(q) is defined as follows:
where a and b are the upper and lower bounds of the integral interval of Q, respectively.
The POME describes the process of selecting the PDF which fits the observed data with minimal deviation among all compatible distributions, as the one that can maximize the Shannon entropy, subject to certain constraints. Constraints in the form of low-order original or central moments are probably the most popular, given their structural flexibility and solution reliability [3,50,51,52]. In this paper, the first three original moments were adopted as constraints for maximizing Equation (8), thus the entropy-based PDF should be specifically restrained as follows:
where qi (i = 1, 2, 3) are the first to third power of q, while
(i = 1, 2, 3) are corresponding sampling original moments of q.
To maximize the Shannon entropy (Equation (8)) subject to the constraints specified by Equations (9) and (10), the Lagrange multipliers method [3] was adopted, and then the PDF of runoff in each month is derived as:
where λ0, λ1, λ2, and λ3 are the Lagrange multipliers,
The Lagrange multipliers can be obtained by solving the minimization problem of the following convex functions [53]:
where E[qi] (i = 1, 2, 3) are the expectations of qi obtained from observations. The Newton–Raphson method was then employed to iteratively calculate the Lagrange multiplier.
In this way, a more uniform theoretical PDF of monthly runoff fQ(q) is constructed by making maximum use of the information collected from the simulated runoff data while avoiding redundant information as much as possible. Once the PDF is determined, the cumulative distribution function (CDF) can then be estimated by integrating the PDF as follows:
Finally, the cumulative probability was transformed into a standardized normal deviance of the normal CDF:
where Φ−1(∙) is the inverse of a standard normal CDF.
For comparatively evaluating the capability of the modeled runoff to reconstruct the historical drought condition, the SDI calculated from observed monthly streamflow series [21] is also applied to model hydrological drought events in the study area. Likewise, the POME distribution is selected as the theoretical PDF for observed monthly streamflow data. The standardized nature of SRI and SDI removes the spatial and temporal differences among regions, thus making them suitable for multiple time-scale analysis. Accumulation of time scale, however, attenuates the modeling errors during continuous runoff generation. To compare the difference between these indices in estimating streamflow quantiles under a more significant circumstance, only a one-month time scale is employed in this study.
2.3. Identification of Drought Events and Characteristics
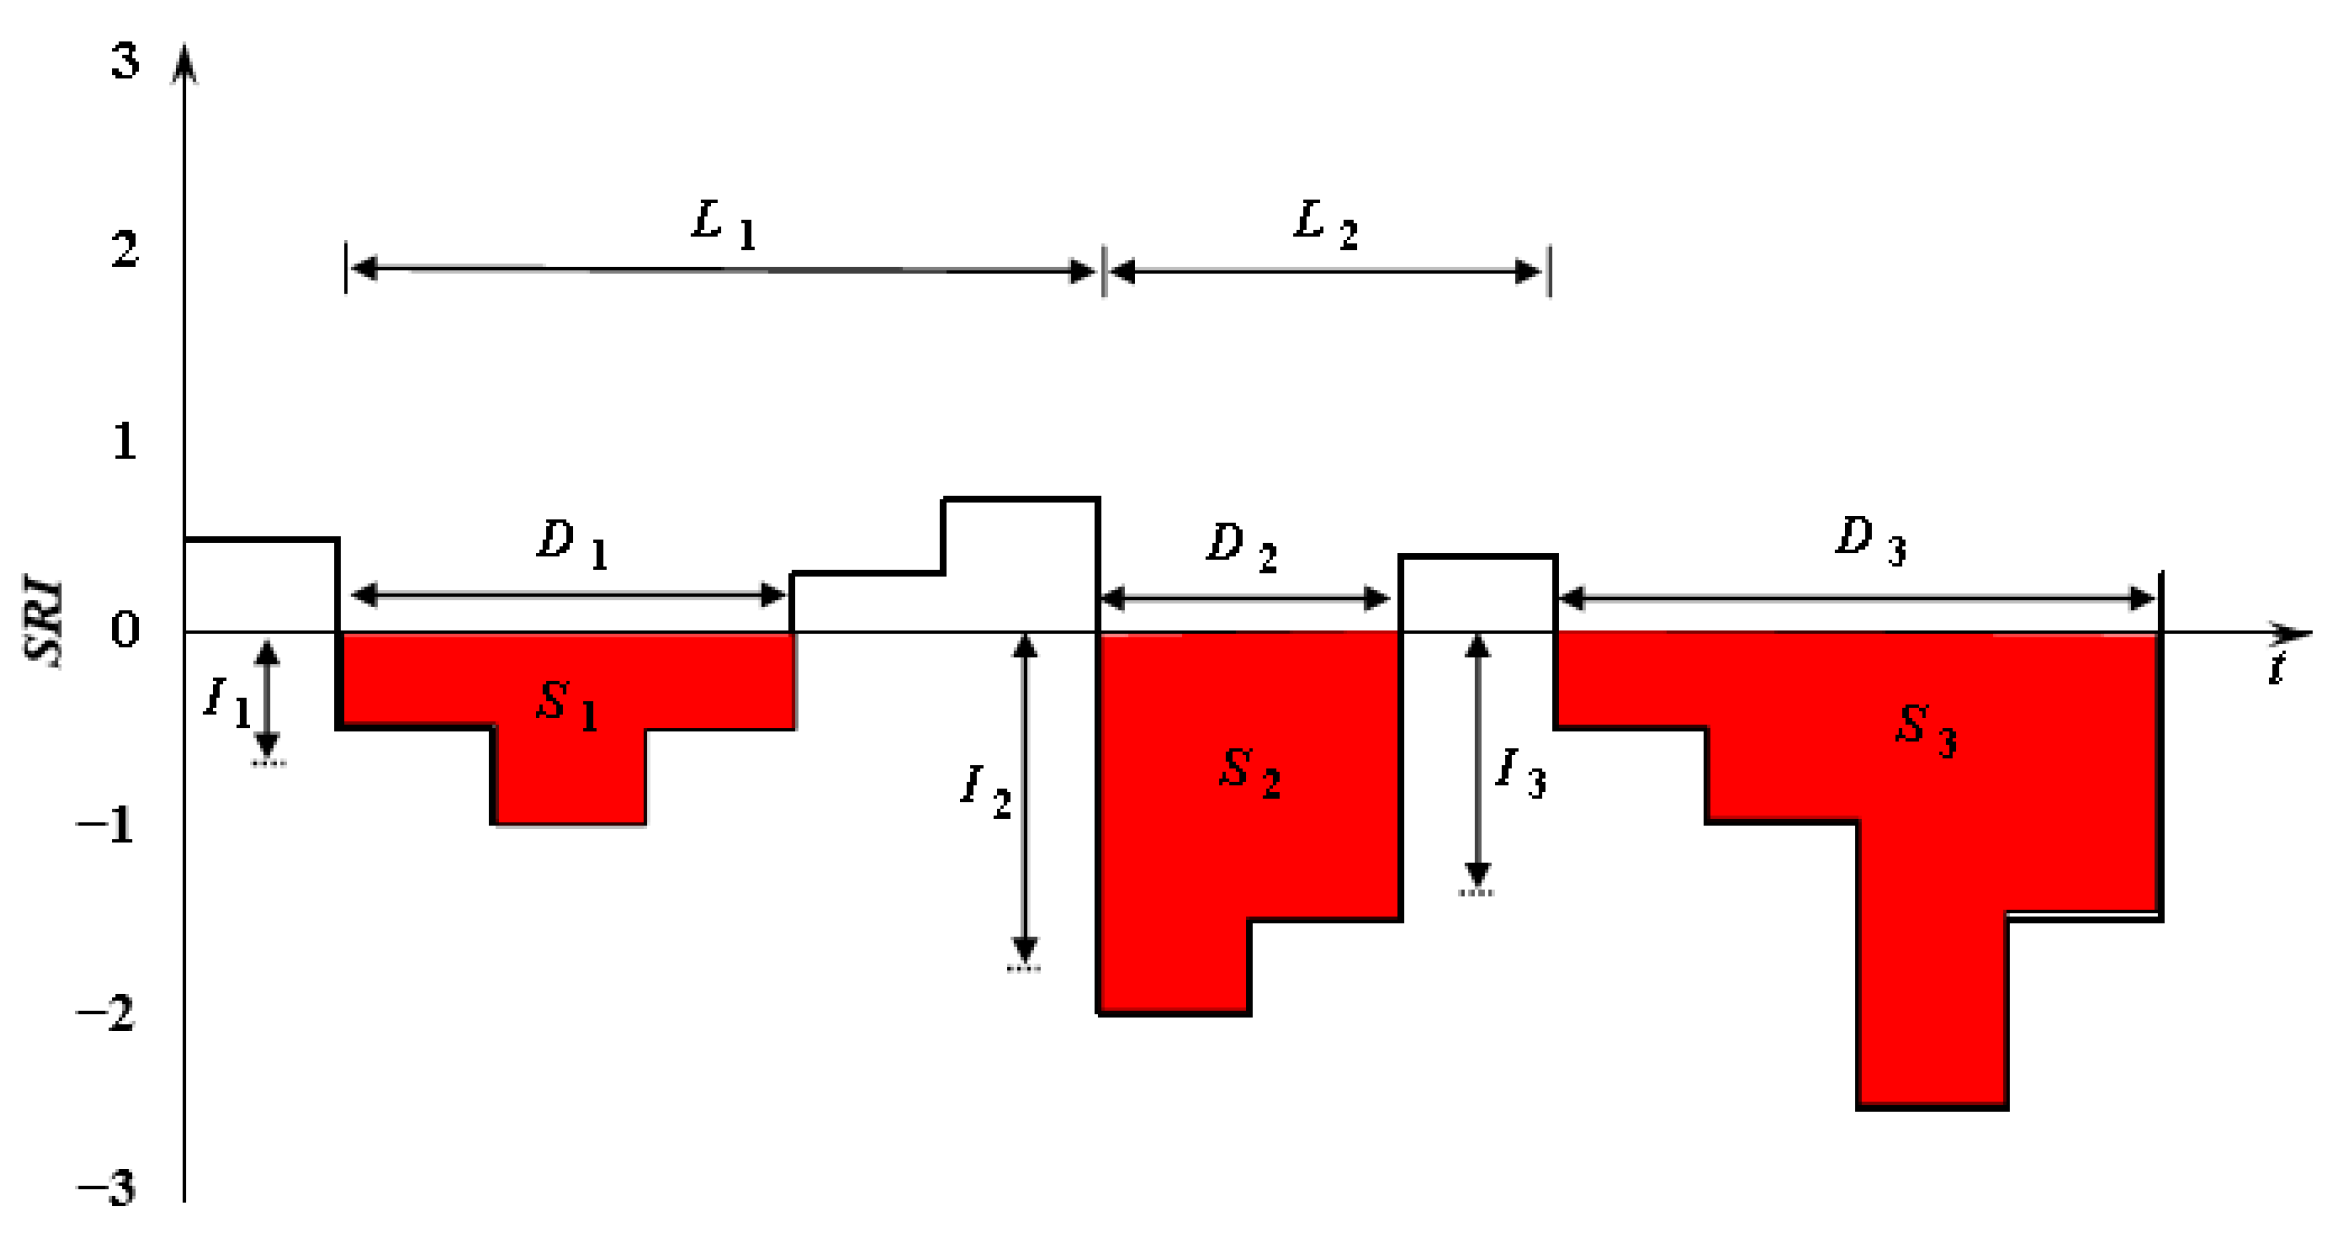
After obtaining the SRI (or SDI) series, drought events and corresponding characteristic variables can be extracted by means of the Run Theory [54,55]. A drought event is defined as a consecutive time period with SRI/SDI values lower than a pre-set threshold, which is determined as zero in this paper considering its standardized nature [18], as well as to obtain sufficient samples of drought events with limited hydrological data (see Figure 1). Characteristic variables that constitute a drought event include:
(1) Drought duration (D) is defined as the time period between the initiation and termination of a drought, with continuous SRI/SDI values below the critical level with a unit of month.
(2) Drought severity (S) is the dimensionless cumulative deficiency of the SRI/SDI value below the critical level within a drought event.
(3) Drought intensity (I) is the average value of the SRI/SDI below the critical level within the drought duration, which can be estimated as the drought severity divided by the duration.
(4) Drought inter-arrival time (L) is the time gap between two initiation moments of adjacent droughts.
2.4. Correlation Analysis between Drought Characteristics and Watershed Features
The occurrence and evolution of hydrological drought events are simultaneously affected by complicated land–atmosphere coupled process and water storage capability of the catchment (including both groundwater storage and unsaturated zone storage). Construction of the rainfall–runoff model makes it possible to analyze the driving forces and main influencing factors of hydrological droughts.
In this study, we selected four representative indicators of watershed climatic and underlying surface features. Firstly, the Aridity Index (AI, AI = PE/P), defined as the ratio of mean annual potential evapotranspiration PE and mean annual rainfall P of a catchment, is adopted. Then, to link the calibrated physical parameter with observed hydrological element, the Basin Storage Index (BI, BI = SC/Q), defined as the ratio of the maximum soil water capacity SC (one of the parameters of the TPMWB) and the mean annual runoff Q, is derived to evaluate the capability of the catchment to store and regulate runoff. Since the model proposed in this paper does not separate the base flow from the runoff, this indicator can be regarded as an alternative to the traditional Base Flow Index (BFI) [56]. The third indicator also depends on the structure of the TPMWB, that is, the time-scale transformation parameter C. According to Hu et al. [39], C is a regionally specific parameter, which can be seen as the maximum ratio of monthly actual evapotranspiration and potential evapotranspiration in a catchment, influenced by land use, vegetation coverage, etc. Finally, the annual Runoff Coefficient (RC, RC = Q/P), defined as the ratio of the mean annual runoff Q and the mean annual rainfall P, is employed.
Among the selected indices, the AI is mainly controlled by catchment climate, while BI can be regarded as the reflection of the regulating ability of the watershed’s underlying surface. Additionally, C and RC are comprehensive indicators informing the impacts of both climatic and underlying land surface features. The linear correlation analysis is applied to assess the interrelationships of different drought characteristics and watershed features, while the coefficient of determination R2 is used to investigate the strength of coupling.
3. Study Area and Data
3.1. Study Area
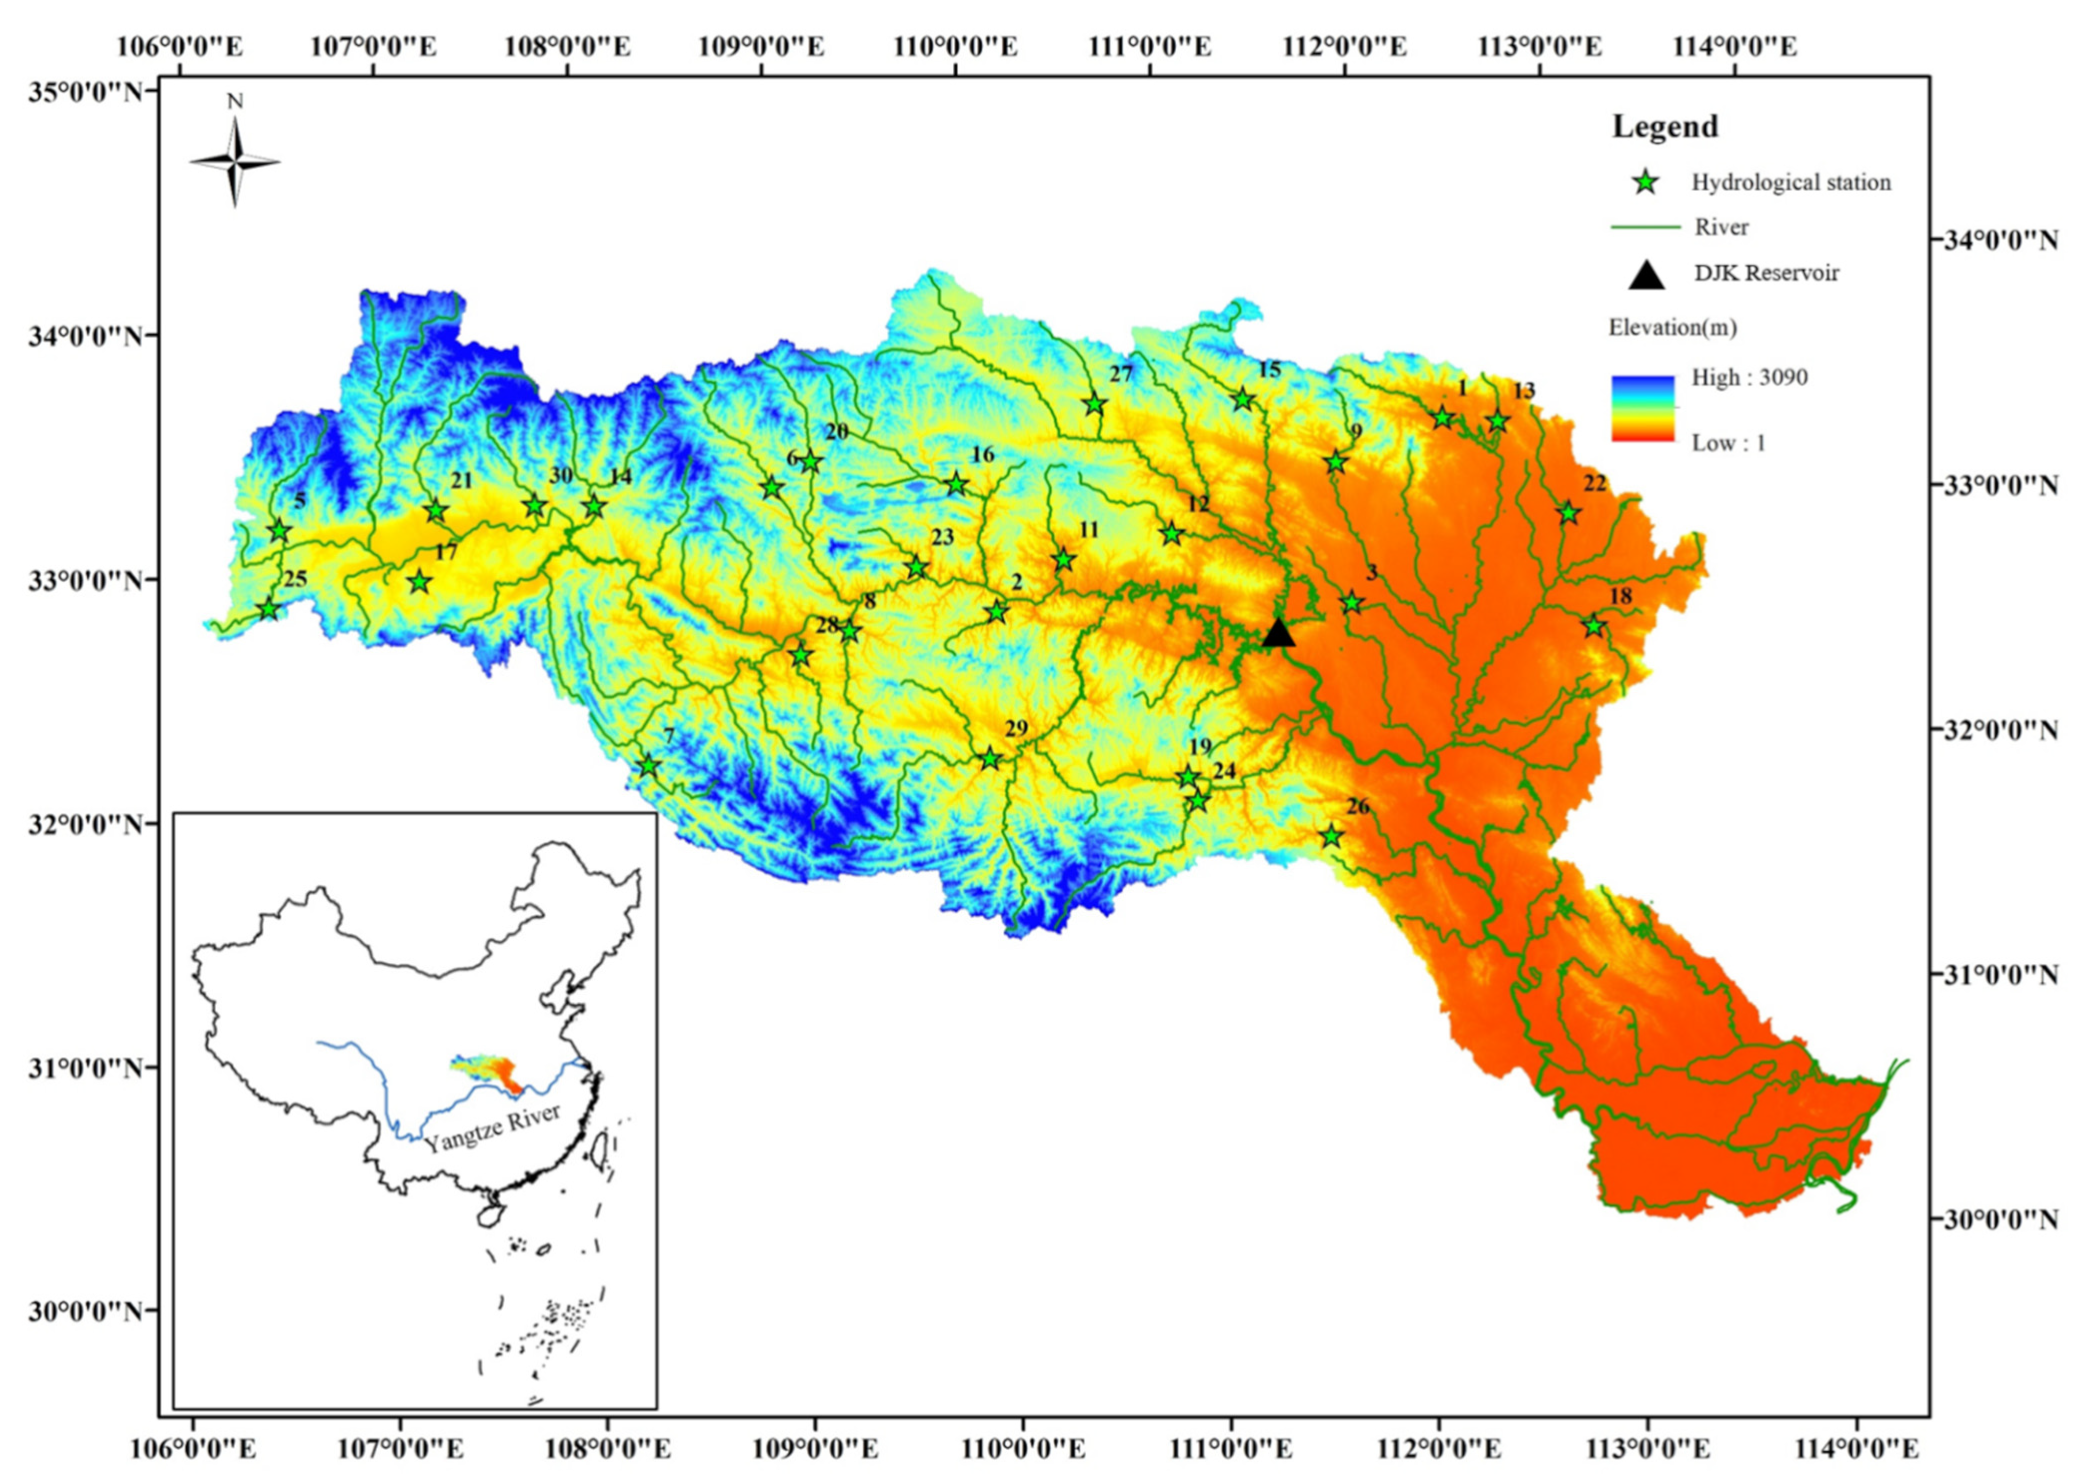
The Han River, located with 106~114° E and 30~34° N, is the largest tributary in the middle reach of the Yangtze River. Flowing southeastward from its source on the southern slope of the Qinling Mountains, the river passes through several provinces in central China, and finally pours into the Yangtze River at Wuhan City, with a mainstream length of 1577 km and a drainage area of more than 159,000 km2 (see Figure 2). The Danjiangkou (DJK) reservoir divides the whole basin into an upper and a mid-lower sub-basin. A sub-tropical monsoon climate and the varying topography from high mountains in the upper reach to relatively flat plains in the lower give rise to dramatic spatial–temporal diversity of water resources distribution in this area.
There have been some studies revealing a very dry period after 1990s in the Han River basin [57] and a decreasing trend of precipitation in the future over the upper basin [58]. The Hang River is also the water source for the middle route of the well-known South-to-North Water Diversion Project (SNWDP) in China. Since the capacity of water diversion depends greatly on the water availability of the water source area, fully understanding drought characteristics in the Han River basin is of great importance for efficient water resources management and planning.
3.2. Data
Hydrological data used in this study include monthly precipitation, monthly potential evapotranspiration (represented by pan evaporation), and monthly streamflow from 30 sub-basins located within the Han River basin, as shown in Figure 2. The main characteristics of these sub-basins are listed in Table 1. All data series used cover a time period from the 1950s to 1980s, with a minimum length of more than 20 years to ensure the representativeness of the data. Additionally, the data have not been extended beyond 1990 to keep the stationary assumption of data; the rapid economic development that has taken place in China since 1990, characterized by large-scale land use change and sharp increase in water consumption for living and production, has dramatically altered the hydrological regimes in the Han River basin [59].
Monthly precipitation, pan evaporation, and streamflow records were collected from hydrological almanacs compiled by the Bureau of Hydrology of Changjiang (Yangtze River) Water Resources Commission of China. The areal mean precipitation of each sub-basin was obtained by using the Thiessen polygon method, while pan evaporation and streamflow data at the hydrological station of each sub-basin were directly adopted.
4. Results and Discussion
4.1. Performance of the Modified TPMWB Model
To test the performance of the proposed TPMWB model, the historical record of each sub-basin was divided into two parts, i.e., calibration period and validation period. The lengths of validation period were set to be equally the last 5 years for all sub-basins, while the remaining data were used to calibrate parameters of the TPMWB model.
The NSE and RE indicators during the validation period in each sub-basin were calculated and are listed in Table 2. The average value of NSE for the 30 sub-basins in the Han River basin is 0.82, with a range from 0.74 to 0.88, while the mean value of RE is 10.7%, ranging from 1.2% to 30.4%. In general, the performance of the proposed modified TPMWB model is reasonably satisfactory and competitive with that of the previous version proposed by Xiong and Guo [29].
There are clear differences in terms of the combination of climate (represented by the Aridity Index AI, see Table 1) and topography conditions among the study areas. Hence, four representative sub-basins, Sheqi, Taikou, Wanyugou, and Youshuijie, were selected for further comparison based on their AI values, catchment areas, and topography. The observed and simulated monthly runoff hydrographs at the four selected outlets of the sub-basins are shown in Figure 3 for a more visual demonstration of the simulation ability of the proposed model. It is obvious that the modified TPMWB model can successfully capture the variability of the runoff processes in these areas quite well.
It can also be informed from Table 2 that most calibrated C parameter values are scattered around unity, which reflects their roles in adjusting the inter-relationship among Et, PEt, and Pt, in consideration of a time-scale transformation from year to month. For the SC parameter, very robust SC values are obtained through the optimization procedure with almost all calibrated SC values distributing around 300 mm, except for a few outliers such as the Jiajiafang and Jiangwan sub-basins. It is shown that the SC parameter contains a wealth of information related to underlying surface properties of the catchment. Given the acceptable performance of the modified TPMWB model, it can be used to reproduce or predict the hydrographs of calibrated sub-basins with confidence.
The modified TPMWB model strengthens the physical base of the previous version [29] by solving the unrealistic condition that dQ/dNS may be larger than 1.0 when NS/SC increases to a threshold. Additionally, the calibrated SC values are much smaller compared to the early parameter set with similar homogeneity [29].
4.2. Hydrological Drought Assessment Based on Standardized Drought Indices
4.2.1. Calculation of Standardized Drought Indices
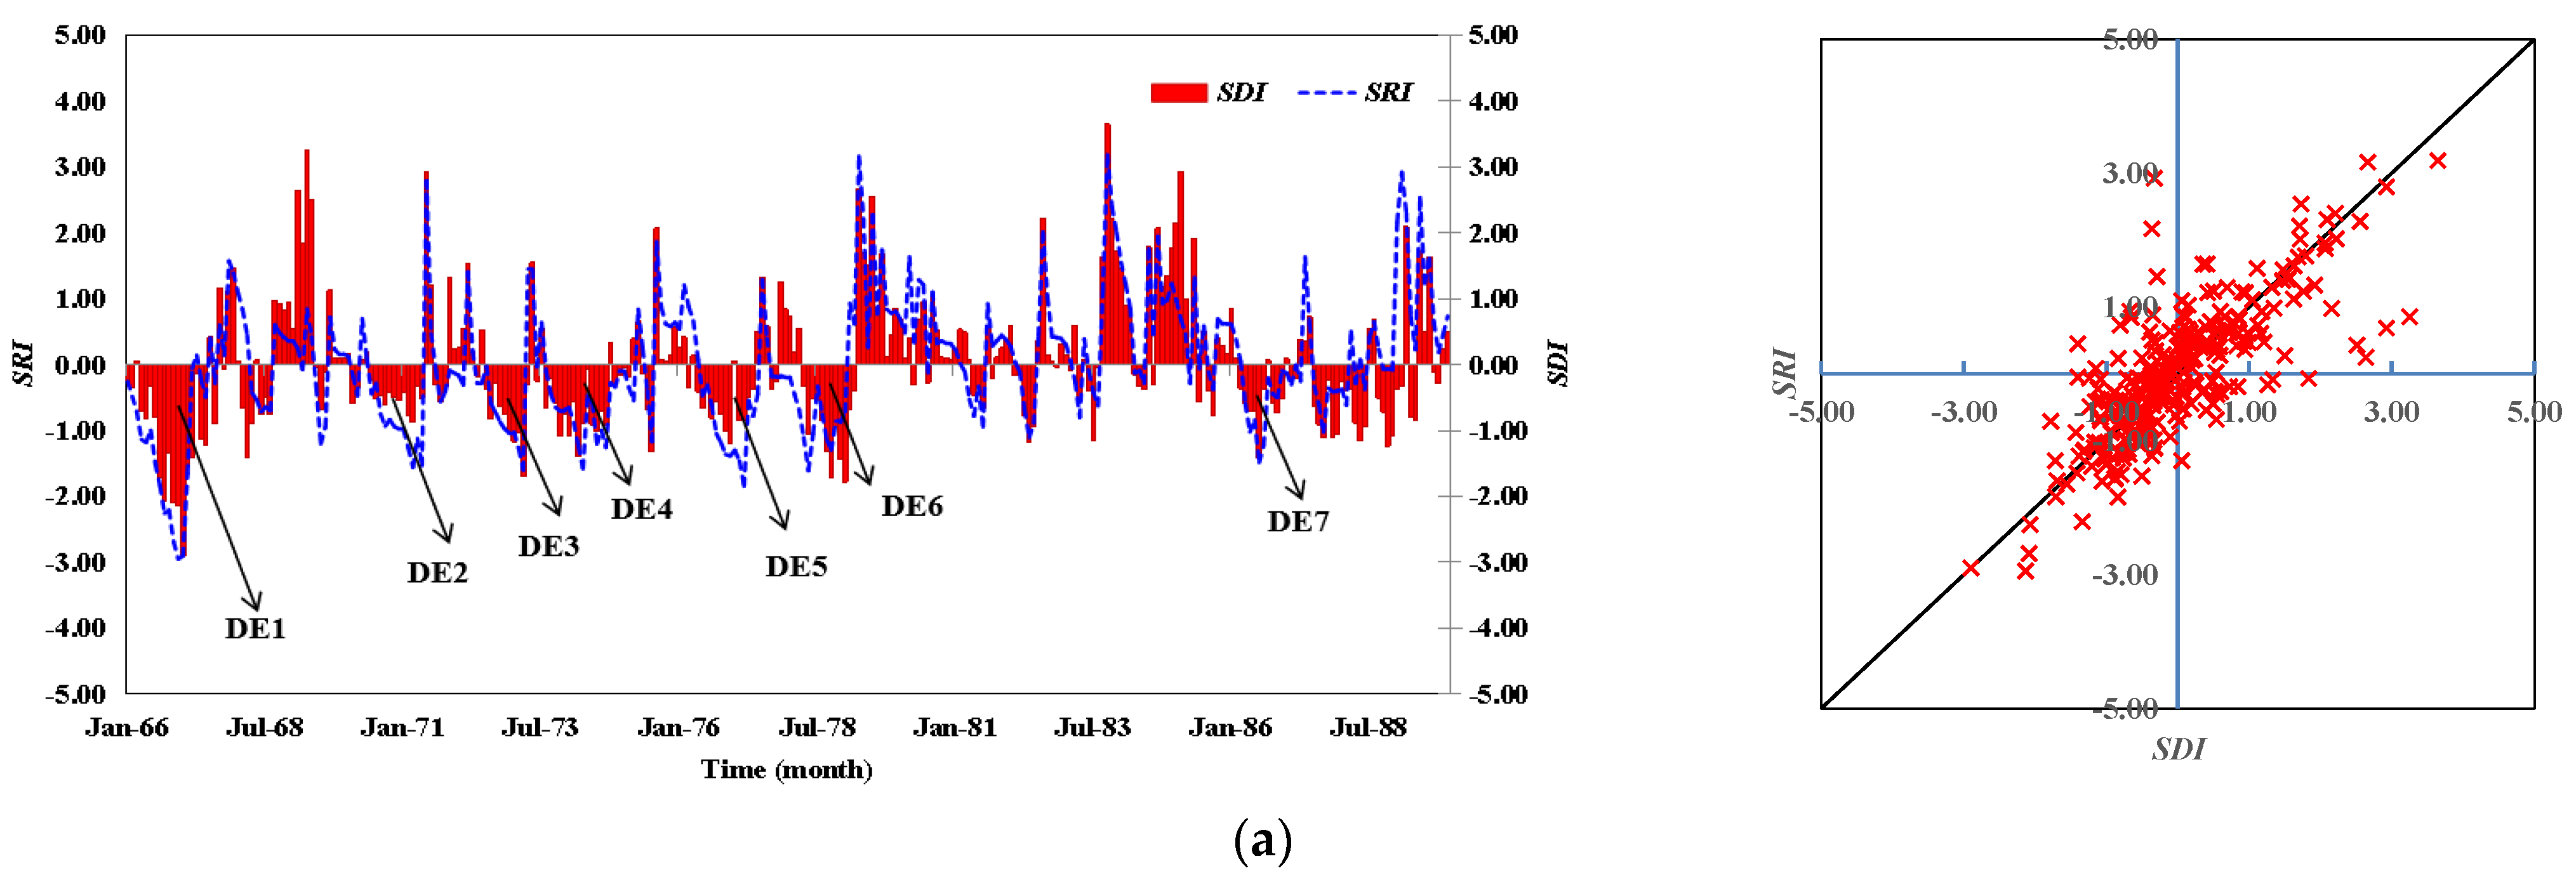
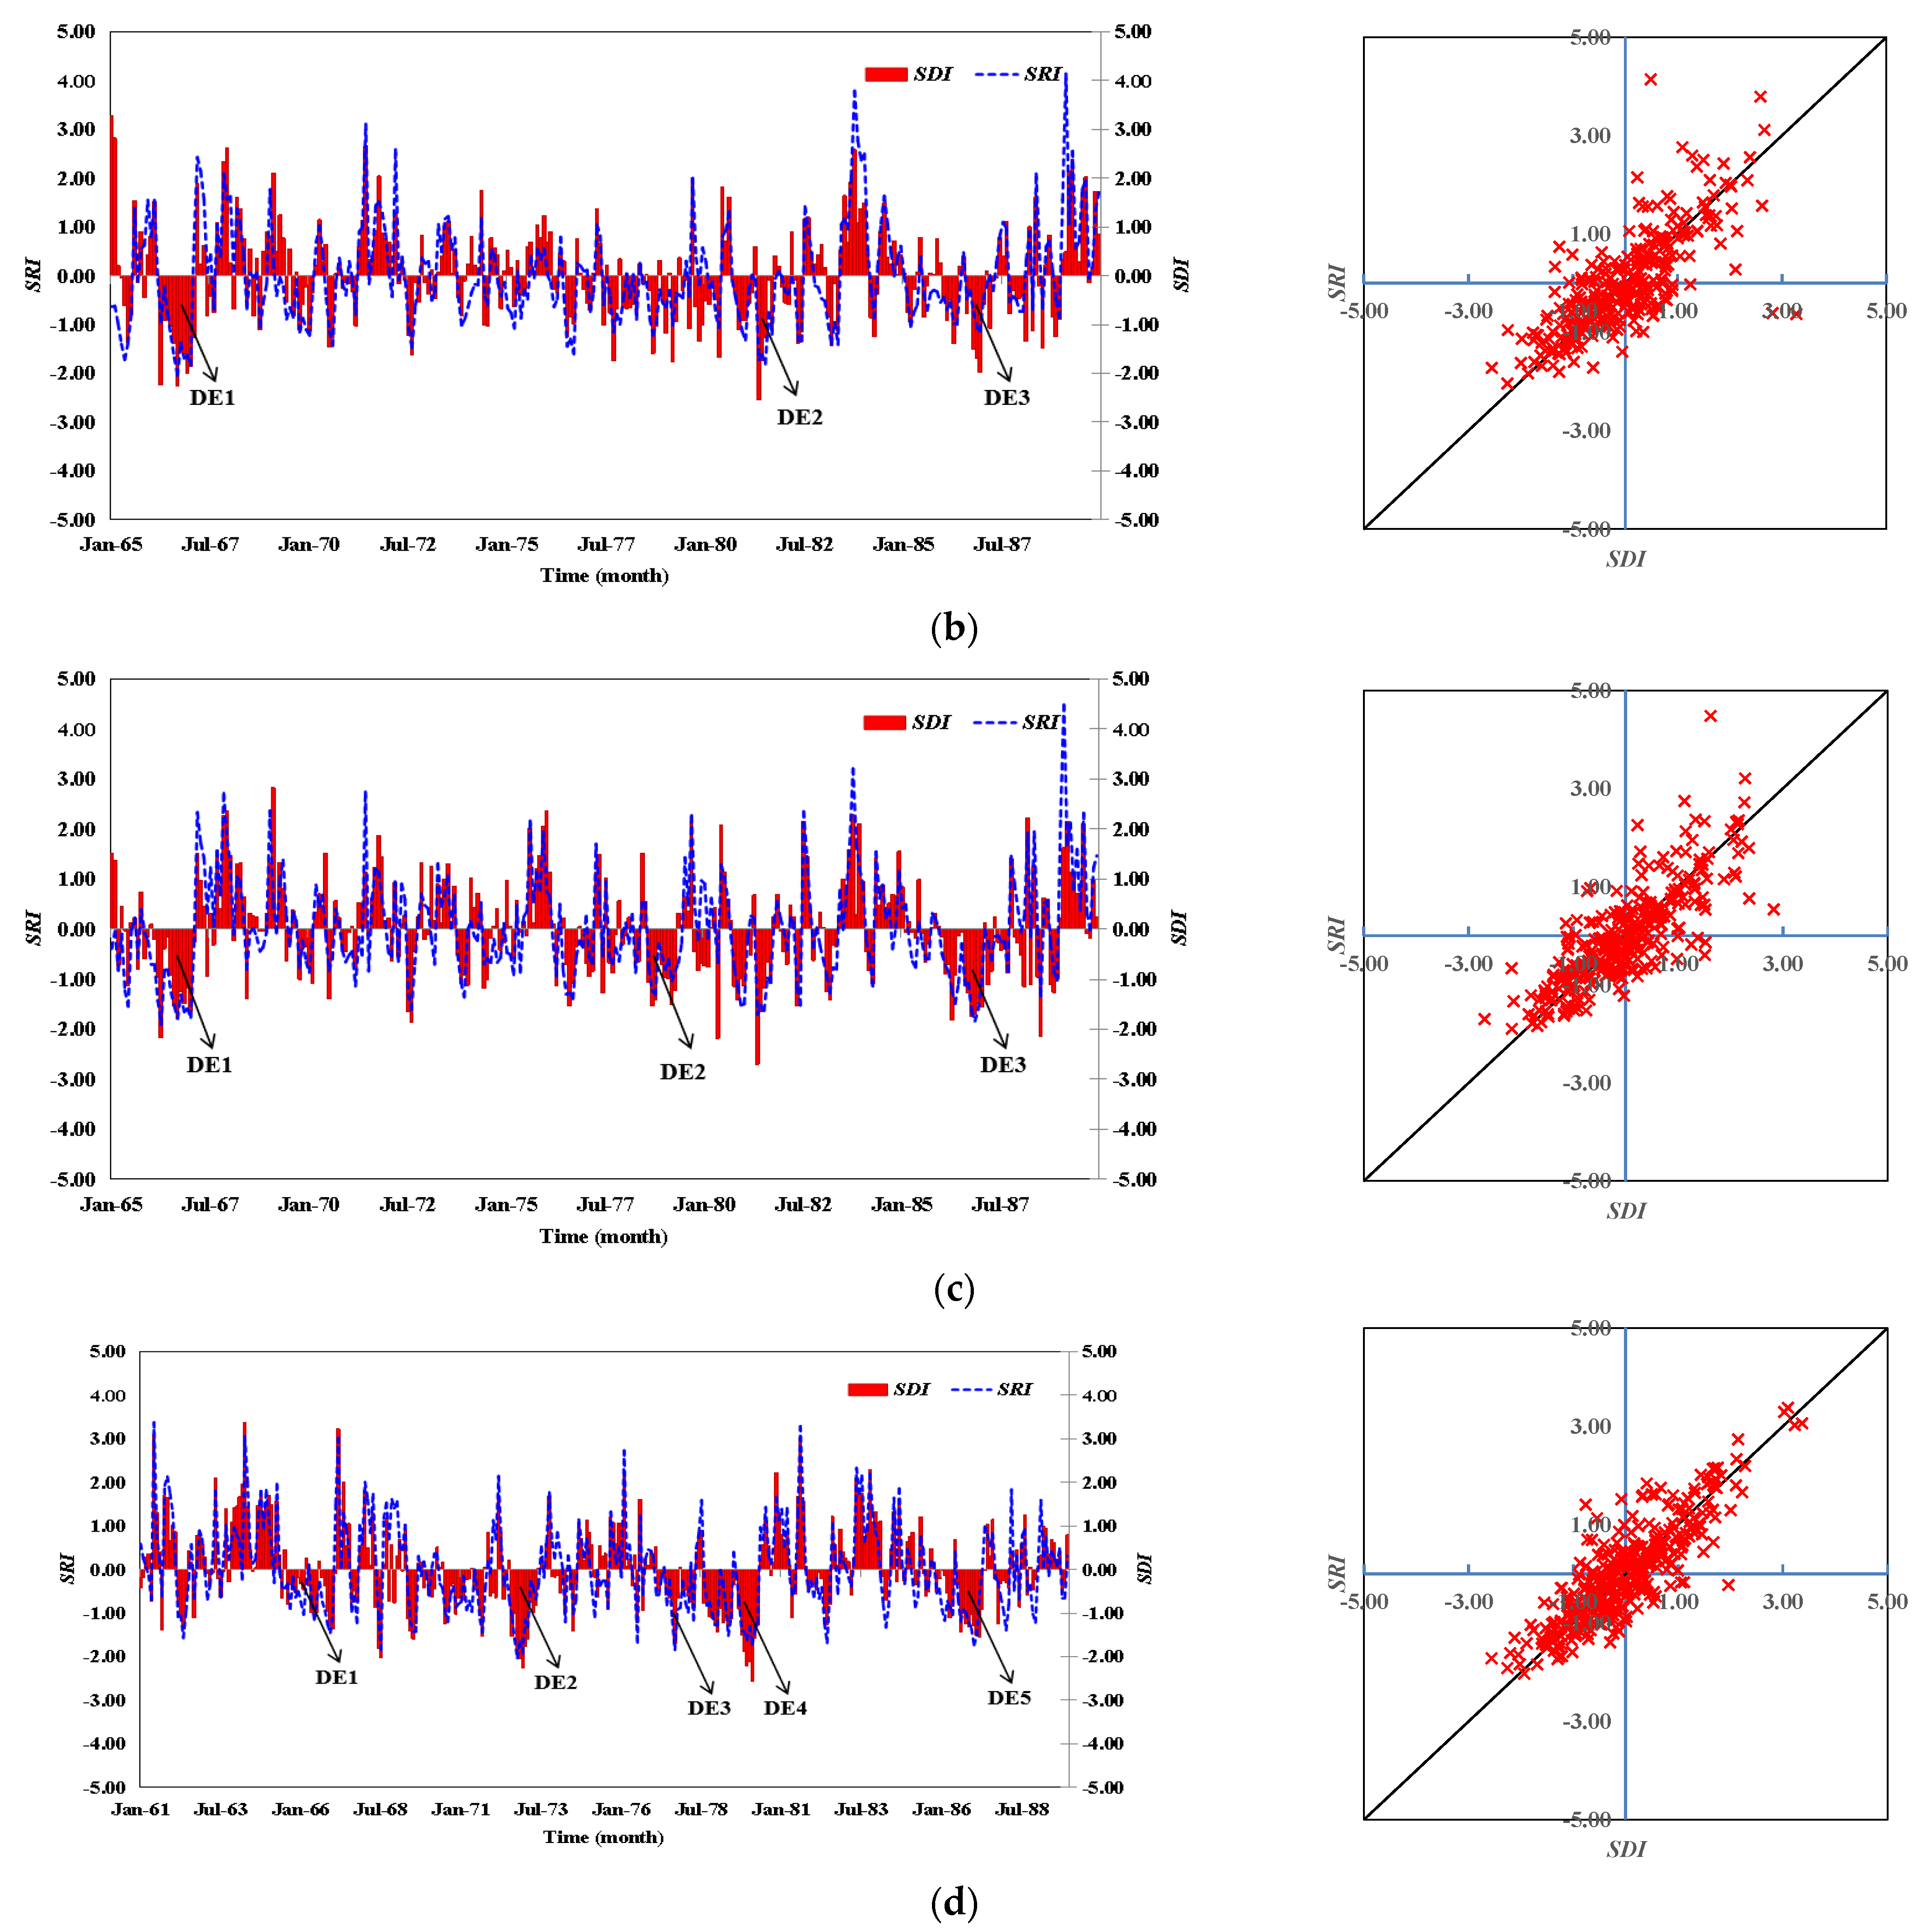
After estimating the PDF parameters of runoff distributions using the POME method, theoretical cumulative probabilities and standardized normal quantiles calculated from curve-fitted observed/simulated monthly runoff distributions for different months were obtained; therefore, the SDI and SRI series for each sub-basin were constructed.
Comparison between historical SDI and SRI series of the selected four sub-basins are shown in Figure 4. It can be found that the SRI series calculated using monthly runoff simulated by the modified TPMWB model capture several severe drought episodes, which is in accordance with the fluctuation of SDI, especially in dry months whose values are less than zero. For example, severe droughts (DEs) during 1966–1967, 1971–1972, 1973–1974, 1974–1975, 1976–1977, 1978–1979, and 1986–1987 at Sheqi can be recognized from both the SRI and the SDI series, together with identification of drought events during 1966–1967, 1980–1981, and 1986–1987 at Taikou, during 1965–1967, 1978–1979, and 1986–1987 at Wanyugou, during 1965–1967, 1972–1973, 1977–1978, 1979–1980, and 1986–1987 at Youshuijie.
4.2.2. Drought Characteristics (DC) Analysis
Comparisons of the relative bias (RB = [DCSRI − DCSDI]/DCSDI) of drought characteristics between the SRI and SDI are shown in Table 3. It is found that the occurrence of drought events estimated by SRI (43.13 times on average) is less frequent compared with that estimated by SDI (48.19 times on average), with a mean RB of −9.7%. We can also notice that the average drought duration (E[D]) for most sub-basins are, however, overestimated by the SRI as the mean E[D] calculated from SRI for the 30 sub-basins (4.03 months) is obviously longer than that from SDI (3.44 months) with a mean RB of 18.1%. Moreover, the maximum relative error of E[D] reaches 54.6%. This is similar for the average inter-arrival times (E[L]) with a mean and maximum RB of 11.7% and 41.5%, respectively. In fact, a few short and minor droughts would be removed, while several dependent droughts would be combined to a larger independent drought event when extracting drought events from the SRI series, since continuously simulated runoff series may eliminate the random fluctuations in observation series.
Differences between average drought severities (E[S]) extracted from SRI and SDI series for the 30 sub-basins are much smaller, with a mean RB of 1.2%, ranging from −16.4% to 15.1%. In contrast, the RBs between average drought intensities (E[I]) extracted from the two series of 30 sub-basins have a wider range, with a mean RB of −10.9%, ranging from −29.9% to 4.3%. Additionally, the variation ranges of RBs for the two characteristics are distributed not evenly in the two sides of the mean values.
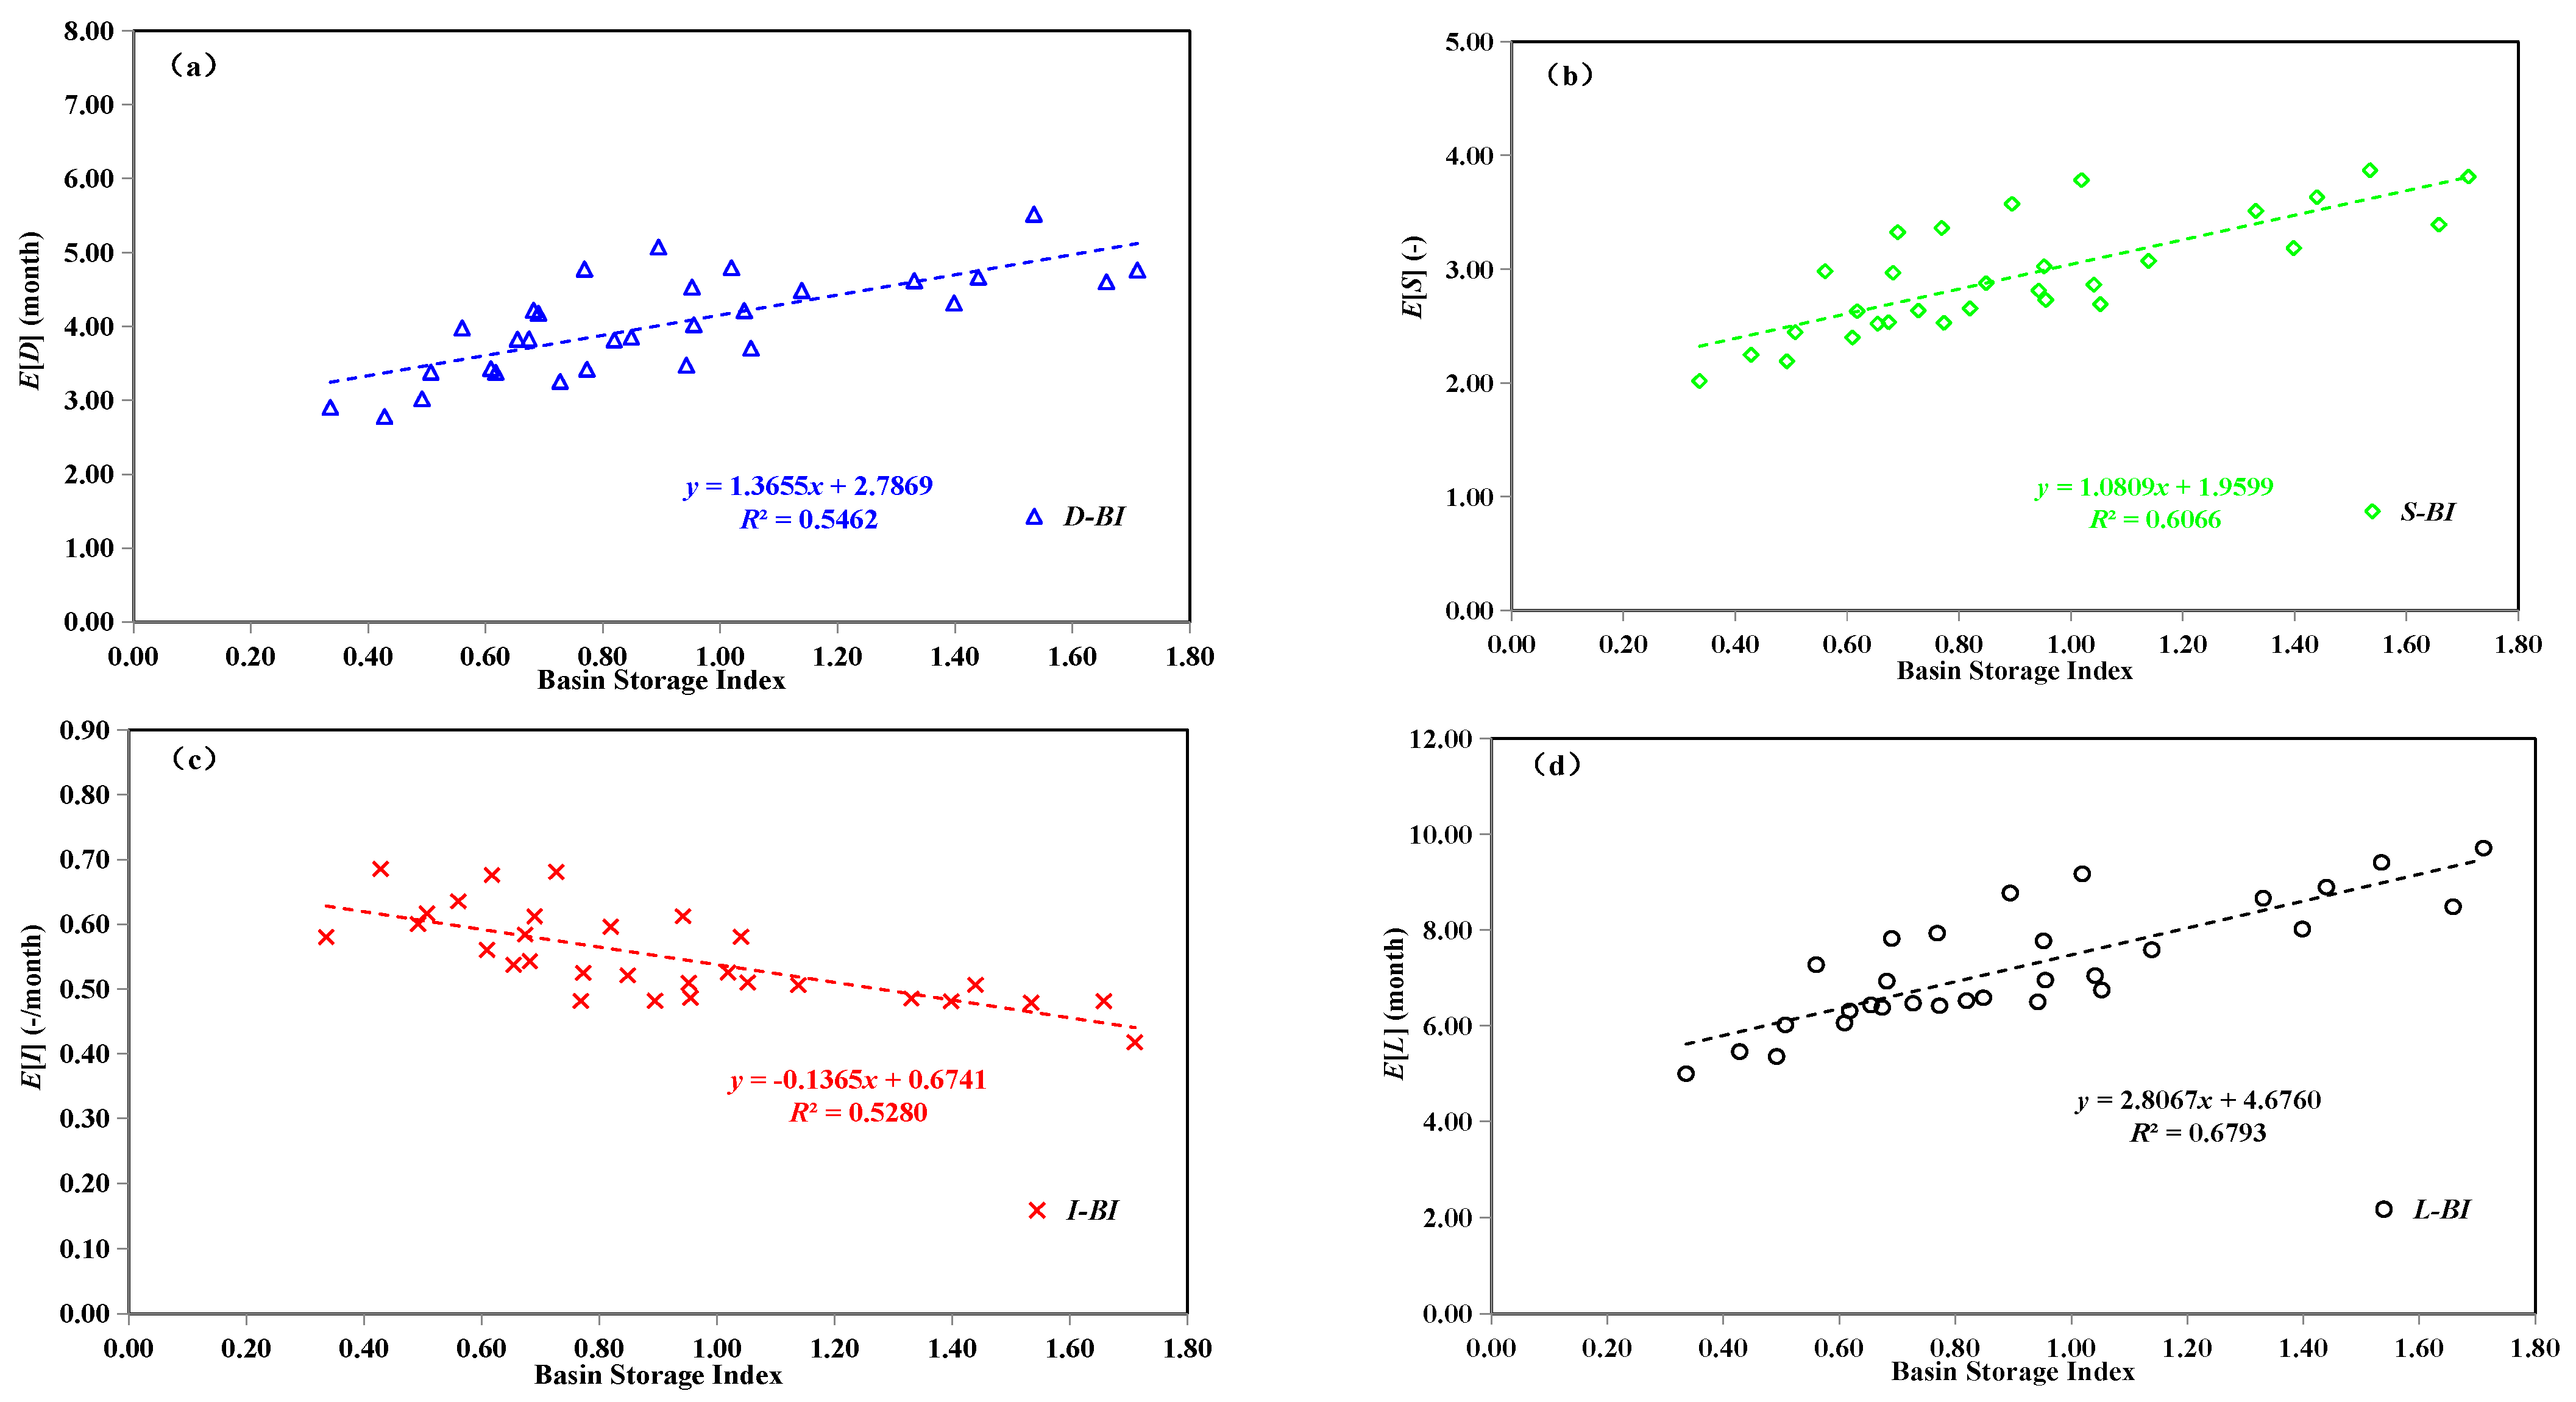
It can be inferred with a high degree of certainty that the difference between drought characteristics extracted from SRI and SDI series for the Han River sub-basins mainly depends on the simulation accuracy of the hydrological model. However, from the above comparison, we can conclude that the SRI has an acceptable performance in depicting regional drought evolution.
4.3. Impacts of Watershed Features on Drought Characteristics
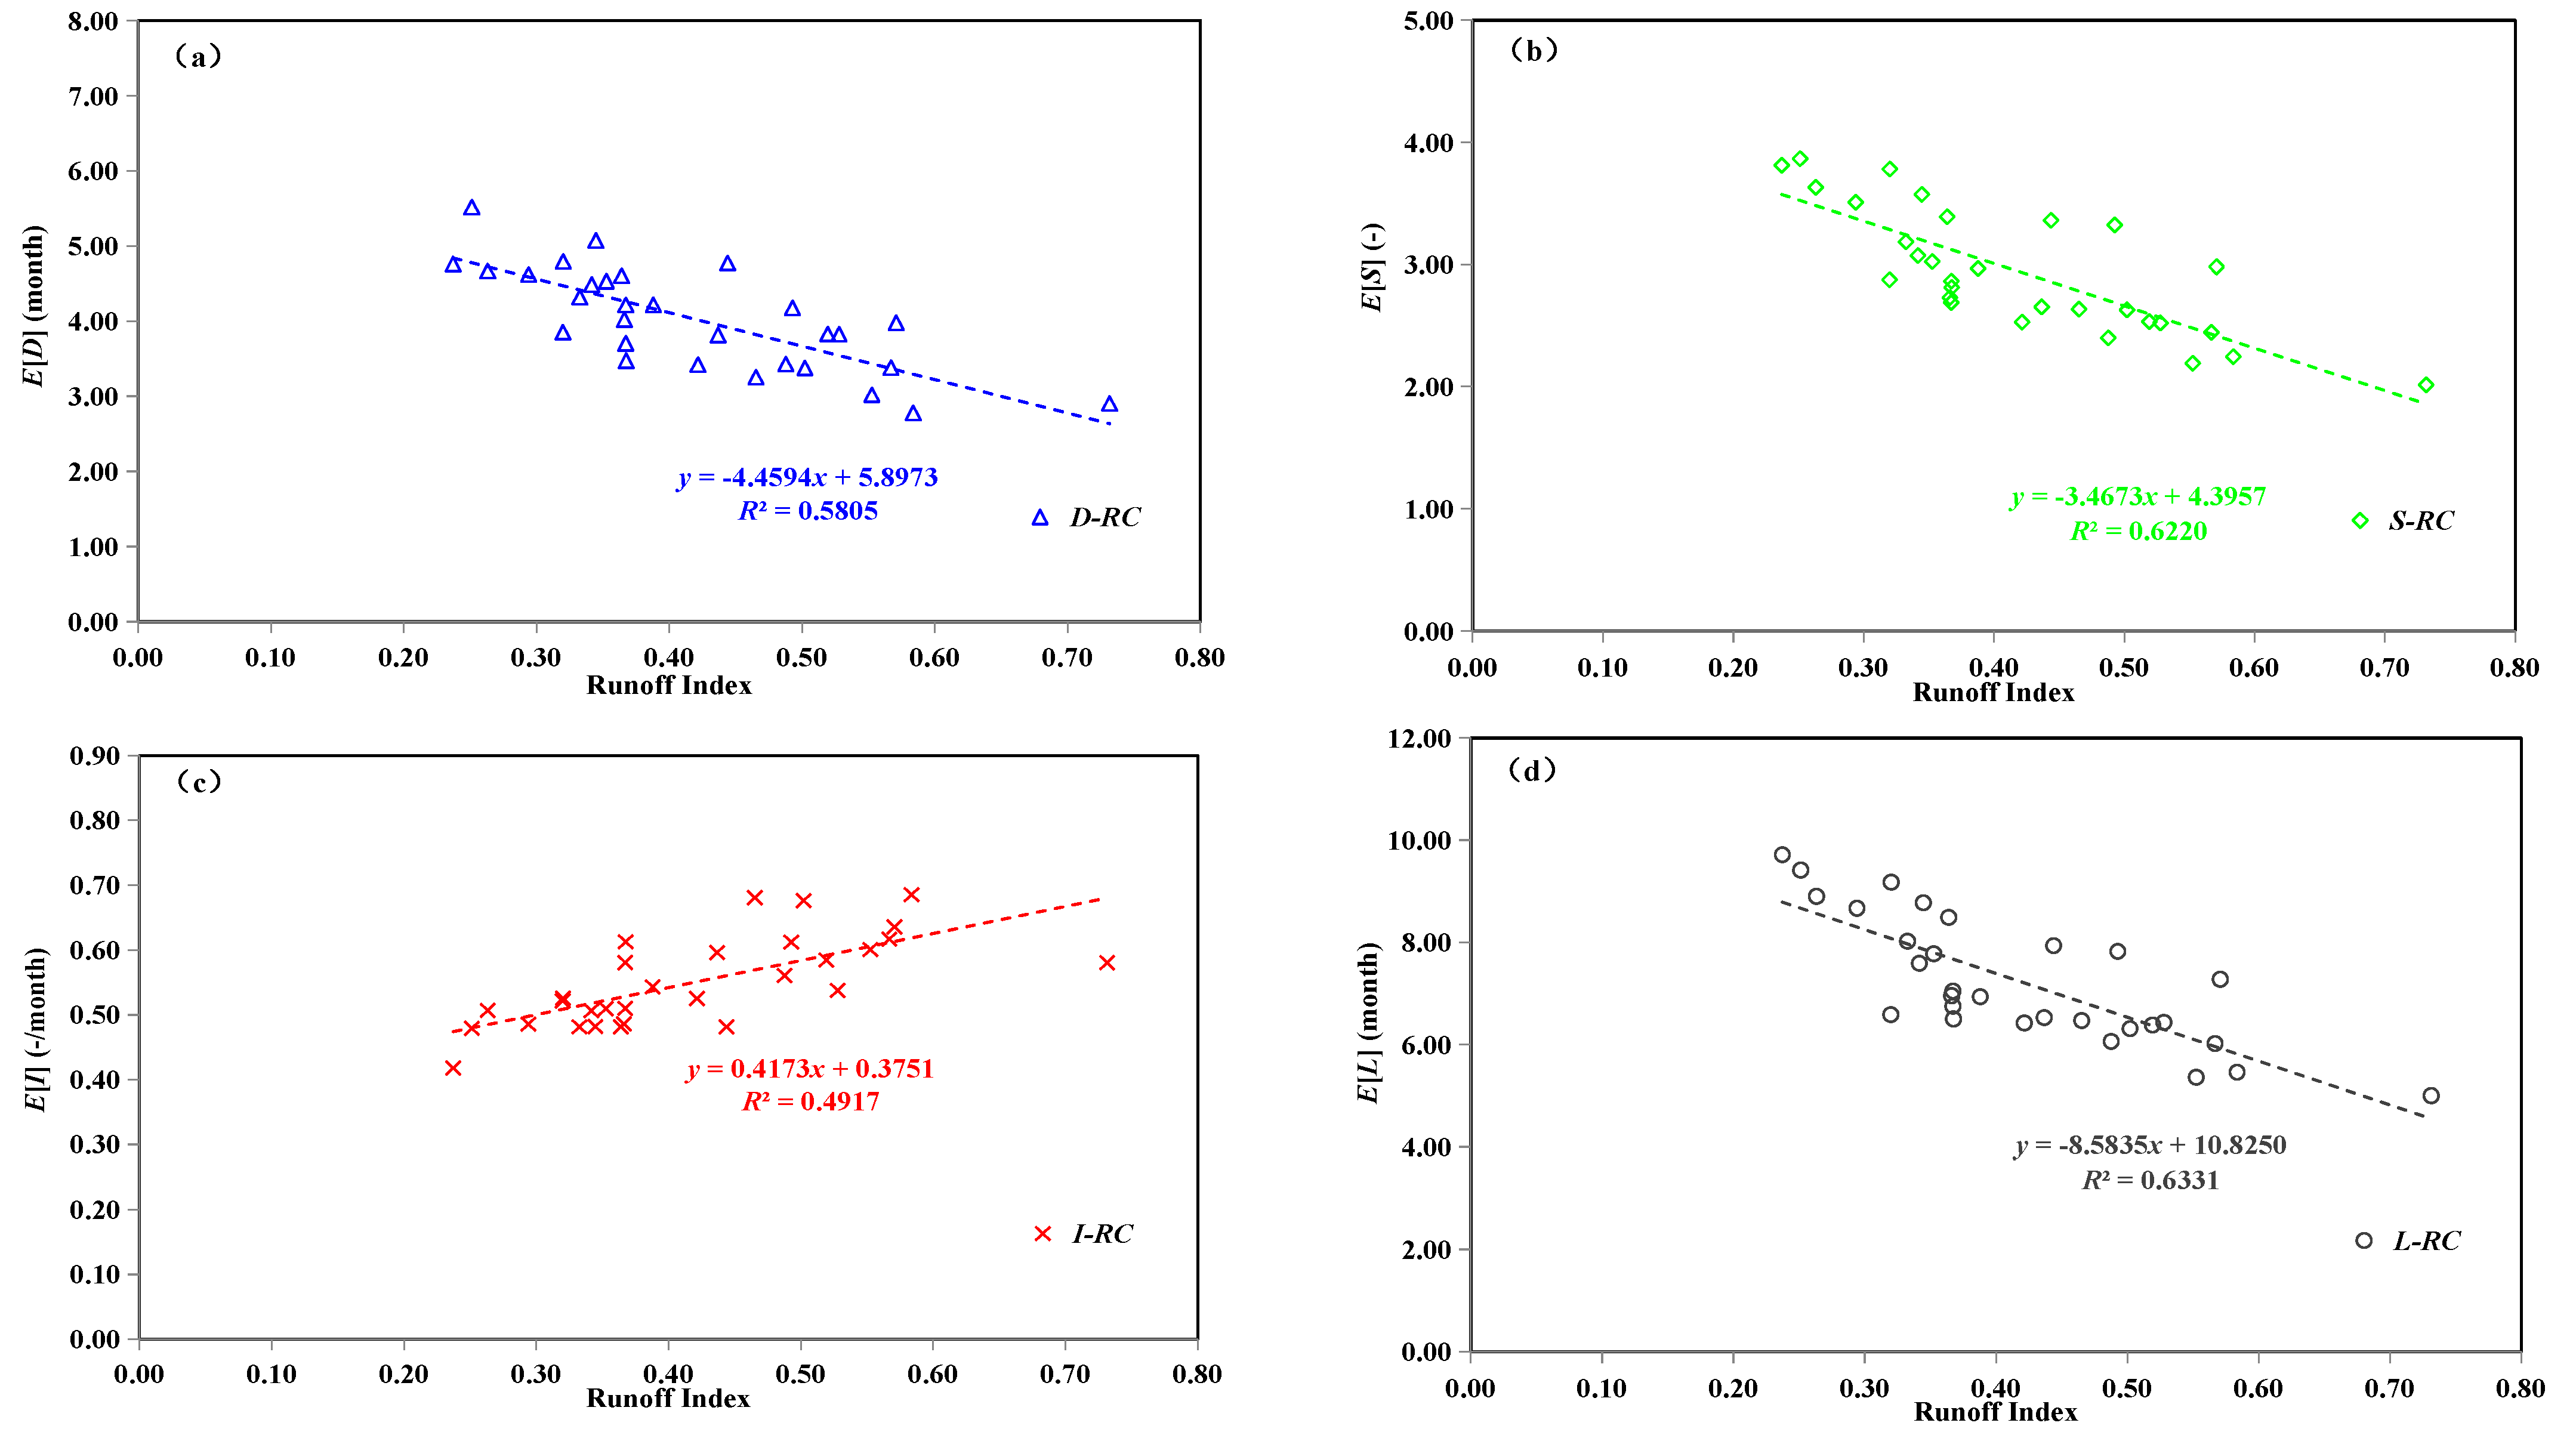
To further understand the relationship between the hydrological drought characteristics and the generalized climate and underlying surface parameters (i.e., AI, BI, C, RC) in each sub-basin, the correlation between each parameter and the average value of drought characteristics extracted from the SRI series is plotted in Figure 5, Figure 6, Figure 7 and Figure 8, respectively.
It can be deduced from the figures that, in general, correlations between the statistical characteristics of drought events such as E[D], E[S], E[I], and E[L], and the basin-scale climate and underlying surface factors in each basin are significant. Among the drought characteristics, the drought intensity S and the drought inter-arrival time L are greatly affected by the basin climate and the underlying surface factors; further, the drought duration D and the drought intensity I have relatively low but significant correlations with those climate and underlying surface parameters.
Among the characteristics of each watershed climate and the underlying surface factors, the BI that reflects the watershed’s ability to regulate and store runoff, and the Runoff Coefficient RC that comprehensively reflects the climate and underlying surface elements, are most closely related to each drought feature, and the correlations between the Aridity Index AI and drought characteristics are also significant. However, the correlation coefficients between the scaling conversion coefficient C and drought characteristics are relatively low. Since BI mainly reflects the water storage capacity of the basin, and RC is also related to the terrain, vegetation coverage, and land use of the basin, it can be speculated that the formation and development of hydrological drought in the Han River basin may be greatly affected by the underlying surface elements of the basin. However, the role of climate factors cannot be ignored.
The larger the Basin Storage Index BI, that is, the larger the ratio of maximum soil water storage capacity to annual runoff, the longer the average hydrological drought duration; the possible reason is that according to the relative equilibrium relationship between runoff and soil water storage in the model structure [Qt/NSt = (NSt − Qt)/SC], when the watershed is experiencing a meteorological drought, which begins with a decrease in precipitation or a rise in temperature, more available water is used to refill the water shortage in soil and underground aquifers, so hydrological droughts may last longer. The smaller the Runoff Coefficient RC, the less precipitation that can be transferred into runoff; when a meteorological drought occurs in the watershed, it would be necessary to accumulate precipitation not lower than the normal level for a long time to restore the hydrological drought to a normal level, resulting in longer drought duration. The larger the Aridity Index AI, the drier the watershed; when the temperature increases, the evaporation capacity increases and the precipitation decreases, thus the watershed with a large AI may further amplify the drought. Since parameter C is the ratio of Et/PEt, and the compression transformation tanh(Pt/PEt), when the precipitation is small and evapotranspiration is large, that is, in the dry period, in the basin with large C, the actual evapotranspiration accounts for a higher proportion of evapotranspiration capacity, which results in a relatively small runoff.
Many studies have revealed that S and D generally have a strong positive correlation [52,55]; thus, the degrees of correlation between S and each watershed climate/underlying surface factor are also similar to that of D. For example, in a watershed with a small RC, when experiencing a drought condition, more precipitation is needed in the future to restore the runoff from the deficit state to the normal level.
According to the definition of drought inter-arrival time L, two initiation moments of adjacent droughts consist of a drought event and a humid period. Then, a watershed with a larger BI, that is, better water storage capacity in both the groundwater aquifer and unsaturated zone, may have a better “memory” of the drought or wet state of the watershed, and is more inclined to maintain the current state possibly because of relatively slower water conversion, thus the return period of a drought event is longer.
Generally, when the correlation coefficients between other drought characteristics and the abovementioned watershed factors are positive, the correlation coefficients between drought intensity I and those watershed factors are negative, and vice versa. The possible reason is that I is not a drought feature directly obtained, but is calculated from S and D, which may neutralize the influence and uncertainty of various factors on S and D.
5. Conclusions
In this study, a modified two-parameter monthly water balance model was proposed based on the generalized proportionality hypothesis, and the monthly runoff process at the outlet of 30 sub-watersheds in the Han River basin was simulated using the precipitation and potential evapotranspiration data set. Drought events were extracted from the Standardized Runoff Index (SRI) series and several drought characteristics were calculated using Run Theory. Controlling factors for the evolution of hydrological drought in the Han River basin were explored through the correlation study between the drought characteristics and several dimensionless parameters that characterize the basin climate and underlying surface features. The main conclusions are summarized as follows:
(1) The modified monthly water balance model can simulate the monthly runoff process at the outlet of the watershed with acceptable accuracy, with an average NSE of 0.82 and mean RE of 10.7%. The model can thus provide a powerful tool for hydrological simulation in humid and semi-humid areas.
(2) All statistical characteristics of drought events such as drought duration, severity, intensity, and inter-arrival time, are strongly related to basin-scale climate and underlying surface factors. The formation and development of hydrological drought in the Han River basin may be mainly controlled by the underlying surface elements of the basin, and the role of climatic elements also needs to be considered.
Among currently available drought analysis methods, frequency analysis of hydrological variables is probably the most popular one, having the major advantages of simplicity, variable time scale, and few data requirements. Unfortunately, in many catchments, streamflow data used to calculate a probabilistic hydrological drought index are mainly influenced by human impacts or are not long enough to carry out frequency analysis [28], thus necessitating the development of drought indices that can deduce the hydrological drought condition from climatic and antecedent soil moisture deficit. By incorporating the underlying physical mechanisms in the choice and estimation of runoff distribution, together with the explicit use of climate factors and watershed characteristics, the derived distribution approach [60] seems to be a potential alternative in runoff frequency analysis and regional drought early-warning under changing environmental conditions.
Author Contributions
Conceptualization, S.G. and G.C.; methodology, X.H.; investigation, X.H. and C.J.; writing—original draft preparation, X.H. and N.G.; writing—review and editing, S.G. All authors have read and agreed to the published version of the manuscript.
Funding
This research was financially supported by the Visiting Researcher Fund Program of State Key Laboratory of Water Resources and Hydropower Engineering Science (Grant No. 2018SWG03) and the National Key Research and Development Program of China (Grant No. 2022YFC3200302).
Data Availability Statement
The data presented in this study are available on request from the corresponding author. The data are not publicly available due to privacy.
Acknowledgments
The authors are also very grateful to the Bureau of Hydrology of Changjiang (Yangtze River) Water Resources Commission of China for providing valuable climatic and hydrological data.
Conflicts of Interest
The authors declare no conflict of interest.
References
- Fleig, A.K.; Tallaksen, L.M.; Hisdal, H.; Demuth, S. A global evaluation of streamflow drought characteristics. Hydrol. Earth Syst. Sci. 2006, 10, 535–552. [Google Scholar] [CrossRef] [Green Version]
- Masih, I.; Maskey, S.; Mussá, F.E.F.; Trambauer, P. A review of droughts on the African continent: A geospatial and long-term perspective. Hydrol. Earth Syst. Sci. 2014, 18, 3635–3649. [Google Scholar] [CrossRef] [Green Version]
- Hong, X.; Guo, S.; Xiong, L.; Liu, Z. Spatial and temporal analysis of drought using entropy-based standardized precipitation index: A case study in Poyang Lake basin, China. Theor. Appl. Climat. 2015, 122, 543–556. [Google Scholar] [CrossRef]
- Rahmat, S.N.; Jayasuriya, N.; Bhuiyan, M. Assessing droughts using meteorological drought indices in Victoria, Australia. Hydrol. Res. 2015, 46, 463–476. [Google Scholar] [CrossRef]
- Portela, M.M.; Dos Santos, J.F.; Silva, A.T.; Benitez, J.B.; Frank, C.; Reichert, J.M. Drought analysis in southern Paraguay, Brazil and northern Argentina: Regionalization, occurrence rate and rainfall thresholds. Hydrol. Res. 2015, 46, 792–810. [Google Scholar] [CrossRef]
- de Freitas, G.N. São Paulo drought: Trends in streamflow and their relationship to climate and human-induced change in Cantareira watershed, Southeast Brazil. Hydrol. Res. 2015, 51, 750–767. [Google Scholar] [CrossRef]
- Zhang, R.; Chen, X.; Zhang, Z.; Shi, P. Evolution of hydrological drought under the regulation of two reservoirs in the headwater basin of the Huaihe River, China. Stoch. Environ. Res. Risk Assess. 2015, 29, 487–499. [Google Scholar] [CrossRef]
- Hong, X.; Guo, S.; Wang, L.; Yang, G.; Liu, D.; Guo, H.; Wang, J. Evaluating water supply risk in the middle and lower reaches of Hanjiang river basin based on an integrated optimal water resources allocation model. Water 2016, 8, 364. [Google Scholar] [CrossRef] [Green Version]
- Firoz, A.B.M.; Nauditt, A.; Fink, M.; Ribbe, L. Quantifying human impacts on hydrological drought using a combined modelling approach in a tropical river basin in central Vietnam. Hydrol. Earth Syst. Sci. 2018, 22, 547–565. [Google Scholar] [CrossRef] [Green Version]
- Tijdeman, E.; Hannaford, J.; Stahl, K. Human influences on streamflow drought characteristics in England and Wales. Hydrol. Earth Syst. Sci. 2018, 22, 1051–1064. [Google Scholar] [CrossRef]
- Fan, K.; Zhang, Q.; Gu, X.; Singh, V.P.; Xu, C.Y.; Shen, Z.; Wang, G. Global soil moisture drought identification and responses to natural and anthropogenic forcings. J. Hydrol. 2022, 610, 127993. [Google Scholar] [CrossRef]
- Mishra, A.K.; Singh, V.P. Drought modeling—A review. J. Hydrol. 2011, 403, 157–175. [Google Scholar] [CrossRef]
- McKee, T.B.; Doesken, N.J.; Kleist, J. The relationship of drought frequency and duration to time scales. In Proceedings of the 8th Conference on Applied Climatology, Anaheim, CA, USA, 17–22 January 1993. [Google Scholar]
- Tsakiris, G.; Vangelis, H. Establishing a drought index incorporating evapotranspiration. Euro. Water 2005, 9, 3–11. [Google Scholar]
- Vicente-Serrano, S.M.; Beguería, S.; López-Moreno, J.I. A multiscalar drought index sensitive to global warming: The standardized precipitation evapotranspiration index. J. Clim. 2010, 23, 1696–1718. [Google Scholar] [CrossRef] [Green Version]
- Mishra, A.K.; Singh, V.P. A review of drought concepts. J. Hydrol. 2010, 391, 202–216. [Google Scholar] [CrossRef]
- Fischer, T.; Gemmer, M.; Su, B.; Scholten, T. Hydrological long-term dry and wet periods in the Xijiang River basin, South China. Hydrol. Earth Syst. Sci. 2013, 17, 135–148. [Google Scholar] [CrossRef] [Green Version]
- Hong, X.; Guo, S.; Zhou, Y.; Xiong, L. Uncertainties in assessing hydrological drought using streamflow drought index for the upper Yangtze River basin. Stoch. Environ. Res. Risk Assess. 2015, 29, 1235–1247. [Google Scholar] [CrossRef]
- Sun, X.; Li, Z.; Tian, Q. Assessment of hydrological drought based on nonstationary runoff data. Hydrol. Res. 2020, 51, 894–910. [Google Scholar] [CrossRef]
- Yue, S.; Sheng, X.; Yang, F. Spatiotemporal evolution and meteorological triggering conditions of hydrological drought in the Hun River basin, NE China. Nat. Hazards Earth Syst. Sci. 2022, 22, 995–1014. [Google Scholar] [CrossRef]
- Nalbantis, I.; Tsakiris, G. Assessment of hydrological drought revisited. Water Resour. Manag. 2009, 23, 881–897. [Google Scholar] [CrossRef]
- Vicente-Serrano, S.M.; López-Moreno, J.I.; Beguería, S.; Lorenzo-Lacruz, J.; Azorin-Molina, C.; Morán-Tejeda, E. Accurate computation of a streamflow drought index. J. Hydrol. Eng. 2012, 17, 318–332. [Google Scholar] [CrossRef]
- Bloomfield, J.P.; Marchant, B.P. Analysis of groundwater drought building on the standardized precipitation index approach. Hydrol. Earth Syst. Sci. 2013, 17, 4769–4787. [Google Scholar] [CrossRef] [Green Version]
- Waseem, M.; Ajmal, M.; Kim, T.W. Development of a new composite drought index for multivariate drought assessment. J. Hydrol. 2015, 527, 30–37. [Google Scholar] [CrossRef]
- Zhang, Y.; Huang, S.; Huang, Q.; Leng, G.; Wang, H.; Wang, L. Assessment of drought evolution characteristics based on a nonparametric and trivariate integrated drought index. J. Hydrol. 2019, 579, 124230. [Google Scholar] [CrossRef]
- Palmer, W.C. Meteorological Drought; US Department of Commerce, Weather Bureau: Washington, DC, USA, 1965. [Google Scholar]
- Shukla, S.; Wood, A.W. Use of a standardized runoff index for characterizing hydrologic drought. Geophys. Res. Lett. 2008, 35, L02405. [Google Scholar] [CrossRef] [Green Version]
- Staudinger, M.; Stahl, K.; Seibert, J. A drought index accounting for snow. Water Resour. Res. 2014, 50, 7861–7872. [Google Scholar] [CrossRef]
- Xiong, L.; Guo, S. A two-parameter monthly water balance model and its application. J. Hydrol. 1999, 216, 111–123. [Google Scholar] [CrossRef]
- Guo, S.; Wang, J.; Xiong, L.; Ying, A.; Li, D. A macro-scale and semi-distributed monthly water balance model to predict climate change impacts in China. J. Hydrol. 2002, 268, 1–15. [Google Scholar] [CrossRef]
- Mouelhi, S.; Michel, C.; Perrin, C.; Andréassian, V. Stepwise development of a two-parameter monthly water balance model. J. Hydrol. 2006, 318, 200–214. [Google Scholar] [CrossRef]
- Zhang, L.; Potter, N.; Hickel, K.; Zhang, Y.; Shao, Q.X. Water balance modeling over variable time scales based on the Budyko framework-Model development and testing. J. Hydrol. 2008, 360, 117–131. [Google Scholar] [CrossRef]
- Wang, Q.; Pagano, T.C.; Zhou, S.; Hapuarachchi, H.A.P.; Zhang, L.; Robertson, D.E. Monthly versus daily water balance models in simulating monthly runoff. J. Hydrol. 2011, 404, 166–175. [Google Scholar] [CrossRef]
- Vandewiele, G.L.; Xu, C.Y.; Win, N.L. Methodology and comparative study of monthly water balance models in Belgium, China and Burma. J. Hydrol. 1992, 134, 315–347. [Google Scholar] [CrossRef]
- Xu, C.Y.; Singh, V.P. A review on monthly water balance models for water resources investigations. Water Resour. Manag. 1998, 12, 20–50. [Google Scholar] [CrossRef]
- Vasiliades, L.; Loukas, A.; Liberis, N. A water balance derived drought index for Pinios River basin, Greece. Water Resour. Manag. 2011, 25, 1087–1101. [Google Scholar] [CrossRef]
- Li, S.; Xiong, L.; Dong, L.; Zhang, J. Effects of the Three Gorges Reservoir on the hydrological droughts at the downstream Yichang station during 2003–2011. Hydrol. Process. 2013, 27, 3981–3993. [Google Scholar] [CrossRef]
- Wang, W.; Wei, J.; Shao, Q.X.; Xing, W.; Yong, B.; Yu, Z.; Jiao, X. Spatial and temporal variations in hydro-climatic variables and runoff in response to climate change in the Luanhe River basin, China. Stoch. Environ. Res. Risk Assess. 2015, 29, 1117–1133. [Google Scholar] [CrossRef]
- Hu, Q.; Wang, Y.; Liu, K.; Wang, Z. Monthly runoff simulation based on improved two-parameter monthly water volume balance model. J. Hohai Univ. Nat. Sci. 2007, 35, 638–642. (In Chinese) [Google Scholar]
- Harman, C.; Troch, P.A. What makes Darwinian hydrology “Darwinian”? Asking a different kind of question about landscapes. Hydrol. Earth Syst. Sci. 2014, 18, 417–433. [Google Scholar] [CrossRef] [Green Version]
- Wang, D.B.; Tang, Y. A one-parameter Budyko model for water balance captures emergent behavior in Darwinian hydrologic models. Geophys. Res. Lett. 2014, 41, 4569–4577. [Google Scholar] [CrossRef] [Green Version]
- Mo, K.C. Model-based drought indices over the United States. J. Hydrometeorol. 2008, 9, 1212–1230. [Google Scholar] [CrossRef]
- Wang, D.B.; Hejazi, M.; Cai, X.M.; Valocchi, A.J. Climate change impact on meteorological, agricultural, and hydrological drought in central Illinois. Water Resour. Res. 2011, 47, W09527. [Google Scholar] [CrossRef] [Green Version]
- Leng, G.; Tang, Q.; Rayburg, S. Climate change impacts on meteorological, agricultural, and hydrological droughts in China. Global Planet. Chang. 2015, 126, 23–34. [Google Scholar] [CrossRef]
- Guo, Y.; Huang, S.; Huang, Q.; Leng, G.; Fang, W.; Wang, L.; Wang, H. Propagation thresholds of meteorological drought for triggering hydrological drought at various levels. Sci. Total Environ. 2020, 712, 136502. [Google Scholar] [CrossRef] [PubMed]
- Wang, T.; Tu, X.; Singh, V.P.; Chen, X.; Lin, K. Global data assessment and analysis of drought characteristics based on CMIP6. J. Hydrol. 2021, 596, 126091. [Google Scholar] [CrossRef]
- Jaynes, E.T. Information theory and statistical mechanics. Phys. Rev. 1957, 106, 620–630. [Google Scholar] [CrossRef]
- Jaynes, E.T. Information theory and statistical mechanics, II. Phys. Rev. 1957, 108, 171–190. [Google Scholar] [CrossRef]
- Shannon, C.E. The mathematical theory of communications. Bell Syst. Tech. J. 1948, 27, 379–423. [Google Scholar] [CrossRef] [Green Version]
- Smith, J.E. Moment methods for decision analysis. Manag. Sci. 1993, 39, 340–358. [Google Scholar] [CrossRef]
- Hao, Z.; Singh, V.P. Entropy-based method for extreme rainfall analysis in Texas. J. Geophys. Res. Atmos. 2013, 118, 263–273. [Google Scholar] [CrossRef]
- Hao, Z.; Singh, V.P. Entropy-based method for bivariate drought analysis. J. Hydrol. Eng. 2013, 18, 780–786. [Google Scholar] [CrossRef]
- Mead, L.R.; Papanicolaou, N. Maximum entropy in the problem of moments. J. Math. Phys. 1984, 25, 2404–2417. [Google Scholar] [CrossRef] [Green Version]
- Zuo, D.D.; Hou, W.; Yan, P.C.; Feng, T.C. Research on drought in southwest China based on the theory of run and two-dimensional joint distribution theory. Acta Phys. Sin. 2014, 63, 230204. [Google Scholar]
- Wu, R.; Zhang, J.; Bao, Y.; Guo, E. Run theory and copula-based drought risk analysis for Songnen Grassland in Northeastern China. Sustainability 2019, 11, 6032. [Google Scholar] [CrossRef]
- Malagò, A.; Bouraoui, F.; De Roo, A. Diagnosis and treatment of the SWAT hydrological response using the budyko framework. Sustainability 2018, 10, 1373. [Google Scholar] [CrossRef] [Green Version]
- Chen, H.; Guo, S.; Xu, C.Y.; Singh, V.P. Historical temporal trends of hydro-climatic variables and runoff response to climate variability and their relevance in water resource management in the Hanjiang basin. J. Hydrol. 2007, 344, 171–184. [Google Scholar] [CrossRef]
- Chen, H.; Guo, J.; Xiong, W.; Guo, S.; Xu, C.Y. Downscaling GCMs using the Smooth Support Vector Machine method to predict daily precipitation in the Hanjiang Basin. Adv. Atmos. Sci. 2010, 27, 274–284. [Google Scholar] [CrossRef]
- Xiong, L.; Yu, K.; Gottschalk, L. Estimation of the distribution of annual runoff from climatic variables using copulas. Water Resour. Res. 2014, 50, 7134–7152. [Google Scholar] [CrossRef]
- Eagleson, P.S. Dynamics of flood frequency. Water Resour. Res. 1972, 8, 878–898. [Google Scholar] [CrossRef]
Figure 1.
Definition of drought characteristics using Run Theory.

Figure 2.
Topography and hydrological stations in the Han River basin.

Figure 3.
Observed and simulated monthly runoff hydrographs at: (a) Sheqi; (b) Taikou; (c) Wanyugou; (d) Youshuijie.
Figure 3.
Observed and simulated monthly runoff hydrographs at: (a) Sheqi; (b) Taikou; (c) Wanyugou; (d) Youshuijie.

Figure 4.
Standardized hydrological index series calculated from simulated runoff (SRI) and observed streamflow (SDI) at: (a) Sheqi; (b) Taikou; (c) Wanyugou; (d) Youshuijie.
Figure 4.
Standardized hydrological index series calculated from simulated runoff (SRI) and observed streamflow (SDI) at: (a) Sheqi; (b) Taikou; (c) Wanyugou; (d) Youshuijie.


Figure 5.
Correlation between Aridity Index and (a) E[D]; (b) E[S]; (c) E[I]; (d) E[L].

Figure 6.
Correlation between Basin Storage Index and (a) E[D]; (b) E[S]; (c) E[I]; (d) E[L].

Figure 7.
Correlation between C and (a) E[D]; (b) E[S]; (c) E[I]; (d) E[L].

Figure 8.
Correlation between Runoff Coefficient and (a) E[D]; (b) E[S]; (c) E[I]; (d) E[L].


Table 1.
Data information for the studied sub-basins.
| No. | Watershed | Area (km2) | Data Period | P (mm∙yr−1) | PE (mm∙yr−1) | Q (mm∙yr−1) | AI (-) | RC (-) |
|---|---|---|---|---|---|---|---|---|
| 1 | Baitugang | 1134 | 1963–1989 | 923 | 864 | 389 | 0.94 | 0.42 |
| 2 | Baiyan | 690 | 1965–1989 | 779 | 708 | 286 | 0.91 | 0.37 |
| 3 | Bandian | 425 | 1955–1989 | 742 | 896 | 176 | 1.21 | 0.24 |
| 4 | Caodian | 683 | 1960–1987 | 1142 | 1205 | 443 | 1.06 | 0.39 |
| 5 | Chadianzi | 1683 | 1967–1989 | 868 | 624 | 319 | 0.72 | 0.37 |
| 6 | Chaiping | 2364 | 1969–1989 | 845 | 880 | 369 | 1.04 | 0.44 |
| 7 | Dazhuhe | 2651 | 1968–1989 | 1229 | 735 | 899 | 0.60 | 0.73 |
| 8 | Guihuayuan | 1275 | 1964–1989 | 859 | 721 | 446 | 0.84 | 0.52 |
| 9 | Houhui | 816 | 1958–1989 | 902 | 849 | 318 | 0.94 | 0.35 |
| 10 | Huayuan | 2601 | 1964–1987 | 1113 | 1207 | 356 | 1.08 | 0.32 |
| 11 | Jiajiafang | 1281 | 1960–1989 | 839 | 885 | 279 | 1.05 | 0.33 |
| 12 | Jiangwan | 781 | 1959–1989 | 849 | 890 | 309 | 1.05 | 0.36 |
| 13 | Kouzihe | 421 | 1963–1989 | 863 | 865 | 316 | 1.00 | 0.37 |
| 14 | Lianghekou | 2816 | 1967–1989 | 889 | 716 | 438 | 0.81 | 0.49 |
| 15 | Miping | 1404 | 1967–1989 | 794 | 875 | 209 | 1.10 | 0.26 |
| 16 | Nankuanping | 3936 | 1965–1989 | 773 | 869 | 264 | 1.12 | 0.34 |
| 17 | Nanshahe | 243 | 1967–1989 | 1208 | 585 | 705 | 0.48 | 0.58 |
| 18 | Pingshi | 748 | 1960–1989 | 975 | 1010 | 336 | 1.04 | 0.34 |
| 19 | Qingfeng | 2082 | 1963–1989 | 931 | 875 | 298 | 0.94 | 0.32 |
| 20 | Qingniwan | 1377 | 1965–1989 | 798 | 869 | 293 | 1.09 | 0.37 |
| 21 | Shengxiancun | 2143 | 1961–1988 | 890 | 738 | 414 | 0.83 | 0.47 |
| 22 | Sheqi | 1044 | 1966–1989 | 796 | 981 | 200 | 1.23 | 0.25 |
| 23 | Shuhe | 581 | 1969–1989 | 881 | 851 | 391 | 0.97 | 0.44 |
| 24 | Taikou | 2073 | 1965–1989 | 883 | 888 | 466 | 1.01 | 0.53 |
| 25 | Tiesuoguan | 433 | 1966–1989 | 1106 | 632 | 611 | 0.57 | 0.55 |
| 26 | Wanyugou | 560 | 1965–1989 | 1013 | 996 | 494 | 0.98 | 0.49 |
| 27 | Wuguan | 724 | 1959–1989 | 772 | 888 | 227 | 1.15 | 0.29 |
| 28 | Xianhekou | 772 | 1966–1989 | 974 | 733 | 489 | 0.75 | 0.50 |
| 29 | Xinzhou | 4660 | 1964–1989 | 1055 | 830 | 598 | 0.79 | 0.57 |
| 30 | Youshuijie | 911 | 1961–1989 | 939 | 734 | 536 | 0.78 | 0.57 |
Table 2.
Calibrated TPMWB model parameters and performance criteria for the studied sub-basins.
| No. | Watershed | C (-) | SC (-) | NSE (%) | RE (%) |
|---|---|---|---|---|---|
| 1 | Baitugang | 0.94 | 300.63 | 0.83. | 10.4 |
| 2 | Baiyan | 0.98 | 301.01 | 0.75 | 12.8 |
| 3 | Bandian | 1.14 | 301.11 | 0.80 | 4.1 |
| 4 | Caodian | 0.85 | 302.08 | 0.84 | 15.5 |
| 5 | Chadianzi | 1.23 | 300.61 | 0.85 | 21.9 |
| 6 | Chaiping | 0.76 | 302.35 | 0.86 | 10.2 |
| 7 | Dazhuhe | 0.36 | 301.84 | 0.84 | 7.7 |
| 8 | Guihuayuan | 0.62 | 300.63 | 0.74 | 11.0 |
| 9 | Houhui | 1.03 | 302.78 | 0.82 | 7.8 |
| 10 | Huayuan | 0.95 | 302.08 | 0.81 | 15.2 |
| 11 | Jiajiafang | 1.03 | 390.16 | 0.80 | 1.8 |
| 12 | Jiangwan | 1.00 | 512.38 | 0.78 | 2.7 |
| 13 | Kouzihe | 1.02 | 301.83 | 0.86 | 14.4 |
| 14 | Lianghekou | 1.22 | 302.35 | 0.83 | 18.7 |
| 15 | Miping | 1.15 | 300.93 | 0.81 | 5.7 |
| 16 | Nankuanping | 0.93 | 300.63 | 0.84 | 12.2 |
| 17 | Nanshahe | 0.91 | 301.81 | 0.86 | 17.8 |
| 18 | Pingshi | 1.00 | 300.63 | 0.75 | 13.1 |
| 19 | Qingfeng | 1.09 | 303.66 | 0.80 | 2.1 |
| 20 | Qingniwan | 0.90 | 305.02 | 0.85 | 12.3 |
| 21 | Shengxiancun | 0.86 | 301.01 | 0.76 | 30.4 |
| 22 | Sheqi | 1.13 | 306.95 | 0.88 | 5.9 |
| 23 | Shuhe | 0.89 | 300.63 | 0.86 | 4.6 |
| 24 | Taikou | 0.73 | 305.02 | 0.81 | 1.2 |
| 25 | Tiesuoguan | 0.85 | 300.63 | 0.86 | 22.1 |
| 26 | Wanyugou | 0.75 | 300.93 | 0.86 | 5.8 |
| 27 | Wuguan | 1.09 | 302.08 | 0.82 | 6.7 |
| 28 | Xianhekou | 0.67 | 302.08 | 0.81 | 13.2 |
| 29 | Xinzhou | 0.69 | 303.13 | 0.82 | 3.8 |
| 30 | Youshuijie | 0.65 | 300.31 | 0.86 | 10.6 |
| Ave. | 0.91 | 311.91 | 0.82 | 10.7 | |
| Min. | 0.36 | 300.31 | 0.74 | 1.2 | |
| Max. | 1.23 | 512.38 | 0.88 | 30.4 | |
Table 3.
Comparisons of the statistical drought characteristics for the sub-basins.
| No. | Watershed | Number (Times) | E[D] (Month) | E[S] (-) | E[I] (-/Month) | E[L] (Month) | ||||||||||
|---|---|---|---|---|---|---|---|---|---|---|---|---|---|---|---|---|
| SRI | SDI | RB(%) | SRI | SDI | RB(%) | SRI | SDI | RB(%) | SRI | SDI | RB(%) | SRI | SDI | RB(%) | ||
| 1 | Baitugang | 50 | 53 | −5.6 | 3.42 | 3.29 | 4.0 | 2.53 | 2.34 | 8.0 | 0.53 | 0.67 | −21.3 | 6.42 | 6.04 | 6.3 |
| 2 | Baiyan | 44 | 48 | −8.8 | 3.70 | 3.23 | 14.6 | 2.69 | 2.40 | 11.9 | 0.51 | 0.64 | −20.6 | 6.75 | 6.13 | 10.0 |
| 3 | Bandian | 42 | 48 | −12.9 | 4.76 | 4.94 | −3.6 | 3.81 | 4.28 | −10.9 | 0.42 | 0.50 | −15.9 | 9.71 | 8.56 | 13.5 |
| 4 | Caodian | 46 | 58 | −20.2 | 4.22 | 3.15 | 33.7 | 2.97 | 2.86 | 3.8 | 0.54 | 0.55 | −0.5 | 6.93 | 5.53 | 25.5 |
| 5 | Chadianzi | 40 | 40 | 0.0 | 3.48 | 3.68 | −5.6 | 2.81 | 2.75 | 2.2 | 0.61 | 0.59 | 3.8 | 6.50 | 6.83 | −4.8 |
| 6 | Chaiping | 38 | 34 | 11.8 | 3.82 | 4.09 | −6.7 | 2.65 | 3.03 | −12.3 | 0.60 | 0.62 | −4.1 | 6.53 | 7.18 | −9.1 |
| 7 | Dazhuhe | 52 | 52 | 0.0 | 2.90 | 2.70 | 7.5 | 2.02 | 1.94 | 4.2 | 0.58 | 0.66 | −12.1 | 5.00 | 4.98 | 0.4 |
| 8 | Guihuayuan | 47 | 51 | −7.9 | 3.83 | 2.83 | 35.5 | 2.53 | 2.35 | 7.7 | 0.58 | 0.71 | −17.7 | 6.38 | 6.03 | 5.9 |
| 9 | Houhui | 49 | 59 | −16.4 | 4.53 | 3.61 | 25.4 | 3.02 | 3.27 | −7.5 | 0.51 | 0.61 | −16.3 | 7.78 | 6.48 | 20.0 |
| 10 | Huayuan | 41 | 44 | −7.7 | 3.85 | 3.38 | 14.1 | 2.88 | 3.05 | −5.7 | 0.52 | 0.50 | 4.3 | 6.59 | 6.30 | 4.6 |
| 11 | Jiajiafang | 44 | 61 | −27.3 | 4.32 | 3.21 | 34.4 | 3.19 | 3.01 | 5.8 | 0.48 | 0.53 | −8.9 | 8.02 | 5.90 | 36.1 |
| 12 | Jiangwan | 43 | 44 | −3.2 | 4.60 | 4.07 | 13.1 | 3.39 | 2.95 | 15.1 | 0.48 | 0.51 | −5.6 | 8.49 | 8.21 | 3.4 |
| 13 | Kouzihe | 46 | 53 | −13.1 | 4.02 | 3.67 | 9.5 | 2.73 | 2.97 | −8.1 | 0.49 | 0.53 | −8.3 | 6.96 | 6.02 | 15.5 |
| 14 | Lianghekou | 34 | 49 | −30.8 | 4.18 | 2.70 | 54.6 | 3.32 | 2.89 | 15.0 | 0.61 | 0.77 | −20.3 | 7.82 | 5.53 | 41.5 |
| 15 | Miping | 30 | 35 | −14.2 | 4.67 | 4.10 | 13.9 | 3.63 | 4.02 | −9.6 | 0.51 | 0.57 | −11.3 | 8.90 | 7.77 | 14.5 |
| 16 | Nankuanping | 39 | 37 | 5.4 | 4.49 | 4.48 | 0.1 | 3.07 | 3.32 | −7.5 | 0.51 | 0.56 | −9.9 | 7.59 | 7.89 | −3.8 |
| 17 | Nanshahe | 50 | 48 | 4.2 | 2.78 | 2.81 | −1.1 | 2.25 | 2.30 | −2.4 | 0.69 | 0.72 | −5.0 | 5.46 | 5.69 | −4.0 |
| 18 | Pingshi | 40 | 51 | −21.7 | 5.08 | 3.79 | 34.0 | 3.57 | 3.59 | −0.5 | 0.48 | 0.57 | −14.9 | 8.78 | 6.99 | 25.6 |
| 19 | Qingfeng | 34 | 49 | −30.8 | 4.79 | 3.21 | 49.3 | 3.78 | 3.42 | 10.6 | 0.53 | 0.63 | −16.9 | 9.18 | 6.50 | 41.1 |
| 20 | Qingniwan | 42 | 41 | 3.3 | 4.21 | 3.93 | 7.3 | 2.86 | 2.85 | 0.4 | 0.58 | 0.62 | −5.6 | 7.05 | 7.15 | −1.5 |
| 21 | Shengxiancun | 51 | 62 | −18.3 | 3.25 | 2.70 | 20.6 | 2.63 | 2.68 | −1.7 | 0.68 | 0.67 | 1.8 | 6.47 | 5.32 | 21.7 |
| 22 | Sheqi | 29 | 39 | −25.2 | 5.52 | 4.02 | 37.2 | 3.87 | 3.57 | 8.3 | 0.48 | 0.50 | −4.7 | 9.41 | 7.32 | 28.6 |
| 23 | Shuhe | 31 | 32 | −3.6 | 4.77 | 3.83 | 24.6 | 3.36 | 3.09 | 8.9 | 0.48 | 0.69 | −29.9 | 7.94 | 7.59 | 4.6 |
| 24 | Taikou | 46 | 48 | −4.6 | 3.83 | 2.97 | 28.7 | 2.52 | 2.34 | 7.7 | 0.54 | 0.72 | −25.5 | 6.43 | 6.07 | 6.0 |
| 25 | Tiesuoguan | 53 | 51 | 3.9 | 3.02 | 3.09 | −2.4 | 2.19 | 2.28 | −3.9 | 0.60 | 0.67 | −10.3 | 5.36 | 5.59 | −4.1 |
| 26 | Wanyugou | 49 | 52 | −5.8 | 3.43 | 2.85 | 20.3 | 2.40 | 2.87 | −16.4 | 0.56 | 0.70 | −19.9 | 6.06 | 5.65 | 7.3 |
| 27 | Wuguan | 42 | 52 | −19.2 | 4.62 | 3.74 | 23.6 | 3.51 | 3.62 | −3.0 | 0.49 | 0.59 | −18.0 | 8.67 | 7.05 | 22.9 |
| 28 | Xianhekou | 45 | 49 | −8.5 | 3.38 | 2.82 | 19.8 | 2.63 | 2.97 | −11.5 | 0.68 | 0.68 | 0.0 | 6.31 | 5.75 | 9.7 |
| 29 | Xinzhou | 50 | 55 | −8.8 | 3.38 | 2.72 | 24.3 | 2.45 | 2.14 | 14.1 | 0.62 | 0.72 | −14.1 | 6.02 | 5.61 | 7.3 |
| 30 | Youshuijie | 47 | 50 | −6.2 | 3.98 | 3.57 | 11.4 | 2.98 | 2.63 | 13.5 | 0.64 | 0.63 | 1.5 | 7.28 | 6.88 | 5.8 |
| Ave. | 43.13 | 48.19 | −9.7 | 4.03 | 3.44 | 18.1 | 2.94 | 2.93 | 1.2 | 0.55 | 0.62 | −10.9 | 7.23 | 6.48 | 11.7 | |
| Min. | 29 | 32 | −30.8 | 2.78 | 2.70 | −6.7 | 2.02 | 1.94 | −16.4 | 0.42 | 0.50 | −29.9 | 5.00 | 4.98 | −9.1 | |
| Max. | 53 | 62 | 11.8 | 5.52 | 4.94 | 54.6 | 3.87 | 4.28 | 15.1 | 0.69 | 0.77 | 4.3 | 9.71 | 8.56 | 41.5 | |
Publisher’s Note: MDPI stays neutral with regard to jurisdictional claims in published maps and institutional affiliations. |
© 2022 by the authors. Licensee MDPI, Basel, Switzerland. This article is an open access article distributed under the terms and conditions of the Creative Commons Attribution (CC BY) license (https://creativecommons.org/licenses/by/4.0/).
Share and Cite
MDPI and ACS Style
Hong, X.; Guo, S.; Chen, G.; Guo, N.; Jiang, C. A Modified Two-Parameter Monthly Water Balance Model for Runoff Simulation to Assess Hydrological Drought. Water 2022, 14, 3715. https://doi.org/10.3390/w14223715
AMA Style
Hong X, Guo S, Chen G, Guo N, Jiang C. A Modified Two-Parameter Monthly Water Balance Model for Runoff Simulation to Assess Hydrological Drought. Water. 2022; 14(22):3715. https://doi.org/10.3390/w14223715
Chicago/Turabian StyleHong, Xingjun, Shenglian Guo, Guiya Chen, Na Guo, and Cong Jiang. 2022. "A Modified Two-Parameter Monthly Water Balance Model for Runoff Simulation to Assess Hydrological Drought" Water 14, no. 22: 3715. https://doi.org/10.3390/w14223715
Note that from the first issue of 2016, this journal uses article numbers instead of page numbers. See further details here.