
Fresh Water Use in Florida: Trends and Drivers


1
School of the Environment, Florida Agricultural and Mechanical University, 1515 S. M.L.K. Jr. BLVD, Tallahassee, FL 32307, USA
2
Biological Systems Engineering, Florida Agricultural and Mechanical University, Benjamin Banneker Tech C, 1409 Wahnish Way, Tallahassee, FL 32307, USA
*
Author to whom correspondence should be addressed.
Water 2022, 14(22), 3726; https://doi.org/10.3390/w14223726
Submission received: 14 September 2022
/
Revised: 7 November 2022
/
Accepted: 15 November 2022
/
Published: 17 November 2022
(This article belongs to the Special Issue Water Footprint and Life Cycle Assessment: Complementary Strengths in Analyzing Water Use along Supply Chains)
Abstract
:Water quality and quantity are critical issues as the Florida’s population grows. This paper analyzed water use regionally (central, north, and south Florida) as well as in rural and urban areas in Florida from 2005 to 2015 using three indicators (total water use, agriculture water use, and per capita water use). Eight (8) water-consuming categories, such as aquaculture, livestock, irrigation, public supply, thermoelectric power, mining, industrial self-supply, and domestic self-supply, were considered for total water use. Per capita water use used public supply category and agricultural water use used aquaculture, livestock, and irrigation categories. Linear regression analysis was used to observe the relationship between population and water use. The highest water use was recorded in south Florida, while the lowest was in north Florida. Water use per capita was higher in urban areas. Irrigation water use was higher among the eight water use categories. Many drivers influencing Florida water use were identified through literature review and causal loop diagram was developed. Some (e.g., household size, land use/land cover change, urbanization, agriculture, population, income, climate change, tourism, and industry) may cause an increase in water use, while others (e.g., pricing systems, conservation methods, education, and technology) may cause a decrease in water use. Overall, this research addresses the need of understanding water use trends and the drivers affecting those trends, which are important to determine whether a water conservation plan is needed.
1. Introduction
Access to sufficient and renewable water sources to support demand in quantity and quality has always played a fundamental and critical role in human life and societies [1]. That is also a stepping stone to development because countries and communities can be locked in poverty for generations without clean, easily accessible water [2]. The water crisis is considered one of the global risks and ranks among the most serious international challenges in the coming years [3]. Sufficient water quantity and quality are strongly linked to sustainable development [4]. In fact, the 6th target of the sustainable development goals (SDGs) is dedicated to clean water and sanitation [5]. Considered one of the central focuses of SDG, it looks beyond targets related to drinking water supply as well as sanitation and includes aspects of water quality and wastewater, water use and efficiency, integrated water resources management, ecosystems, and an enabling environment [5,6].
In the United States, particularly in Florida, meeting the water demands of the increasing population has become a critical issue when balancing needs from agricultural, commercial development, natural environment, and public use [7]. Water is one of Florida’s most important natural resources [8]. Benefiting from an abundant amount of freshwater springs, heavy rains, and oceans, Florida is unique in its seemingly endless water resources. The state has more than 1700 streams and rivers, 7800 freshwater lakes, 700 springs, 11 million acres of wetlands, and underlying aquifers to satisfy human and environmental freshwater needs [9]. In some regions in Florida, the underground freshwater reserve can no longer sustain the growing water demands of the population while also feeding Florida’s rivers, springs, and lakes [10]. With periodic droughts, shortages of freshwater may occur. Drought and water shortages in the state have caused urban planners and policymakers to pay closer attention to water use, water supply development, and water resource management [10,11].
As Florida’s environment is water-sensitive, many environmental issues are water-related [12]. Accurate and reliable water use data is critical to assessing water demands and aiding future water availability throughout Florida. The Florida District of the United States Geological Survey (USGS) has primary federal responsibility for evaluating water resources and providing basic hydrological data on the state’s surface and groundwater. Over the years, the USGS has developed several categories’ estimates of water withdrawals and water use. These estimates provide perspectives on water use patterns by sector and over time [8]. These data are released quinquennially (every five years) at the national, state, and county levels.
Water availability to support current and future agriculture, population, and tourism are essential to the development of the economy and vital to the well-being of residents and visitors [13]. Florida’s problem are the challenges in meeting the water demands of its growing population, competing demands on water from agricultural, commercial development, natural environment, and public use [14], the water rates are high compared to other states in the southern United States as well as potential climate change impacts on water resources (e.g., droughts, hurricanes). Our study identified the following need and knowledge gaps in Florida in the context of freshwater use.
- ₋
- Many studies related to water have been carried out in Florida, and no research has compared different regions of the state. However, elements such as weather, population, level of urbanization, and agricultural and industrial activities, which are most likely to influence water use, may vary from one region to another region of the state [15,16,17].
- ₋
- Studies have explored one or more categories of water use in the entire Florida or parts of it, e.g., irrigation. Most water-related studies in Florida have examined water use from different perspectives using various analytical approaches. Some studies have estimated outdoor water use by identifying factors associated with irrigation practices [18] and analyzing combinations of irrigation planning and landscape/irrigation design to reduce irrigation water application [19]. Water use is also assessed in agricultural activities by examining irrigation water use on sandy soil [20]. Toor and Rainey [21] analyzed the use of reclaimed water to reduce surface and groundwater use, while Anderson [22] presented some of the advantages of reclaimed water use. Leal et al. [23] described the level of importance Florida residents associate with water quantity issues. Palenchar et al. [24] investigated water use patterns and volume for indoor purposes. To our knowledge, studies have not compared the freshwater use in terms of all eight categories namely: aquaculture, livestock, irrigation, thermoelectric power, mining, industrial self-supply, domestic self-supply, and public supply.
- ₋
- Leal et al. [23] suggested that water use comparison between urban and rural areas could be very interesting, especially since rural and urban areas differ in population and land use/land cover properties, including commercial, residential, services, or industrial entities [25]. Besides, a high population can contribute to a decrease in existing water sources [23].
- ₋
- More and more variables have been incorporated into the models to the point that water use drivers vary greatly [26]. Drivers can positively or negatively influence water use. From a conservation awareness perspective, identifying and understanding water use drivers in Florida can contribute to water resource management and policy-making.
Therefore, this paper aims to address the need and knowledge gaps by (1) examining the quantity, trends, and patterns of water use in north, central, and south Florida through eight water-consuming categories: aquaculture, livestock, irrigation, thermoelectric power, mining, industrial self-supply, domestic self-supply, and public supply, (2) comparing urban and rural water use in Florida and (3) identifying and understanding the relationships between water use and its drivers by creating a causal loop diagram (4) estimating the relationship between population and water use using regression analysis. These are important to ensure that water resources (surface and groundwater) continue to support people, food production, natural ecosystems, and the economy.
2. Study Region, Methodology, and Datasets Used
2.1. Study Region
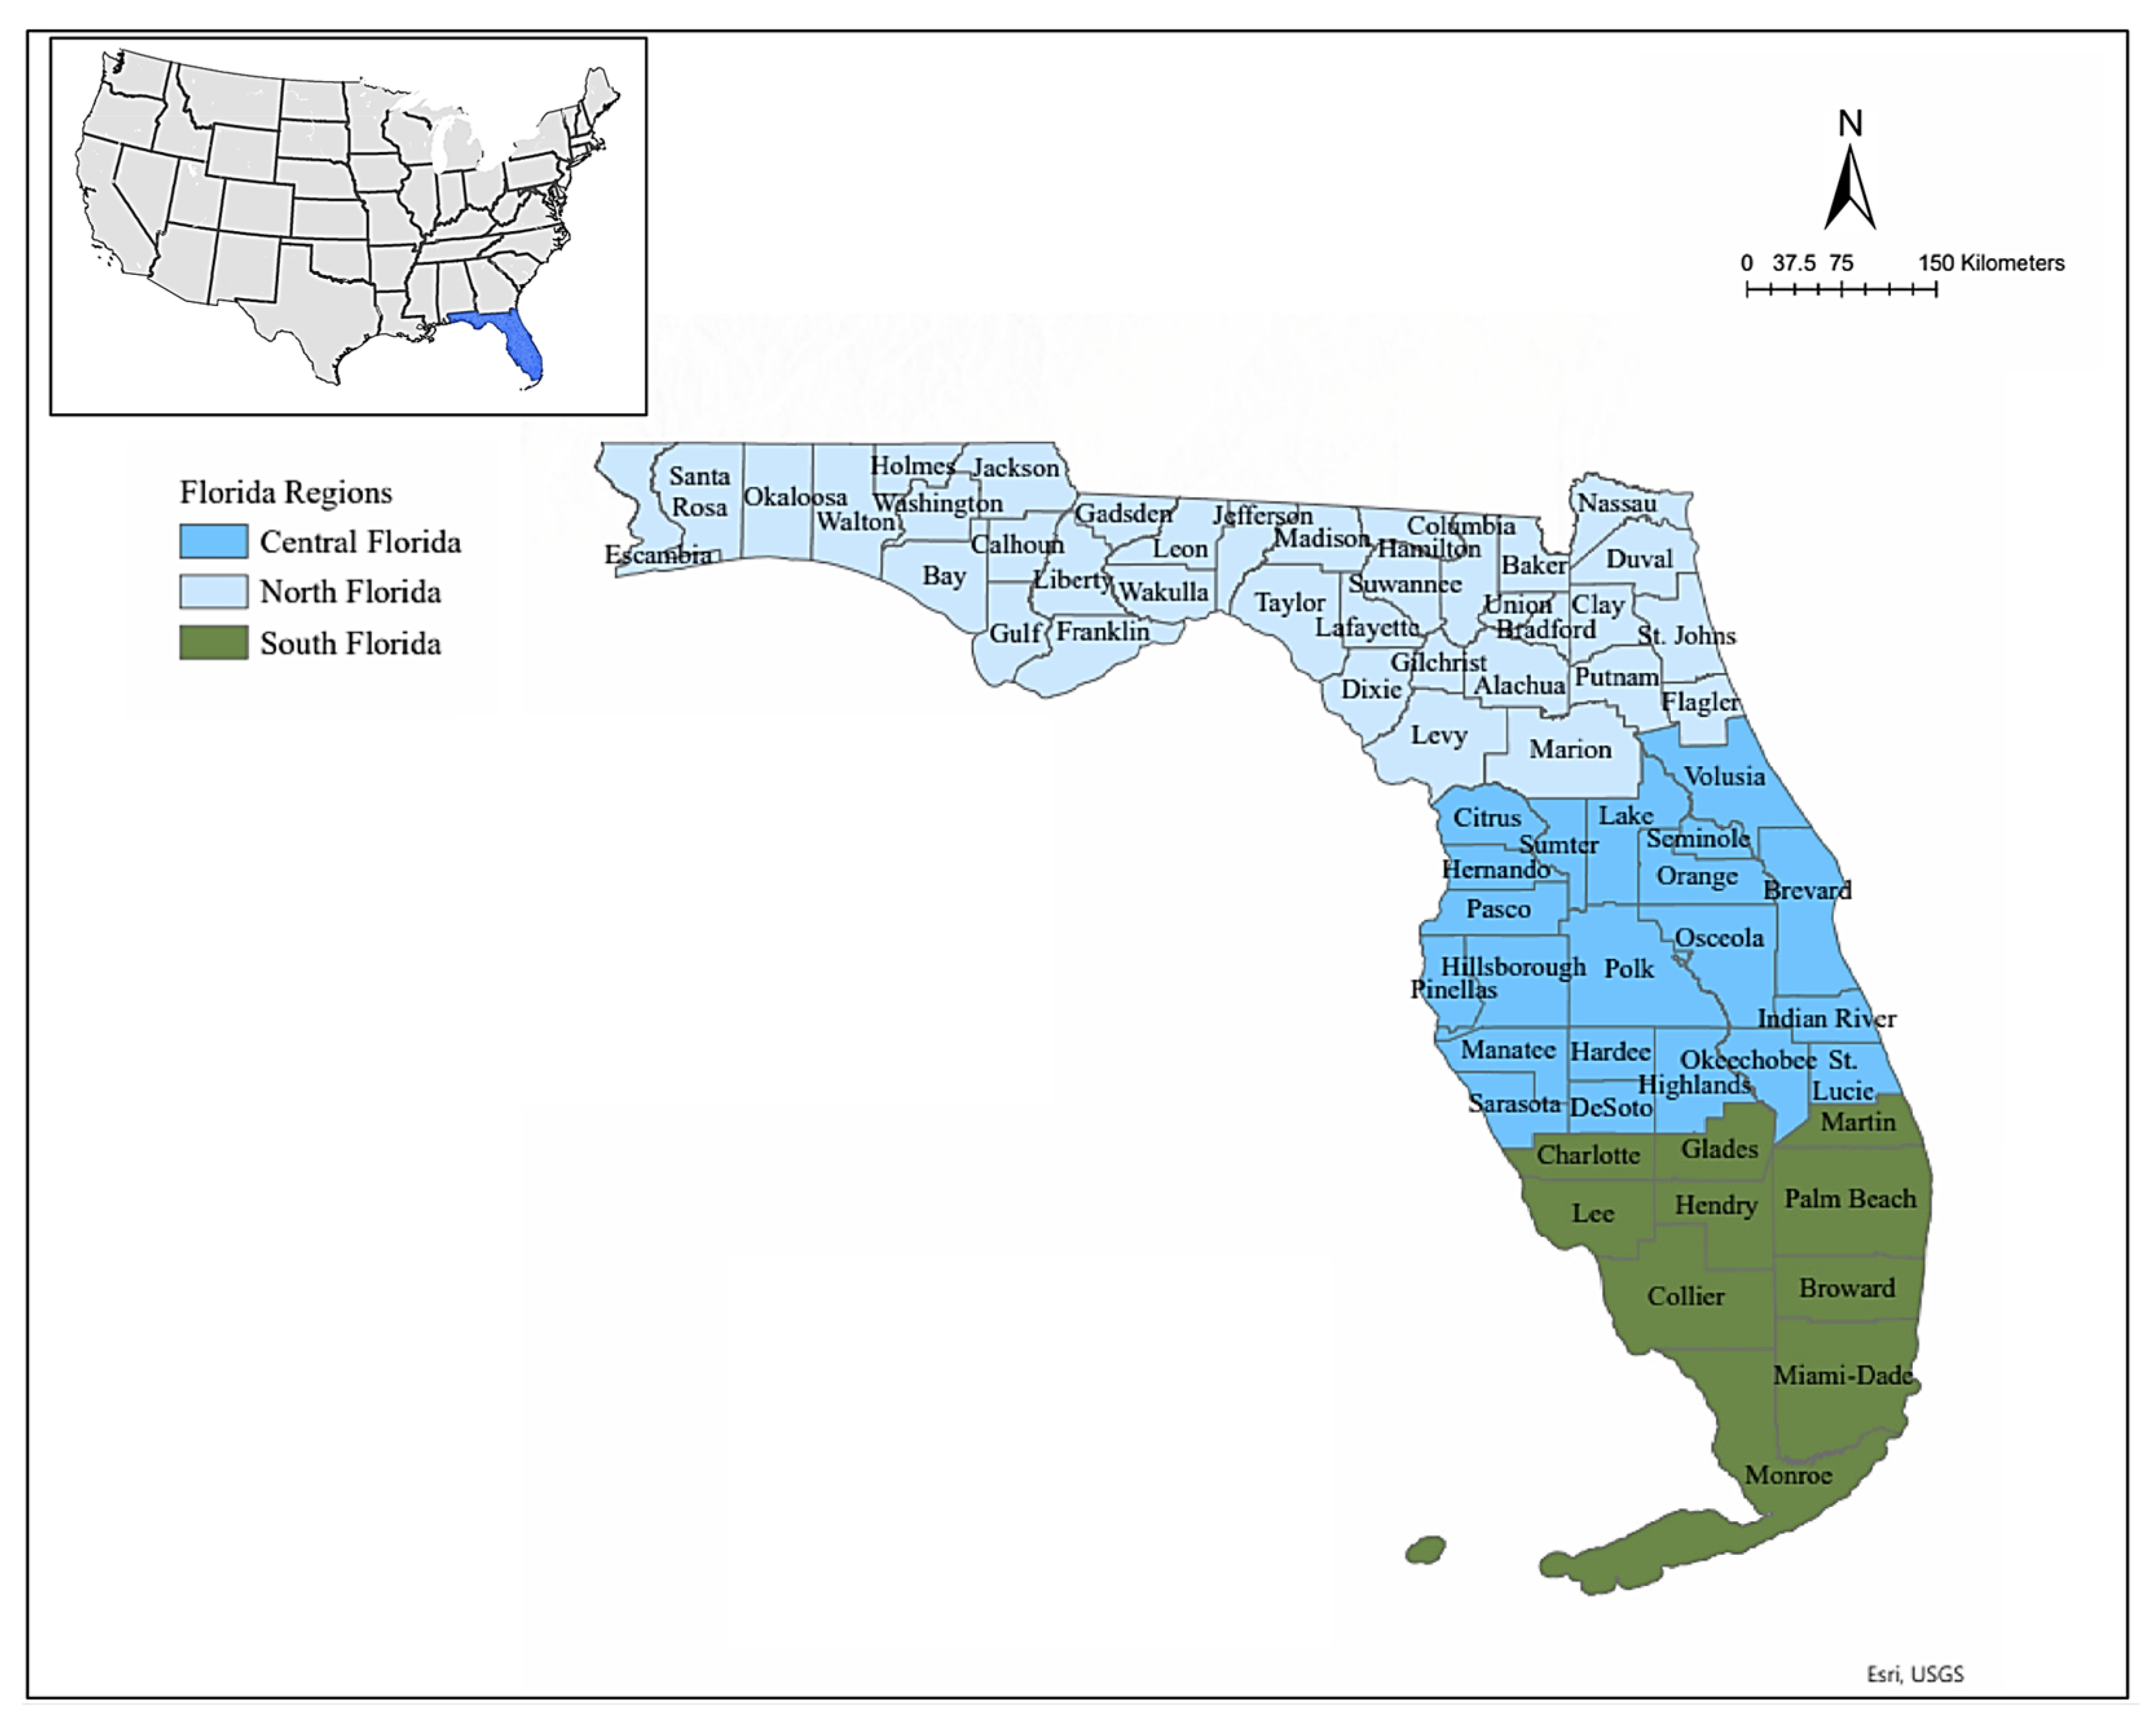
The State of Florida has been selected as the study area because it is a major consumer of water, where the main source of irrigation is from the surface and groundwater [8,27]. Florida has the third highest population in the United States [28]. Moreover, the state has a sub-tropical climate and is highly vulnerable to increasing high temperatures [29,30]. Climate variability-induced stresses on water resources combined with an ever-growing population with an increasing need for irrigated agriculture put pressure on freshwater bodies such as lakes, streams, and aquifers [29,31]. Florida is in the southeastern region of the United States. The state is bordered to the west by the Gulf of Mexico, to the northwest by Alabama, to the north by Georgia, to the east by the Bahamas and the Atlantic Ocean, and to the south by the straits of Florida and Cuba. According to the United States Census Bureau, there are 67 counties in the State of Florida (Figure 1). Escambia and St. Johns Counties are the oldest (established in 1821) [32], while Gilchrist County is the youngest (established in 1925) [33]. Miami-Dade County is the most populated and Liberty County is the least populated [34].
The state of Florida has been divided into three to six regions. The six (6) region classification includes: northwest, northeast, central, central west, southwest, and southeast [35], while the five (5) region classification consists of: panhandle, north, north central, south central, and south [36],. The four (4) region classification is panhandle, north, central, and south [37,38], and finally the three (3) region classification is north, central, and south Florida) [39,40,41,42] for research purposes. This study used the simplest classification to account for water use differences across the state, the three (3) regions classification established by the Department of Wildlife Ecology & Conservation of the University of Florida (UF/DWEC) (Figure 1). North Florida has thirty-six counties (36), central Florida has twenty-one (21), and south Florida has ten (10) counties [39].
2.2. Methodology
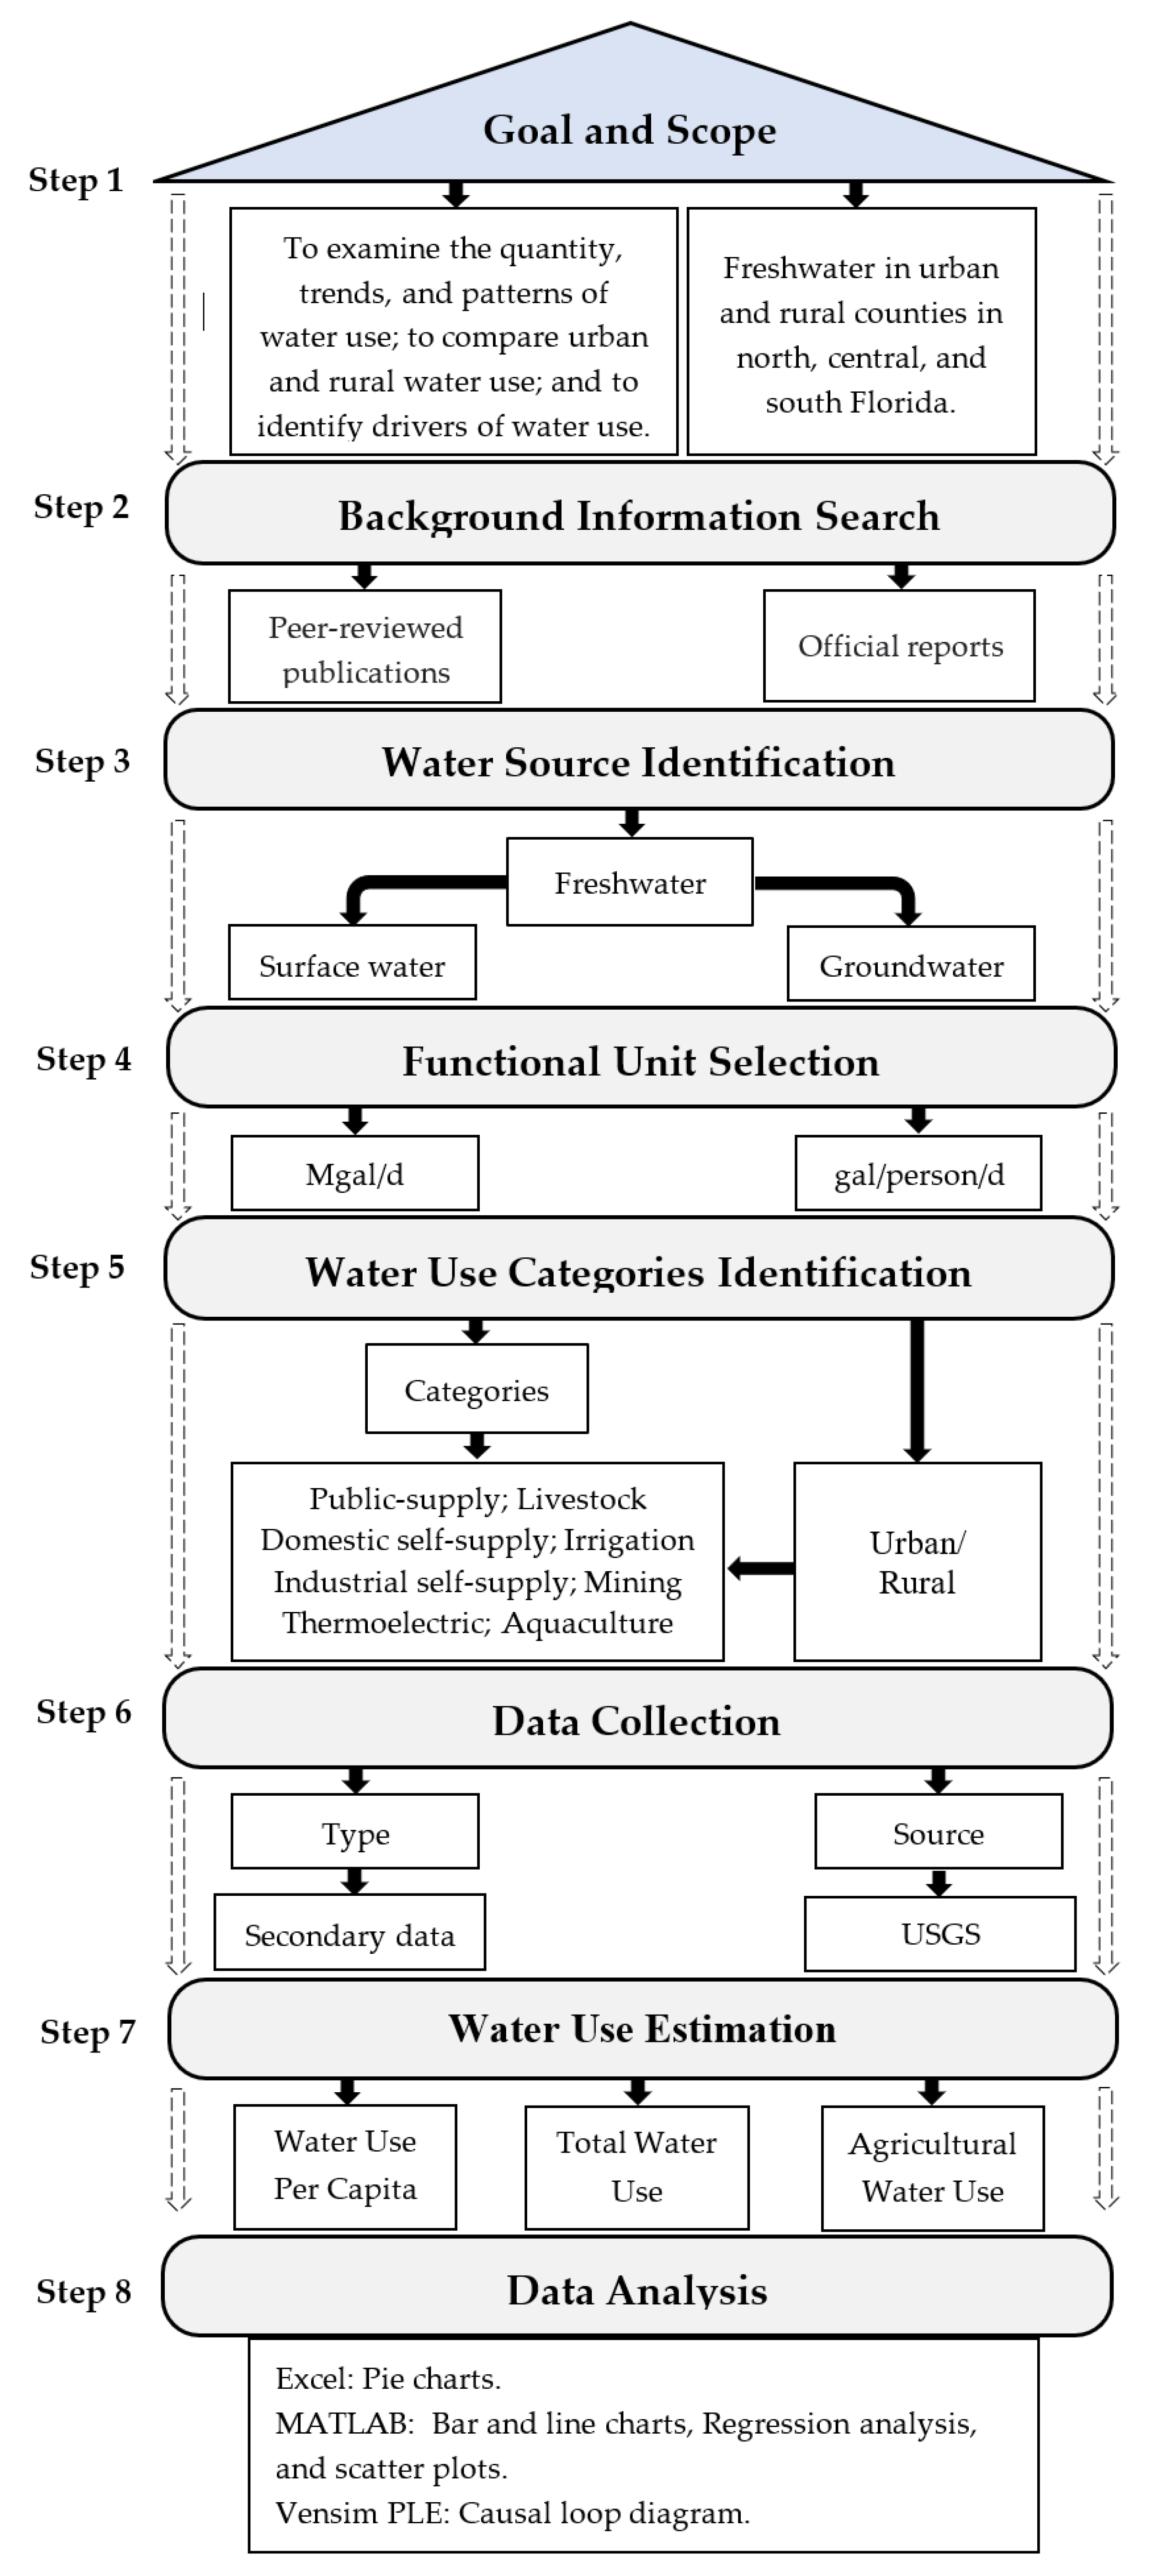
The methodology section involved the following steps: goal and scope, background information search, targeted type of water, functional units, water use components, water use estimation, data set used, findings, and recommendations. The methodology followed in this study is briefly provided in the flowchart (Figure 2) and described below.
Step 1. Goal and Scope of the Study
The present work aims to examine water use in north, central, and south Florida, then, compare urban and rural water use in Florida, and lastly to identify and understand the relationships between water use and its drivers. The target audience is stakeholders such as policy and decision-makers, researchers, students, and state and private organizations at both the local and national levels.
The scope consists of setting the system boundaries for water use (what to include and what to exclude). The present study estimates freshwater water use in the (3) three regions of Florida, then in urban and rural counties in Florida, specifically considering eight water use categories such as (1) public supply water, (2) domestic self-supply, (3) industrial self-supply, (4) mining, (5) thermoelectric, (6) irrigation, (7) livestock, and (8) aquaculture. Irrigation, livestock, and aquaculture (three out of eight categories) are combined as agricultural water use. The water use estimation was done for 2005, 2010, and 2015. The water use estimation is based on blue water, including groundwater and surface water.
Step 2. Background Information Search
After defining the preliminary objectives and scope of this work, background research was carried out. Peer review articles and official reports were consulted to identify and understand existing literature on different aspects surrounding water use assessment. After obtaining sufficient background information, the objectives and scope were refined to have a more specific and relevant outcome. The background research also helped identify the gaps in Florida’s water use assessment that this paper attempts to fill and the different drivers influencing water use in Florida.
Step 3. Water Source Identification
The two types of water used in this study are surface and groundwater. Groundwater is located below the earth’s surface in spaces between rock and soil. Surface water is collected in streams, rivers, lakes, reservoirs, etc.
Step 4. Functional Unit Selection
The functional unit gives the measure of a reference unit in which the outputs are reported. For the present study, the functional units for water use are Million gallons per day (Mgal/d) and gallons per day per capita (gal/person/d).
Step 5. Water Use Categories and urban/rural water use
- ❖ Water-Use Categories for all counties in Florida
This paper includes assessments of all water uses in north, central, and south Florida for the following categories.
- Public-supply water use—Water delivered to domestic, commercial, and industrial users by public and private water suppliers.
- Domestic self-supply water use—Water withdrawn from a private source, such as a well, or captured as rainwater in a cistern for usage purposes in the domestic sector.
- Industrial self-supply water use—Water from a private source for fabricating, processing, washing, diluting, cooling, or transporting a product; incorporating water into a product; or sanitation needs within the manufacturing facility.
- Mining water use—Water used to extract minerals from solids, such as coal, iron, sand, and gravel; liquids, such as crude petroleum; and gases, such as natural gas.
- Thermoelectric power water use—Water used to generate electricity with steam-driven turbine generators. This category includes Once-through cooling and Recirculating cooling systems.
- Irrigation water use—Water applied to sustain plant growth in agricultural practices.
- Livestock water use—Water associated with livestock watering, feedlots, dairy operations, cooling of facilities for the animals and products, dairy sanitation, and wash down of facilities.
- Aquaculture water use—Water associated with raising organisms that live in water, such as finfish and shellfish.
- ❖
- Urban/Rural Water Use
Researchers and policy officials employ many definitions to distinguish rural from urban areas. The US Census Bureau defines rural as what is not urban, meaning after defining individual urban areas, rural is what is left. The Census Bureau’s urban-rural classification fundamentally delineates geographical areas based on population density. Additionally, land use/land cover properties, including commercial, residential, services, or industrial entities, can also be included in the definition [25].
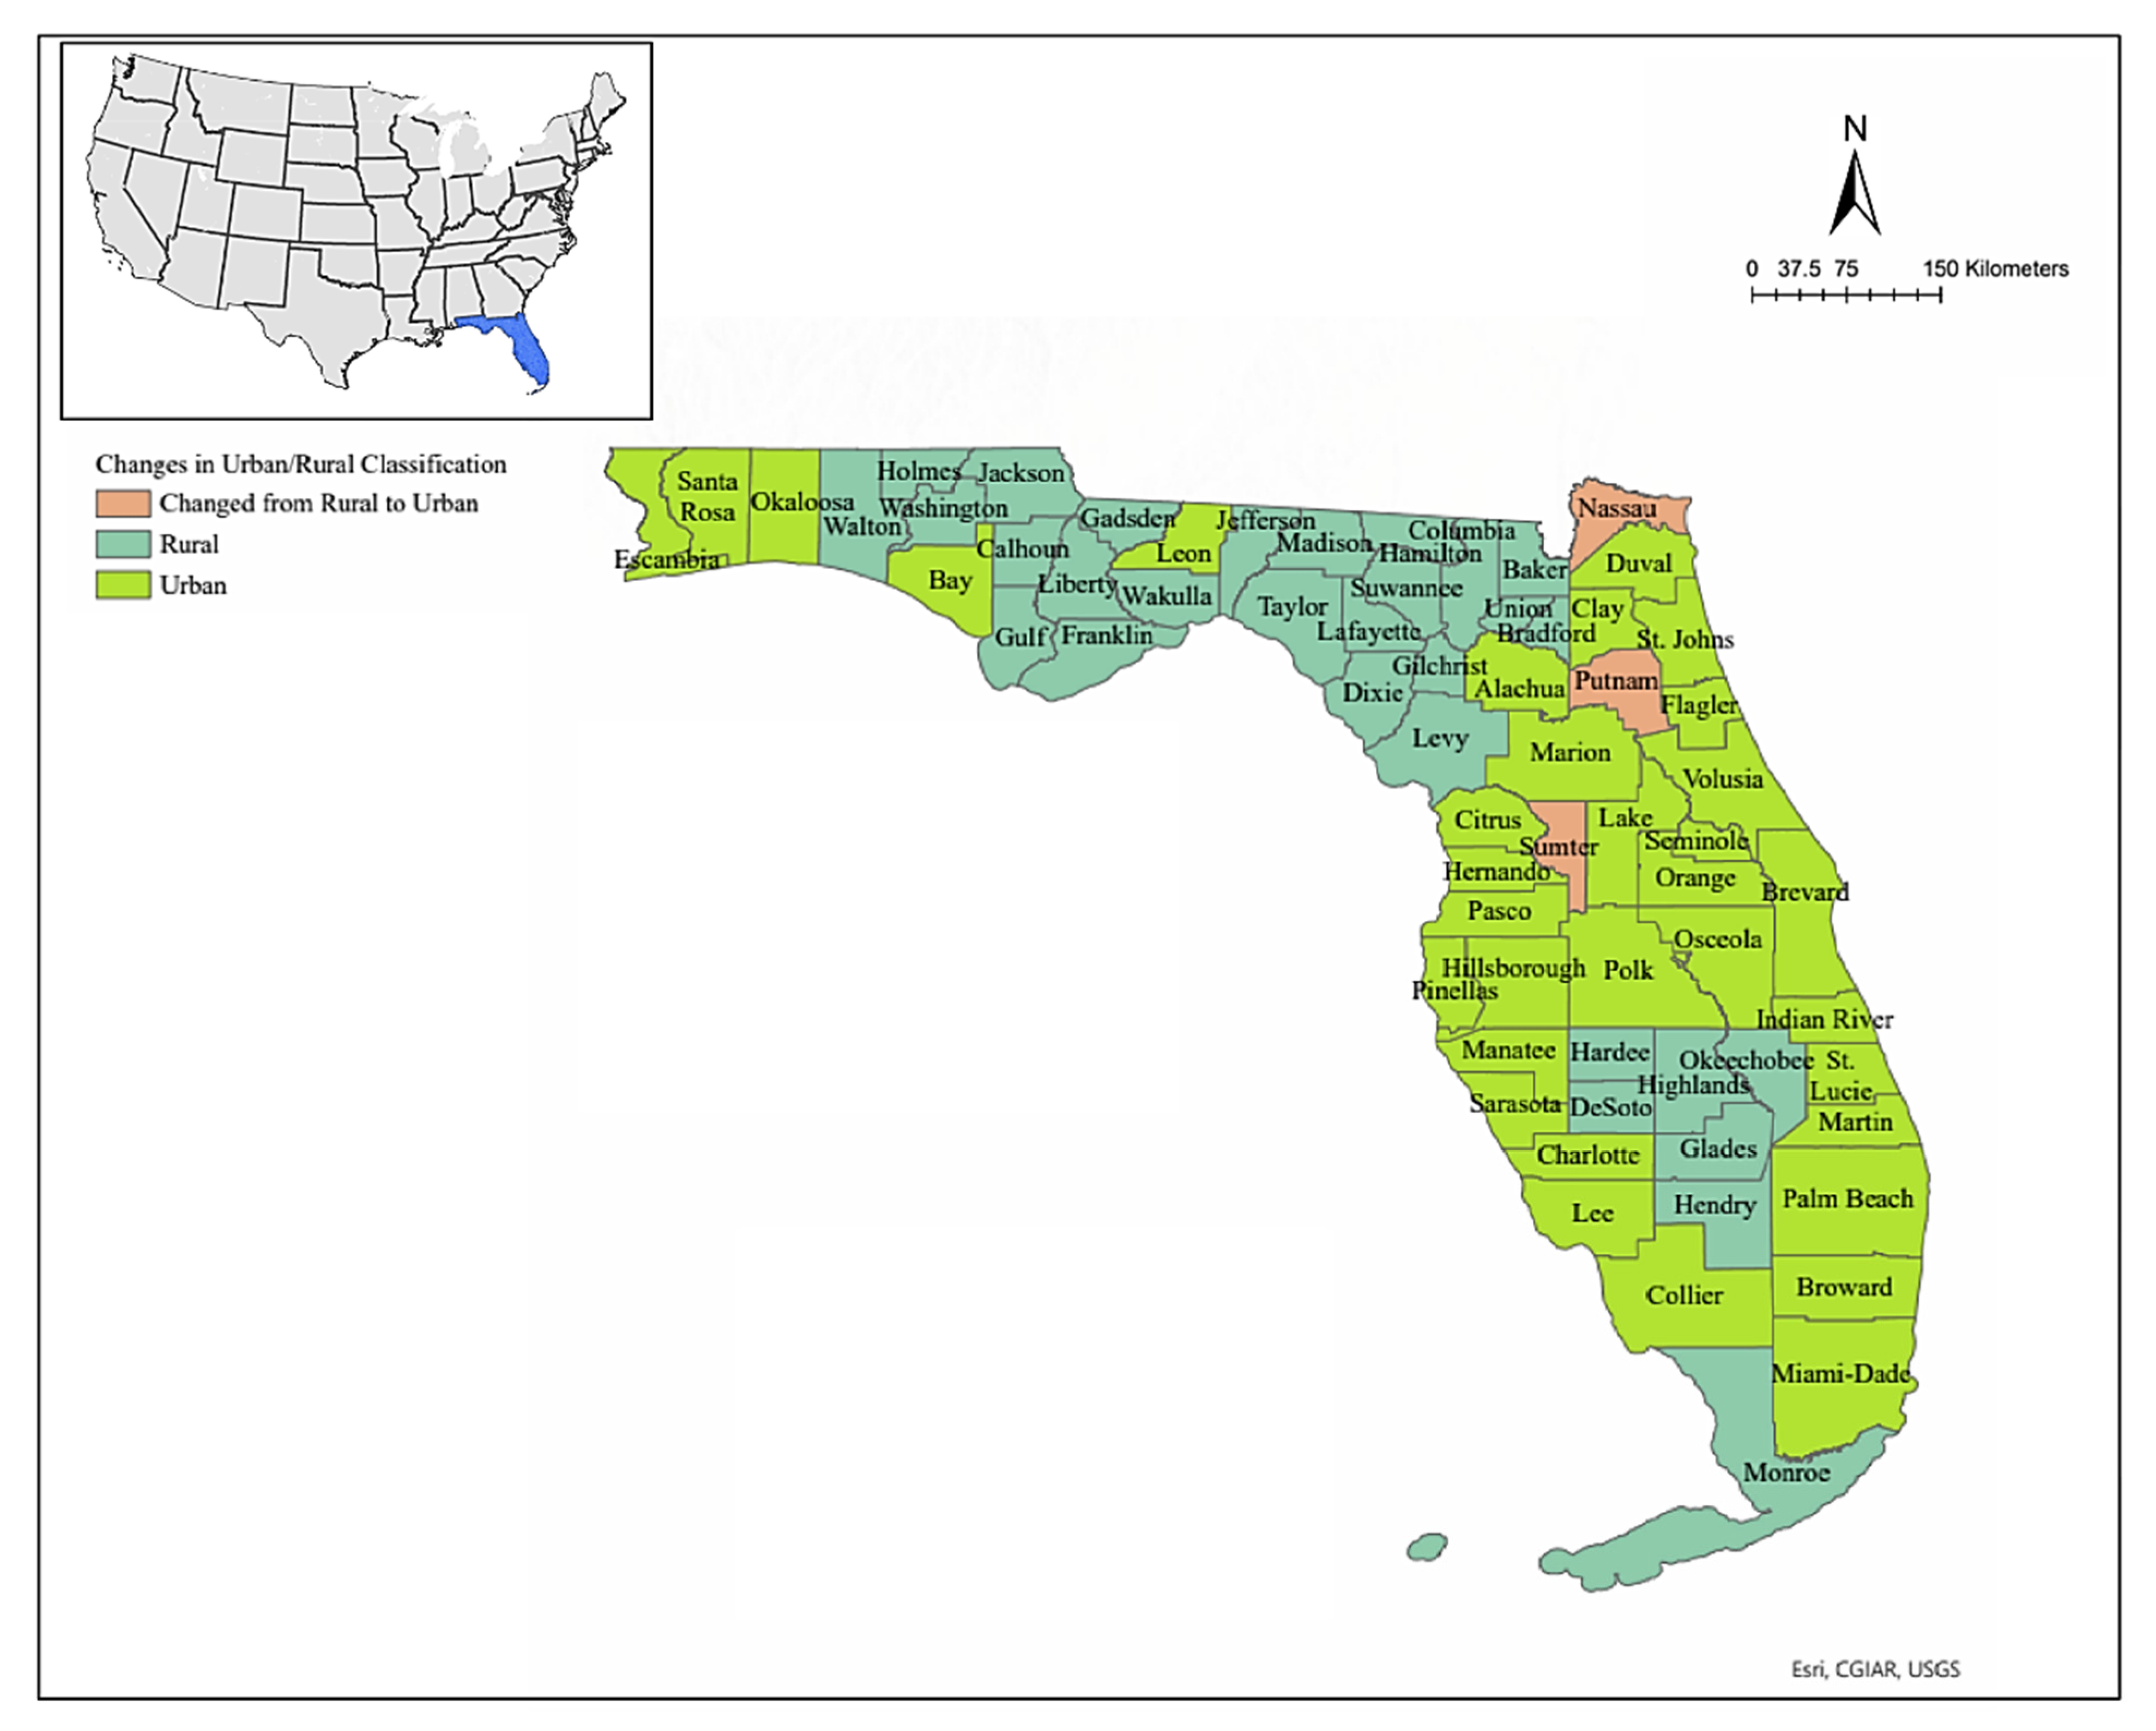
Urban means an area with a population density of more than 100 individuals per square mile and the rest are rural areas. Rural or urban county classification is obtained from the US Census Bureau. Thus, in this paper, water use is assessed in both rural and urban Florida counties. In 2005, Florida had 34 urban and 33 rural counties (Figure 3). However, in 2010 and 2015, three (3) rural counties (Putnam, Nassau, and Sumter counties) were reclassified as urban counties (Figure 3). Therefore, in 2015, Florida had 37 urban and 30 rural counties. All eight (8) water use categories previously described were assessed for Florida’s urban and rural counties in 2005, 2010, and 2015. Water use per capita is used to compare urban and rural water use.
Step 6. Data Collection
Nationwide water use/withdrawal data are available from the United States Geological Survey (USGS), listed by state and county, and disaggregated by categories ([43], [27], and [44]). The categories of water use have changed over the survey periods. For example, before 2005, the categories and data collection methods were different. The categories were public supply, domestic, commercial, irrigation, livestock, industrial, mining, thermoelectric, and hydroelectric power. Therefore, this study analyzes water use, trends, and patterns in Florida using historical data from 2005 to 2015 since the classification and the data collection methods are similar. Data for water use categories such as irrigation, livestock, aquaculture, public-supply, self-supplied domestic, self-supplied industrial, mining, and thermoelectric power were taken from USGS for 2005 [43], 2010 [27], and 2015 [44] (Figure 4). Florida counties are classified as rural and urban [45,46]. In 2005, there were thirty-four urban counties in Florida. From 2010 to 2015, the number of urban counties has increased to thirty-seven.
Step 7. Water Use Estimation: Total, Agricultural, Per Capita Water Use
- ❖ Total Water Use
Water Use Indicator was used to estimate water use in Florida. The Water Use Indicator (WUI) refers to the cumulation of public supply, domestic self-supply, industrial self-supply, mining, thermoelectric, and agricultural water use (Equation (1)).
In the equation, WUI: Water Use Indicator; WUp: Public supply water use; WUd: Domestic self-supply water use; WUi: Industrial self-supply water use; WUm: Mining water use; WUt: Thermoelectric water use; S: Surface water; G: Groundwater; and WUa: Agricultural Water Use.
- ❖ Agricultural Water Use
Among the different categories of water use, irrigation, livestock, and aquaculture are directly associated with the agricultural sector. Certainly, they were assessed with the other components in north, central, and south Florida. However, when analyzed separately from the other water use components, these three (3) components (irrigation, livestock, and aquaculture) help to provide information about agricultural water use. The estimation procedure adopted in this study for agricultural water use is also linear and additive
Agricultural Water Use (WUa.) refers to surface and ground water sources used for irrigation, livestock, and aquaculture. The following equations were.
WUa: Agricultural Water Use; WUirr: water use for irrigation; WUaq: water use in aquaculture; WUls: water use for livestock; l: lake; r: river; AQ: aquifer; aq: Aquaculture; ls: Livestock.
- ❖ Per Capita Water Use
The per capita water use is defined by the daily water volume per person per day, usually expressed as gallons/person/day [47]. It is often used to compare water use over time or among groups of people using public water supplies. The quantity of water consumed per capita was estimated in this research by using Equation 6 from [48].
WUpc Water use per capita, WUt is the total water use from public supply water, and PoP, is the population that uses the water.
Step 8. Data Analysis
The data used in this study were analyzed and presented using tables, maps, a causal loop diagram, bar, line, and pie charts, along with other customized-designed figures. The tables and the customized-designed figures were created using Microsoft Word. The bar, line, and pie charts were created using MATLAB and Excel. The causal loop diagram was created using the “Vensim PLE” software. The relationships between Florida freshwater use and the drivers were obtained from the literature (listed in Table 1). ArcMap was used to create the maps.
Correlation assessments between water use and the population were also evaluated using simple linear regression analysis in the three regions of Florida. The linear regression analysis was conducted using MATLAB between total water use in each county (dependent variable) and county population (independent variable). North Florida has thirty-six counties (36), central Florida has twenty-one (21), and south Florida has ten (10) counties [39]. The details are provided in Table 2.
3. Results
3.1. Patterns and Trends in Water Use
3.1.1. Total Water Use
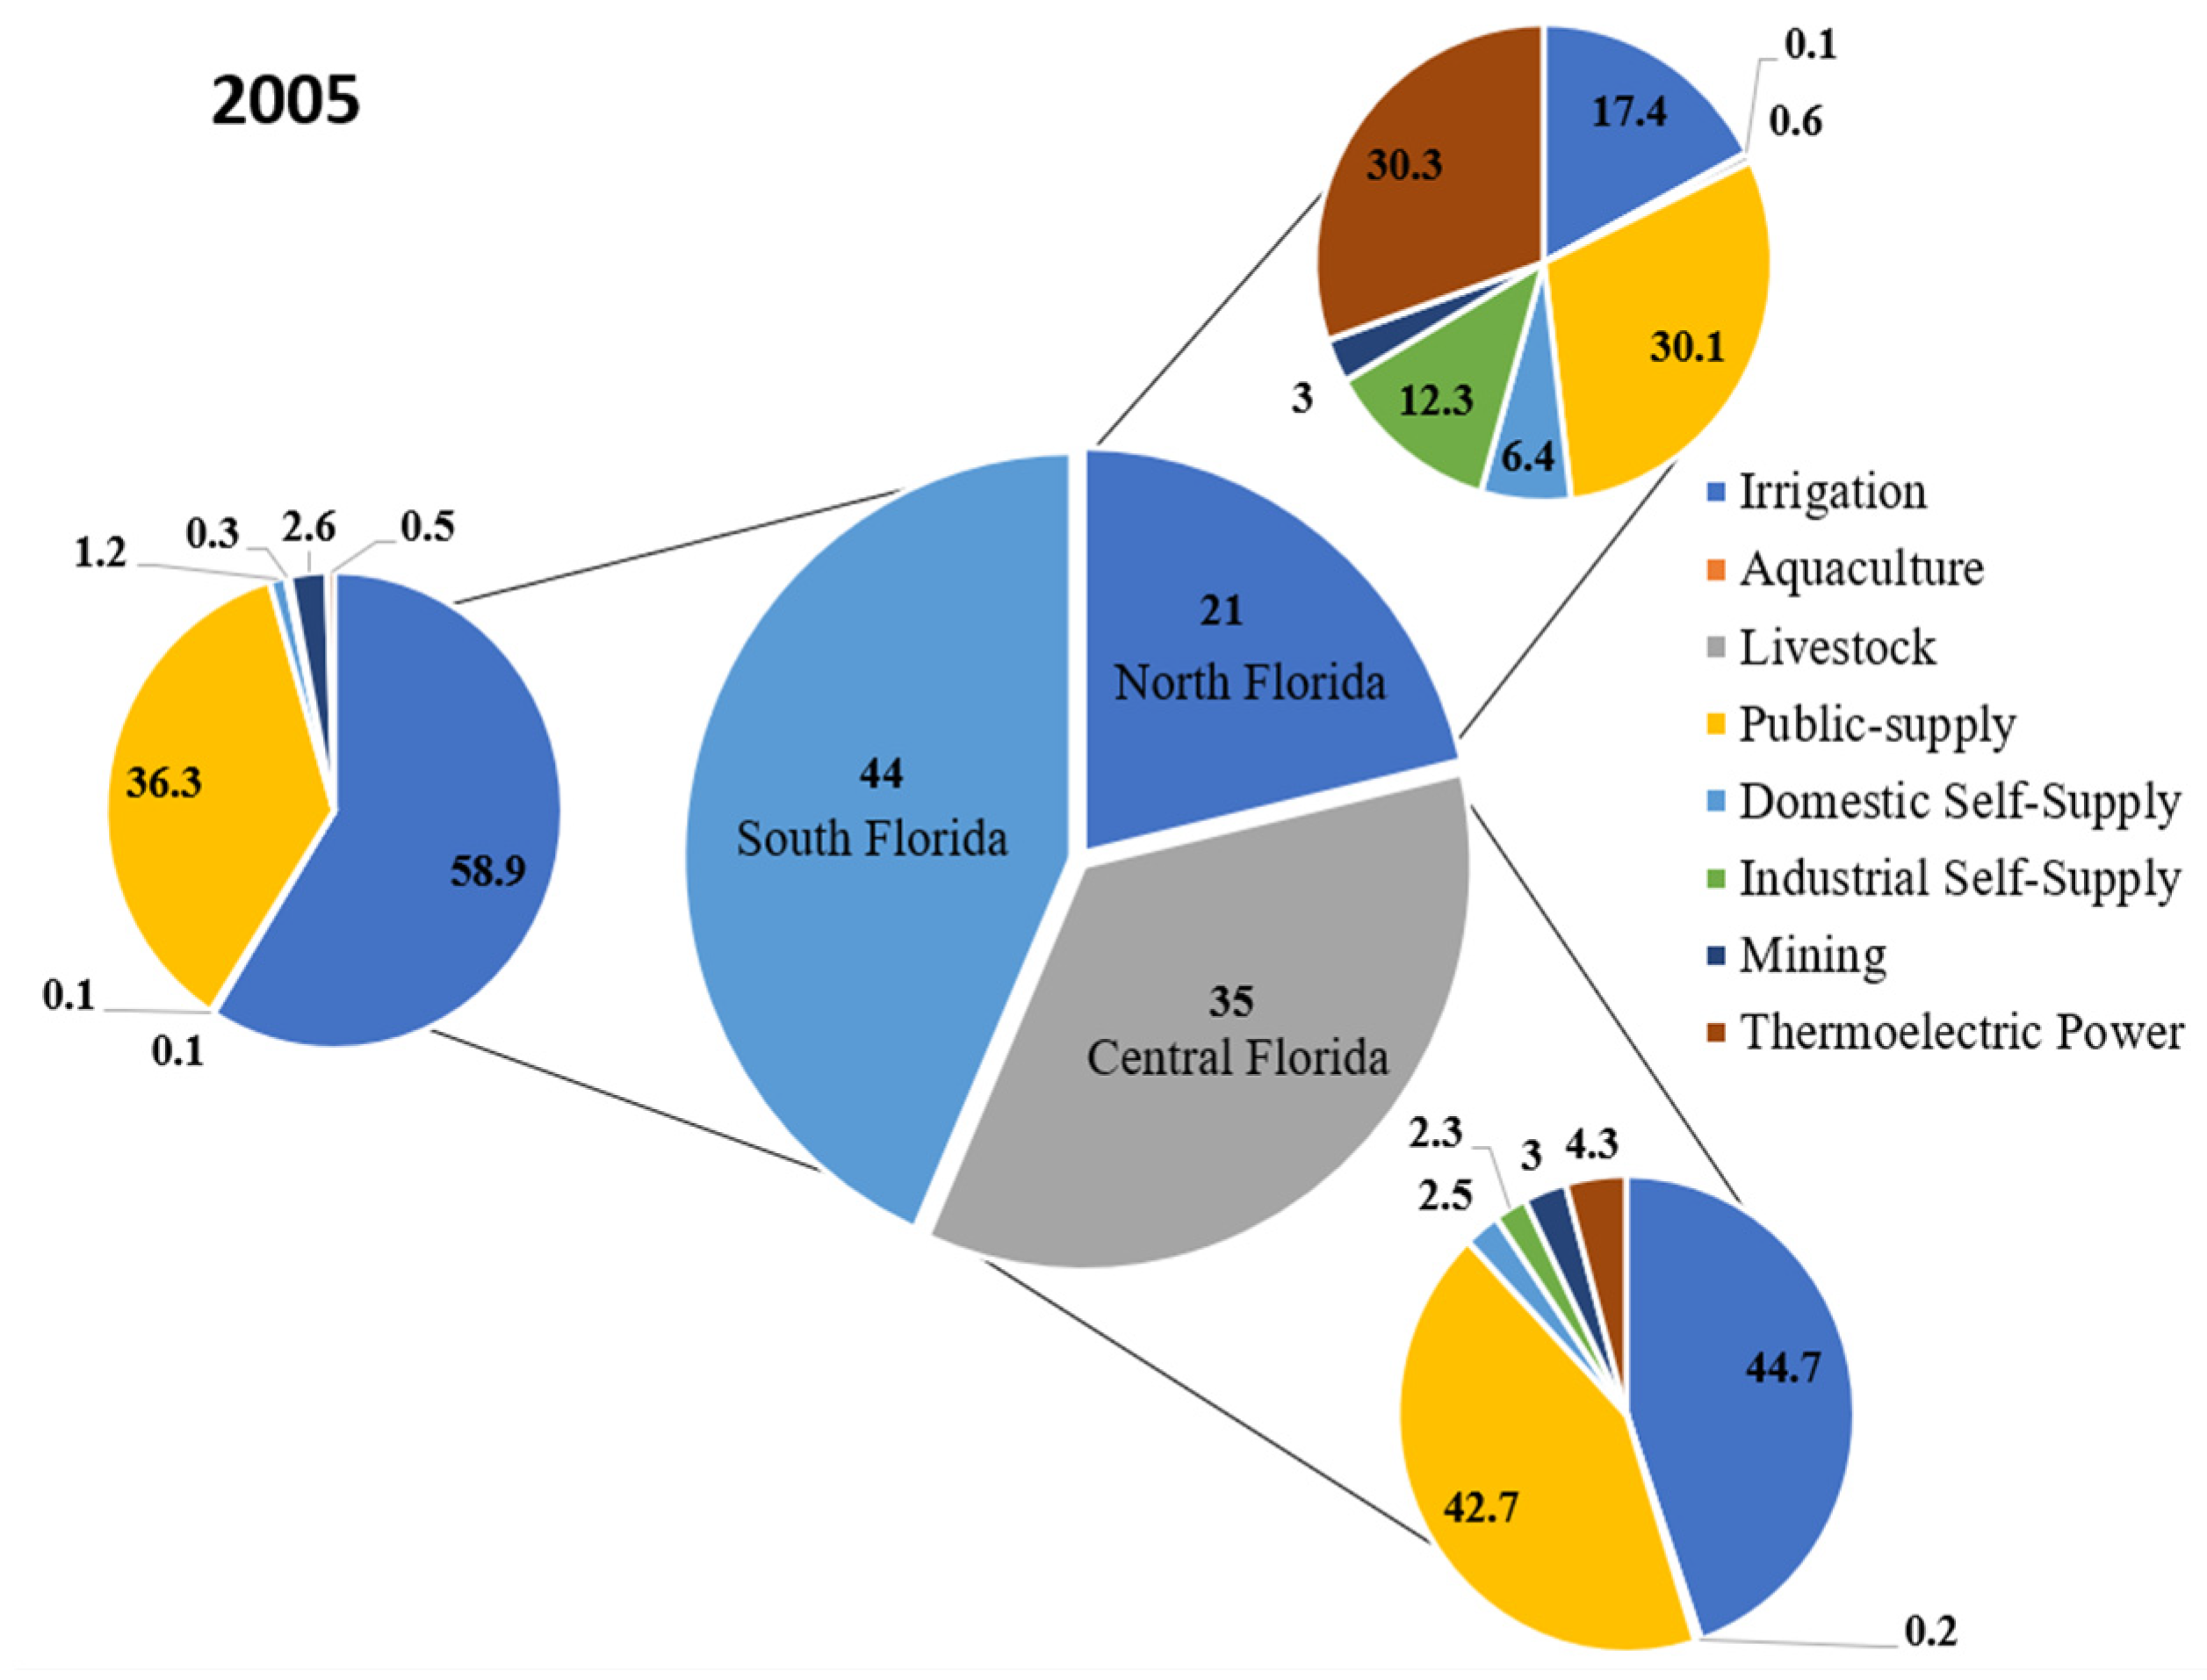
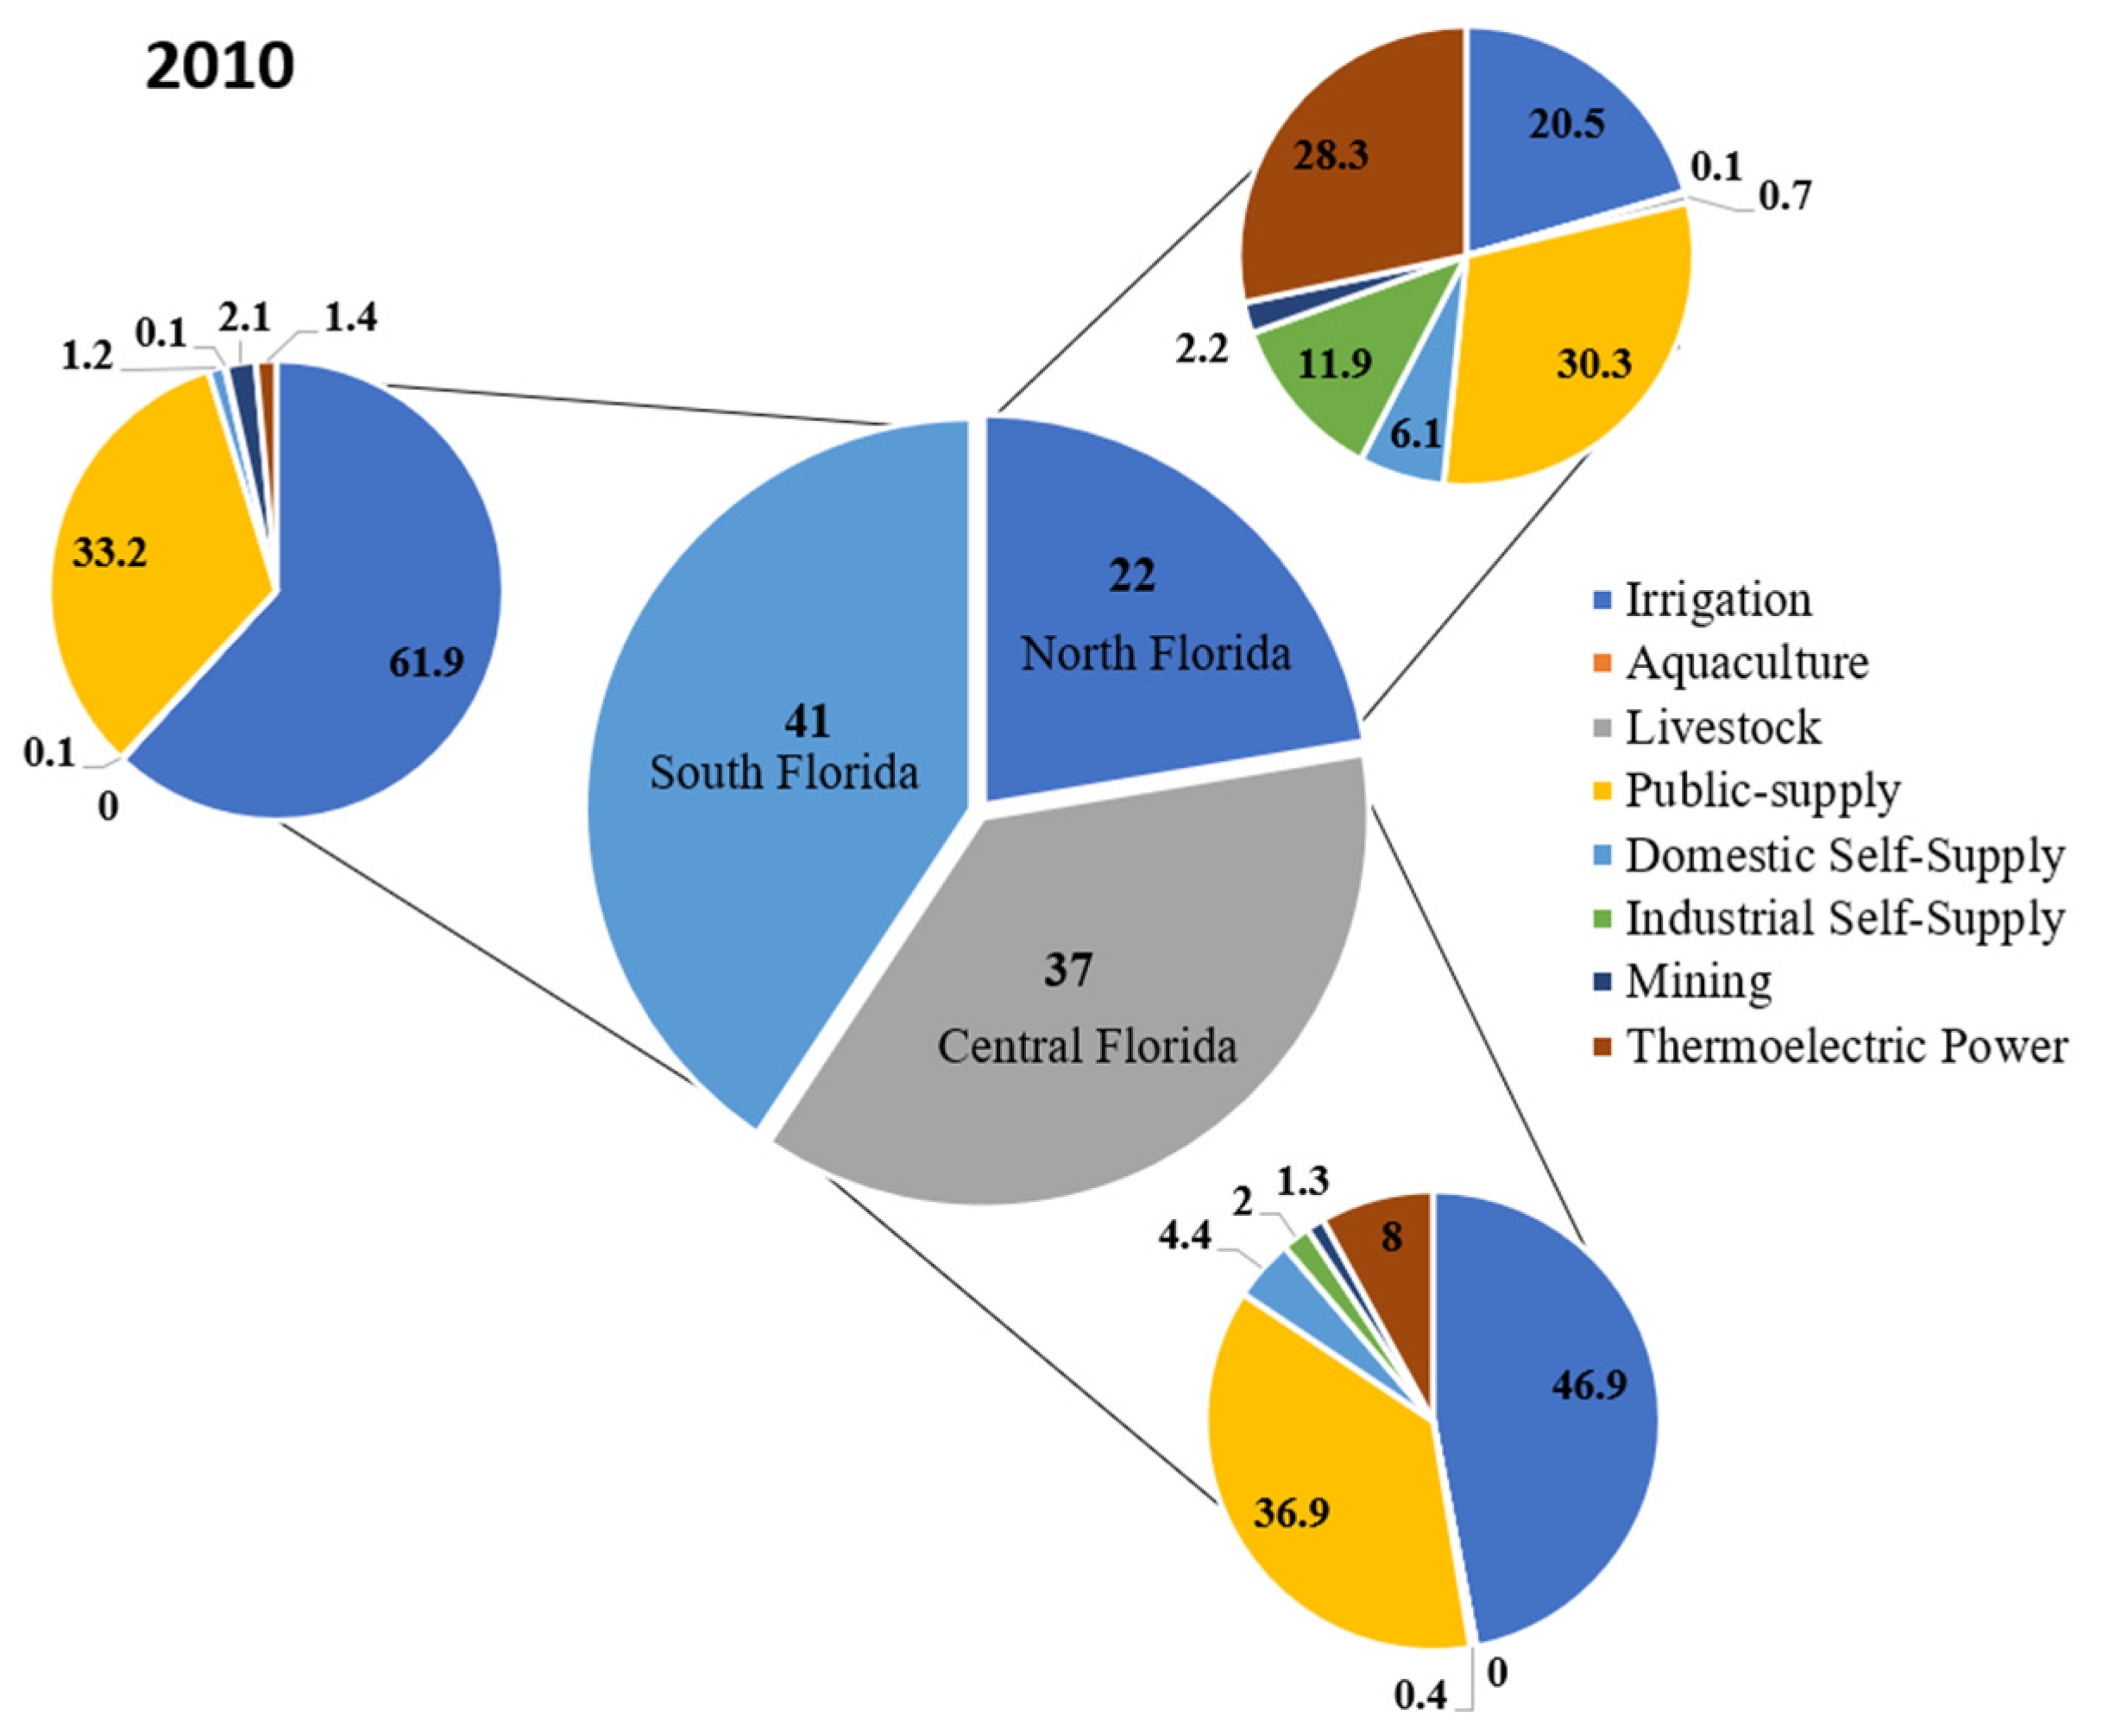
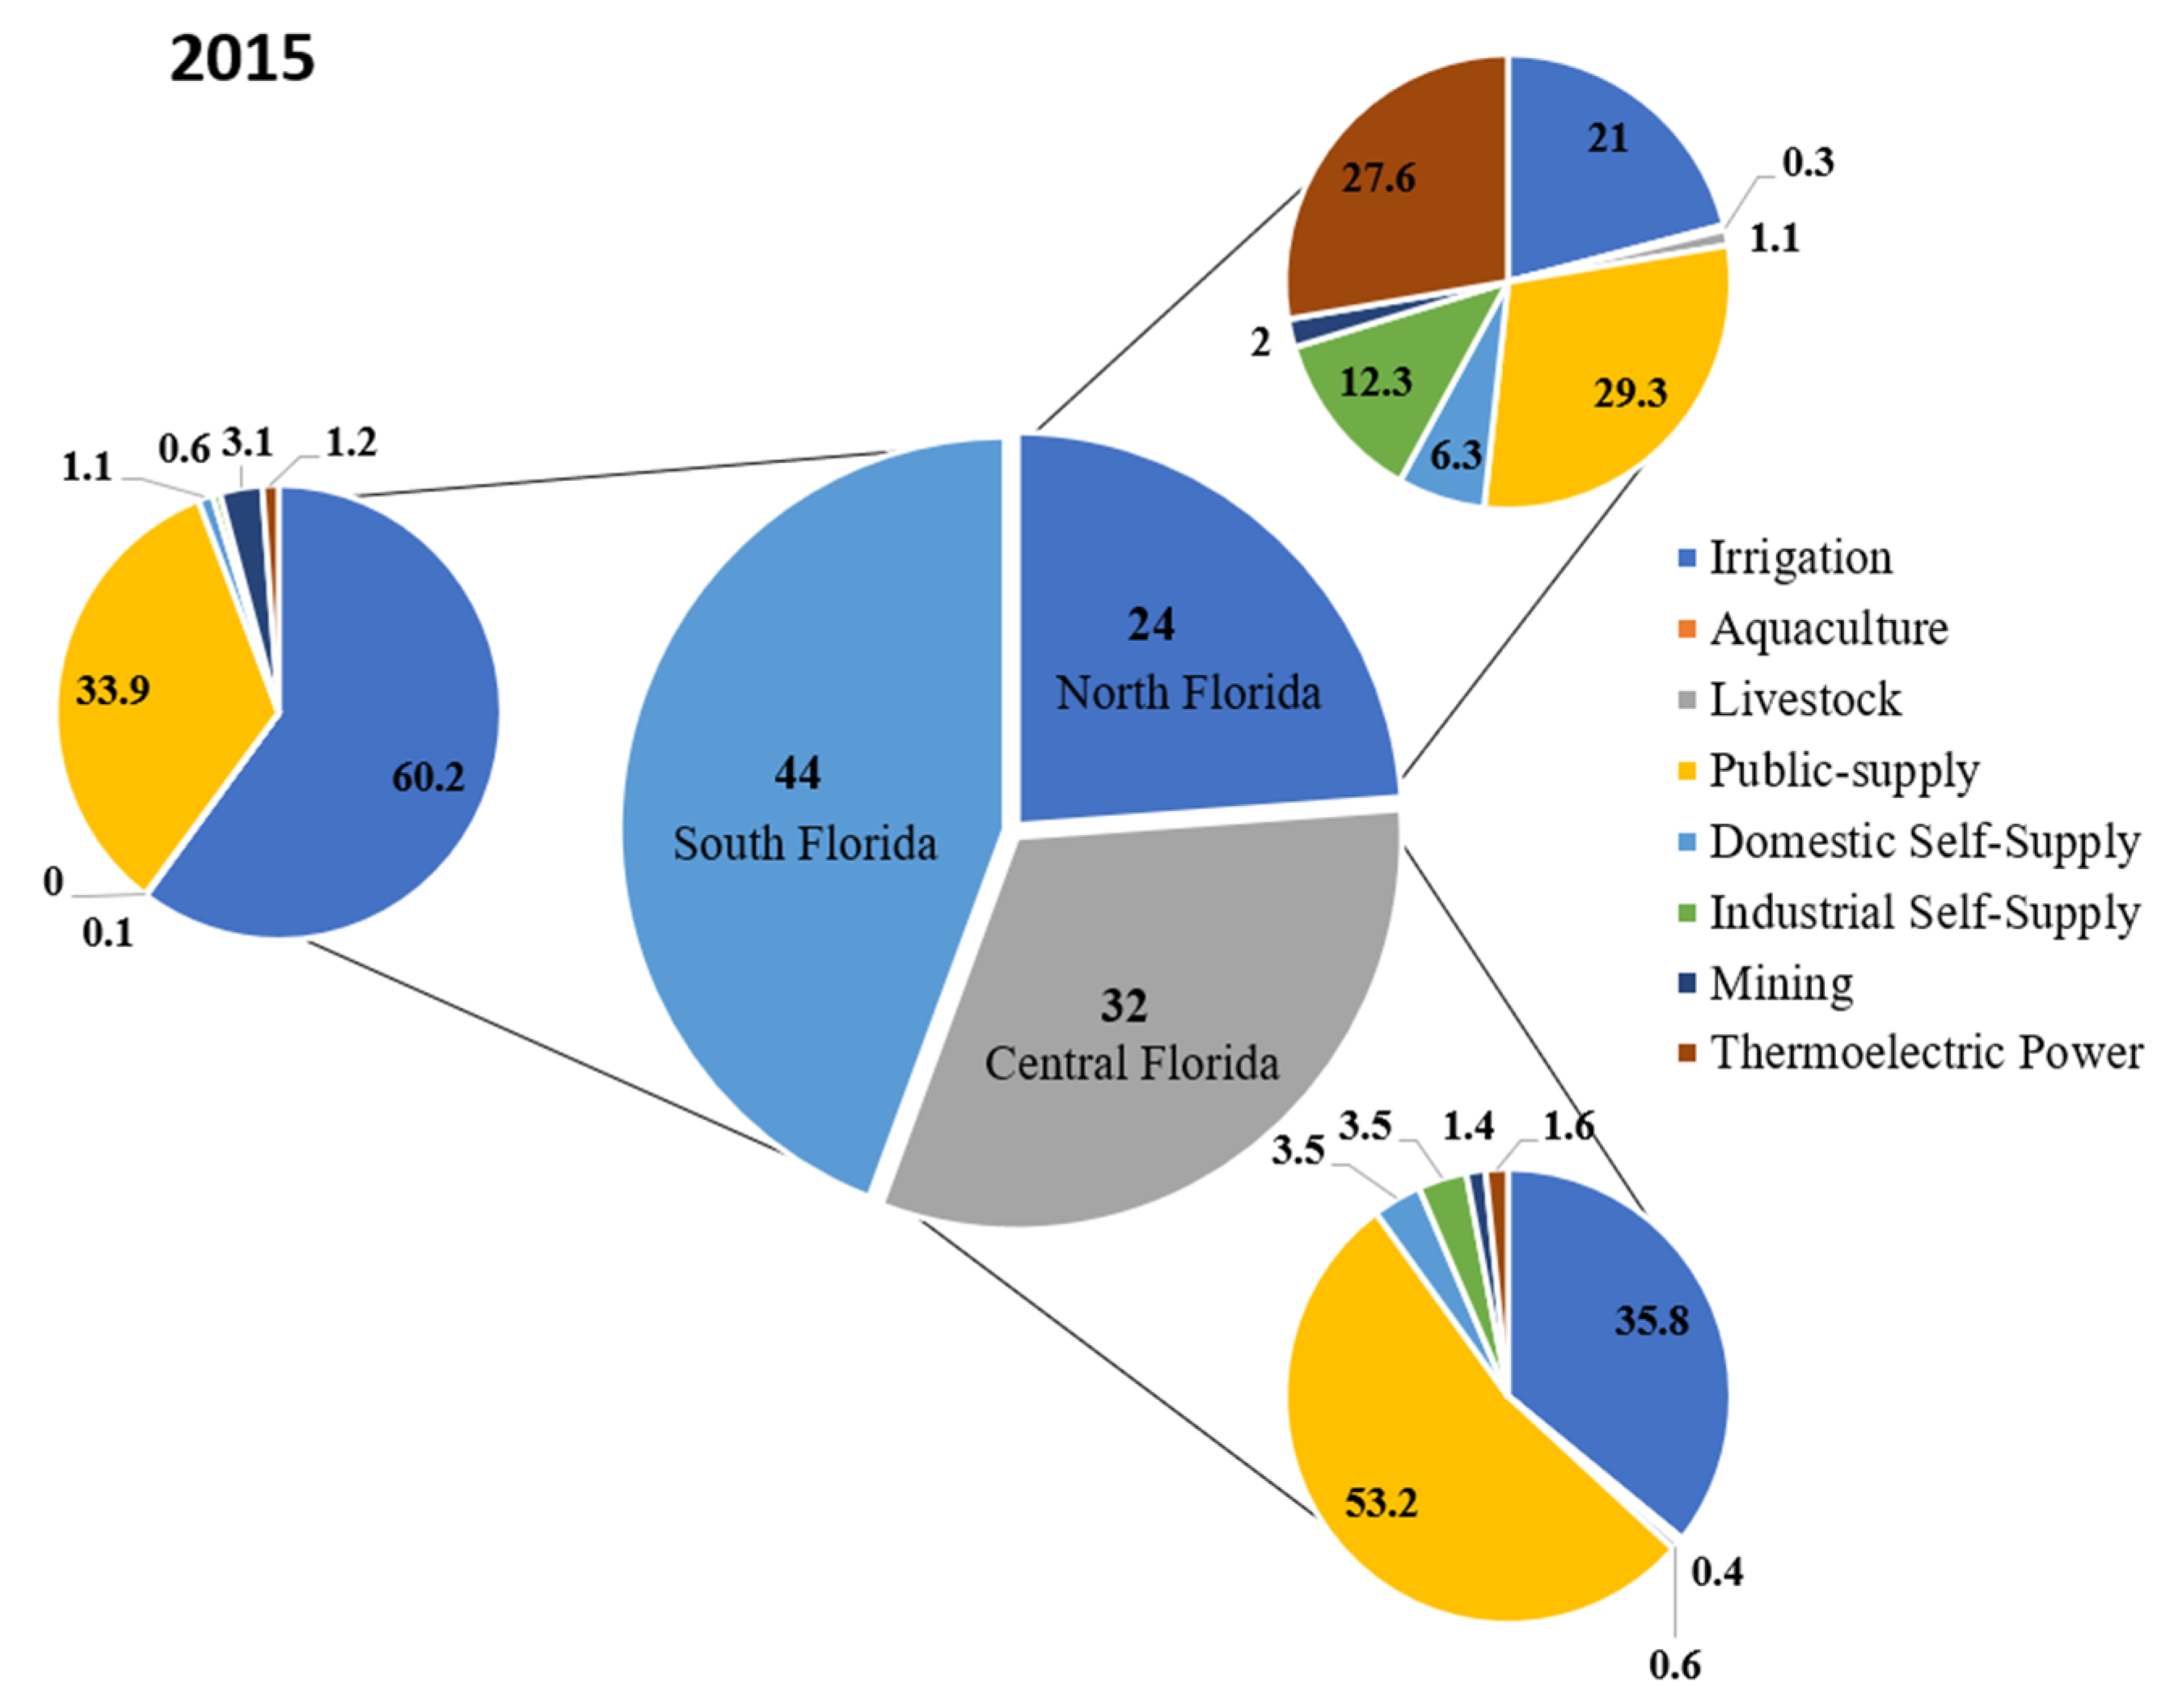
Florida’s total freshwater use was 6868 Mgal/d in 2005, 6399 Mgal/d in 2010, and 6399 Mgal/d in 2015. Water-use data leading to these results are from the following categories public supply, domestic self-supply, industrial self-supply, mining, thermoelectric power, irrigation, livestock, and aquaculture. In 2005, north Florida used 21% of the total freshwater use in Florida, central Florida, 35%, and south Florida, 44% (Figure 5). In 2010, freshwater use increased to 22% in north Florida and 37% in central Florida, dropping to 41% in south Florida (Figure 6). In 2015, freshwater use was similar to 2005 (44%) in south Florida but increased to 24% in north Florida; however, it has dropped to 32% in central Florida (Figure 7).
- ₋ Irrigation—Three (3) types of irrigation practices were observed in Florida: sprinkler/spray irrigation (method of applying water in a controlled manner that is similar to rainfall), micro-irrigation (low-pressure, low-flow-rate type of irrigation that can reduce the likelihood of overwatering a landscape), and surface irrigation (also known as flood or furrow irrigation), where farmers flow water down small trenches running through their crops. Compared to all the other categories, in 2005, irrigation water use was 17.4% in north Florida, 44.7% in central Florida, and 58.9% in south Florida (Figure 5). In 2010, irrigation water use increased to 20.5%, 46.9%, and 61.9% in north, central, and south Florida consecutively (Figure 6). In 2015, irrigation water use was still 21% in north Florida as of 2010. However, it has consecutively decreased to 35.8% and 60.2% in central and south Florida (Figure 7).
- ₋ Aquaculture—Aquaculture water use was less than 1% in all three Florida regions in 2005 and 2015 (Figure 5 and Figure 7). In 2010, aquaculture water use was less than 1% in north and central Florida. Curiously, in 2010, the data reported showed that there was no water use in aquaculture in south Florida (Figure 6).
- ₋ Public Supply—In 2005, the public water supply was 30.1% in north Florida, 42.7% in central Florida, and 36.3% in south Florida (Figure 5). In 2010, public-supply water use decreased to 36.9% and 33.2% in central and south Florida consecutively but was 30.3% in north Florida (Figure 6). In 2015, public-supply water use decreased to 29.3% in north Florida, while it increased to 53.2% and 33.9% in central Florida and south Florida, consecutively (Figure 7).
- ₋ Domestic Self-Supply—In 2005, domestic self-supplied water use was 6.4% in north Florida, 2.5% in central Florida, and 1.2% in south Florida (Figure 5). In 2010, it consecutively dropped to 6.1% and remained at 1.2% in north and south Florida, while it increased to 4.4% in central Florida (Figure 6). In 2015, domestic self-supplied water use increased to 6.3% in the north, decreased to 3.5% in central Florida, and slightly dropped to 1.1% in south Florida (Figure 7).
- ₋ Industrial Self-Supply—Self-supplied water use was 12.5% in north Florida, 2.3% in central Florida, and less than 1% in south Florida in 2005 (Figure 5). In 2010, it consecutively dropped to 11.9%, 2%, and remained less than 1% in north, central, and south Florida, while it increased to 4.4% in central Florida (Figure 6). In 2015, industrial self-supplied water use remained at 12.3% in north Florida as in 2005, but increased to 3.5% and dropped to less than 1% in central and south Florida consecutively (Figure 7).
- ₋ Mining—In 2005, water use in the mining sector was 3% in north and central Florida regions (Figure 5 and Figure 6) and 2.6% in south Florida. In 2010, it decreased to 2.2%, 1.3% and 2.1% in north, central, and south Florida (Figure 6). In 2015, mining water use was 2% in north Florida, 1.4% in central, and 3.1% in south Florida (Figure 7).
- ₋ Thermoelectric Power—In 2005, thermoelectric power water use was 30.3% in north Florida, 4.3% in central Florida, and 0.5% in south Florida (Figure 5). In 2010, It decreased to 28.3% in north Florida but increased to 8% and 1.4% in central and south Florida consecutively (Figure 6). In 2015, thermoelectric power water use decreased to 27.6% in north Florida, 1.6% in central, and 1.2% in south Florida (Figure 7).
3.1.2. Urban and Rural Water Use
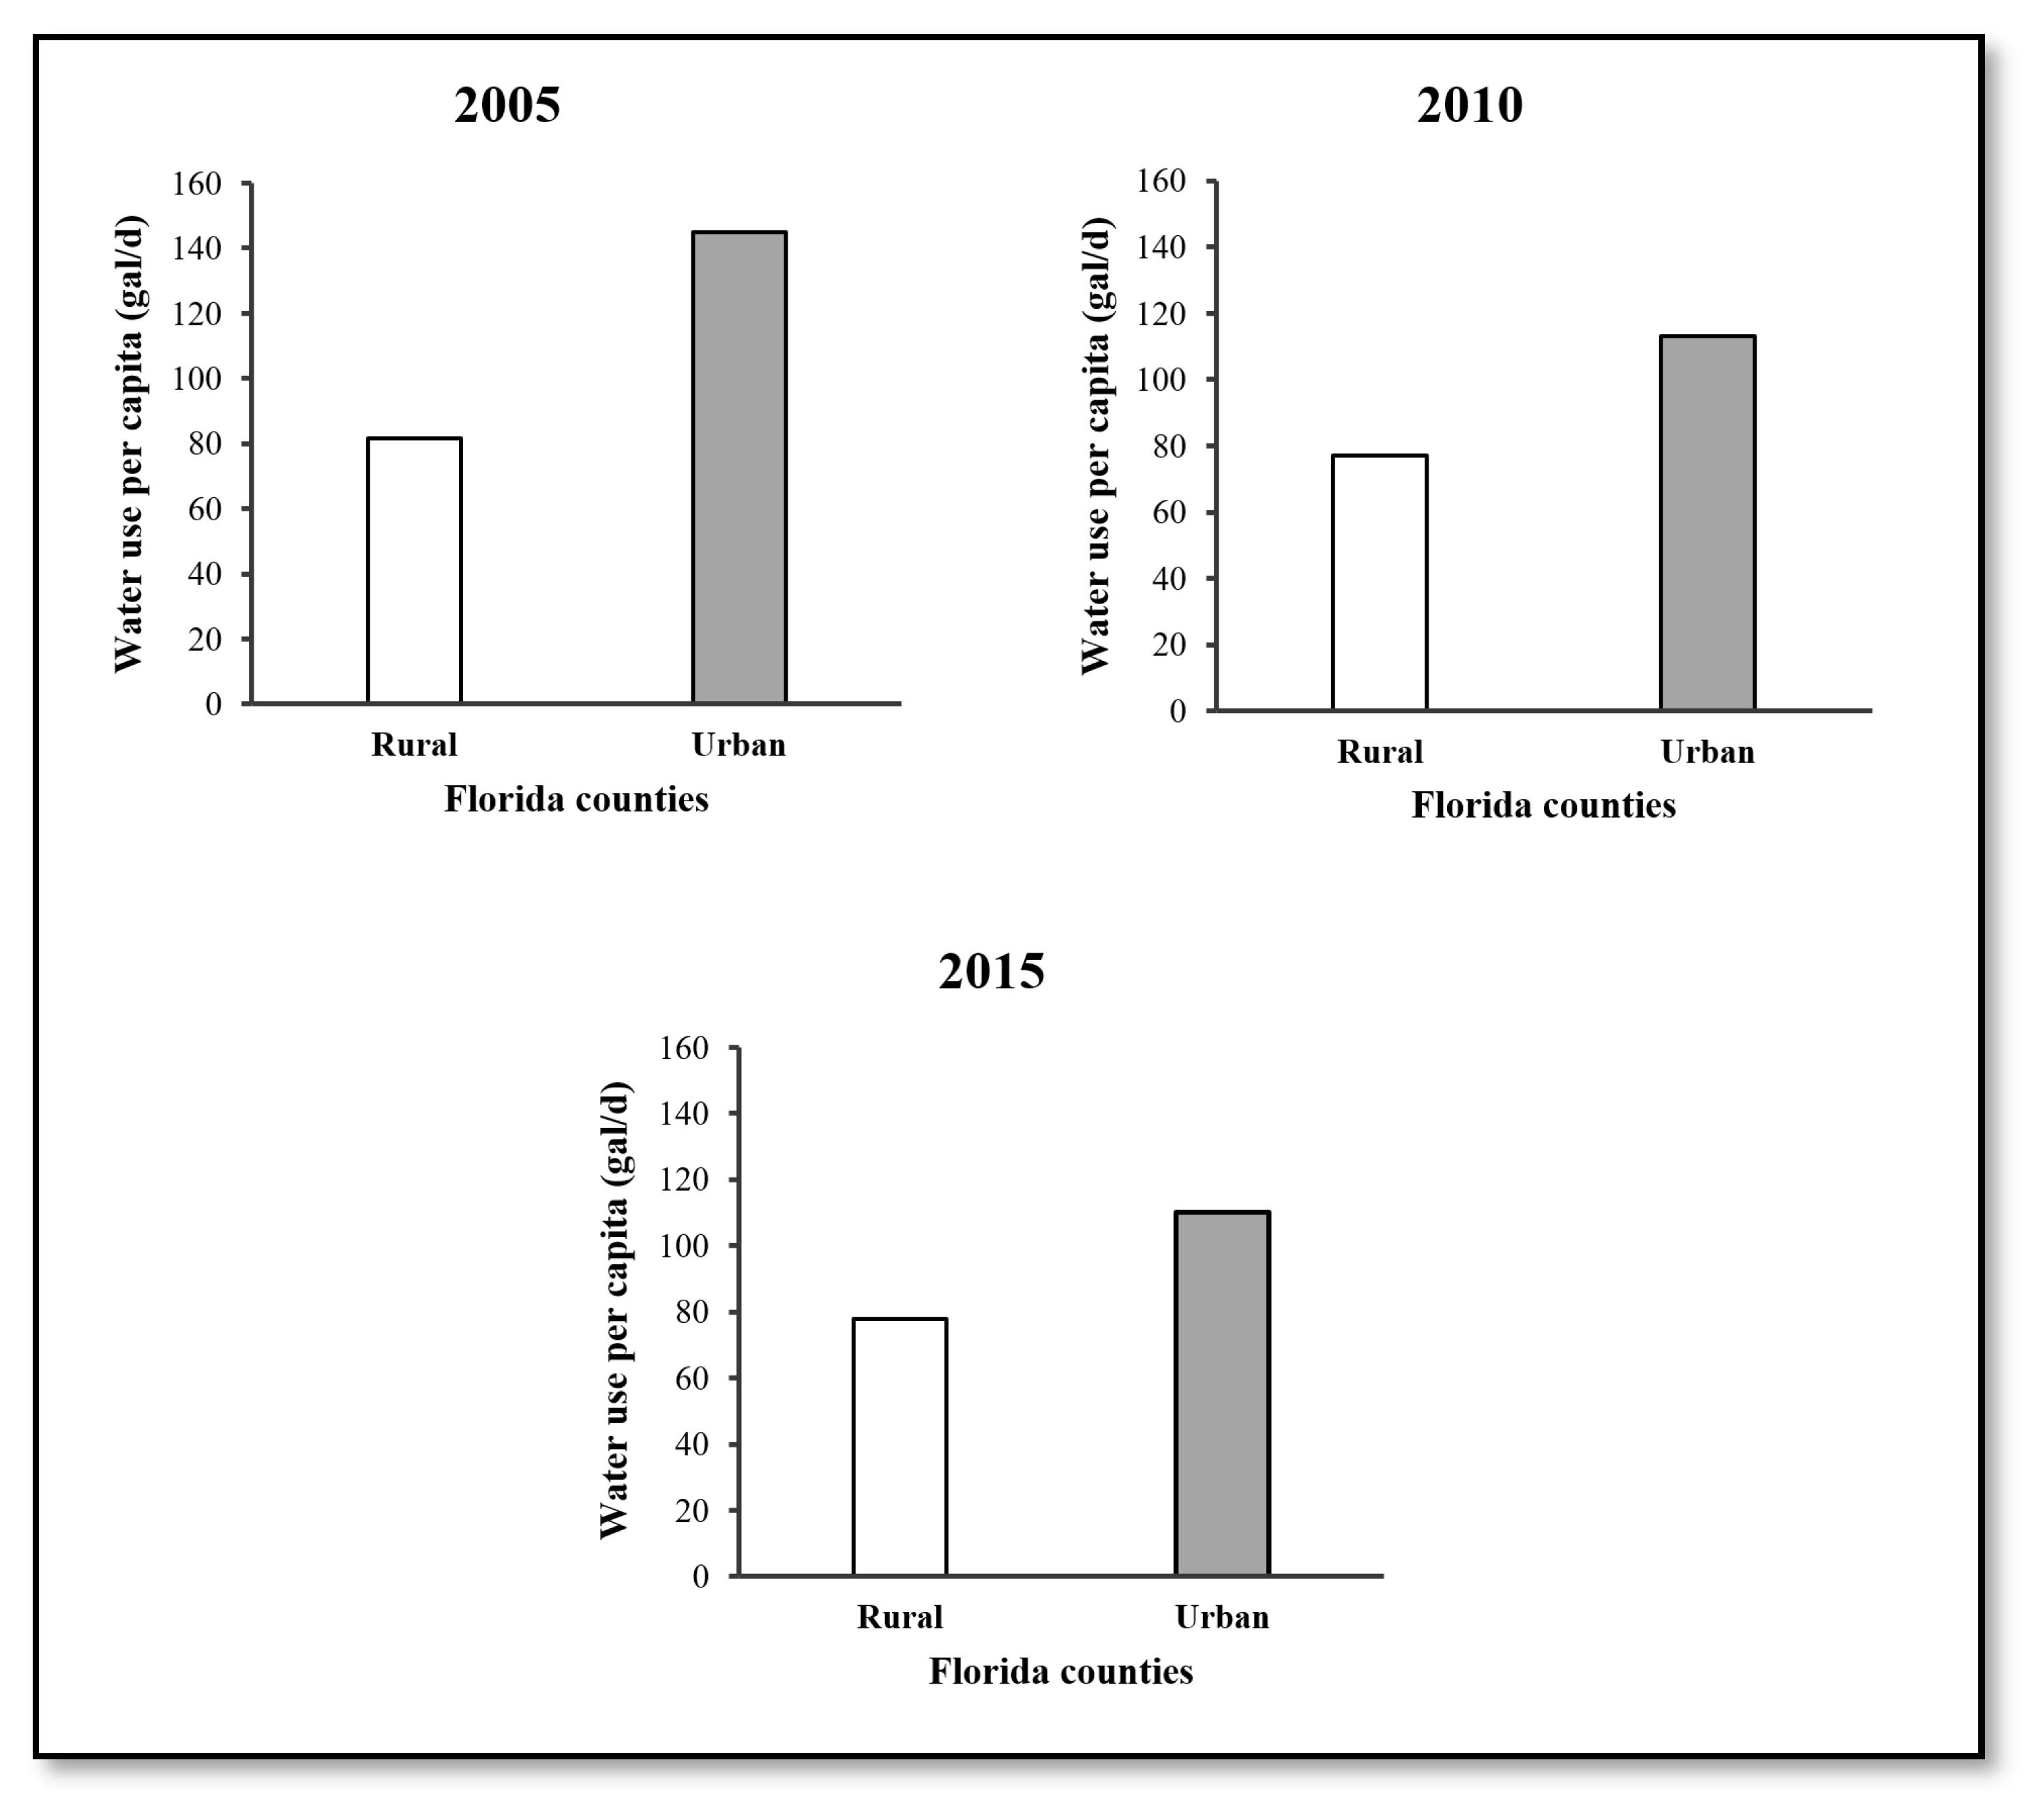
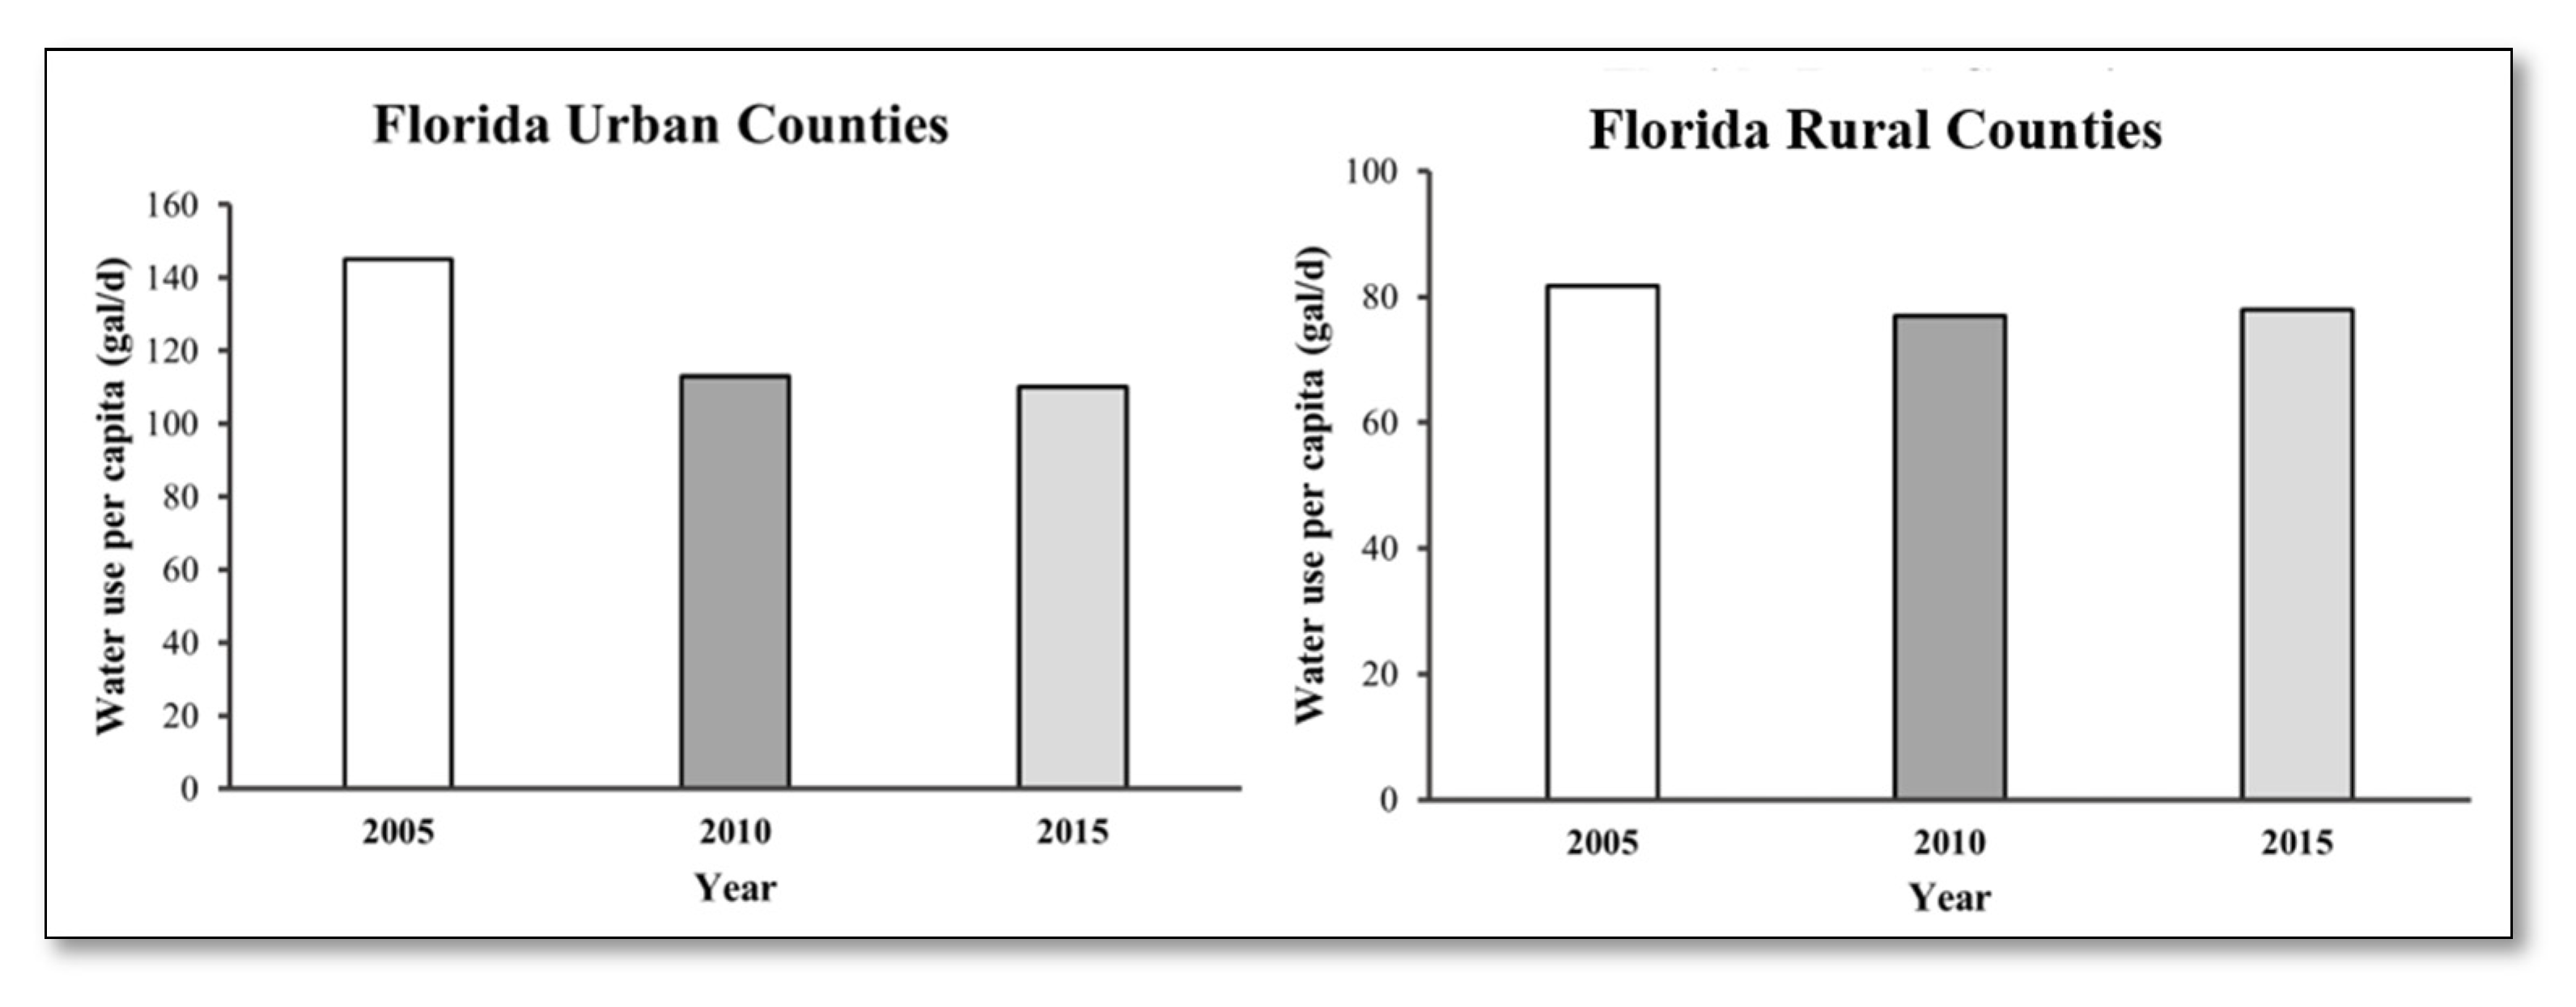
In 2005, Florida counted 33 rural counties and 34 urban counties. In 2010 and 2015, Putnam, Nassau, and Sumter counties were reclassified from rural to urban counties. Therefore, it has become 30 rural and 37 urban counties. The distribution of the average daily per capita water use for Florida urban and rural counties in 2005 is shown in Figure 8, suggesting that the average is about 81.7 gal/person/d in rural counties and 145.04 gal/person/d in urban counties. In 2010, water use per capita in urban counties was 113.09 gal/person/d and 76.9 gal/person/d in rural counties, while in 2015, water use per capita in urban counties was 110.10 gal/person/d and 77.9 gal/person/d in rural counties (Figure 8). When comparing the variation of water use per capita within rural and urban counties over the years, the graphs displayed in Figure 9 show that water use per capita has decreased significantly for both rural and urban counties from 2005 to 2010 and slightly varied from 2010 to 2015.
3.1.3. Water Use by Source
In Florida, freshwater use can have two potential sources: groundwater and surface water. Groundwater was the most used in all three Florida regions compared to surface water. There was a significant difference between the amount of freshwater used from groundwater and surface water in Florida. However, in 2015, the difference was very slim between the amount of groundwater and surface water in south Florida (Figure 10).
From 2005 to 2015, the water used in crop irrigation, livestock, and aquaculture in north and central Florida was dominated by groundwater, while surface water was the most used in South Florida. For Public supplied water, groundwater provided most of the water needed by all three Florida regions. Only groundwater was used for domestic self-supply use in north, central, and south Florida. More groundwater was used in north and central Florida for industrial self-supplied water, while more surface water was used in south Florida. In 2010, surprisingly, industrial self-supplied water use in south Florida was only from groundwater. Only groundwater was used for mining water in Florida, except in south Florida, while surface water was the most used in all three regions of Florida for the thermoelectric power sector.
3.1.4. Change in Water Use
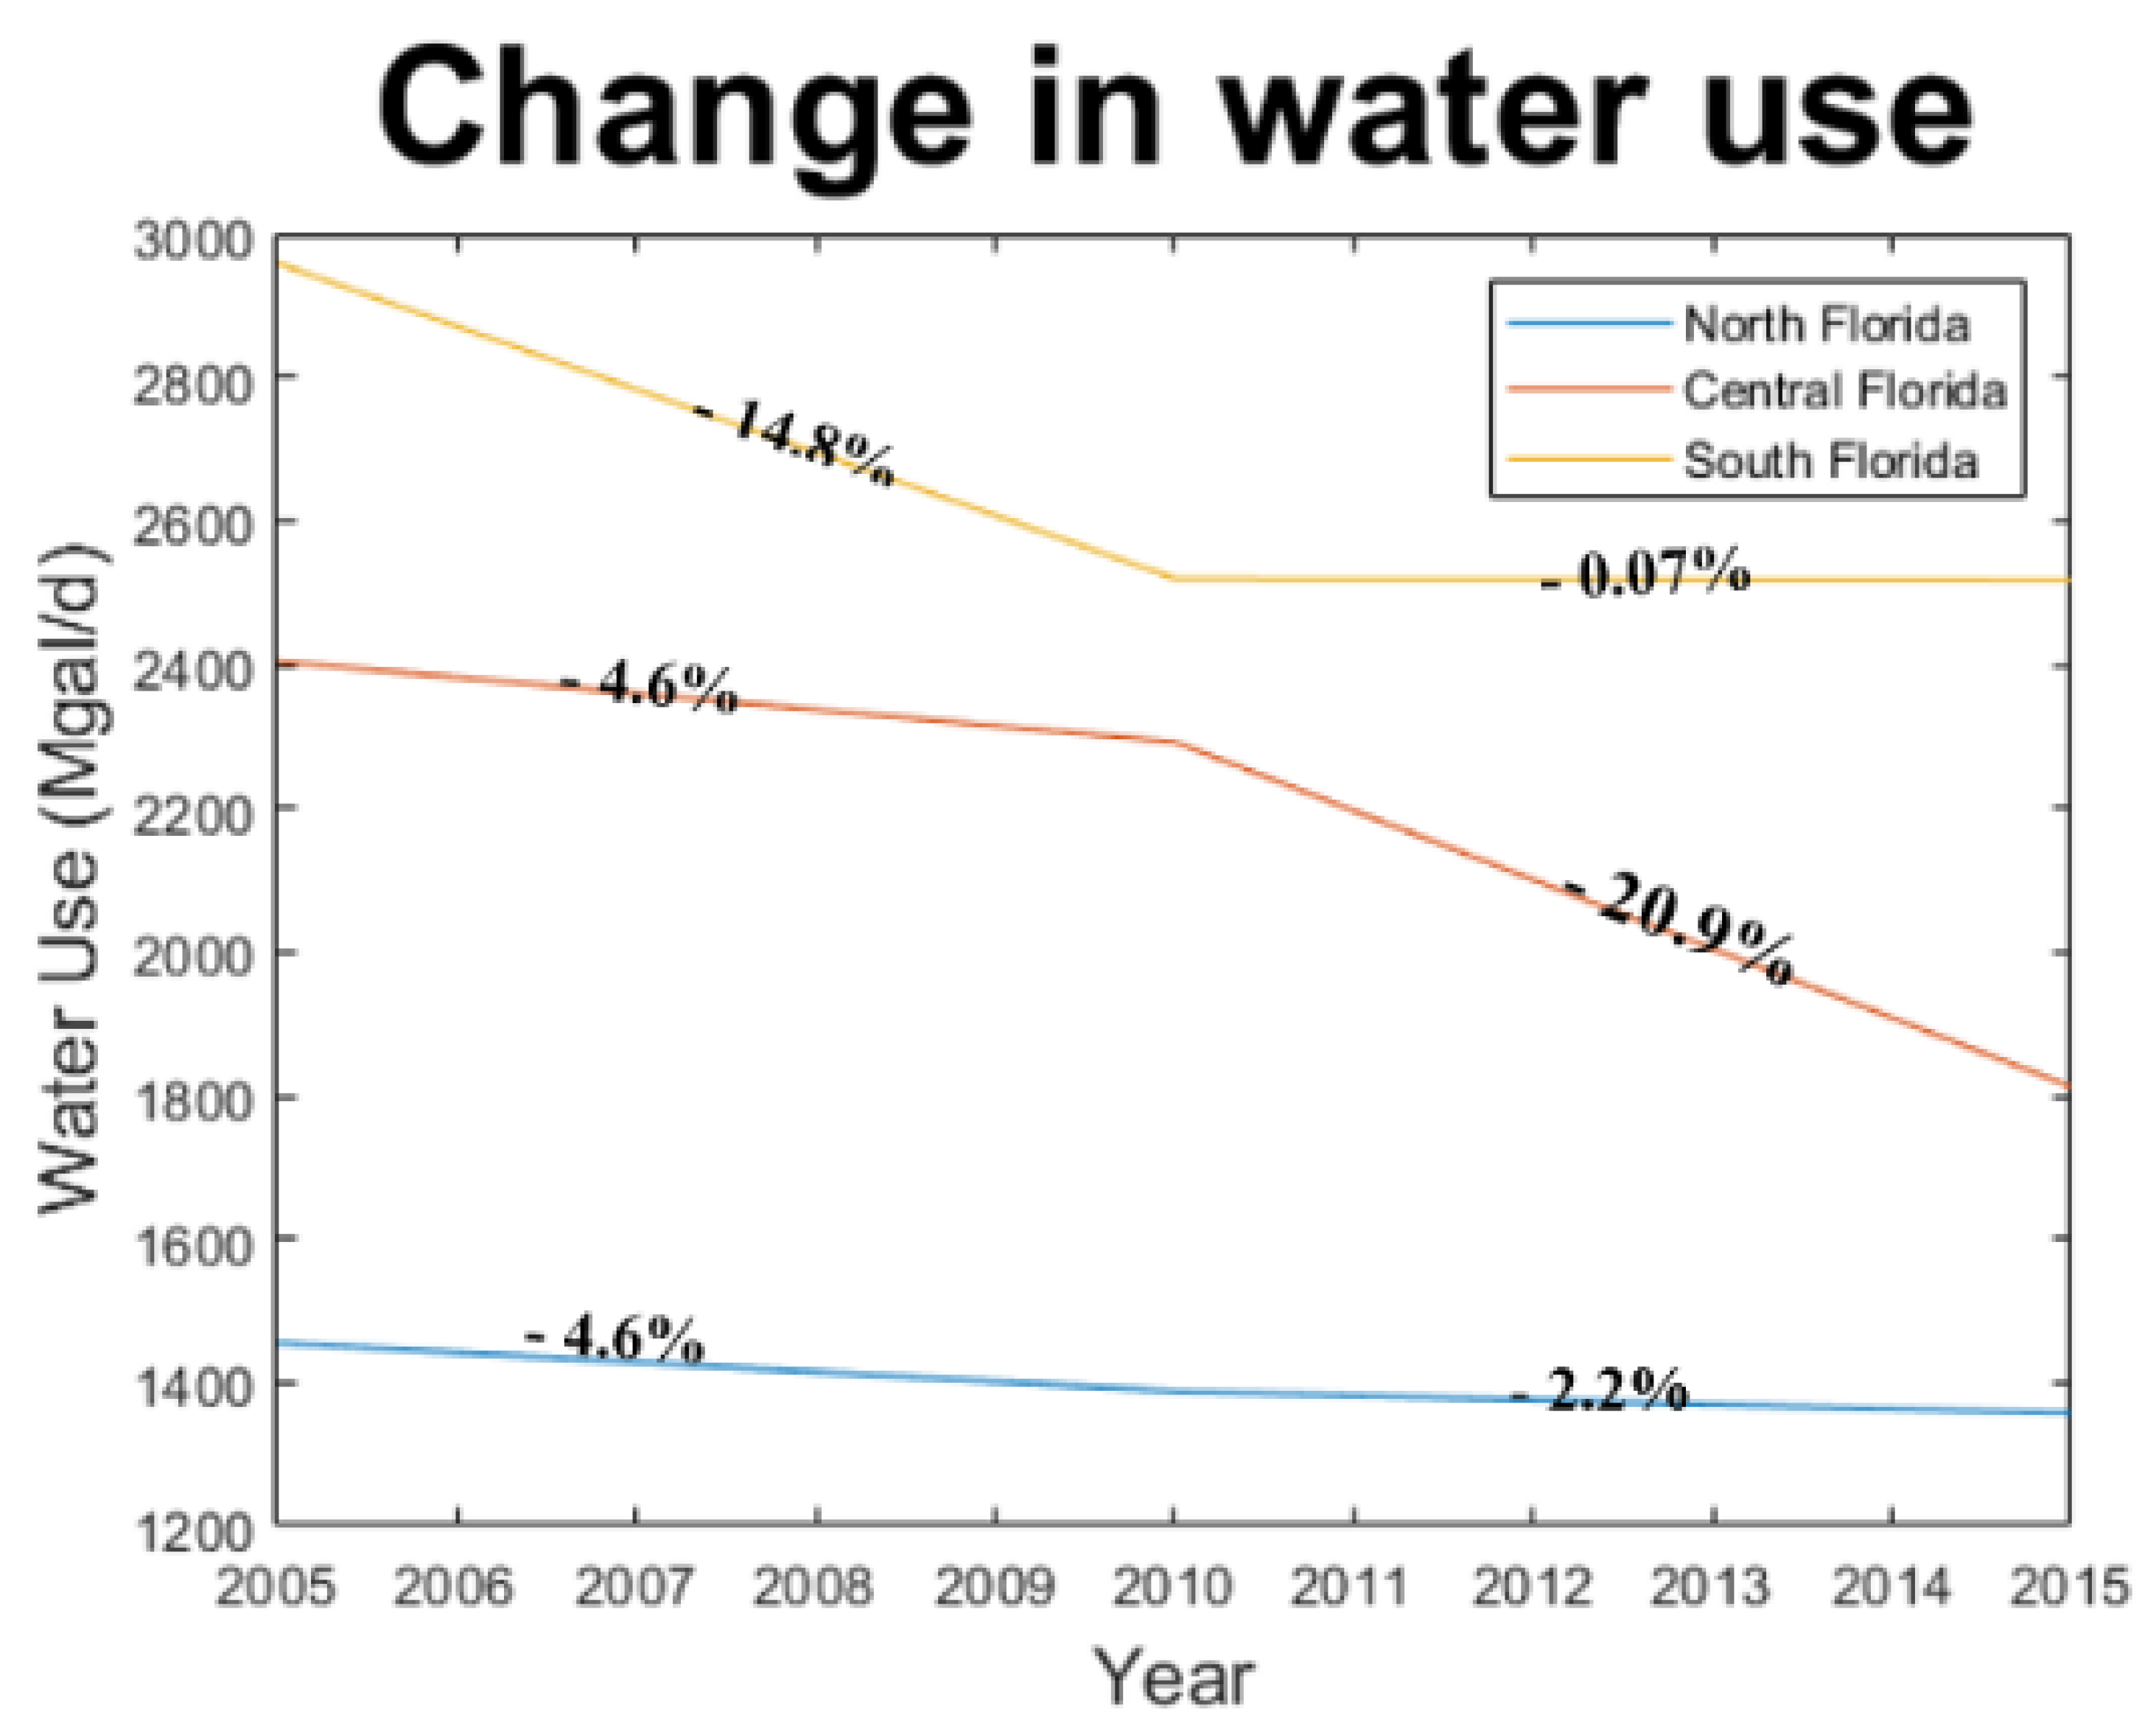
From 2005 to 2015, variations were observed in the amount of water used in the three regions of Florida. We looked at the difference in water use based on two periods: from 2005—2010 and 210- 2015 for north, central, and south Florida (Figure 11). In north Florida, freshwater use dropped by 4.6% from 2005 to 2010 and kept dropping by 2.2% from 2010 to 2015. In central Florida, the quantity of freshwater used decreased by 4.6% from 2005 to 2010 and significantly reduced by 20.9% from 2010 to 2015. In south Florida, freshwater use dropped by 14.8% from 2005 to 2015 and slightly decreased by 0.07% from 2010 to 2015.
3.2. Drivers of Water Use
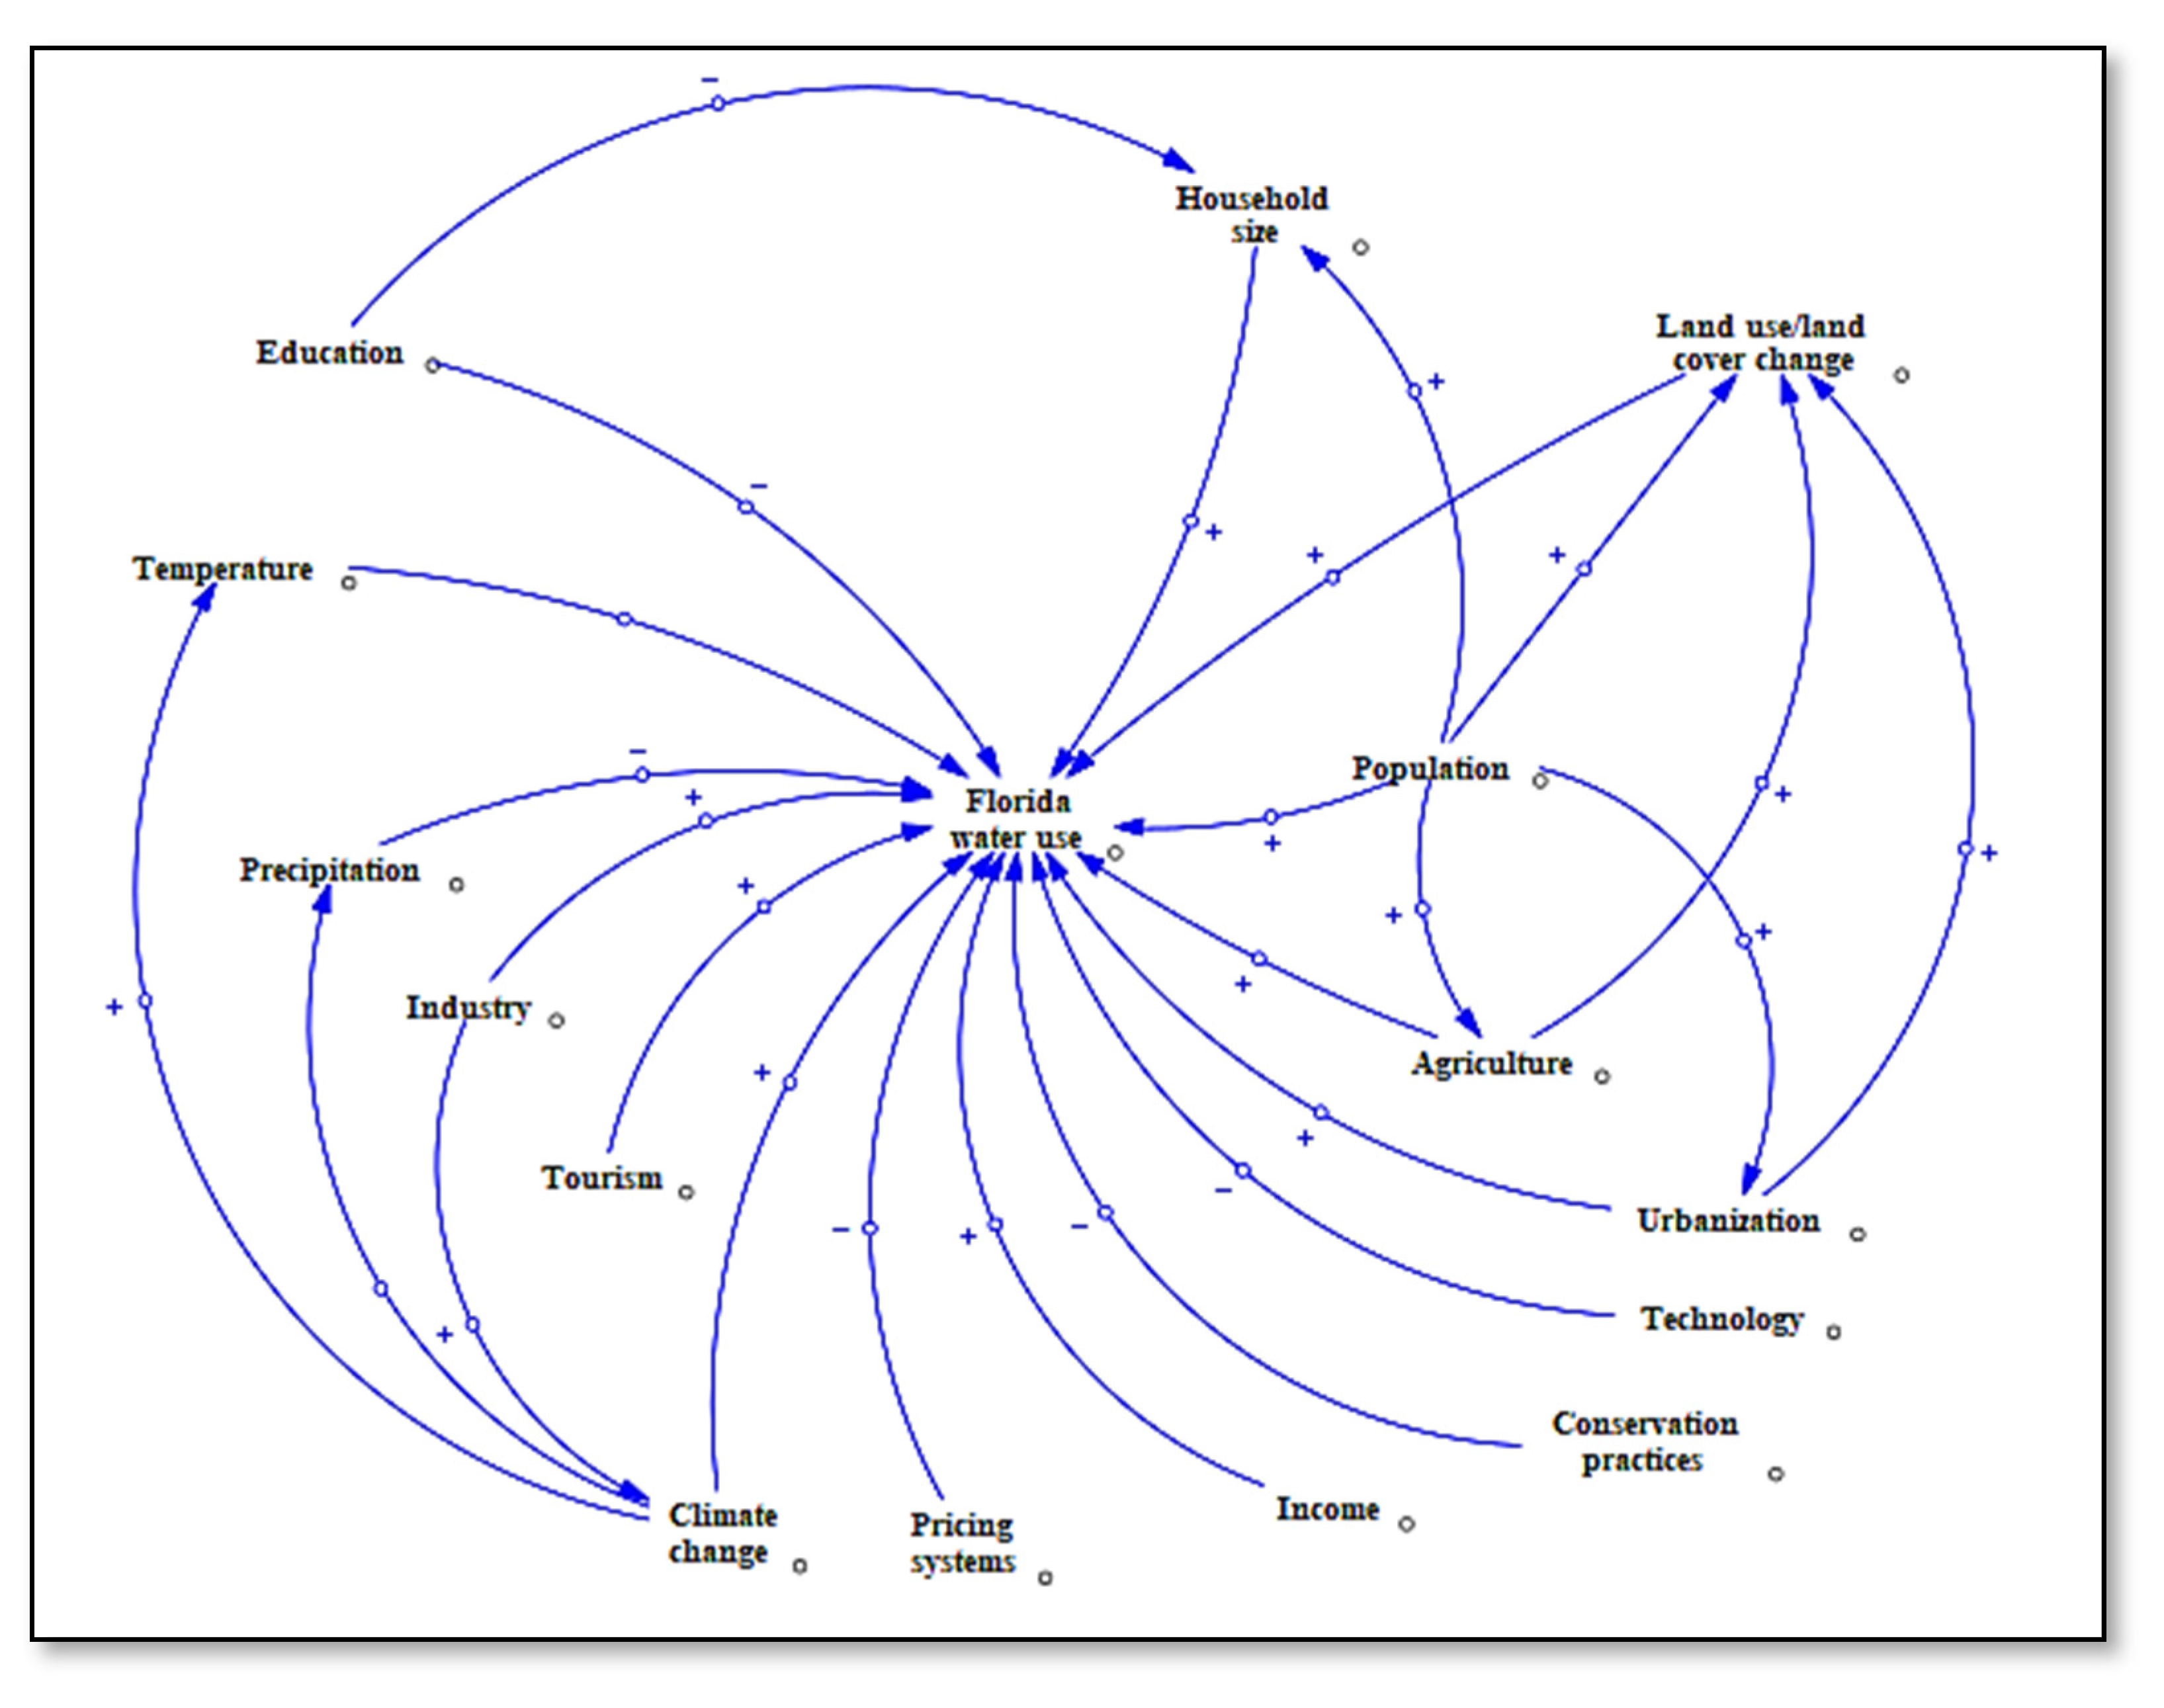
Drivers can influence patterns and trends in water use. In this paper, drivers of Florida water use are classified into several groups, such as sociodemographic, environmental, economic, regulatory policies, and technical drivers. The sociodemographic drivers are population, education, urbanization, household size, and income. Land use/land cover change, climate change, temperature, and precipitation are considered environmental drivers. Agriculture, industry, and tourism are drivers related to the economy, while conservation methods and pricing systems are more likely regulatory policies and technology, mainly technical (Table 1). Figure 12 shows interrelationships between water use and its drivers in Florida.
As presented in the causal loop diagram (Figure 12), household size, land use/land cover change, urbanization, agriculture, population, income, climate change, tourism, and industry have positive polarities with water use [16,49,50]. These drivers increase the amount of water use in Florida. Other drivers, including pricing systems, conservation methods, education, and technology, have negative polarities with Florida water use. Temperature and precipitation can increase or decrease water use depending on whether they are high or low.
Some drivers can directly influence water use and indirectly affect other water-use drivers. These drivers are education, population, climate change, agriculture, and urbanization. According to the causal loop diagram (Figure 12), the population influence more water use drivers than any other drivers identified in this study. Further discussion about the drivers’ relationships with Florida water use will be provided later in the paper.

Table 1.
Sources of publications for water use driver identification.
| Categories | Drivers | Citations |
|---|---|---|
| Sociodemographic | Population | [16,23,51,52] |
| Education | [22,23] | |
| Urbanization | [15,53] | |
| Household size | [51] | |
| Income | [51] | |
| Environmental | Land use/land cover change | [16,49] |
| Climate change | [51,54] | |
| Temperature | [54,55] | |
| Precipitation | [54,55,56] | |
| Economic | Agriculture | [50] |
| Industry | [57] | |
| Tourism | [51] | |
| Policy | Conservation methods | [51] |
| Pricing systems | [51,52,58] | |
| Technical | Technology | [59,60] |
3.3. Water Use and Population
Regression is a basic method commonly employed to model the relationship between two indicators and propose the dependent indicator values as a function of the independent indicators. In this study, the correlation assessment between water use and the population was evaluated using simple linear regression analysis in the three regions of Florida. The results of the regression-based correlation assessments carried out in this study are represented in Table 2.
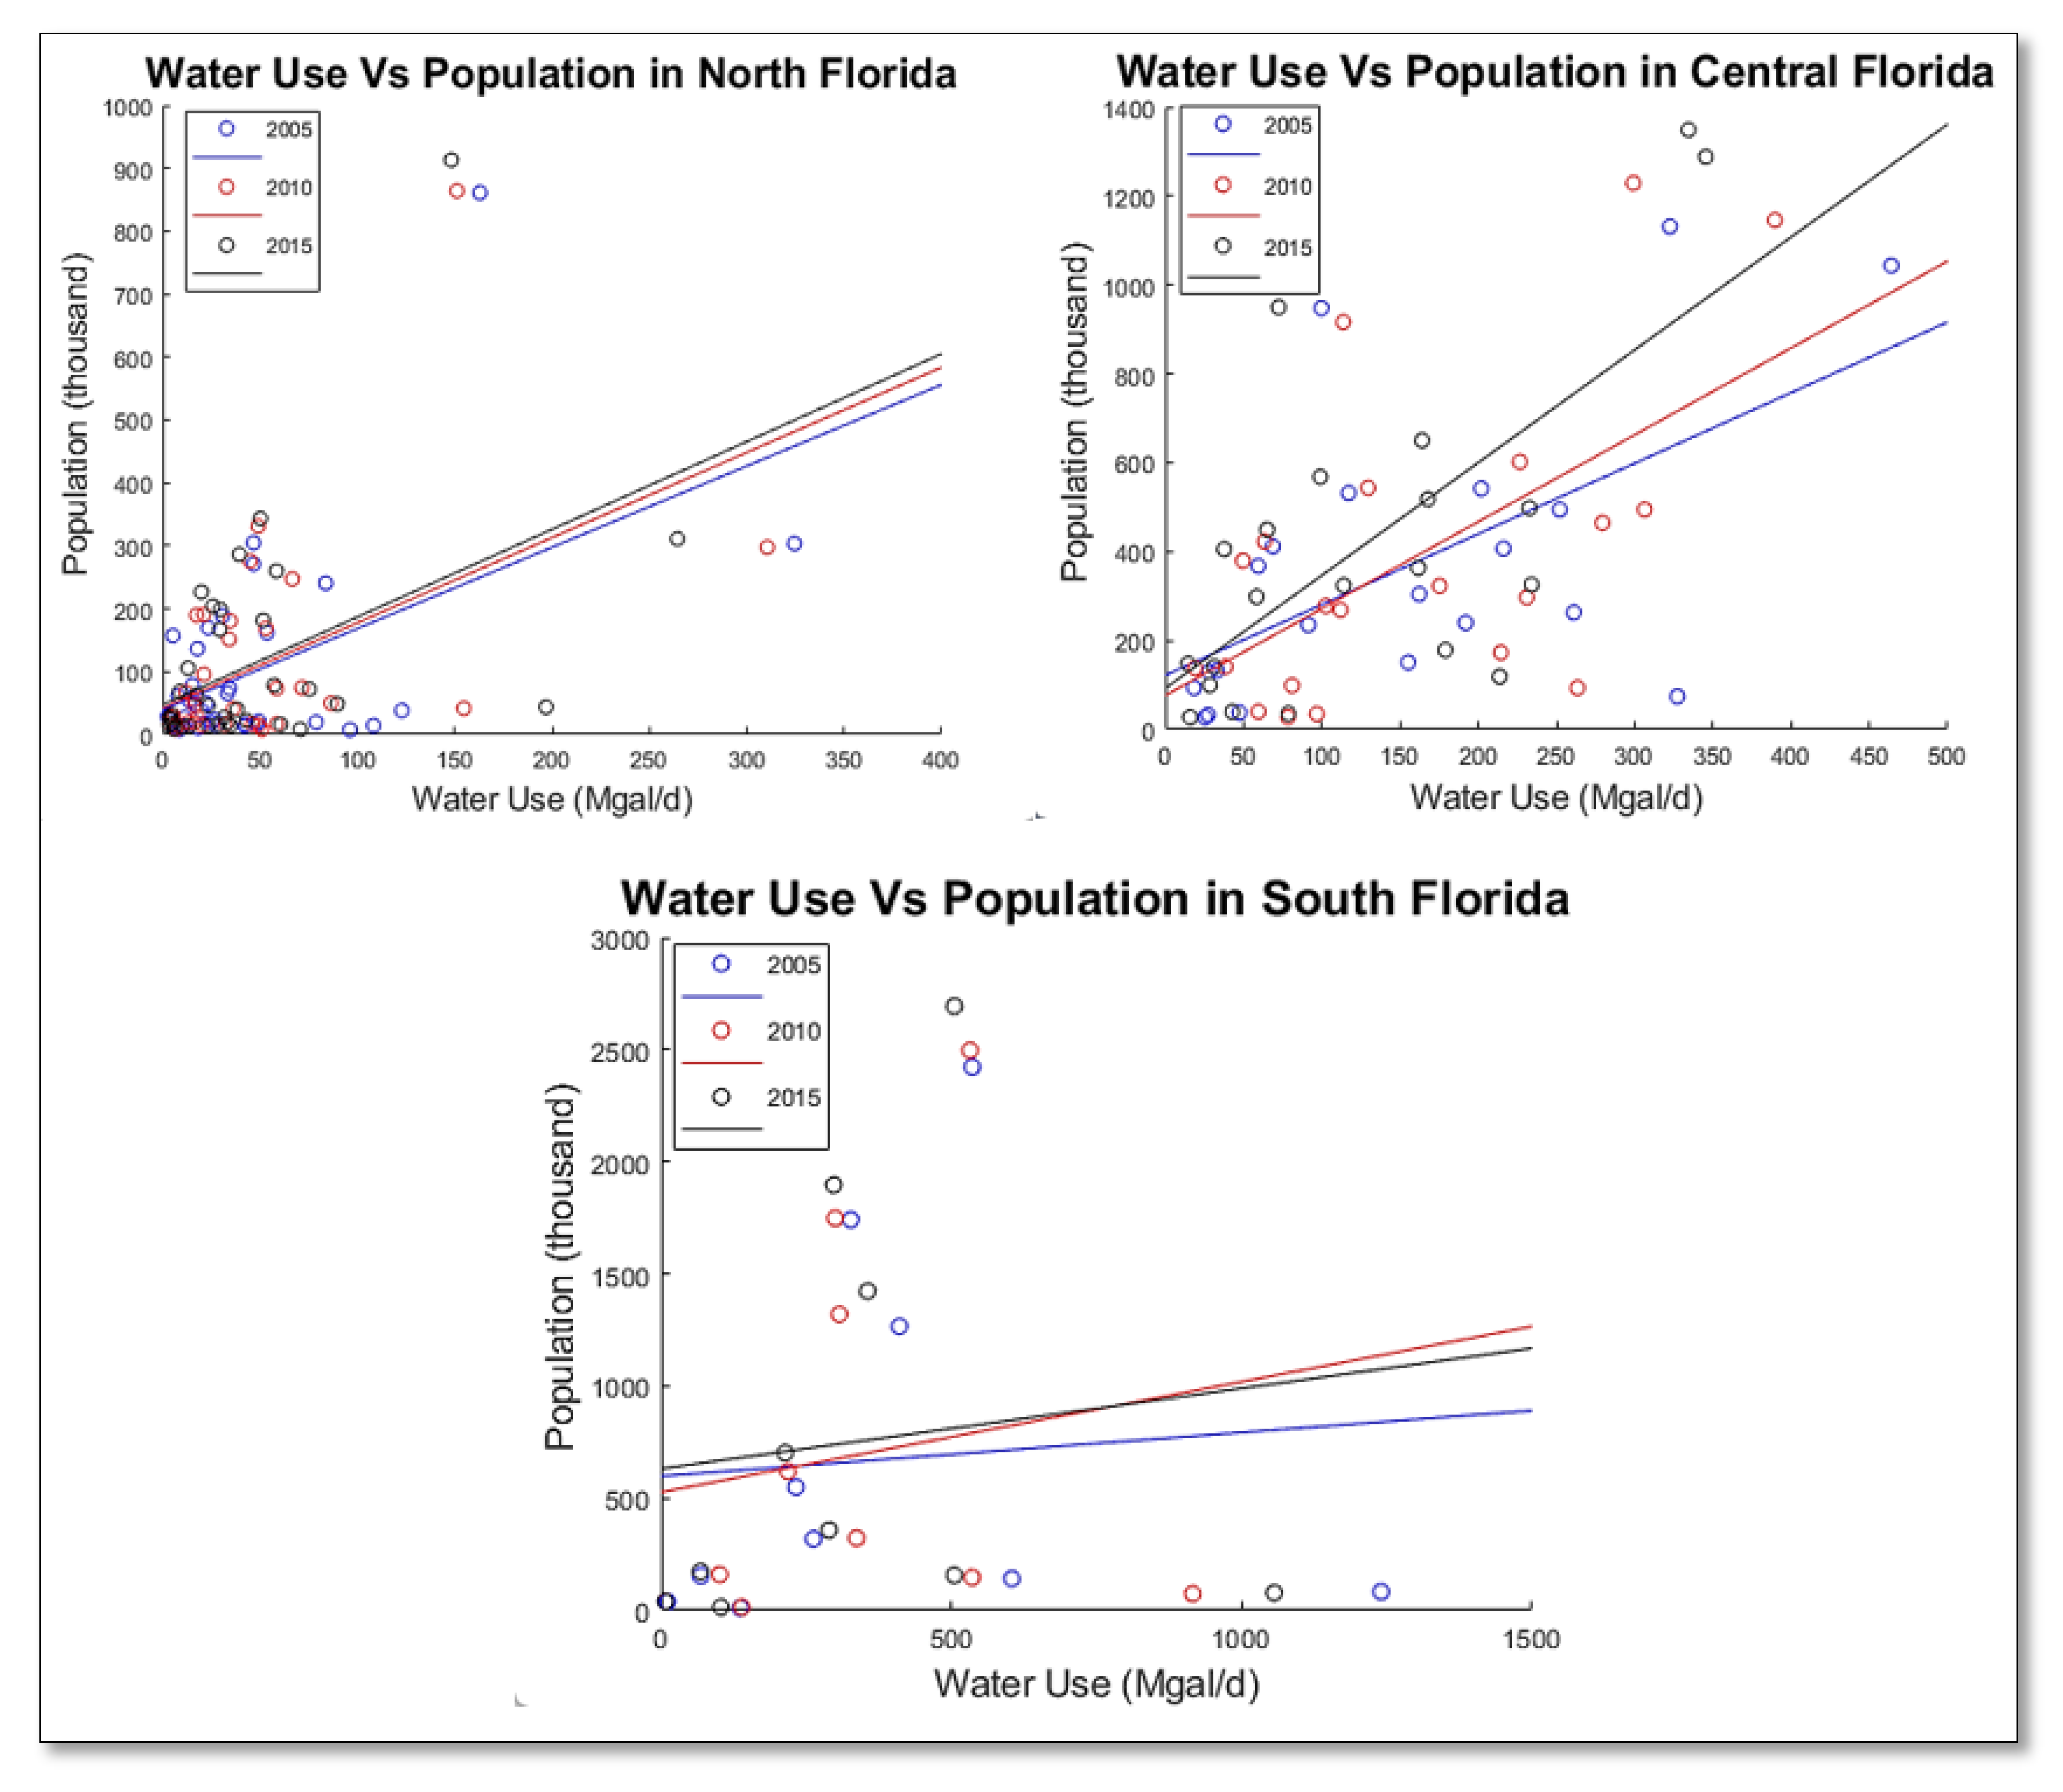
In linear regression analysis, a positive value indicates a positive linear correlation between the indicators. According to the plots in Figure 13 and the equations given in Table 1, it can be concluded that there were positive linear correlations between the population and water use in north, central, and south Florida in 2005, 2010, 2015 (columns R2 and R in Table 1). There were weak positive correlations between population and water use in north Florida in 2005, 2010, and 2015. Moderate positive correlations were recorded between population and water use in central Florida in 2005, 2010, and 2015. In south Florida, only very weak positive correlations were recorded between population and water use in 2005, 2010, and 2015. The computed coefficient of determination for central Florida indicated that about 35%, 35%, and 45% of water use for the respective years 2005, 2010, and 2015 (columns R2 in Table 1) could be explained by the population growth in the south side of the state.
Table 2.
Results of linear regression for correlation assessment of public supply and population in Florida.
Table 2.
Results of linear regression for correlation assessment of public supply and population in Florida.
| Florida Regions | 2005 | 2010 | 2015 | ||||||
|---|---|---|---|---|---|---|---|---|---|
| Equation | R2 | R | Equation | R2 | R | Equation | R2 | R | |
| North Florida | y = 1.292x + 39.29 | 0.242 | 0.492 | y = 1.353x + 42.34 | 0.239 | 0.489 | y = 1.394x + 47.36 | 0.206 | 0.454 |
| Central Florida | y = 1.589x + 121.9 | 0.351 | 0.593 | y = 1.954x + 76.39 | 0.354 | 0.595 | y = 2.537x + 92.7 | 0.451 | 0.672 |
| South Florida | y = 0.1952x + 597.6 | 0.007 | 0.082 | y = 0.4926x + 526.5 | 0.0227 | 0.151 | y = 0.3579x + 631. | 0.013 | 0.116 |
4. Discussion
4.1. Demand, Supply, and Water Use Quantity
Statewide water-use data at a county level for all withdrawal categories at 5-year intervals collected from USGS are used to analyze water use in north, central and south Florida. However, it is sometimes difficult to analyze water use because of differences in data-collection techniques, methods, and changing sources of information through the years [61]. Therefore, in this study, we had only considered data from 2005 to 2015 related to public supply, domestic self-supply, industrial self-supply, mining, thermoelectric power, irrigation, livestock, and aquaculture. Groundwater was the most common source of water from 2005 to 2015. This is more likely because of its good quality and widespread availability throughout the state [8].
When we compare the three (3) regions of Florida, Figure 5, Figure 6 and Figure 7 show that north Florida water use increased from 21% to 24% of the total water use from 2005 to 2015. In central Florida, water use increased from 35% in 2005 to 37% in 2010, then dropped to 32% in 2015. The highest rate of water use was seen in south Florida at 44% in 2005, but decreased to 41% in 2010, then increased to 44% in 2015. Agricultural water use (irrigation, livestock, and aquaculture) was significantly higher in south Florida than in the other two Florida regions (north and central Florida) from 2005 to 2015. South Florida’s irrigation water use was also considerably higher than any other water-use category from 2005 to 2015.
After irrigation, livestock, and aquaculture considered as agricultural water use, the five remaining categories show differences in water use amounts. The highest water use rate was recorded for public supply, consecutively followed by domestic self-supply, industrial self-supply, mining, and thermoelectric power. Although Figure 5, Figure 6 and Figure 7 show different variations in the rate of water use for all eight (8) categories, Figure 11 shows an overall reduction in the amount of water use in Florida from 2005 to 2015. All the water-use categories are affected by that reduction except mining water use. In fact, there was an increase in the amount of water used in the mining sector from 2005 to 2015. That increase might occur as new homes, commercial facilities (health facilities, hotels, restaurants, shopping areas), and road construction have increased statewide since 2010 [62].
Concerning public supply water use, the decrease can be a result of factors such as more efficient appliances and plumbing fixtures; water conservation through improved education of users, changes in rate structures, better loss-prevention programs; the availability of reclaimed wastewater as a lawn irrigation option; water management mandates and constraints [63]. Another possible factor could be a shift by commercial and residential public-supply customers from using purchased water for lawn or landscaping irrigation to obtaining water from a canal, lake, or individual well exclusively for this purpose [8]. The long-term decline in water use was a surprise in thermoelectric power since Florida is considered the second-largest electricity producer in the United States, behind Texas [64]. Possible causes of the decrease in industrial self-supply withdrawals may be the conversion of self-supplied users to public water supplies and a greater reliance on more water-efficient technologies [65].
4.2. Drivers of Change Affecting Florida Water Use
Several drivers identified from the literature were found to influence water use in Florida. Some studies reported household size [51], land use/land cover change [16,49], urbanization [15,53], agriculture [50], population [16,23,51,52], income [51], climate change [51,54], tourism [51], and industry [57] enhances Florida water use. Additionally, pricing systems [51,52,58], conservation methods [51], education [22,23], and technology [59,60] are among the drivers that decrease Florida water use.
As climate change is part of many environmental debates, south Florida experienced severe drought conditions from 2006 to 2009 and 2011 [11]. This situation led to excessive water usage in south Florida. Therefore, conservation measures like limited landscape irrigation and reductions in agriculture use were required during this difficult period [11]. Climate change also influences temperature and precipitation [54], affecting water uptake by plants and animals [55]. Dimkić [66] states that temperature is positively correlated with water use. In addition, low rainfall leads to a greater need for irrigation depending on the distribution of rainfall events [54]. In north Florida, the climate is somewhat cooler and receives a more abundant amount of rainfall yearly [67]. This lower rainfall can explain the relatively lower water use rate in north Florida than in central and south Florida (Figure 5, Figure 6 and Figure 7).
Population growth is also an important driver of water use. According to Ahmad and Prashar [52], a higher population automatically increases the demand for freshwater. Florida has the third highest population in the United States [28], and it is likely to continue to increase [54]. Sun et al. [16] found that the population increase greatly stressed the water supply in Florida. The regression-based correlation assessments in this study show positive correlations between populations (Figure 13). However, low coefficients of determination indicate that population alone does not induce water-use changes. Other drivers of water use, provided in the causal loop diagram (Figure 12), might have played a role in the variation of water use in Florida. The most populated counties, such as Duval in north Florida and Miami-dade in south Florida, show lower water use than Escambia in north Florida and Palm beach in south Florida. The population also influences other drivers, such as household size, urbanization, agriculture, and land use/land cover change. The increase in household size can increase water use per capita [51,68]. Land use/land cover change can influence water use [23,69] when reducing agricultural and forest land to benefit urbanization, leading to high metropolitan water demand [16].
Education, pricing systems, conservation methods, and technology can reduce Florida’s water use. Effective communication and education efforts can address concerns about water quantity issues [23]. Anderson [22] states that Florida should consider a statewide public outreach and education program to inform citizens of the benefits of using reclaimed water from a water conservation perspective. New technologies, including smart irrigation [60] and water-saving devices [70], can increase water-use efficiency in Florida.
The relationship between water pricing and usage varies. Some studies find water pricing causes decreased water use. A 10% increase in rate for residential customers, has shown 1% to 3% reductions in water usage [14]. Other studies indicate that water is an inelastic good, which means that an increase in water price does not proportionally decrease water use [71,72]. A higher cost of water triggers water conservation attitudes in people. Studies observed, inequity when the low income customers were more responsive to price increases than the high income customers indicating a larger reduction in residential demand in a lower income community when compared to higher income community [14]. In another study, Ahmad and Prashar [52] claimed that policies introducing low-flow appliances and pricing are tested to reduce municipal water use in south Florida effectively. It can be observed the relationship is complex as it depends on a variety of factors, such as: fixed charges in customer bills; percent of total income spent on water; price of water from alternative water sources (such as private wells, wastewater); length of time over which rates and water demands are evaluated; climate and weather events; initial water rates; type of water use (indoor vs. outdoor); season and time of the day (peak vs. off-peak periods); geographical region; customers’ knowledge of their water rates; and presence of other conservation and education programs [14]. These factors can be considered as drivers as well.
However, water conservation policies should not target only municipal water demand. In this case, the main target is the population, which should not be because other water-using activities can influence the trends and patterns of water use. Unfortunately, water use planning for water demands in Florida begins with projections of future demands based primarily on population projections [17]. To guarantee a good water management plan from a sustainable development perspective, effective water governance able to handle the challenges related to the cross-scales and cross-level interactions is necessary [73].
4.3. Assumptions, limitations, next steps
This study assessed water use in Florida. The estimation method adopted consisted solely of using the water use data provided by the USGS for the years 2005, 2010, and 2015 through linear and additive equations. Only these three periods (2005, 2010, and 2015) were considered due to the change in the data collection method observed in the previous years. In addition, county-level data were not available for previous years. The data used in this research is mainly related to the amount of water withdrawn. The assumption was made that the water withdrawn was water use. Therefore, this study did not consider the concept of “water consumption,” implying that the water should not be returned to the same catchment where it was withdrawn. Since secondary data were used in this study, some limitations should be considered when interpreting the results. Hence, the results reflect the information from these available data, and the accuracy of this information depends mainly on the rigor of the methods used when collecting the data.
The analysis is subjective to the classification of Florida into regions and categories of water use. A different classification could provide a different picture. Only eight (8) water-use categories are considered in this analysis. These are public supply, domestic self-supply, industrial self-supply, mining, thermoelectric power, irrigation, livestock, and aquaculture. Irrigation, livestock, and aquaculture are considered agricultural water use. The public supply water also provides water for the domestic and industrial sectors. This makes estimating water use for the domestic and industrial sectors a little delicate because these data would have to be added to the domestic and industrial self-supply water use estimates. However, the data concerning the quantity of water allocated to the domestic and industrial sectors from public supply was unavailable. It should also be noted that these results are for freshwater use only and do not include saline water, although saline water use is higher than freshwater use in Florida.
The relationship between drivers of water use are complex. This study used only population as the driver. However, several drivers have been identified to influence water use in Florida. They were obtained from studies gathered from a systematic search. Therefore, the results do not reflect all available information regarding drivers influencing water use in Florida. There is a lack of data on the drivers of water use.
As part of future research, we will also focus on developing scenario-based predicted water consumption patterns using artificial intelligence techniques to optimize water management efforts. Future studies could also investigate the influences of additional drivers in urban and/or rural areas through regression analysis and deep learning techniques.
5. Conclusions
Water is one of the most important natural resources. On one hand, Florida has several streams and rivers, freshwater lakes, springs, wetlands, and underlying aquifers. While on the other hand, the state faces challenges from growing population and competing needs (e.g., agricultural, natural environment, domestic). This study identified the knowledge gaps in the water use in states water use estimation. Therefore, this research aimed to estimate water use for eight categories (aquaculture, livestock, irrigation, thermoelectric power, mining, industrial self-supply, domestic self-supply, and public supply) in the three regions of Florida (north, central, and south) as well as in urban and rural counties. Additionally, drivers impacting the state’s water use were identified.
The USGS data collected for the years 2005, 2010, and 2015 from groundwater and surface water sources were used for estimating total water use and per capita water use. Additionally, our paper also identified and discussed possible drivers from the literature that could lead to changes (increase or decrease) in water use patterns to develop the causal loops. The population (driver) and water use relationships were estimated using linear regression.
The results showed that the highest water use was recorded in south Florida, while the lowest was in north Florida. Among the (8) eight categories considered in this study, public supply shows the highest water use, while industrial self-supply shows the lowest water use rate. The average daily per capita water use for urban Florida counties was higher than in rural counties. Groundwater was the most common water source; however, surface water was very high in south Florida. From literature we observed drivers that increase water use are household size, land use/land cover change, urbanization, agriculture, population, income, climate change, tourism, and industry. The drivers that decrease water use are pricing systems, conservation methods, education, and technology. The results of the linear regression analysis in Florida showed in addition to population other drivers (e.g., agriculture, industry, tourism, etc.) as well as non-linear methods (e.g., artifical intelligence) need to be considered for better understanding of water use.
In general, total freshwater use in Florida declined from 2005 to 2015. However, there is great concern about the high rate of water use in South Florida, especially when considering the high agricultural activity, the expansion of urbanization, and the growing population in this region. This study brings out the need to collect data on some of the identified drivers to develop or adopt effective strategies for the sustainable management of water resources and effective water governance.
Author Contributions
A.M. and A.A.: Conceptualization, Visualization, Methodology. A.A.: Resources, Supervision, Project administration, Funding acquisition. A.M.: Data curation, Writing—original draft preparation. A.M. and A.A.: Writing—review and editing. All authors have read and agreed to the published version of the manuscript.
Funding
This research is funded by the National Institute of Food and Agriculture of the United States Department of Agriculture (USDA-NIFA) to Florida A&M University through Non-Assistance Cooperative Agreement grant no. 58-6066-1-044. Additionally, support from USDA-NIFA capacity building grants 2017–38821–26405 and 2022-38821-37522, USDA-NIFA Evans-Allen Project, Grant 11979180/2016–01711, USDA-NIFA grant no. 2018–68002–27920, as well as National Science Foundation Grant no. 1735235 awarded as part of the National Science Foundation Research Traineeship and Grant no. 2123440.
Data Availability Statement
The data supporting reported results can be found online on the United States Geological Survey (USGS) website. 2005 data: https://water.usgs.gov/watuse/data/2005/. 2010 data: https://water.usgs.gov/watuse/data/2010/. 2015 data: https://www.sciencebase.gov/catalog/item/get/5af3311be4b0da30c1b245d8. Websites accessed on 15 November 2022.
Acknowledgments
We are grateful to Ryan Nedd and Ernesta Hunter for their feedback and suggestions that helped improve the overall quality of the original manuscript.
Conflicts of Interest
The authors declare no conflict of interest.
References
- Yang, L.; Yang, S.-H.; Magiera, E.; Froelich, W.; Jach, T.; Laspidou, C. Domestic water consumption monitoring and behaviour intervention by employing the internet of things technologies. Procedia Comput. Sci. 2017, 111, 367–375. [Google Scholar] [CrossRef]
- Reid, K. Global Water Crisis: Facts, FAQs, and How to Help. 2018. Available online: https://www.worldvision.org/clean-water-news-stories/global-water-crisis-facts (accessed on 15 November 2022).
- McLennan, M. The Global Risks Report 2021, 16th ed.; World Economic Forum Cologny: Cologny, Switzerland, 2021. [Google Scholar]
- Bhaduri, A.; Bogardi, J.; Siddiqi, A.; Voigt, H.; Vörösmarty, C.; Pahl-Wostl, C.; Bunn, S.E.; Shrivastava, P.; Lawford, R.; Foster, S.; et al. Achieving Sustainable Development Goals from a Water Perspective. Front. Environ. Sci. 2016, 4, 64. [Google Scholar] [CrossRef] [Green Version]
- Moumen, Z.; El Idrissi, N.E.A.; Tvaronavičienė, M.; Lahrach, A. Water security and sustainable development. Insights Reg. Dev. 2019, 1, 301–317. [Google Scholar] [CrossRef]
- Sadoff, C.W.; Borgomeo, E.; Uhlenbrook, S. Rethinking water for SDG 6. Nat. Sustain. 2020, 3, 346–347. [Google Scholar] [CrossRef]
- Odera, E.; Martin, E.; Lamm, A. Southern Florida High Water Users’ Public Opinions of Water in Florida. 2015. Available online: http://piecenter.com/wp-content/uploads/2015/09/SouthFloridaWaterOpinions_REPORTFINAL.pdf (accessed on 15 November 2022).
- Marella, R.L. Water Withdrawals, Use, and Trends in Florida, 2010; US Geological Survey: Reston, VA, USA, 2014. [Google Scholar]
- Fernald, E.; Purdum, E. Water Resource Atlas; Institute of Public Affairs, Florida State Univ.: Tallahassee, FL, USA, 1998; pp. 114–119. [Google Scholar]
- Wade, T.; Borisova, T. Florida’s Water Resources. EDIS 2022, 1, 1–9. [Google Scholar] [CrossRef]
- Takatsuka, Y.; Niekus, M.R.; Harrington, J.; Feng, S.; Watkins, D.; Mirchi, A.; Nguyen, H.; Sukop, M.C. Value of irrigation water usage in South Florida agriculture. Sci. Total Environ. 2018, 626, 486–496. [Google Scholar] [CrossRef]
- Glenn, M.E.; Authority, F.K.A. Water Resources Activities in Florida, 1987–1988; US Geological Survey: Reston, VA, USA, 1988. [Google Scholar]
- Stoker, P.; Rothfeder, R. Drivers of Urban Water Use. Sustain. Cities Soc. 2014, 12, 1–8. [Google Scholar] [CrossRef]
- Rawls, C.; Borisova, T.; Berg, S.; Burkhardt, J. Incentives for Residential Water Conservation: Water Price, Revenue, and Consumer Equity in Florida . In Proceedings of the Southern Agricultural Economics Association Annual Meeting, Orlando, FL, USA, 6–9 February 2010. [Google Scholar]
- Dzurik, A.A. Water Use and Public Policy in Florida. J. Water Resour. Plan. Manag. 1984, 110, 167–179. [Google Scholar] [CrossRef]
- Sun, G.; McNulty, S.G.; Myers, J.M.; Cohen, E.C. Impacts of Climate Change, Population Growth, Land Use Change, and Groundwater Availability on Water Supply and Demand across the Conterminous US. Watershed Update 2008, 6, 1–30. [Google Scholar]
- Maliva, R.G.; Manahan, W.S.; Missimer, T.M. Climate change and water supply: Governance and adaptation planning in Florida. Water Policy 2021, 23, 521–536. [Google Scholar] [CrossRef]
- Morera, M.C.; Monaghan, P.F.; Dukes, M.D. Determinants of Landscape Irrigation Water Use in Florida-Friendly Yards. Environ. Manag. 2020, 65, 19–31. [Google Scholar] [CrossRef] [PubMed]
- Haley, M.B.; Dukes, M.D.; Miller, G.L. Residential Irrigation Water Use in Central Florida. J. Irrig. Drain. Eng. 2007, 133, 427–434. [Google Scholar] [CrossRef]
- Zotarelli, L.; Scholberg, J.M.; Dukes, M.; Muñoz-Carpena, R.; Icerman, J. Tomato yield, biomass accumulation, root distribution and irrigation water use efficiency on a sandy soil, as affected by nitrogen rate and irrigation scheduling. Agric. Water Manag. 2009, 96, 23–34. [Google Scholar] [CrossRef]
- Toor, G.S.; Rainey, D.P. History and Current Status of Reclaimed Water Use in Florida. EDIS 2009, 10, 1–4. [Google Scholar] [CrossRef]
- Anderson, C. Reclaimed Water Use: The Example of Florida. U. Fla. JL & Pub. Pol’y 2014, 25, 1. [Google Scholar]
- Leal, A.; Rumble, J.N.; Lamm, A.J. Setting the Agenda: Exploring Florida Residents’ Perceptions of Water Quality and Quantity Issues. J. Appl. Commun. 2015, 99, 53–68. [Google Scholar] [CrossRef] [Green Version]
- Palenchar, J.; Friedman, K.; Heaney, J.P. Hydrograph Separation of Indoor and Outdoor Billed Water Use in Florida’s Single Family Residential Sector . In Proceedings of the FSAWWA Fall Conference, Orlando, FL, USA, 5 June 2009. [Google Scholar]
- Bureau, U.C. Urban and Rural. Available online: https://www.census.gov/programs-surveys/geography/guidance/geo-areas/urban-rural.html (accessed on 15 November 2022).
- Corbella, H.M.; Pujol, D.S. What lies behind domestic water use: A review essay on the drivers of domestic water consumption. Boletín Asoc. Geógrafos Españoles 2009, 50, 297–314. [Google Scholar]
- Maupin, M.A.; Kenny, J.F.; Hutson, S.S.; Lovelace, J.K.; Barber, N.L.; Linsey, K.S. Estimated Use of Water in the United States in 2010; US Geological Survey: Reston, VA, USA, 2014. [Google Scholar]
- Population Clock. Available online: https://www.census.gov/popclock/ (accessed on 15 November 2022).
- Anandhi, A.; Bentley, C. Predicted 21st century climate variability in southeastern U.S. using downscaled CMIP5 and meta-analysis. Catena 2018, 170, 409–420. [Google Scholar] [CrossRef]
- Shukla, S.; Shrestha, N.; Jaber, F.; Srivastava, S.; Obreza, T.; Boman, B. Evapotranspiration and crop coefficient for watermelon grown under plastic mulched conditions in sub-tropical Florida. Agric. Water Manag. 2014, 132, 1–9. [Google Scholar] [CrossRef]
- Singh, S.; Srivastava, P.; Mitra, S.; Abebe, A. Climate variability and irrigation impacts on streamflows in a Karst watershed—A systematic evaluation. J. Hydrol. Reg. Stud. 2016, 8, 274–286. [Google Scholar] [CrossRef] [Green Version]
- Winsberg, M.D. The Advance of Florida’s Frontier as Determined from Post Office Openings. Fla. Hist. Q. 1993, 72, 189–199. [Google Scholar]
- Gonzalez, E. The Local Government Formation Manual. 2003. Available online: http://www.leedelegation.com/uploads/2/3/0/7/2307391/2013-2014_local_government_formation_manual.pdf (accessed on 15 November 2022).
- Wilke, A.B.B.; Vasquez, C.; Cardenas, G.; Carvajal, A.; Medina, J.; Petrie, W.D.; Beier, J.C. Invasion, establishment, and spread of invasive mosquitoes from the Culex coronator complex in urban areas of Miami-Dade County, Florida. Sci. Rep. 2021, 11, 14620. [Google Scholar] [CrossRef] [PubMed]
- Zotarelli, L.; Dukes, M.D.; Simonne, E.H.; Barrett, C.E.; Dittmar, P. 2020–2021 Vegetable Production Handbook: Chapter 3. Principles and Practices of Irrigation Management for Vegetables. 2020. Available online: https://journals.flvc.org/edis/article/download/121804/121978 (accessed on 15 November 2022).
- Heberlein-Larson, L.A.; Tan, Y.; Stark, L.M.; Cannons, A.C.; Shilts, M.H.; Unnasch, T.R.; Das, S.R. Complex Epidemiological Dynamics of Eastern Equine Encephalitis Virus in Florida. Am. J. Trop. Med. Hyg. 2019, 100, 1266–1274. [Google Scholar] [CrossRef] [PubMed]
- Smith, S. Florida Population Growth: Past, Present and Future. 2005. Available online: https://www.bebr.ufl.edu/sites/default/files/Research%20Reports/FloridaPop2005_0.pdf (accessed on 15 November 2022).
- Kelen, P.T.V.; Downs, J.A.; Stark, L.M.; Loraamm, R.W.; Anderson, J.H.; Unnasch, T.R. Spatial epidemiology of eastern equine encephalitis in Florida. Int. J. Health Geogr. 2012, 11, 47. [Google Scholar] [CrossRef]
- Florida’s Snakes. Available online: https://ufwildlife.ifas.ufl.edu/snakes/florida.shtml (accessed on 15 November 2022).
- Borisova, T.; Bi, X.; Larkin, S.; Longanecker, J. Assessing Nature-Based Recreation to Support Economic Development and Environmental Sustainability Extension Programs. J. Ext. 2016, 54, 9. [Google Scholar]
- Lieurance, D.; Flory, L. SS-AGR-371/AG376: The UF/IFAS Assessment of Nonnative Plants in Florida’s Natural Areas: History, Purpose, and Use. Available online: https://edis.ifas.ufl.edu/publication/AG376 (accessed on 15 November 2022).
- Salaudeen, T.; Thomas, M.; Harding, D.; Hight, S.D. Economic Impact of Tropical Soda Apple (Solanum viarum) on Florida Cattle Production. Weed Technol. 2013, 27, 389–394. [Google Scholar] [CrossRef]
- Kenny, J.F.; Barber, N.L.; Hutson, S.S.; Linsey, K.S.; Lovelace, J.K.; Maupin, M.A. Estimated Use of Water in the United States in 2005; US Geological Survey: Reston, VA, USA, 2009. [Google Scholar]
- Dieter, C.; Linsey, K.; Caldwell, R.; Harris, M.; Ivahnenko, T.; Lovelace, J.; Maupin, M.; Barber, N. Estimated Use of Water in the United States County-Level Data for 2015 (Ver. 2.0, June 2018); data release; US Geological Survey: Reston, VA, USA, 2018; Volume 10, p. F7TB15V5. [Google Scholar]
- Khan, M.; Roberson, S.; Reid, K.; Jordan, M.; Odoi, A. Geographic disparities and temporal changes of diabetes prevalence and diabetes self-management education program participation in Florida. PLoS ONE 2021, 16, e0254579. [Google Scholar] [CrossRef]
- Ebrahimi, Z.D.; Momenitabar, M.; Arani, M.; Bridgelall, R. Remediation Ranking of High Crash Fatality Locations Involving Older Drivers in Florida’s Rural Counties. 2022. Available online: http://dx.doi.org/10.2139/ssrn.4062873 (accessed on 15 November 2022).
- Neto, M.D.L.F.; Naghettini, M.; Von Sperling, M.; Libânio, M. Assessing the relevance of intervening parameters on the per capita water consumption rates in Brazilian urban communities. Water Sci. Technol. Water Supply 2005, 5, 9–15. [Google Scholar] [CrossRef]
- Mui, K.; Wong, L.T.; Law, L.; Wai, M.K. Domestic water consumption benchmark development for Hong Kong. Build. Serv. Eng. Res. Technol. 2007, 28, 329–335. [Google Scholar] [CrossRef]
- Pokharel, S. Analysis of Land Use Change as a Method of Predicting Water Demands in an Urbanizing Environment: Redland, Miami-Dade County, Florida; Master of Science, Florida International University: Miami, FL, USA, 2014. [Google Scholar] [CrossRef]
- Warziniack, T.; Arabi, M.; Brown, T.C.; Froemke, P.; Ghosh, R.; Rasmussen, S.; Swartzentruber, R. Projections of Freshwater Use in the United States Under Climate Change. Earth's Futur. 2022, 10, e2021EF002222. [Google Scholar] [CrossRef]
- Marella, R.L. Factors That Affect Public-Supply Water Use in Florida, with a Section on Projected Water Use to the Year 2020; U.S. Department of the Interior, U.S. Geological Survey: Reston, VA, USA, 1992. [Google Scholar]
- Ahmad, S.; Prashar, D. Evaluating Municipal Water Conservation Policies Using a Dynamic Simulation Model. Water Resour. Manag. 2010, 24, 3371–3395. [Google Scholar] [CrossRef]
- Alford, S.; Harris, H.; Martin, C.; Chagaris, D.; Allen, M. SE CASC Coastal Resilience Working Group Part III. Watershed Modification Effects on Coastal Ecosystems: A Synthesis from Selected Gulf of Mexico Estuaries. 2021. Available online: https://www.researchgate.net/profile/Charles-Martin-11/publication/356001608_SE_CASC_Coastal_Resilience_Working_Group_Part_III_Watershed_Modification_Effects_on_Coastal_Ecosystems_A_Synthesis_from_Selected_Gulf_of_Mexico_Estuaries/links/6189621707be5f31b7590874/SE-CASC-Coastal-Resilience-Working-Group-Part-III-Watershed-Modification-Effects-on-Coastal-Ecosystems-A-Synthesis-from-Selected-Gulf-of-Mexico-Estuaries.pdf (accessed on 15 November 2022).
- Her, Y.G.; Boote, K.; Migliaccio, K.; Fraisse, C.; Letson, D.; Mbuya, O.; Anandhi, A.; Chi, H.; Ngatia, L.; Asseng, S. Climate Change Impacts and Adaptation in Florida’s Agriculture. In Florida’s Climate: Changes, Variations & Impacts; 2017. Available online: https://diginole.lib.fsu.edu/islandora/object/fsu%3A539159 (accessed on 15 November 2022).
- Anandhi, A.; Sharma, A.; Sylvester, S. Can meta-analysis be used as a decision-making tool for developing scenarios and causal chains in eco-hydrological systems? Case study in Florida. Ecohydrology 2018, 11, e1997. [Google Scholar] [CrossRef] [Green Version]
- Opalinski, N.F.; Bhaskar, A.S.; Manning, D.T. Spatial and Seasonal Response of Municipal Water Use to Weather across the Contiguous U.S. JAWRA J. Am. Water Resour. Assoc. 2020, 56, 68–81. [Google Scholar] [CrossRef]
- Liu, L.; Hejazi, M.; Patel, P.; Kyle, P.; Davies, E.; Zhou, Y.; Clarke, L.; Edmonds, J. Water demands for electricity generation in the U.S.: Modeling different scenarios for the water–energy nexus. Technol. Forecast. Soc. Chang. 2015, 94, 318–334. [Google Scholar] [CrossRef]
- Zhang, X.; Khachatryan, H. Investigating Monetary Incentives for Environmentally Friendly Residential Landscapes. Water 2020, 12, 3023. [Google Scholar] [CrossRef]
- Borisova, T.; Shah, S.I.A.; Wade, T.; Grogan, K.; Bi, X. Valuing Florida Water Resources: Water Use in Irrigated Agriculture. 2019. Available online: https://edis.ifas.ufl.edu/pdf/FE/FE105700.pdf (accessed on 15 November 2022).
- Morera, M.C.; Monaghan, P.F.; Dukes, M.D. Evolving response to smart irrigation controllers in high water-use central Florida homes. AWWA Water Sci. 2019, 1, e111. [Google Scholar] [CrossRef] [Green Version]
- Marella, R. Water Withdrawals, Use, and Trends in Florida, 2005. Scientific Investigations Report 2009–5125; US Geological Survey: Reston, VA, USA, 2009. [Google Scholar]
- Marella, R. Water Withdrawals, Uses, and Trends in Florida, 2015; Scientific Investigations Report 2019–5147; US Geological Survey: Reston, VA, USA, 2019. [Google Scholar]
- Verdi, R.J.; Tomlinson, S.A.; Marella, R.L. Drought of 1998–2002: Impacts on Florida’s Hydrology and Landscape. 2006. Available online: https://pubs.usgs.gov/circ/2006/1295/pdf/circ1295.pdf (accessed on 15 November 2022).
- U.S. Energy Information Administration—EIA—Independent Statistics and Analysis. Available online: https://www.eia.gov/state/analysis.php?sid=FL#21. (accessed on 15 November 2022).
- Borisova, T.; Rogers, J. Water Withdrawals and Their Use in Florida in 2010. 2018. Available online: https://edis.ifas.ufl.edu/publication/FE943 (accessed on 15 November 2022).
- Dimkić, D. Temperature Impact on Drinking Water Consumption. Environ. Sci. Proc. 2020, 2, 31. [Google Scholar] [CrossRef]
- Cheng, C.-H.; Nnadi, F.; Liou, Y.-A. A Regional Land Use Drought Index for Florida. Remote Sens. 2015, 7, 17149–17167. [Google Scholar] [CrossRef] [Green Version]
- Capece, J. Population Growth and Water Demand Model for Port LaBelle, Florida. 2007. Available online: http://hendryutilities.com/docs/boxes/PLUS_Population_Study_070830.pdf (accessed on 15 November 2022).
- Barnett, C. Mirage: Florida and the Vanishing Water of the Eastern US; University of Michigan Press: Ann Arbor, MI, USA, 2008; pp. 6–75. [Google Scholar]
- Mayer, P.; DeOreo, W.; Towler, E.; Martien, L.; Lewis, D. Tampa Water Department Residential Water Conservation Study: The Impacts of High Efficiency Plumbing Fixture Retrofits in Single-Family Homes. In A Report Prepared for Tampa Water Department and the United States Environmental Protection Agency. 2004. Available online: https://www.researchgate.net/publication/242745422_Tampa_Water_Department_Residential_Water_Conservation_Study_The_Impacts_of_High_Efficiency_Plumbing_Fixture_Retrofits_in_Single-Family_Homes (accessed on 15 November 2022).
- Abrams, B.; Kumaradevan, S.; Sarafidis, V.; Spaninks, F. An Econometric Assessment of Pricing Sydney’s Residential Water Use*. Econ. Rec. 2012, 88, 89–105. [Google Scholar] [CrossRef]
- Worthington, A.C.; Hoffman, M. An Empirical Survey of Residential Water Demand Modelling. J. Econ. Surv. 2008, 22, 842–871. [Google Scholar] [CrossRef] [Green Version]
- Cash, D.W.; Adger, W.N.; Berkes, F.; Garden, P.; Lebel, L.; Olsson, P.; Pritchard, L.; Young, O. Scale and Cross-Scale Dynamics: Governance and Information in a Multilevel World. Ecol. Soc. 2006, 11, art8. [Google Scholar] [CrossRef]
Figure 1.
Map of Florida: counties and three Florida’s regions (north, central, and south).

Figure 2.
Flowchart showing the methodology. The dotted arrows show the sequence of steps in the methodology. The solid arrows indicate the elements considered at each stage.
Figure 2.
Flowchart showing the methodology. The dotted arrows show the sequence of steps in the methodology. The solid arrows indicate the elements considered at each stage.

Figure 3.
Rural/Urban classification of Florida counties (in 2010 and 2015. Three counties, Sumter, Putnam, and Nassau, originally designated as rural counties in 2005, became urban counties in 2010 and 2015.
Figure 3.
Rural/Urban classification of Florida counties (in 2010 and 2015. Three counties, Sumter, Putnam, and Nassau, originally designated as rural counties in 2005, became urban counties in 2010 and 2015.

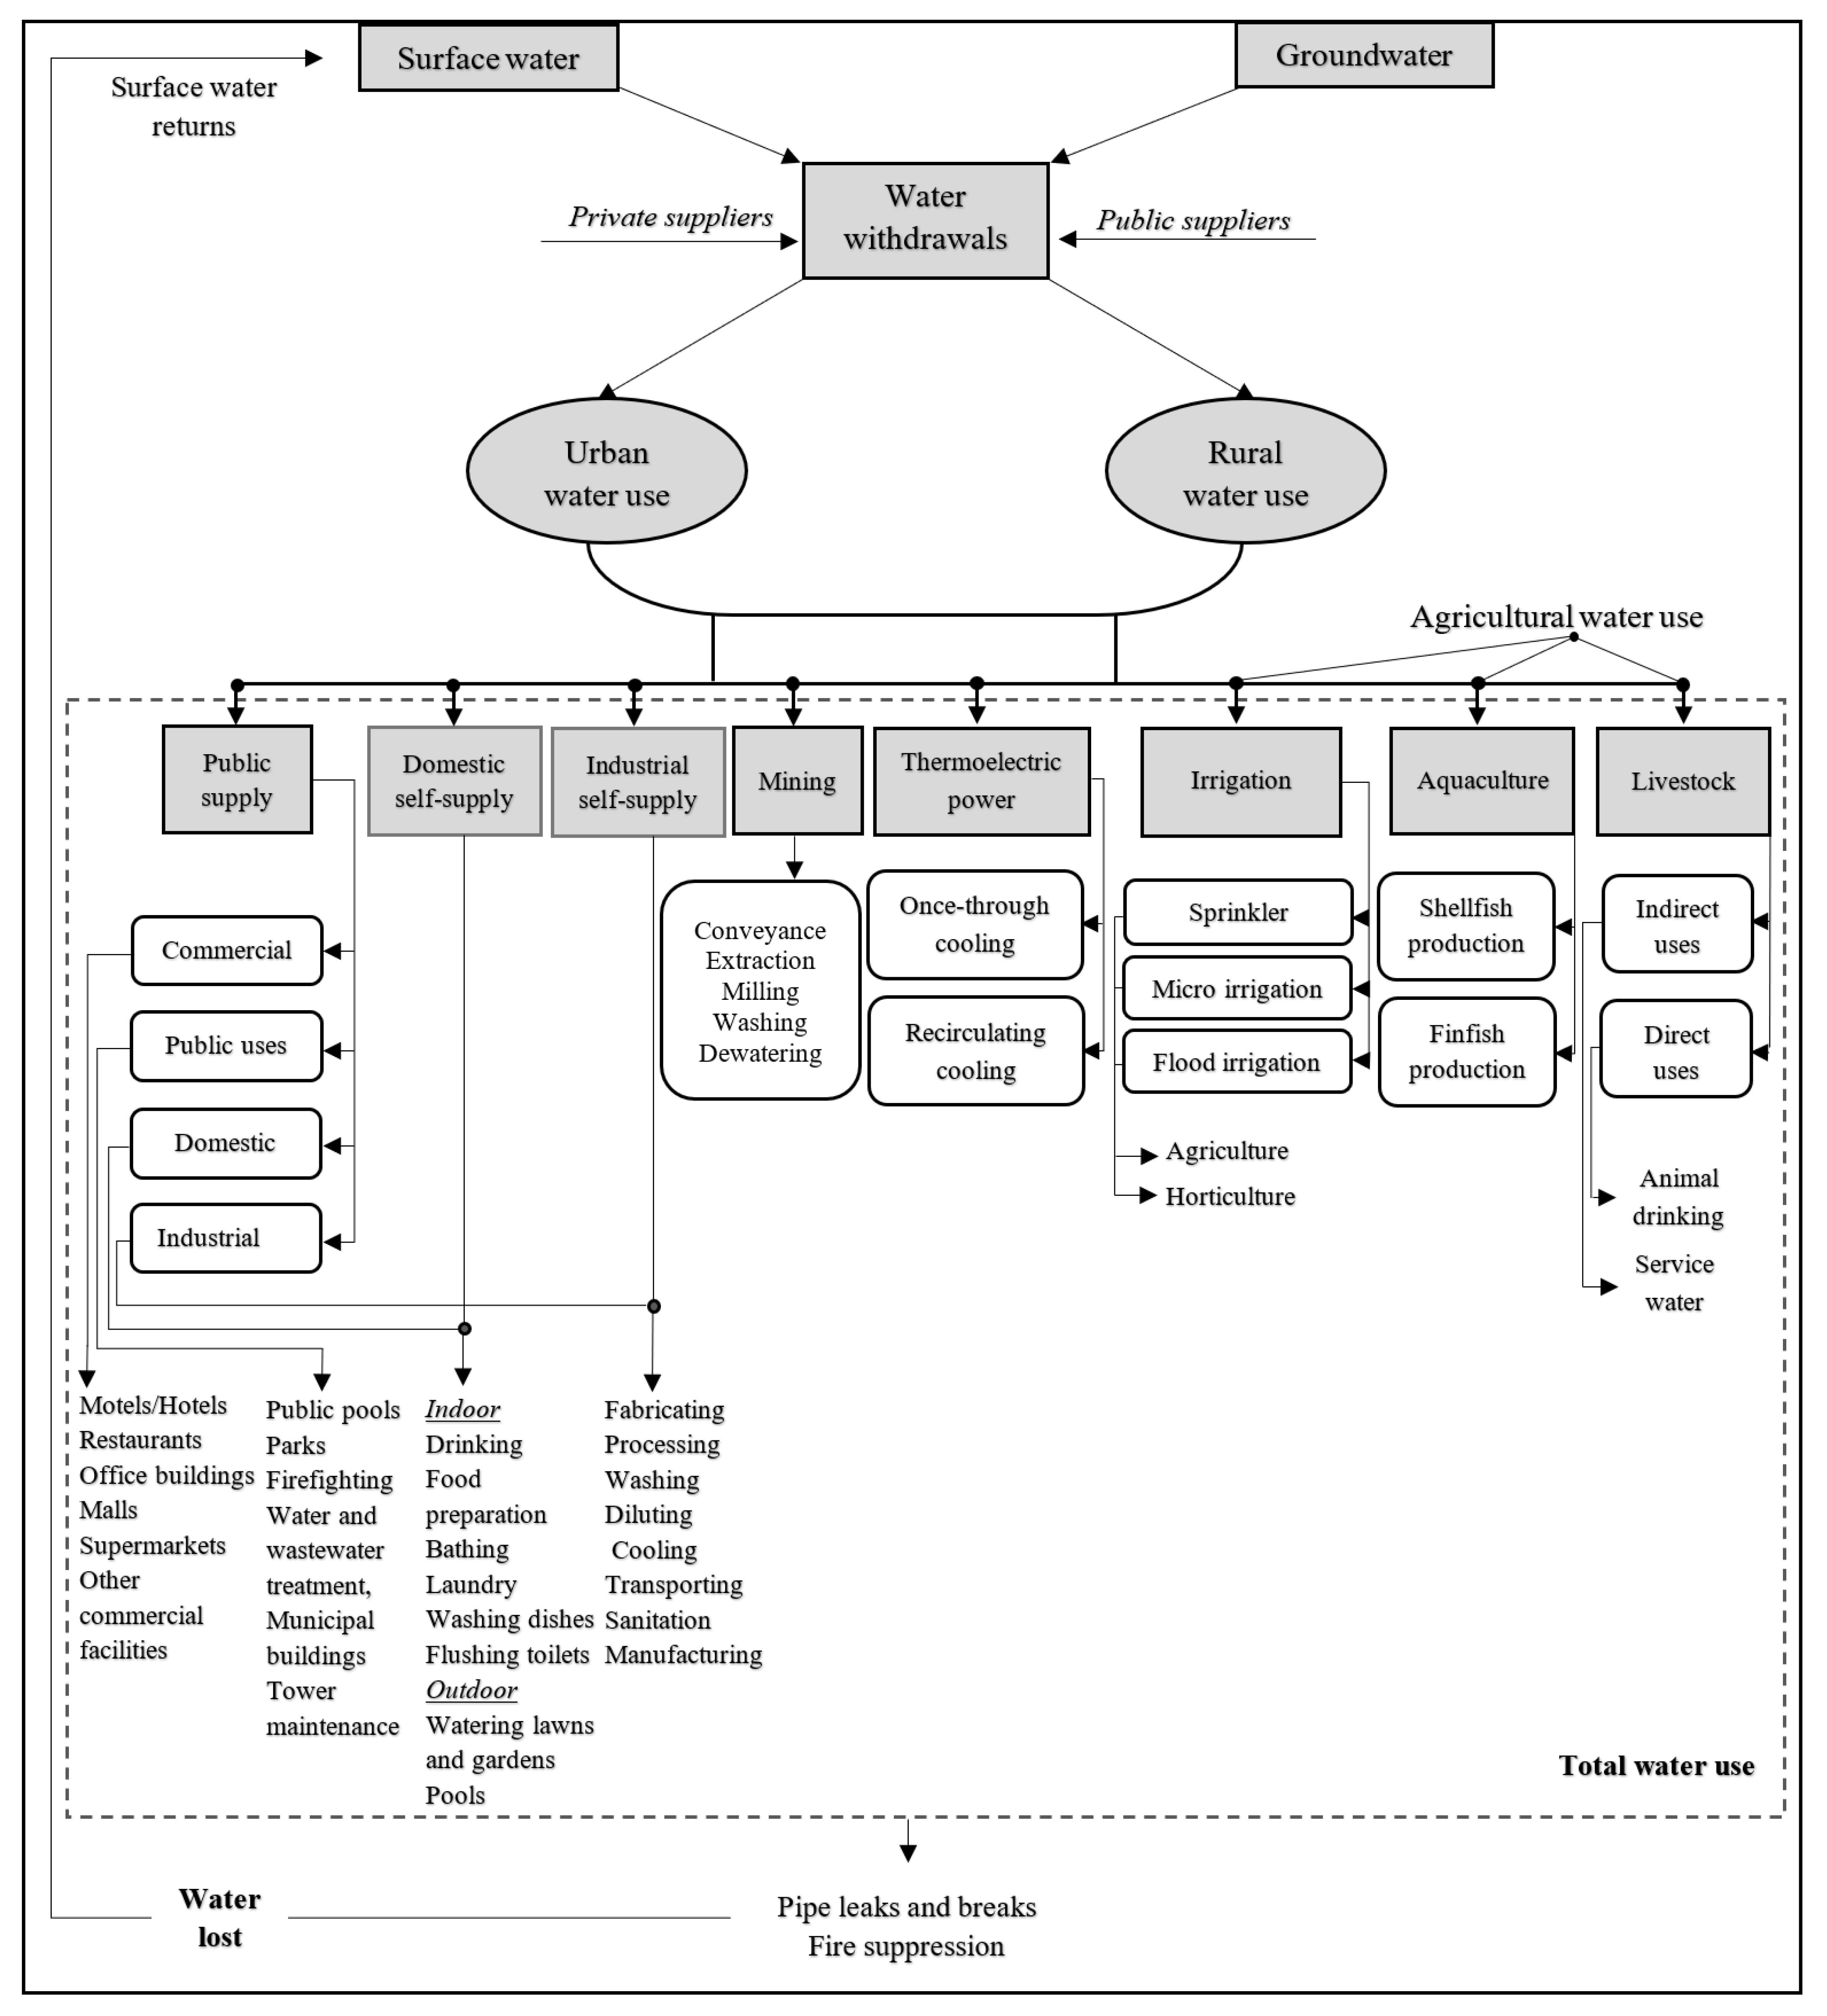
Figure 4.
Components of Water Use Indicator used to estimate total water use in Florida.

Figure 5.
Florida water use in 2005.

Figure 6.
Florida water use in 2010.

Figure 7.
Florida water use in 2015.

Figure 8.
Rural and urban water use in 2005, 2010, and 2015.

Figure 9.
Comparison within counties.

Figure 10.
Comparison of water use by source (surface and groundwater) in north, central and south Florida.
Figure 10.
Comparison of water use by source (surface and groundwater) in north, central and south Florida.

Figure 11.
Change in water use.

Figure 12.
Causal loop diagram showing interrelationships between water use and its drivers in Florida. The drivers are represented as texts. Causal relationships are defined as arrows with plus (+) and minus (-) symbols showing the direction of causality (Positive signs increase, and negative signs reduce).

Figure 13.
Linear regression analysis of the correlation assessment of public supply and population in north, central, and south Florida. The circles represent the counties in north (36 counties), central (21 counties), and south Florida (10 counties).
Figure 13.
Linear regression analysis of the correlation assessment of public supply and population in north, central, and south Florida. The circles represent the counties in north (36 counties), central (21 counties), and south Florida (10 counties).

Publisher’s Note: MDPI stays neutral with regard to jurisdictional claims in published maps and institutional affiliations. |
© 2022 by the authors. Licensee MDPI, Basel, Switzerland. This article is an open access article distributed under the terms and conditions of the Creative Commons Attribution (CC BY) license (https://creativecommons.org/licenses/by/4.0/).
Share and Cite
MDPI and ACS Style
Morain, A.; Anandhi, A. Fresh Water Use in Florida: Trends and Drivers. Water 2022, 14, 3726. https://doi.org/10.3390/w14223726
AMA Style
Morain A, Anandhi A. Fresh Water Use in Florida: Trends and Drivers. Water. 2022; 14(22):3726. https://doi.org/10.3390/w14223726
Chicago/Turabian StyleMorain, Almando, and Aavudai Anandhi. 2022. "Fresh Water Use in Florida: Trends and Drivers" Water 14, no. 22: 3726. https://doi.org/10.3390/w14223726
Note that from the first issue of 2016, this journal uses article numbers instead of page numbers. See further details here.