
Accurate Monitoring of Algal Blooms in Key Nearshore Zones of Lakes and Reservoirs Using Binocular Video Surveillance System

1
School of Surveying, Mapping and Geographical Sciences, Liaoning Technical University, Fuxin 123000, China
2
Key Laboratory of Watershed Geography, Chinese Academy of Sciences, Nanjing Institute of Geography and Limnology, Chinese Academy of Sciences, Nanjing 210008, China
3
School of Spatial Informatics and Geomatics Engineering, Anhui University of Science and Technology, Huainan 232000, China
*
Author to whom correspondence should be addressed.
Water 2022, 14(22), 3728; https://doi.org/10.3390/w14223728
Submission received: 31 October 2022
/
Revised: 10 November 2022
/
Accepted: 15 November 2022
/
Published: 17 November 2022
(This article belongs to the Special Issue Point-Source and Diffuse Water Pollution)
Abstract
:In recent years, algal blooms break out frequently and often accumulate in nearshore zones of eutrophic lakes and reservoirs, which seriously threaten regional water supply security. It is of great significance to grasp the status of algal blooms in key nearshore zones timely for the emergency prevention and control of algal blooms. A video surveillance system provides a new method for achieving this goal. The results of algal-bloom monitoring in current research, however, are usually interfered by onshore vegetation for their similar textural features. Accordingly, there are great limitations in current works in terms of decision support for emergency prevention and control of algal blooms. To solve this problem, a binocular video surveillance system based an accurate monitoring method of algal blooms is proposed in this paper. Binocular images of monitoring areas are obtained periodically by exploiting the binocular video surveillance system, which is performed by a stereoscopic 3D reconstruction method to obtain the 3D point cloud data of monitoring areas. Afterward, water regions and non-water regions are intelligently discriminated according to the elevation characteristics of point clouds, and only the image data of the water regions are finally adopted for algal-bloom extraction. Thus, the influence of onshore vegetation on the extraction of algal blooms can be eliminated. The system was implemented and applied, and the experimental results show that the proposed method can eliminate effectively the interference of onshore vegetation on the extraction of algal blooms and improve significantly the accuracy of existing methods for algal-bloom monitoring based on video surveillance system.
1. Introduction
Lakes and reservoirs are the main water sources in China, but most of them are currently in the state of eutrophication, resulting in the frequent outbreaks of algal blooms. Given this background, the community and societal production have been affected seriously, which have been recognized by government departments at all levels [1,2,3,4]. Compared with other areas of lakes and reservoirs, the prevention and control of algal blooms in nearshore zones are particularly important. Firstly, drinking water sources and water intakes are usually located in nearshore zones. Once large-scale accumulation of algal blooms occurs in nearshore zones, a series of secondary disasters are likely to result, and the safety of drinking water is seriously affected. Moreover, important landscapes around lakes and reservoirs (e.g., wetland parks, etc.) are usually located in nearshore zones, and the accumulation and odor of algal blooms in nearshore zones leads to the deterioration of the ecological environment of the scenic water, and have a negative impact on landscape recreation. Therefore, it is quite significant to obtain timely information on the current situation and abnormal algal blooms in key nearshore zones of eutrophic lakes and reservoirs, which can efficiently guide the emergency treatment of algal blooms and minimize the potential damage.
Traditional methods of algal-bloom monitoring in lakes and reservoirs relies mainly on satellite remote sensing and periodic field monitoring. Satellite remote sensing technology is playing an important role in the daily monitoring of algal blooms in lakes and reservoirs [5,6,7,8,9,10,11,12]. It has an advantage of large-region synchronous observation, which can quickly obtain the area and spatial distribution of algal blooms in an entire lake or reservoir [13,14,15,16,17,18,19,20,21,22,23,24,25]. Nevertheless, limited by the spatial resolution of image data, it is difficult to obtain accurate information on algal blooms in nearshore zones of lakes and reservoirs. In addition, the data acquisition frequency of satellite remote sensing is generally not high and is affected easily by weather, which cannot meet the needs of daily and emergency monitoring during large-scale outbreak periods of algal blooms. For example, affected by cloudy and rainy weather, the effective monitoring data cannot be obtained on more than half of the dates each year in Lake Taihu and Lake Chaohu, two typical eutrophic lakes in China. Periodic field monitoring [26] mainly monitors the distribution of algal blooms through mobile observation and sampling in the lake area. Although theoretically, high-precision information on algal blooms in key areas along lakes and reservoirs can be obtained, the monitoring process is time-consuming and quite inefficient. Algal blooms change rapidly, usually approach without casting a shadow, and leave without leaving a trace [27], and thus periodic field monitoring methods cannot grasp timely and accurately the information on algal blooms in key nearshore zones of lakes and reservoirs. Consequently, there are still great limitations in traditional methods of algal-bloom monitoring in key nearshore zones of lakes and reservoirs.
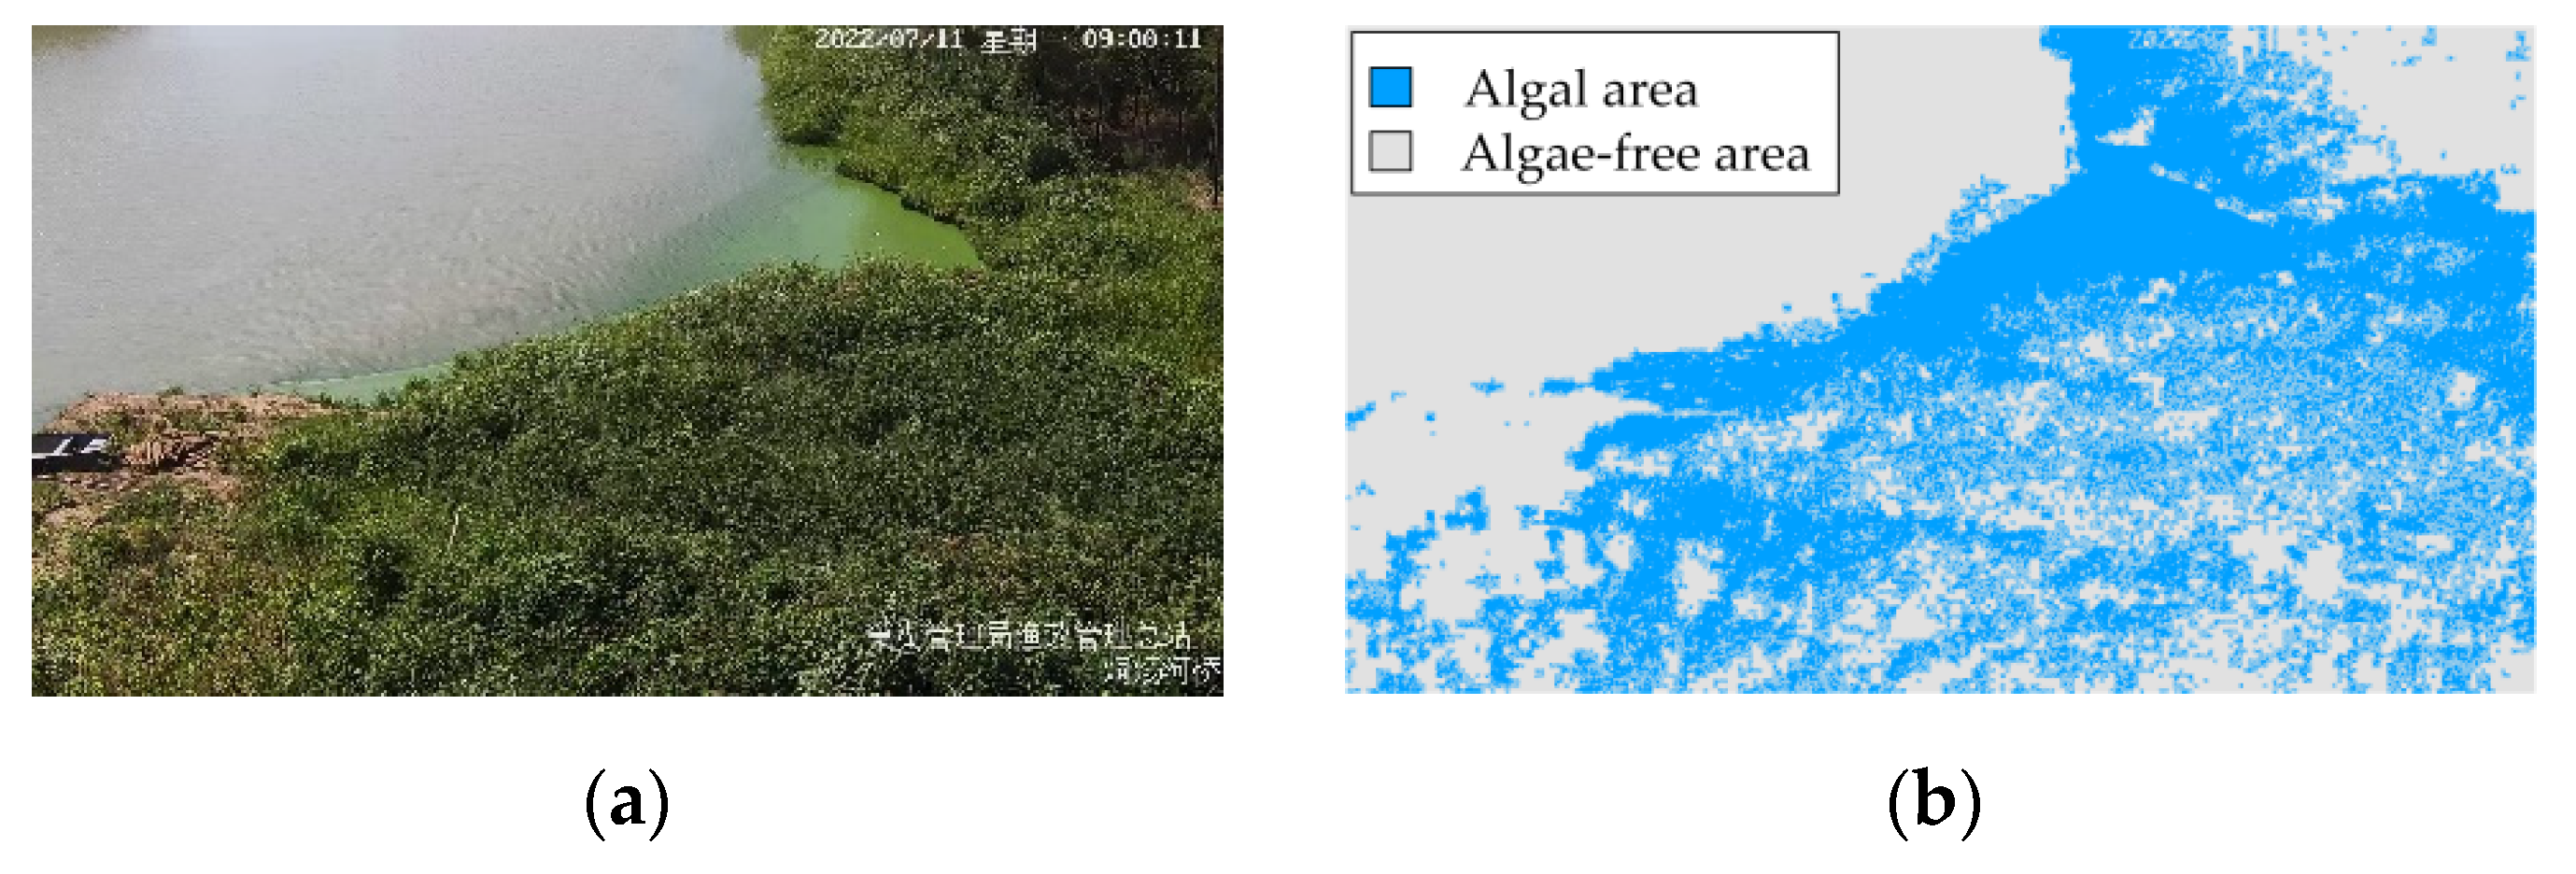
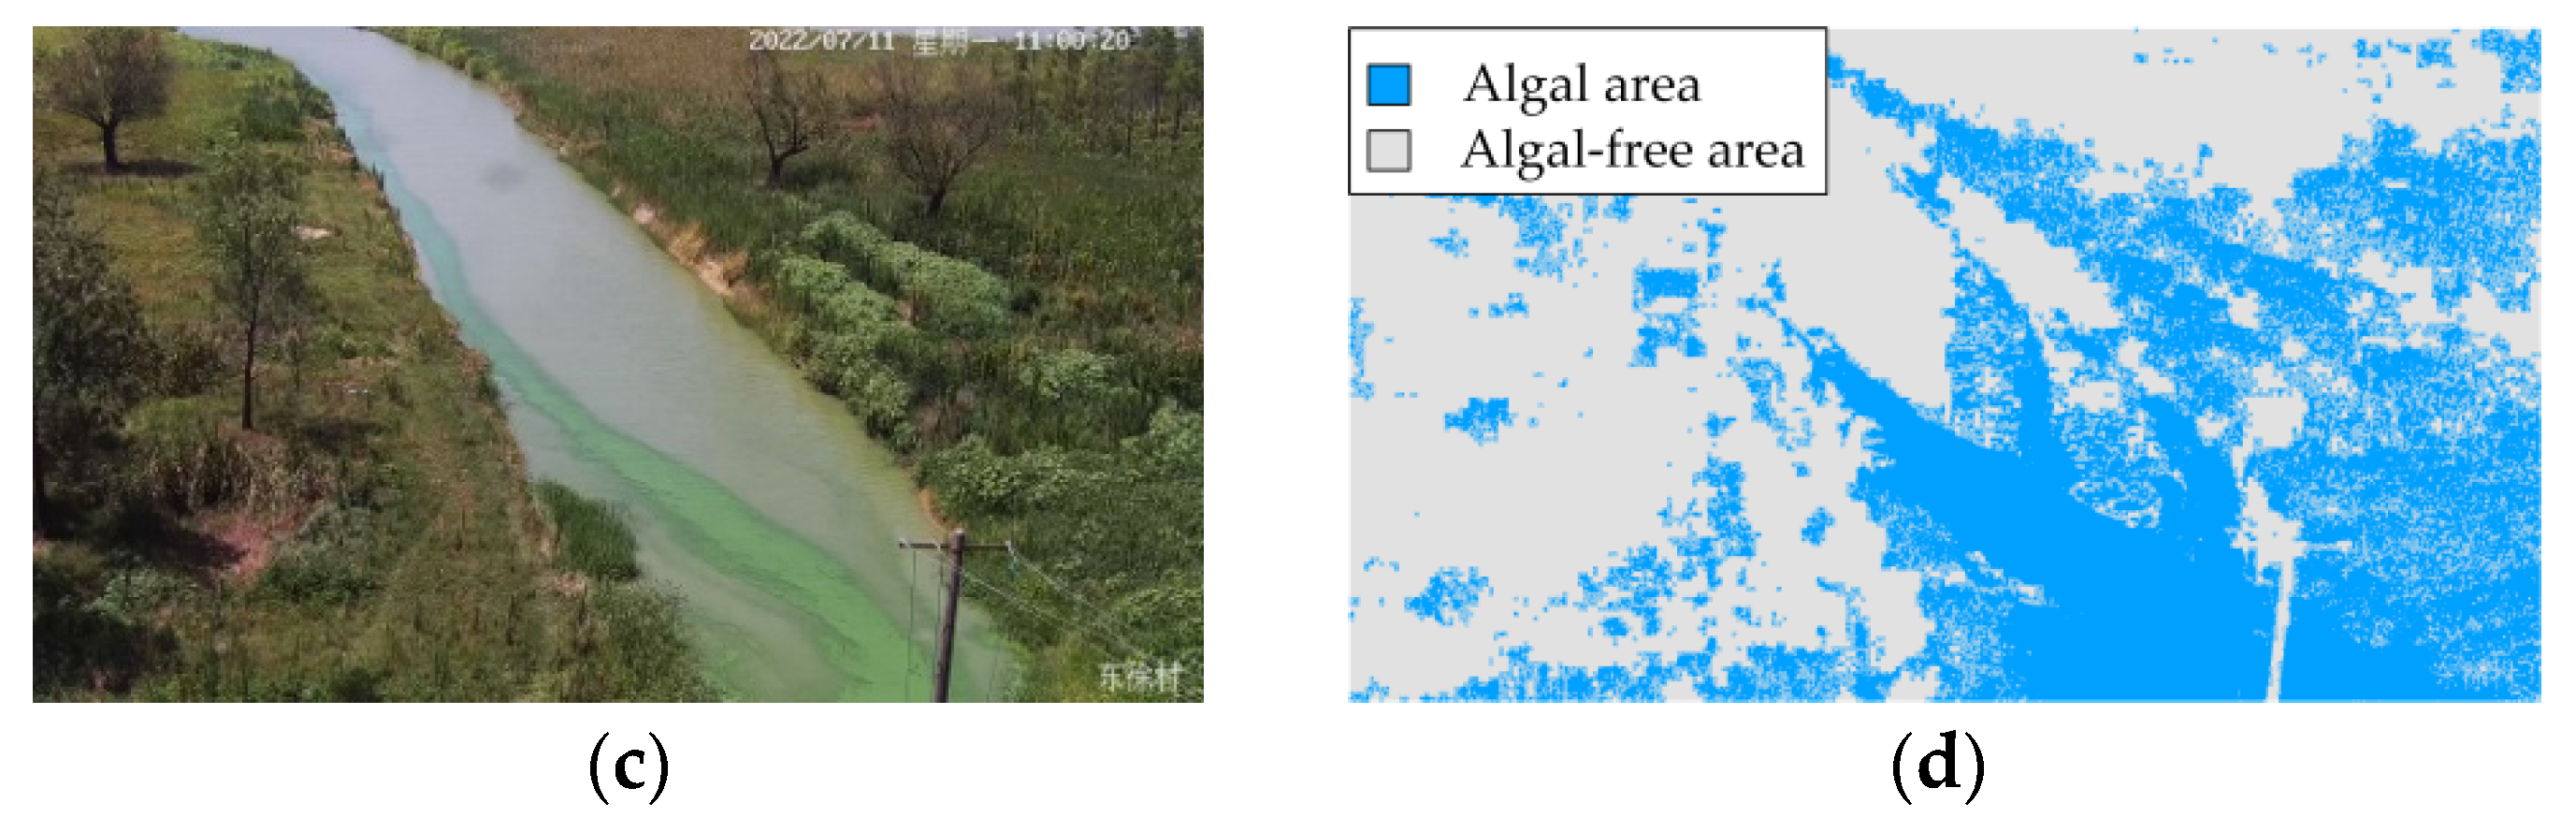
To realize high frequency monitoring of algal blooms in key nearshore zones of lakes and reservoirs, buoys equipped with phycocyanin and chlorophyll-a sensors and shore-base video surveillance systems have attracted much attention from researchers [28,29,30,31,32,33,34]. Buoys can monitor algal blooms at specific locations, but they cannot monitor algal blooms in a wide range. Video surveillance systems have the advantages of unattended and continuous operation, which can realize continuous monitoring of algal blooms on sunny days and partly cloudy and rainy days (with sufficient light). Combined with extraction methods of algal blooms from video data, this method for monitoring has provided a new effective means for timely characterization of algal blooms in key nearshore zones of lakes and reservoirs. However, there are usually various uses of the video monitoring systems around lakes and reservoirs, e.g., fishery administration, security monitoring of protection areas, etc. Therefore, shooting angles of monitoring equipment are frequently adjusted, and onshore vegetation is usually captured when obtaining the image data of monitoring areas. Accordingly, the results of algal-bloom monitoring are usually interfered owing to the similar textural features of onshore vegetation and algal blooms (Figure 1), and there are still great limitations to the current methods in terms of decision-making support for emergency prevention and control of algal blooms in lakes and reservoirs.
Aiming at the abovementioned problems, an accurate monitoring method for algal blooms in key nearshore zones of lakes and reservoirs is proposed in this paper, based on a binocular video surveillance system and an existing method of algal-bloom extraction from image data. Target water regions are continuously monitored by binocular video monitoring systems, and binocular images of target water regions are captured periodically and automatically. The binocular stereo vision principle is then used to realize 3D reconstruction of target water regions. Afterward, water regions and non-water regions can be judged intelligently according to the elevation characteristics of the 3D point clouds obtained for target water regions. Pixel coordinates of non-water area in the 2D image can be calculated from the 3D point cloud data of the non-water area, and the non-water area in the 2D image can be eliminated to generate the water-area image data. Finally, only the image data of water regions are utilized for algal-bloom extraction, and the interference of onshore vegetation can be eliminated thoroughly.
2. Materials and Methods
2.1. Basic Principle of Algal Extraction Based on a Video Image
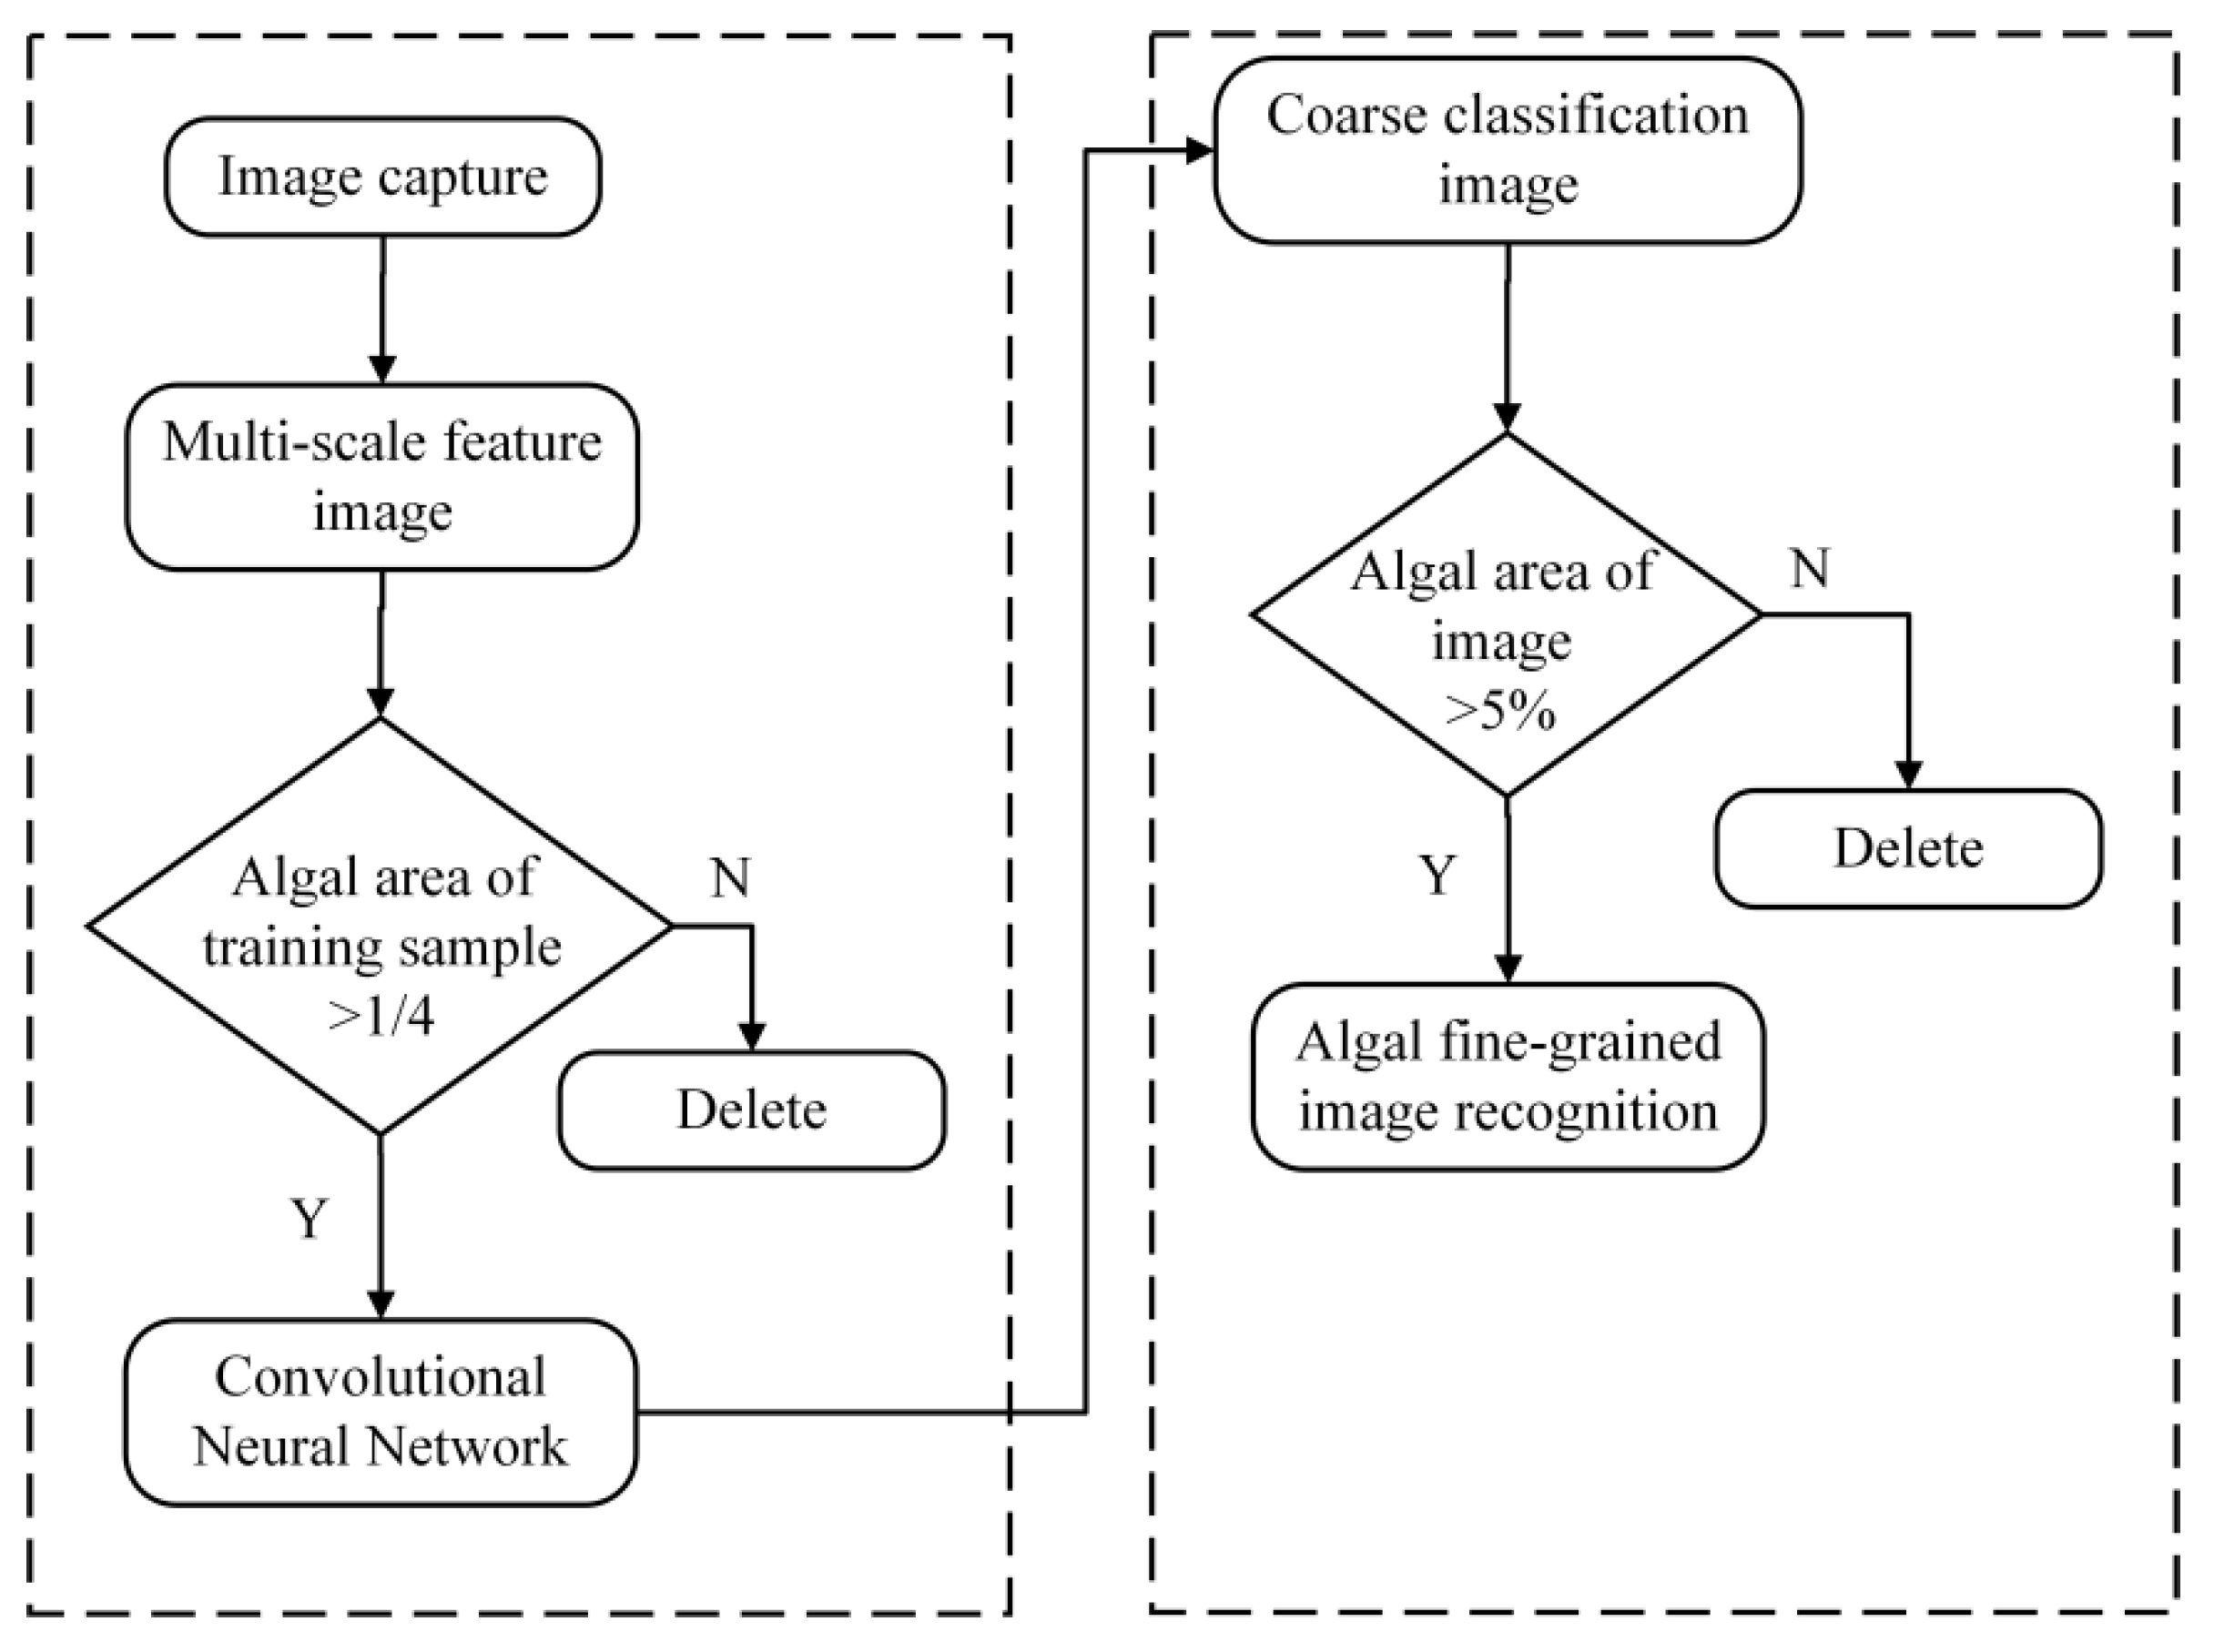
In the common method for algal-bloom extraction based on a video image [31], a multi-scale deep network framework is first constructed by VGG (visual geometry group) classification network, which is then used to classify coarsely the video image. Next, the coverage of algal bloom in the given video image is estimated to distinguish among algal blooms, shadows, and turbid water bodies. Finally, the given video image is divided according to color, and algal blooms can be identified effectively by exploiting random forest methods. The basic procedure for algal-bloom extraction is shown in Figure 2.
2.2. Binocular Image Data Acquisition in Key Nearshore Zones of Lakes and Reservoirs
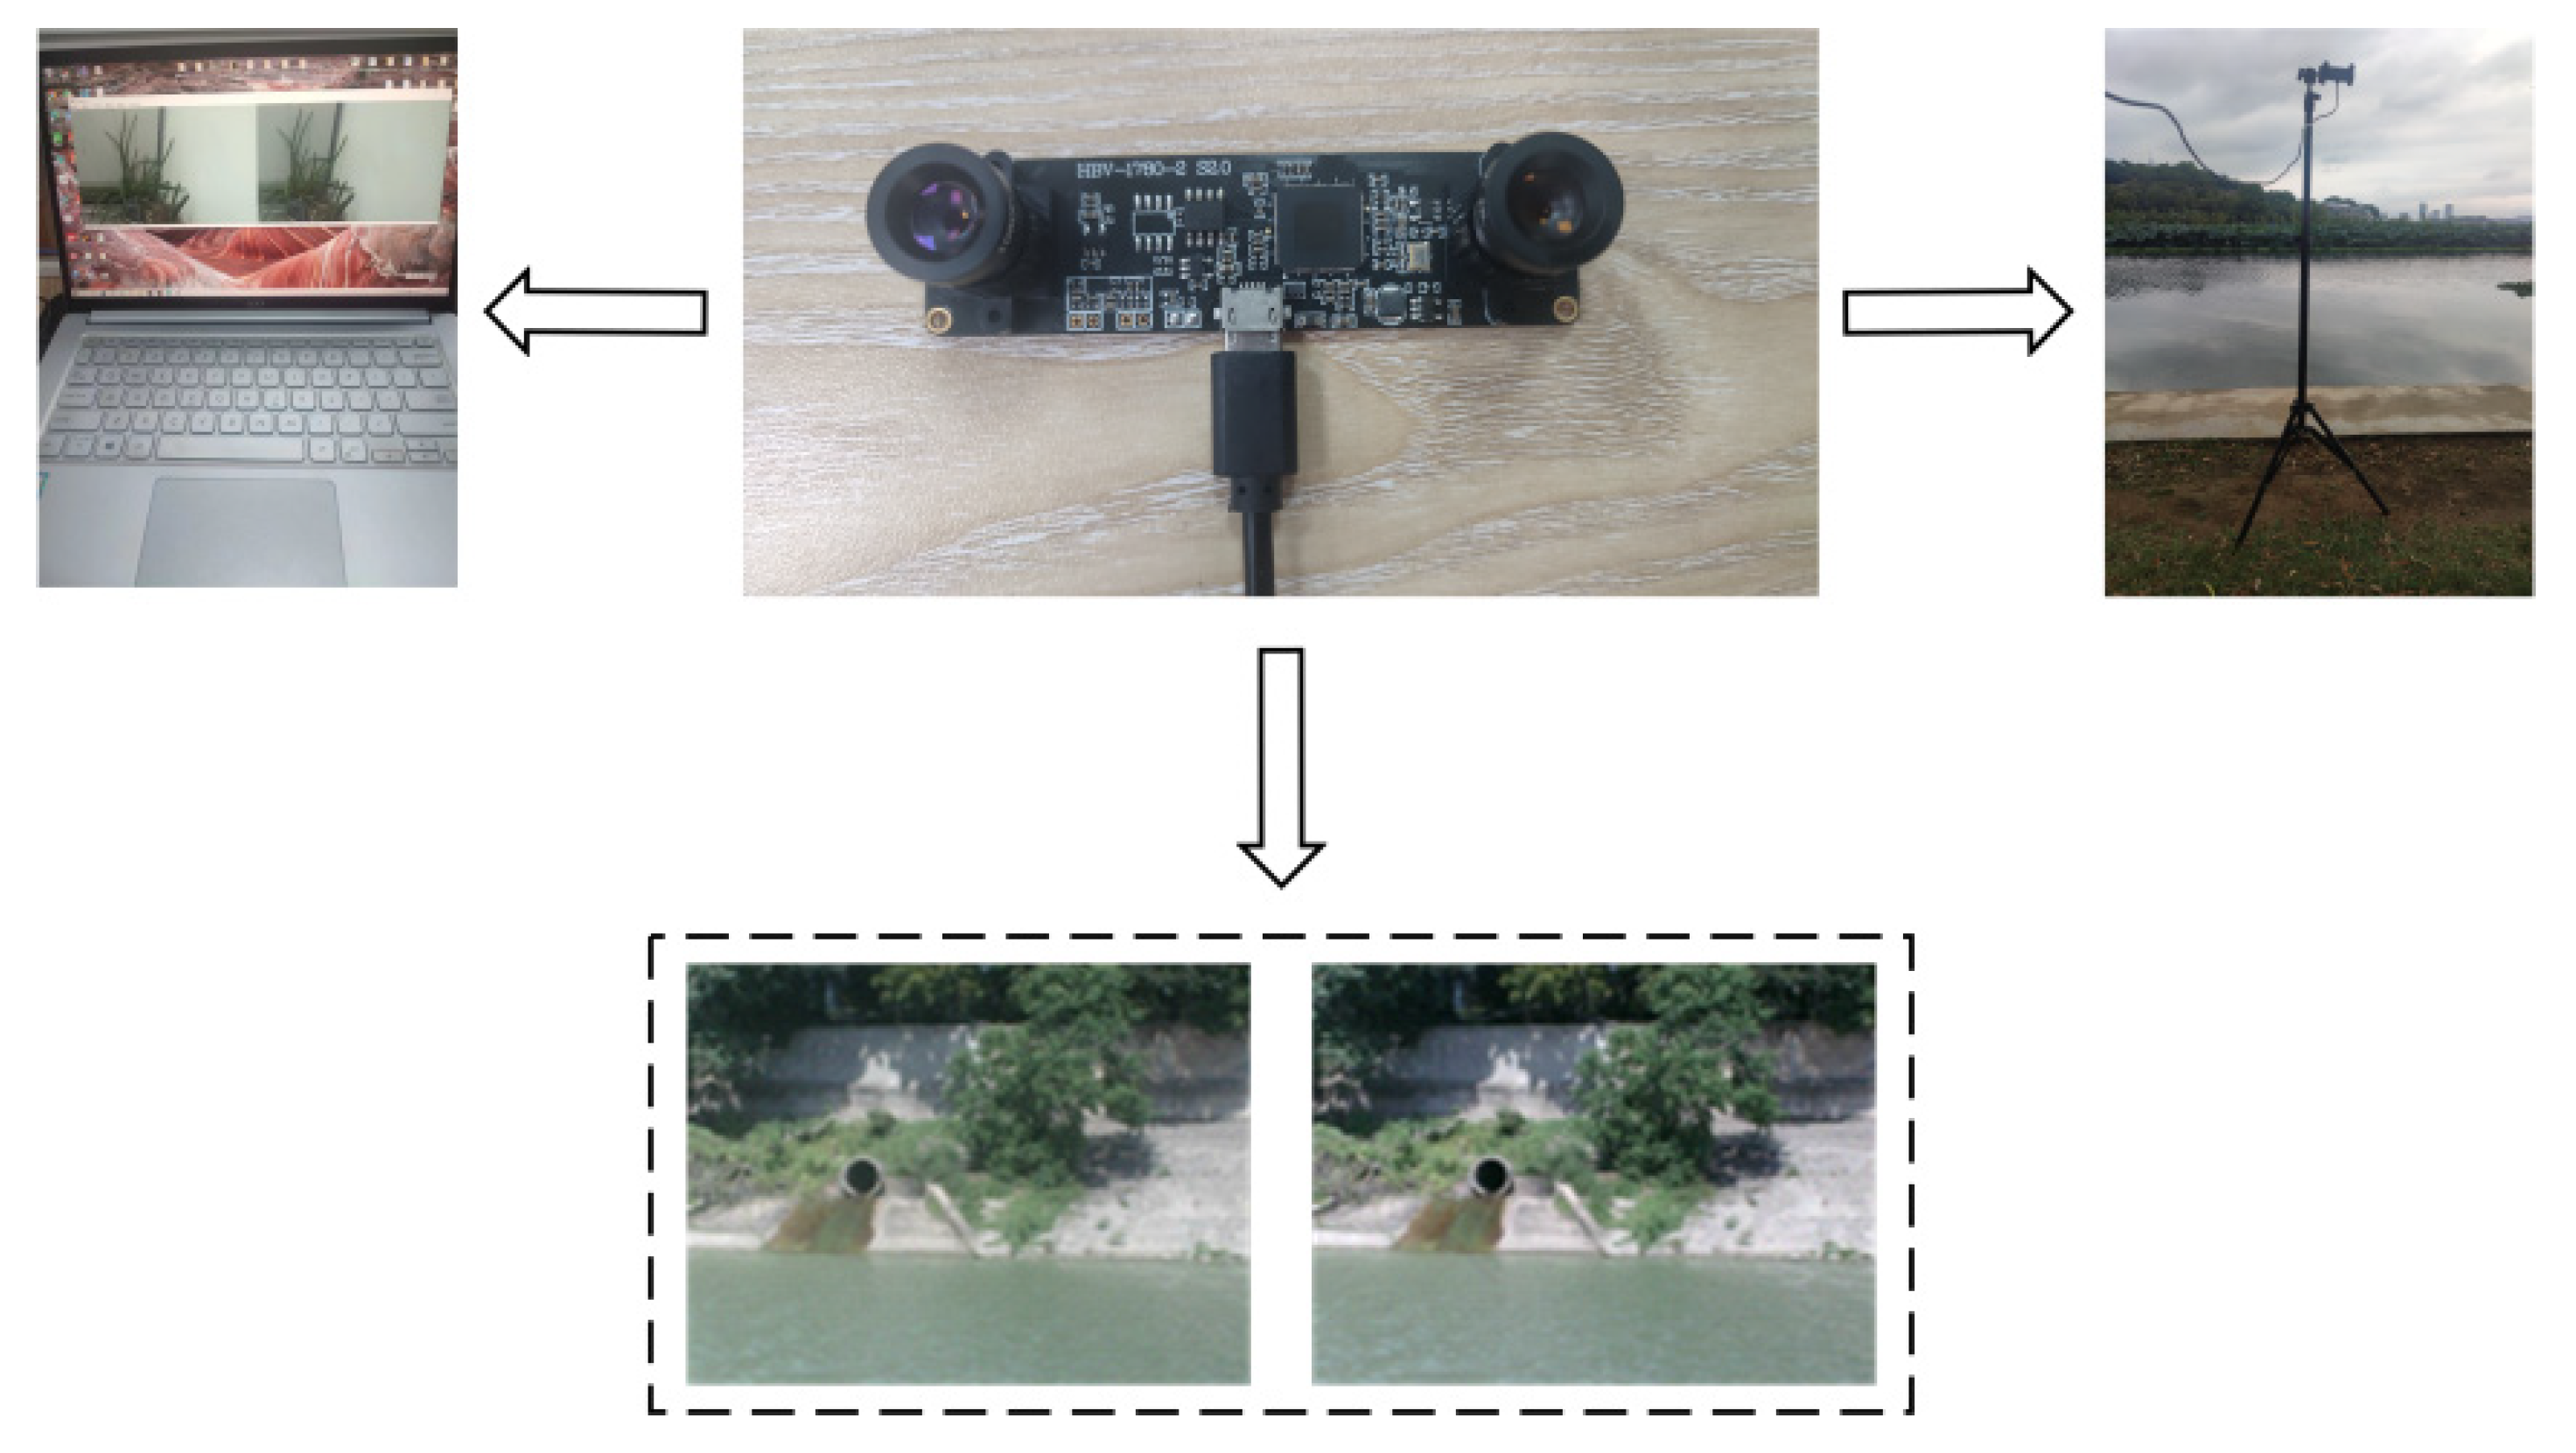
The binocular vision image acquisition system utilized in this paper is powered by USB and consists of two synchronous camera modules with 1 million pixels. Details of this system’s parameters are listed in Table S1. During the experiment, first, to monitor the target area at regular time, the synchronous camera modules are fixed at the designated position by a bracket and connected to the computer (PC) through a USB data cable (Figure 3). Next, by using code written in C++ programming language, the monitoring area of the system is captured regularly to obtain the binocular image of the target area.
The aforementioned system was used to acquire binocular images of key nearshore zones of Lake Chaohu during July 2022. In the process of binocular image acquisition, the influencing factors, e.g., shooting angle, device height, and illumination intensity, were fully considered to guarantee that the collected image data could meet the requirements for 3D reconstruction of target water regions.
2.3. Accurate Extraction of Algal Blooms Based on Binocular Images
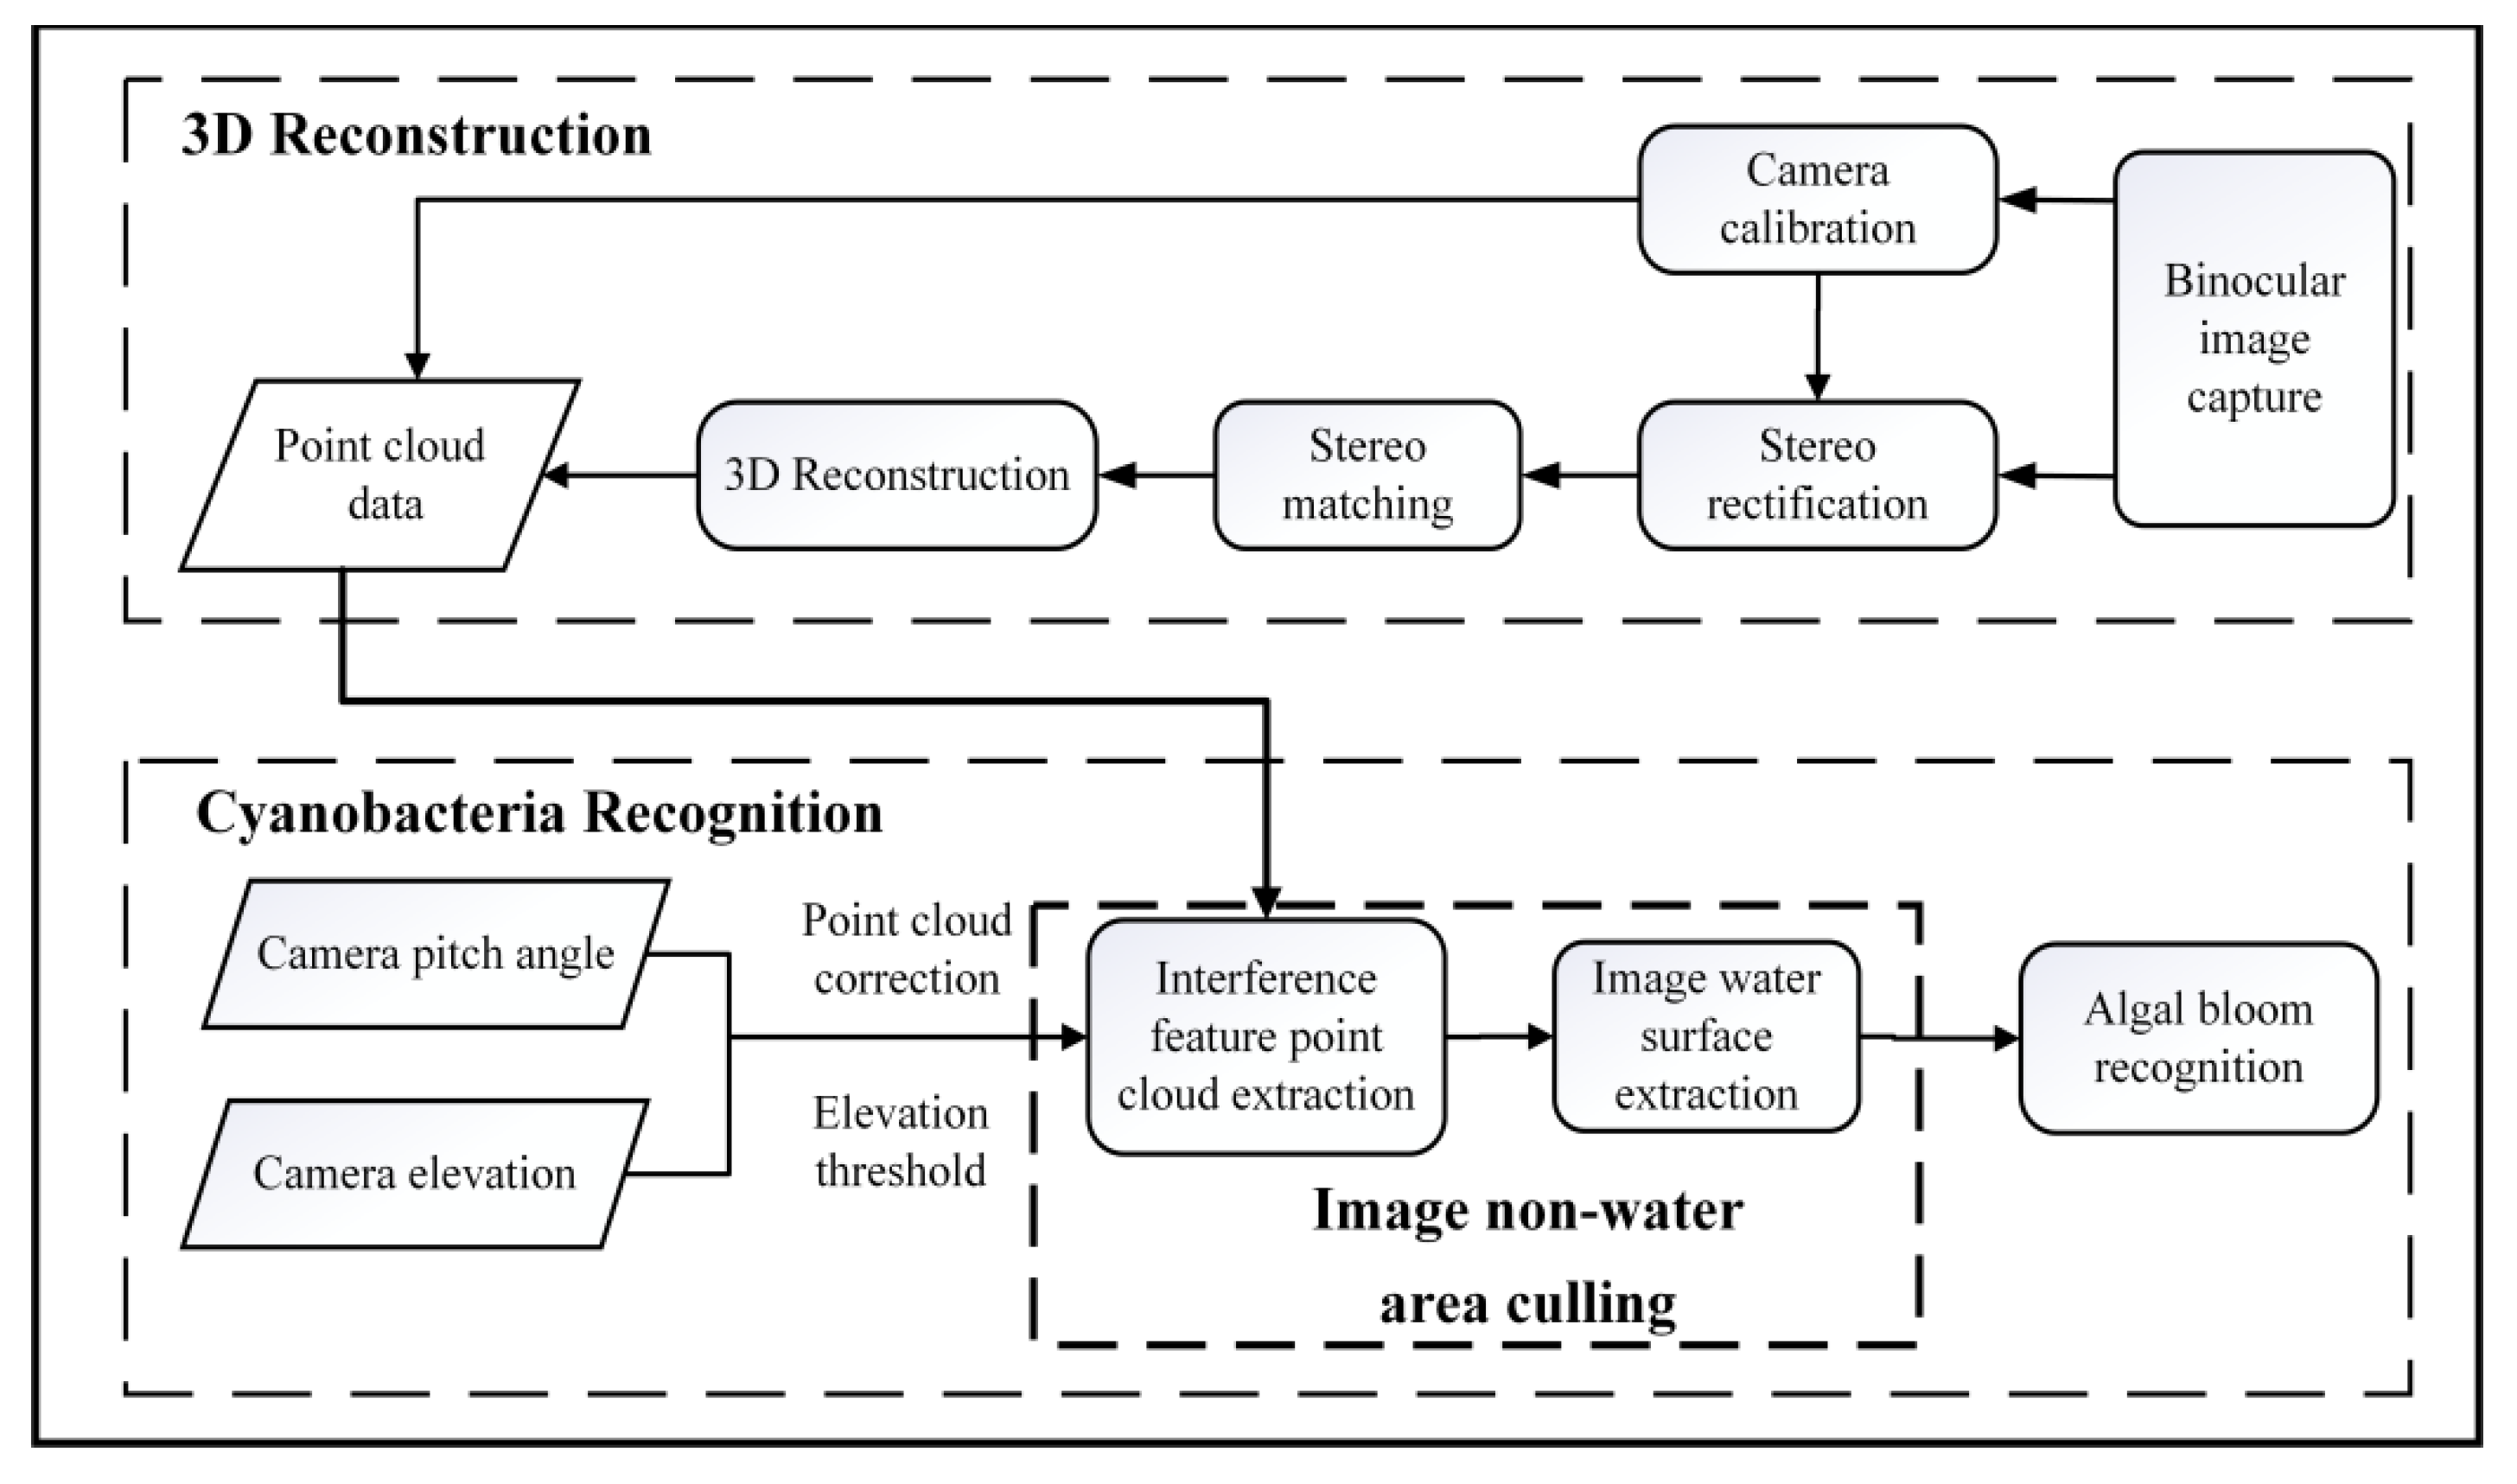
To solve the limitations of existing methods of algal-bloom extraction based on video surveillance systems, this study uses a binocular video surveillance system to obtain binocular vision images of target water regions, and generates 3D clouds exploiting the obtained images based on the principle of stereo vision. According to elevation features, water regions, and non-water regions can be identified intelligently, and the interference of onshore vegetation to the extraction of algal blooms can be eliminated effectively by only taking the image data of water regions for algal-bloom extraction.
The flowchart of the proposed accurate extraction method for algal blooms based on binocular video surveillance system is shown in Figure 4.
2.3.1. Binocular Stereo Vision 3D Point Cloud Acquisition
Binocular stereo vision (Figure S1) is a machine vision method based on the principle of parallax, which converts 2D image information into 3D geometric information by obtaining the depth information of the image. Three-dimensional reconstruction of binocular stereo vision includes five steps: image acquisition, camera calibration, image correction, stereo matching, and 3D reconstruction.
- Step 1: Image acquisition
Use the binocular image acquisition system described in Section 2.2 to acquire simultaneously binocular images of the target water regions, and then pre-process the obtained images to prepare for the subsequent experiments.
- Step 2: Camera calibration
Camera calibration is divided into two substeps. The first is to perform single-target calibration on the two cameras to obtain their own parameters (internal parameters and distortion parameters), and the other is to obtain the relative position information of the two cameras (external parameters). Detailed parameters of binocular camera calibration are shown in Table S2.
- Step 3: Image correction
When using a binocular camera to collect binocular images, it is inevitable that the two 2D image planes cannot be completely coplanar. In addition, the binocular images are distorted due to the use of a wide-angle lens.
The image distortion caused by shooting with a wide-angle lens can be eliminated by image correction on the binocular image. Afterward, complete coplanar alignment of the two image planes can be achieved, and it can be guaranteed that there only exists parallax in the horizontal direction in binocular images. Then, the stereo matching problem can be reduced from 2D searching to 1D searching, and the search efficiency of stereo matching can be improved (Figure S2).
- Step 4: Stereo matching
Stereo matching is an important step in the 3D reconstruction procedure of binocular stereo vision, and its purpose is to find the corresponding points from the left and the right images, calculate the feature points of the two images, establish the corresponding relationship between the calculated feature points, and obtain the disparity image (Figure S3) based on the 2D information from the two images.
- Step 5: 3D reconstruction
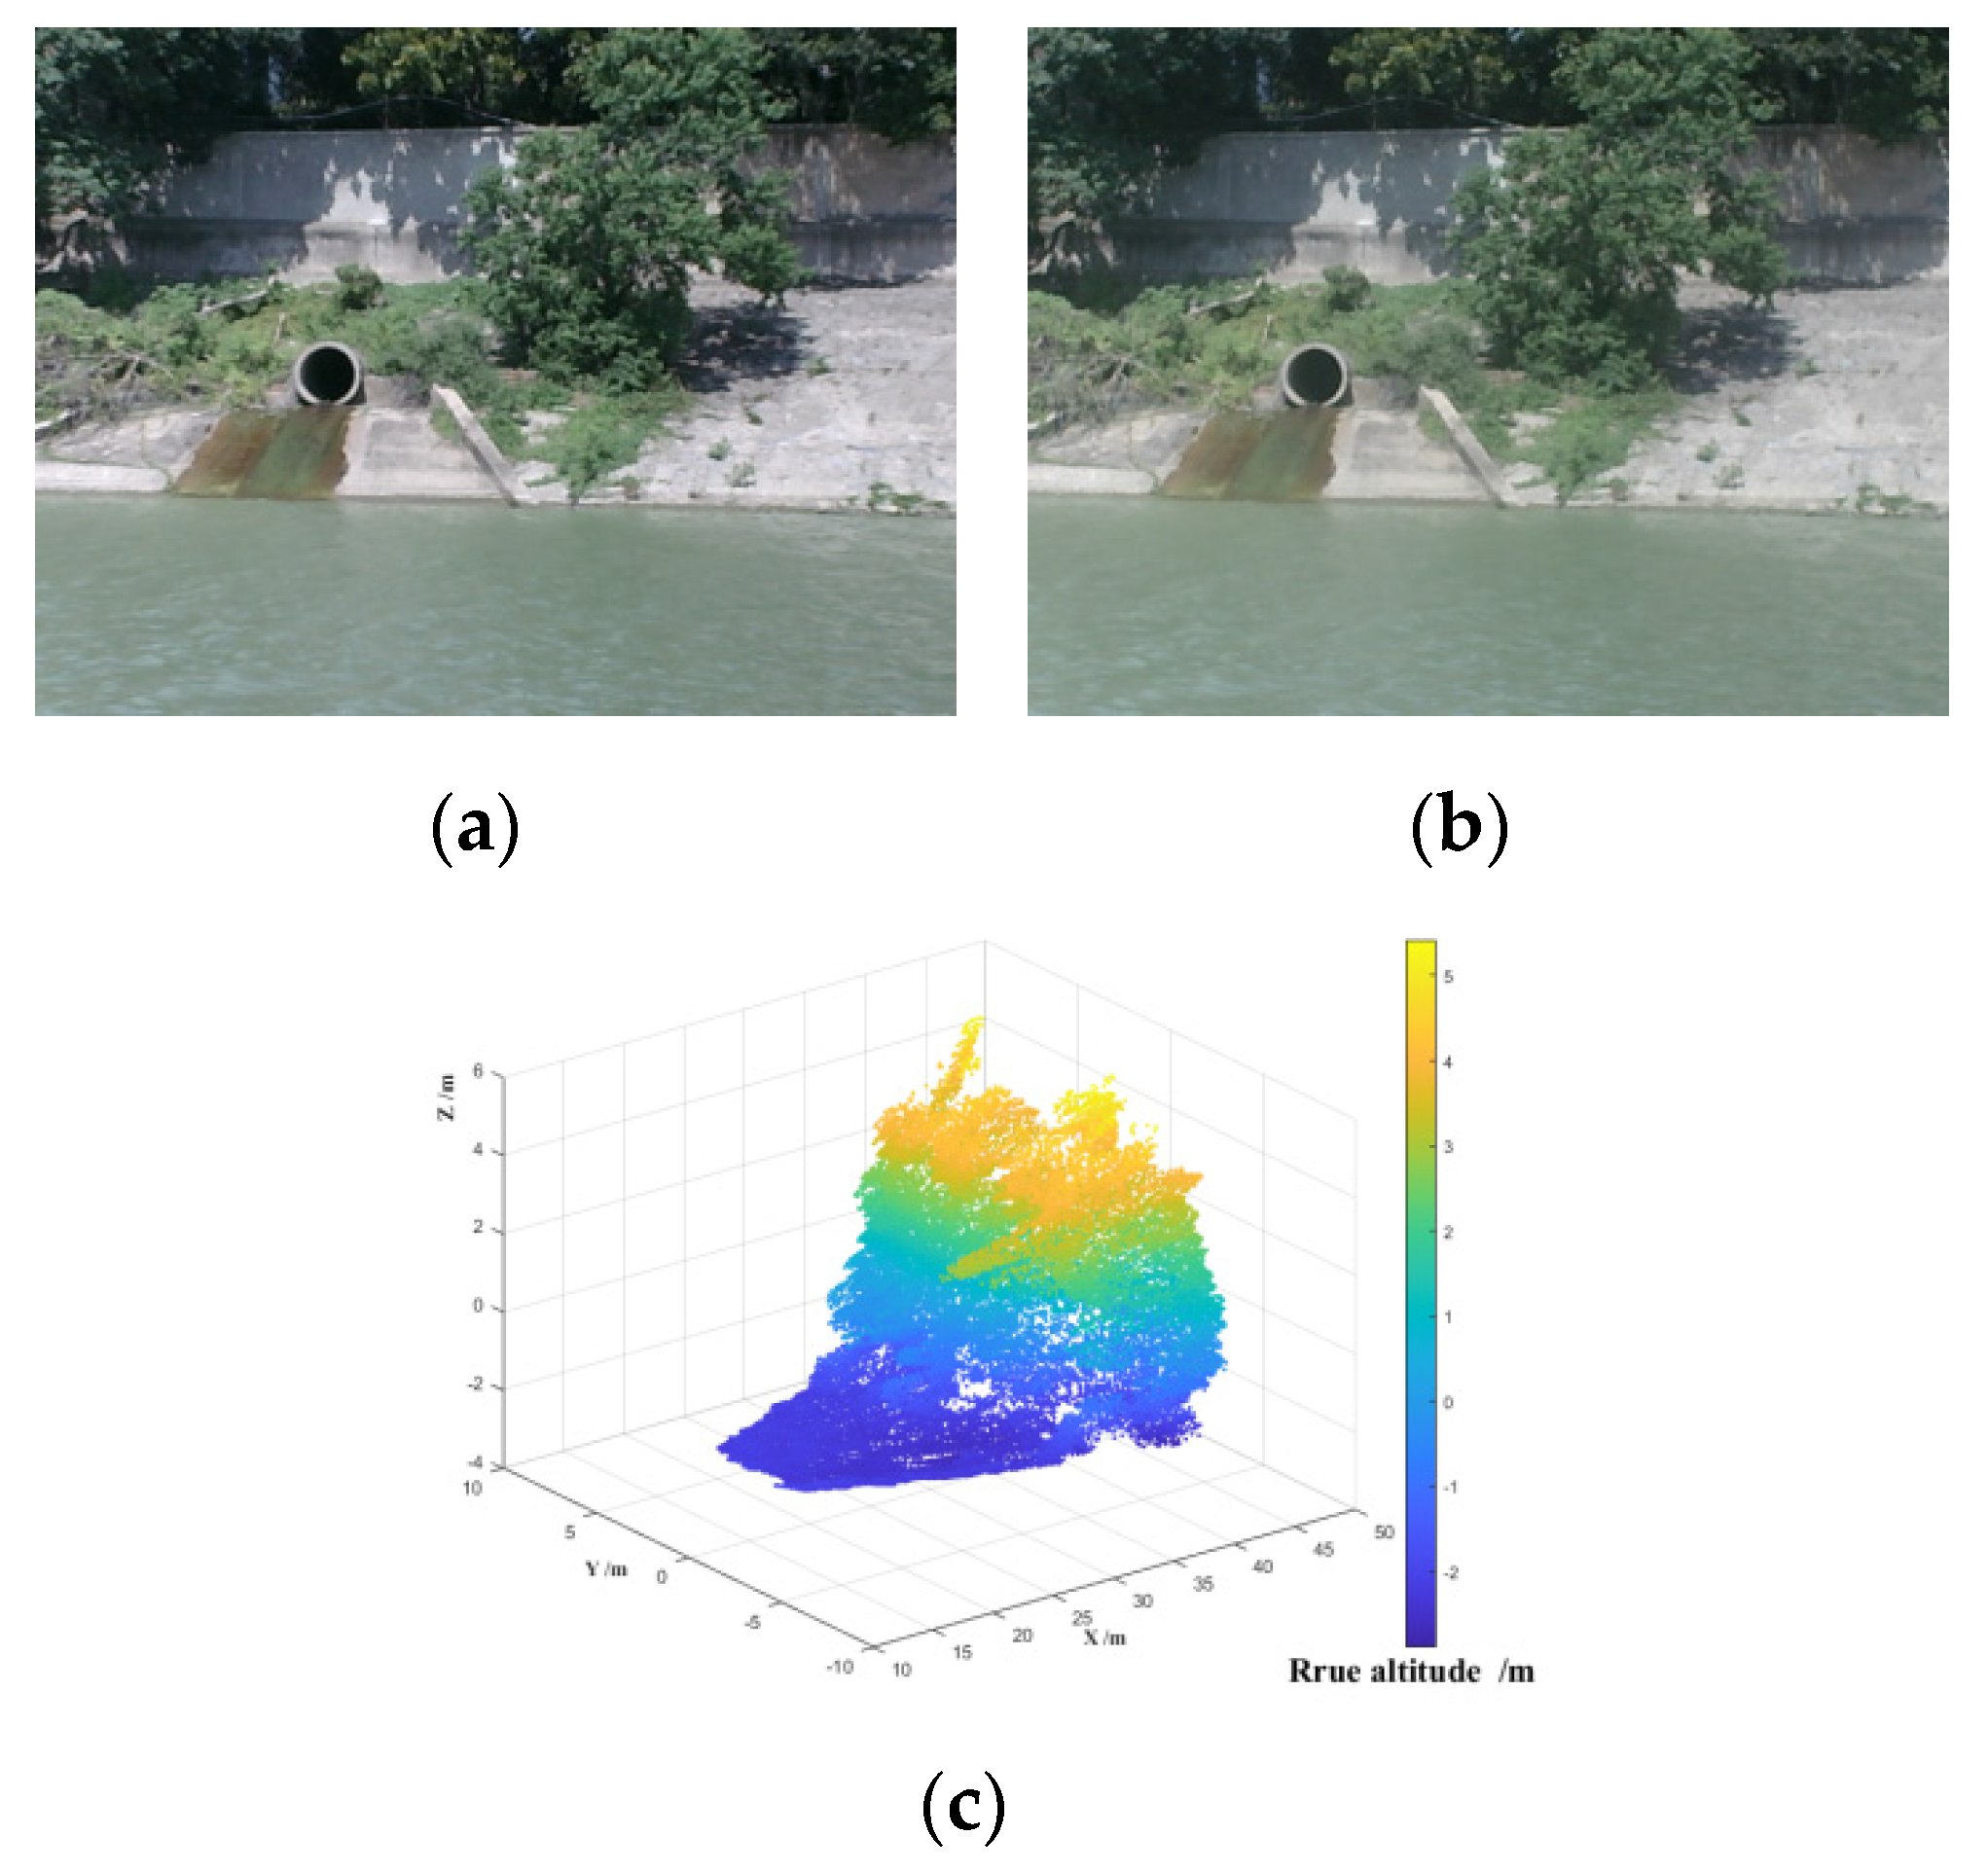
Three-dimensional reconstruction within the binocular stereo vision method is to obtain dense 3D point cloud data by calculating the depth value of the stereo matching image; 3D reconstruction of binocular stereo vision is shown in Figure 5.
2.3.2. Separation of Water Region and Non-Water Region
- (1)
- Non-water region identification in 3D point clouds
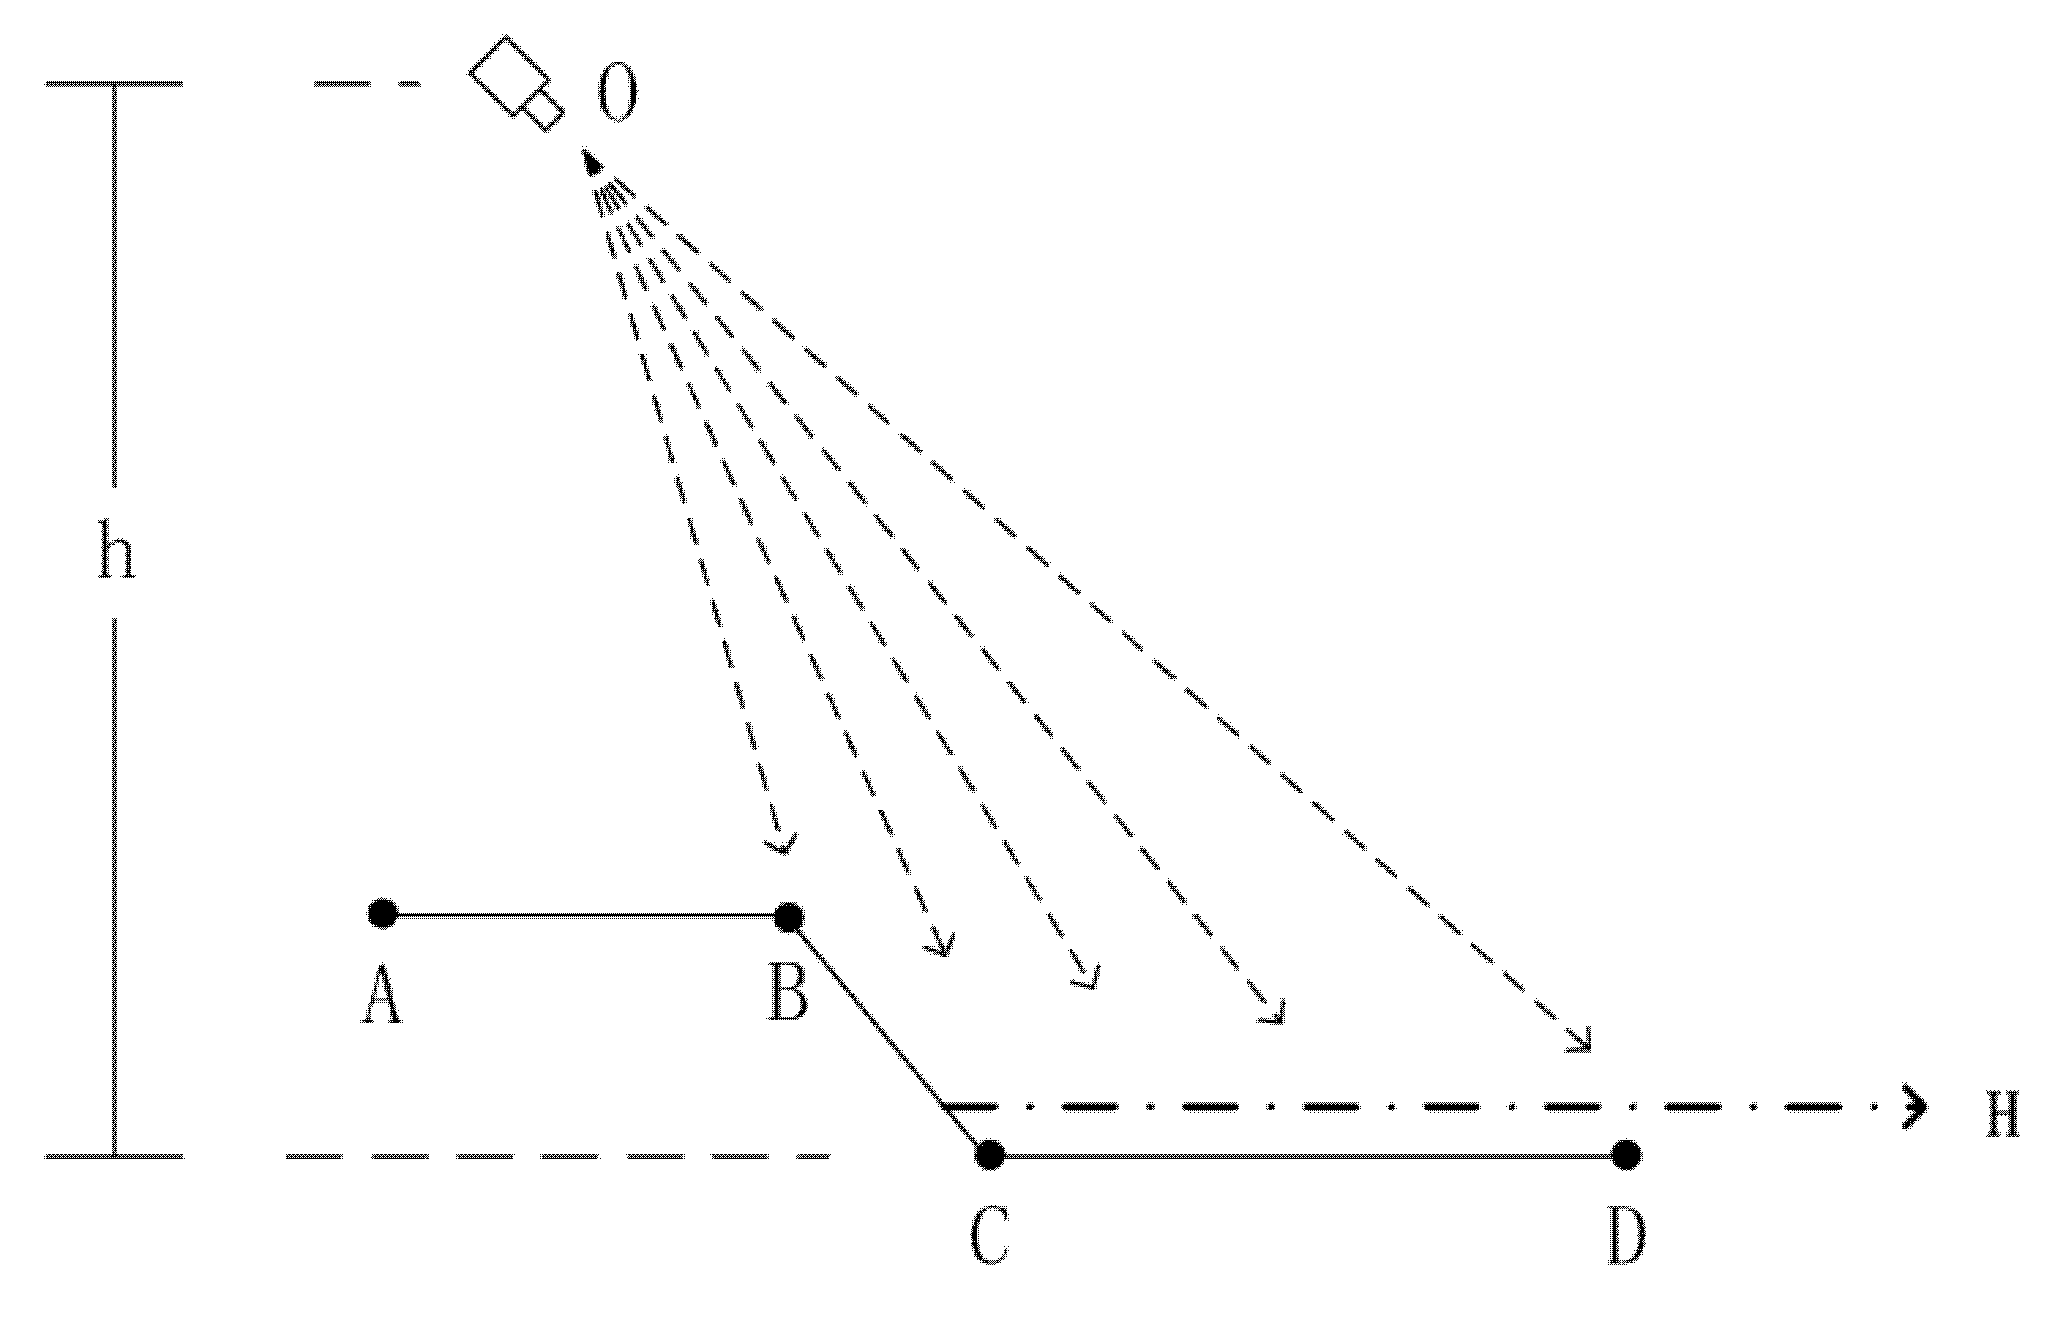
In the 3D point clouds obtained for the target region, points in water regions have different elevation features than points in non-water regions; this difference provides an important basis for identifying non-water regions. Specifically, the point cloud elevation of the water regions is lower than that of the non-water regions. Therefore, this study designed an intelligent discrimination method to recognize non-water regions based on point cloud elevation characteristics. The 3D point cloud data acquisition method based on the binocular video monitoring system applied to a target area is shown in Figure 6. and are points in non-water regions, and are points in water regions, is the monitoring position of the binocular surveillance camera, is the elevation threshold, and is the distance from the camera to the water surface.
It is easy to know from Figure 6 that the value of is very important for accurate identification of non-water regions. Water regions are often affected by waves and the reflection of surface features on the shore, which leads to the existence of some vertices with abnormal elevation values in the 3D point cloud data of the water regions. The abnormal elevation values will interfere with the recognition of point clouds in non-water regions. To solve this problem, the value of is determined as ( is the water surface elevation). Then, the point cloud of the non-water region is intelligently identified through the threshold value H; for any vertex, if its elevation value is greater than h, it is marked as a non-water region vertex; otherwise, it is marked as a water region vertex. Finally, the spatial distribution range of non-water regions can be determined based on the identified vertex coordinates of all non-water regions.
- (2)
- Obtaining the pixel coordinates of the non-water regions
The pixel is the smallest unit of an image, and pixel coordinates refer to the position of the pixel in the image. Based on the world coordinates of the marked vertices in the non-water regions, the pixel coordinates of the corresponding pixels in the pixel coordinate system of all the vertices in the non-water regions can be calculated by using the internal and external parameters of the camera. The conversion method from world coordinates to pixel coordinates is:
where is the elevation in the camera coordinate system; is the number of columns in the image; is the number of lines in the image; is the number of pixels on the unit distance of the U-axis of the image plane; is the number of pixels on the unit distance of the v-axis of the image plane; is the coordinate of the main point of the image; is the 3D coordinate in the world coordinate system; is the rotation matrix of the calibrated camera; and is the translation matrix of the calibrated camera.
Since the 3D point cloud data are calculated and obtained according to the left parallax map, the calculated pixel coordinates are the pixel coordinates in the left image.
- (3)
- Deletion of non-water regions in the left image
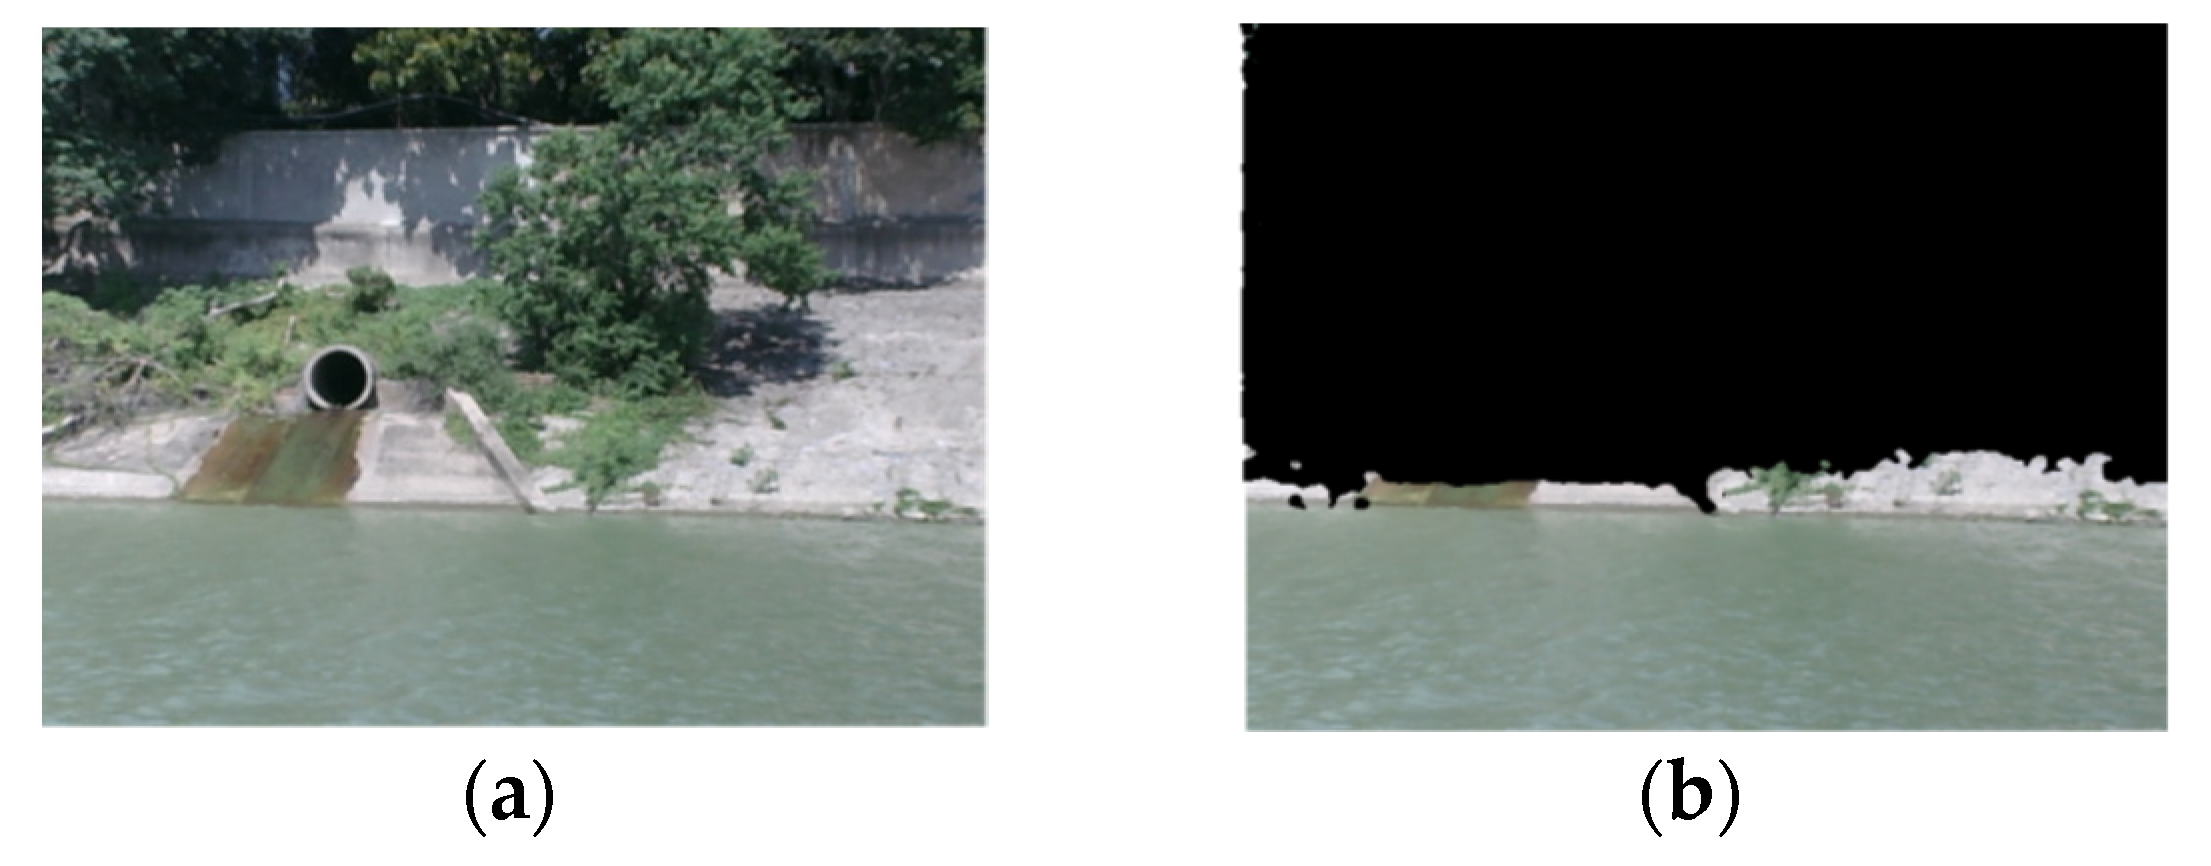
There is absolute independence between pixels, and changing the pixel value of one pixel does not affect other pixels. According to the pixel coordinates of the non-water regions in the left video image, the pixel values of the non-water regions can be changed. By changing the color characteristics of non-water regions and realizing non-water area deletion in the left video image (Figure 7), the image data of the water regions in the left video image is generated.
2.3.3. Accurate Identification of Algal Blooms
By using the existing video image and the algal-blooms recognition method, the water regions image data of the left video image generated in Section 2.3.2 is used to recognize algal blooms. To a certain extent, this can eliminate the uncertain accuracy of the extraction result for algal blooms that is caused by the interference of nearshore vegetation, and realize the accurate recognition of algal blooms.
2.4. Precision Evaluation
To verify the feasibility and reliability of the binocular vision monitoring system in terms of algal-bloom monitoring, an effective index is necessary to reflect the accuracy of algal-bloom recognition. In this paper, PA (pixel accuracy) is used as the accuracy evaluation index, which refers to the proportion of the number of pixels in the left video image where algae blooms are correctly recognized to the total number of pixels. PA can be calculated by using Equation (2), where is the number of pixels where algal bloom is correctly recognized, denotes the total number of pixels in the left video image.
3. Results
Taking Lake Chaohu Basin as the experimental object, the calibrated binocular video surveillance system was used to sample the key nearshore zones of Lake Chaohu. Then, based on the Visual Studio 2019 software development tool, OpenCV 3.4, PCL (point cloud Library) 1.12.0 and C + + development programming language, accurate recognition of algal blooms based on the binocular video monitoring system is realized.
To verify the advantages of the proposed method, multiple sets of video images were collected in both the algal-free areas and the algal areas for experiments. Firstly, the collected video images are manually interpreted. (The non-water regions in the video images were manually removed by manual recognition, and the actual areas of algal blooms in the video images were identified by the algal-bloom recognition method in the video images within water regions). The results of artificial interpretation were considered as the actual spatial distribution of algal blooms.
Then, the method described in [31] and the method proposed in this paper were used to recognize algal blooms in the left video images, and comparison experiments were made between the two methods. The results of the comparison are shown in Table 1, and the identification results for algal blooms in the algal-free area are shown in Table 2.
From Table 1 and Table 2, it can be seen that the recognition results using the proposed method are closer to the manual interpretation results, compared with the method described in [31].
Afterward, the PAs of the recognition result were calculated separately, using the PA of the manual interpretation result as the true value. Finally, the recognition results of the method described in [31] and the method proposed in this paper are compared with the manual interpretation result. The comparison results of algal areas and algal-free areas are shown in Table 3 and Table 4, respectively.
It can be concluded from the above experiments that the errors of algal-bloom recognition for the proposed method are far lower than those for the method described in [31]. It can be seen from Table 3 and Table 4 that the errors of algal recognition are caused mainly by the interference of onshore vegetation. Accordingly, it is proved that using the method proposed in this paper to monitor algae blooms in the nearshore zones of lakes and reservoirs can effectively eliminate the influence of the onshore vegetation, and improve significantly the accuracy of algal-bloom monitoring.
4. Discussion
An accurate monitoring method for algal blooms in the nearshore zones of lakes and reservoirs based on a binocular video surveillance system is proposed in this paper. The 3D point cloud reconstruction of the target area in the lakeside zone is first realized, based on the principle of binocular stereo vision. The pixel coordinates of non-water regions in 3D point cloud data are then calculated. The image data of water regions can be obtained afterward by processing the non-water regions pixel value of the image. Finally, the accurate identification of algal blooms in the key nearshore zones of the lakes and reservoirs is realized.
In this work, when distinguishing water regions and non-water regions in 3D point cloud data, the extraction results of the “water-land” boundary are not clear due to point cloud sparsity, which affects the accuracy of algae-bloom recognition to a certain degree. Therefore, we will give more attention to improving the stereo matching algorithm in our near-future work. In addition, only the area portion of algal blooms in the target region is obtained, while the accurate area of algal blooms is not calculated; we will try our best to solve this problem in our future work.
Supplementary Materials
The following supporting information can be downloaded at: https://www.mdpi.com/article/10.3390/w14223728/s1. Table S1: Parameters of the binocular image acquisition system; Figure S1: Basic principle of binocular stereo vision; Table S2: Description of the camera calibration parameters; Figure S2: Image correction; Figure S3: Disparity image optimization.
Author Contributions
Conceptualization, J.L. and Y.Q.; methodology, J.L., Y.Q. and C.X.; validation, Y.Q., J.L. and H.X.; formal analysis, Y.Q.; investigation, J.L.; resources, J.L., Y.Q. and H.X.; data curation, J.L. and X.W.; writing—original draft preparation, J.L.; writing—review and editing, J.L.; visualization, J.L. and X.W.; supervision, Y.Q. and H.X.; project administration, Y.Q. and C.X. All authors have read and agreed to the published version of the manuscript.
Funding
This work was supported jointly by the Natural Science Foundation of Jiangsu Province (Grant No. BK20201100), the National Natural Science Foundation of China (Grant No. 42101433), and the Open Research Fund of National Engineering Research Center for Agro-Ecological Big Data Analysis and Application, Anhui University (Grant No. AE202107).
Institutional Review Board Statement
Not applicable.
Informed Consent Statement
Not applicable.
Data Availability Statement
The corresponding data and programs can be obtained by contacting the corresponding author via [email protected].
Conflicts of Interest
The authors declare no competing financial interest.
References
- Brooks, B.W.; Lazorchak, J.M.; Howard, M.D.; Johnson, M.-V.V.; Morton, S.L.; Perkins, D.A.; Reavie, E.D.; Scott, G.I.; Smith, S.A.; Steevens, J.A. Are harmful algal blooms becoming the greatest inland water quality threat to public health and aquatic ecosystems? Environ. Toxicol. Chem. 2016, 35, 6–13. [Google Scholar] [CrossRef] [PubMed]
- Reynolds, C.S. Cyanobacterial water-blooms. Adv. Bot. Res. 1987, 13, 67–143. [Google Scholar]
- Wang, H.; Xu, C.; Liu, Y.; Erik, J.; Jens-Christian, S.; Wu, J.; Zhang, W.; Zhou, T.; Wang, P.; Shingirai, N.; et al. From unusual suspect to serial killer: Cyanotoxins boosted by climate change may jeopardize African megafauna. Innov. Amst. 2021, 2, 100092. [Google Scholar] [CrossRef] [PubMed]
- Qiu, Y.; Duan, H.; Xie, H.; Ding, X.; Jiao, Y. Design and development of a web-based interactive twin platform for watershed management. Trans. GIS 2022, 26, 1299–1317. [Google Scholar] [CrossRef]
- Torgersen, C.; Faux, R.N.; McIntosh, B.A.; Poage, N.J.; Norton, D.J. Airborne thermal remote sensing for water temperature assessment in rivers and streams. Remote Sens. Environ. 2001, 76, 386–398. [Google Scholar] [CrossRef]
- Vrieling, A. Satellite remote sensing for water erosion assessment: A review. CATENA 2006, 65, 2–18. [Google Scholar] [CrossRef]
- Chacon-Torres, A.; Ross, L.G.; Beveridge, M.C.M.; Watson, A.I. The application of SPOT multispectral imagery for the assessment of water quality in Lake Patzcuaro, Mexico. Int. J. Remote Sens. 1992, 13, 587–603. [Google Scholar] [CrossRef]
- Thenkabail, P.S.; Cai, X.; Biradar, C.M.; Platonov, A.; Dheeravath, V.; Goldlshleger, N.; Ben Dor, E.; Alchanatis, V.; Vithanage, J.; Markandu, A.; et al. Water productivity mapping using remote sensing data of various resolutions to support “more crop per drop”. J. Appl. Remote Sens. 2009, 3, 033557. [Google Scholar] [CrossRef]
- Giardino, C.; Bresciani, M.; Villa, P.; Martinelli, A. Application of Remote Sensing in Water Resource Management: The Case Study of Lake Trasimeno, Italy. Water Resour. Manag. 2010, 24, 3885–3899. [Google Scholar] [CrossRef]
- Rodriguez, P.O.; Holzman, M.; Degano, M.; Faramiñán, A.; Rivas, R.; Bayala, M. Spatial variability of the green water footprint using a medium-resolution remote sensing technique: The case of soybean production in the Southeast Argentine Pampas. Sci. Total Environ. 2021, 763, 142963. [Google Scholar] [CrossRef]
- Ortiz-Rosa, S.; Hernández, W.; Williams, S.; Armstrong, R. Water Quality Anomalies following the 2017 Hurricanes in Southwestern Puerto Rico: Absorption of Colored Detrital and Dissolved Material. Remote Sens. 2020, 12, 3596. [Google Scholar] [CrossRef]
- Sun, X.; Zhang, Y.; Shi, K.; Zhang, Y.; Li, N.; Wang, W.; Huang, X.; Qin, B. Monitoring water quality using proximal remote sensing technology. Sci. Total Environ. 2022, 803, 149805. [Google Scholar] [CrossRef] [PubMed]
- Clark, J.; Schaeffer, B.; Darling, J.A.; Urquhart, E.A.; Johnston, J.M.; Ignatius, A.R.; Myer, M.H.; Loftin, K.A.; Werdell, P.J.; Stumpf, R.P. Satellite monitoring of cyanobacterial harmful algal bloom frequency in recreational waters and drinking water sources. Ecol. Indic. 2017, 80, 84–95. [Google Scholar] [CrossRef]
- Gómez, J.; Alonso, C.A.; García, A. Remote sensing as a tool for monitoring water quality parameters for mediterranean lakes of European Union water framework directive (WFD) and as a system of surveillance of cyanobacterial harmful algae blooms (SCyanoHABs). Environ. Monit. Assess. 2011, 181, 317–334. [Google Scholar] [CrossRef] [PubMed]
- Jim, G.; Chuanmin, H.; Gary, B.; Stephanie, K. Ocean Color Satellites Show Extensive Lines of Floating Sargassum in the Gulf of Mexico. IEEE Trans. Geosci. Remote Sens. 2006, 44, 3619–3625. [Google Scholar]
- Hu, C.; Muller-Karger, F.E.; Taylor, C.; Carder, K.L.; Kelble, C.; Johns, E.; Heil, C.A. Red tide detection and tracing using MODIS fluorescence data: A regional example in SW Florida coastal waters. Remote Sens. Environ. 2005, 97, 311–321. [Google Scholar] [CrossRef]
- Edward, S.; Frédéric, F.; Rafael, A.; Baptista, P.; Heygster, G.; Lubac, B.; Raucoules, D.; Almeida, P.L.; Bergsma, E.W.J.; Capo, S.; et al. Monitoring Beach Topography and Nearshore Bathymetry Using Spaceborne Remote Sensing: A Review. Remote Sens. 2019, 11, 2212. [Google Scholar]
- Hu, C.; Lee, Z.; Ma, R.; Yu, K.; Li, D.; Shang, S. Moderate Resolution Imaging Spectroradiometer (MODIS) observations of cyanobacteria blooms in Taihu Lake, China. J. Geophys. Res. Earth Surf. 2010, 115, C04002. [Google Scholar] [CrossRef] [Green Version]
- Wang, M.; Shi, W. Satellite-Observed Algae Blooms in China’s Lake Taihu. Trans. Am. Geophys. Union 2011, 89, 201–202. [Google Scholar] [CrossRef]
- Qi, L.; Hu, C.; Visser, P.M.; Ma, R. Diurnal changes of cyanobacteria blooms in Taihu Lake as derived from GOCI observations. Limnol. Oceanogr. 2018, 63, 1711–1726. [Google Scholar] [CrossRef] [Green Version]
- Ma, J.; Qin, B.; Paerl, H.W.; Brookes, J.D.; Hall, N.S.; Shi, K.; Zhou, Y.; Guo, J.; Li, Z.; Xu, H.; et al. The persistence of cyanobacterial (Microcystis spp.) blooms throughout winter in Lake Taihu, China. Limnol. Oceanogr. 2016, 61, 711–722. [Google Scholar] [CrossRef] [Green Version]
- Zhang, Y.; Ma, R.; Duan, H.; Loiselle, S.; Zhang, M.; Xu, J. A novel MODIS algorithm to estimate chlorophyll a concentration in eutrophic turbid lakes. Ecol. Indic. 2016, 69, 138–151. [Google Scholar] [CrossRef]
- Liang, Q.; Zhang, Y.; Ma, R.; Loiselle, S.; Li, J.; Hu, M. A MODIS-Based Novel Method to Distinguish Surface Cyanobacterial Scums and Aquatic Macrophytes in Lake Taihu. Remote Sens. 2017, 9, 133. [Google Scholar] [CrossRef]
- Kaire, T.; Tiit, K.; Alo, L.; Sepp, M.; Paavel, B.; Noges, T. First Experiences in Mapping Lake Water Quality Parameters with Sentinel-2 MSI Imagery. Remote Sens. 2016, 8, 640. [Google Scholar]
- Yuji, S.; Akihiro, M.; Akihiro, M.; Ono, S.; Ito, A. A Simple Red Tide Monitoring Method using Sentinel-2 Data for Sustainable Management of Brackish Lake Koyama-ike. Japan. Water 2019, 11, 1044. [Google Scholar]
- Yang, Z.; Shi, X.; Chen, N.; Zhang, M. Spatial-temporal variations of the in-situ growth rate of bloom-forming cyanobacteria and their environmental factors in Lake Chaohu, China. J. Lake Sci. 2021, 33, 1043–1050. [Google Scholar]
- Zhang, Y.; Shi, K.; Zhang, Y.; Sun, X.; Li, N.; Huang, X.; Wang, W.; Zhou, Y.; Gao, Y.; Cai, H.; et al. The proposal, practice and preliminary application of land-based (ground-based, shore-based) remote sensing of water environment. Natl. Remote Sens. Bull. 2021, 25, 2163–2172. [Google Scholar]
- Deepak, R.M.; Abhishek, K.; Lakshmish, R.; Boddula, V.K.; Das, M.C.; Page, B.P.; Weber, S.J. CyanoTRACKER: A cloud-based integrated multi-platform architecture for global observation of cyanobacterial harmful algal blooms. Harmful Algae 2020, 96, 101828. [Google Scholar]
- Duan, H.; Wan, N.; Qiu, Y.; Liu, G.; Ceng, Q.; Luo, J.; Chen, Y.; Qi, T. Discussions and practices on the framework of monitoring system in eutrophic lakes and reservoirs. J. Lake Sci. 2020, 32, 1396–1405. [Google Scholar]
- Qiu, Y.; Duan, H.; Wan, N.; Gao, R.; Huang, J.; Xue, K.; Peng, Z.; Xiao, P. Design and practice of a platform for monitoring, early-warning and simulation of algal blooms in Lake Chaohu. J. Lake Sci. 2022, 34, 38–48. [Google Scholar]
- Ma, T.; Xiao, P.; Zhang, X.; Duan, H.; Qiu, Y. Real-time monitoring of cyanobacterial blooms dynamics around Lake Chaohu based on video surveillance images. J. Lake Sci. 2022, 34, 1840–1853. [Google Scholar]
- Zhao, H.; Li, J.; Yan, X.; Fang, S.; Du, Y.; Xue, B.; Yu, K.; Wang, C. Monitoring Cyanobacteria Bloom in Dianchi Lake Based on Ground-Based Multispectral Remote-Sensing Imaging: Preliminary Results. Remote Sens. 2021, 13, 3970. [Google Scholar] [CrossRef]
- Cao, Q.; Yu, G.; Sun, S.; Dou, Y.; Li, H.; Qiao, Z. Monitoring Water Quality of the Haihe River Based on Ground-Based Hyperspectral Remote Sensing. Water 2022, 14, 22. [Google Scholar] [CrossRef]
- Wang, W.; Shi, K.; Zhang, Y.; Li, N.; Sun, X.; Zhang, D.; Zhang, Y.; Qin, B.; Zhu, G. A ground-based remote sensing system for high-frequency and real-time monitoring of phytoplankton blooms. J. Hazard. Mater. 2022, 439, 129623. [Google Scholar] [CrossRef]
Figure 1.
Extraction result of algal blooms based on video images: (a,c) original video images; (b,d) results of algal-bloom extraction.
Figure 1.
Extraction result of algal blooms based on video images: (a,c) original video images; (b,d) results of algal-bloom extraction.


Figure 2.
Basic procedure for algal-bloom extraction by using video images.

Figure 3.
Working principle of the binocular image acquisition system.

Figure 4.
Flowchart of the proposed accurate extraction method for algal blooms.

Figure 5.
Three-dimensional reconstruction of binocular stereo vision: (a) left image; (b) right image; (c) 3D point clouds obtained.
Figure 5.
Three-dimensional reconstruction of binocular stereo vision: (a) left image; (b) right image; (c) 3D point clouds obtained.

Figure 6.
Schematic diagram of point cloud acquisition for the binocular vision monitoring system.

Figure 7.
Deletion of non-water regions in the left image: (a) original image; (b) water image data.
Figure 7.
Deletion of non-water regions in the left image: (a) original image; (b) water image data.


Table 1.
Results of algal-bloom identification in algal-free areas. (Original image is the left video image; the area enclosed by the red line in the original image is the algae area; MI is the result of manual interpretation; MV is the recognition result using the method described in [31]; and BV is the recognition result using the proposed method).
| Experiment ID | Original Image | MI | MV | BV |
|---|---|---|---|---|
| Experiment_01 |  |  |  |  |
| Experiment_02 |  |  |  |  |
| Experiment_03 |  |  |  |  |
| Experiment_04 |  |  |  |  |
| Experiment_05 |  |  |  |  |
Note(s): (![Water 14 03728 i021]() algal area
algal area ![Water 14 03728 i022]() algae-free areas).
algae-free areas).
 algal area
  algae-free areas).
Table 2.
Results of algal-bloom identification in algal areas. (Original image is the left video image; MI is the result of manual interpretation; MV is the recognition result using the method described in [31]; and BV is the recognition result using the proposed method).
Table 2.
Results of algal-bloom identification in algal areas. (Original image is the left video image; MI is the result of manual interpretation; MV is the recognition result using the method described in [31]; and BV is the recognition result using the proposed method).
| Experiment ID | Original Image | MI | MV | BV |
|---|---|---|---|---|
| Experiment_01 |  |  |  |  |
| Experiment_02 |  |  |  |  |
| Experiment_03 |  |  |  |  |
Note(s): (![Water 14 03728 i021]() algal area
algal area ![Water 14 03728 i022]() algae-free area).
algae-free area).
algal area algae-free area).
Table 3.
The comparison results of algal-bloom recognition in algal areas. (MI is the result of manual interpretation; MV is the recognition result using the method described in [31]; BV is the recognition result of the proposed method; and DV is the errors of PA between the method described in [31] and the proposed method).
| Experiment ID | MI | MV | BV | DV |
|---|---|---|---|---|
| Experiment_01 | 25% | 43% | 27% | 16 % |
| Experiment_02 | 36% | 51% | 40% | 11% |
| Experiment_03 | 9% | 48% | 19% | 29% |
| Experiment_04 | 37 % | 65% | 41% | 24% |
| Experiment_05 | 22% | 38 % | 26% | 12% |
Table 4.
The comparison results of algal-bloom recognition in algal-free areas. (MI is the result of manual interpretation; MV is the recognition result using the method described in [31]; BV is the recognition result of this method; and DV is the errors of PA between the method described in [31] and the proposed method).
| Experiment ID | MI | MV | BV | DV |
|---|---|---|---|---|
| Experiment_01 | 5% | 30% | 8% | 22% |
| Experiment_02 | 9% | 46% | 13% | 33% |
| Experiment_03 | 1% | 16% | 6% | 10% |
Publisher’s Note: MDPI stays neutral with regard to jurisdictional claims in published maps and institutional affiliations. |
© 2022 by the authors. Licensee MDPI, Basel, Switzerland. This article is an open access article distributed under the terms and conditions of the Creative Commons Attribution (CC BY) license (https://creativecommons.org/licenses/by/4.0/).
Share and Cite
MDPI and ACS Style
Liu, J.; Xia, C.; Xie, H.; Wang, X.; Qiu, Y. Accurate Monitoring of Algal Blooms in Key Nearshore Zones of Lakes and Reservoirs Using Binocular Video Surveillance System. Water 2022, 14, 3728. https://doi.org/10.3390/w14223728
AMA Style
Liu J, Xia C, Xie H, Wang X, Qiu Y. Accurate Monitoring of Algal Blooms in Key Nearshore Zones of Lakes and Reservoirs Using Binocular Video Surveillance System. Water. 2022; 14(22):3728. https://doi.org/10.3390/w14223728
Chicago/Turabian StyleLiu, Jia, Chunlin Xia, Hui Xie, Xiaodong Wang, and Yinguo Qiu. 2022. "Accurate Monitoring of Algal Blooms in Key Nearshore Zones of Lakes and Reservoirs Using Binocular Video Surveillance System" Water 14, no. 22: 3728. https://doi.org/10.3390/w14223728
Note that from the first issue of 2016, this journal uses article numbers instead of page numbers. See further details here.