
GIS-Based Approach Applied to Study of Seasonal Rainfall Influence over Flood Vulnerability

 ,
,  , , ,
, , ,  , , , , ,
  , and
, and 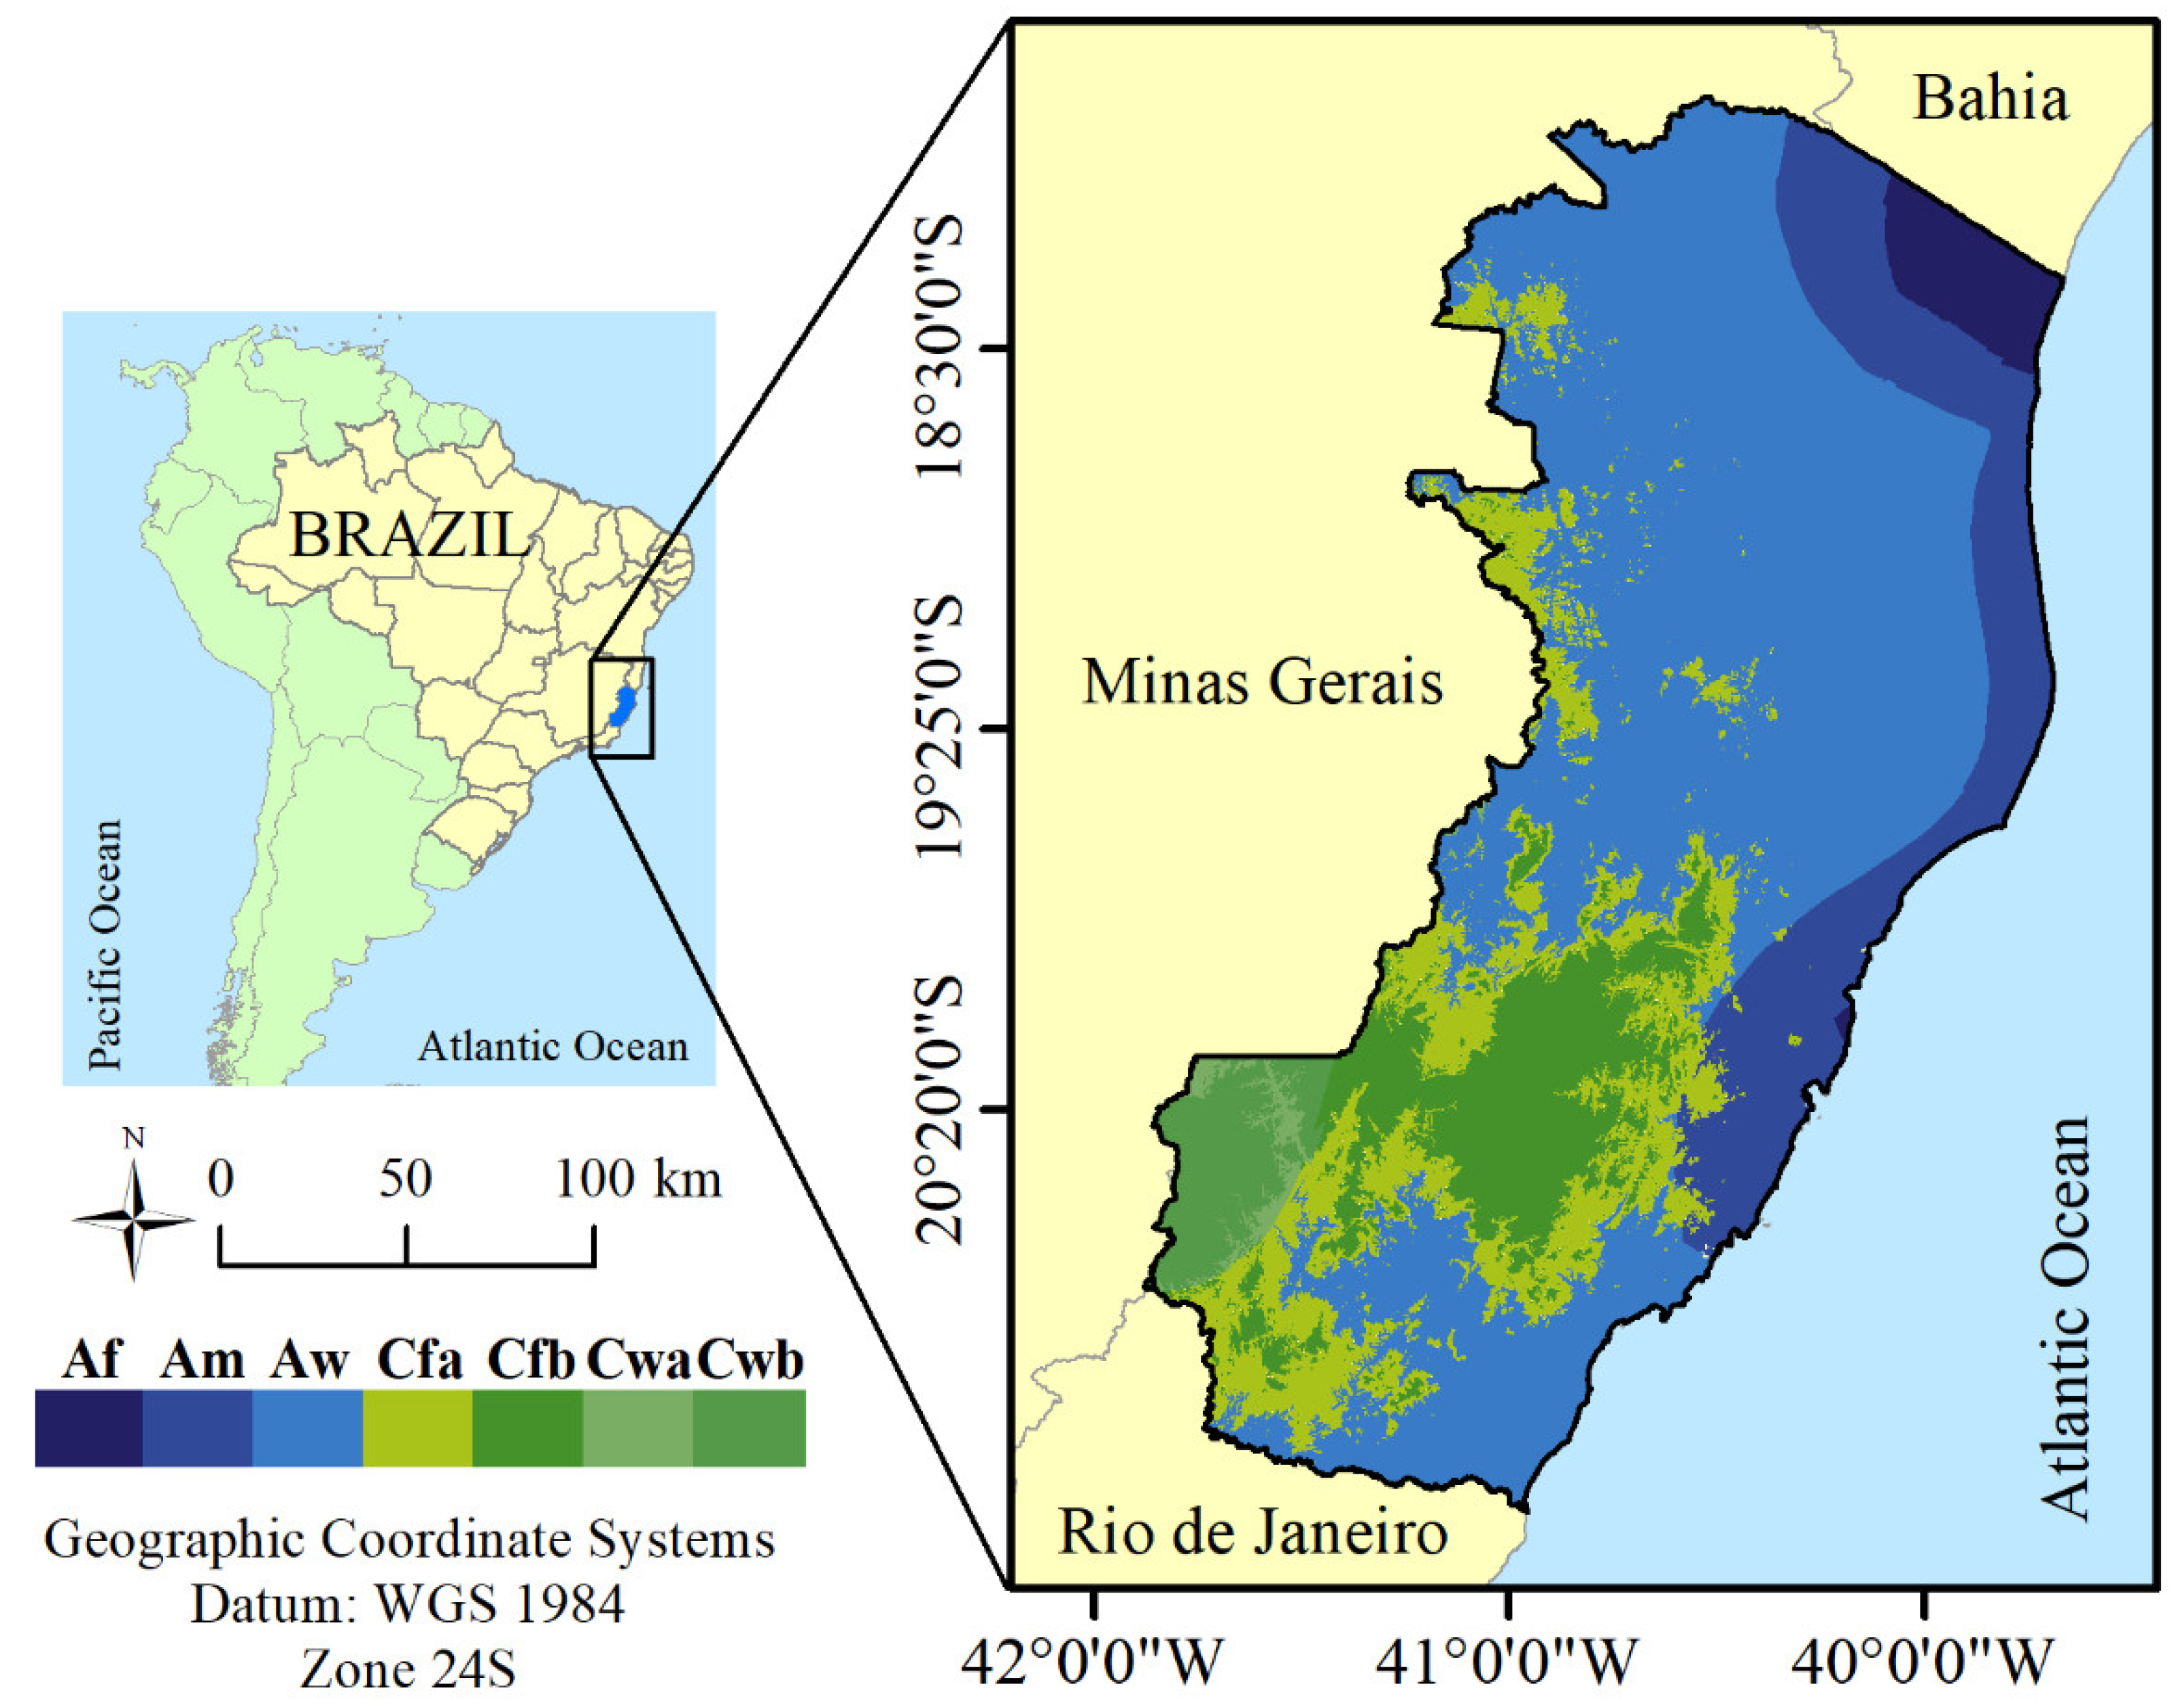
Abstract
:1. Introduction
2. Materials and Methods
2.1. Study Area
2.1.1. Climatic Characterization
2.1.2. Geomorphological Characterization
2.1.3. Socioeconomic Characterization
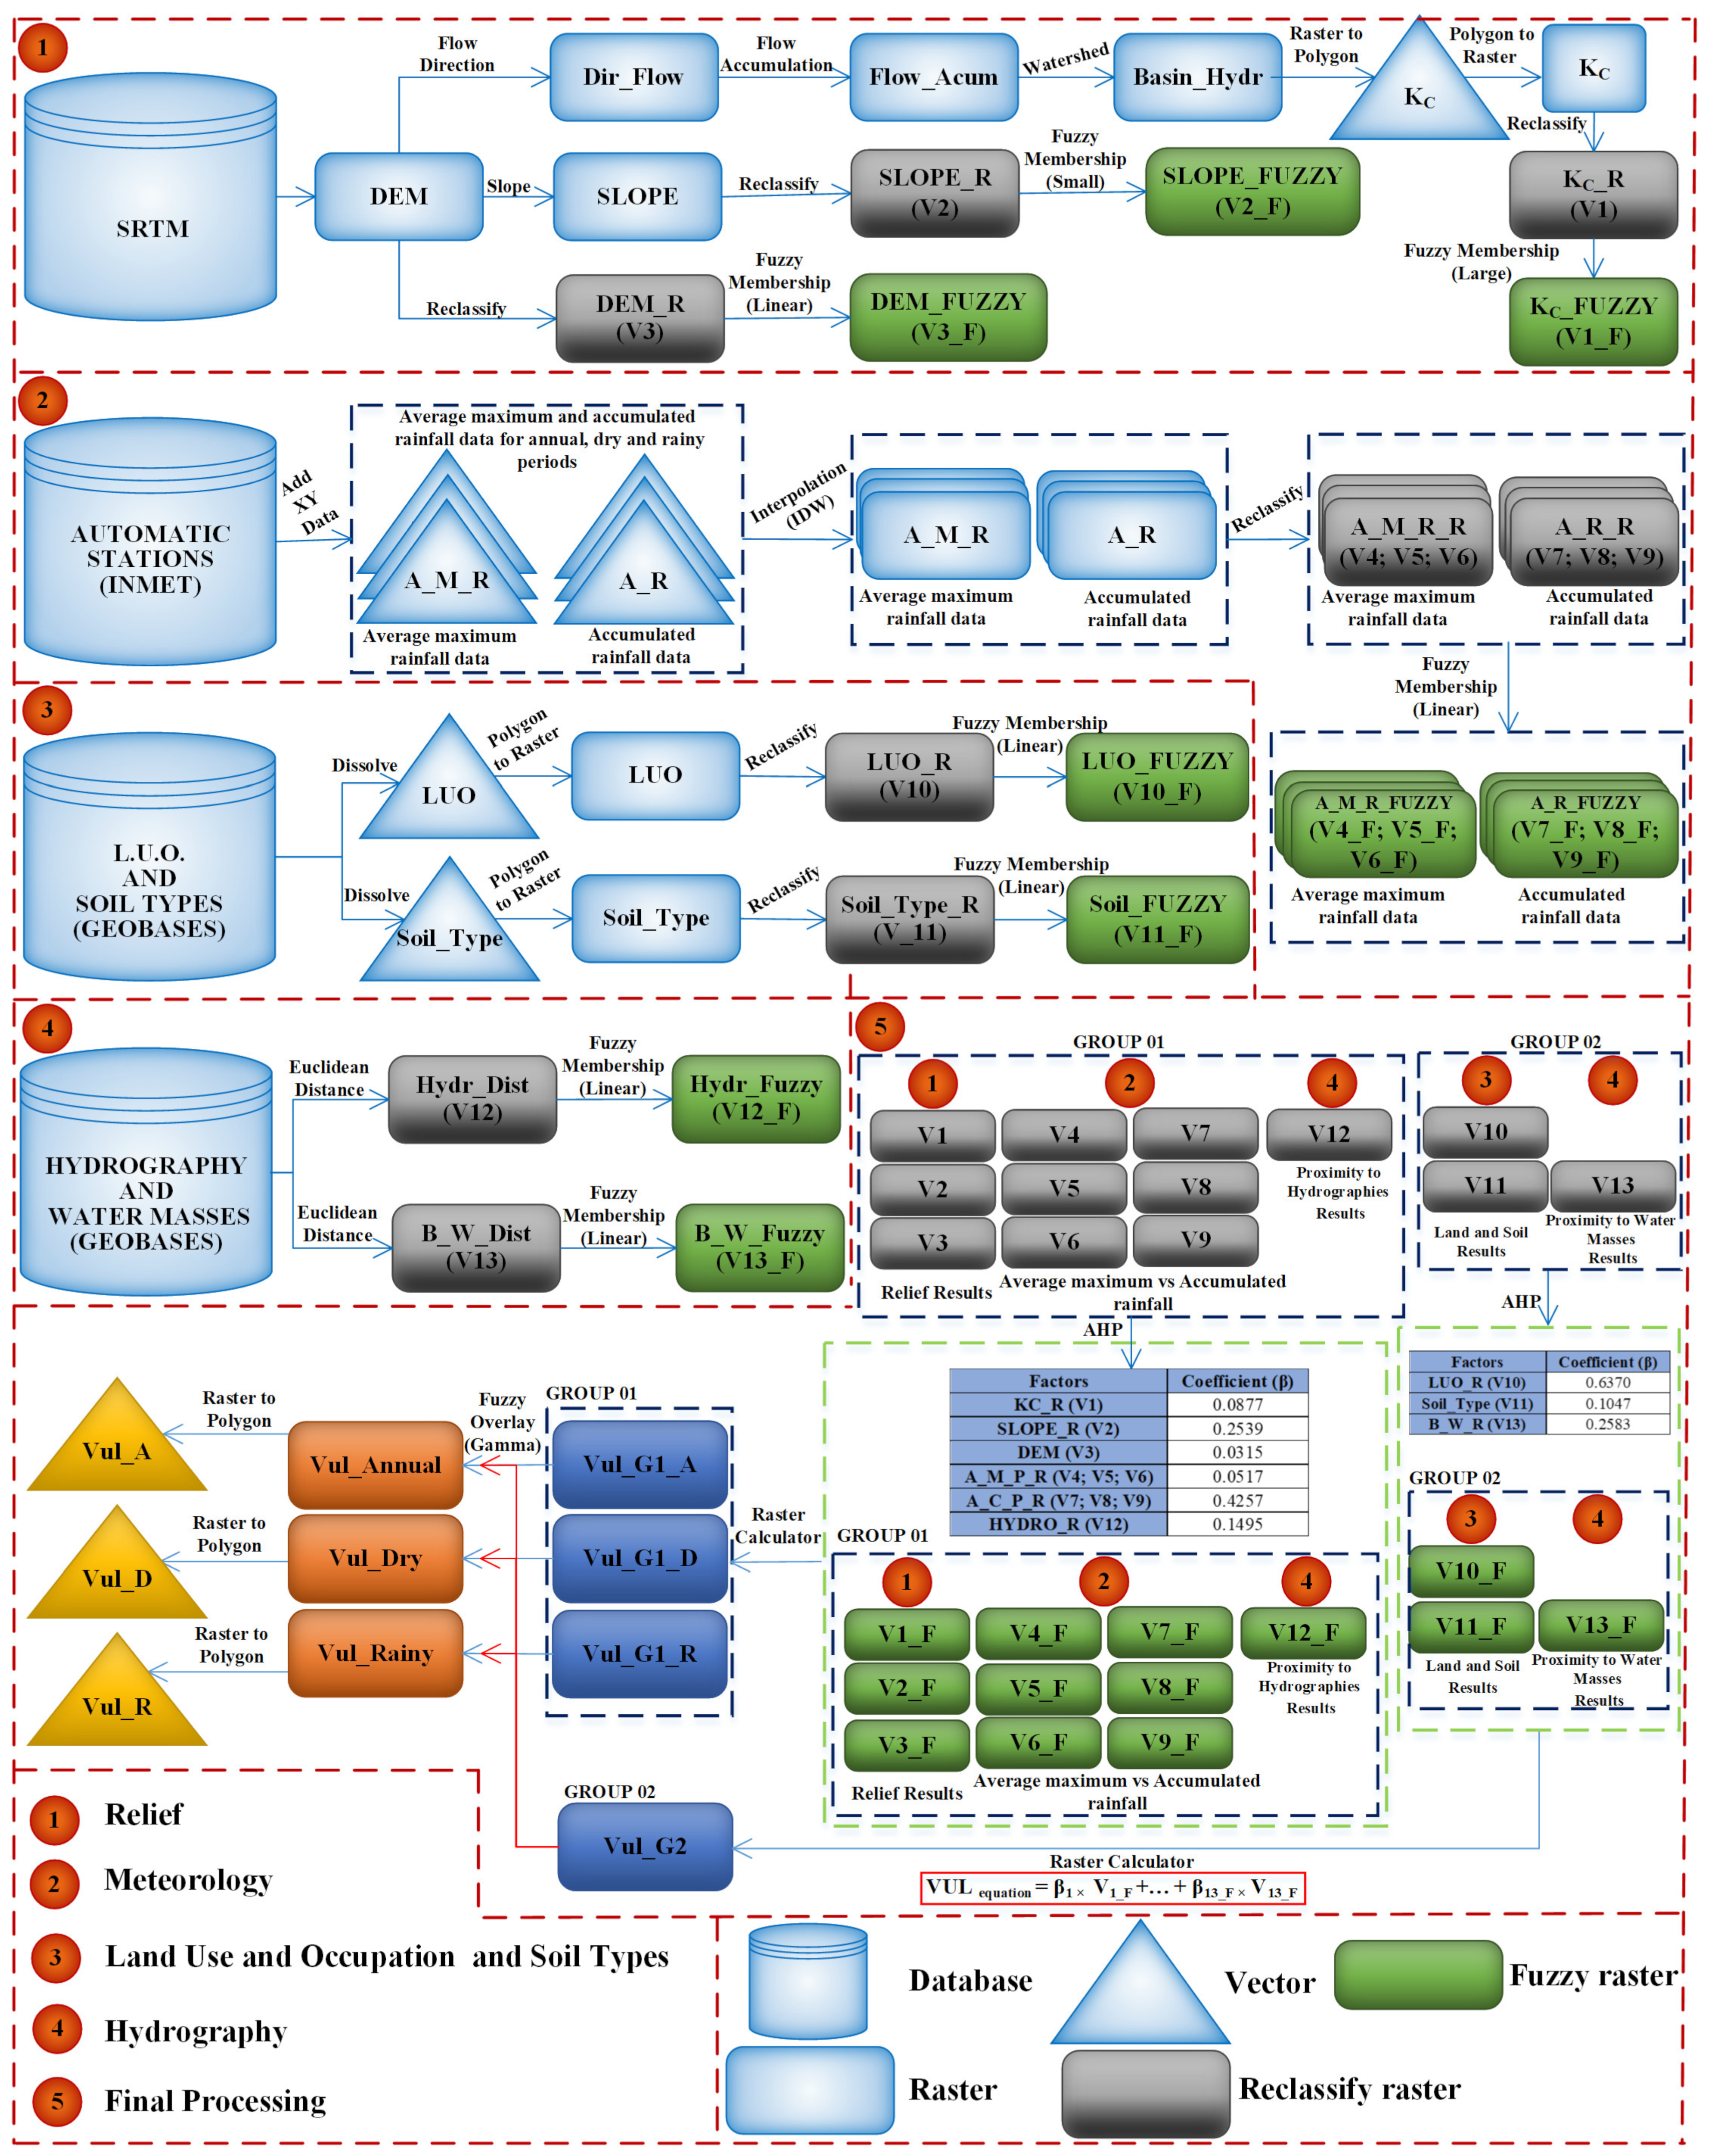
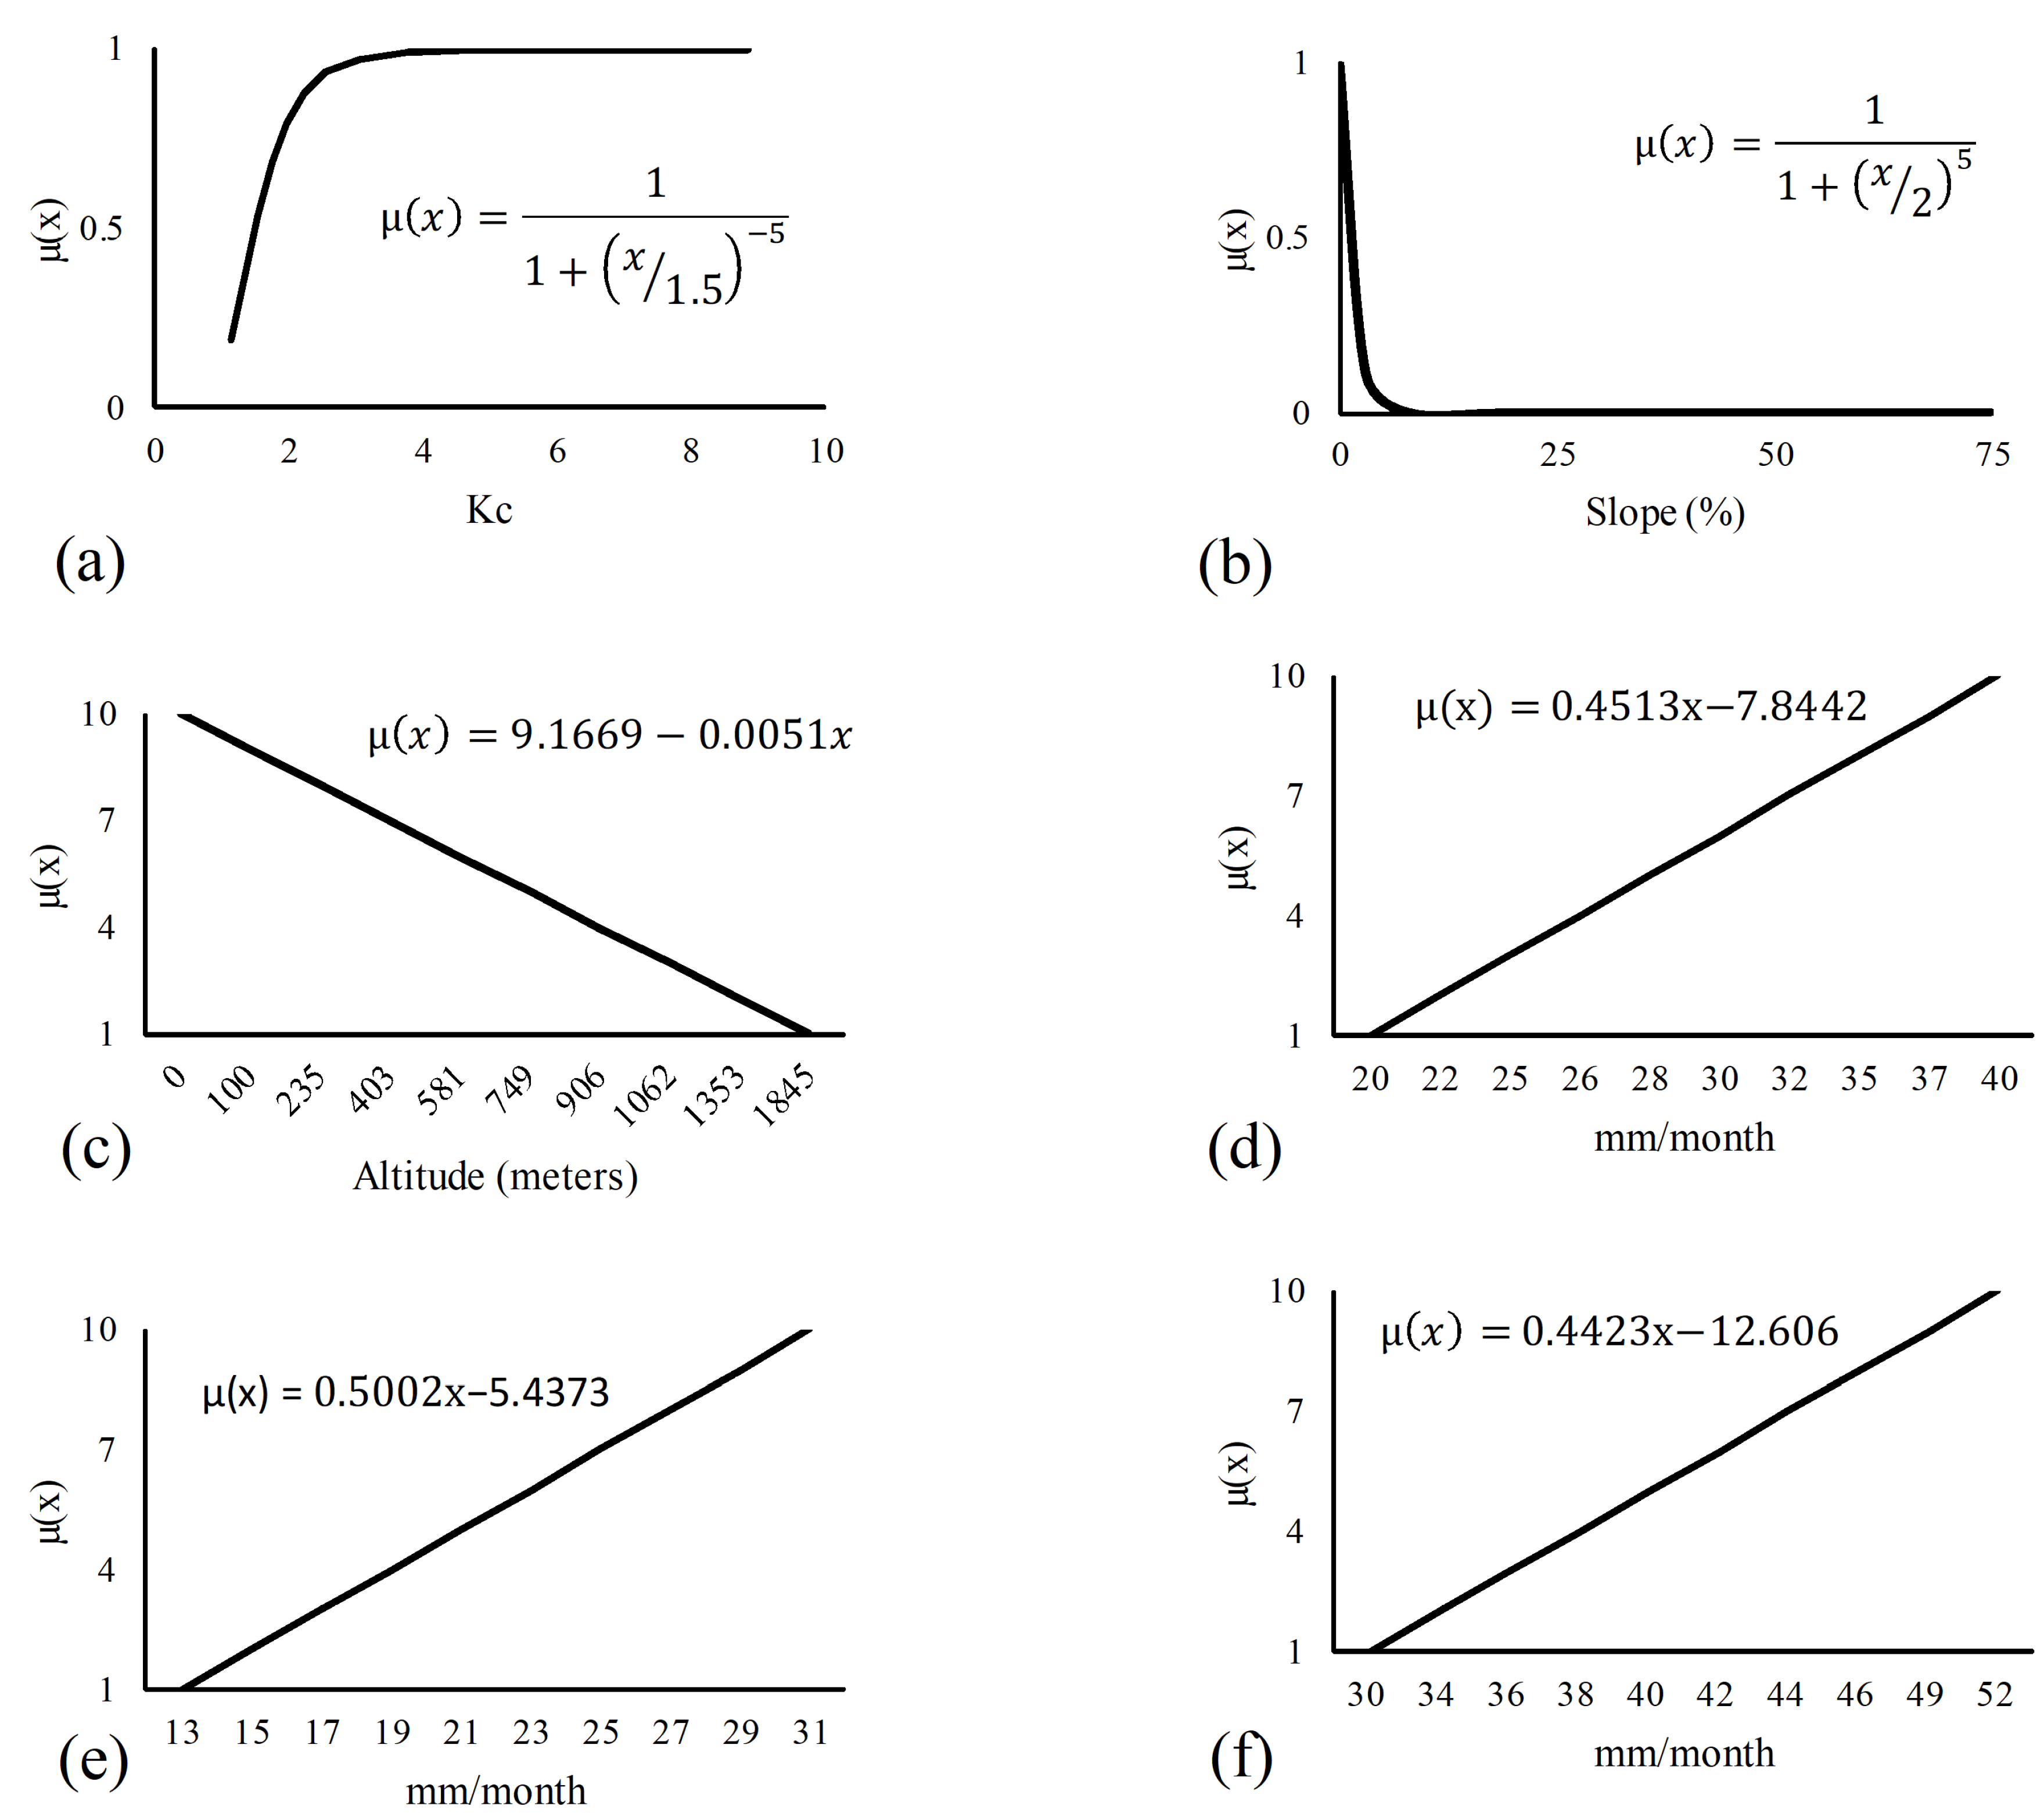
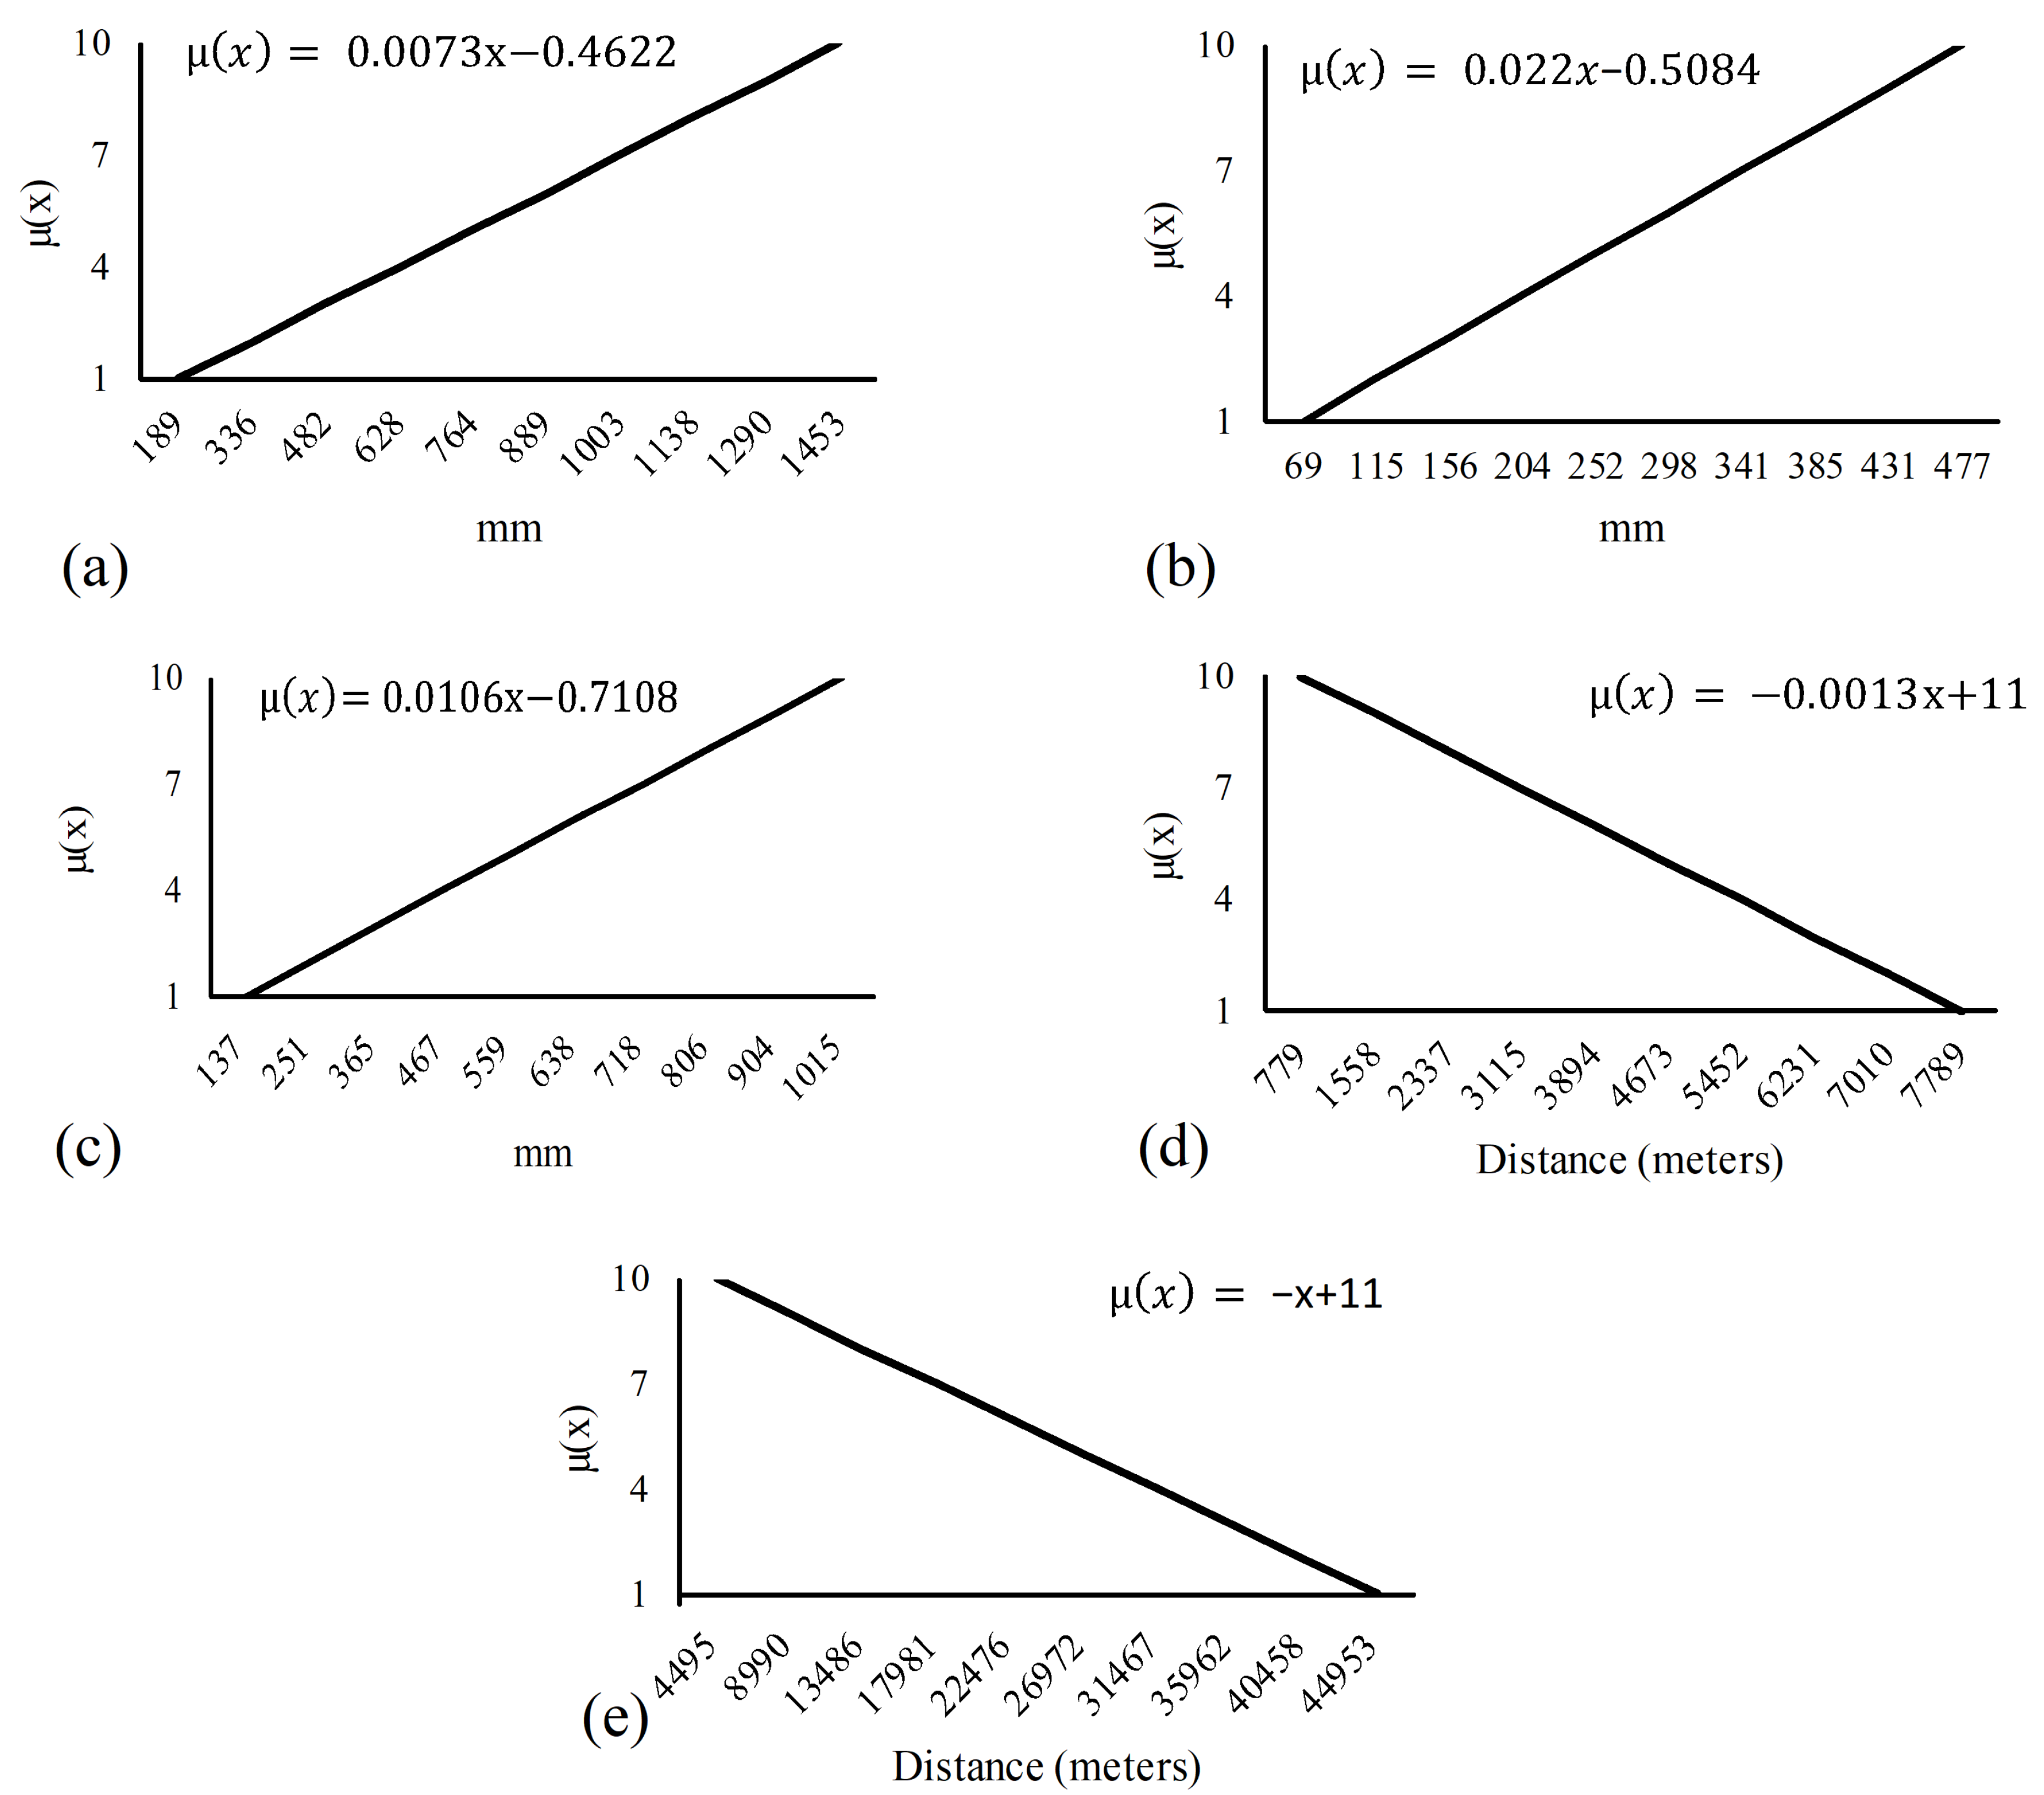
2.2. Methodological Steps
3. Results
Flood Vulnerability in Espírito Santo State
4. Discussion
5. Conclusions
Supplementary Materials
Author Contributions
Funding
Data Availability Statement
Acknowledgments
Conflicts of Interest
References
- Kobiyama, M.; Mendonça, M.; Moreno, D.A.; De Oliveira, I.P.V.; Emerson, M.; Marcelino Edson, V.; Gonçalves, F.; Luiza, L.; Brazetti, P.; Fabris Goerl, R.; et al. Prevenção de Desastres Naturais: Conceitos Básicos; Organic Trading: Florianópolis, Brazil, 2006. [Google Scholar]
- Jha, A.; Bloch, R.; Lamond, J. Cidades e Inundações: Um Guia Para a Gestão Integrada de Inundações Urbanas para o Século XXI. Um resumo para os Formuladores de Políticas; World Bank: Washington, DC, USA, 2012; pp. 1–54. [Google Scholar]
- Wu, Z.; Xue, W.; Xu, H.; Yan, D.; Wang, H.; Qi, W. Urban Flood Risk Assessment in Zhengzhou, China, Based on a D-Number-Improved Analytic Hierarchy Process and a Self-Organizing Map Algorithm. Remote Sens. 2022, 14, 4777. [Google Scholar] [CrossRef]
- Magalhães, I.A.L.; Thiago, C.R.L.; Agrizzi, D.V.; dos Santos, A.R. Uso de Geotecnologias Para Mapeamento De Áreas De Risco De Inundação Em Guaçuí, Es: Uma Análise Comparativa Entre Dois Métodos. Cad. Geociênc. 2011, 8, 63–70. [Google Scholar]
- Berndtsson, R.; Becker, P.; Persson, A.; Aspegren, H.; Haghighatafshar, S.; Jönsson, K.; Larsson, R.; Mobini, S.; Mottaghi, M.; Nilsson, J.; et al. Drivers of Changing Urban Flood Risk: A Framework for Action. J. Environ. Manag. 2019, 240, 47–56. [Google Scholar] [CrossRef] [PubMed]
- Stocker, T.F.; Qin, G.-K.P.D.; Tignor, M.; Allen, S.K.; Boschung, J.; Nauels, A.; Xia, Y.; Bex, V. Climate Change 2013: The Physical Science Basis; Reino Unido e Nova Iorque, Painel Intergovernamental Sobre Alterações Climáticas: Cambridge, UK, 2013. [Google Scholar]
- Church, J.A.; Clark, P.U.; Cazenave, A.; Gregory, J.M.; Jevrejeva, S.; Levermann, A.; Merrifield, M.A.; Milne, G.A.; Nerem, R.S.; Nunn, P.D.; et al. Sea Level Change; PM Cambridge University Press: Cambridge, UK, 2013. [Google Scholar]
- Romero, S. The New York Times: Briefing Mundial | As Américas; EUA: New York, NY, USA, 2013; p. 8. [Google Scholar]
- Cai, T.; Li, X.; Ding, X.; Wang, J.; Zhan, J. Flood Risk Assessment Based on Hydrodynamic Model and Fuzzy Comprehensive Evaluation with GIS Technique. Int. J. Disaster Risk Reduct. 2019, 35, 101077. [Google Scholar] [CrossRef]
- Costache, R.; Tin, T.T.; Arabameri, A.; Crăciun, A.; Ajin, R.S.; Costache, I.; Islam, A.R.M.T.; Abba, S.I.; Sahana, M.; Avand, M.; et al. Flash-Flood Hazard Using Deep Learning Based on H 2 O R Package and Fuzzy-Multicriteria Decision-Making Analysis. J. Hydrol. 2022, 609, 17. [Google Scholar] [CrossRef]
- Gomide, F.A.C.; Gudwin, R.R.; Tanscheit, R. Conceitos Fundamentais Da Teoria de Conjuntos Fuzzy Lógica Fuzzy e Aplicações. In Proceedings of the 6th IFSA IFAC Congress Tutorials, São Paulo, Brasil, 25 October 2015; pp. 1–38. [Google Scholar]
- De Peluzio, T.M.O. Lógica Fuzzy Na Determinação de Fragmentos Florestais Para a Coleta de Sementes. Ph.D. Thesis, Universidade Federal do Espirito Santo, Jerônimo Monteiro, Brazil, 2017. [Google Scholar]
- Teixeira, T.R.; Soares Ribeiro, C.A.A.; Rosa dos Santos, A.; Marcatti, G.E.; Lorenzon, A.S.; de Castro, N.L.M.; Domingues, G.F.; Leite, H.G.; da Costa de Menezes, S.J.M.; Santos Mota, P.H.; et al. Forest Biomass Power Plant Installation Scenarios. Biomass Bioenergy 2018, 108, 35–47. [Google Scholar] [CrossRef]
- Yu, D.; Hong, X. A Theme Evolution and Knowledge Trajectory Study in AHP Using Science Mapping and Main Path Analysis. Expert Syst. Appl. 2022, 205, 14. [Google Scholar] [CrossRef]
- Lyu, H.-M.; Zhou, W.-H.; Shen, S.-L.; Zhou, A.-N. Inundation Risk Assessment of Metro System Using AHP and TFN-AHP in Shenzhen. Sustain. Cities Soc. 2020, 56, 14. [Google Scholar] [CrossRef]
- Githinji, T.W.; Dindi, E.W.; Kuria, Z.N.; Olago, D.O. Application of Analytical Hierarchy Process and Integrated Fuzzy-Analytical Hierarchy Process for Mapping Potential Groundwater Recharge Zone Using GIS in the Arid Areas of Ewaso Ng’iro—Lagh Dera Basin, Kenya. HydroResearch 2022, 5, 22–34. [Google Scholar] [CrossRef]
- Das, S. Flood Susceptibility Mapping of the Western Ghat Coastal Belt Using Multi-Source Geospatial Data and Analytical Hierarchy Process (AHP). Remote Sens. Appl. Soc. Environ. 2020, 20, 17. [Google Scholar] [CrossRef]
- Yin, J.; Yu, D.; Yin, Z.; Wang, J.; Xu, S. Modelling the Anthropogenic Impacts on Fluvial Flood Risks in a Coastal Mega-City: A Scenario-Based Case Study in Shanghai, China. Landsc. Urban Plan. 2015, 136, 144–155. [Google Scholar] [CrossRef]
- Chang, C.T. Risk-Trading in Flood Management: An Economic Model. J. Environ. Manag. 2017, 200, 1–5. [Google Scholar] [CrossRef]
- Kulp, S.; Strauss, B.H. Rapid Escalation of Coastal Flood Exposure in US Municipalities from Sea Level Rise. Clim. Chang. 2017, 142, 477–489. [Google Scholar] [CrossRef] [Green Version]
- Jongman, B.; Hochrainer-Stigler, S.; Feyen, L.; Aerts, J.C.J.H.; Mechler, R.; Botzen, W.J.W.; Bouwer, L.M.; Pflug, G.; Rojas, R.; Ward, P.J. Increasing Stress on Disaster-Risk Finance Due to Large Floods. Nat. Clim. Chang. 2014, 4, 264–268. [Google Scholar] [CrossRef]
- Venegas-González, A.; Roig, F.A.; Lisi, C.S.; Junior, A.A.; Alvares, C.A.; Tomazello-Filho, M. Drought and Climate Change Incidence on Hotspot Cedrela Forests from the Mata Atlântica Biome in Southeastern Brazil. Glob. Ecol. Conserv. 2018, 15, 15. [Google Scholar] [CrossRef]
- Instituto Brasileiro de Geografia e Estatística. XII Recenseamento Geral Do Brasil; Instituto Brasileiro de Geografia e Estatística: Rio de Janeiro, Brazil, 2017. [Google Scholar]
- Secretaria de Estado do Turismo—SETUR/ES. Mapa Do Turismo Do Espírito Santo; Secretaria de Estado do Turismo—SETUR/ES: Vitória, Brazil, 2016. [Google Scholar]
- Mantovani, A.M. Espírito Santo. Vitória, ES, 2003. Available online: https://en.wikivoyage.org/wiki/Esp%C3%ADrito_Santo (accessed on 14 September 2022).
- IEMA. Referência Técnica Instituto Estadual de Meio Ambiente e Recursos Hídricos; IEMA: Cariacica, Brazil, 2012. [Google Scholar]
- Cunha, A.d.M.; Feitoza, H.N.; Feitoza, L.R.; de Oliveira, F.S.; Lani, J.L.; Cardoso, J.K.F.; Trindade, F.S. Atualização Da Legenda Do Mapa de Reconhecimento de Solos Do Estado Do Espírito Santo e Implementação de Interface No Geobases Para Uso de Dados Em SIG. Geografares 2016, 2, 32–65. [Google Scholar] [CrossRef]
- Saaty, T.L. A Scaling Method for Priorities in Hierarchical Structures. J. Math. Psychol. 1977, 15, 234–281. [Google Scholar] [CrossRef]
- Dos Santos, A.R.; Eugenio, F.C.; de Oliveria Louzada, F.L.R. ArcGIS 9.3 Total: Aplicação Para Dados Espaciais; Dados Internacionais de Catalogação-na-Publicação: Vitória, Brazil, 2010; ISBN 9788561890070. [Google Scholar]
- Da Silva, L.M.L.; Barbosa Filho, W.P.; Ferreira, W.R.; Kokshene, I.; Parreiras, R.O.; Ekel, P.Y. Alternativas Locacionais Para a Geração Renovável Em Minas Gerais: Uma Discussão Baseada Na Abordagem Multicritério Espacial. Rev. Bras. Energ. Sol. 2016, VIII, 100–108. [Google Scholar]
- Lewis, S.M.; Gross, S.; Visel, A.; Kelly, M.; Morrow, W. Fuzzy GIS-Based Multi-Criteria Evaluation for US Agave Production as a Bioenergy Feedstock. GCB Bioenergy 2015, 7, 84–99. [Google Scholar] [CrossRef] [Green Version]
- Tominaga, L.K.; Santoro, J.; Amaral, R. (Eds.) Desastres Naturais: Conhecer Para Prevenir, 1st ed.; Instituto Geológico: São Paulo, Brazil, 2009; ISBN 978858723509-1. [Google Scholar]
- Elmer, F.; Hoymann, J.; Düthmann, D.; Vorogushyn, S.; Kreibich, H. Drivers of Flood Risk Change in Residential Areas. Nat. Hazards Earth Syst. Sci. 2012, 12, 1641–1657. [Google Scholar] [CrossRef] [Green Version]
- Wang, Z.; Lai, C.; Chen, X.; Yang, B.; Zhao, S.; Bai, X. Flood Hazard Risk Assessment Model Based on Random Forest. J. Hydrol. 2015, 527, 1130–1141. [Google Scholar] [CrossRef]
- Gupta, K. Challenges in Developing Urban Flood Resilience in India. Philos. Trans. R. Soc. A Math. Phys. Eng. Sci. 2020, 378, 1–9. [Google Scholar] [CrossRef] [PubMed]
- Wang, Y.; Li, C.; Liu, M.; Cui, Q.; Wang, H.; LV, J.; Li, B.; Xiong, Z.; Hu, Y. Spatial Characteristics and Driving Factors of Urban Flooding in Chinese Megacities. J. Hydrol. 2022, 613, 128464. [Google Scholar] [CrossRef]
- Embrapa. Sistema Brasileiro de Classificação de Solos, 5th ed.; dos Santos, H.G., Ed.; Embrapa: Brasília, Brazil, 2018; ISBN 978-85-7035-198-2. [Google Scholar]
- Chang, L.-C.; Liou, J.-Y.; Chang, F.-J. Spatial-Temporal Flood Inundation Nowcasts by Fusing Machine Learning Methods and Principal Component Analysis. J. Hydrol. 2022, 612, 16. [Google Scholar] [CrossRef]
- Empresa Brasileira de Pesquisa Agropecuäria. Sumula da X Reunião Técnica de Levantamento de Solos; Serviço Nacional de Levantamento e Conservaçâo de Solos: Brasília, Brazil, 1979; Volume 10, p. 83. [Google Scholar]


Publisher’s Note: MDPI stays neutral with regard to jurisdictional claims in published maps and institutional affiliations. |
© 2022 by the authors. Licensee MDPI, Basel, Switzerland. This article is an open access article distributed under the terms and conditions of the Creative Commons Attribution (CC BY) license (https://creativecommons.org/licenses/by/4.0/).
Share and Cite
Carvalho, R.d.C.F.; Moreira, T.R.; Souza, K.B.d.; Costa, G.A.; Zanetti, S.S.; Barbosa, K.V.; Filho, C.B.C.; Miranda, M.R.; Guerra Filho, P.A.; Santos, A.R.d.; et al. GIS-Based Approach Applied to Study of Seasonal Rainfall Influence over Flood Vulnerability. Water 2022, 14, 3731. https://doi.org/10.3390/w14223731
Carvalho RdCF, Moreira TR, Souza KBd, Costa GA, Zanetti SS, Barbosa KV, Filho CBC, Miranda MR, Guerra Filho PA, Santos ARd, et al. GIS-Based Approach Applied to Study of Seasonal Rainfall Influence over Flood Vulnerability. Water. 2022; 14(22):3731. https://doi.org/10.3390/w14223731
Chicago/Turabian StyleCarvalho, Rita de Cássia Freire, Taís Rizzo Moreira, Kaíse Barbosa de Souza, Gizely Azevedo Costa, Sidney Sara Zanetti, Kargean Vianna Barbosa, Cláudio Barberini Camargo Filho, Maiara Rodrigues Miranda, Plinio Antonio Guerra Filho, Aline Ramalho dos Santos, and et al. 2022. "GIS-Based Approach Applied to Study of Seasonal Rainfall Influence over Flood Vulnerability" Water 14, no. 22: 3731. https://doi.org/10.3390/w14223731