
Topological Analysis and Application of Urban Drainage Network
by
 ,
,
Hancheng Ren
1,2,3,
Shu Liu
1,2,3,
Min Li
1,2,3,*,
Hongping Zhang
1,2,3,
Huiying Wang
1,2,3,
Xiaoli Hao
1,2,3 and
Jie Cui
4 1
State Key Laboratory of Simulation and Regulation of Water Cycle in River Basin, China Institute of Water Resources and Hydropower Research, Beijing 100038, China
2
China Institute of Water Resources and Hydropower Research, Beijing 100038, China
3
Research Center on Flood and Drought Disaster Reduction of the Ministry of Water Resources, Beijing 100038, China
4
China Academy of Urban Planning and Design Beijing Planning & Design Consultants Company Limited, Beijing 100044, China
*
Author to whom correspondence should be addressed.
Water 2022, 14(22), 3732; https://doi.org/10.3390/w14223732
Submission received: 30 September 2022
/
Revised: 5 November 2022
/
Accepted: 14 November 2022
/
Published: 17 November 2022
(This article belongs to the Special Issue Assessment of Urban Pluvial Flood Risk and Utilization of Rainwater & Flood Resources)
Abstract
:Due to the existence of drainage networks, urban areas have formed their own hydrological mechanism. The pretreatment of complex and elaborate drainage network data has become a challenging step in building an urban hydrological model. This study proposes a network-combing method based on the potential outfall mechanism for an urban drainage system, analyzes the topological structure of the underground network, and generates a subcatchment based on the potential outfall (SBPO). Two hydrological methods are constructed for a typical region in Kunming, Yunnan Province, China. The results show that: The network-combing method of potential outfall mechanisms can well complete the sorting work of a drainage network system and can clarify the relative independent relationship. The SBPO method basically agrees with the SWMM constructed with a high-resolution network in terms of runoff volume, the peak value and the duration of the outflow process at the outfall. However, the subcatchment by the potential outfall mechanism can help to understand the service partition, and the calculation cost is greatly reduced. The method emphasizes the importance of the influence of a drainage system on water confluence, which can help to better understand the process of runoff in urban areas.
1. Introduction
Under climate change caused by global warming and human activities, extreme weather events, especially extreme rainfall, occur more frequently, and this change is still on the rise [1,2]. In the central area of the city, the transformation of the underlying surface affects the exchange of heat and water between the surface and the atmosphere [3,4]. The heat island effect brought by human social production activities will also produce the rain island effect, which generally brings greater rainfall than the normal situation in the surrounding areas [5,6,7,8]. At the same time, the hardened surface increases the ratio of rainfall to runoff. If there is no appropriate drainage system, the citizens will suffer from huge economic losses and security risks [9,10]. In addition, the combined sewer system in the built-up area often produces sewage overflow due to the rainfall, but there is a certain contradiction between urban flood prevention and overflow pollution. There is an eager need to find a balance between urban water safety and water quality.
At present, the specific analysis of an urban hydrological process is mainly realized by numerical simulation [11]. Urban hydrological models are mainly classified into distributed hydrological model, a hydrological and hydrodynamic coupled model, a one- and two-dimensional coupled model, and a fully distributed model. These models focus on different application scenarios, but there is an inherent development context. Distributed hydrological models, such as SWAT and SHE, use the digital elevation model (DEM) to divide the watershed into different grids, calculate runoff generation within the grids, and confluence interactions between the grids [12,13,14,15]. Hydrological and hydrodynamic coupled models, such as SWMM, developed by the EPA (Environmental Protection Agency) in the United States, divide the study area into different subcatchments to calculate the runoff generation and then add the runoff into the hydraulics model [16,17,18]. As for one- and two-dimensional coupled model, such as Infoworks ICM of HR Wallingford, UK, and MIKE URBAN of the Danish Institute of Hydraulics, the subcatchment’s runoff generation results are applied to its outlet node. When overflow occurs at this drainage model, the overflow node is used as a point source to apply flow in the surface model for slope overflow calculation to simulate surface inundation [19,20]. DHM Urban, a fully distributed model developed by The China Institute of Water Resources and Hydropower Research, divides the land surface into micro-scale grids, and each grid serves as a separate runoff generating unit. The runoff generation results are calculated by confluence between slope grids. When the runoff evolves to the grid with inlet nodes according to the physical mechanism, it enters the drainage system. However, in the actual modeling process, it is extremely difficult to collect household management data with random construction and chaotic management of residential areas. Therefore, DHM Urban also needs to make a compromise with city blocks of missing sewer data and delimit subcatchments applying conceptual connection [21]. To sum up, urban hydrological models have been developing in the direction of being more elaborate and closer to physical mechanisms. However, because of a lack of complete underground drainage network data, dividing drainage area into subcatchment is a necessary but challenging step in most urban hydrological models.
A drainage region, also known as a watershed, refers to an area where the exchange of rainwater through the surface or drainage system is relatively independent. The conveying path of surface runoff is greatly affected by buildings, hardened roads and drainage networks in the process of urban construction. Therefore, compared with natural hydrological basins, the spatial heterogeneity and underground connectivity of urban drainage systems are more complex and variable; thus, it is necessary to draw subcatchments in the system [22]. As a homogeneous unit, there usually is rainwater exchange between neighboring subcatchments. In other words, the drainage region is a complete system model research object, and subcatchment is the internal small partition within the system. Generally, a subcatchment division method includes a spatial information method, hydrologic analysis and Thiessen polygon. Wang Xiaojie et al. [23] explained that the stormwater model based on the spatial information partitioning method outputs better results. Duke et al. [24] proposed the RIDEM model integrating REA and CEA algorithm, which integrates the road, ditch and other ground feature information into DEM data, and the subcatchment is generated by using Burn IN and D8 algorithms. Aimé Kayembe et al. [25] use a semi-automated approach that incorporates conventional drainage networks into overland flow paths and defines the maximal runoff contributing area. Qiqi Yang et al. [26] studied the impact of using the stroke scaling method to generalize a storm sewer network on a flood simulation that was analyzed in terms of the total inflow of the outfalls and flood results.
However, most of the existing studies simplify and replace the drainage network data to some extent, and do not analyze the water transporting in the drainage network from topological relation of the network itself. When providing solutions to urban water problems, they have to return to the specific pipe segments and nodes of the drainage network. Miller et al. discovered the comparison of observed storm hydrographs and showed that the degree of area serviced by storm drainage was a stronger determinant of storm runoff response than either the impervious area or development type [27]. Developed urban complex drainage network distribution greatly affects the city zone of runoff path, and a combined sewer of a built-up town makes storm sewers and sewage pipes often have a certain water exchange on a rainy day. In urban areas, the roads are smooth and the structures are complex; thus, the subcatchment based on DEM cannot show the drainage system connectivity. Furthermore, it lacks practical significance to regard the subcatchment as the basic unit of service model calculation. Therefore, the detailed consideration of the underground network information on the urban runoff process is essential for drainage region planning and adjustment.
As is mentioned above, defining an appropriate and practical subcatchment is the prerequisite of hydrological models, and our research gives an improving solution in the following aspects:
- A data sorting method for urban drainage networks is proposed, emphasizing the flow direction in the drainage network system, and the basic principle that is needed to follow in topology building of urban drainage networks is discussed.
- According to the connection relationship of the network topology relationship, we trace the potential drainage outfall for each drainage node and use the control area of the node with the same potential drainage information as a subcatchment.
- The allocation ratio of the rainwater between subcatchments is calibrated dynamically with a hydrodynamic model and then applied to further hydrological analysis.
2. Methodology
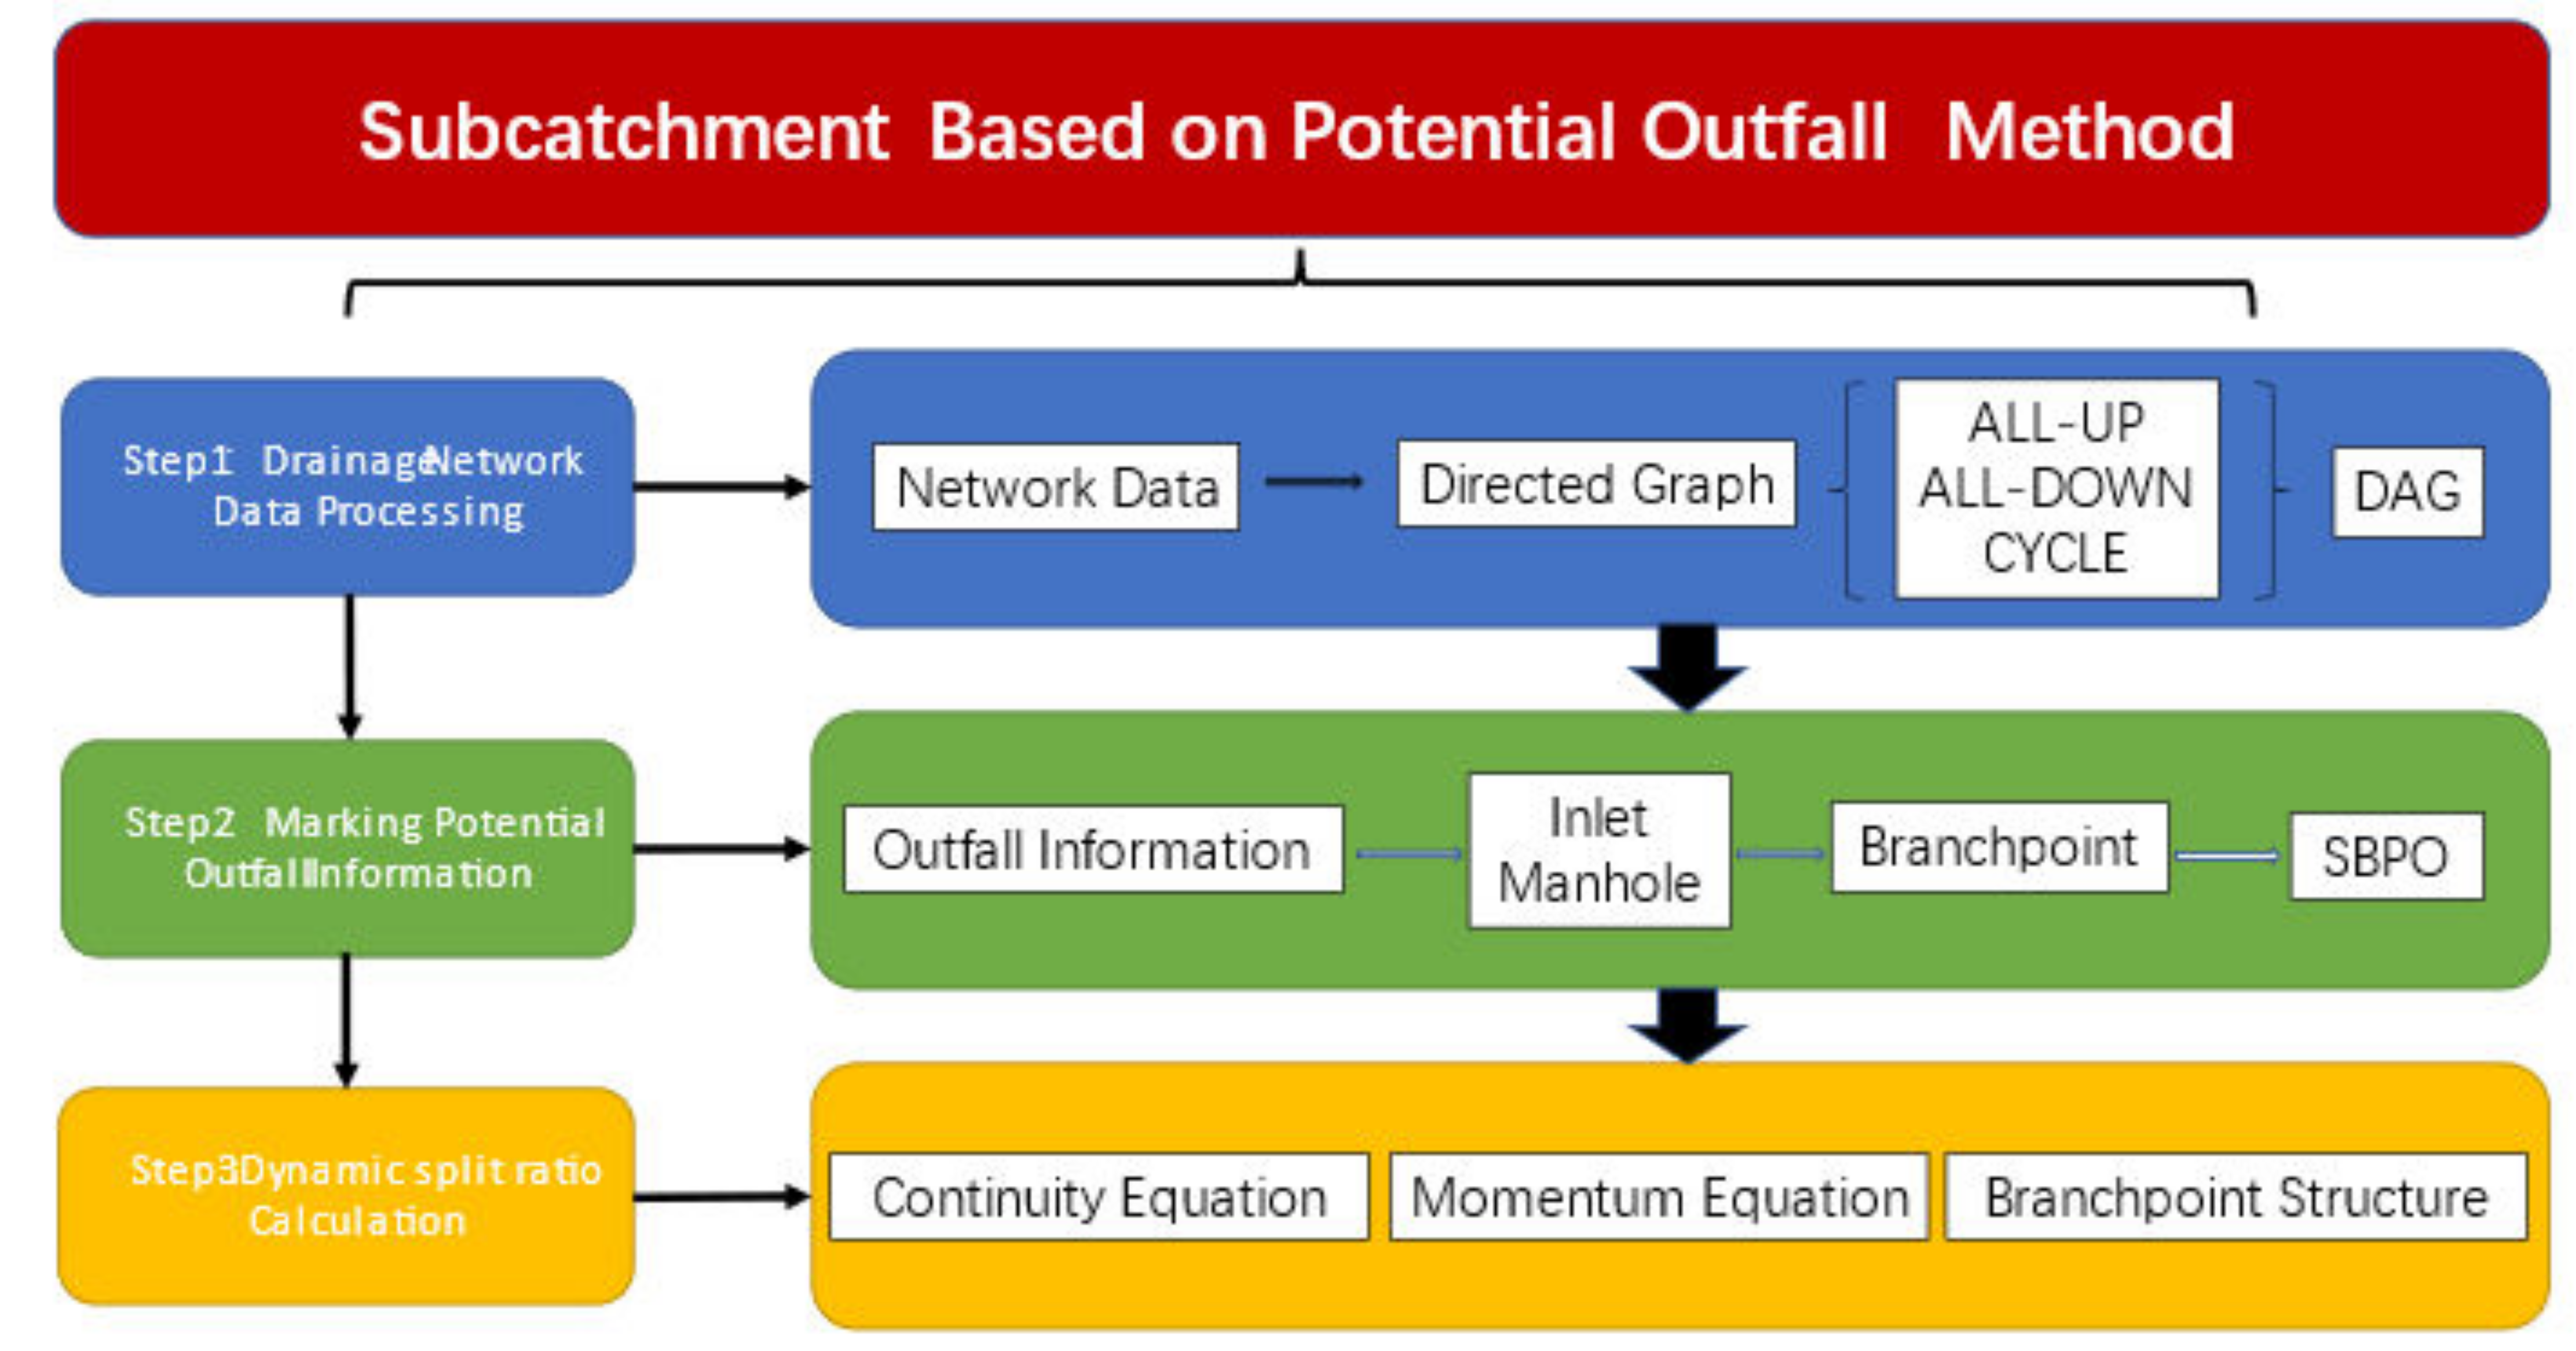
The overall framework of the study is shown in Figure 1, which is divided into three steps: drainage network data processing, marking potential outfall information, and dynamic split ratio calculation. These steps are used to build a hydrological model by the SBPO method.
2.1. Drainage Network Data Combing Method Based on Potential Outfall
2.1.1. Correction of Flow Direction
The urban underground drainage network is generally composed of nodes and pipelines. The node is the hub of the pipeline, and the pipeline is the vein connecting the node. The inlet of the pipeline is defined as upstream, and the outlet is defined as downstream. A pipeline can be generalized as a directed line segment from the inlet to outlet. Thus, urban underground drainage network information can be generalized to a directed point-line topology diagram [28].
A directed graph or digraph is a graph in which edges have orientations. A directed graph is an ordered pair comprising:
- , a set of vertices;
- , a set of edges, which are ordered pairs of vertices.
Many scholars have made efforts to explore the intrinsic properties and development trend of this topology. Elisabeth Krueger et al. [29], using a dual-mapping technique analysis water distribution network and sanitary sewer network, found that a double Pareto (power-law) model approximates the node-degree distributions. Yazdani and Jeffrey [30] analyzed the geometry of water distribution networks of four small cities using a complex network approach in primal mapping. They found these networks to be sparse with an absence of degree-based hubs, with node degrees ranging from 2 to 4 (average = 2). The node degree reflects the number of nodes associated with a node. Therefore, it can be inferred that the underground drainage network under primal mapping also has a sparse network structure, which makes the statistical analysis results of complex networks relatively simple. However, the low node degree network is convenient to summarize the local structure of general significance as the point of penetration for sorting out the network topology data. When these structures appear, we have doubts about the direction initially set at this pipeline, because the actual collected network data will inevitably make mistakes. The following three local structures are worthy of attention, as shown in Figure 2.
- We name structure (a) as an “All-up” node, which is defined as a point upstream of several pipeline but not downstream of any pipeline. For such points, we should warn against it and only retain it after confirming that it is actually correct.
- We name structure (b) as “ALL-down” node. The definition of such a node is that the point is downstream of several pipelines, but not upstream of any pipeline. When such a node appears, an error should be prompted, because such a node will not appear in reality, and the inflow of the node needs to have a reasonable place to go.
- We name structure (c) “Cycle”, which is the same as the definition of cycle in graph theory. Starting from a node in this structure, it can return to itself according to the direction of the pipelines. Such structures make no sense when only gravity is driving them.
Pipeline direction is not absolutely fixed; under special circumstances, the downstream section of jacking reverse flow may occur. Thus, previously defined network data of water inlet and outlet (upstream and downstream) are used for the network, model which is used to record the topological relations and data management, and the direction only affects the sign of the results of the hydrodynamic model.
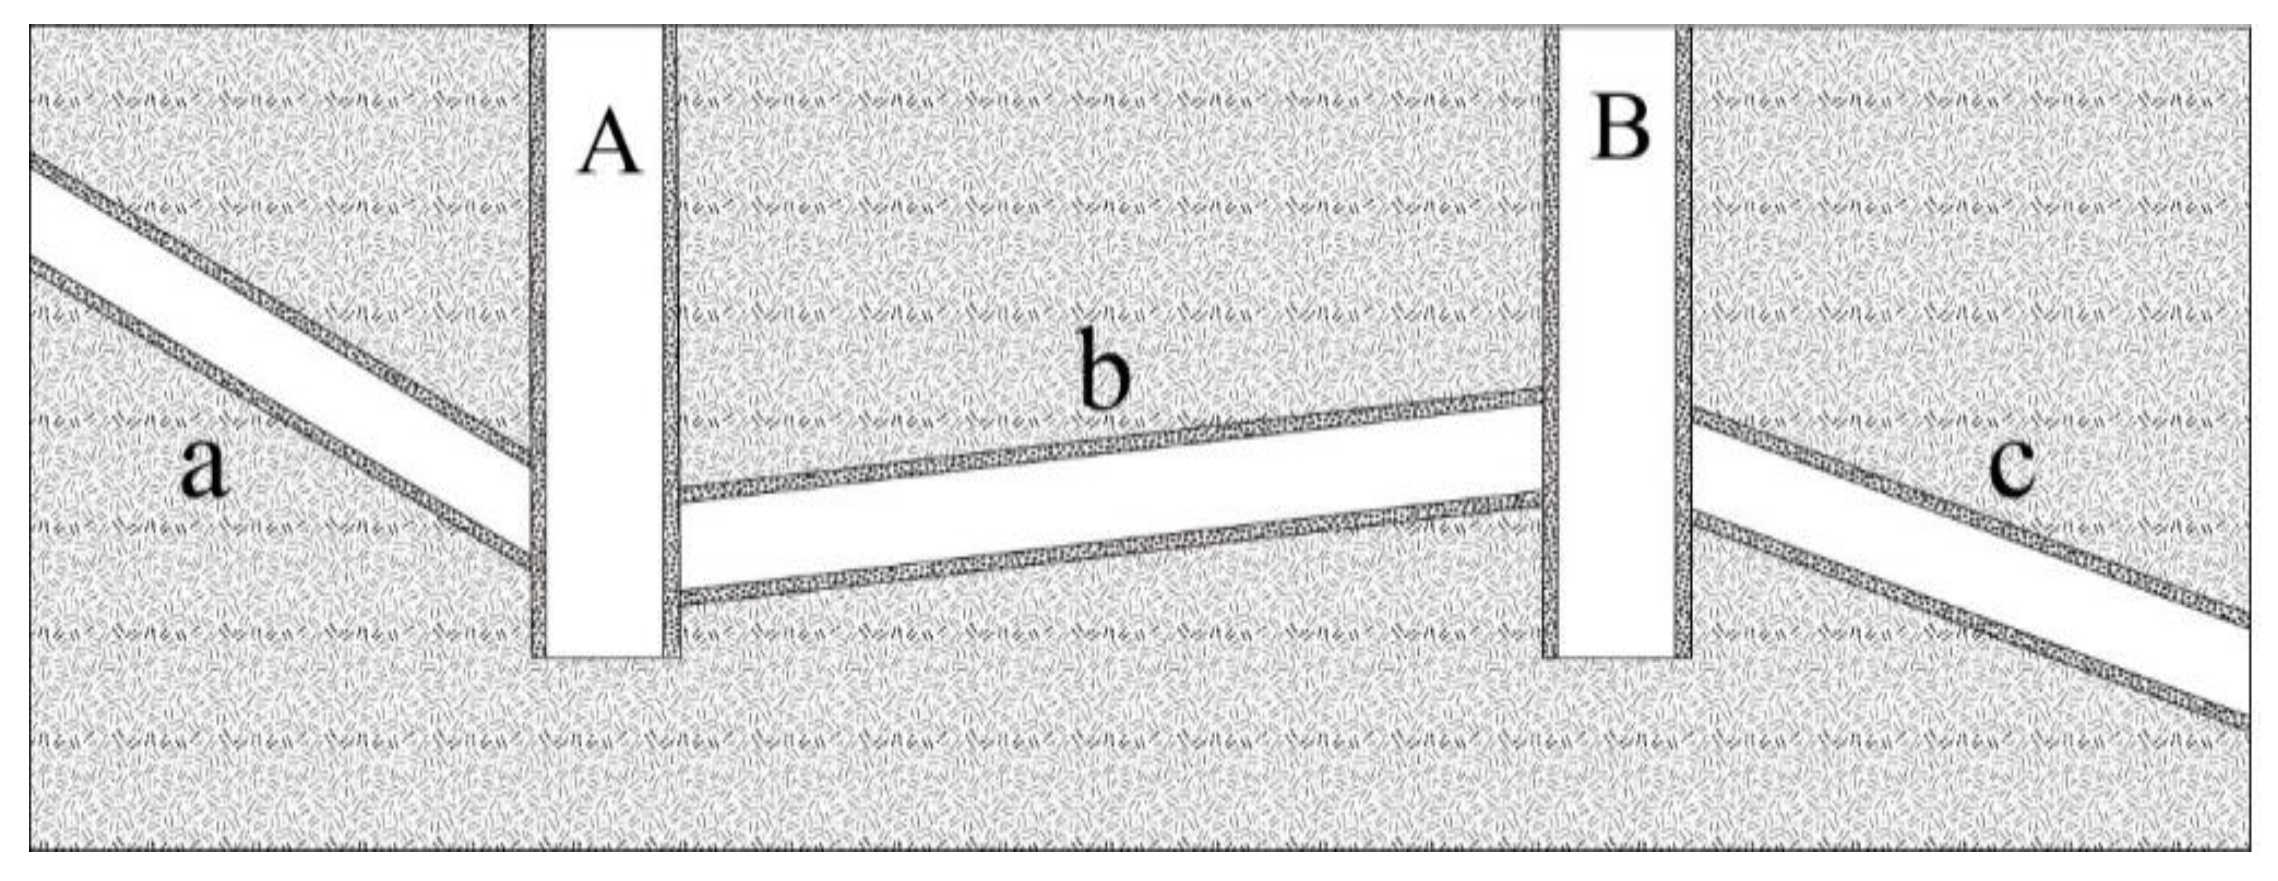
However, the drainage network is a gravity-driven system with a certain slope, and its overall positive slope direction reflects the functional properties of the drainage network. Therefore, we define the general flow direction as the direction of the pipeline. The general direction of this pipeline is not necessarily from the higher end point of the pipeline to the lower end point (the reason may be geological subsidence or construction error), but is the general performance of this pipeline in the overall drainage system. As shown in Figure 3, although the direction of node “A” of pipeline “b” is lower than that of point “B”, the direction of pipe B should be from A to B for the whole drainage.
Therefore, when the topological structure in Figure 3 is encountered, the flow direction analysis should be conducted according to the relative height difference of the pipe section in the whole pipe section. The above partial problems will change the topological form of its adjacent nodes due to correction; thus, it would propagate continuously along a certain direction until it meets a multi-node degree node or endpoint to release.
After the above series of direction correction work, the ideal drainage network topology should be satisfied: the rain grate or residential household drainage outlet as the starting point can smoothly go to the river and sewage treatment plant according to the pipeline direction. Its topological relationship should constitute a DAG (direct acyclic graph). A directed acyclic graph is a directed graph with no directed cycles. That is, it consists of vertices and edges (also called arcs), with each edge directed from one vertex to another, such that following those directions will never form a closed loop. A directed graph is a DAG if and only if it can be topologically ordered by arranging the vertices as a linear ordering that is consistent with all edge directions. The canonical application of topological sorting is in scheduling a sequence of jobs or tasks based on their dependencies. The correctness of directed topology is the basis of topology analysis.
2.1.2. Topology Analysis
The structure of the urban underground drainage network is intricate; thus, it is often graded or classified in order to carry out effective sorting. Strahler classification method in river classification is often used for network classification [31,32]. In this method, the rivers originating from the source are defined as grade 1 rivers. The level of the river formed by the intersection of two rivers of the same level is increased by 1 level. The river level formed by two rivers of different grades is the higher of the two. Due to the principle of minimum entropy generation and erosion, natural rivers in nature will form a two-bifurcation tree structure, and finally, the tributaries will converge to the main stream, with only one outlet [33]. We think applying this method to the urban drainage network system has some limitations, for two reasons: (1) different from natural rivers, urban drainage network may have a fixed size, running through the beginning and end of the main pipeline, the grade of the pipelines should be consistent, but through Strahler’ method, the pipelines in the downstream section are higher than that in the upstream section. (2) Urban drainage network is a man-made system. The bifurcation of a drainage network causes the system to have multiple exits. In the same system, there may be some “main pipes” with different dimensions and specifications but consistent grades, which will affect the primary and secondary analysis. Another approach is to classify the drainage network directly according to its size, distinguishing the trunk pipe by its cross-section size. This method is simple and clear, and can show the structural and functional attributes of the pipeline. However, it is easy to adopt different standards in pipeline construction over time [34], and the standards of the new pipeline are generally greater than those of the old drainage network; thus, it is easy to confuse the classification results when considered together.
In order to comprehensively consider the confluence relationship and internal connection between the drainage networks, we innovatively use the upward tracing method of the drain to mark information for the drainage network nodes. The specific steps are as follows:
- Analyze the in-degree and out-degree of each node.
- The node in-degree = 0 (no upstream), defined as type = 0, which is usually rain grate or household pipe entrance;
- The node in-degree > 0 and out degree > 0 (not the starting point or end point of the drainage network), defined as type = 1, which is generally a manhole;
- The node out-degree = 0 (without downstream), defined as type = 2, which is generally an outlet mouth or an inlet of a sewage plant.
- Mark potential outfall information.
- If a point type is 2, then its outfall information is marked by its own number;
- If a point type is not 2, the downstream of the point is retrieved according to the topological relationship, and the drainage outfall information of the downstream node is returned for recursion;
- Classification—Nodes with the same outfall information are defined as homogeneous nodes.
The method fully considers the drainage network system of one-way connectivity, tracing back each node to find all the possible potential drain. Based on potential outfall information, we can effectively analyze the drainage system. Especially, in urban areas where the pipe stream flows lie, it can throw some light on the motion path of the urban area of water by analyzing the connecting relationship of drainage network through reversely tracking outfalls, which also lays a foundation for the accuracy and rationality of classifying subcatchment division.
2.2. Subcatchment Based on Network Connectivity
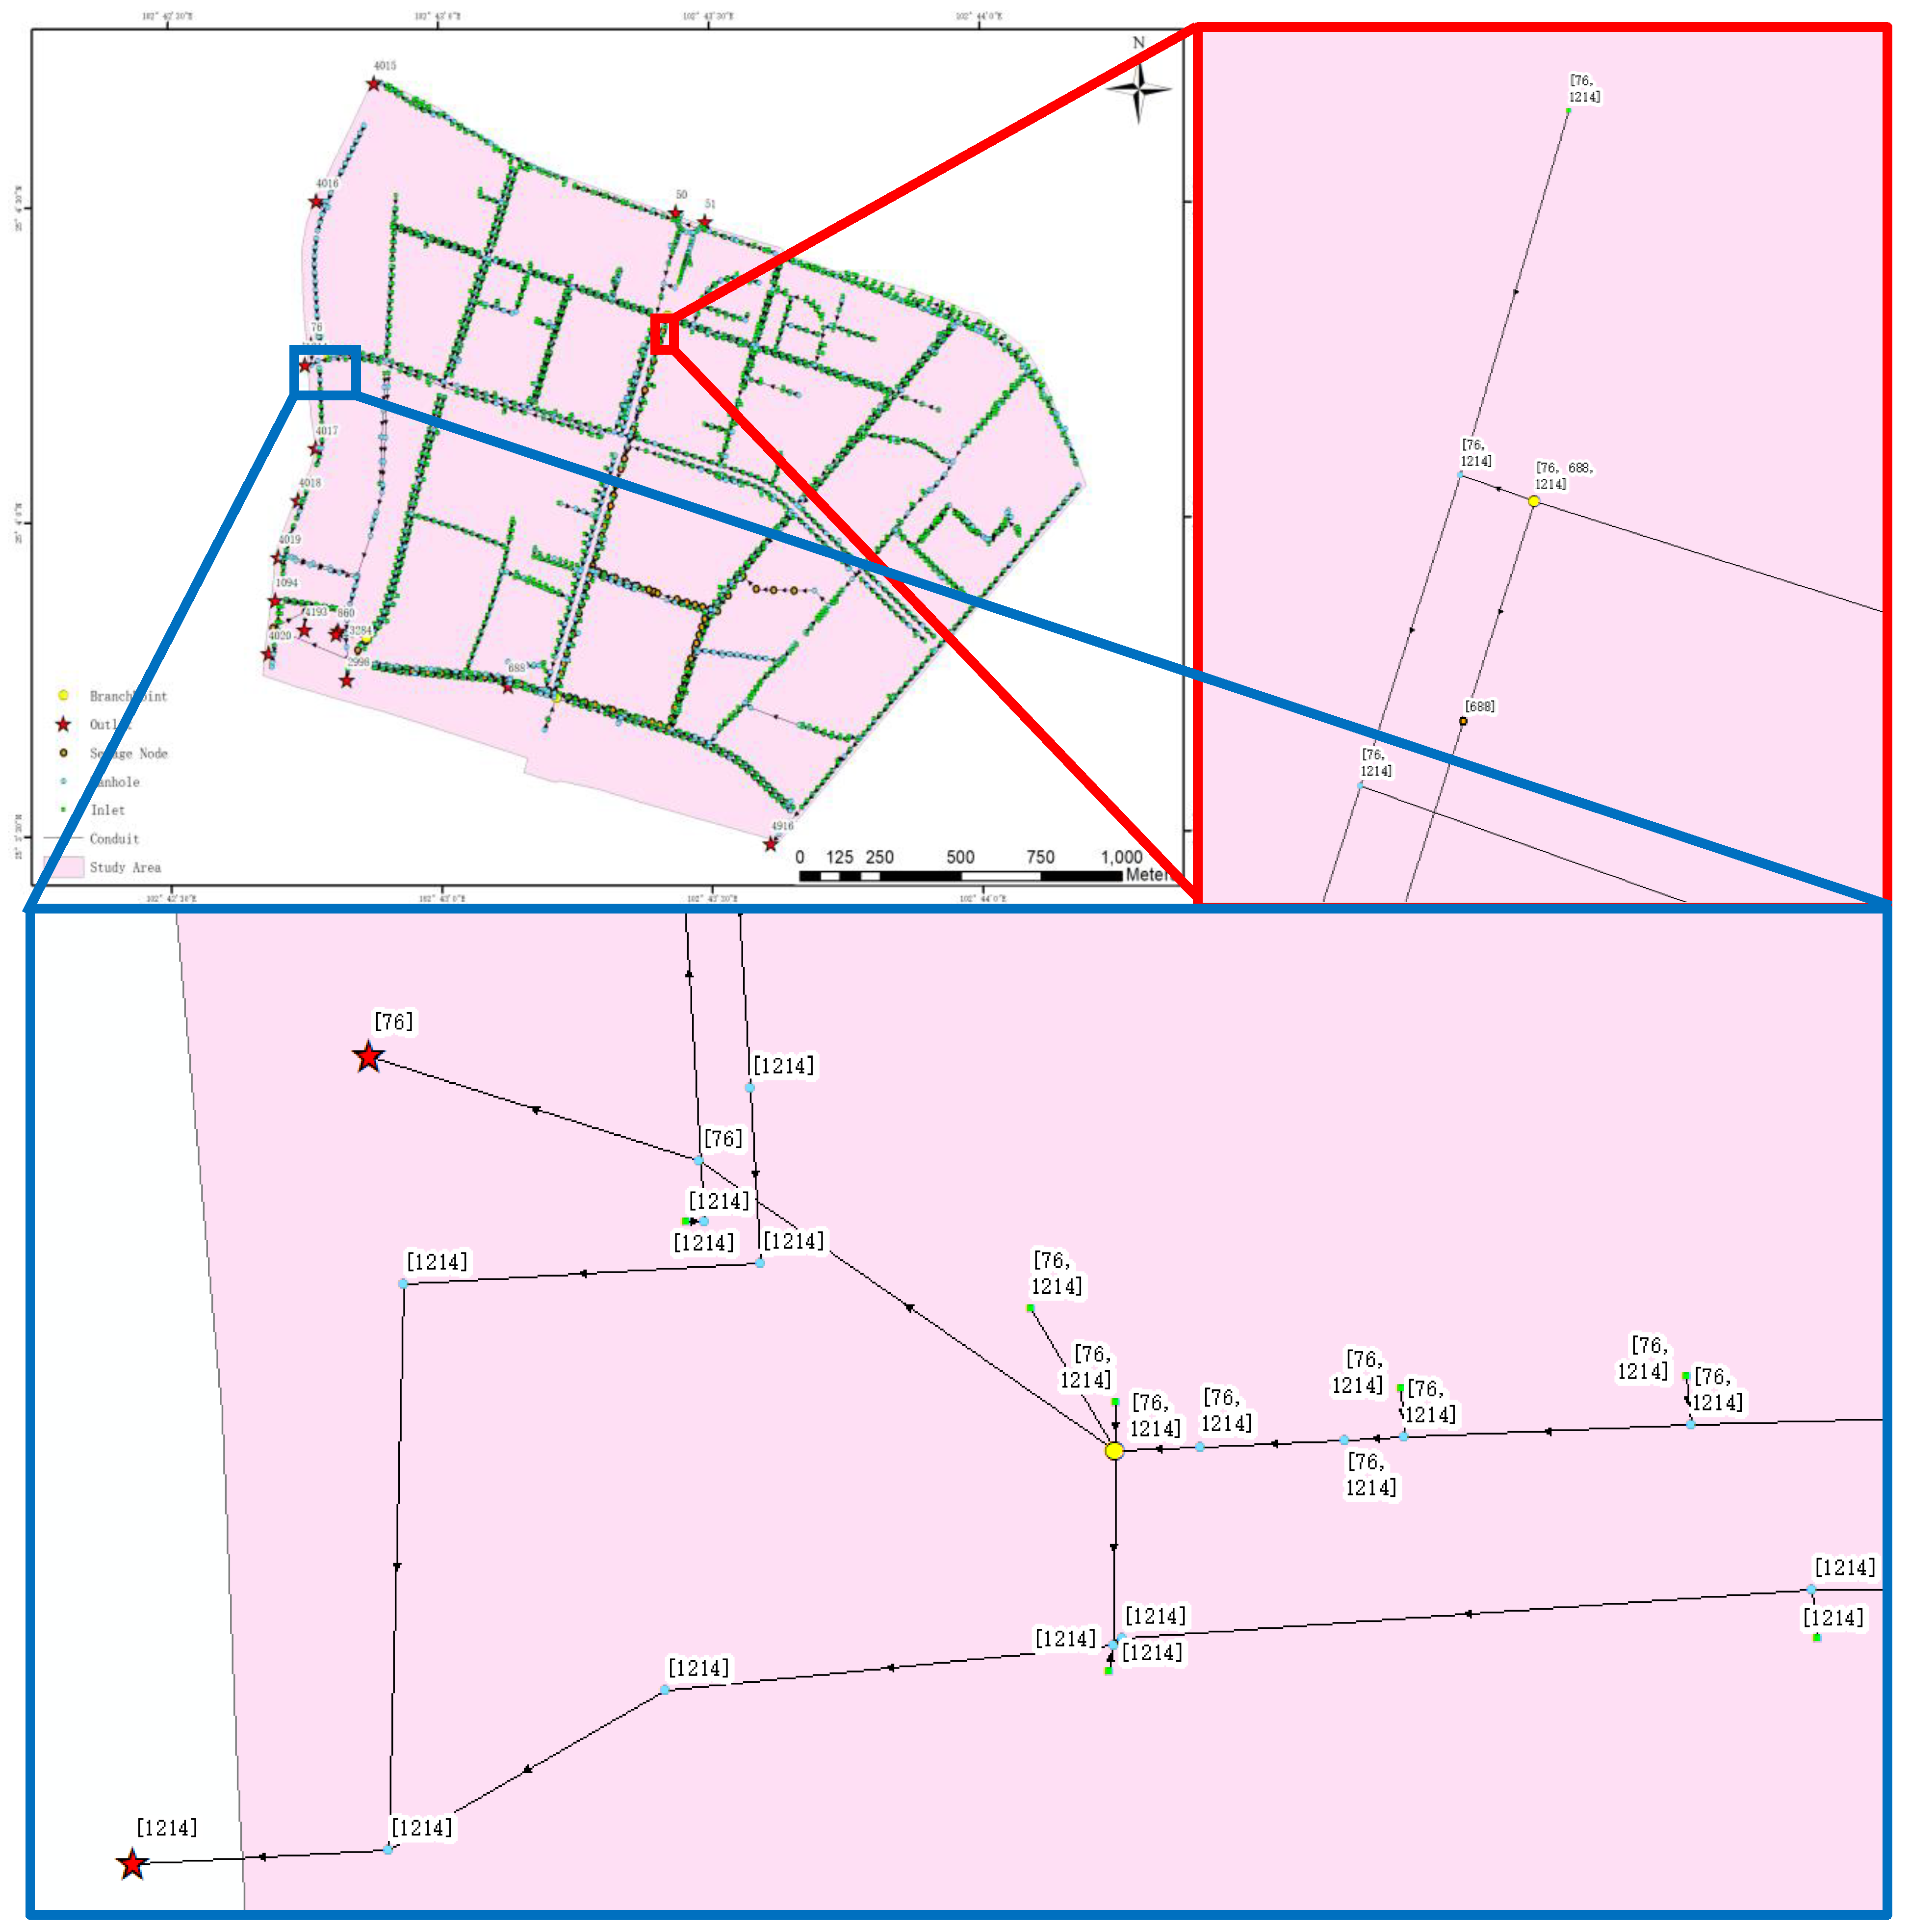
As the basic unit object of urban hydrological model research, the influence of subcatchment on the model cannot be ignored. A simple drainage network topology is created below to illustrate that Figure 4 is a schematic diagram of the upstream effect of the drainage outfall of this structure. By classifying each node according to its potential drainage outfall, the control area of a certain drainage outfall combination can be obtained. Near the downstream, where the potential outfalls of the node are less, for the node with only a potential, the water within its control area shall definitely flow into the corresponding outfall. However, in the upstream of the drainage network system, the node potential outfall information is relatively complex, as the water within the controlled region of these nodes may outflow through more than one outfall. If we mark the same outfall information with the same color and combine them together, it can be found that the nodes making the upstream node potential drain information change are often the ones that have multiple downstream nodes. These kinds of nodes are the key for pipelines to generate overflow, which is differentiated from river systems, and we called these nodes branchpoint. It is easy to reason that if a node has more than one downstream node and these downstream nodes eventually converge to the same node, then the potential outfall information in the upstream of the node will not change. Therefore, we define branchpoint as follows:
Assume that node has neighboring downstream nodes, the set of potential outfalls information at each node is , , …, , if:
then node is branchpoint.
If a subcatchment only has one potential outfall, the amount of water in the region would eventually outflow through the outfall. However, if a subcatchment has two or more potential outfalls, the potential outfall information can only illustrate the possibility of where the water will flow to, but it cannot indicate how the runoff of the subcatchment will be allocated to the various outfalls. Since the pipeline water diversions all occur at the branchpoint, it is necessary to analyze these kinds of nodes in detail. By analyzing the drainage network in this way, we can know that the nodes with the same potential outfall information have the same service objective: discharge the water from the surface confluence of the node to the target outfall. On the contrary, it can be deduced that the points with no intersection of the potential outfall information are mutually independent, and there is no water exchange between these points, which also provides a basis for the drainage partition classification of the urban area.
2.3. Dynamic Split Ratio at Branchpoint of Bifurcation Tube
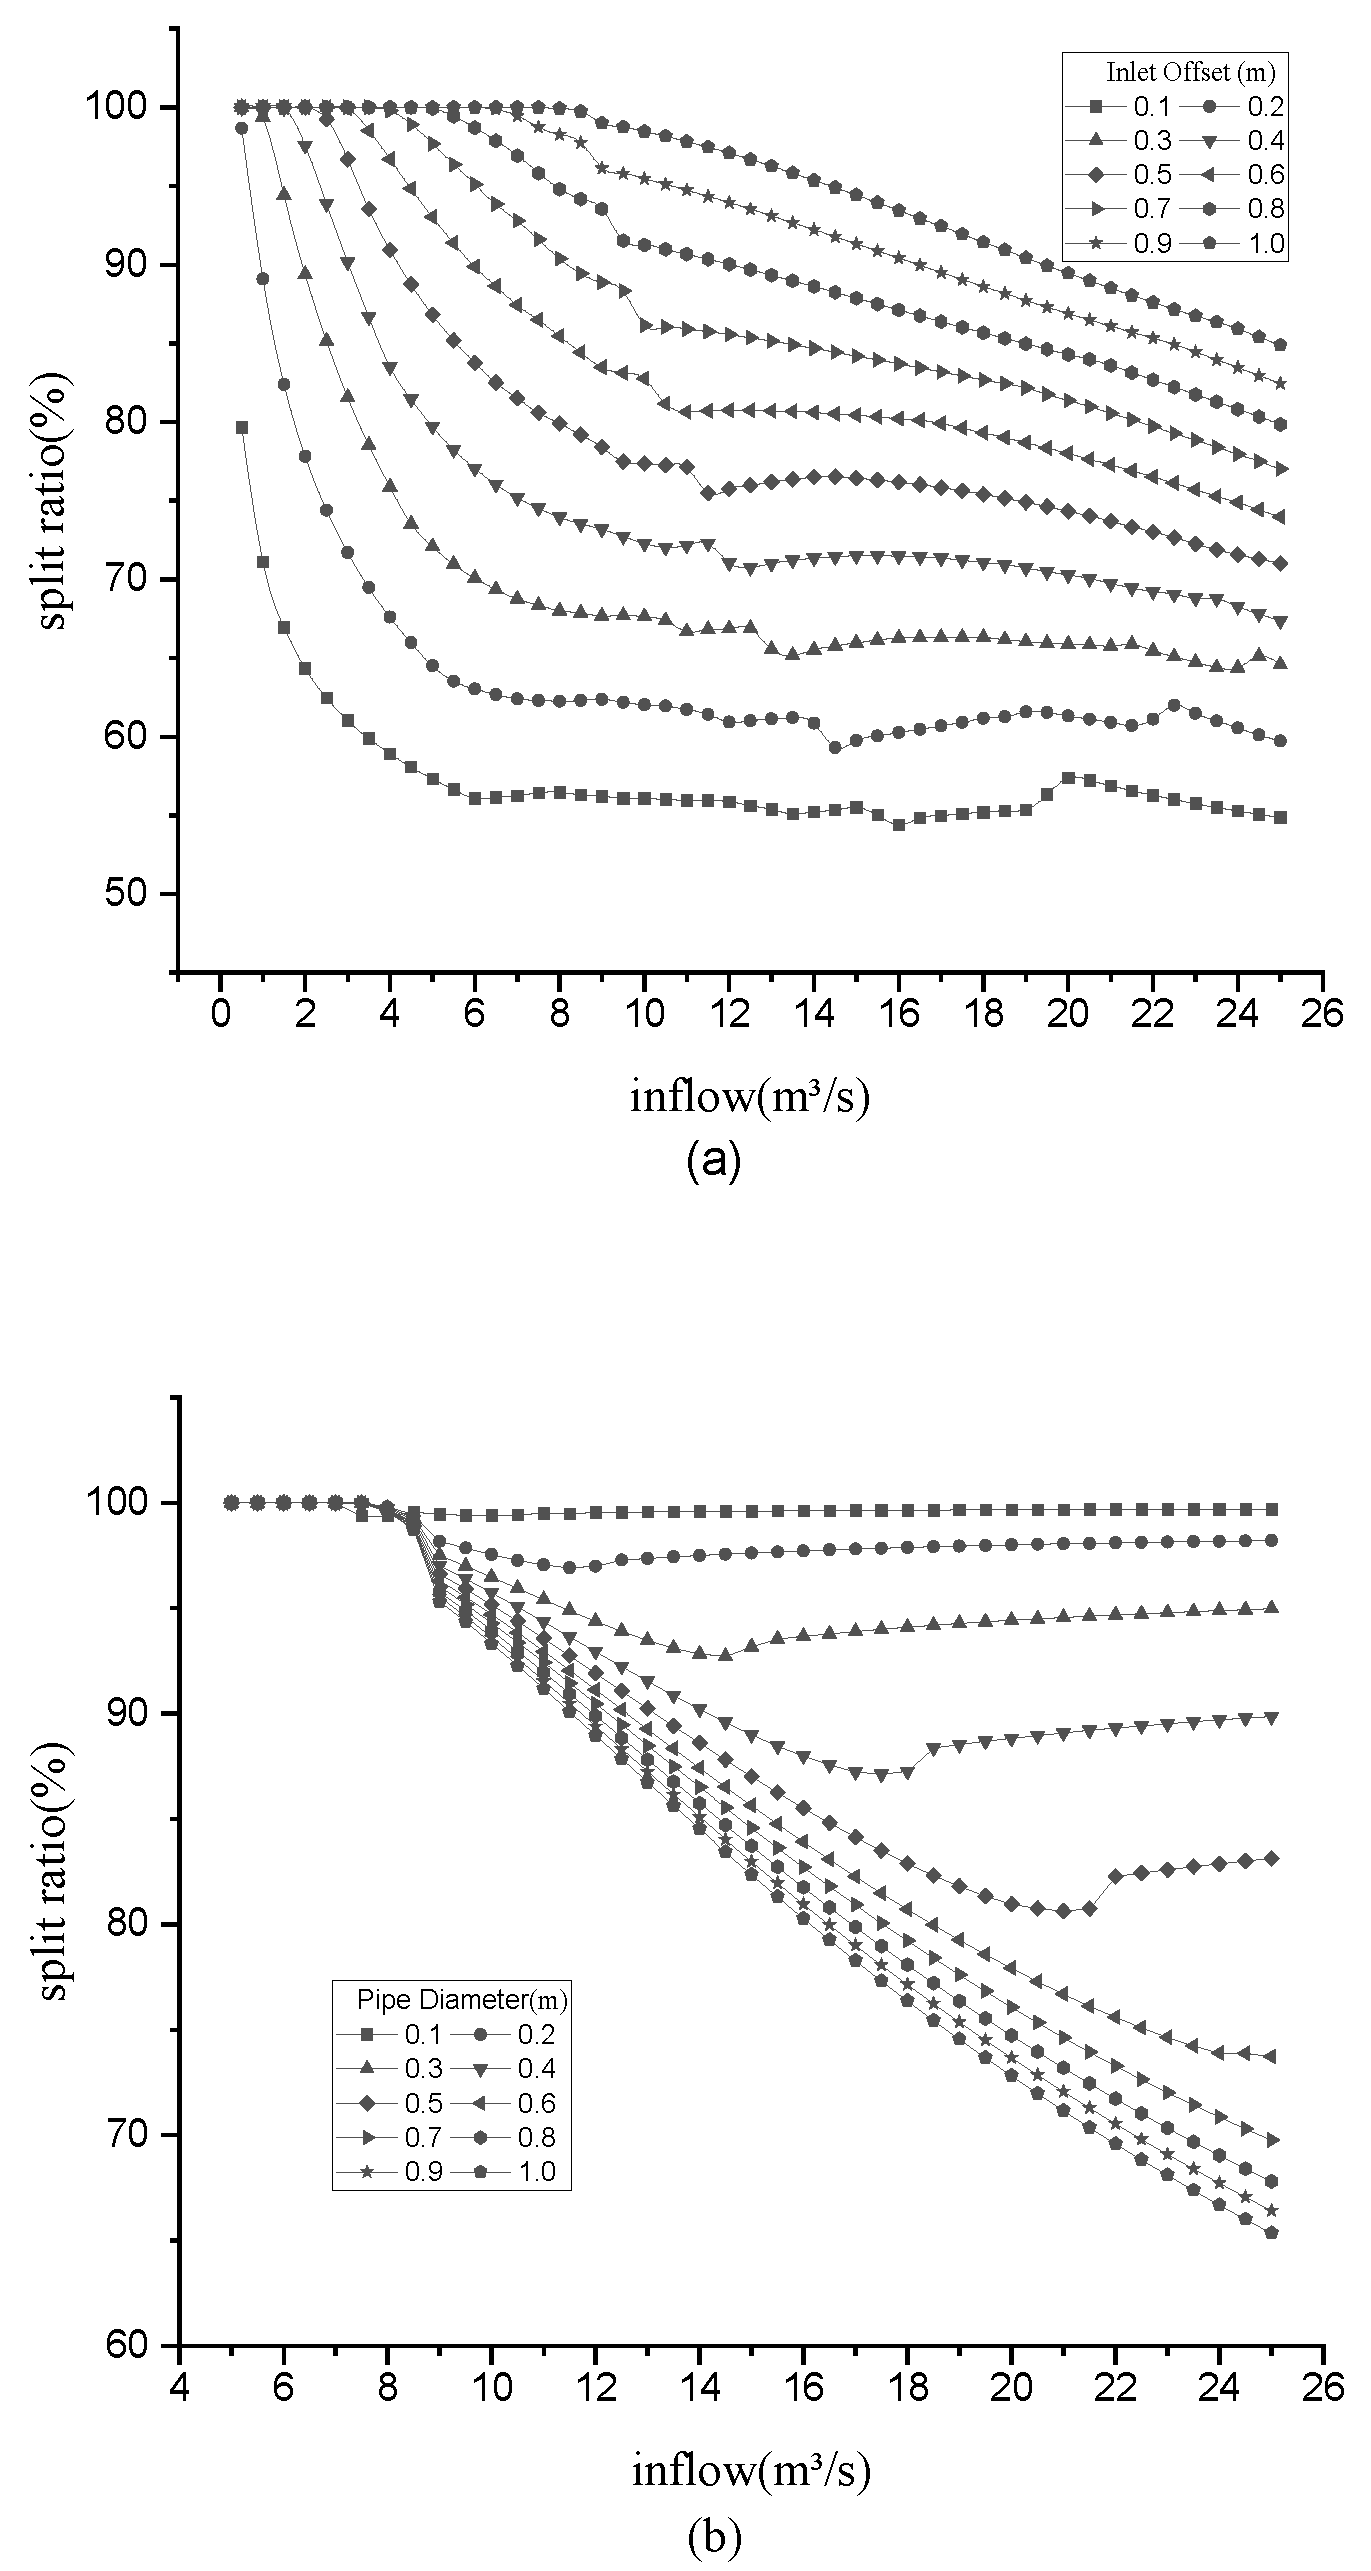
It is easy to understand that the runoff allocation at branchpoint changes dynamically with the runoff input under different scenarios; thus, for a subcatchment with multiple potential outfalls, the outflow from each outfall also changes dynamically. Therefore, the typical two-bifurcation structure is established here to analyze different upstream inflow scenarios. By setting different inflow rates in the upstream section and adjusting a single variable of a pipe at the branchpoint, a change in the split ratio is observed, such as the relative height difference of the inlet or the overflow capacity [35]. The flow through a pipe is governed with uniform equations as follows:
where
- = distance (ft);
- = time (sec);
- = flow cross-sectional area (ft2);
- = flow rate (cfs);
- = hydraulic head of water in the conduit () (ft);
- = conduit invert elevation (ft);
- = conduit water depth (ft);
- = friction slope (head loss per unit length);
- = acceleration of gravity (ft/sec2).
By applying a constant flow upstream of the inlet, the percentage of the total discharge in one of the two pipelines is calculated when the flow to the inlet is stable:
where
- = percentage of a pipe to the total discharge of a branch;
- = flow rate of the two pipes at the inlet.
From Figure 5, the split ratio of branchpoint changes non-linearly as the amount of inflow varies. The above case illustrates that we only need to gather the structure of the branchpoints of partial parameter to calculate any dynamic split ratio of branching points. The field inspection of the drainage network system is often complicated and heavy. According to the importance of branchpoints, the inspection of branchpoints can become an important breakthrough point of field inspection of the drainage system.
2.4. SBPO Modeling Method Details
Through the analysis in Section 2.1, Section 2.2 and Section 2.3, we can divide the subcatchment based on potential outfall, and make clear the dynamic water allocation process between them. Based on these, we can construct a parsimonious hydrological model using SBPO, which conceptualizes a subcatchment as a rectangular surface that has a uniform slope and a width that drains to a single outlet channel.
From the conservation of mass, the net change in depth d per unit of time is simply the difference between inflow and outflow rates over the subcatchment:
where:
- = reservoir water depth (ft);
- = rate of rainfall (ft/s);
- = surface evaporation rate (ft/s);
- = infiltration rate (ft/s);
- = runoff rate (ft/s).
However, when the subcatchment area is too large, the nonlinear reservoir model will lead to over-simulation of peak flows due to an excessively rapid catchment response to storm events [17]. The larger catchment, which merges smaller drainage-connect catchments, dilutes the buffering effect of the drainage system. In order to modify and calibrate the discharge process of the subcatchment based on potential outfalls, the surface runoff transferred to a buffer storage:
where:
- = cross sectional area (m2);
- = the water level (m);
- = runoff rate (m3/s);
- = discharge rate (m3/s).
The buffer storage discharge as the outfall flows from the subcatchment is the boundary condition to the branchpoint. Next, the pre-calculated split ratio is used to determine the allocation of discharge. In this approach, surface runoff is directly related to runoff counties of drainage outlet flows by omitting the drainage confluence within the subcatchment.
Figure 6 illustrates the process of constructing hydrological models using SBPO and its comparison with SWMM. SBPO focuses only on input and output information by understanding the drainage conveying process as a systematic behavior.
3. Study Area and Scenario Design
3.1. Study Area
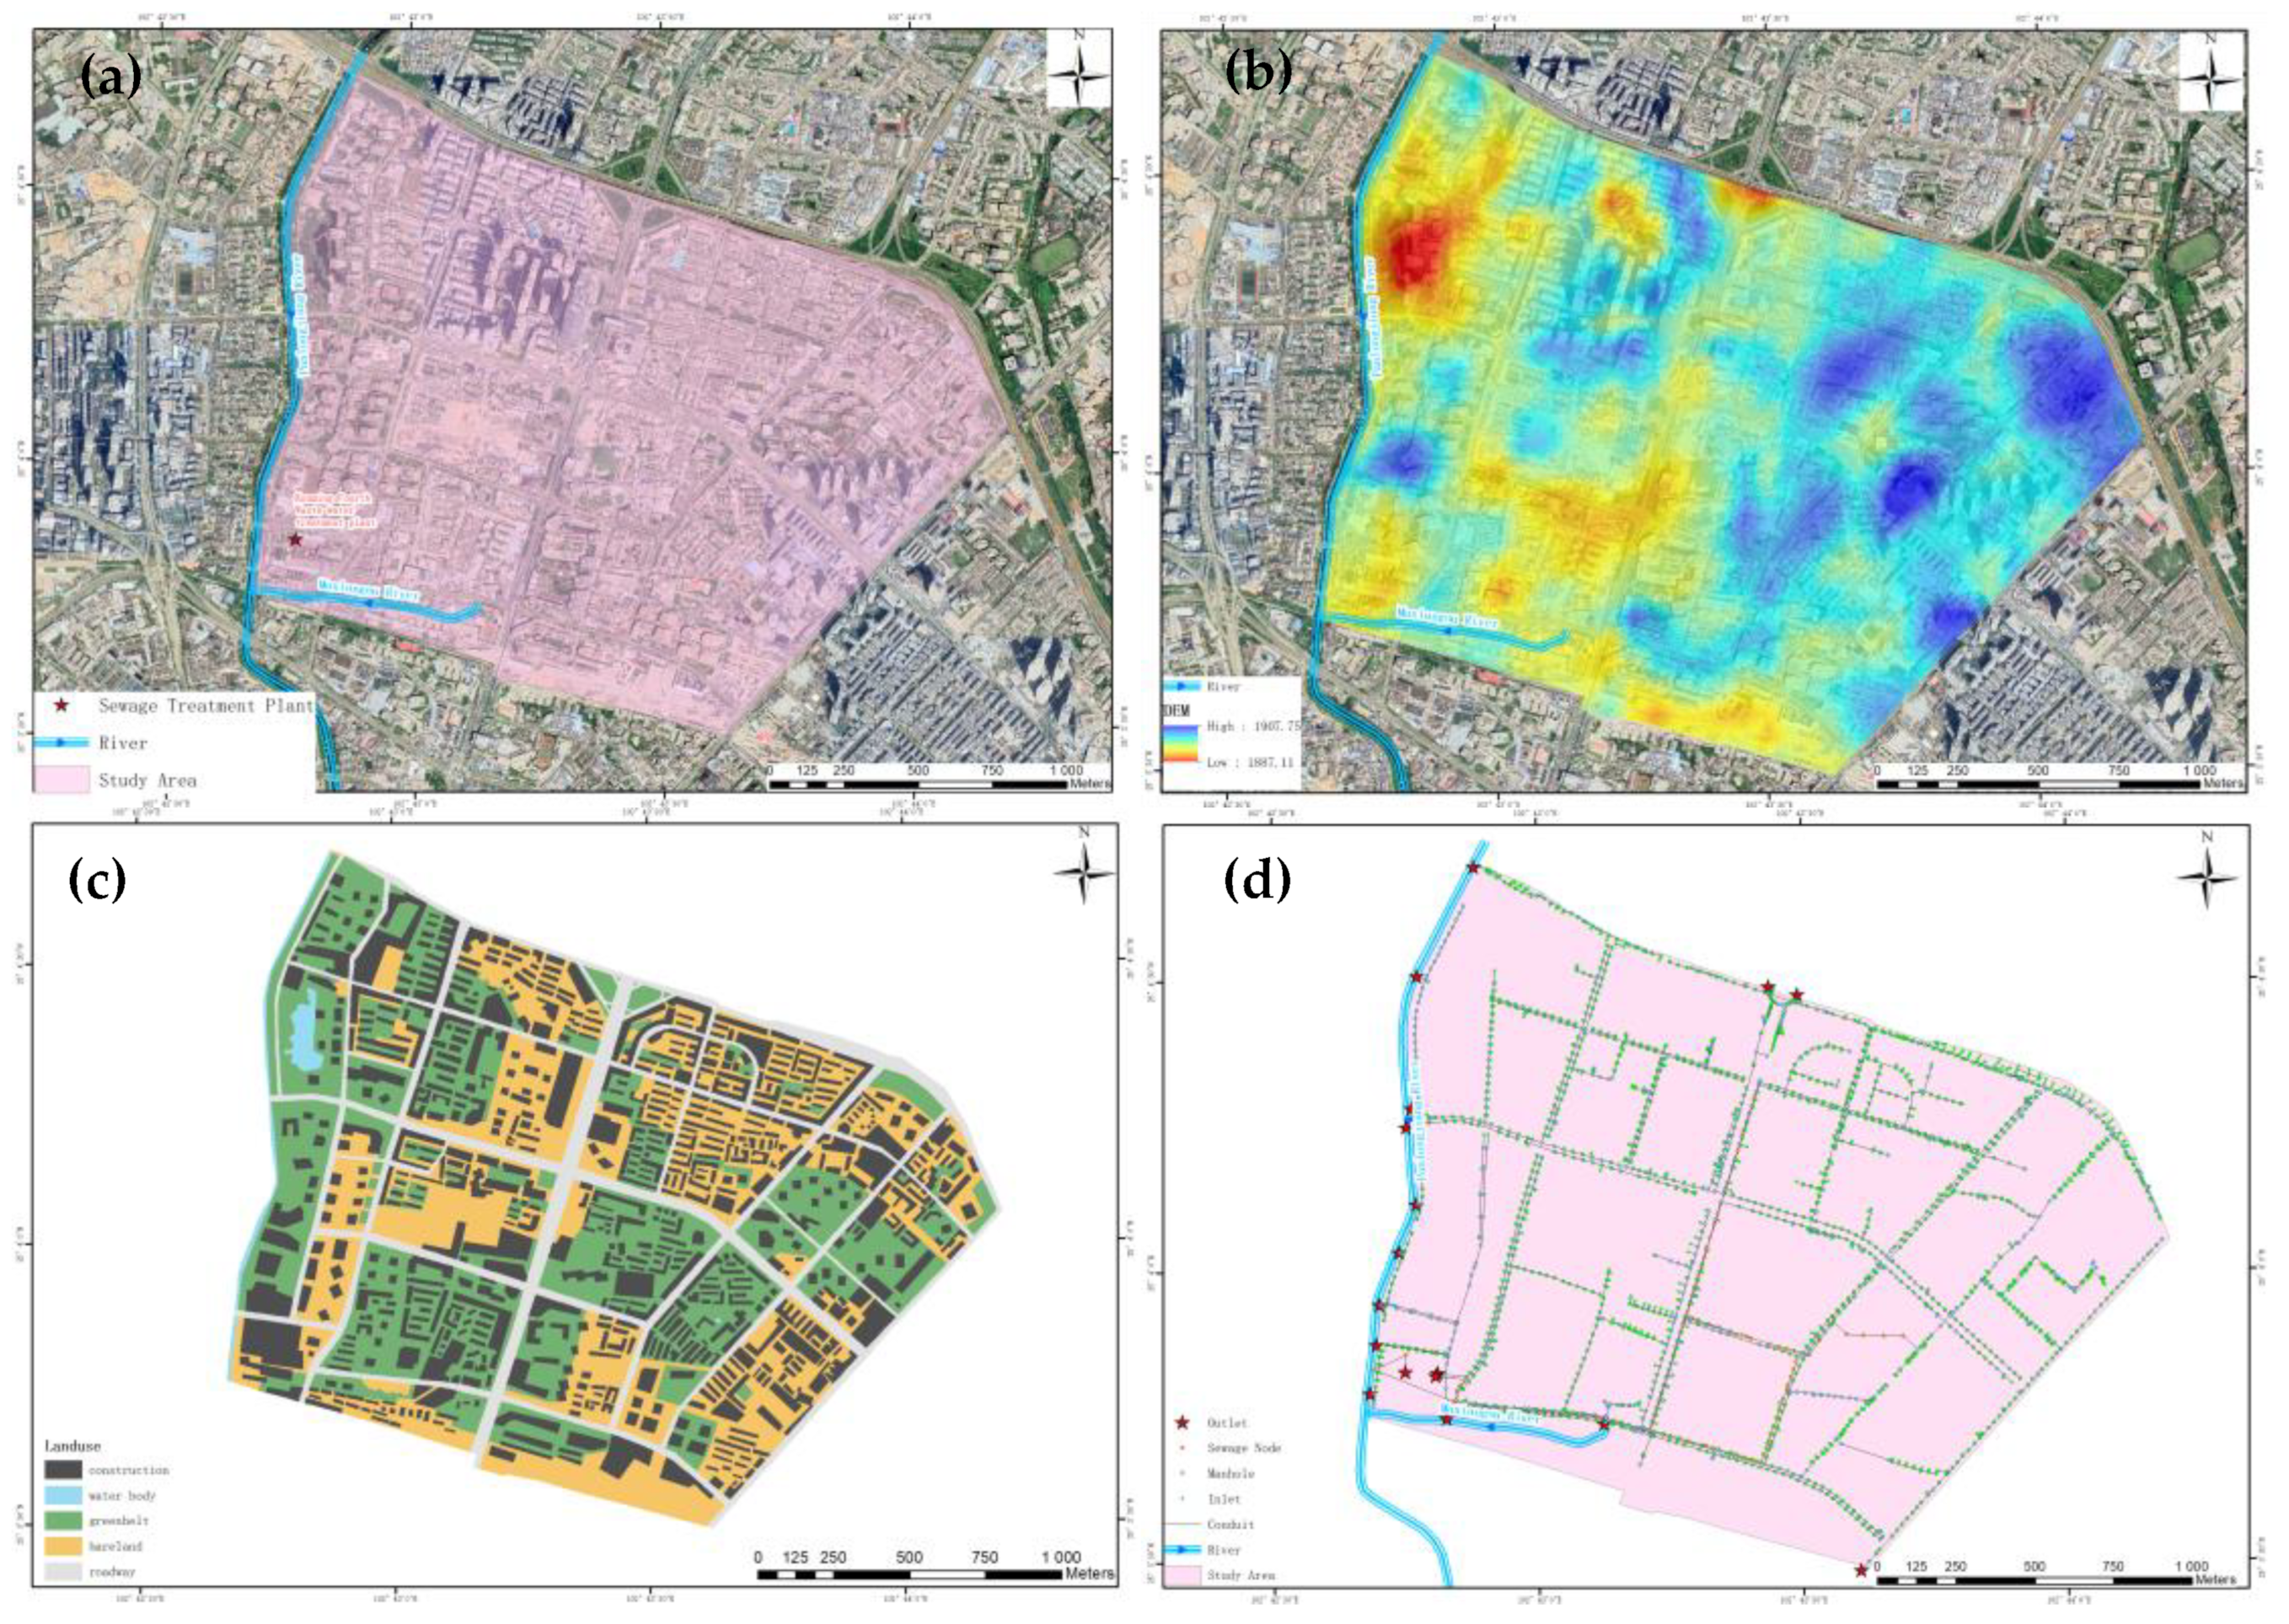
In this study, Maxiangou drainage district in the southern Panlong District, Kunming City, Yunnan Province of China was selected as the research area, as shown in Figure 7. The area is about 360 ha with densely distributed buildings and a drainage network, which has typical urban characteristics. According to the results of the ArcGIS hydrological analysis, the water exchange relationship between this area and the other drainage region is relatively clear. The west and south sides are adjacent to Panlong River and Maxiangou, and the Fourth Water quality Purification Plant of Kunming City is located in the southwest corner of this area. The surface elevation trend is clear, and the overall situation is high in the northeast but low in the southwest. The water in the region confluences from the northeast watershed to the southwest water system. There are 1565 inlets, 3414 manholes, 17 outfalls and 5022 pipelines in this area. The length of the pipeline is 79,743.75 m, and there are obvious characteristics of a combined sewer network. Based on the above reasons, it is considered that this area can more authentically reflect the related problems of waterlogging prevention and overflow pollution in the main urban area of Kunming City; thus, this area is selected as the typical research area of this topic.
3.2. Scenario Design
According to the method proposed in Section 2, we screened and sorted out the topological relationship of the drainage network in the target area, screened out the inlet points that make the upstream outfall information change, and ensured the basic correct representation of the pipeline direction. After that, we used two methods to build a hydrological model. The first way is the SWMM traditional way of modeling (hereinafter called SWMM). Thiessen polygons divided by manholes are the primary subcatchments. Then, they are corrected by remote sensing images and DEM. The second way uses subcatchments based on potential outfall combined with a photomap (hereinafter called SBPO). The water exchange relationship between subcatchments is also calculated. The required parameters of the two modeling methods are shown in Table A1 of Appendix A. According to the Rainstorm manual of Kunming City, the Maxiangou area is located in the control range of Daguanlou rain measuring station, and its designed rainfall intensity formula is as follows:
According to the above design rainfall, we selected the Chicago rain pattern for rainfall allocation [36,37], which lasted for 1 h, and used the different designed rainfalls with the return periods of 1a, 2a, 3a, 5a, 10a, 20a, 30a, 50a and 100a (Table 1), respectively, to simulate the various rainfall scenarios. Through the calibration of the designed rainfall conditions, we used the real rainfall event process in Kunming on 28 June 2021 as the test conditions. The bimodal rainfall lasted for 24 h, the maximum rainfall intensity of 4.1 mm/5 min and the cumulative rainfall of 119 mm.
4. Results
4.1. Results of Drainage System Topology Combing and Subcatchment Based on Potential Outfall
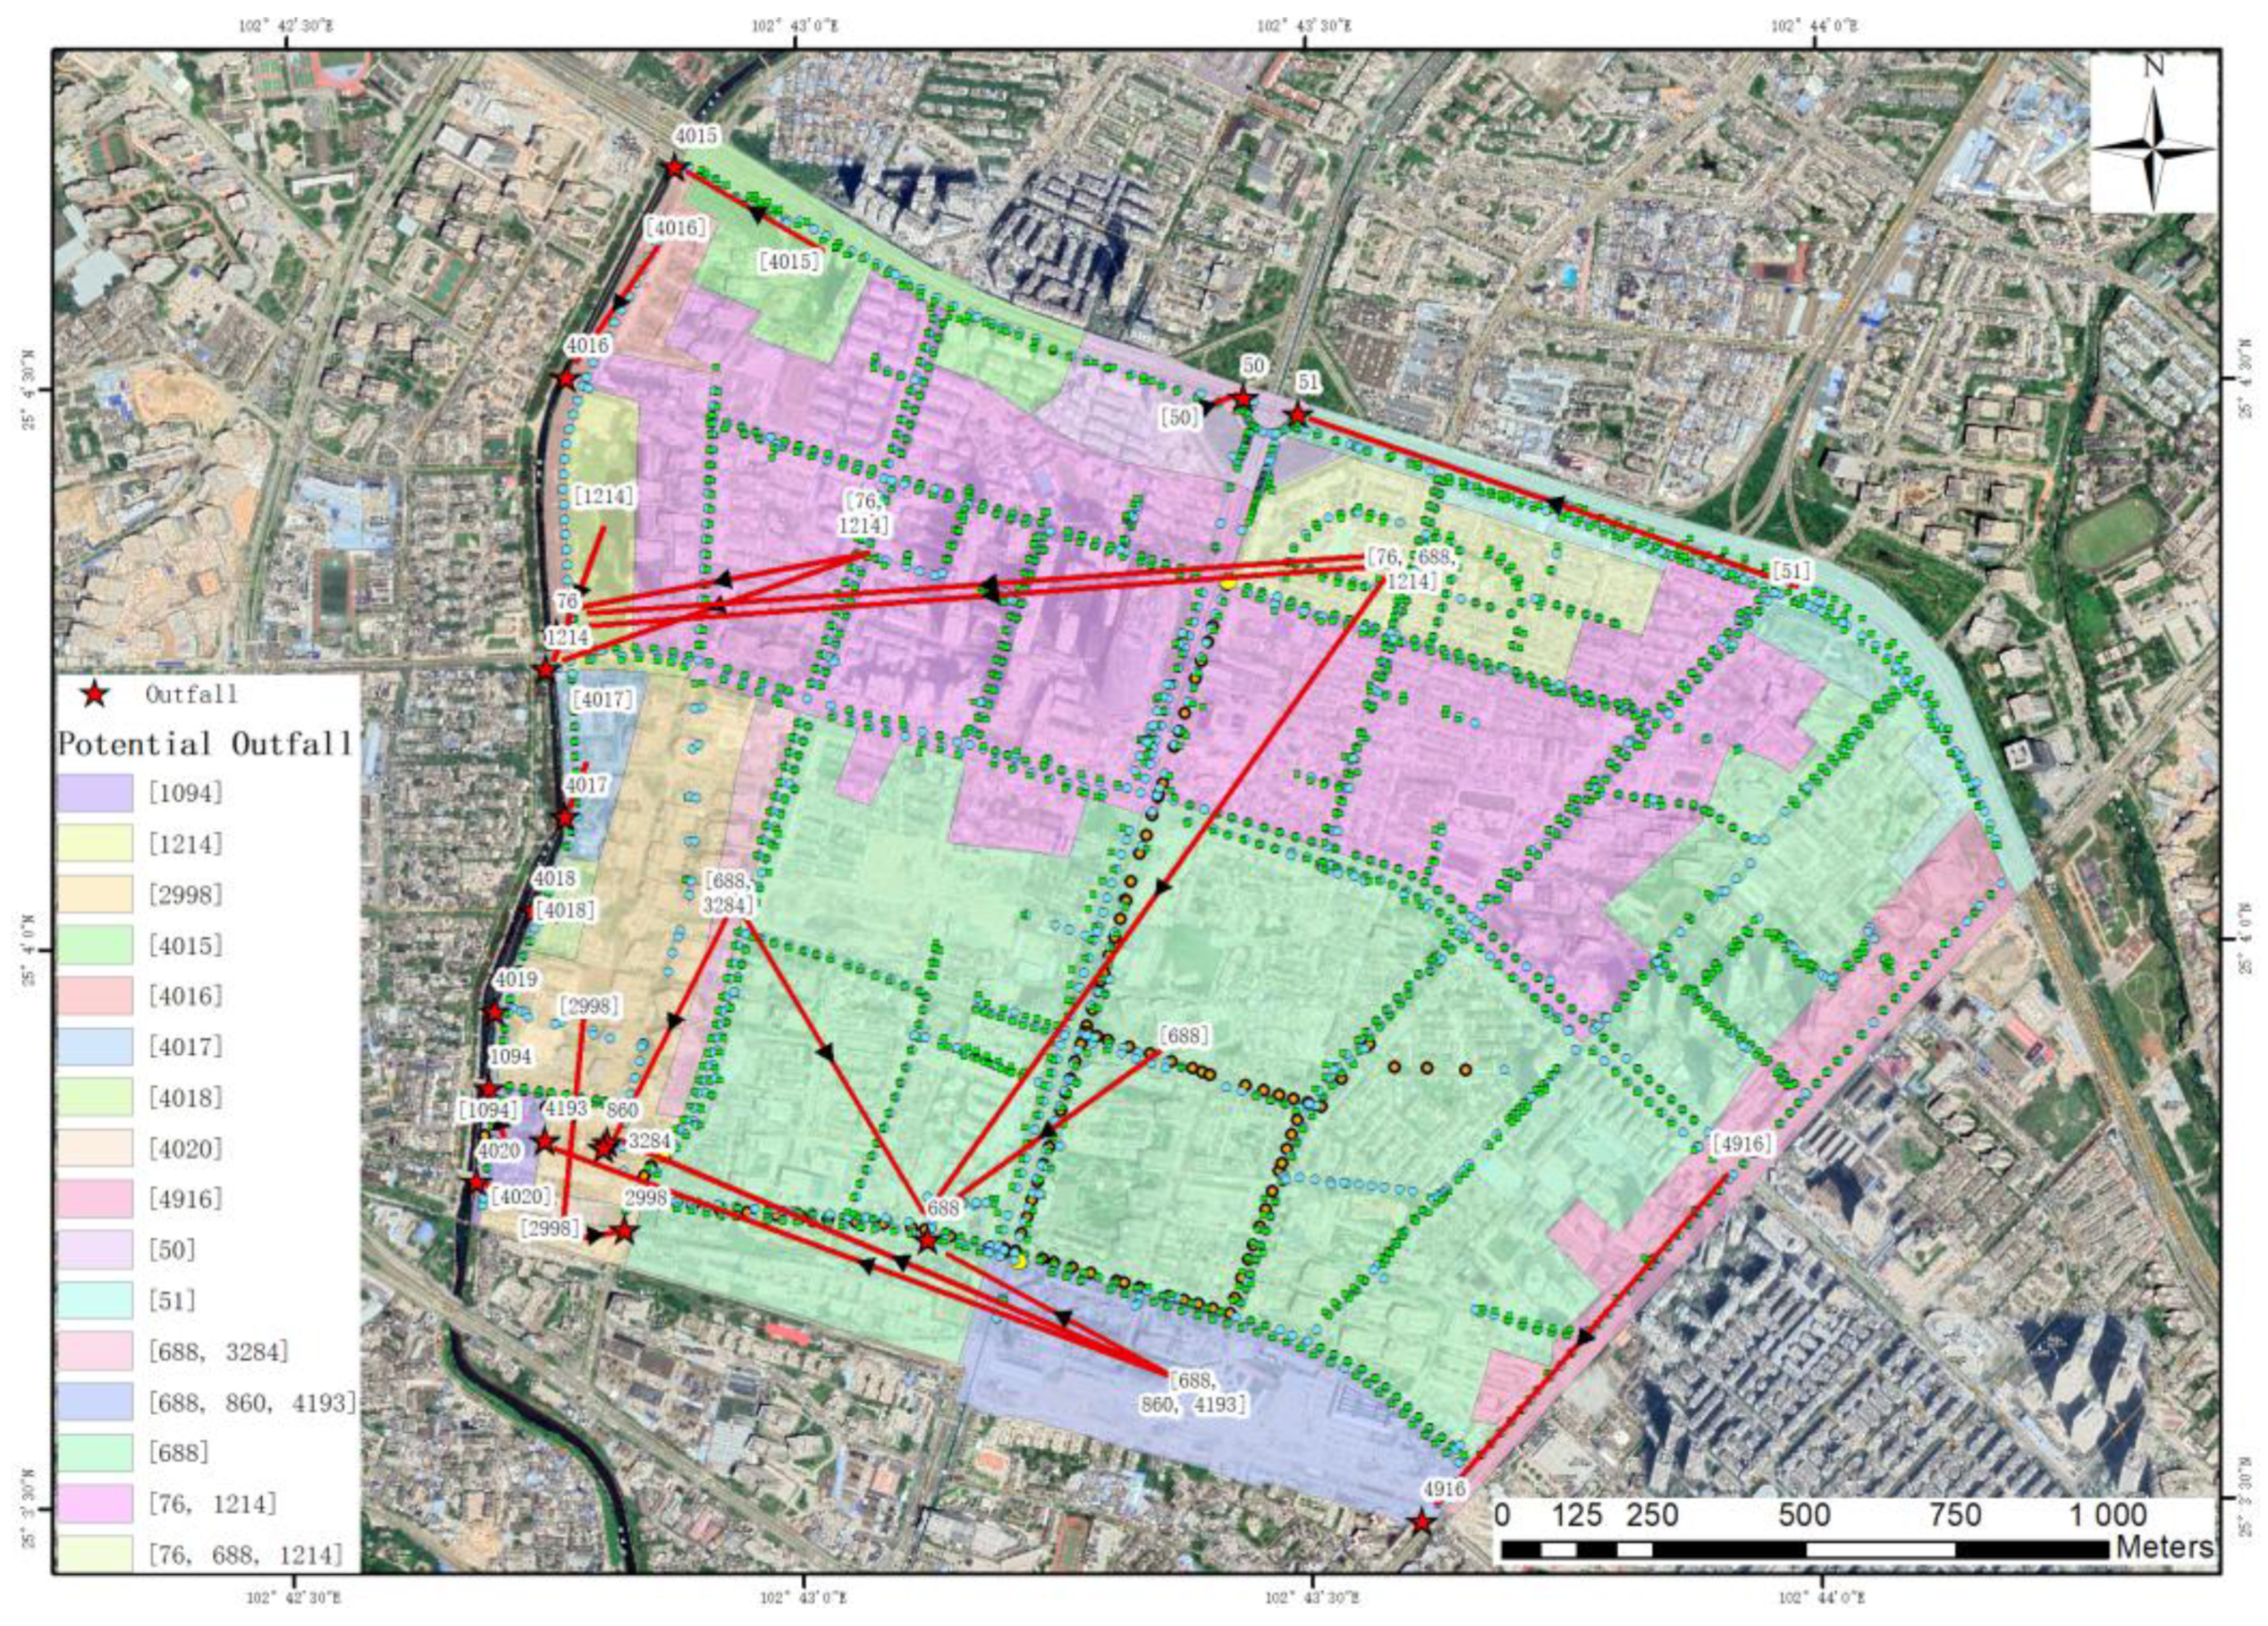
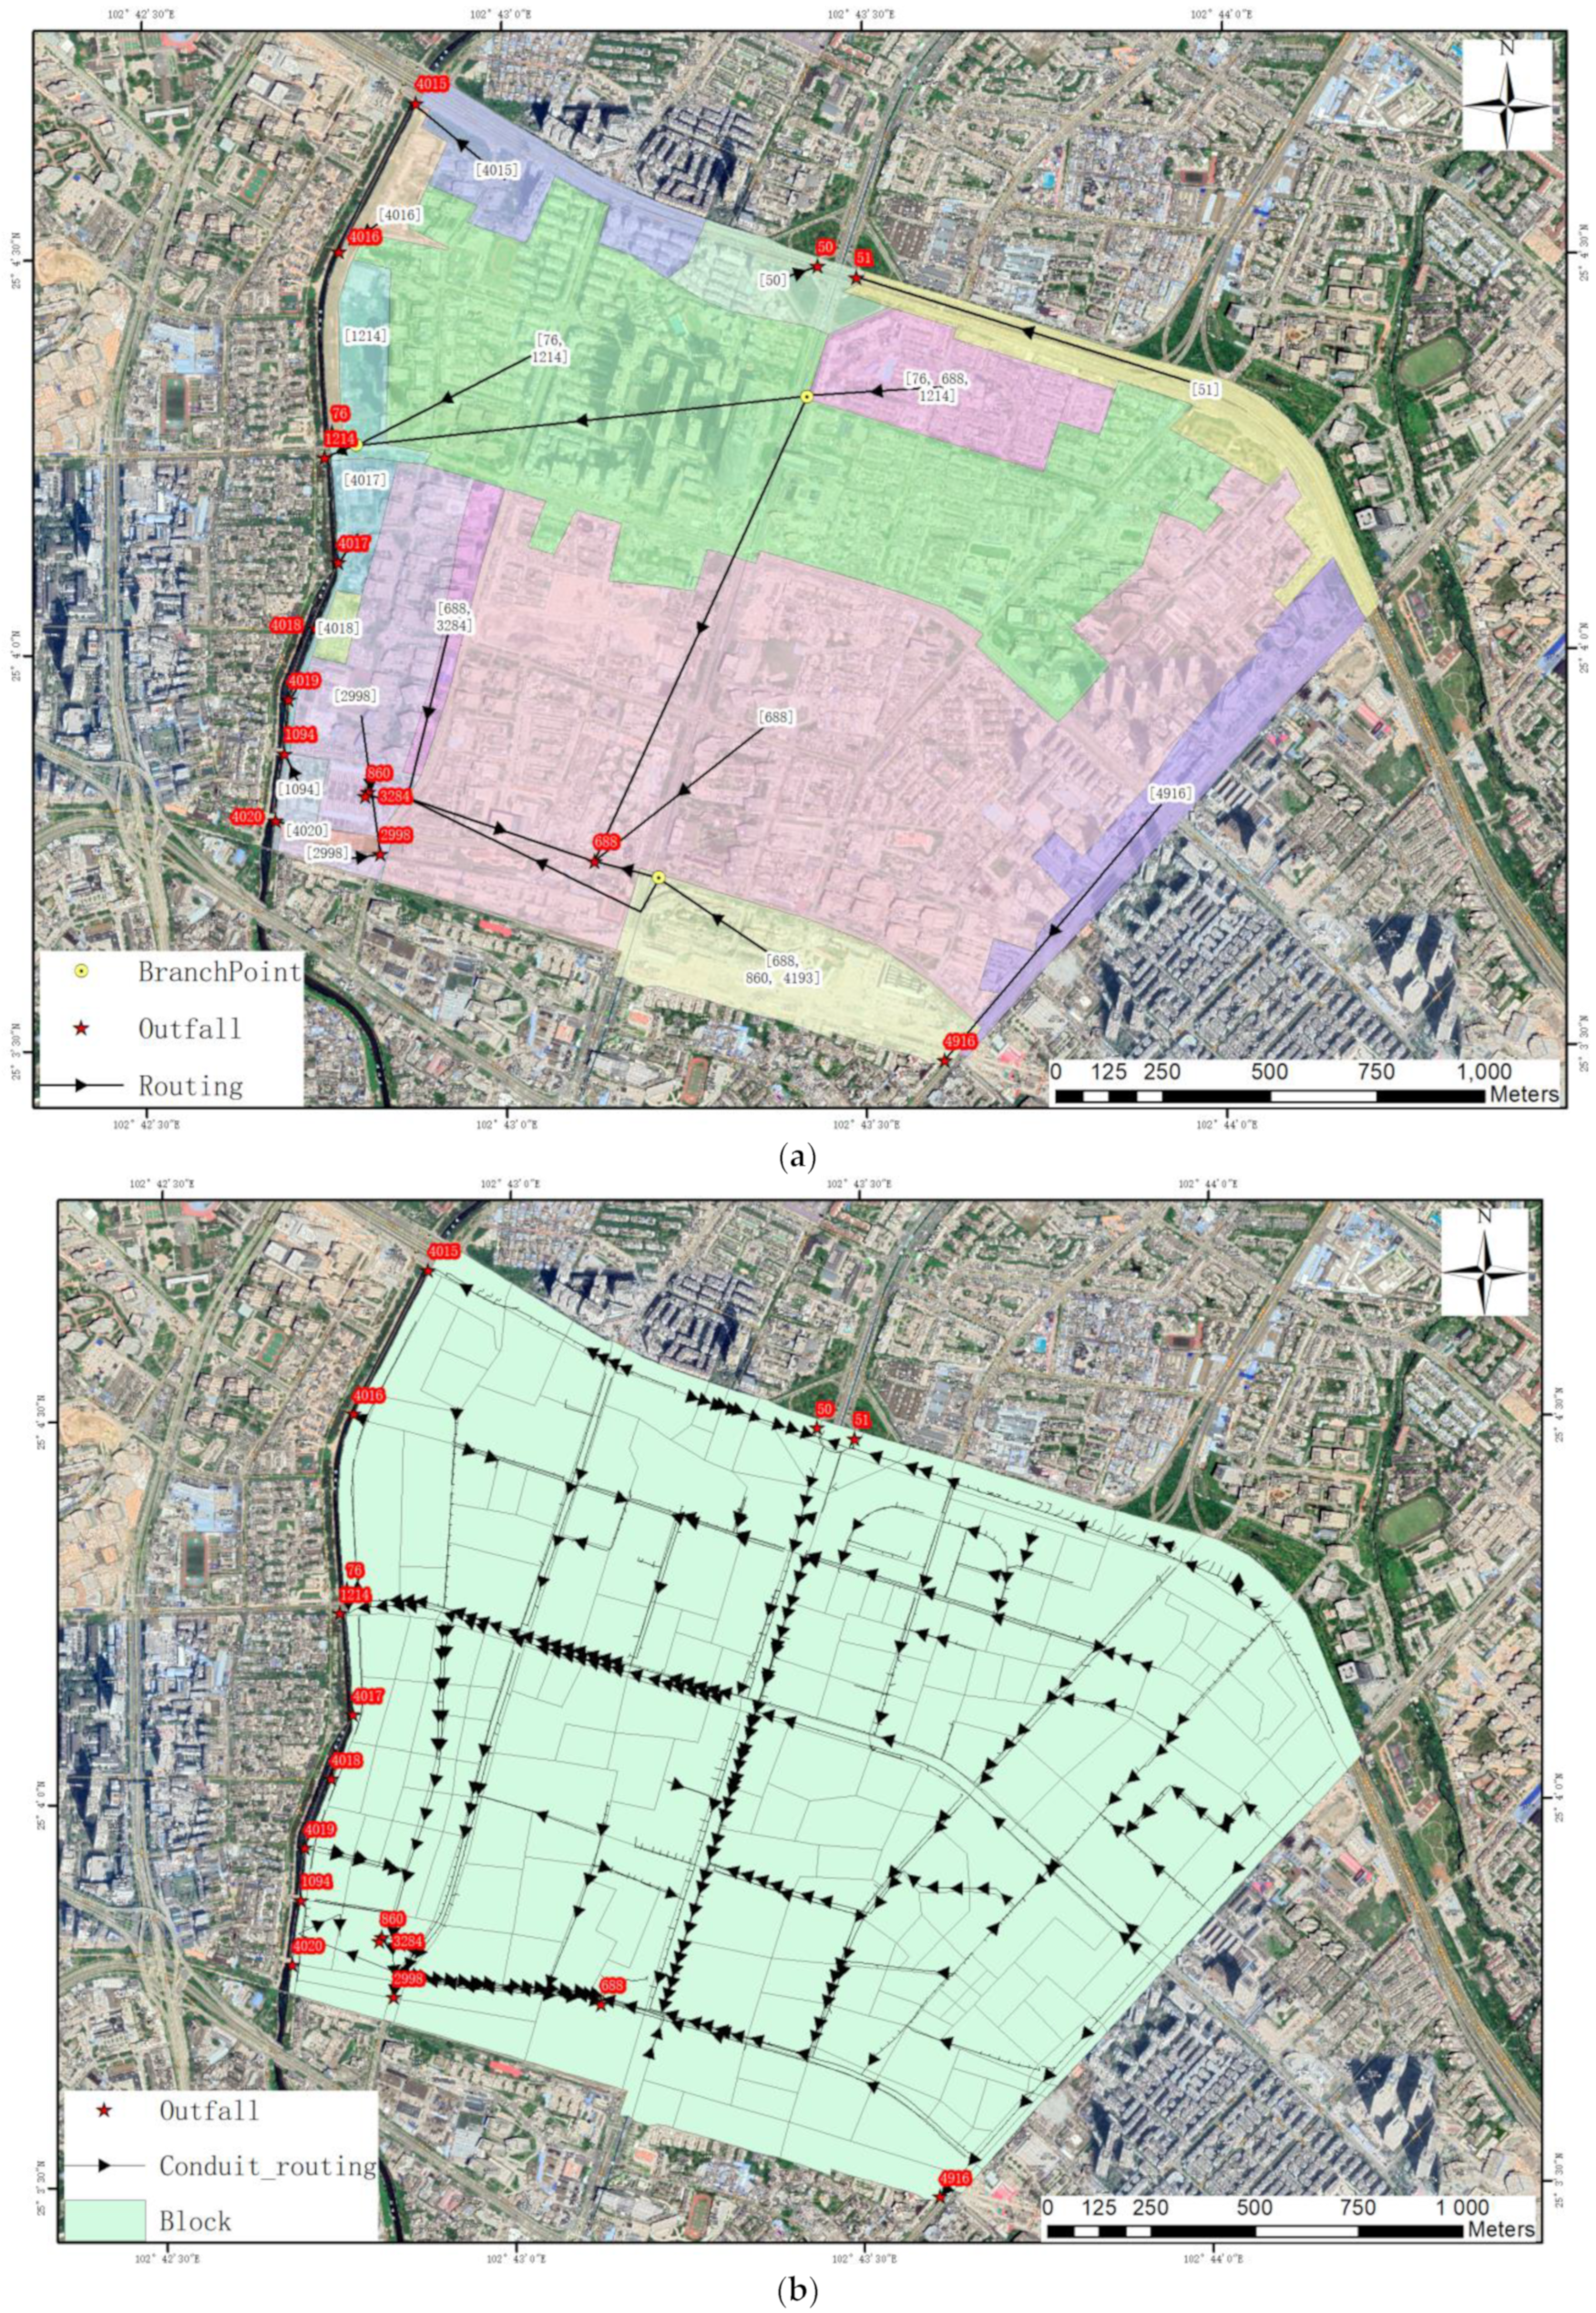
We sorted out the preliminary topological relationship, checked the problems of “ALL-UP”, “ALL-DOWN” and “CYCLE”, and completed the adjustment and verification of the topological relationship to ensure the reasonable location of outfalls. A total of 16 outfalls were selected as shown in Figure 8. The “50”, “51”, and “4916” outfalls are not actual drainage ports, but through which water is discharged into the drainage system outside the area. On this drainage region, the potential outfall of each node is traced, and five branchpoints are screened out according to the topological relationship, as shown in Figure 9. By merging the control areas with the same potential outfall nodes, the study area is divided into 16 different outfall combinations, as shown in Table 2. We compared the SBPO method with the SWMM method conveying the route in Figure 10. It can be seen that the conveying route of the SBPO method is the overall performance of the drainage network conveying route. SBPO with one outfall will be directly discharged through the outfall, while SBPO with more than one outfall will be discharged through the corresponding branchpoint.
Through observation, it can be found that the network topology relationship sorted by the above method can clearly display the functional attributes of the network. Using the subcatchment based on potential outfall, it is possible to have a very clear understanding of where the water in the block goes and whether the drainage is a single sewer system or a combined one. The drainage system in this area is a combined sewer system if the runoff entering through the stormwater inlet is likely to eventually be discharged from the outfall leading to the sewage plant. For example, node “688” is a sewage outfall leading to the Maxiangou River; “1214” and “76” outfalls have a large area of common control area in the study area, and the “1214” outfall is the sewage outfall, which drains into the Panlong River sewage pipeline, while outfall “76” is the overflow stormwater outfall associated with “1214”. The control range of these three water outfalls occupies 71.86% of the total study area, which fully indicates that the Maxiangou area is a confluence system area.
At the same time, the results also indicate that the connectivity of sewage discharge systems and combined systems is often more intensive, where the service area of a single outfall is larger, and the complexity of associated nodes is higher. On the contrary, the rainwater drainage system is independent. The simple rainwater drainage system occupies a relatively small area and is often close to the water body and has a relatively clear tree topology structure, which is in line with the idea of discharging the water into the nearest river to reduce the project cost when constructing the rainwater drainage system.
4.2. Result of Outfalls’ Total Inflow
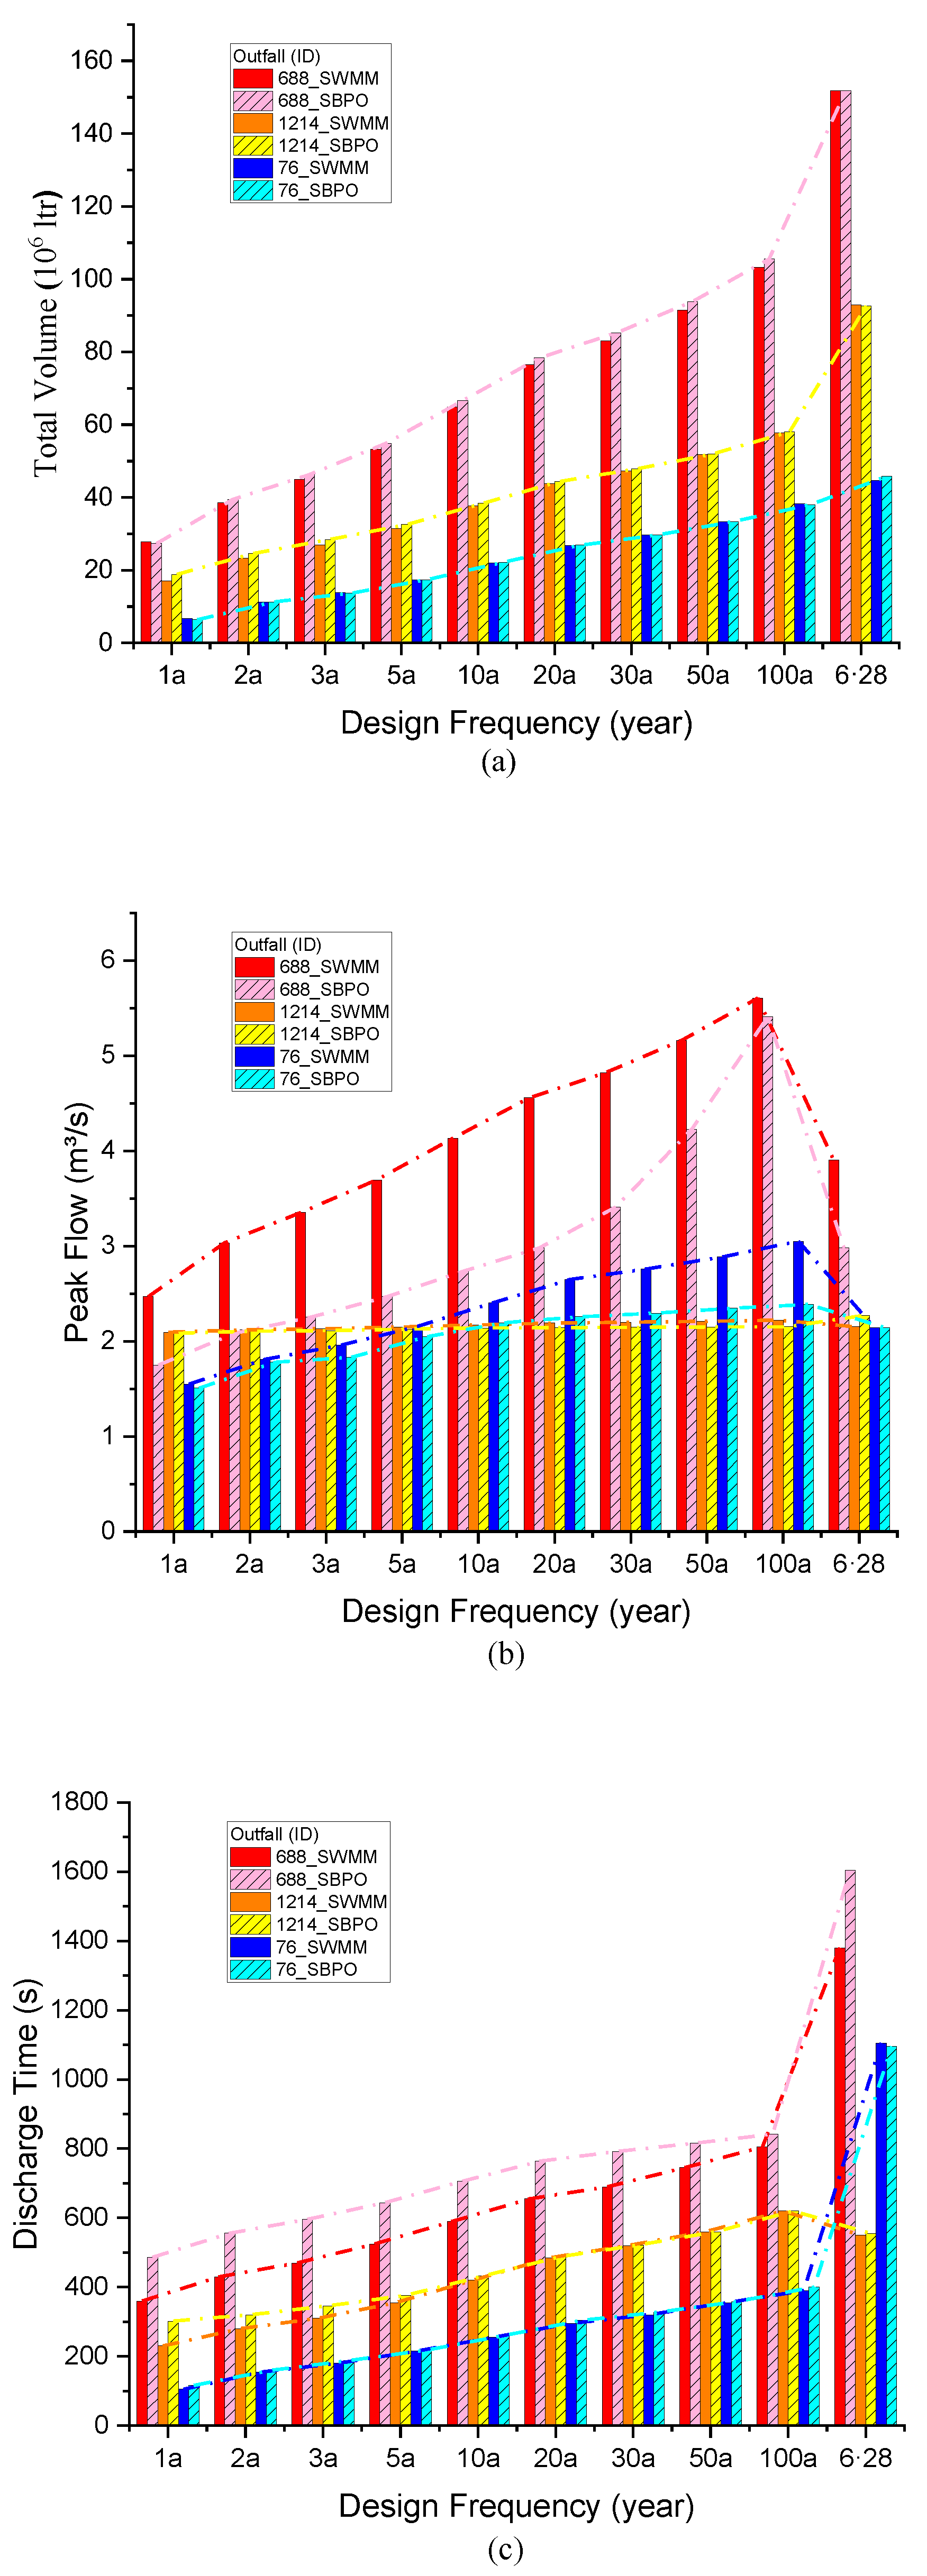
After using the SWMM and SBPO to build the model, we compared the development trend and relative differences of the three main outfall nodes “688”, “76”and “1214” under different rainfall intensities. Specific assessment indicators include total discharge volume, peak value, peak value and discharge time, etc. The results are as follows (Figure 11).
It can be found from Figure 11a that in the 10 rainstorms with design occurrence frequency ranging from 1a to 100a, the maximum error of the total effluent volume at the outfall is only 2.261 × 10⁶ LTR, and the relative error is 2.18%, which indicates that the two simulation methods of SWMM and SBPO have a high degree of consistency in the discharge volume at the outfall, and the water allocation results of the two methods are the same. However, the SBPO method can significantly reduce the computational burden of the model and allow us to view the start and end points of the urban water flow movement from a realistic and meaningful perspective, rather than simply applying the subcatchment only as the calculation units of the service stormwater model. The results also prove the feasibility of using the network combing method based on the outfall to confirm the internal independent relationship of the drainage system.
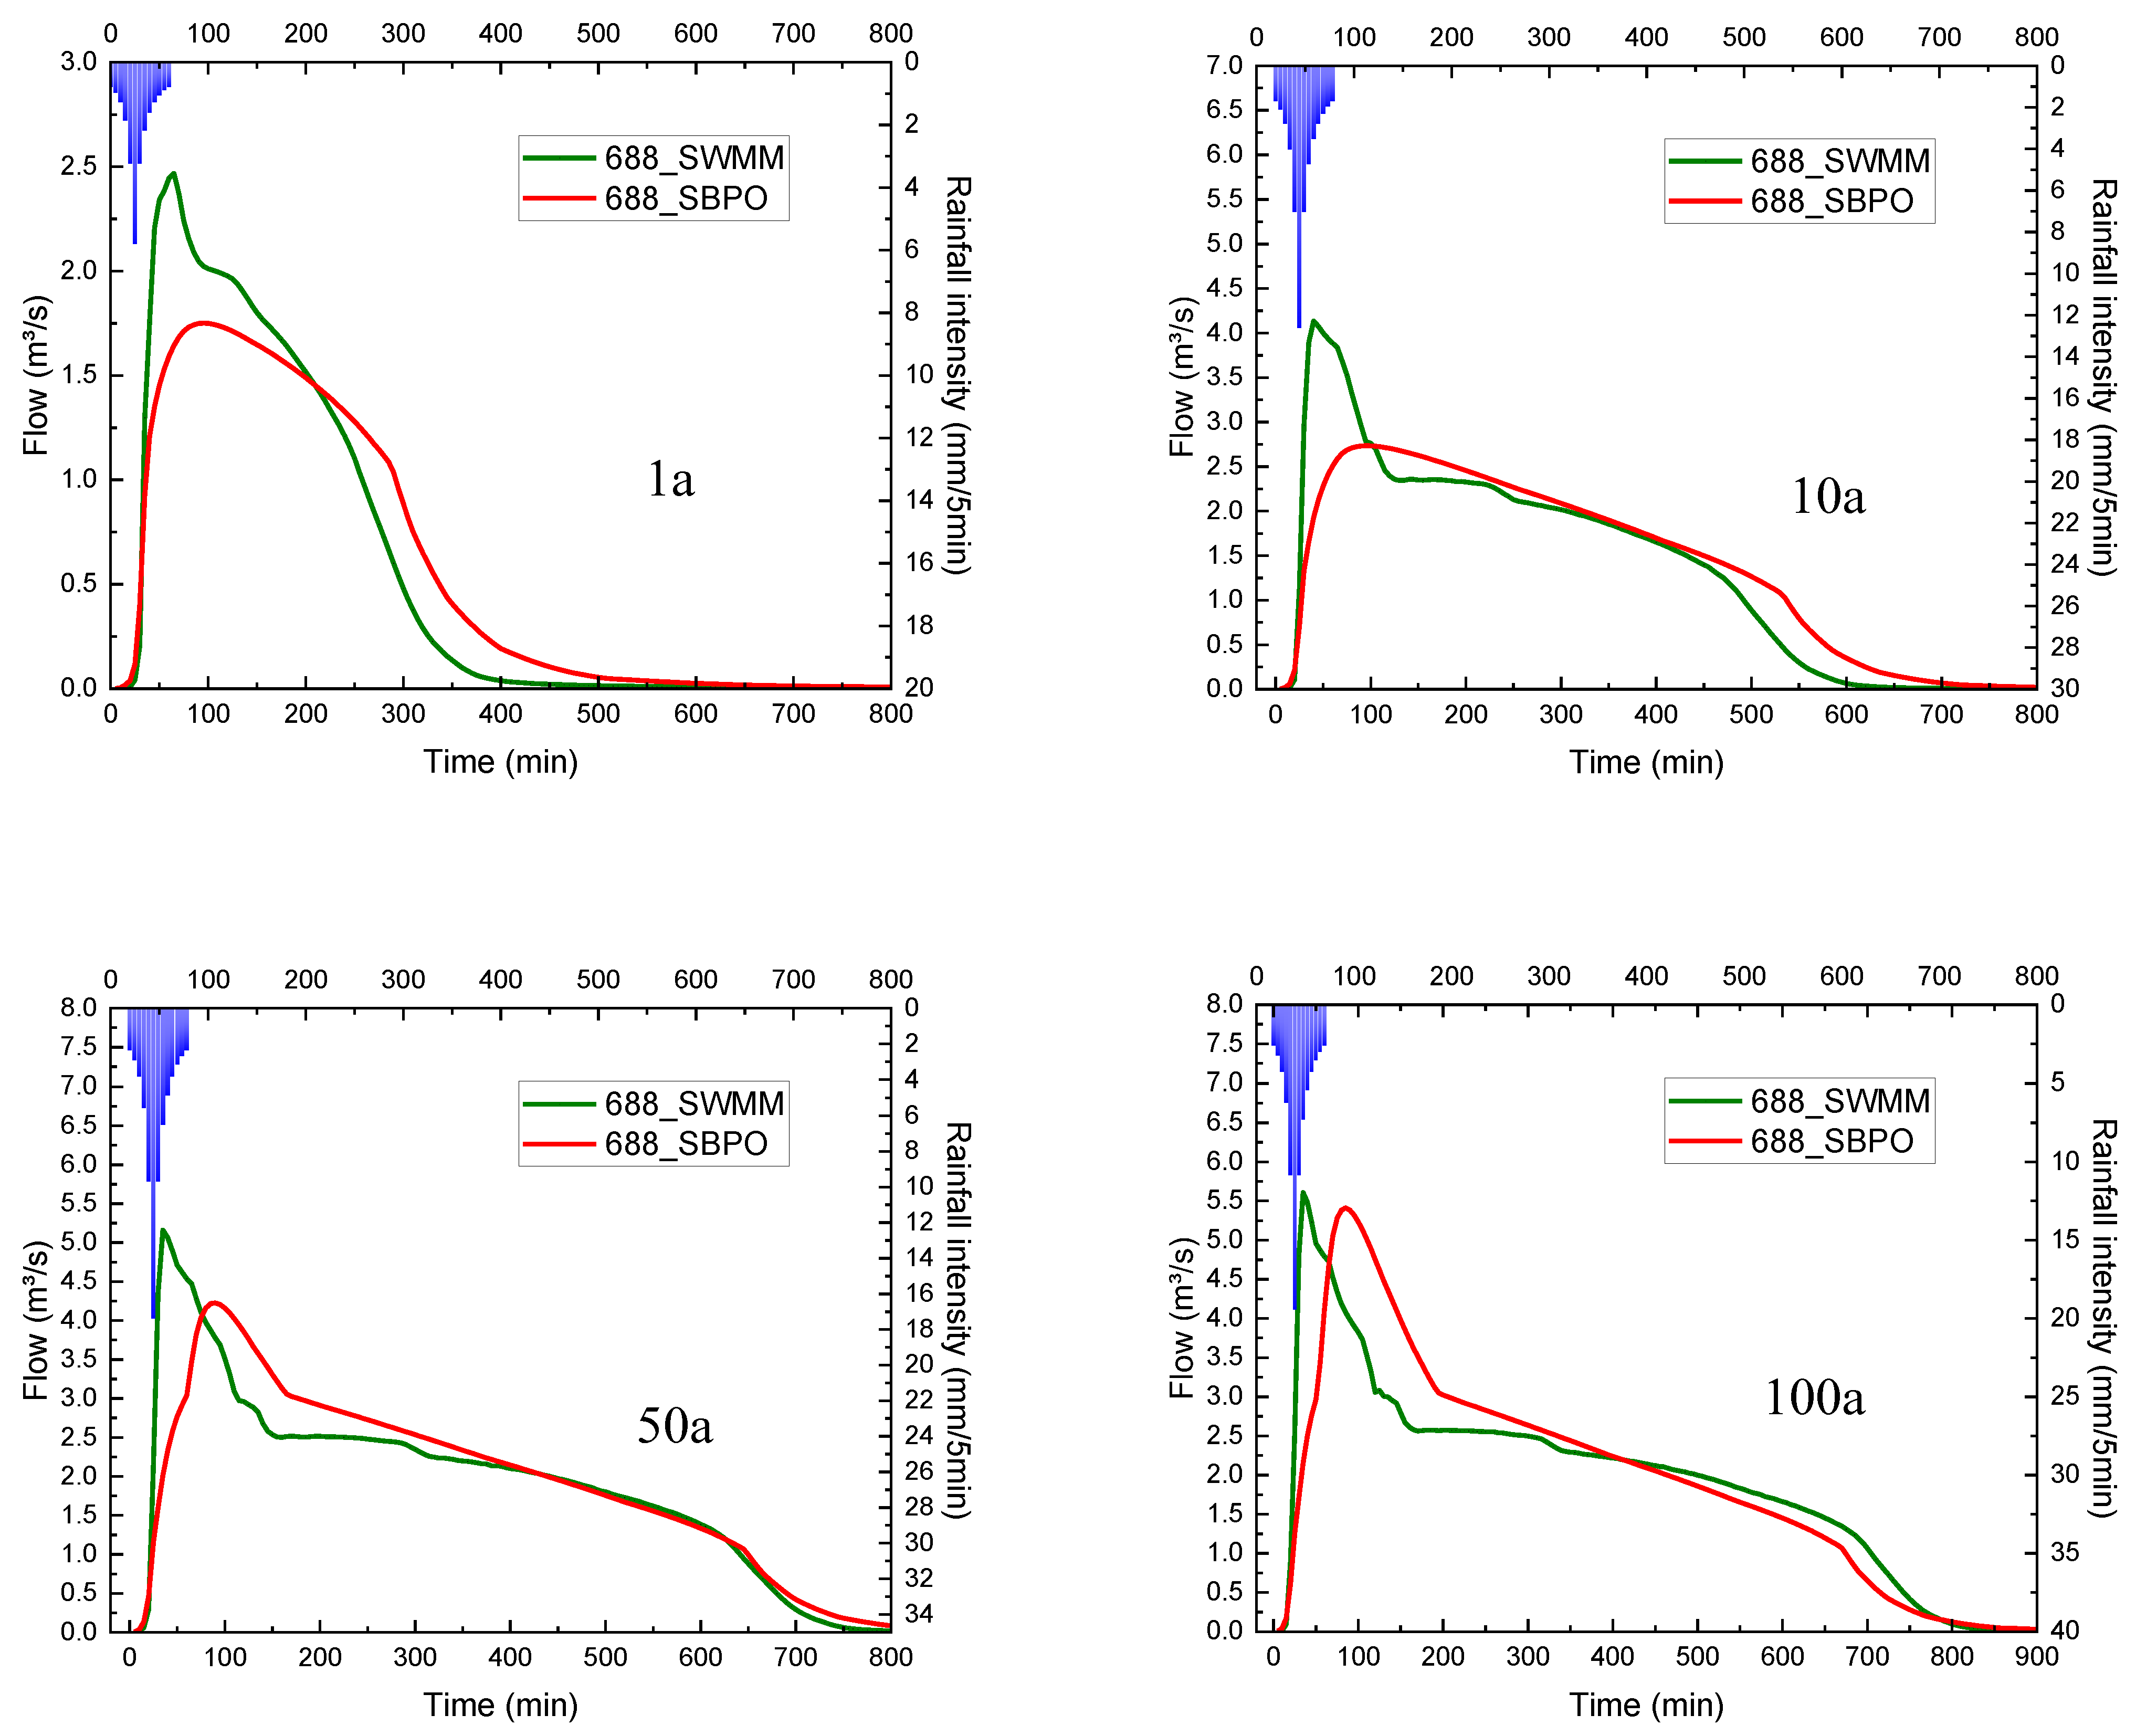
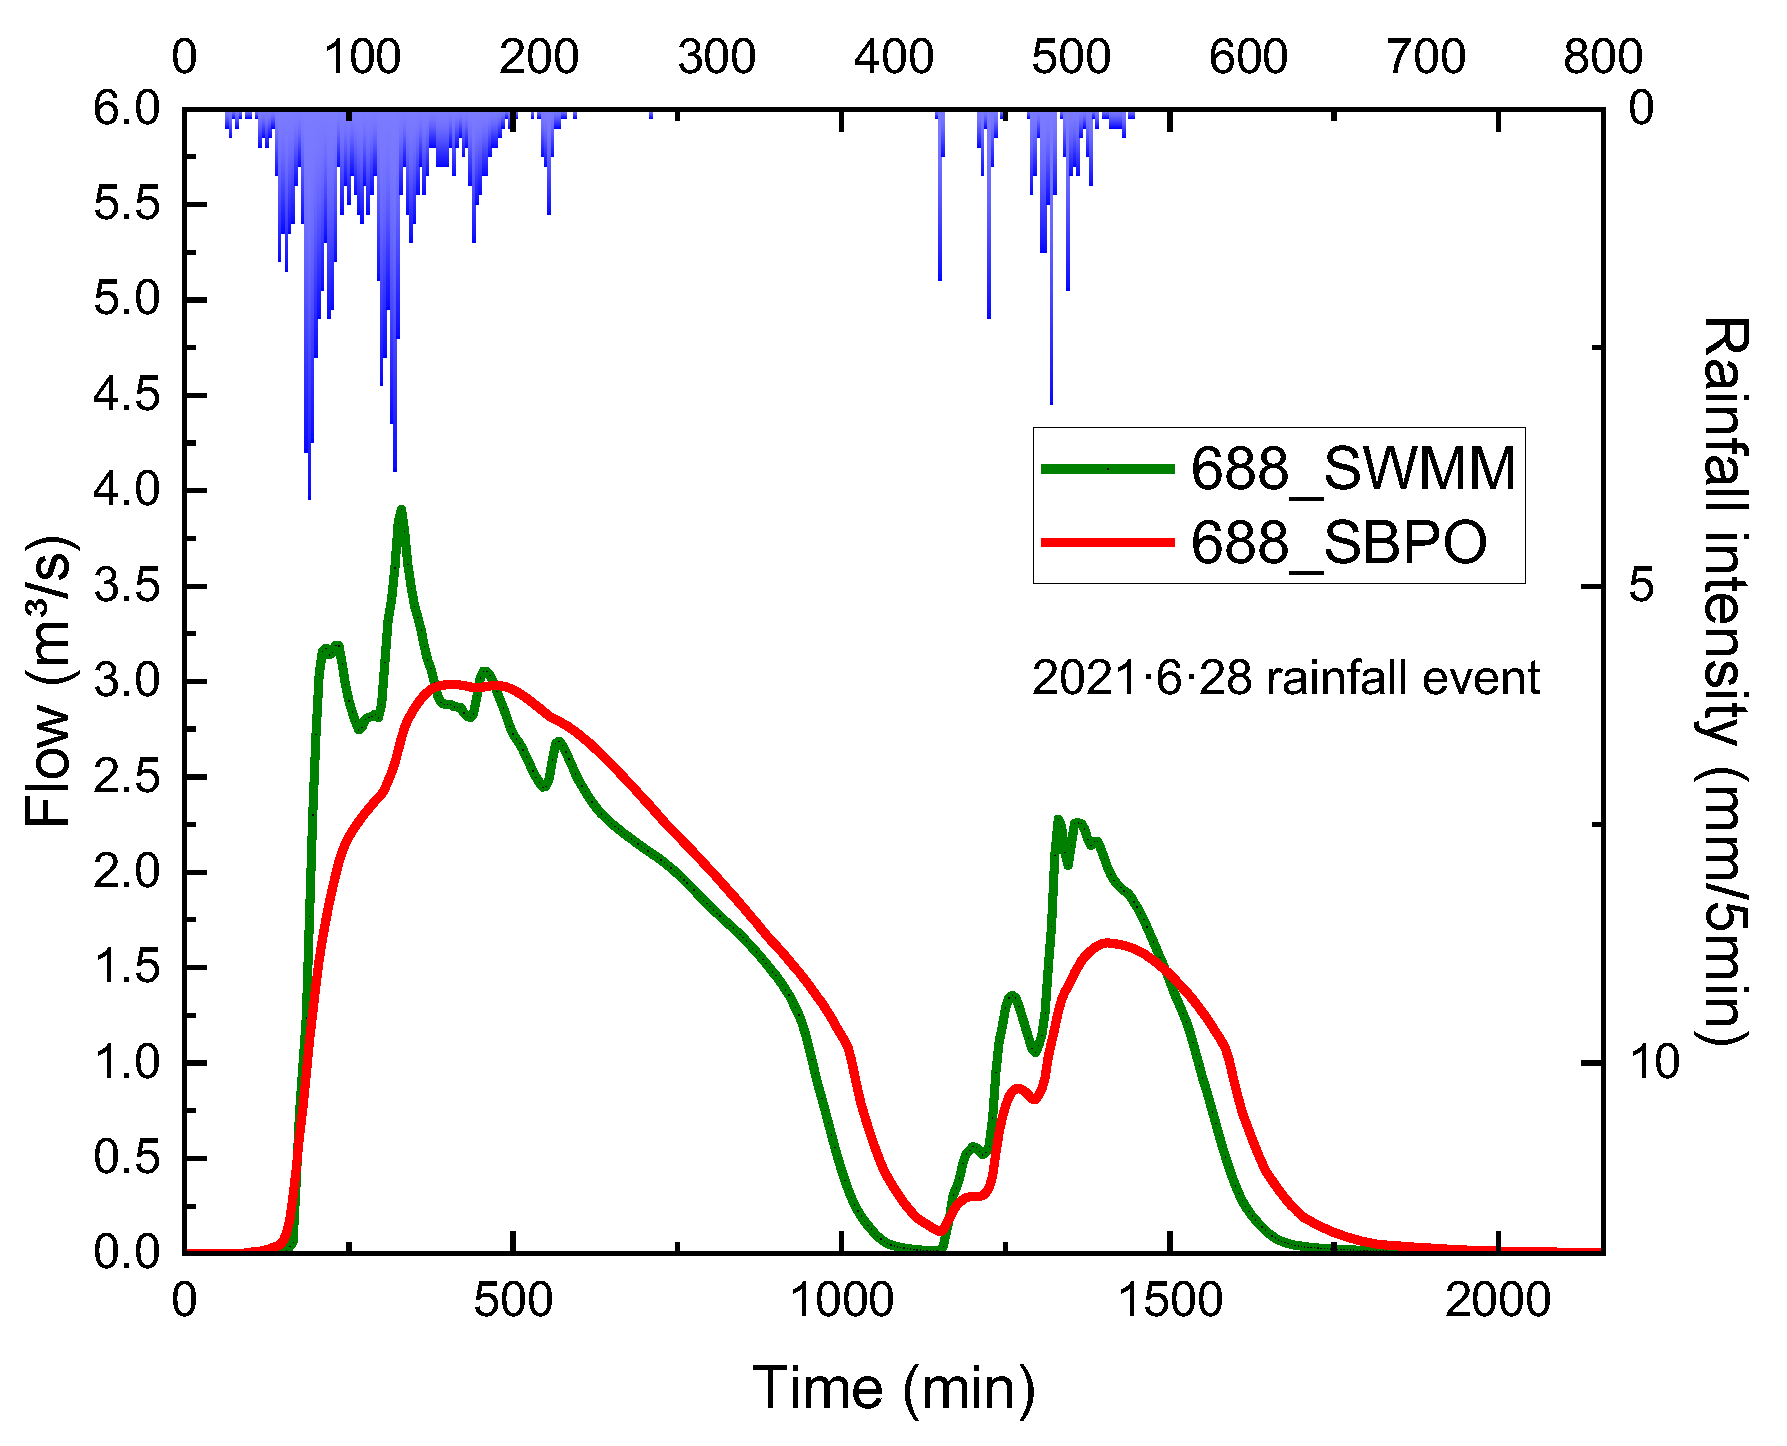
By observing the peak discharge and discharge time, it can be found that there are some differences between the two methods. It can be seen from the peak flow diagram of outfall “688” that when the rainfall is light, the peak flow at the outfall of the SWMM method is generally larger than that of SBPO, and the maximum error reaches 1.58 m3/s. In order to observe the specific situation at the outfall, we further checked the flow process lines of outfall 688 with return periods of “1a”, “10a”, “50a”, “100a” and“6·28” (Figure 12):
From this series of figures, it can be seen that the peak rainfall of outfall discharge given by the SWMM method in light rain is significantly larger than that of the SBPO method. Even though the gap would decrease with the increase in rainfall amount, the peak occurrence time of the SBPO method is still delayed compared with SWMM. The reason is possibly the use of storage instead of drainage networks to buffer large catchments from a severe response to rainfall in the SBPO method.
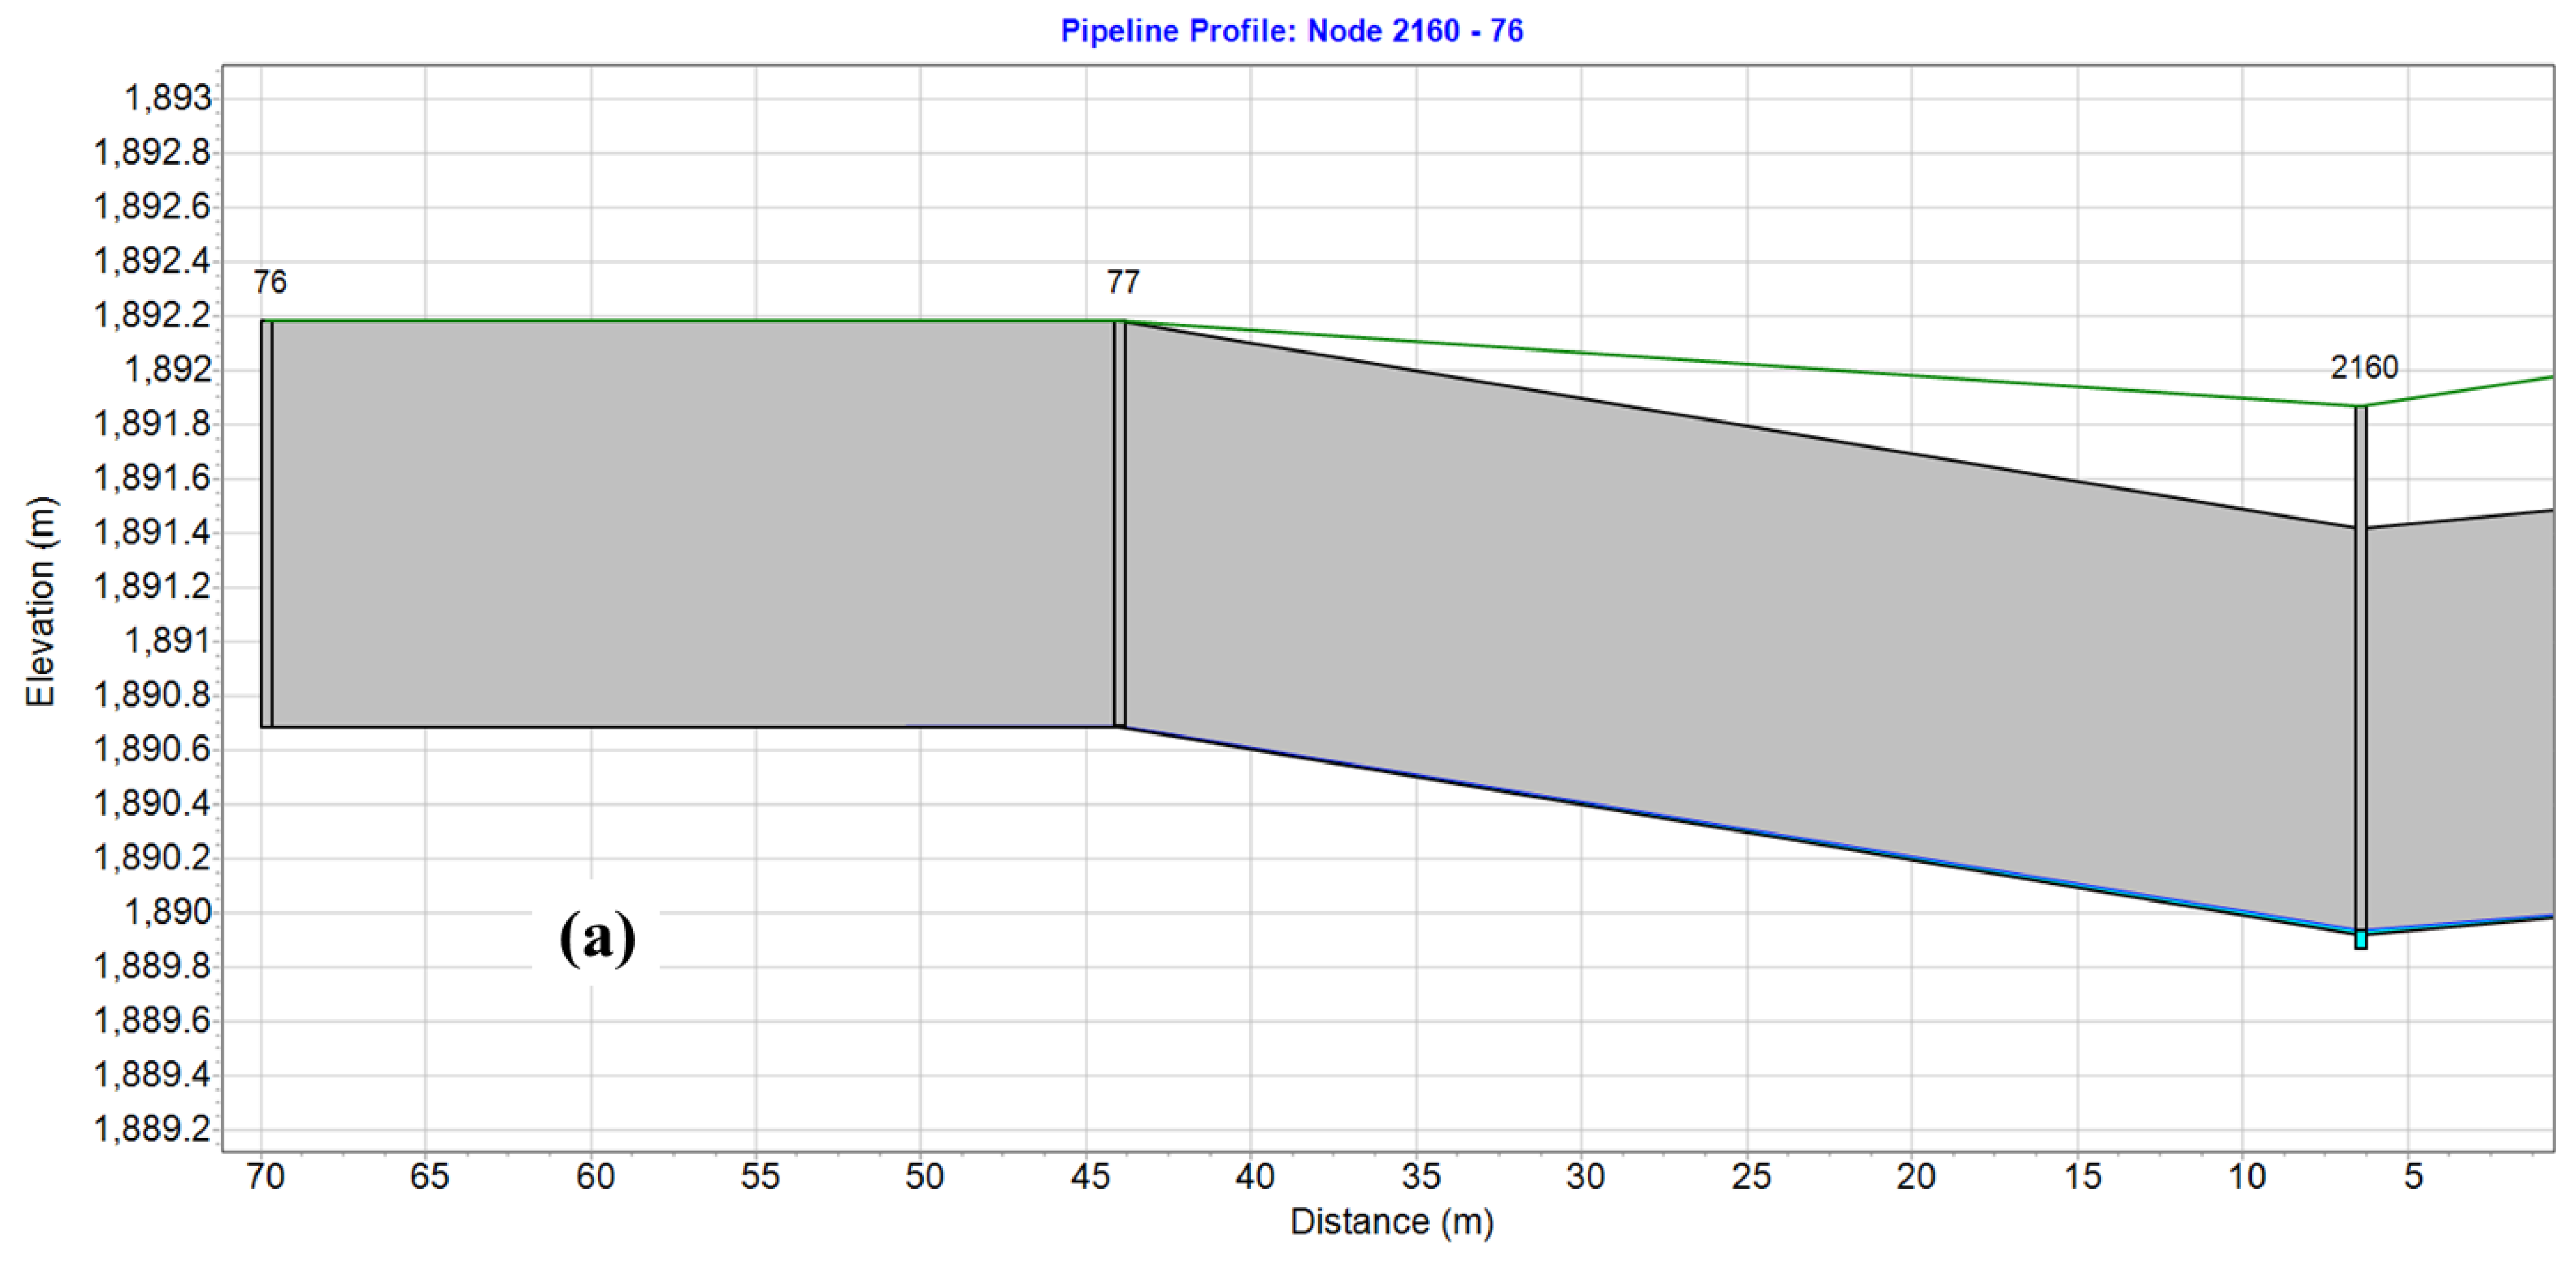
According to the Figure 11b, it can also be found that the peak flow of outfall “1214” keeps stable and will not change with the variation of rainfall intensity. Through the data investigation, we found that the pipe diameter at outfall “1214” is narrowed to match the size of the sewage pipe in Panlong River (Figure 13). There is a phenomenon that the flow runs from the pipe with larger diameter into the one with smaller diameter. From outfall “1214” and “76” back to their branchpoint, we discovered that the in-offset of 1214 is lower. When the flow is less, it generally flows out from the “1214” sewage pipe and enters the sewage plant for purification treatment. When the flow becomes large, the flow will overflow from the branchpoint to “76” outfall; thus, that the sewage does not go through the sewage plant and directly discharges into the river. As can be seen Figure 11a, the volume proportion of outfall “76” increased with the increase in rainfall intensity.
We also compared the simulation time of 18 schemes of the two methods. Table 2 shows the simulation time cost of the two schemes in different scenarios. It can be found that the simulation time of the single method will increase with the increase in rainfall, but the computing time of the SBPO method is significantly smaller than that of the SWMM method. The average efficiency improvement is achieved at 72.91% (Table 3). Not surprisingly, the integration of the subcatchment through potential outfall can effectively optimize the computational load of the model, reduce the computational time cost, and improve computational efficiency.
5. Discussion
5.1. Basic Drainage Network Data Processing
The drainage network is the underground “blood vessel” of the city, and it often has tens of thousands of underground pipeline and nodes. For the relevant practitioners of urban hydrology, out of different research objectives, they often have different processing methods for network data. Park et al. [38] investigated the spatial resolution of the sewer network on the SWMM and found that it did not have a significant effect on the simulated runoff volume. However, this research still needs to distinguish the main pipes from the others in the drainage system, which are inseparable from the correct topological relationship. McGrath et al. [39] explained network topology and rainfall controls on the variability of combined sewer overflows and loads. The above research shows that even the urban hydrological analysis at the level of systematic or statistical properties cannot be separated from the topological sorting of the drainage network system. Especially in the combined system area, the correctness of the drainage network topology is the priority when researchers want to find the problem.
In this study, we discussed the common problems of network data in urban areas. After the direction of the pipeline is assigned, the directed graph should avoid zero out-degree of non-outfall nodes and the circular topology. We should be cautious about the nodes with an in-degree of 0 and an out-degree of more than 1, as such nodes tend to deviate from the gravity-driven properties of the drainage network, although they may occur in the real world. After checking the above problems, this study puts forward that the correct topological digraph of the drainage network system should comply with the definition of DAG and the location of the outfall should point to the river and the sewage plant. This provides urban designers with basic inspection standards for the drainage network, and provides ideas for collecting and sorting drainage network data.
On the basis of correct flow direction of the drainage network, we proposed a labeling method based on potential outfalls. This method enables people to view the complex and scattered network nodes from a new perspective and complete clustering nodes. On this basis, the difference between the urban underground drainage network and natural river topology is illustrated: underground drainage network, as a man-made junction, does not follow the tree trunk structure of the minimum entropy generation principle. In contrast to the river network system, we define the branchpoint of the drainage network based on the potential outfall information. It is not necessary for any node whose out-degree is greater than or equal to 2 to be a branchpoint. The branchpoint must make the potential outfall information of its upstream node diverge. Through this case, it can be found that for the combined sewer system area, these points are often the key nodes leading to overflow pollution. One of the characteristics of the combined sewer system is that the pipe flow is discharged from the sewage network with lower elevation to the sewage plant when there is no rainfall or when the rainfall is light. Usually, when the rainfall is heavy, the sewage plant cannot bear a large amount of low-load sewage, so that the low-load sewage directly overflows from the sewage network to the stormwater network and eventually is discharged into the river. For the areas with serious overflow pollution and the willingness to carry out rain and sewage diversion, the lock-in of branchpoint location can help practitioners quickly find the sticking point of these works. For example, if the purification capacity of the sewage treatment plant is increased, then the overflow threshold of the stormwater channel at the overflow branchpoint can be improved or completely closed.
5.2. Application of Potential Outfall Information Based on Network Node
On the analysis mentioned above, we proposed a drainage network application based on the combination of potential outfall information. Cleveland et al. [40] simulated runoff with the Hydrologic Modeling System (HEC-HMS) and discovered that the size or number of subcatchments have little influence on the computed runoff hydrographs. Since the simulation results of runoff in different scaled subcatchment areas are similar, it is the key that how to save the calculation cost as much as possible without losing the accuracy of the output results and make the calculation elements have practical significance.
We clustered nodes based on potential outfall information and considered the area controlled by these nodes as a common subcatchment. With the increase in ground hardness and building density, the drainage network played a decisive role in the confluence path of the urbanized area. Therefore, it would be well reasoned to reduce the influence of surface confluence and consider the confluence relationship of the drainage network as the basis for dividing the subcatchments. In the past, subcatchments often only serve the computational units of the model, but SBPO reveals the relative independence of a regional drainage system at the surface level. SBPO can provide convenience and a basis for such work as urban LID development and non-point source pollution control.
Krebs et al. [17] conducted perturbations in spatial resolution through sewer network truncation, which showed that the runoff volume was mostly unaffected by resolution perturbations. This conclusion is the same as our research results, but from the perspective of network topology, our study reveals that the root of consistency of discharge flow volume is the relative independence of water exchange in a drainage network system. In other words, we still emphasize the importance of elaborate network data for urban hydrological analysis. This study shows that the runoff generation area controlled by the outfall determines the final water volume of the outfall. For the flow-producing area without drainage network data, subjectively coupling the flow-producing area to a main pipe node may have a non-negligible negative impact on the calculation results. It is easy to reason that SBPO is the simplified upper limit of the subcatchment area in terms of focusing on the water volume of the drainage system outlet. That is to say, if one only focuses on the amount of water flowing out of the drainage system, expect to optimize the network as much as possible, and expand the area of the subcatchment to save calculation costs, then the area controlled by the nodes with the same information of the drainage ports is the largest subcatchment one can obtain. This can offer a calculation method and working idea for river water pollution treatment or capacity planning as well as upgrading of sewage plants in which the discharge of the outfall is regarded as the lateral inflow
In the process of modeling subcatchments based on potential outfalls, a relatively independent network confluence process is actually treated as a systematic behavior. Although the consistency of outfall water volume can be guaranteed, large subcatchments will enlarge the peak value of the flow process [17]. Therefore, in the urban hydrological model, parameters reflecting the capacity of the drainage network should be added to the subcatchment area to influence the flow allocation process [41]. In order to ease the peak flow, the storage pool is applied in this study to adjust the discharge process of the subcatchment. After calibrating, it was discovered that a buffer parameter of the storage can always be found; thus, that the outfall flow of the subcatchment can be properly fitted under various rainfall scenarios. We think that this can reflect the role of the drainage network system in the area to some extent. As for the internal relationship between drainage network parameters affecting the flow distribution process and the attributes such as pipe length, density, volume, etc., this needs to be further studied, with discussions from urban hydrology researchers. The SBPO approach assumes that the drainage network routing plays a decisive role in runoff conveying. Therefore, the applicability of this method in urban areas with steep slopes needs to be further studied.
6. Conclusions
In this study, we put forward a method to sort out the topological relationship of a complex underground drainage network in urban areas, discussed the common topological errors of urban drainage network data and explained the basic principles that should be obeyed for correct drainage network data. On the basis of correct drainage network topology, we proposed a method of drainage network node information labeling based on potential outfall, clustered the complex and chaotic drainage nodes, and explained the branchpoint as the key factor to produce different outfall information. Moreover, we clearly defined the topological structure of the branchpoint and analyzed the water distribution process at the branchpoint by a hydrodynamic method. Combined with the block image, we divided subcatchments with the same potential outfall control information, established the dynamic water exchange relationship between these subcatchments, and investigated the outfall flow of the study area. The results showed that:
- The point-line relationship of the drainage network system is generalized to a directed graph, and the topological relationship of the drainage network can be quickly and effectively sorted into the DAG diagram of the outfall leading to the river or sewage by changing and correcting the partial structures such as “ALL-DOWN”, “ALL-UP” and “CYCLE” defined by the in-out degree. This can greatly simplify the difficulty of sorting out the intricate underground drainage network data in urban areas.
- By tracing the network upstream from the outfall with the correct representation of the flow direction, the researchers can retrieve the potential outfall at each node of the network system. The relative independence of the drainage network system can be explained by clustering the drainage network system from this perspective. The branchpoint points defined by the potential outfall information are the key to water exchange between subcatchment areas and the keynote of overflow analysis in the combined sewer area.
- The SBPO modeling method is highly consistent with the SWMM of a high-resolution drainage network in terms of drainage outfall volume. Under the SBPO method, the time of computing the peak discharge and discharge duration can significantly reduce with the buffer effect of the storage on the drainage network system.
In the future, people can sort out the correct network topology relationship to divide the control area of different outfalls and clarify the response result of the outfall to rainfall. Urban flood control and drainage, overflow pollution, river water level and water quality control can be more quickly estimated by SBPO. Urban underground drainage network reconstruction can also effectively affect the water transfer process of the existing drainage network system by increasing or decreasing the branchpoints.
Author Contributions
X.H., H.W. and J.C. collected and processed the data. H.R, S.L. and M.L. proposed the method and analyzed the results. H.R. and H.Z. wrote the manuscript. All authors have read and agreed to the published version of the manuscript.
Funding
This research was funded by Beijing Municipal Science and Technology Project and the National Key Research and Development Program (Z201100008220005, 2016YFC0803107, 2016YFC0803109).
Data Availability Statement
Participants of this study did not agree for their data to be shared publicly; thus, supporting data are not available.
Conflicts of Interest
The authors declare no conflict of interest.
Appendix A

Table A1.
Model parameter set.
| Parameter Set | SPBO | SWMM | ||
|---|---|---|---|---|
| Ruoff-generation | Sub-catchment | Area, Width, Slope, Imperv, N-inperv, N-perv, Dstore-Imperv, Dstore-Perv, OUTLET | ||
| Runoff-conveying | Drainage Network | Faraway Branchpoint | Near Branchpoint | Node: Invert EI MAX. Depth Initial Depth Surcharge Depth Ponded Area |
| Topological information: Inlet Node, Outlet Node | Node: Invert EI MAX. Depth Initial Depth Surcharge Depth Ponded Area | |||
| Conduit: Inlet Node Outlet Node Shape MAX. depth Length Roughless InletOffset OutletOffset InitialFlow | Conduit: Inlet Node Outlet Node Shape MAX. depth Length Roughless InletOffset OutletOffset InitialFlow | |||
References
- Allen, M.R.; Ingram, W.J. Constraints on Future Changes in Climate and the Hydrologic Cycle. Nature 2002, 419, 228–232. [Google Scholar] [CrossRef] [PubMed]
- Kharin, V.V.; Zwiers, F.W.; Zhang, X.; Wehner, M. Changes in Temperature and Precipitation Extremes in the CMIP5 Ensemble. Clim. Change 2013, 119, 345–357. [Google Scholar] [CrossRef]
- Zhang, J.; Wang, Y.; He, R.; Hu, Q.; Song, X. Discussion on the urban flood and waterlogging and causes analysis in China. Adv. Water Sci. 2016, 27, 485–491. [Google Scholar] [CrossRef]
- Xu, Z.; Chen, H.; Ren, M.; Cheng, T. Progress on disaster mechanism and risk assessment of urban flood/waterlogging disasters in China. Adv. Water Sci. 2020, 31, 713–724. [Google Scholar] [CrossRef]
- Ganeshan, M.; Murtugudde, R.; Imhoff, M.L. A Multi-City Analysis of the UHI-Influence on Warm Season Rainfall. Urban Clim. 2013, 6, 1–23. [Google Scholar] [CrossRef]
- Kaufmann, R.K.; Seto, K.C.; Schneider, A.; Liu, Z.; Zhou, L.; Wang, W. Climate Response to Rapid Urban Growth: Evidence of a Human-Induced Precipitation Deficit. J. Clim. 2007, 20, 2299–2306. [Google Scholar] [CrossRef]
- Shepherd, J.M.; Burian, S.J. Detection of Urban-Induced Rainfall Anomalies in a Major Coastal City. Earth Interact. 2003, 7, 1–17. [Google Scholar] [CrossRef]
- Bounoua, L.; Zhang, P.; Mostovoy, G.; Thome, K.; Masek, J.; Imhoff, M.; Shepherd, M.; Quattrochi, D.; Santanello, J.; Silva, J.; et al. Impact of Urbanization on US Surface Climate. Environ. Res. Lett. 2015, 10, 084010. [Google Scholar] [CrossRef] [Green Version]
- Shao, W.; Su, X.; Lu, J.; Liu, J.; Yang, Z.; Cao, Y.; Yang, Z.; Wang, K. The Application of Big Data in the Analysis of the Impact of Urban Floods: A Case Study of Qianshan River Basin. J. Phys. Conf. Ser. 2021, 1955, 012061. [Google Scholar] [CrossRef]
- Su, X.; Shao, W.; Liu, J.; Jiang, Y.; Wang, K. Dynamic Assessment of the Impact of Flood Disaster on Economy and Population under Extreme Rainstorm Events. Remote Sens. 2021, 13, 3924. [Google Scholar] [CrossRef]
- Xu, Z.X.; Ye, C.L. Simulation of urban flooding/waterlogging processes:Principle, models and prospects. J. Hydraul. Eng. 2021, 52, 381–392. [Google Scholar] [CrossRef]
- Zhou, J.; Liu, Y.; Guo, H.; He, D. Combining the SWAT Model with Sequential Uncertainty Fitting Algorithm for Streamflow Prediction and Uncertainty Analysis for the Lake Dianchi Basin, China: Swat with Sufi-2 for Streamflow Prediction and Uncertainty Analysis. Hydrol. Process. 2014, 28, 521–533. [Google Scholar] [CrossRef]
- Rahman, K.U.; Shang, S.; Shahid, M.; Wen, Y. Hydrological Evaluation of Merged Satellite Precipitation Datasets for Streamflow Simulation Using SWAT: A Case Study of Potohar Plateau, Pakistan. J. Hydrol. 2020, 587, 125040. [Google Scholar] [CrossRef]
- Leng, M.; Yu, Y.; Wang, S.; Zhang, Z. Simulating the Hydrological Processes of a Meso-Scale Watershed on the Loess Plateau, China. Water 2020, 12, 878. [Google Scholar] [CrossRef] [Green Version]
- Zhang, H.; Wang, B.; Liu, D.L.; Zhang, M.; Leslie, L.M.; Yu, Q. Using an Improved SWAT Model to Simulate Hydrological Responses to Land Use Change: A Case Study of a Catchment in Tropical Australia. J. Hydrol. 2020, 585, 124822. [Google Scholar] [CrossRef]
- GironAs, J.; Roesner, L.A.; Rossman, L.A.; Davis, J. A New Applications Manual for the Storm Water Management Model (SWMM). Environ. Model. Softw. 2010, 25, 813–814. [Google Scholar] [CrossRef]
- Krebs, G.; Kokkonen, T.; Valtanen, M.; Setälä, H.; Koivusalo, H. Spatial Resolution Considerations for Urban Hydrological Modelling. J. Hydrol. 2014, 512, 482–497. [Google Scholar] [CrossRef]
- Babaei, S.; Ghazavi, R.; Erfanian, M. Urban Flood Simulation and Prioritization of Critical Urban Sub-Catchments Using SWMM Model and PROMETHEE II Approach. Phys. Chem. Earth Parts A/B/C 2018, 105, 3–11. [Google Scholar] [CrossRef]
- Cheng, T.; Xu, Z.; Hong, S.; Song, S. Flood Risk Zoning by Using 2D Hydrodynamic Modeling: A Case Study in Jinan City. Math. Probl. Eng. 2017, 2017, 5659197. [Google Scholar] [CrossRef] [Green Version]
- Sidek, L.M.; Jaafar, A.S.; Majid, W.H.A.W.A.; Basri, H.; Marufuzzaman, M.; Fared, M.M.; Moon, W.C. High-Resolution Hydrological-Hydraulic Modeling of Urban Floods Using InfoWorks ICM. Sustainability 2021, 13, 10259. [Google Scholar] [CrossRef]
- Zhang, H.; Wu, W.; Hu, C.; Hu, C.; Li, M.; Hao, X.; Liu, S. A Distributed Hydrodynamic Model for Urban Storm Flood Risk Assessment. J. Hydrol. 2021, 600, 126513. [Google Scholar] [CrossRef]
- Guo, J. Urban Flood Mitigation and Stormwater Management; CRC Press: Boca Raton, FL, USA, 2017; p. 589. ISBN 978-1-315-26991-7. [Google Scholar]
- Wang, X.; Xia, J.; Dong, B.; Hou, J.; Li, Q. Simulation of urban flood using the SWMM with the hierarchical catchment partition method. Adv. Water Sci. 2022, 33, 196–207. [Google Scholar] [CrossRef]
- Duke, G.D.; Kienzle, S.W.; Johnson, D.L.; Byrne, J.M. Incorporating Ancillary Data to Refine Anthropogenically Modified Overland Flow Paths. Hydrol. Process. 2006, 20, 1827–1843. [Google Scholar] [CrossRef]
- Kayembe, A.; Mitchell, C.P.J. Determination of Subcatchment and Watershed Boundaries in a Complex and Highly Urbanized Landscape. Hydrol. Process. 2018, 32, 2845–2855. [Google Scholar] [CrossRef]
- Yang, Q.; Dai, Q.; Han, D.; Zhu, X.; Zhang, S. Impact of the Storm Sewer Network Complexity on Flood Simulations According to the Stroke Scaling Method. Water 2018, 10, 645. [Google Scholar] [CrossRef] [Green Version]
- Miller, J.D.; Kim, H.; Kjeldsen, T.R.; Packman, J.; Grebby, S.; Dearden, R. Assessing the Impact of Urbanization on Storm Runoff in a Peri-Urban Catchment Using Historical Change in Impervious Cover. J. Hydrol. 2014, 515, 59–70. [Google Scholar] [CrossRef] [Green Version]
- Hagberg, A.A.; Schult, D.A.; Swart, P.J. Exploring Network Structure, Dynamics, and Function Using Network X; Los Alamos National Lab. (LANL): Los Alamos, NM, USA, 2008; p. 5. [Google Scholar]
- Krueger, E.; Klinkhamer, C.; Urich, C.; Zhan, X.; Rao, P.S.C. Generic Patterns in the Evolution of Urban Water Networks: Evidence from a Large Asian City. Phys. Rev. E 2017, 95, 032312. [Google Scholar] [CrossRef] [Green Version]
- Yazdani, A.; Jeffrey, P. Complex Network Analysis of Water Distribution Systems. Chaos 2011, 21, 016111. [Google Scholar] [CrossRef] [Green Version]
- Strahler, A.N. Quantitative Analysis of Watershed Geomorphology. Trans. Am. Geophys. Union 1957, 38, 913–920. [Google Scholar] [CrossRef] [Green Version]
- Sitzenfrei, R. Stochastic Generation of Urban Water Systems for Case Study Analysis; Innsbruck University Press: Innsbruck, Austria, 2012; p. 231. [Google Scholar]
- Xu, G.; Lian, J. Changes of the entropy, the entropy production and the rate of energy dissipation in river adjustment. Adv. Water Sci. 2004, 15, 1–5. [Google Scholar] [CrossRef]
- Reply of The State Council on the Implementation Plan of New Urbanization during the 14th Five-Year Plan Period; Bulletin of The State Council of the People’s Republic of China: Beijing, China, 2022; p. 23.
- McDonnell, B.; Ratliff, K.; Tryby, M.; Wu, J.; Mullapudi, A. PySWMM: The Python Interface to Stormwater Management Model (SWMM). J. Open Source Softw. 2020, 5, 2292. [Google Scholar] [CrossRef]
- Arnell, V.; Harremoës, P.; Jensen, M.; Johansen, N.B.; Niemczynowicz, J. Review of Rainfall Data Application for Design and Analysis. Water Sci. Technol. 1984, 16, 1–45. [Google Scholar] [CrossRef]
- Madsen, H.; Mikkelsen, P.S.; Rosbjerg, D.; Harremoës, P. Regional Estimation of Rainfall Intensity-Duration-Frequency Curves Using Generalized Least Squares Regression of Partial Duration Series Statistics: Regional Estimation of Rainfall Idf Curves. Water Resour. Res. 2002, 38, 21-1–21-11. [Google Scholar] [CrossRef]
- Park, S.Y.; Lee, K.W.; Park, I.H.; Ha, S.R. Effect of the Aggregation Level of Surface Runoff Fields and Sewer Network for a SWMM Simulation. Desalination 2008, 226, 328–337. [Google Scholar] [CrossRef]
- McGrath, G.; Kaeseberg, T.; Reyes Silva, J.D.; Jawitz, J.W.; Blumensaat, F.; Borchardt, D.; Mellander, P.; Paik, K.; Krebs, P.; Rao, P.S.C. Network Topology and Rainfall Controls on the Variability of Combined Sewer Overflows and Loads. Water Resour. Res. 2019, 55, 9578–9591. [Google Scholar] [CrossRef]
- Cleveland, T.G.; Luong, T.; Thompson, D.B. Water Subdivision for Modeling. In Proceedings of the World Environmental and Water Resources Congress 2009, Kansas City, MI, USA, 12 May 2009; pp. 1–10. [Google Scholar]
- Lungariya, P.; Katharotiya, N.; Mehta, D.; Waikhom, S. Analysis of Continuous Water Distribution in Surat City Using Epanet: A Case Study. GRD J. Eng. Recent Adv. Civ. Eng. Glob. Sustain. 2016, 2455–5703. [Google Scholar]
Figure 1.
Overall research framework.

Figure 2.
Suspicious topological structure in drainage network. (a) All-up; (b) ALL-down; (c) Cycle.
Figure 2.
Suspicious topological structure in drainage network. (a) All-up; (b) ALL-down; (c) Cycle.

Figure 3.
Pipeline with flow direction opposite to slope. Where, A and B represent nodes; a, b and c represent pipeline.
Figure 3.
Pipeline with flow direction opposite to slope. Where, A and B represent nodes; a, b and c represent pipeline.

Figure 4.
Subcatchment based on potential outfall.

Figure 5.
(a) Two pipelines with a diameter of 1 m. The inlet offset of one bifurcation pipe is constantly raised. (b) The diameter of one pipeline is 1 m, and the diameter of the other pipeline is increased above it.
Figure 5.
(a) Two pipelines with a diameter of 1 m. The inlet offset of one bifurcation pipe is constantly raised. (b) The diameter of one pipeline is 1 m, and the diameter of the other pipeline is increased above it.

Figure 6.
Model framework comparison.

Figure 7.
Location of the study area and related display. (a) Study area; (b) DEM; (c) land use; (d) distribution of network.
Figure 7.
Location of the study area and related display. (a) Study area; (b) DEM; (c) land use; (d) distribution of network.

Figure 8.
Subcatchment based on potential outfall in Maxiangou catchment.

Figure 9.
Some important branchpoints.

Figure 10.
Routing comparison. (a) SBPO routing; (b) SWMM drainage network routing.

Figure 11.
Outfall flow indicators. (a) Total discharge volume; (b) peak flow; (c) discharge Time.

Figure 12.
“688” outfall flow rate comparison.


Figure 13.
Branchpoint to outfall pipelines side profile. (a) branchpoint”2160” to outfall “76”; (b) branchpoint”2160” to outfall “1214”.
Figure 13.
Branchpoint to outfall pipelines side profile. (a) branchpoint”2160” to outfall “76”; (b) branchpoint”2160” to outfall “1214”.


Table 1.
Designed rainstorm parameters.
| Design Frequency (a) | The Total Rainfall (mm) | The Biggest Rain Density (mm/5 min) |
|---|---|---|
| 1 | 24.953 | 5.805 |
| 2 | 33.778 | 7.858 |
| 3 | 38.940 | 9.059 |
| 5 | 45.442 | 10.571 |
| 10 | 54.267 | 12.624 |
| 20 | 63.091 | 14.677 |
| 30 | 68.252 | 15.878 |
| 50 | 74.755 | 17.39 |
| 100 | 83.579 | 19.443 |
Table 2.
SBPO attributes.
| Potential Outfall | Area (ha) | Length of Conduits (m) | Number of Nodes | Number of Potential Outfalls | Combined System |
|---|---|---|---|---|---|
| (688) | 143.5 | 19,697.853 | 1146 | 1 | YES |
| (76, 1214) | 103.9 | 14,906.404 | 1020 | 2 | YES |
| (2998) | 20.01 | 2775.734 | 86 | 1 | YES |
| (688, 860, 4193) | 19.04 | 1061.384 | 69 | 3 | YES |
| (4916) | 16.13 | 2223.359 | 164 | 1 | NO |
| (51) | 15.08 | 3090.572 | 235 | 1 | NO |
| (76, 688, 1214) | 14.82 | 2725.267 | 219 | 3 | YES |
| (4015) | 11.02 | 1117.715 | 95 | 1 | NO |
| (50) | 7.202 | 994.165 | 122 | 1 | NO |
| (1214) | 5.414 | 800.299 | 55 | 1 | YES |
| (4016) | 5.067 | 783.716 | 32 | 1 | NO |
| (688, 3284) | 3.903 | 49.525 | 59 | 2 | YES |
| (4017) | 3.815 | 563.841 | 26 | 1 | NO |
| (1094) | 1.681 | 656.529 | 16 | 1 | NO |
| (4018) | 1.153 | 145.865 | 14 | 1 | NO |
| (4020) | 0.897 | 81.848 | 9 | 1 | NO |
Table 3.
The model computing time comparison.
| Computing Time (s) | Design Frequency | |||||||||
|---|---|---|---|---|---|---|---|---|---|---|
| 1a | 2a | 3a | 5a | 10a | 20a | 30a | 50a | 100a | MEAN | |
| SWMM | 273 | 280 | 288 | 290 | 291 | 296 | 290 | 302 | 311 | 291.22 |
| SBPO | 62 | 60 | 65 | 78 | 80 | 86 | 91 | 93 | 98 | 79.22 |
| Improve Efficiency (%) | 77.29 | 78.57 | 77.43 | 73.10 | 72.51 | 70.95 | 68.62 | 69.21 | 68.49 | 72.91 |
Publisher’s Note: MDPI stays neutral with regard to jurisdictional claims in published maps and institutional affiliations. |
© 2022 by the authors. Licensee MDPI, Basel, Switzerland. This article is an open access article distributed under the terms and conditions of the Creative Commons Attribution (CC BY) license (https://creativecommons.org/licenses/by/4.0/).
Share and Cite
MDPI and ACS Style
Ren, H.; Liu, S.; Li, M.; Zhang, H.; Wang, H.; Hao, X.; Cui, J. Topological Analysis and Application of Urban Drainage Network. Water 2022, 14, 3732. https://doi.org/10.3390/w14223732
AMA Style
Ren H, Liu S, Li M, Zhang H, Wang H, Hao X, Cui J. Topological Analysis and Application of Urban Drainage Network. Water. 2022; 14(22):3732. https://doi.org/10.3390/w14223732
Chicago/Turabian StyleRen, Hancheng, Shu Liu, Min Li, Hongping Zhang, Huiying Wang, Xiaoli Hao, and Jie Cui. 2022. "Topological Analysis and Application of Urban Drainage Network" Water 14, no. 22: 3732. https://doi.org/10.3390/w14223732
Note that from the first issue of 2016, this journal uses article numbers instead of page numbers. See further details here.