
Spatiotemporal Distribution of Nitrous Oxide on the Northeastern Bering Sea Shelf
by
 , and
, and
Jiexia Zhang
1, 
Liyang Zhan
1,*,
Liqi Chen
1,
Haiyan Jin
2,
Man Wu
1,
Wangwang Ye
1 and
Jian Liu
1 1
Key Laboratory of Global Change and Marine Atmospheric Chemistry, Third Institute of Oceanography, Ministry of Natural Resources, Xiamen 361005, China
2
Key Laboratory of Marine Ecosystem Dynamics, Second Institute of Oceanography, Ministry of Natural Resources, Hangzhou 310012, China
*
Author to whom correspondence should be addressed.
Water 2022, 14(22), 3738; https://doi.org/10.3390/w14223738
Submission received: 17 October 2022
/
Revised: 10 November 2022
/
Accepted: 12 November 2022
/
Published: 17 November 2022
(This article belongs to the Special Issue Marine Atmospheric Chemistry)
Abstract
:Rapid warming and loss of sea ice in the Arctic Ocean could play an important role in the dissolution and emission of greenhouse gas nitrous oxide (N2O). We investigated dissolved N2O in spatiotemporal distribution on the northeastern Bering Sea shelf (NEBS) in the summer of 2012. The results showed that N2O concentrations were higher in the Chirikov Basin (mean ± SD, 14.8 ± 2.4 nmol/L) than in the south of St. Lawrence Island (mean ± SD, 17.7 ± 2.3 nmol/L). In the Chirikov Basin, N2O displayed a decreasing distribution pattern from west (~20.4 nmol/L) to east (~12.9 nmol/L). In the area south of St. Lawrence Island, N2O almost presented a two-layer structure, although it showed a vertically homogeneous distribution in the inner shelf. In the cold bottom water, the N2O was affected mainly by in situ production or sediment emission. Longer resident time may cause N2O accumulation in the cold bottom water. The calculated sea–air flux (−1.6~36.2 μmol/(m2·d)) indicates that the NEBS is an important potential source of atmospheric N2O and could play an important role in global oceanic N2O emission with intensifying global issues.
1. Introduction
N2O is one of the most important greenhouse gases in the atmospheric reactivity and radiative budget. Although N2O concentration in the atmosphere is low (ppb), its greenhouse effect is approximately 300 times greater than that of CO2 on a per molecular basis [1]. In addition, N2O is the dominant ozone-depleting substance in the 21st century [2]. At present, atmospheric N2O concentration is rising at a rate of 0.85 ± 0.03 ppb yr−1 [3], which will have an important impact on global climate change.
The ocean is a net source of atmospheric N2O and contributes approximately 22–25% of the total global emission [4,5]. Oceanic N2O production primarily involves microbial processes such as nitrification and denitrification. In nitrification, N2O production acts as a by-product. However, during the denitrification process, N2O acts as an intermediate production [6]. With the development of N2O surveys in the global ocean and the improvement in N2O analysis technology, N2O distribution [7,8,9], air–sea flux [5,10], and formation mechanism [11,12] are becoming better understood. However, N2O study in polar regions such as the Arctic Ocean is rarely attempted due to year-round sea ice cover (except in summer). Recently, the Arctic Ocean has been experiencing an unprecedented rate changing in warming [13], freshening [14], sea ice retreat [15], and ocean acidification [16] due to altered climate. These experienced changes have an important effect on the biogeochemical and physical processes of the Arctic Ocean, especially on the continental shelf. These processes would directly control the production and consumption of atmospheric climate–relative trace gases [17,18] including N2O [19].
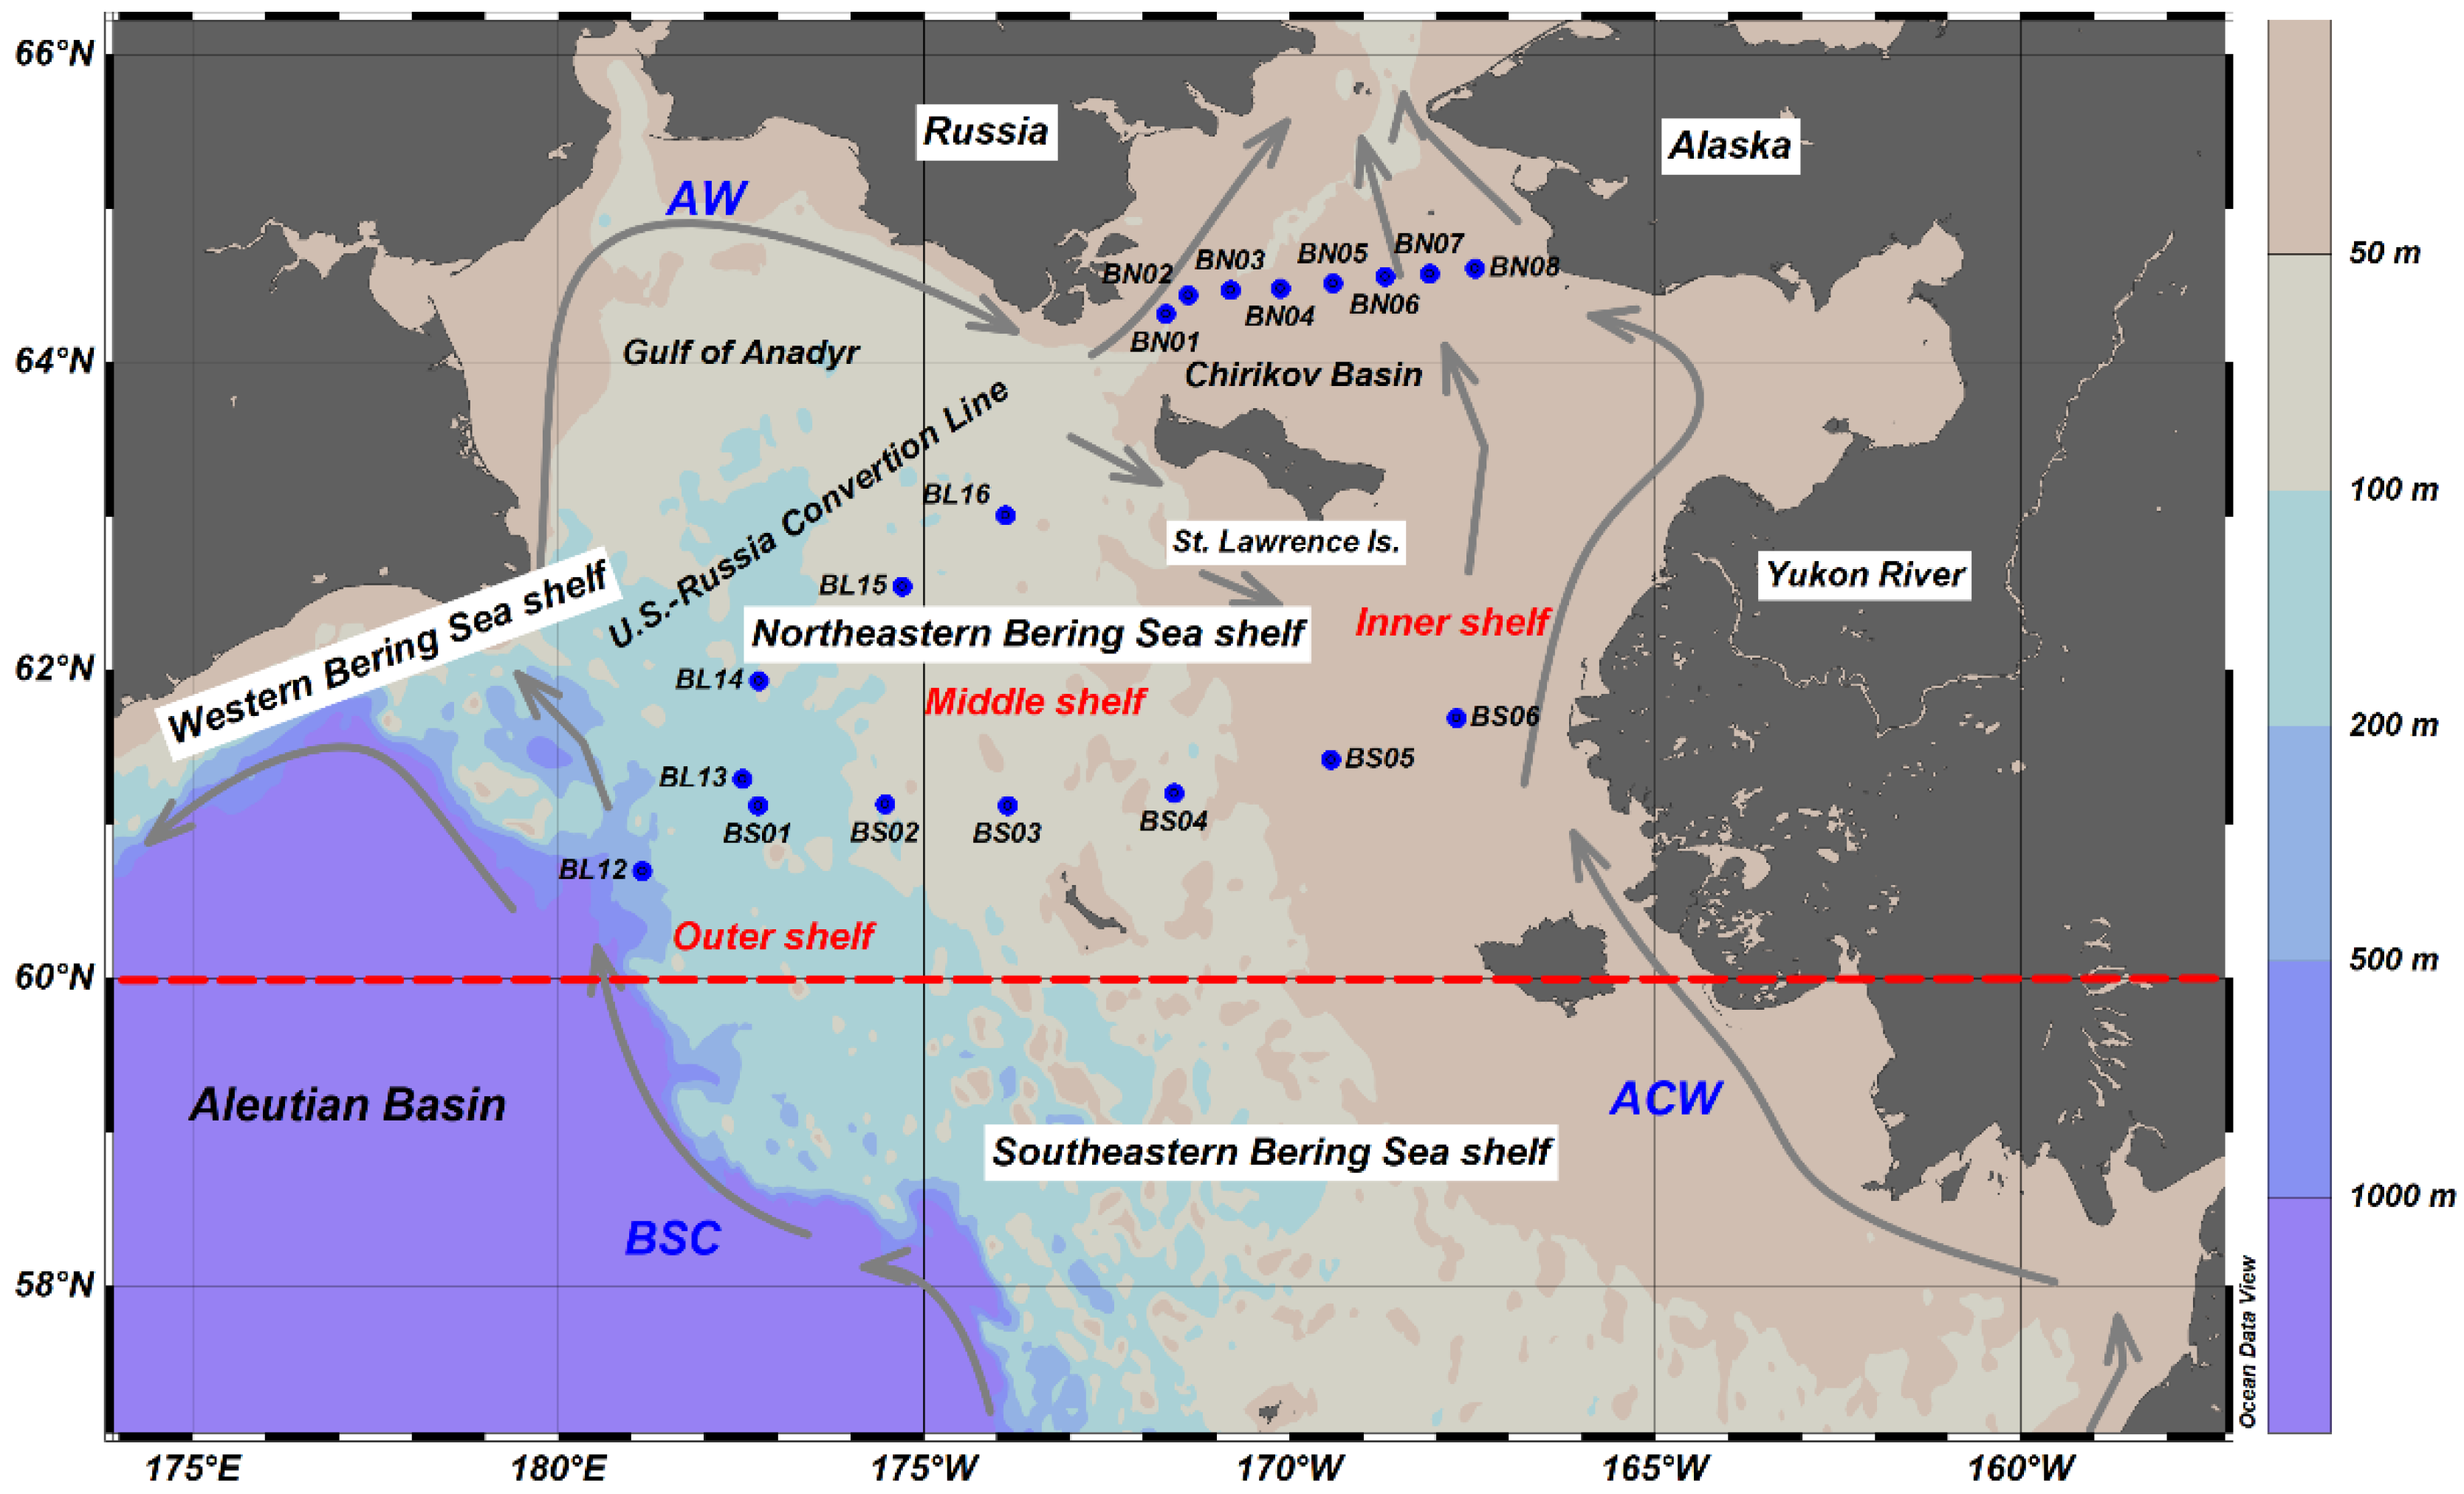
The eastern Bering Sea shelf is a marginal and high-productivity sea in high latitude [20]. Due to tidal influencing and the mean sea level difference between the Pacific and Arctic Oceans [21], the Bering Sea shelf becomes the route through which water from the Pacific Ocean enters into the Arctic Ocean. High-nutrient Pacific water flowing through the Bering Sea shelf and then into the Chukchi Sea would be modified due to active biochemical processes [22,23], which influence the productivity of the Chukchi Sea shelf and even of the whole Arctic ecosystem [24]. The hydrological characteristics of the eastern Bering Sea shelf are complex because influenced by topography, tides, and winds [25]. There are two main currents which take the Pacific water into the eastern Bering Sea shelf, forming three water masses (Figure 1). One is the Bering Slope Current (BSC) in the west [26], which is a northward branch flow with cool, high salinity water (>32.5) characteristics. This current continues through the Gulf of Anadyr, taking on the Anadyr water (AW), and then proceeds through the Anadyr Strait into the Chirikov Basin and the Arctic Ocean. The other current is the relatively weak Alaska Coastal Current (ACC) in the east, which is associated with the Aleutian North slope Current and with poor nutrients, warm temperature, and low salinity (<31.8). The Alaska Coastal Water (ACW) then continues through the Strait of Shpanberg into the western Arctic Ocean [25]. Although the mean flow in the Bering Sea shelf is from south to north, there is a weak current in the east from the Alaska coast in the upper layer of the shelf water, bringing the low-salinity waters to the relatively high salinity area of the northwest shelf [27]. A partly Anadyr current from the west flows along the south bank of St. Lawrence Island to form a narrower current flowing to the east [28]. This circulation pattern is typical in the summer, which causes most of the Bering Sea shelf water to flow northward into the Arctic Ocean, while the development of stratification allows the remaining water on the shelf to form a relatively isolated cold bottom water [25]. St. Lawrence Island divides this shelf into the Chirikov Basin in the north, Anadyr Strait in the west, and Shpanberg Strait in the east [29]. In the area south of St. Lawrence Island, three domains are defined on the basis of the water bottom depth: the inner (0–50 m), middle (50–100 m), and outer (100–200 m) shelf (Figure 1). When currents flow through the eastern Bering shelf, they form different features of water masses: high-nutrient Anadyr water (AW); warm, poor-nutrient Alaska Coastal Water (ACW); and Bering Shelf Water (BSW)) (Figure 1). Different hydrological environments will have different effects on N2O distribution. Therefore, understanding the spatiotemporal distribution of N2O on the complex NEBS is important for assessing the role of N2O in the Arctic Ocean.
The few extant studies on this topic show that the dissolved N2O in the surface water of the Arctic Ocean is variable and that under/over-saturations coexist. In general, the Arctic Ocean shelf is a source of N2O (110–181% saturate), and the Arctic Basin is an N2O sink (75–95% saturate) [19,30,31,32,33,34,35]. In the vertical distributions, N2O concentrations are low in the surface water and high in the bottom water in the shelf. This distribution pattern mainly results from the sediment remineralization of organic matter, which may produce N2O and release it into the overlying water [32,35]. As far as we know, N2O studies on the eastern Bering Sea shelf have been very limited and concentrated on a few stations or a narrow region [19,32]. There has been no report that has described the spatiotemporal variations in a wide region of the complex eastern Bering Sea shelf. In this study, we created a regional classification for the Eastern Bering Sea shelf based on the water masses and topography in order to observe the spatiotemporal variation in N2O distribution. Additionally, we calculated the air–sea flux of the N2O to evaluate the importance of N2O in the eastern Bering Sea shelf.
2. Materials and Methods
2.1. Study Area
The Bering Sea is almost equal in area to the Aleutian Basin (maximum depth 3500 m) and the continental shelves (<200 m), which consist of the broad (>500 km) shelf in the east and the narrow shelf in the west [25]. Stabeno and Farley [36] further partition the eastern Bering Sea shelf into northern and southern shelves at ~60° N (Figure 1). In order to better understand the spatiotemporal features of N2O on the northeastern Bering Sea shelf (NEBS), we divided the northeastern Bering Sea shelf into the Chirikov Basin (BN01-BN08) and the area to the south of St. Lawrence Island. On the basis of the oceanographic fronts, we subdivided the area to the south of St. Lawrence Island into an inner (<50 m depth) (BM05, BS06, BS05), middle (50–100 m depth) (BS02, BS03, BS04, BL14, BL15, BL16), and outer (>100 m depth) (BL12, BL13, BS01) shelf. The sampling locations are shown in Figure 1 and Table 1.
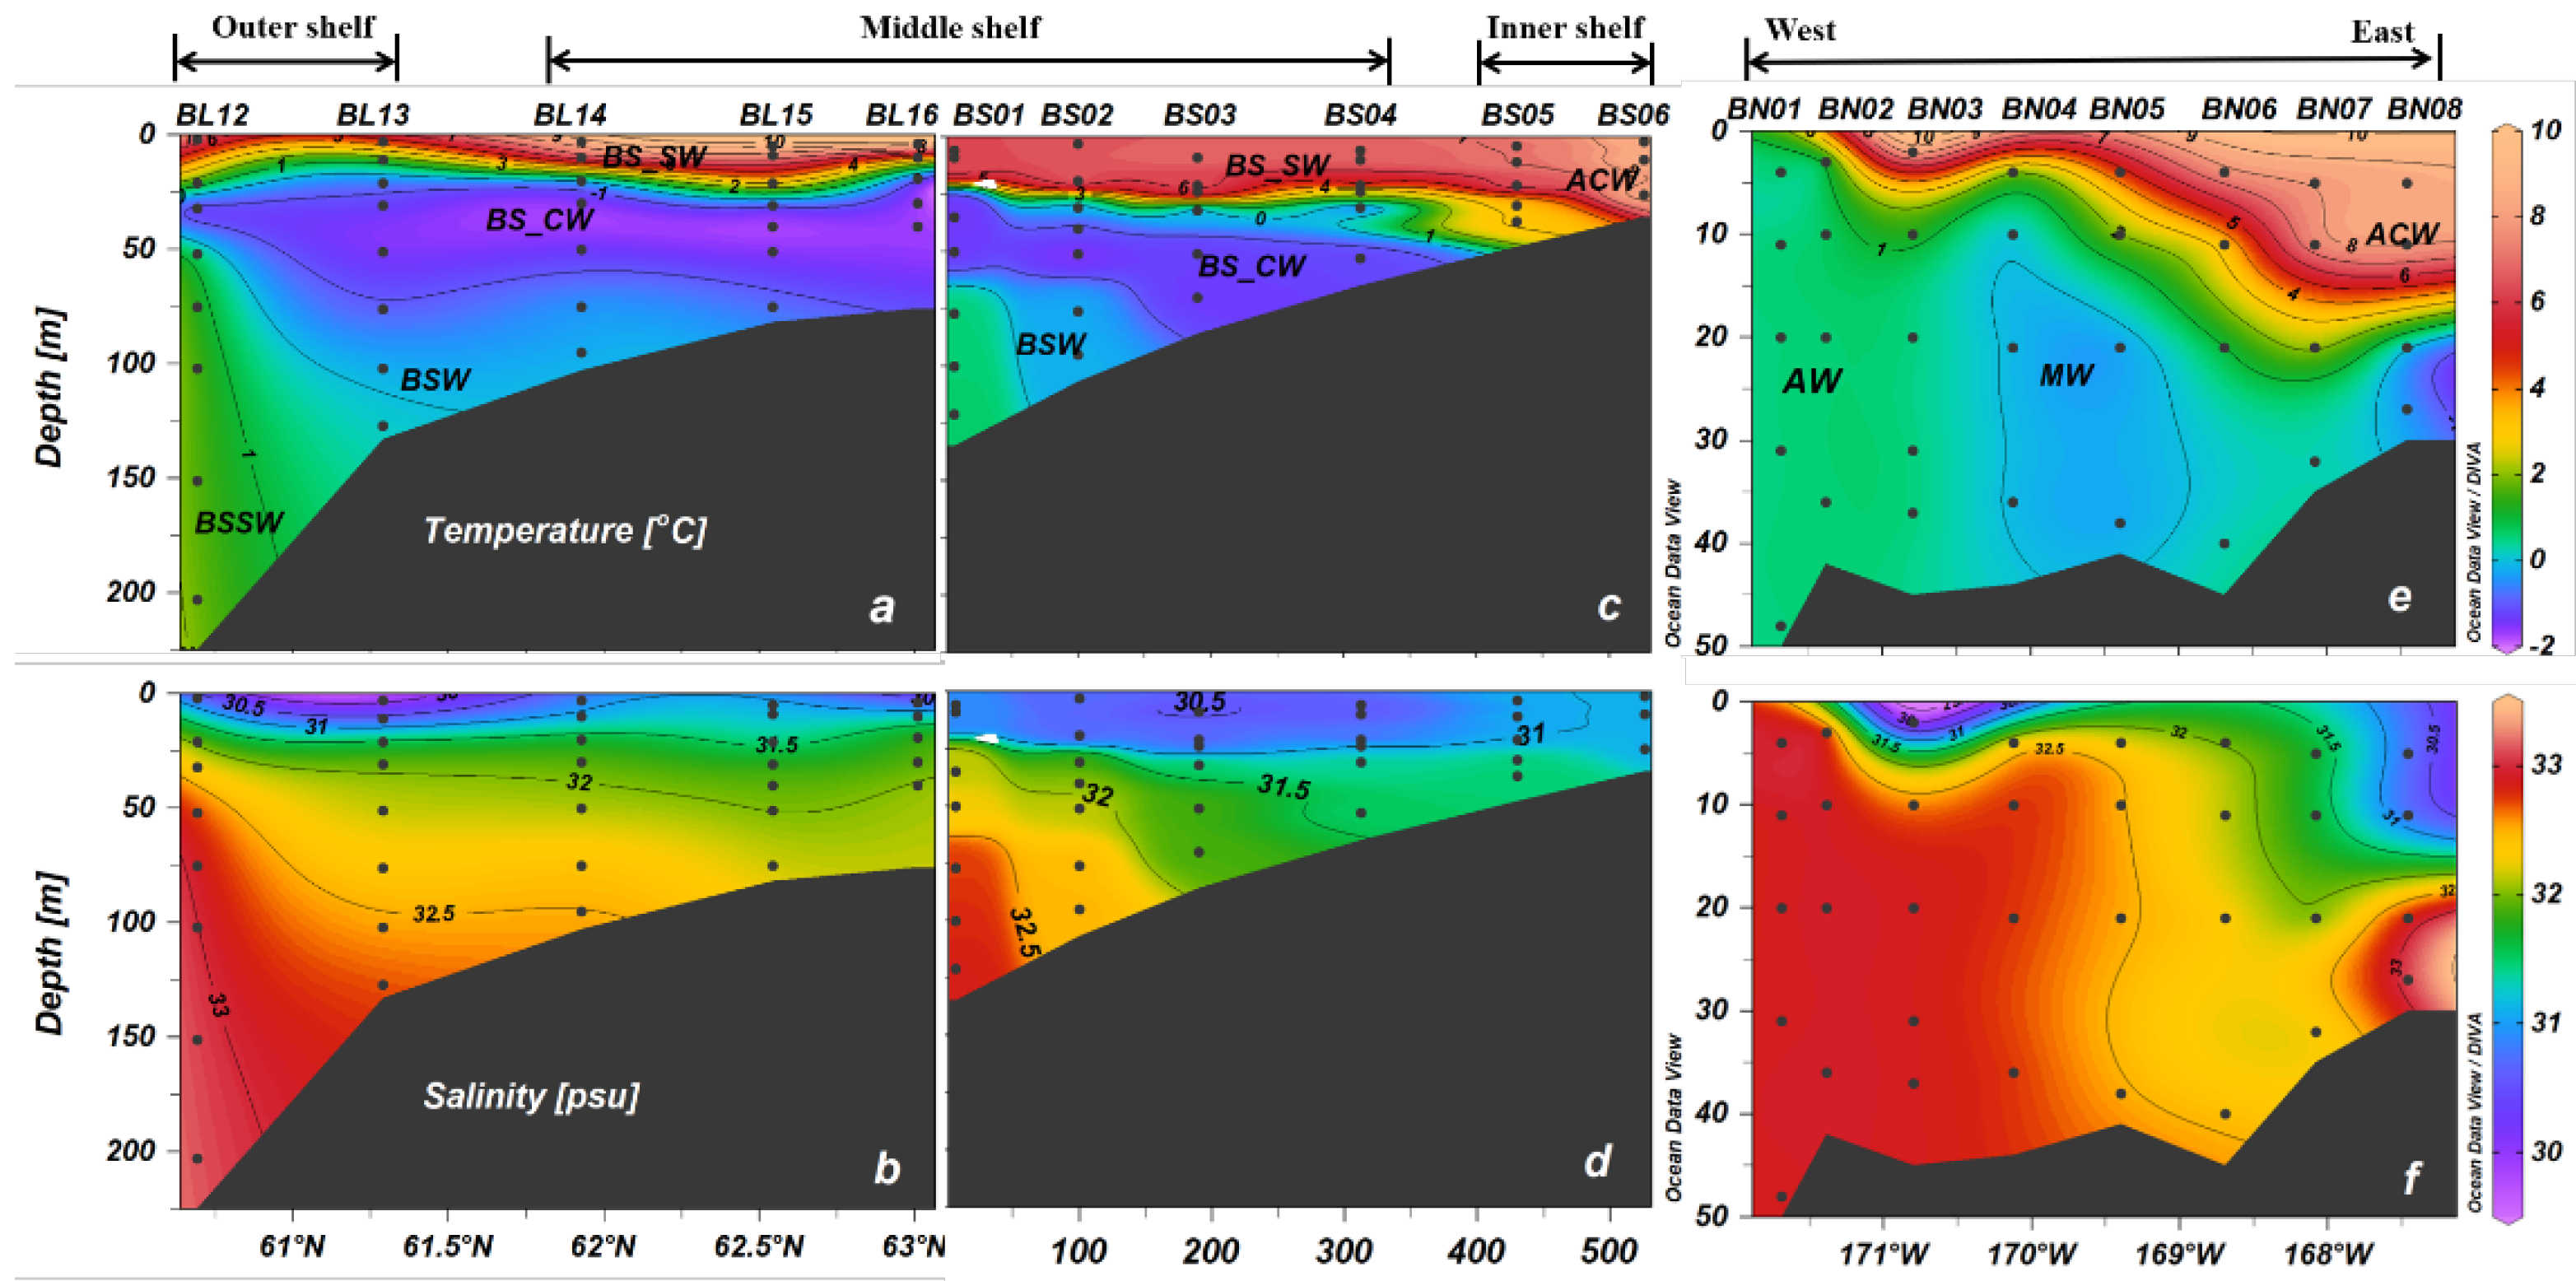
Figure 2 shows the vertical distribution of temperature and salinity of three sections (BL, BS, and BN). Five types of water masses are identified in the area to the south of St. Lawrence Island: Bering Shelf Surface Water (BS_SW), Bering Shelf Cold Water (BS_CW), Alaska Coastal Water (ACW), and Bering Slope Current Water (BSCW). Three types of water masses are identified in the Chirikov Basin: Anadyr Water (AW), ACW, and Mixed Water from AW and ACW.
2.2. Seawater Sampling
Seawater samples were obtained along the NEBS during the summer of 2012 during a cruise of the R/V “Xuelong”: Fifth Chinese National Arctic Research Expedition (CHINARE2012). Sea water samples for N2O, DO, and nutrients were taken from 10 L Niskin bottles mounted on a rosette water sampler, attached to a Sea-Bird Electronics conductivity (SBE-911 Plus) conductivity-temperature-depth system, which collected the pressure, temperature, and salinity. Tygon tubing was attached to the Niskin bottle, and a 250 mL biochemical oxygen demand bottle was filled and overflowed with seawater at least 2–3 times volume; then the tube was slowly removed from the bottle. One-hundred μL saturated mercuric chloride was added to inhibit biological activity. The samples were sealed with greased ground-glass stoppers and then fastened with a clip and stored at a 4 °C room until analysis in the land lab.
2.3. Analysis
The N2O subsamples were transferred from the 250 mL sampling bottle into a 20 mL headspace vial. Note that when performing this experiment, no bubbles should be generated during the operation. Then ~10 mL of high-purity nitrogen (99.999%) was injected into the 20 mL headspace vial to replace the sample water. The subsamples were then analyzed using the static headspace equilibration method [37] and gas chromatography (GC2010) equipped with an electron capture detector. The precision of this method is 2%.
The DO samples were immediately analyzed onboard using the Winkler method of direct spectrophotometry [38]. The precision value was 0.20 μmol/L.
The nutrients dataset was provided by the second institute of oceanography, MNR.
The nutrients were analyzed onboard using a continuous flow analyzer Skarlar (Holland, Breda). The ammonium (NH4+) was measured using the spectrometric method. The limit of detection for NH4+, NO3− NO2−, and PO43− was 0.5 μmol/L, 0.1 μmol/L, 0.1 μmol/L, and 0.03 μmol/L, respectively. [39].
2.4. Calculation
2.4.1. Saturation and Excess N2O (ΔN2O)
The saturation and excess of the N2O (ΔN2O) was calculated with the following equations:
where [N2O]eq was the equilibrium concentration of N2O between the seawater and the atmosphere. The [N2O]eq was calculated using the solubility of N2O at the seawater temperature and salinity [40] and the atmospheric mixing ratio of ~325.5 nmol/mol on 15 July 2012 (https://www.esrl.noaa.gov/gmd/hats/combined/N2O.html).
N2O saturation = [N2O]measured/[N2O]eq
ΔN2O = [N2O]measured − [N2O]eq
2.4.2. Apparent Oxygen Utilization (AOU)
The AOU was calculated as the difference between the dissolved oxygen concentration measured ([O2]measured) in the sample, and the equilibrium concentration ([O2]eq) was calculated at equilibrium with the atmosphere given water mass temperature and salinity [41]. [O2]measured is the measured concentration of O2 in the seawater. The AOU was calculated as in the following Equation (3):
AOU = [O2]eq − [O2]measured
2.4.3. N**
N** is a parameter to estimate the relative excess or deficit of fixed nitrogen relative to phosphate. A negative N** value indicates a deficit of dissolved inorganic nitrogen (due to denitrification/anammox), and a positive value indicates N fixation [42]. N** was calculated as in the following Equation (4) [43]:
N** = 0.87 × ([NO3−] + [NO2−] + [NH4+] − 16 × [PO43−] + 2.9)
2.4.4. Sea–Air Flux
The sea–air flux densities (F in µmol/(m2·d)) of the N2O were calculated with the measured N2O concentrations in the surface water (0–10 m), [N2O]measured, [N2O]eq, and the gas transfer velocity (kw in cm/h) from [44]:
F = kw ([N2O]surface − [N2O]eq)
k = 0.251 (u10)2 (ScN2O/660)−0.5
The k is gas exchange coefficient and is calculated as a function of 10 m wind speed (u10) and Schmidt number (ScN2O). The value u10 was obtained from the ship’s anemometer. The ScN2O for N2O and was computed using empirical equations for the kinematic viscosity of seawater and the diffusion coefficient of the N2O in the water.
3. Results
3.1. N2O in the Surface Water
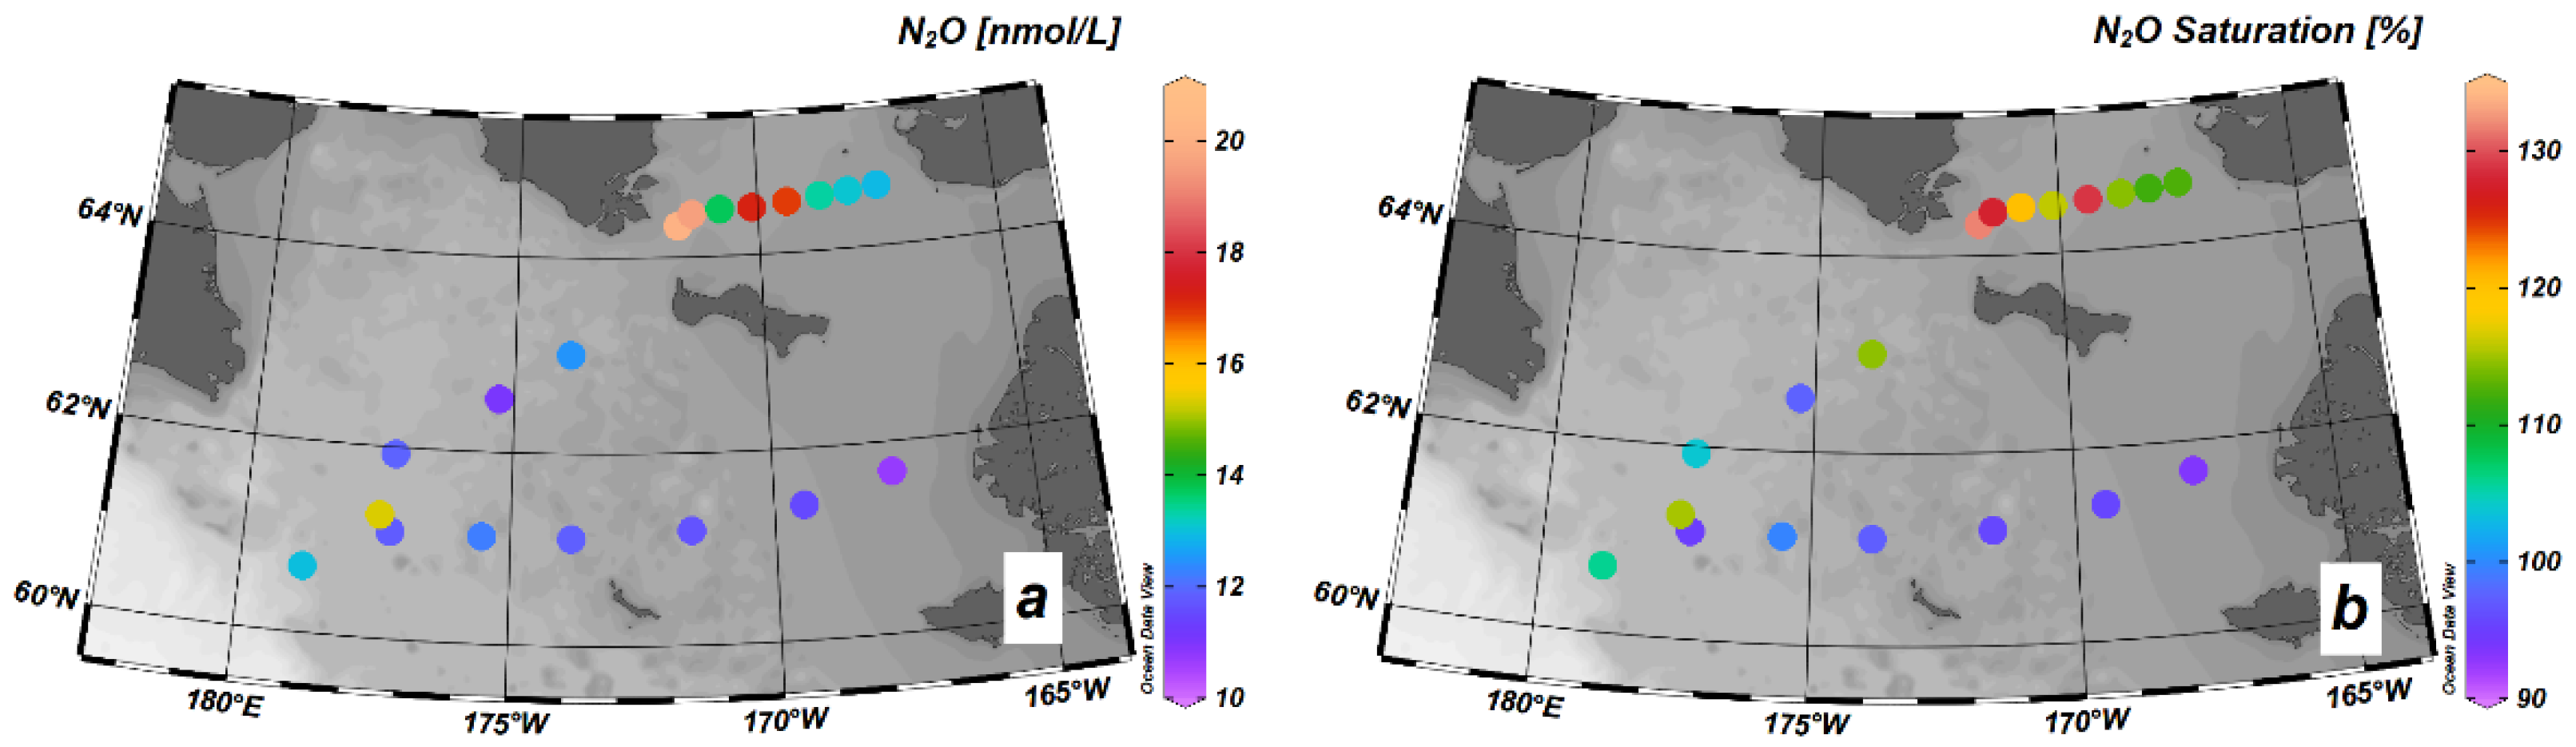
On the northeastern Bering Sea shelf, N2O concentrations were variable (10.7–20.1 nmol/L) with an under/oversaturation (93–132%) coexistence in the surface layer (<5 m depth) (See Figure 3 and Table 1). Spatially, N2O distribution differences between the area south of St. Lawrence Island and the Chirikov Basin were observed: (1) Both N2O concentrations and saturations in the area to the south of St. Lawrance Island (10.7 to 15.3 nmol/L, 93–115%) were lower than the Chirikov Basin (12.9–20.1 nmol/L, 112–132%); (2) N2O concentrations showed little variation, and saturations were almost equal with respect to the atmosphere (mean ± SD, 102 ± 8%) in the area south of St. Lawrence Island; (3) A large east-west gradient of N2O was found in the Chirikov Basin. The highest N2O concentration was found in the west, and the lowest value of N2O was found in the east.
3.2. The Vertical Distribution of N2O
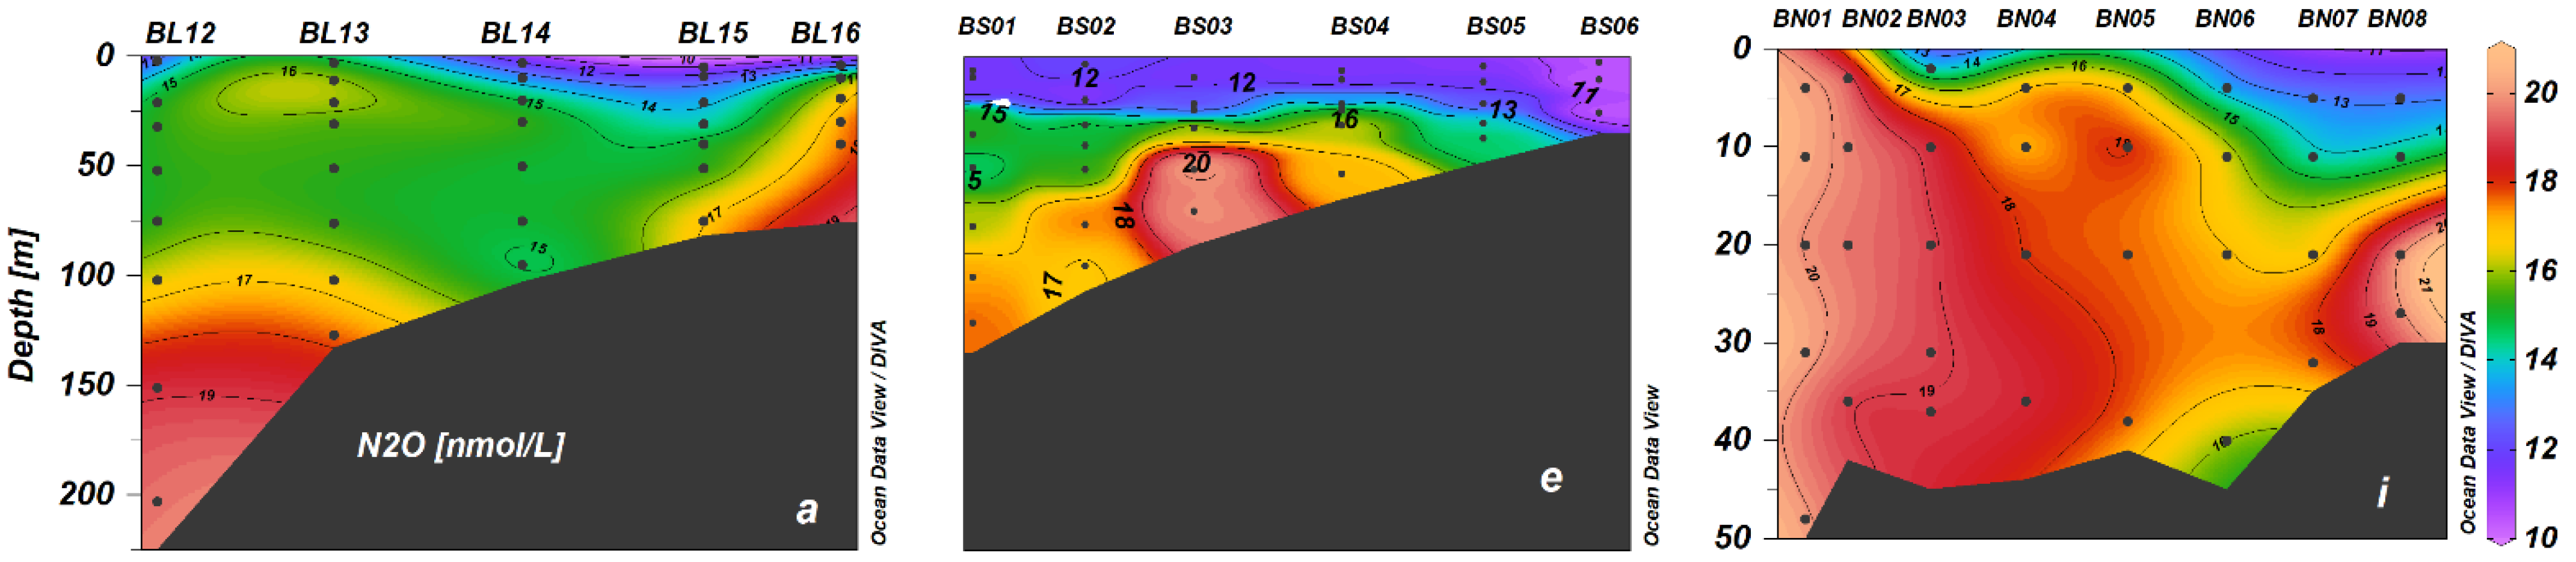
In the area to the south of St. Lawrence, the highest N2O concentration was observed in the middle shelf (BS section), and the lowest N2O concentration was observed in the inner shelf (Figure 3). On the whole, the distribution pattern shows that N2O concentration was low in the surface mixed layer (SML) and relatively high in the subsurface water, which is consistent with previous reports in the western Arctic Ocean shelf [19,31,32,35]. However, some differences can be observed: (1) in the inner shelf, N2O concentrations were low and homogenous in the whole water column; (2) In the cold bottom water, N2O concentrations in the BS section were obviously higher than the BL section; (3) In the outer shelf, N2O concentration increased with the increase in depth, and the concentration in the bottom water (>100 m depth) was higher than in the BL section.
Compared with the area south of St. Lawrence Island, N2O concentrations were high and showed a west-east gradient distribution pattern in the Chirikov Basin. The highest N2O concentration was found in the west and the whole water column mixed well. Toward the east, N2O concentration gradually decreased and the distribution pattern turned into a two-layer structure. In addition, we found that the N2O concentration in the easternmost station BN08 was higher than in the surrounding waters.
4. Discussion
4.1. N2O Flux Variations in Surface Water
N2O emissions from the Northern Bering Sea must be urgently constrained because the warming of the climate related to environmental issues is likely to continue. We calculated N2O flux (−1.6~36.2 μmol/(m2·d) ,mean ± SD, 7.1 ± 10.4 μmol/(m2·d)) in the Northeastern Bering Sea shelf and observed obviously spatial variations in the south and north shelf of St. Lawrence Island. N2O flux in the area to the south of St. Lawrence Island was 0.3 ± 2.1 μmol/(m2·d), which is consistent with the results of previous studies [32,45], but significantly lower than the Chirikov Basin (14.7 ± 0.8 μmol/(m2·d)) (Table 1).
Region-to-region variation in surface N2O flux on the northeastern Bering Sea shelf is likely mainly caused by physical processes including wind speed, temperature, and mixing. Temperature is an important factor controlling N2O solubility [40]. However, we observed an obvious N2O saturation difference between the area south of St. Lawrece Island and the Chirikov Basin, indicating that other factors may influence N2O in surface water. Previous studies have proved that sea ice meltwater could dilute N2O concentration in the surface water because sea ice meltwater contains very low N2O concentration [35,46]. However, we didn’t observe significant N2O undersaturation in the surface water, indicating that the influence of wind speed and water mixing should be considered.
In the south shelf of St. Lawrence Island, the wind-caused exchange of N2O in the surface water occurs predominantly in the upper atmosphere, due to a strong thermocline layer inhibiting the exchange between surface water and subsurface water. Therefore, the N2O was almost in equilibrium with the atmosphere in the south shelf of St. Lawrence Island. However, in the Chirikov Basin, the whole water column mixed well in the west side due to the occurrence of upwelling [47]. The highest N2O flux up to 36.2 μmol/(m2·d) in the area to the west of the Chirikov Basin resulted from the advection of Anadyr water and upper-down mixing. Although there are no N2O data obtained from the Anadyr Bay, the bay’s high primary productivity features could be conducive to N2O production due to the remineralization of organic matters [27]. In addition, the upwelling process would take high N2O bottom water into the surface water. Our results indicate that the area south of St. Lawrence Island acts as a weak alternating source/sink of atmospheric N2O influenced by the dilution of sea ice melting water and the exchange between surface water andair driven by wind. However, the Chirikov Basin acts as a significant N2O source due to advection and vertical transportation.
4.2. Temporal and Spatial Variations in N2O in the Northern Bering Sea Shelf
Early studies have shown that N2O concentration increases with depth in the Bering Sea and Chukchi Sea shelves [31,32,34,35], which is consistent with the distribution of N2O in this study. Sediment has been thought to be the main release source [31,34,35]. However, spatiotemporal differences in N2O in the regions of the northeastern Bering Sea shelf have been found: (1) a difference in N2O distribution between the north and south shelf of St. Lawrence Island; and (2) a difference in the cold water between the BS and BL sections.
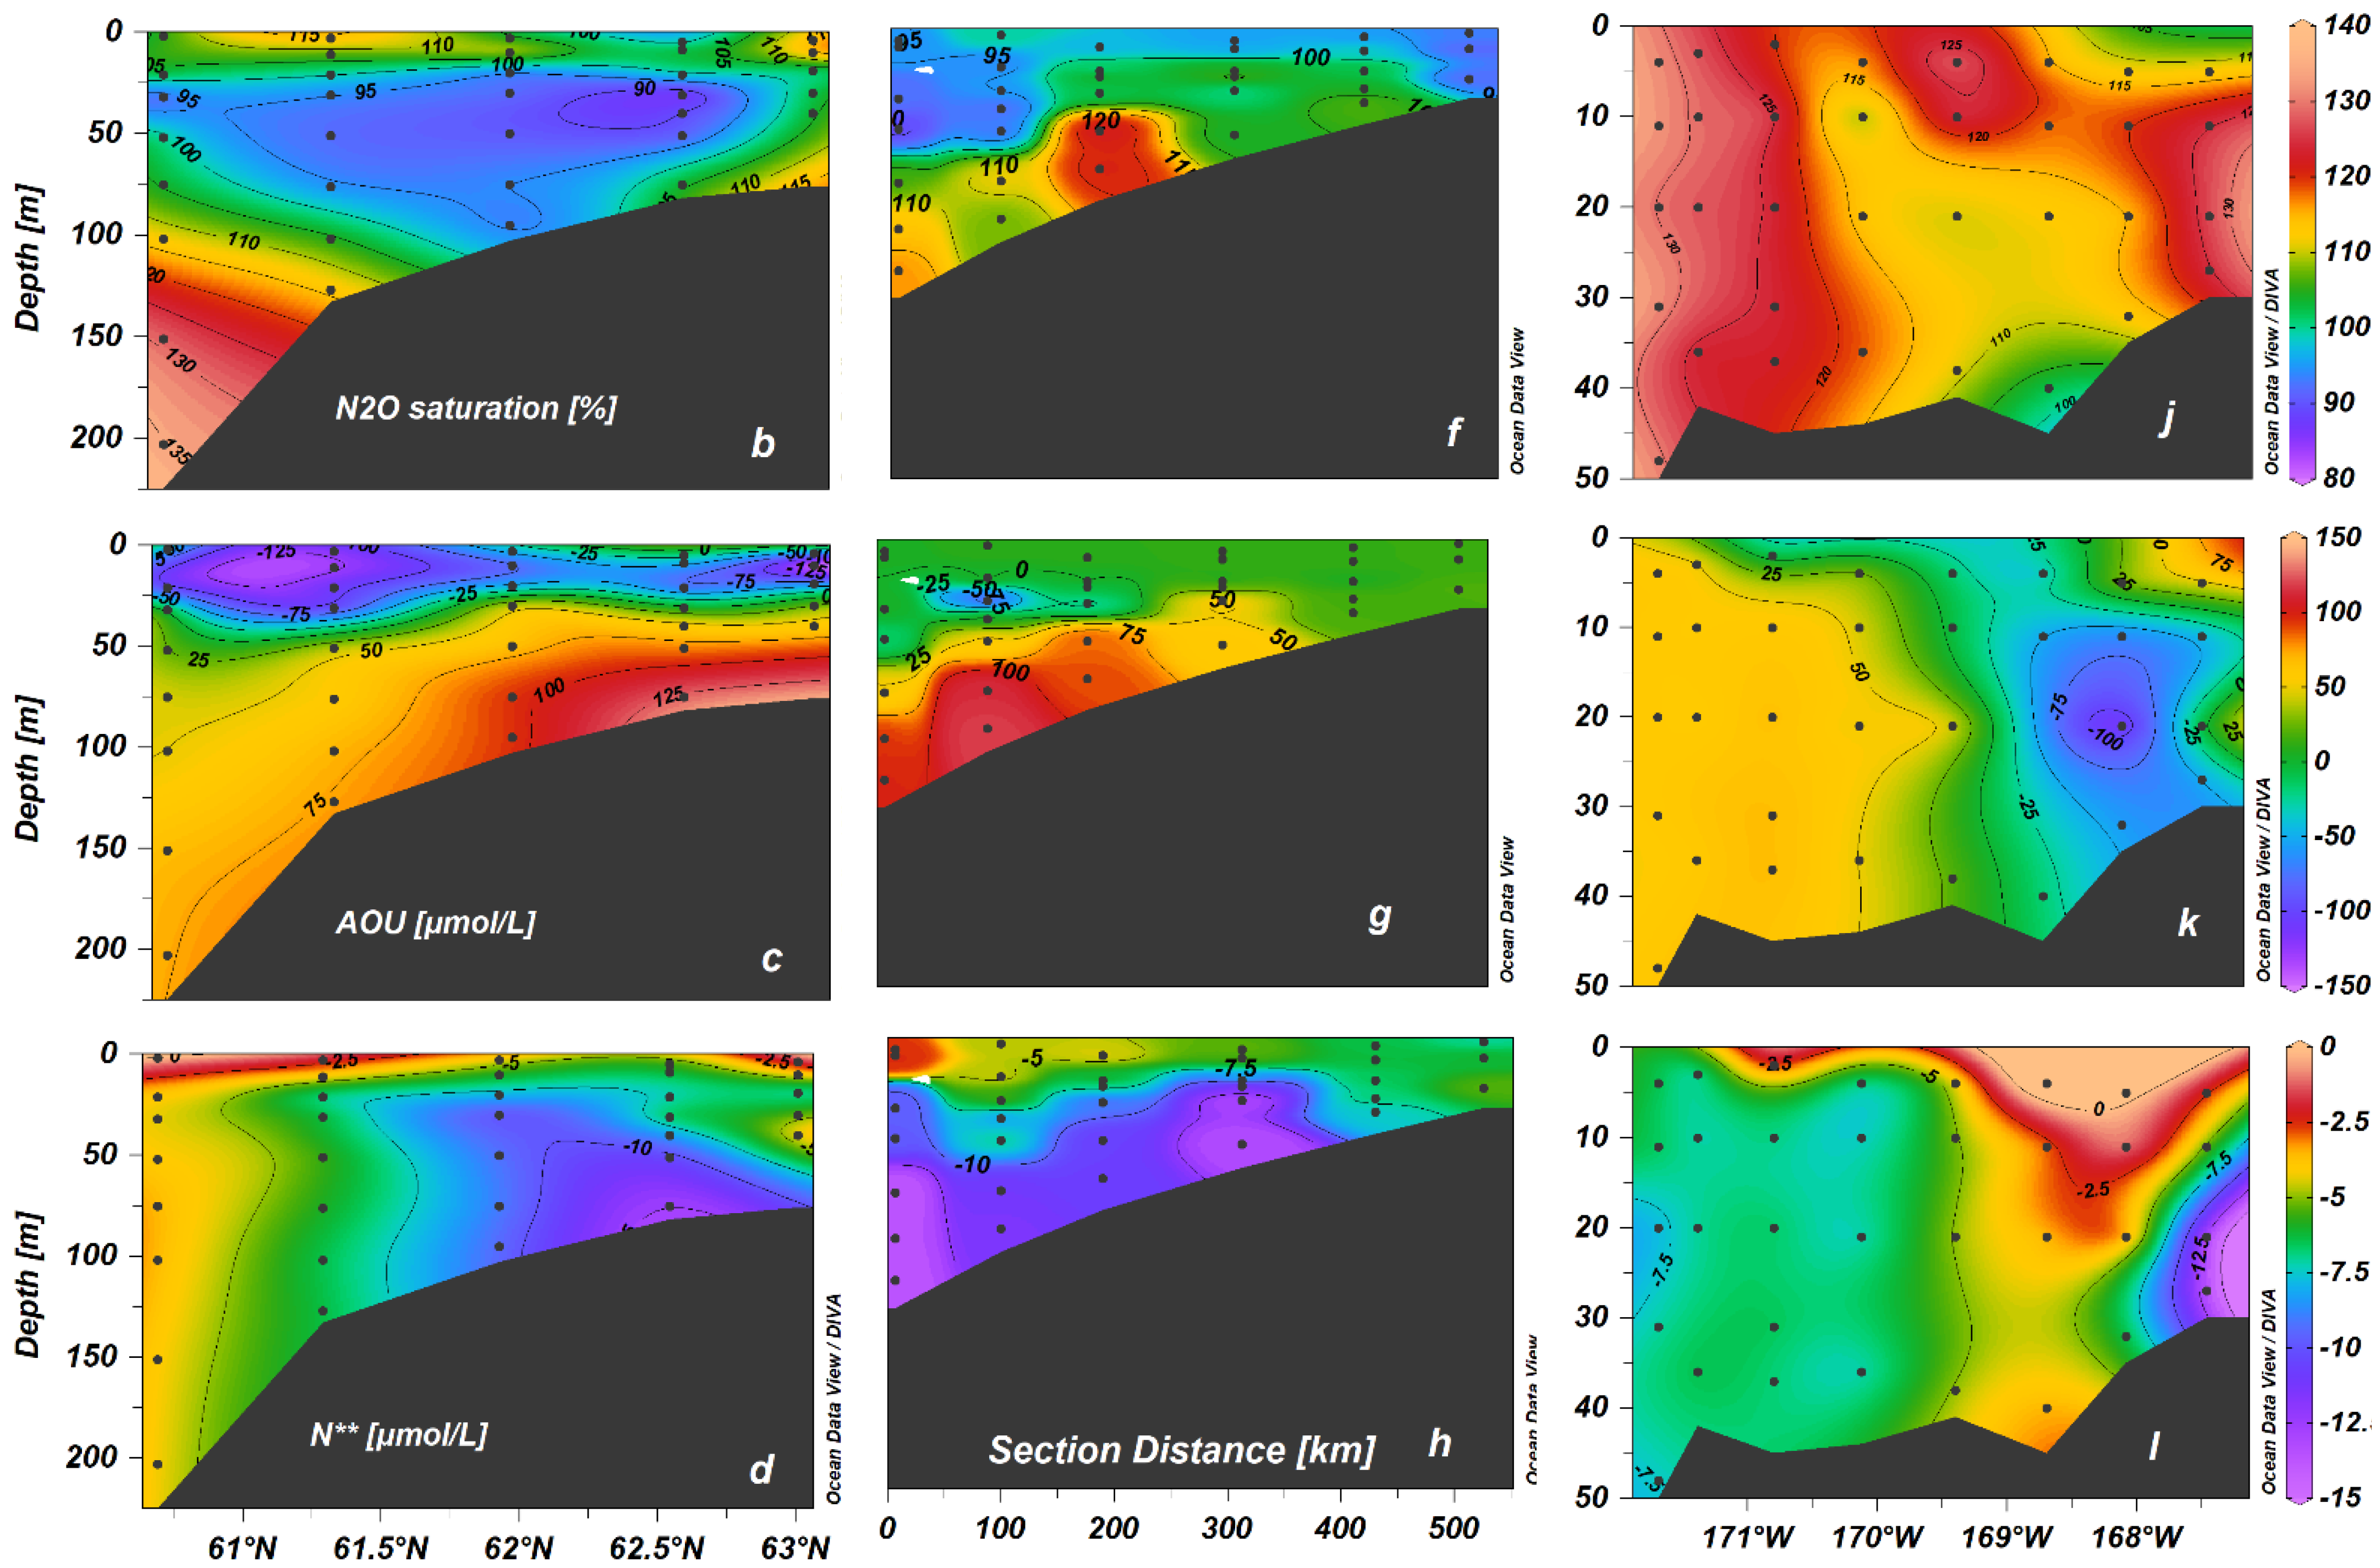
In the westside of the Chirikov Basin, the water was influenced mainly by the Anadyr water with high nutrients, produced through the processes of organic matter mineralization, accompanied by N2O production [12,34]. High N2O value in the Anadyr water would be transported into the Chirikov Basin. Then the intense water mixing affected by upwelling process in the west of Chirikov Basin [27,47] resulted in high concentration of N2O observed in the west areas of Chirikov Basin. N2O production in situ would be minor due to unstable water which is not conductive to biological processes. Both advective transport and water mixing were domain processes influencing N2O distribution in the west of the Chirikov Basin. Same as the inner shelf, the waters in the east of Chirikov Basin were influenced mainly by ACW; however, the distributions of N2O in both areas were different, indicating that there are different influencing processes. In the inner shelf, N2O concentrations (mean ± SD, 12.1 ± 1.7) are relatively low and almost homogeneous from the surface to the bottom layer, which is likely a result of low productivity and shallow water depth. In the eastward area in the Chirikov Basin, the stratification is gradually intense due to the mixing of AW, ACW, and river inputting. We found that N2O concentration in the eastmost station (BN08) subsurface waters was higher than in surrounding waters, which corresponds to low AOU (~−50.2 μmol/L) and N** (−13.3 μmol/L) (Figure 4j–k); this indicates that in situ production of N2O by remineralization of organic matters is relatively weak and that external river inputting may be the main source.
In contrast, the cold bottom water pool in the middle shelf is a relatively isolated water mass. It has been thought to be the winter residual water with weak flow and long residence time. We assume that N2O in the cold water is not affected by advection inputting but mainly affected by in situ production/consumption or sediment emission. The relationships between N2O and AOU and between N2O and N** were examined in this cold water. Positive correlation between N2O and AOU was found (Figure 5) and was interpreted as a result of N2O formation by the nitrification process. Because anaerobic denitrification is unlikely to occur in well-oxygenated water, the observed highly negative value of N** in the eastern Bering Sea shelf indicates strong sediment denitrification [48,49], which means there is a strong N2O release from sediment to bottom water. Although no relationship between N2O and N** was observed in this study, the contribution of sediment denitrification could not be excluded [32].
In N2O saturation, we found undersaturation (85–96%) in the cold bottom water during July 2012 and almost equilibrium or oversaturation (100–122%) during September 2012 (Figure 4b,f). Longer resident time might promote more N2O accumulation [50]. However, we need further research to prove this, because the sampling stations in July did not overlap with those in September.
5. Conclusions
N2O study on the northeastern Bering Sea shelf was conducted during summer 2012. The northeastern Bering Sea shelf acted as a weak source/sink for atmospheric N2O in the area south of St. Lawrence Island and then became a source in the Chirikov Basin. In the vertical distribution, the N2O showed spatiotemporal variability in a two-layer system (between surface and subsurface water), region-to-region (between the south and north sides of St. Lawrence Island and between the outer, middle, and inner shelves), and the same region (in the middle shelf and in the Chirikov Basin). These findings emphasize that N2O is affected by physical factors (wind, sea ice meltwater, and mixing) and biogeochemical processes (photosynthesis and mineralization of organic matter) in the NEBS. Although the N2O source to the atmosphere is not strong in the area south of St. Lawrence Island, it may play an important role in the N2O emission with the enhancement of warming. Further studies of N2O on the eastern Bering Sea shelf including biological culture, isotopic technique, and model-based estimation should be conducted to better understand the N2O driving mechanism and the N2O contribution to global N2O under the condition of continuing warming.
Author Contributions
Conceptualization, J.Z., L.Z. and L.C.; methodology, J.Z. and L.Z.; formal analysis, J.Z., J.L., M.W. and H.J.; investigation, J.Z.; data curation, W.Y.; writing—original draft preparation, J.Z.; writing—review and editing, J.Z. and L.Z. All authors have read and agreed to the published version of the manuscript.
Funding
This work was funded by the Scientific Research Foundation of the Third Institute of Oceanography, MNR (grant number 2019033), the Scientific Research Foundation of the Third Institute of Oceanography, MNR (grant number 2018024), the Natural Science Foundation of Fujian Province (grant number 2019J05147), and the National Natural Science Foundation of China (grant number 41906193).
Data Availability Statement
The data presented in this study are available on request from the corresponding author.
Acknowledgments
We would like to thank the officers, captain, and crew of the R/V Xuelong for help with the sampling. We also thank the scientists onboard during the cruise for providing technical assistance. We thank the physical oceanography group during CHINARE2012 for providing salinity and temperature data. We thank Fan Zhang and Heng Sun for measuring the concentration of dissolved oxygen.
Conflicts of Interest
The authors declare no conflict of interest.
References
- Yung, Y.L.; Wang, W.C.; Lacis, A.A. Greenhouse effect due to atmospheric nitrous oxide. Geophys. Res. Lett. 1976, 3, 619–621. [Google Scholar] [CrossRef]
- Ravishankara, A.R.; Daniel, J.S.; Portmann, R.W. Nitrous Oxide (N2O): The Dominant Ozone-Depleting Substance Emitted in the 21st Century. Science 2009, 326, 123–125. [Google Scholar] [CrossRef] [PubMed] [Green Version]
- Canadell, J.G.; Monteiro, P.; Costa, M.H.; Cotrim da Cunha, L.; Cox, P.M.; Eliseev, A.V.; Henson, S.; Ishii, M.; Jaccard, S.; Koven, C.; et al. Global Carbon and other Biogeochemical Cycles and Feedbacks. In Climate Change 2021: The Physical Science Basis; Masson-Delmotte, V., Ed.; Cambridge University Press: Cambridge/New York, NY, USA, 2021. [Google Scholar]
- Nevison, C.D.; Keeling, R.F.; Weiss, R.F.; Popp, B.N.; Jin, X.; Fraser, P.J.; Porter, L.W.; Hess, P.G. Southern Ocean ventilation inferred from seasonal cycles of atmospheric N2O and O2/N2at Cape Grim, Tasmania. Tellus B Chem. Phys. Meteorol. 2005, 57, 218–229. [Google Scholar] [CrossRef]
- Nevison, C.D.; Weiss, R.F.; Erickson, D.J., III. Global oceanic emissions of nitrous oxide. J. Geophys. Res. Space Phys. 1995, 100, 15809–15820. [Google Scholar] [CrossRef]
- Bange, H.W.; Freing, A.; Kock, A.; Löscher, C. Marine pathways to nitrous oxide. In Nitrous Oxide and Climate Change; Smith, K., Ed.; Routledge: London, UK, 2010; pp. 36–62. [Google Scholar]
- Dore, J.E.; Karl, D. Nitrification in the euphotic zone as a source for nitrite, nitrate, and nitrous oxide at Station ALOHA. Limnol. Oceanogr. 1996, 41, 1619–1628. [Google Scholar] [CrossRef]
- Ostrom, N.E.; Russ, M.E.; Popp, B.; Rust, T.M.; Karl, D. Mechanisms of nitrous oxide production in the subtropical North Pacific based on determinations of the isotopic abundances of nitrous oxide and di-oxygen. Chem. Glob. Change Sci. 2000, 2, 281–290. [Google Scholar] [CrossRef]
- Walter, S.; Bange, H.W.; Breitenbach, U.; Wallace, D.W.R. Nitrous oxide in the North Atlantic Ocean. Biogeosciences 2006, 3, 607–619. [Google Scholar] [CrossRef] [Green Version]
- Nevison, C.; Butler, J.H.; Elkins, J.W. Global distribution of N2O and the ΔN2O-AOU yield in the subsurface ocean. Glob. Biogeochem. Cycles 2003, 17, 1–30. [Google Scholar] [CrossRef]
- Toyoda, S.; Yoshida, N. Determination of Nitrogen Isotopomers of Nitrous Oxide on a Modified Isotope Ratio Mass Spectrometer. Anal. Chem. 1999, 71, 4711–4718. [Google Scholar] [CrossRef]
- Yamagishi, H.; Westley, M.B.; Popp, B.N.; Toyoda, S.; Yoshida, N.; Watanabe, S.; Koba, K.; Yamanaka, Y. Role of nitrification and denitrification on the nitrous oxide cycle in the eastern tropical North Pacific and Gulf of California. J. Geophys. Res. Earth Surf. 2007, 112, 139–158. [Google Scholar] [CrossRef]
- Steele, M.; Ermold, W.; Zhang, J. Arctic Ocean surface warming trends over the past 100 years. Geophys. Res. Lett. 2008, 35, 2614. [Google Scholar] [CrossRef] [Green Version]
- Giles, K.A.; Laxon, S.W.; Ridout, A.L.; Wingham, D.J.; Bacon, S. Western Arctic Ocean freshwater storage increased by wind-driven spin-up of the Beaufort Gyre. Nat. Geosci. 2012, 5, 194–197. [Google Scholar] [CrossRef]
- Perovich, D.K.; Richter-Menge, J.A. Loss of Sea Ice in the Arctic. Annu. Rev. Mar. Sci. 2009, 1, 417–441. [Google Scholar] [CrossRef] [PubMed] [Green Version]
- Qi, D.; Chen, L.; Chen, B.; Gao, Z.; Zhong, W.; Feely, R.A.; Anderson, L.G.; Sun, H.; Chen, J.; Chen, M.; et al. Increase in acidifying water in the western Arctic Ocean. Nat. Clim. Change 2017, 7, 195–199. [Google Scholar] [CrossRef]
- Li, C.; Wang, B.; Wang, Z.; Li, J.; Yang, G.; Chen, J.; Lin, L.; Lyu, Y.; Guo, F. Spatial and Interannual Variability in Distributions and Cycling of Summer Biogenic Sulfur in the Bering Sea. Geophys. Res. Lett. 2019, 46, 4816–4825. [Google Scholar] [CrossRef]
- Sun, H.; Gao, Z.-Y.; Zhao, D.-R.; Sun, X.-W.; Chen, L.-Q. Spatial variability of summertime aragonite saturation states and its influencing factor in the Bering Sea. Adv. Clim. Change Res. 2021, 12, 508–516. [Google Scholar] [CrossRef]
- Wu, M.; Chen, L.; Zhan, L.; Zhang, J.; Li, Y.; Liu, J. Spatial Variability and Factors Influencing the Air-Sea N2O Flux in the Bering Sea, Chukchi Sea and Chukchi Abyssal Plain. Atmosphere 2017, 8, 65. [Google Scholar] [CrossRef] [Green Version]
- Mathis, J.T.; Bates, N.R.; Hansell, D.A.; Babila, T. Net community production in the northeastern Chukchi Sea. Deep Sea Res. Part II Top. Stud. Oceanogr. 2009, 56, 1213–1222. [Google Scholar] [CrossRef]
- Springer, A.M.; McROY, C.P.; Flint, M.V. The Bering Sea Green Belt: Shelf-edge processes and ecosystem production. Fish. Oceanogr. 1996, 5, 205–223. [Google Scholar] [CrossRef]
- Andreev, A.G.; Budyansky, M.V.; Khen, G.V.; Uleysky, M.Y. Water dynamics in the western Bering Sea and its impact on chlorophyll a concentration. Ocean Dyn. 2020, 70, 593–602. [Google Scholar] [CrossRef]
- Devol, A.H.; A Codispoti, L.; Christensen, J.P. Summer and winter denitrification rates in western Arctic shelf sediments. Cont. Shelf Res. 1997, 17, 1029–1050. [Google Scholar] [CrossRef]
- Jones, E.P.; Swift, J.H.; Anderson, L.G.; Lipizer, M.; Civitarese, G.; Falkner, K.K.; Kattner, G.; McLaughlin, F. Tracing Pacific water in the North Atlantic Ocean. J. Geophys. Res. Earth Surf. 2003, 108, 1–13. [Google Scholar] [CrossRef]
- Coachman, L.K.; Coachman, L.K.; Aagaard, K.; Tripp, R.B. Bering Strait: The Regional Physical Oceanography; University of Washington Press: Washington, DC, USA, 1975; Volume 172, pp. 502–503. [Google Scholar]
- Liu, N.; Lin, L.; Wang, Y.; Chen, H.; He, Y. The distribution and inter-annual variation of water masses on the Bering Sea shelf in summer. Acta Oceanol. Sin. 2016, 35, 59–67. [Google Scholar] [CrossRef]
- Danielson, S.; Aagaard, K.; Weingartner, T.; Martin, S.; Winsor, P.; Gawarkiewicz, G.; Quadfasel, D. The St. Lawrence polynya and the Bering shelf circulation: New observations and a model comparison. J. Geophys. Res. Earth Surf. 2006, 111, 1–18. [Google Scholar] [CrossRef]
- Muench, R.D.; Schumacher, J.D.; Salo, S.A. Winter currents and hydrographic conditions on the northern central Bering Sea shelf. J. Geophys. Res. Earth Surf. 1988, 93, 516. [Google Scholar] [CrossRef]
- Stabeno, P.J.; Schumacher, J.D.; Ohtani, K. The physical oceanography of the Bering Sea. In Dynamics of the Bering Sea: A Summary of Physical, Chemical, and Biological Characteristics, and a Synopsis of Research on the Bering Sea, North Pacific Marine Science Organization (PICES); Loughlin, T.R., Ohtani, K., Eds.; University of Alaska: Fairbanks, AK, USA, 1999; pp. 1–28. [Google Scholar]
- Zhan, L.; Zhang, J.; Ouyang, Z.; Lei, R.; Xu, S.; Qi, D.; Gao, Z.; Sun, H.; Li, Y.; Wu, M.; et al. High-resolution distribution pattern of surface water nitrous oxide along a cruise track from the Okhotsk Sea to the western Arctic Ocean. Limnol. Oceanogr. 2020, 66, S401–S410. [Google Scholar] [CrossRef]
- Fenwick, L.; Capelle, D.; Damm, E.; Zimmermann, S.; Williams, W.J.; Vagle, S.; Tortell, P.D. Methane and nitrous oxide distributions across the North American Arctic Ocean during summer, 2015. J. Geophys. Res. Oceans 2017, 122, 390–412. [Google Scholar] [CrossRef] [Green Version]
- Hirota, A.; Ijiri, A.; Komatsu, D.; Ohkubo, S.; Nakagawa, F.; Tsunogai, U. Enrichment of nitrous oxide in the water columns in the area of the Bering and Chukchi Seas. Mar. Chem. 2009, 116, 47–53. [Google Scholar] [CrossRef]
- Kitidis, V.; Upstill-Goddard, R.; Anderson, L.G. Methane and nitrous oxide in surface water along the North-West Passage, Arctic Ocean. Mar. Chem. 2010, 121, 80–86. [Google Scholar] [CrossRef]
- Toyoda, S.; Kakimoto, T.; Kudo, K.; Yoshida, N.; Sasano, D.; Kosugi, N.; Ishii, M.; Kameyama, S.; Inagawa, M.; Yoshikawa-Inoue, H.; et al. Distribution and Production Mechanisms of N2O in the Western Arctic Ocean. Glob. Biogeochem. Cycles 2021, 35, e2020GB006881. [Google Scholar] [CrossRef]
- Zhang, J.; Zhan, L.; Chen, L.; Li, Y.; Chen, J. Coexistence of nitrous oxide undersaturation and oversaturation in the surface and subsurface of the western Arctic Ocean. J. Geophys. Res. Oceans 2015, 120, 8392–8401. [Google Scholar] [CrossRef] [Green Version]
- Stabeno, P.J.; Farley, E.V., Jr.; Kachel, N.B.; Moore, S.; Mordy, C.W.; Napp, J.M.; Overland, J.E.; Pinchuk, A.I.; Sigler, M.F. A comparison of the physics of the northern and southern shelves of the eastern Bering Sea and some implications for the ecosystem. Deep Sea Res. Part II Top. Stud. Oceanogr. 2012, 65–70, 14–30. [Google Scholar] [CrossRef]
- Zhan, L.-Y.; Chen, L.-Q.; Zhang, J.-X.; Lin, Q. A system for the automated static headspace analysis of dissolved N2O in seawater. Int. J. Environ. Anal. Chem. 2013, 93, 828–842. [Google Scholar] [CrossRef]
- Dickson, A.G. Determination of Dissolved Oxygen in Sea Water by Winkler Titration. WHP Op. Methods 1996, 3. [Google Scholar]
- Zhuang, Y.; Jin, H.; Li, H.; Chen, J.; Lin, L.; Bai, Y.; Ji, Z.; Zhang, Y.; Gu, F. Pacific inflow control on phytoplankton community in the Eastern Chukchi Shelf during summer. Cont. Shelf Res. 2016, 129, 23–32. [Google Scholar] [CrossRef]
- Weiss, R.F.; Price, B.A. Nitrous oxide solubility in water and seawater. Mar. Chem. 1980, 8, 347–359. [Google Scholar] [CrossRef]
- Weiss, R.F. The solubility of nitrogen, oxygen and argon in water and seawater. Deep. Sea Res. Oceanogr. Abstr. 1970, 17, 721–735. [Google Scholar] [CrossRef]
- Gruber, N.; Sarmiento, J.L. Global patterns of marine nitrogen fixation and denitrification. Glob. Biogeochem. Cycles 1997, 11, 235–266. [Google Scholar] [CrossRef]
- Nishino, S.; Shimada, K.; Itoh, M. Use of ammonium and other nitrogen tracers to investigate the spreading of shelf waters in the western Arctic halocline. J. Geophys. Res. Earth Surf. 2005, 110, 1–6. [Google Scholar] [CrossRef] [Green Version]
- Wanninkhof, R. Relationship between wind speed and gas exchange over the ocean revisited. Limnol. Oceanogr. Methods 2014, 12, 351–362. [Google Scholar] [CrossRef]
- Zhan, L.; Wu, M.; Chen, L.; Zhang, J.; Li, Y.; Liu, J. The Air-Sea Nitrous Oxide Flux along Cruise Tracks to the Arctic Ocean and Southern Ocean. Atmosphere 2017, 8, 216. [Google Scholar] [CrossRef]
- Randall, K.; Scarratt, M.; Levasseur, M.; Michaud, S.; Xie, H.; Gosselin, M. First measurements of nitrous oxide in Arctic sea ice. J. Geophys. Res. Earth Surf. 2012, 117, 247–253. [Google Scholar] [CrossRef]
- Nihoul, J.C.J. Aspects of the Northern Bering Sea Ecohydrodynamics. Elsevier Oceanogr. Ser. 1986, 42, 385–399. [Google Scholar] [CrossRef]
- Tanaka, T.; Guo, L.; Deal, C.; Tanaka, N.; Whitledge, T.; Murata, A. N deficiency in a well-oxygenated cold bottom water over the Bering Sea shelf: Influence of sedimentary denitrification. Cont. Shelf Res. 2004, 24, 1271–1283. [Google Scholar] [CrossRef]
- Zhuang, Y.; Jin, H.; Cai, W.; Li, H.; Qi, D.; Chen, J. Extreme Nitrate Deficits in the Western Arctic Ocean: Origin, Decadal Changes, and Implications for Denitrification on a Polar Marginal Shelf. Glob. Biogeochem. Cycles 2022, 36, e2022GB007304. [Google Scholar] [CrossRef]
- Bange, H.W.; Andreae, M. Nitrous oxide in the deep waters of the world’s oceans. Glob. Biogeochem. Cycles 1999, 13, 1127–1135. [Google Scholar] [CrossRef]
Figure 1.
Map of sampling stations and water current in the eastern Bering Sea shelf. BSC—Bering Slope Current; AW—Anadyr Water; ACW—Alaska Coastal Water.
Figure 1.
Map of sampling stations and water current in the eastern Bering Sea shelf. BSC—Bering Slope Current; AW—Anadyr Water; ACW—Alaska Coastal Water.

Figure 2.
Profiles of temperature and salinity in BL (a,b), BS (c,d), and BN (e,f) sections. BS_SW-Bering Sea Surface Water; BS_CW—Bering Sea Cold Water; BSSW—Bering Sea Slope Water; BSW—Bering Sea shelf Water; ACW—Alaska Coastal Water; AW—Anadyr Water; MW—Mixed Water.
Figure 2.
Profiles of temperature and salinity in BL (a,b), BS (c,d), and BN (e,f) sections. BS_SW-Bering Sea Surface Water; BS_CW—Bering Sea Cold Water; BSSW—Bering Sea Slope Water; BSW—Bering Sea shelf Water; ACW—Alaska Coastal Water; AW—Anadyr Water; MW—Mixed Water.

Figure 3.
Distributions of N2O concentration (a) and saturation (b) in the surface water of the northeastern Bering Sea shelf in summer 2012.
Figure 3.
Distributions of N2O concentration (a) and saturation (b) in the surface water of the northeastern Bering Sea shelf in summer 2012.

Figure 4.
The vertical distribution of N2O concentration, N2O saturation, AOU, and N** in sections BL(a–d), BS (e–h), and BN (i–l) in summer 2012. On the basis of the sampling locations, the BL, BS, and BN sections take latitude, distance, and longitude as their horizontal coordinate, respectively. Due to the difference in bottom depth, the BL and BS sections use the same depth coordinate (0–250 m) and the BN section use another depth coordinate (0–50 m).


Figure 5.
The relationship between N2O and AOU (a) N2O and N** (b) in the cold bottom water of the NBES.
Figure 5.
The relationship between N2O and AOU (a) N2O and N** (b) in the cold bottom water of the NBES.


Table 1.
The sampling information and surface concentration, saturation and flux during CHINARE2012 in the Northeastern Bering Sea shelf.
Table 1.
The sampling information and surface concentration, saturation and flux during CHINARE2012 in the Northeastern Bering Sea shelf.
| Region | Station | Date | Longitude [°E] | Latitude [°N] | Bot. Depth [m] | Temperature [°C] | Salinity | N2O [nmol/L] | N2O Saturation [%] | N2O Flux Mean ± Std [μmol/(m2·d)] |
|---|---|---|---|---|---|---|---|---|---|---|
| South of St. Lawrence Island | BL12 | 14 July 2012 | −178.85 | 60.69 | 233 | 6.61 | 30.68 | 13.0 | 106 | 0.3 ± 2.1 |
| BL13 | 15 July 2012 | −177.48 | 61.29 | 133 | 4.57 | 29.88 | 15.3 | 115 | ||
| BL14 | 15 July 2012 | −177.25 | 61.93 | 103 | 8.43 | 30.945 | 11.9 | 104 | ||
| BL15 | 16 July 2012 | −175.30 | 62.54 | 82 | 8.74 | 31.129 | 11.0 | 97 | ||
| BL16 | 15 July 2012 | −173.89 | 63.00 | 76 | 9.92 | 30.62 | 12.5 | 114 | ||
| BS01 | 11 September 2012 | −177.26 | 61.12 | 135 | 6.19 | 30.80 | 11.8 | 95 | ||
| BS02 | 11 September 2012 | −175.53 | 61.12 | 107 | 6.51 | 30.60 | 12.2 | 100 | ||
| BS03 | 11 September 2012 | −173.85 | 61.12 | 86 | 6.67 | 30.49 | 11.8 | 97 | ||
| BS04 | 10 September 2012 | −171.58 | 61.20 | 65 | 6.60 | 30.49 | 11.7 | 96 | ||
| BS05 | 10 September 2012 | −169.43 | 61.40 | 48 | 7.04 | 31.01 | 11.5 | 96 | ||
| BS06 | 10 September 2012 | −167.72 | 61.70 | 35 | 8.50 | 31.02 | 10.7 | 93 | ||
| Chirikov Basin | BN01 | 16 July 2012 | −171.69 | 64.30 | 53 | 0.77 | 32.87 | 20.1 | 132 | 14.7 ± 0.8 |
| BN02 | 16 July 2012 | −171.38 | 64.40 | 42 | 0.64 | 32.94 | 19.6 | 128 | ||
| BN03 | 17 July 2012 | −170.80 | 64.50 | 45 | 8.85 | 29.79 | 13.7 | 120 | ||
| BN04 | 17 July 2012 | −170.12 | 64.50 | 44 | 1.55 | 32.39 | 17.2 | 116 | ||
| BN05 | 17 July 2012 | −169.40 | 64.50 | 41 | 4.73 | 32.21 | 16.9 | 129 | ||
| BN06 | 17 July 2012 | −168.70 | 64.50 | 45 | 7.91 | 31.95 | 13.3 | 114 | ||
| BN07 | 17 July 2012 | −168.08 | 64.60 | 35 | 7.96 | 31.71 | 13.1 | 112 | ||
| BN08 | 17 July 2012 | −167.46 | 64.60 | 30 | 8.58 | 30.753 | 12.9 | 112 |
Publisher’s Note: MDPI stays neutral with regard to jurisdictional claims in published maps and institutional affiliations. |
© 2022 by the authors. Licensee MDPI, Basel, Switzerland. This article is an open access article distributed under the terms and conditions of the Creative Commons Attribution (CC BY) license (https://creativecommons.org/licenses/by/4.0/).
Share and Cite
MDPI and ACS Style
Zhang, J.; Zhan, L.; Chen, L.; Jin, H.; Wu, M.; Ye, W.; Liu, J. Spatiotemporal Distribution of Nitrous Oxide on the Northeastern Bering Sea Shelf. Water 2022, 14, 3738. https://doi.org/10.3390/w14223738
AMA Style
Zhang J, Zhan L, Chen L, Jin H, Wu M, Ye W, Liu J. Spatiotemporal Distribution of Nitrous Oxide on the Northeastern Bering Sea Shelf. Water. 2022; 14(22):3738. https://doi.org/10.3390/w14223738
Chicago/Turabian StyleZhang, Jiexia, Liyang Zhan, Liqi Chen, Haiyan Jin, Man Wu, Wangwang Ye, and Jian Liu. 2022. "Spatiotemporal Distribution of Nitrous Oxide on the Northeastern Bering Sea Shelf" Water 14, no. 22: 3738. https://doi.org/10.3390/w14223738
Note that from the first issue of 2016, this journal uses article numbers instead of page numbers. See further details here.