
Simulation of the Nitrogen and Phosphorus Leaching Characteristics under Different Filter Materials of an Improved Subsurface Drainage
1
State Key Laboratory of Simulation and Regulation of Water Cycle in River Basin, China Institute of Water Resources and Hydropower Research, Beijing 100038, China
2
Department of Irrigation and Drainage, China Institute of Water Resources and Hydropower Research, Beijing 100048, China
*
Author to whom correspondence should be addressed.
Water 2022, 14(22), 3744; https://doi.org/10.3390/w14223744
Submission received: 26 October 2022
/
Revised: 12 November 2022
/
Accepted: 16 November 2022
/
Published: 18 November 2022
(This article belongs to the Section Water, Agriculture and Aquaculture)
Abstract
:Leaching characteristics of filter materials of the improved subsurface drainage are very important for nitrogen and phosphorus loss. In this paper, the leaching characteristic of soil, sand, straw, and zeolite under different layouts were studied by HYDRUS-2D simulation based on calibration and validation according to laboratory data. Two scenarios were considered, including different soil and filter layouts, and mixed filter materials of straw and sand or zeolite. The results indicate that zeolite showed good adsorption characteristics of both ammonia nitrogen and phosphorus, while the straw’s adsorption characteristics were very different between ammonia nitrogen and phosphorus. Nitrogen and phosphorus concentrations of the outflow were mostly determined by the materials around the outlet. Compared with the cases of no lower soil, when the lower soil depth was 5 cm, the ammonia nitrogen concentrations under sand and straw decreased 54.5% and 96.3%, and the corresponding decreased phosphorus concentrations were 84.1% and 96.2%. In views of mixed filter with straw and the different layouts, that the ratio of straw and sand was 1:1, or the ratio of straw and zeolite was 2:1; at the same time, sand and zeolite should be set around the outlet, and may be better for ammonia nitrogen and total phosphorus concentrations reduction.
1. Introduction
The improved subsurface drainage is a more efficient drainage type by laying high permeability materials as a filter around the pipe. Drainage capacity of the improved subsurface drainage was verified by a laboratory experiment, field test, and simulation [1,2]. Filter materials can influent nitrogen and phosphorus losses of drainage [3,4]. The materials such as straw, sawdust, zeolite, and sand are usually used for nitrogen and phosphorus reduction in water bodies to improve water quality. Pan, et al. [5] studied the pollutants from agricultural drainage by placing soil, cinder, straw, and sawdust in the ditch as substrates. The results show that the sawdust had a better adsorption capacity of total dissolved solids (TDS) and total nitrogen (TN), and under sawdust and soil treatments, chemical oxygen demand (COD), TN, total phosphorus (TP), nitrate nitrogen (NO−3-N), and ammonia nitrogen (NH4+-N) were effectively removed from outflow. Bruun, et al. [6] constructed subsurface flowconstructed wetlands consisting of woodchip as filter matrixes and showed that the higher NO−3-N removal rates were attributed to a longer solute residence time. Humphrey, et al. [7] studied the total dissolved nitrogen (TDN) treatment efficiency of four onsite wastewater systems (OWS) of two conventional style and two single-pass sand filters to determine OWS in clayey soils of the North Carolina Piedmont, found that the sand filter OWS reduced TDN concentrations by an average of 80% and mass loading by 50% prior to discharge to surface waters. Cui, et al. [8] analyzed nutrient removal efficiencies and mechanisms in six constructed wetlands, including combinations between evergreen submerged vegetation planting and rice straw adding under low temperature and the results show that both unvegetated and vegetated constructed wetlands achieved the highest removal rates of TN (85.1–86.6%) and NO−3-N (98.2–98.7%) with increases of approximately 56% and 68% by adding rice straw in water, respectively. Chen, et al. [9] used water hyacinth straw as an adsorbent for phosphorus removal from swine wastewater and the laboratory results show that the straw displayed a rapid TP reduction and the adsorption efficiency was about 36% upon saturation. At the same time, the water hyacinth straw enhanced NH4+-N removal efficiency as well. Paul and Hall [10] fabricated triplicates of laboratory-scale bioreactors to compare the denitrification efficiencies of biochar and zeolite to that of plastic and showed that zeolite exhibited the highest values of surface roughness in terms of arithmetic mean height, and under pseudo-steady-state conditions, zeolite displayed the highest nitrate removal efficiency.
Mixed materials can also be used as filters. The locations and the thickness of the filter materials have the effect of pollution reduction. Le, et al. [11] investigated the ability of wheat straw to remove inorganic nitrogen and phosphorus from wastewater when mixed into sand at different rates, the results show that in the amended sand, inorganic nitrogen was about fourfold lower throughout the experiment compared to sand alone and inorganic phosphorus leaching was about threefold lower and inorganic phosphorus retention was 40% higher in all amended treatments than sand alone on day 16. Glaister, et al. [12] investigated the role of filter media, vegetation, and a saturated zone in achieving optimized nitrogen and phosphorus removal in biofilters and found a very good nutrient removal effect of 90% total phosphorus and 89% total nitrogen reduction. Wang, et al. [13] analyzed the nitrogen removal effects of envelopes with different materials, including wheat straw, sawdust, ceramic, zeolite, and fiber ball, and showed that the inorganic material had a better ability to remove NH4+-N, sawdust had the top nitrogen removal efficiency of 55.1% under an envelope thickness of 10 cm, and the zeolite had the top removal rate of 76.2% under the thickness of 30 cm.
In view of the removal mechanism of nitrogen and phosphorus, the nitrification, nitritation, denitrification, advanced oxidation, adsorption, and sedimentation to the soil or filters are widely accepted as the main pathways through which nitrogen and phosphorus are removed from the wastewater [14,15,16]. The organic pollutants are mostly removed by aerobic and anaerobic degradation [17]. Nitrogen is mainly removed by plant uptake, substratum adsorption, nitrification, and denitrification. Phosphorus removal was achieved through substratum adsorption, plant uptake, and microbial assimilation [18]. Nitrogen removal is strongly related to plants, dissolved oxygen level, HRT, and pollutants loading et al. Phosphorus removal mostly depended on physical and chemical properties of substratum and plants.
The literature about the effects of different materials on nitrogen and phosphorus removal is usually accomplished by experiment, and the method of simulation is rarely used. In this paper, the leaching characteristics of nitrogen and phosphorus under different filter materials of an improved subsurface drainage, including soil, straw, sand, and zeolite were analyzed based on laboratory and simulation tests. Based on the simulation, the effect of filter thickness and location on nitrogen and phosphorus reduction was discussed, and the mixed material of straw and sand or straw and zeolite was studied, considering the different straw ratios and laying locations. This paper may provide a reference for the filter chosen for improved subsurface drainage.
2. Materials and Methods
2.1. Laboratory Test
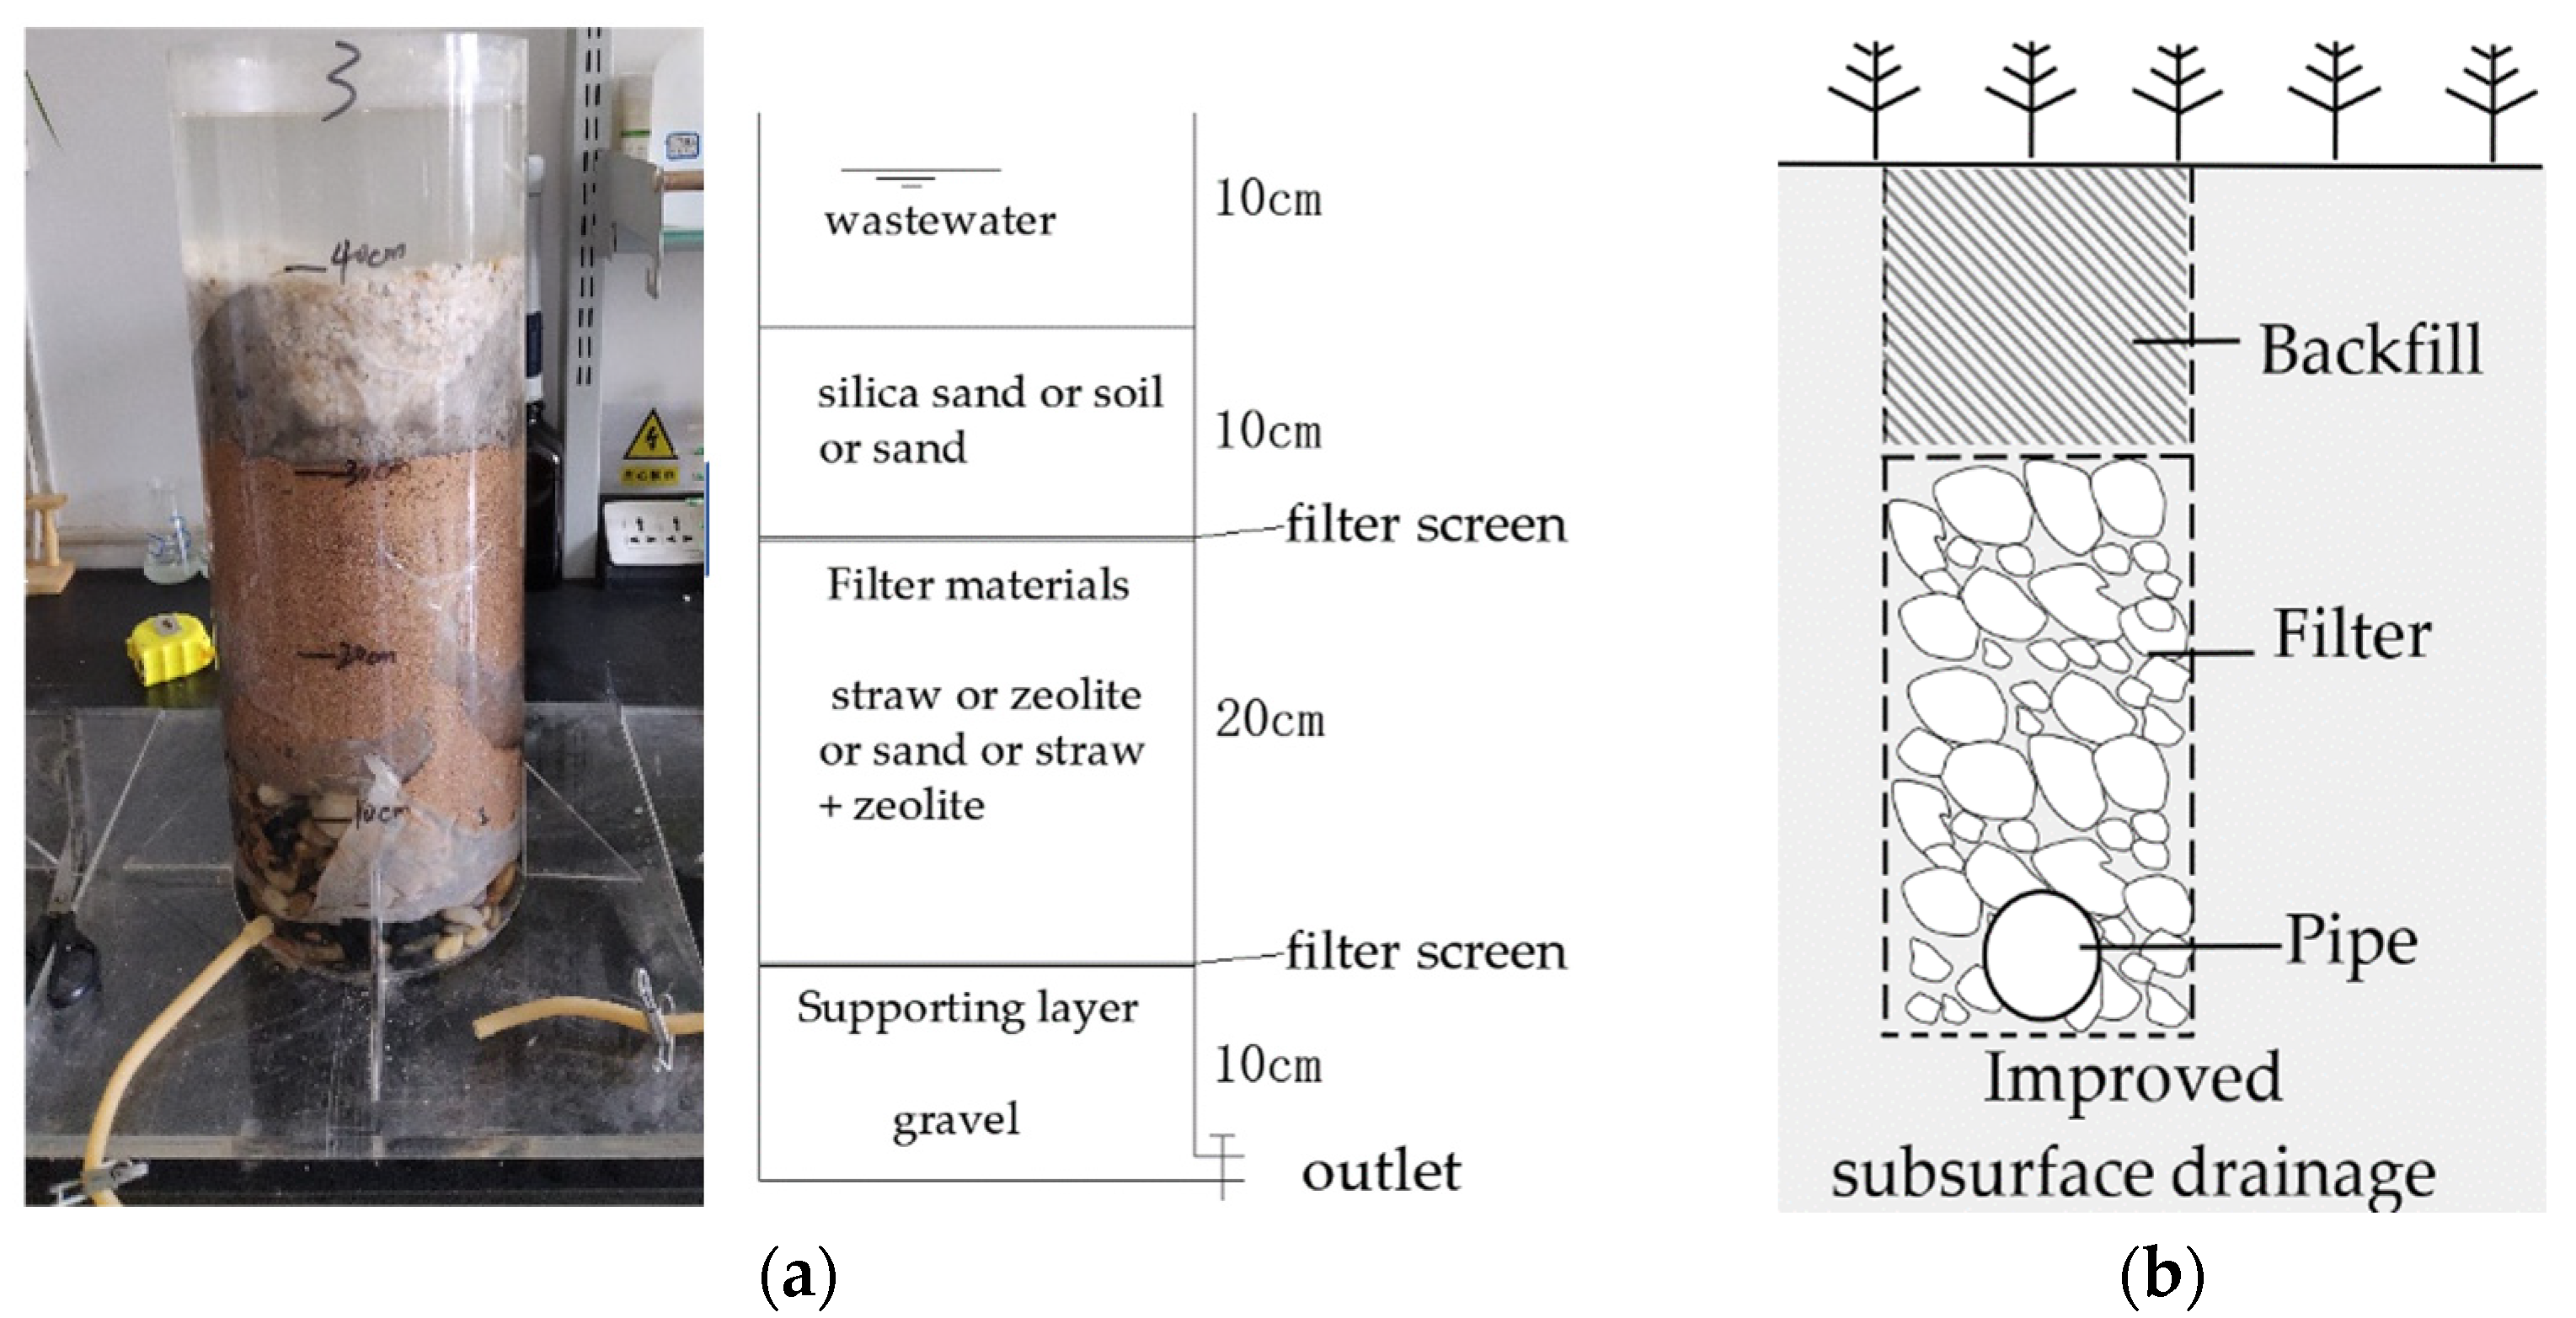
In a laboratory test, a perspex soil column with a 20 cm diameter and 50 cm height was used (Figure 1a). At the bottom of the device, an outlet was set. The gravel with a 10 cm height was set at the bottom as a supporting layer to prevent the clogging of the outlet. The upper materials were set, taking the structure of the improved subsurface drainage as reference (Figure 1b). Above the supporting layer, different filter materials, including straw, zeolite, sand, and zeolite + straw, were set with a 20 cm height. On the top of the filter materials, silica sand or soil or sand were layered within a 10 cm height. Five cases were studied, as shown in Table 1.
The wastewater was filled in the soil column to generate a surface ponding of 8 cm depth. The hydraulic retention time (HRT) was set to be 1 h, 2 h, 3 h, 4 h, 5 h, 6 h, 1 d, 2 d, 3 d, 4 d, and 5 d. Additionally, the discharges of each drainage were about 100–150 mL.
2.2. Simulation Theory
HYDRUS can be used for the simulation process of the adsorption of the NH4+ -N and TP, and the nitrification of NH4+-N to NO−3-N. Mekala and Nambi [19] evaluated the reactive transport of ammonium nitrogen under the continuous and alternate wetting and drying mode of irrigation in soil columns using HYDRUS-2D. Salehi, et al. [20] assessed the ability of the HYDRUS-2D model on simulating the effect of subsurface controlled drainage on nitrate loss of paddy fields and showed that HYDRUS-2D could simulate nitrate concentration with coefficients of determination of 0.95 and 0.89 in calibration and validation periods, respectively. Hou, et al. [21] stated that Hydrus-1D was best to simulate NH4+-N transport through the soil column. Elasbah, et al. [22] pointed out that as nitrate uptake rate and leaching are affected by soil’s adsorption, it is important to determine the adsorption coefficient for nitrate.
The governing flow equation for the two-dimensional isothermal Darcian flow of water in variably saturated rigid porous medium and the van Genuchten (VG) model were given by the literature [4]. Processes of nitrogen transformation were considered as follows: ammonia volatilization, nitrification of NH4+-N to NO−3-N, adsorption of NH4+-N, mineralization, and bio-fixation (or straw decomposition) to NH4+-N. The partial differential equations governing nitrogen transport and transformation in variable-saturated are taken as:
where θ is the volumetric water content [L3L−3], cNH4, and cP are the NH4+-N and TP concentration in the liquid phase [ML−3], sNH4 and sP are the NH4+-N and TP concentration in the soil phase [MM−1], qi is the volumetric water flux of i [LT−1], DijWNH4 and DijWP are the N and P dispersion coefficient [L2T−1], and are the first-order N transformation rate constants in liquid and solid phase [T−1] and are set as ammonia volatilization decay coefficient in this study, and are the similar first-order N transformation rate constants in liquid and solid phase [T−1] and are set as rate constants of nitrification, ρ is the soil bulk density [ML−3], / and / are the zero-order N/P transformation rate constants in liquid and solid phase [ML−3T−1] and are set as rate constants of mineralization and bio-fixation, S is a sink term [T−1], and cr is the concentration of the sink term [ML−3].
The absorbtion isotherm relating sk and ck is described by a generalized nonlinear equation of the form
where kd,k [for linear sorption, L3M−1, for Freundlich sorpion L3βM−β], βk [-] and ηk [L3M−1] are empirical coefficients. The Freundlich, Langmuir, and linear adsorption equations are special cases of Equation (3). When βk = 1, Equation (3) becomes the Langmuir equation, when η = 0, Equation (3) becomes the Freundlich equation, and when both βk = 1 and ηk = 0, Equation (3) leads to a linear adsorption isotherm.
2.3. Model Calibration and Validation
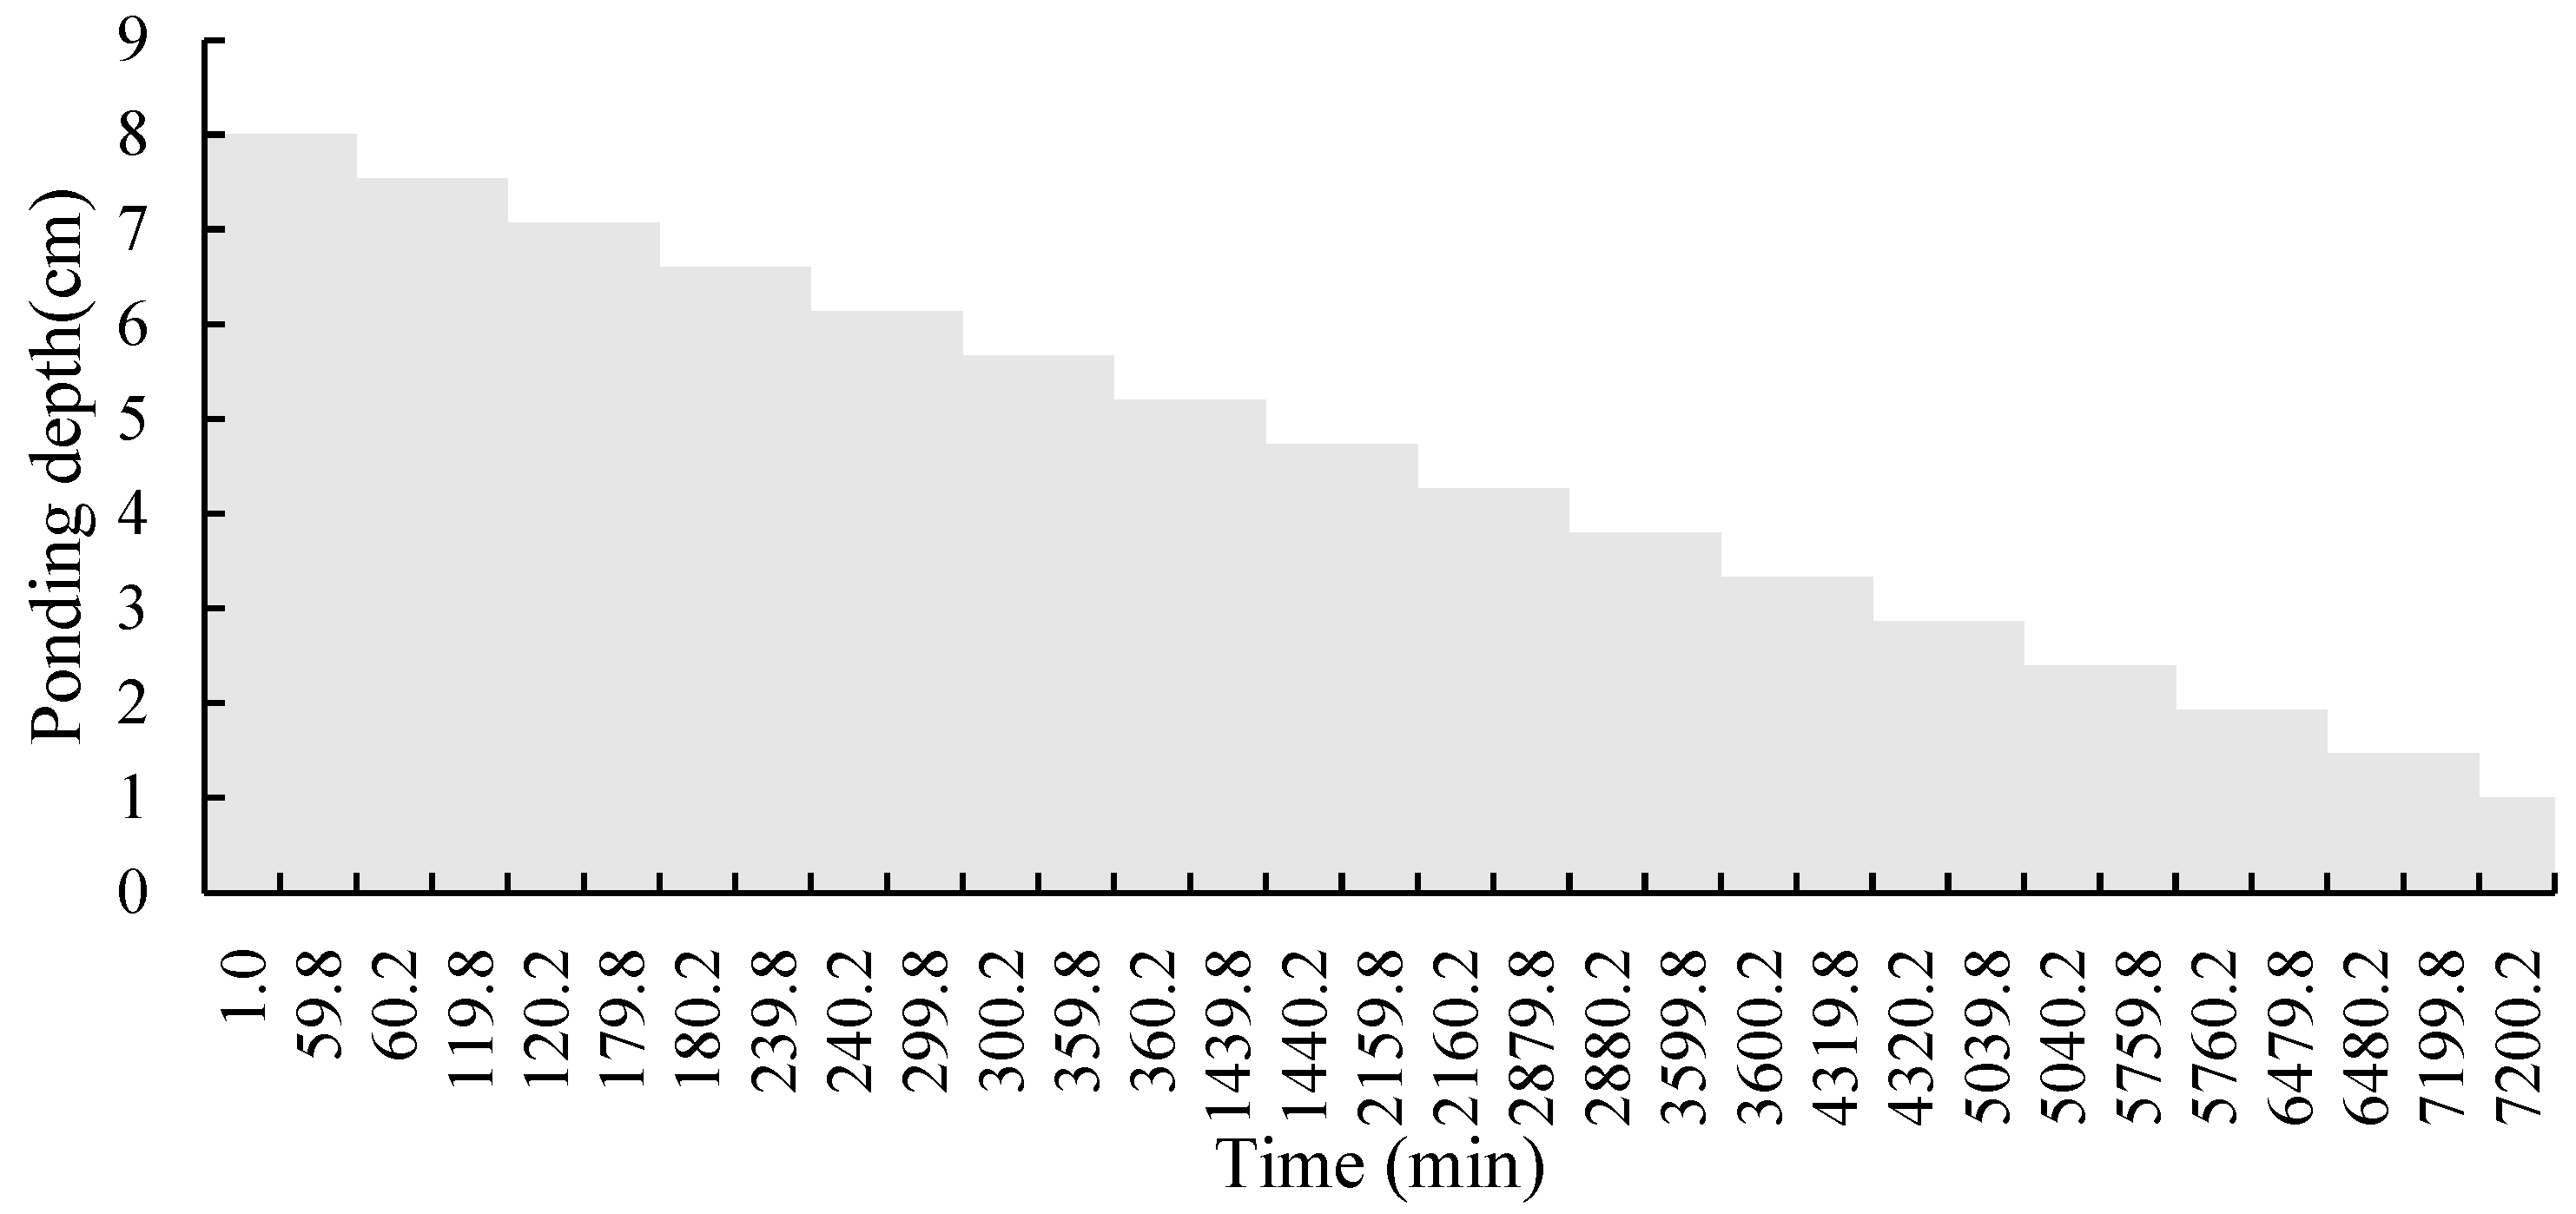
The model sketch was 40 cm in height and 17.7 cm in width, which was set according to the principle of perimeter equivalence [23]. Surface boundary was set to be a constant head boundary and the ponding depth was given in Figure 2. Another boundary around the soil was a no-flux boundary. The outlet boundary was assigned as a variable head boundary because of the control of the pipe, setting a 0 cm water head when the outlet is open and setting 1,000,000 cm water head when the outlet is closed.
The case of soil + sand, straw and zeolite were used for calibration and the case of soil + straw and zeolite + straw were used for validation. Because the size of the laboratory soil column was samll, the drain time was short and the experiment was under conditions of surface ponding, the nitrification may be inapparent and the absorbtion was obvious. Based on the reference [4], for one-time drainage of improved subsurface drainage, the top-five most significant effect factors for the NH4+-N loss were the soil adsorption capacity, filter adsorption capacity, N dispersion coefficient of the filter, N dispersion coefficient of the soil, and nitrification coefficient of the filter. Hence, during the calibration and validation, the absorbtion was mainly considered which could also provide a reference for the filter chosen.
The hydraulic property parameters of the soil, sand, straw, gravel took the values adopted by [1,24] and the hydraulic property parameters of zeolite took sand as reference. Details of the hydraulic parameters are shown in Table 2.
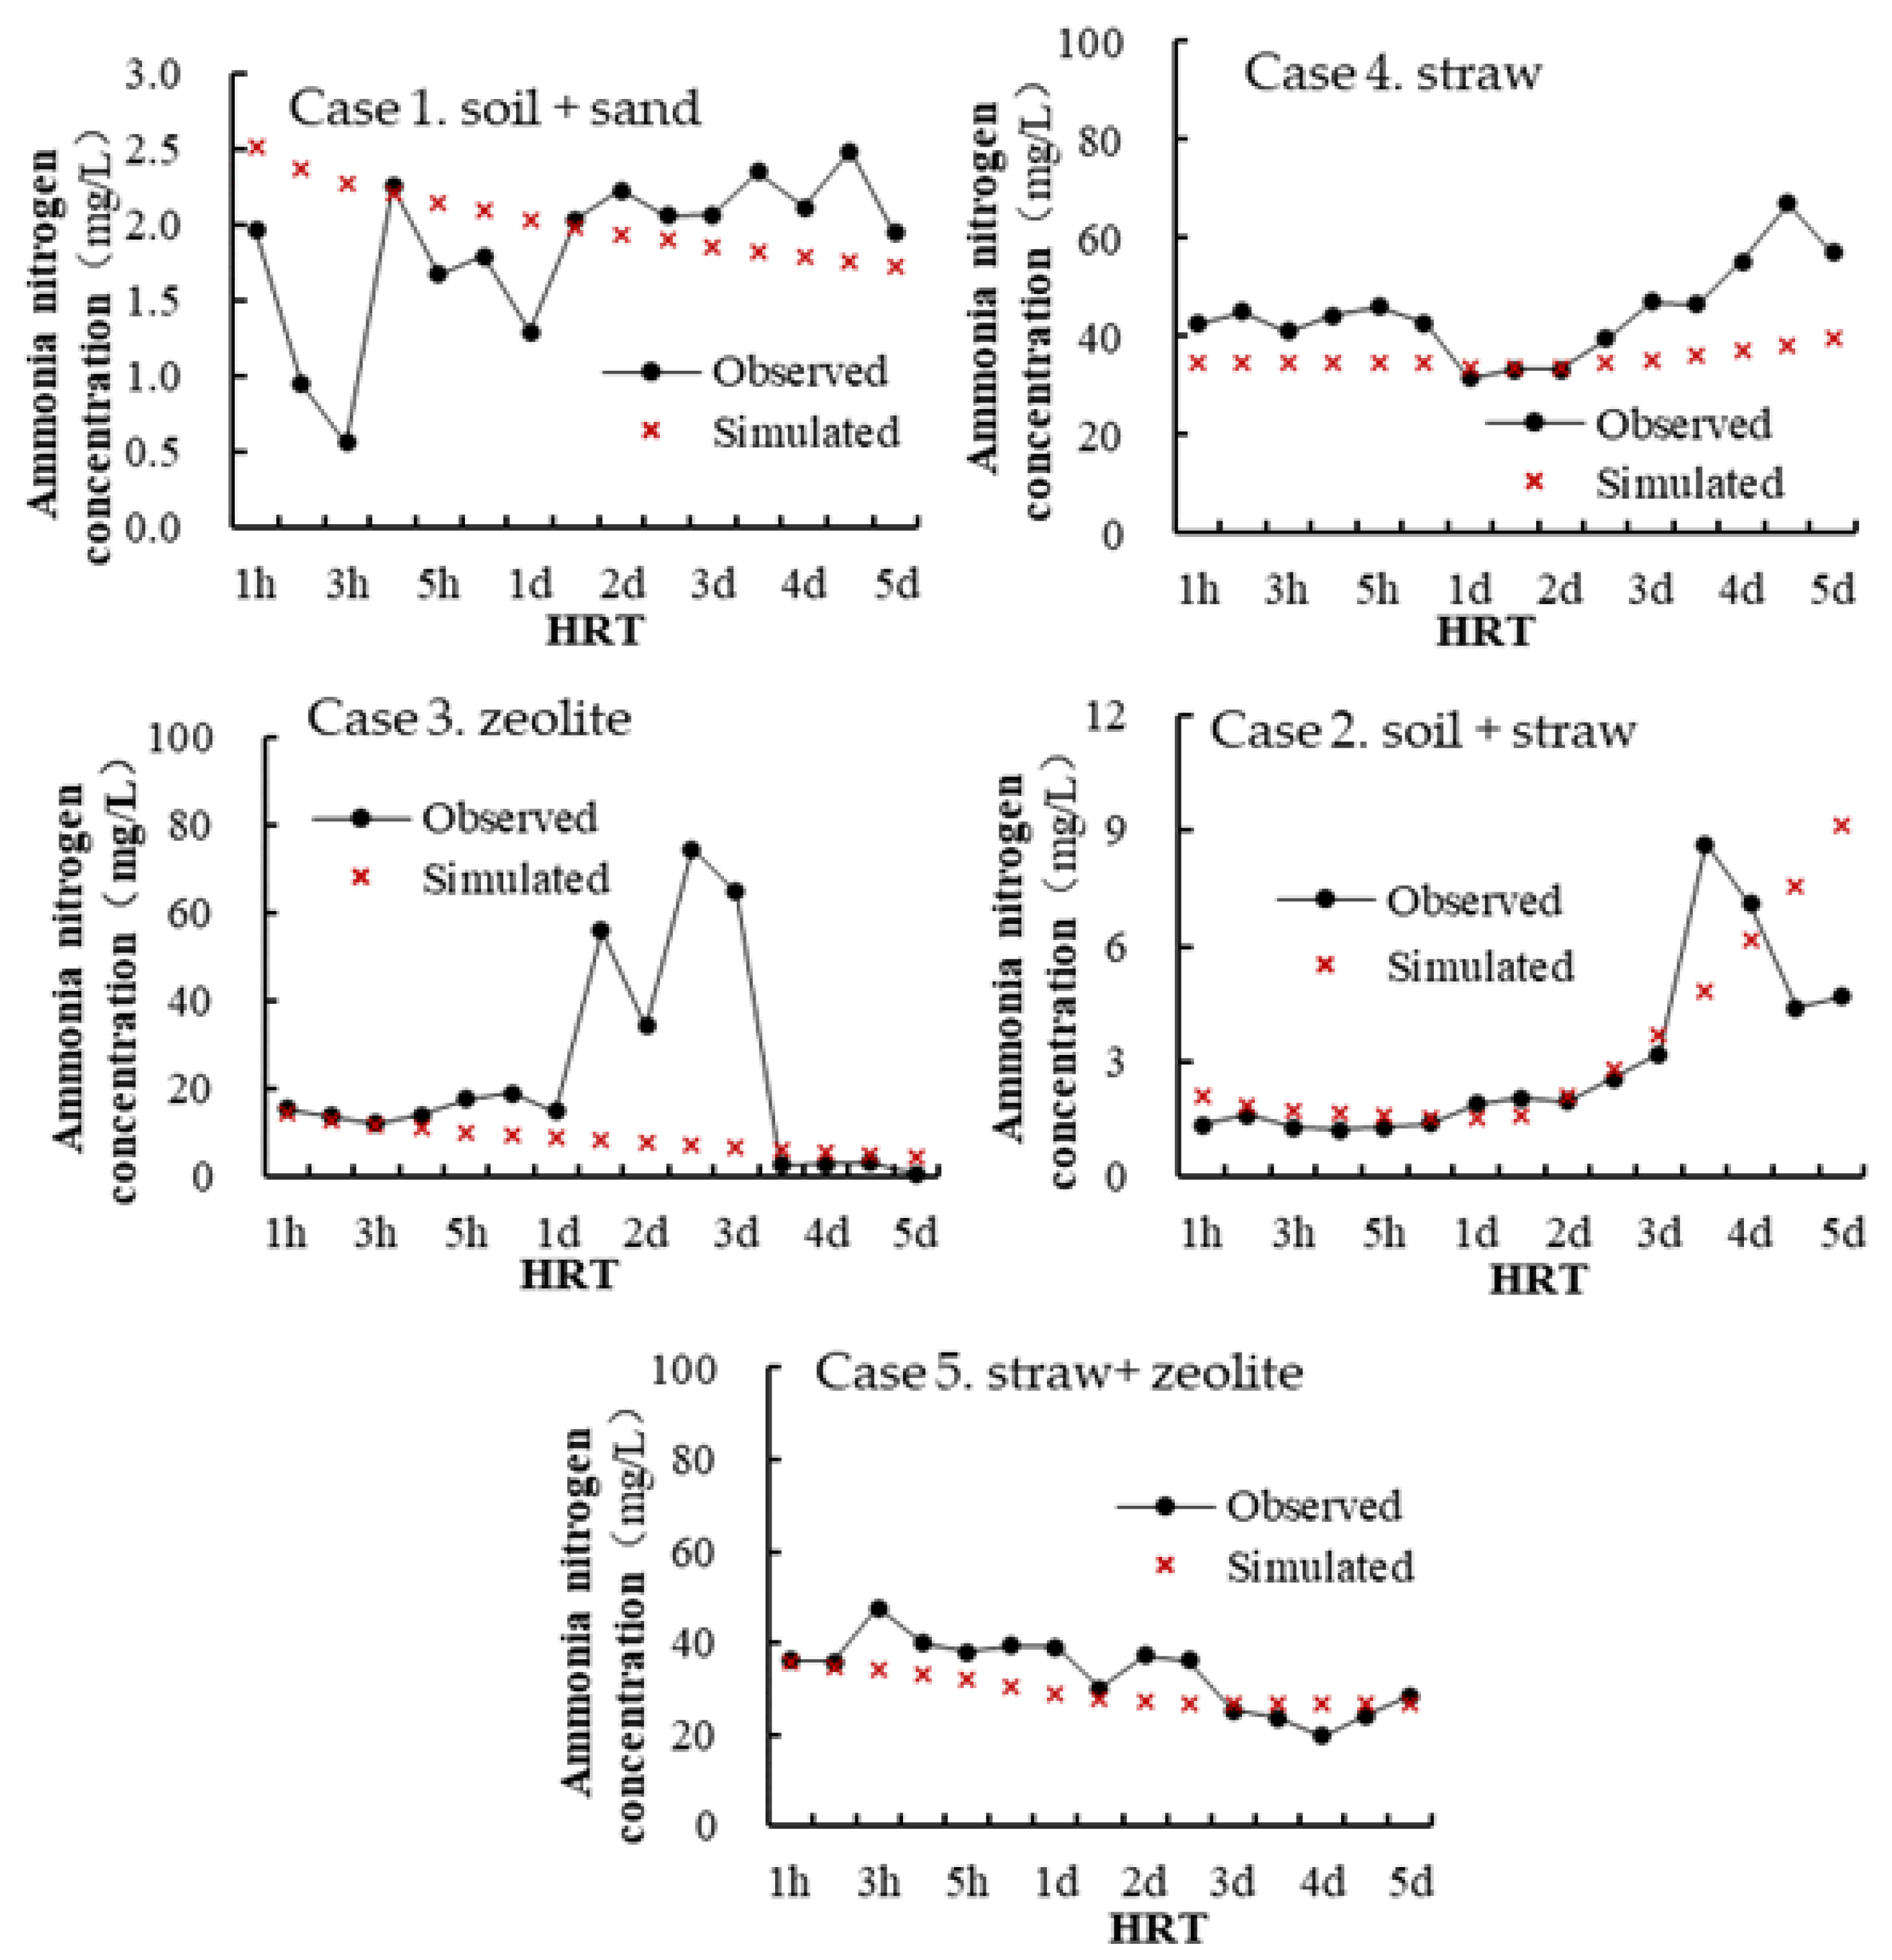
Input parameters for the solute transport part were considered using the following values: the molecular diffusion coefficient (DwNH4) for nitrogen is 1.52 cm2d−1 [4,25], the molecular diffusion coefficient (DwP) for phosphorus is one thousandth of DwNH4, taking the literature [26] and [27] as references. The DL of the soil is 3 cm [28] and the DL of the gravel is 30 cm [25,29], and the DL of other materials is determined by taking the partical size as reference. The DT of all materials equals one-fifth of the DL. Other calibrated parameters were shown in Table 3. The comparisons of the observed and simulated NH4+-N concentrations are shown in Figure 3.
To deeply evaluate model performance of water simulation, statistical parameters of correlation coefficient (R) and relative error (RE) were selected and shown in Table 4. For the case of zeolite, the NH4+-N concentrations were sharply increased when the HRT was 1 d and the large concentrations lasted until 3 d. Then, the NH4+-N concentrations were sharply decreased. The mechanism of this process is not clear and it may be an error of measurement, so the influence of this period is ignored in the statistical parameters. Totally speaking, the simulation results may be accepted whose relative errors were within 25%.
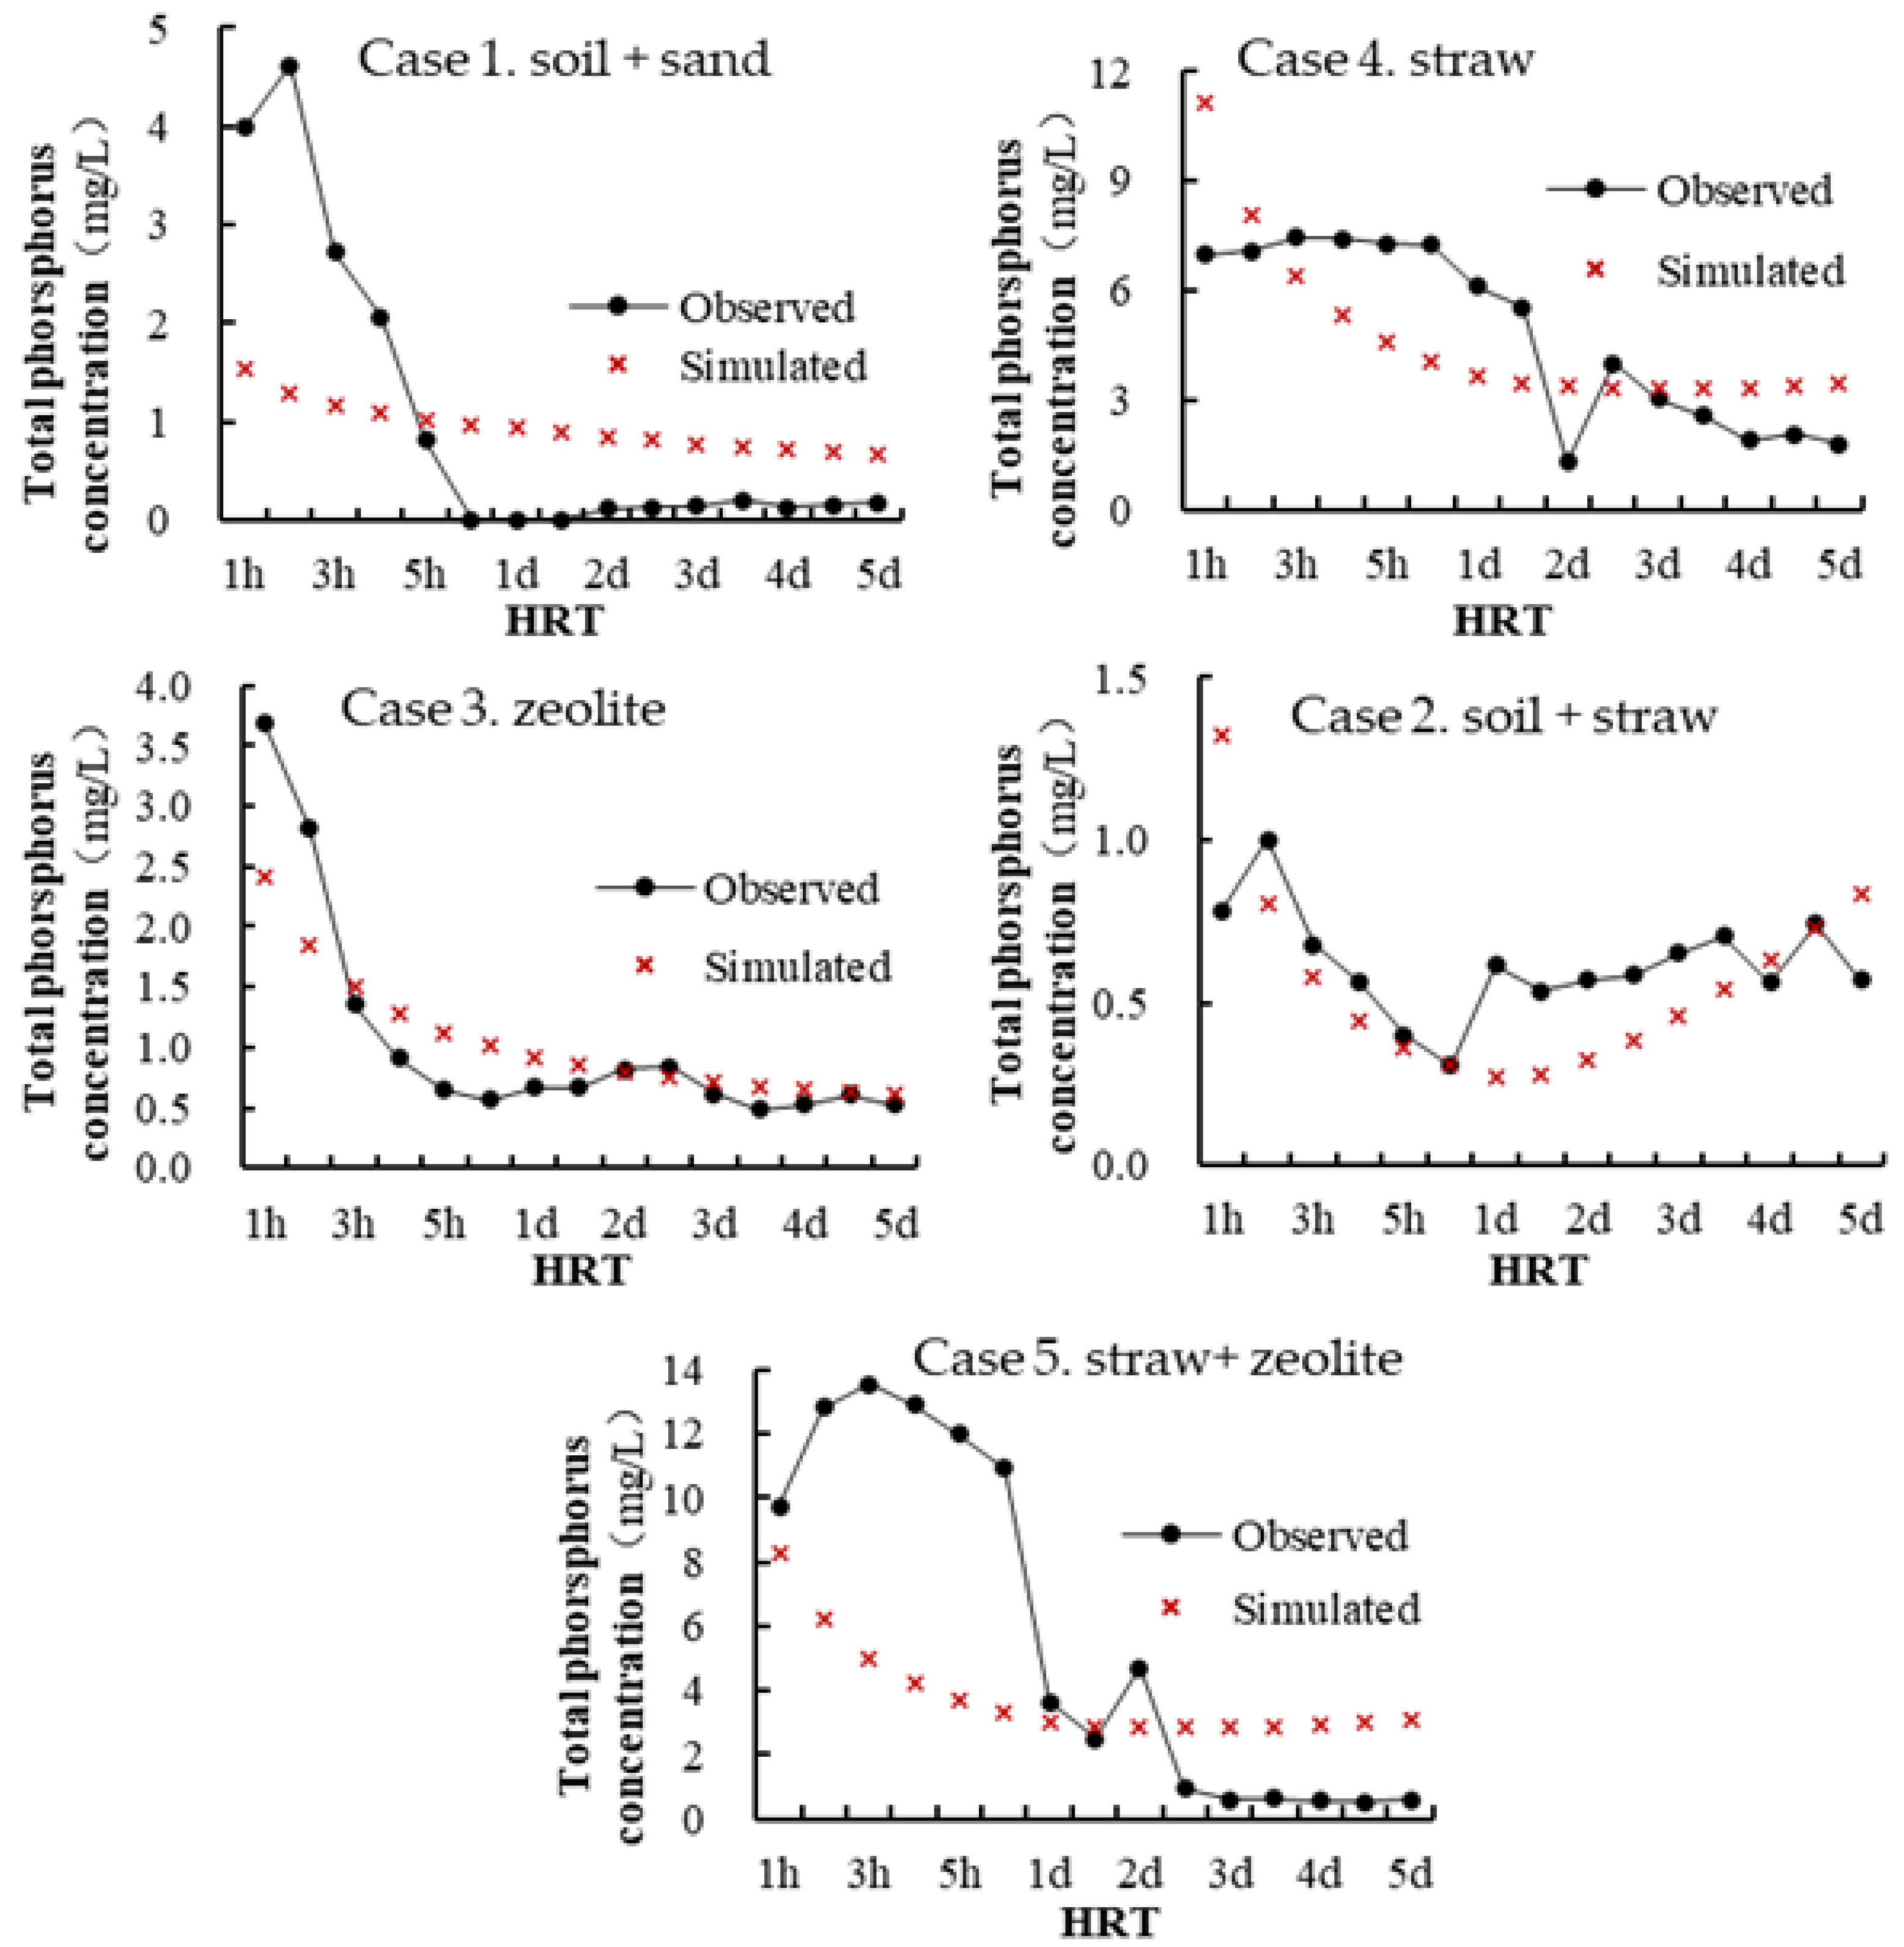
For the simulation of TP, the comparisons of observed and simulated TP concentrations are shown in Figure 4. The statistical parameters of TP simulation are shown in Table 5.
For the case of straw + zeolite, original correlation coefficient and relative error were 0.63 and 34.1%, respectively. The TP concentrations increased obviously when the HRT was from 1 h to 5 h, and then decrased sharply when HRT was 1 d. It was hard to explain the mechanisms. The correlation coefficient and relative error were 0.85 and 9.45%, except the data from HRT of 2 h to 5 h. Totally speaking, the simulation results may be accepted.
2.4. Simulated Scenarios
(1) Scenario 1: effect of soil and filter layout
For the improved subsurface drainage, upper soil depth, thickness of the filter, and filter materials are very important for nitrogen and phosphorus loss. Hence, based on the laboratory experiment, the simulation considered different situations in Table 6. The initial concentrations of nitrogen and phosphorus were set to be 10 mg/L. Other conditions were the same as those of laboratory experiments. In this scenario, concentrations with a HRT of 5 h were studied.
(2) Scenario 2: Mixed filter with straw
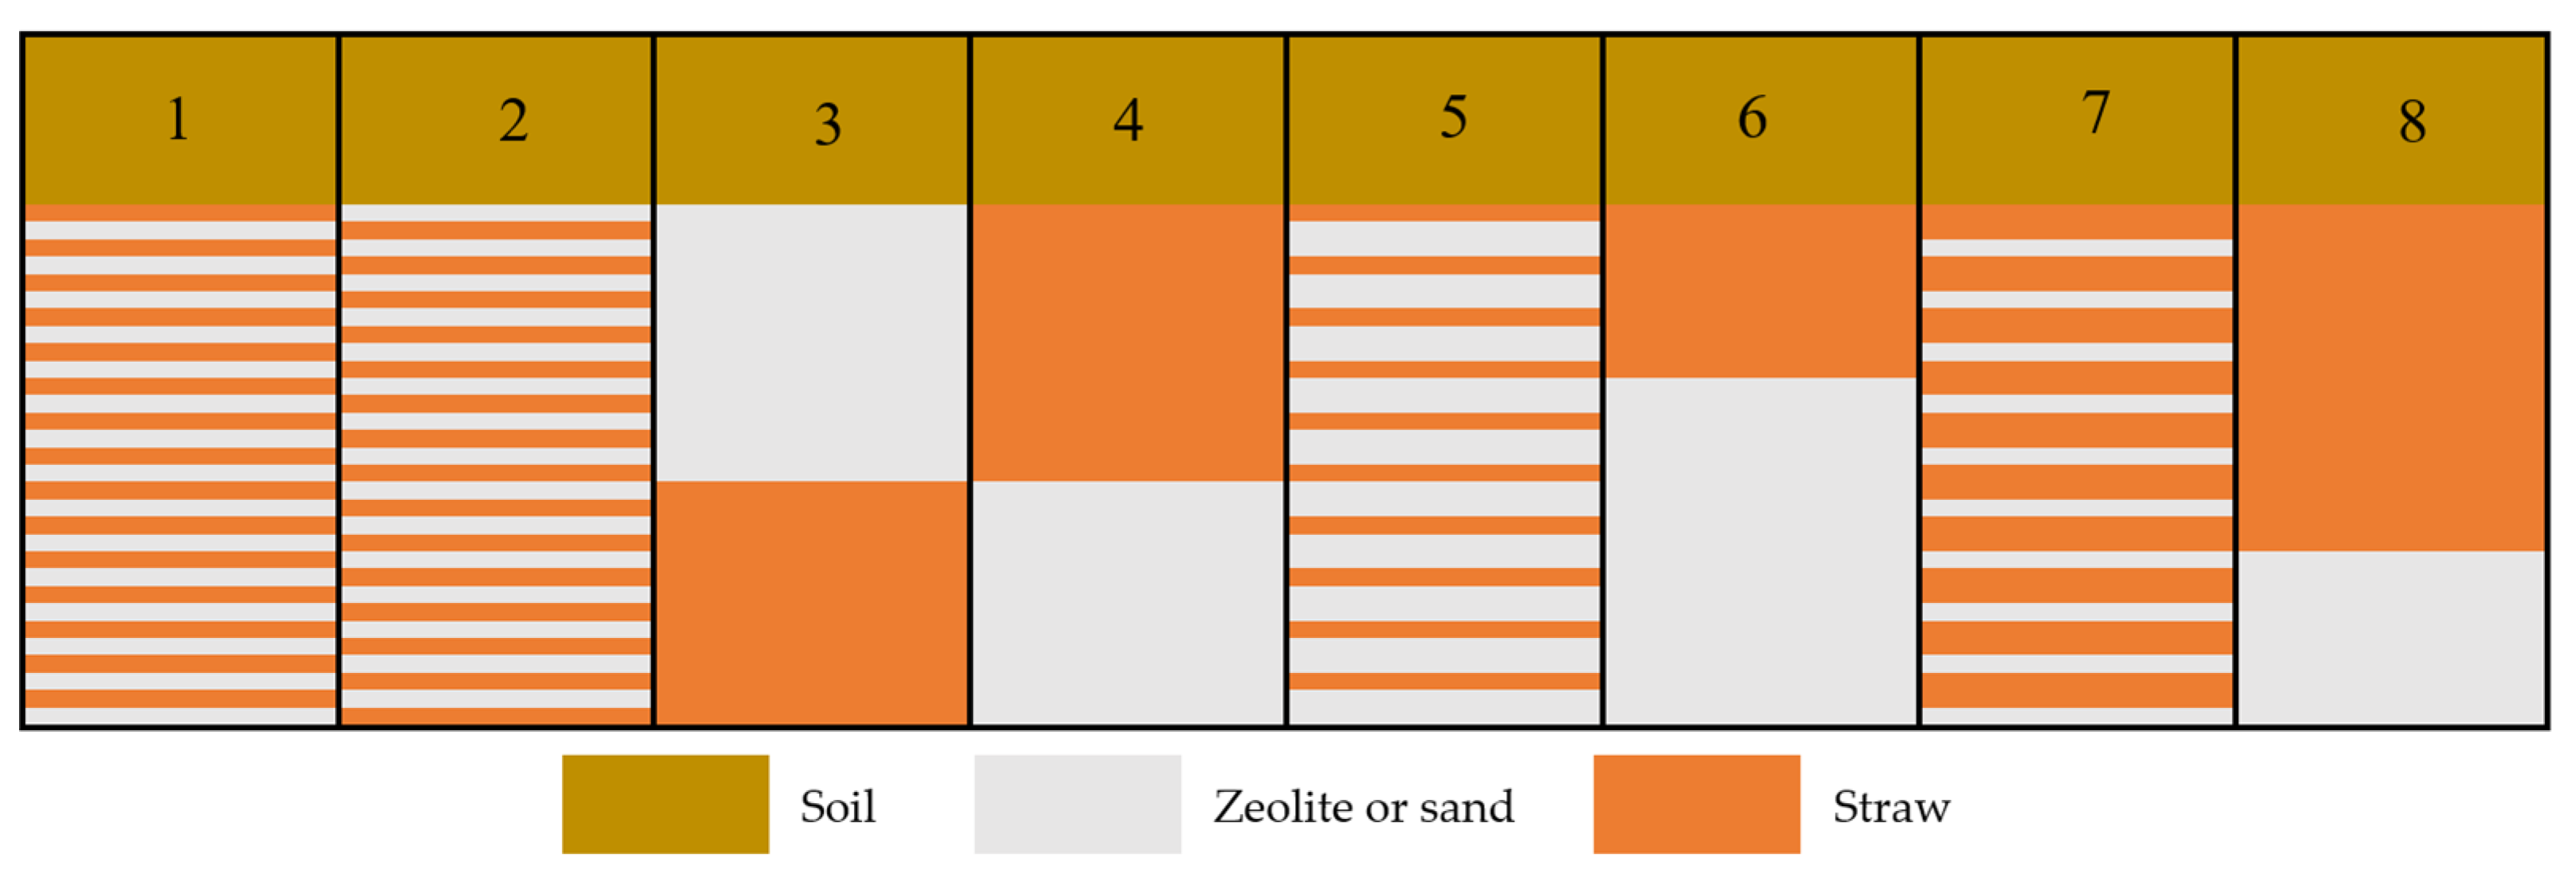
Straw is a cheap material and is easily attained. Mixed filter with straw and other material may be chosen for reducing the cost. Additionally, straw can improve the soil nutrient effectively. In the paper, different proportions were considered between straw and zeolite or sand. The layout of the mixed filter can be seen in Figure 5. The proportion of straw and zeolite or sand is 1:1 in case 1–4, is 1:2 in case 5–6, and is 2:1 in case 7–8. The upper soil was of a 10 cm thickness and there was no lower soil. In this scenario, the concentrations with HRT of 5 h were also studied.
3. Results
3.1. The Adsorption of Different Materials
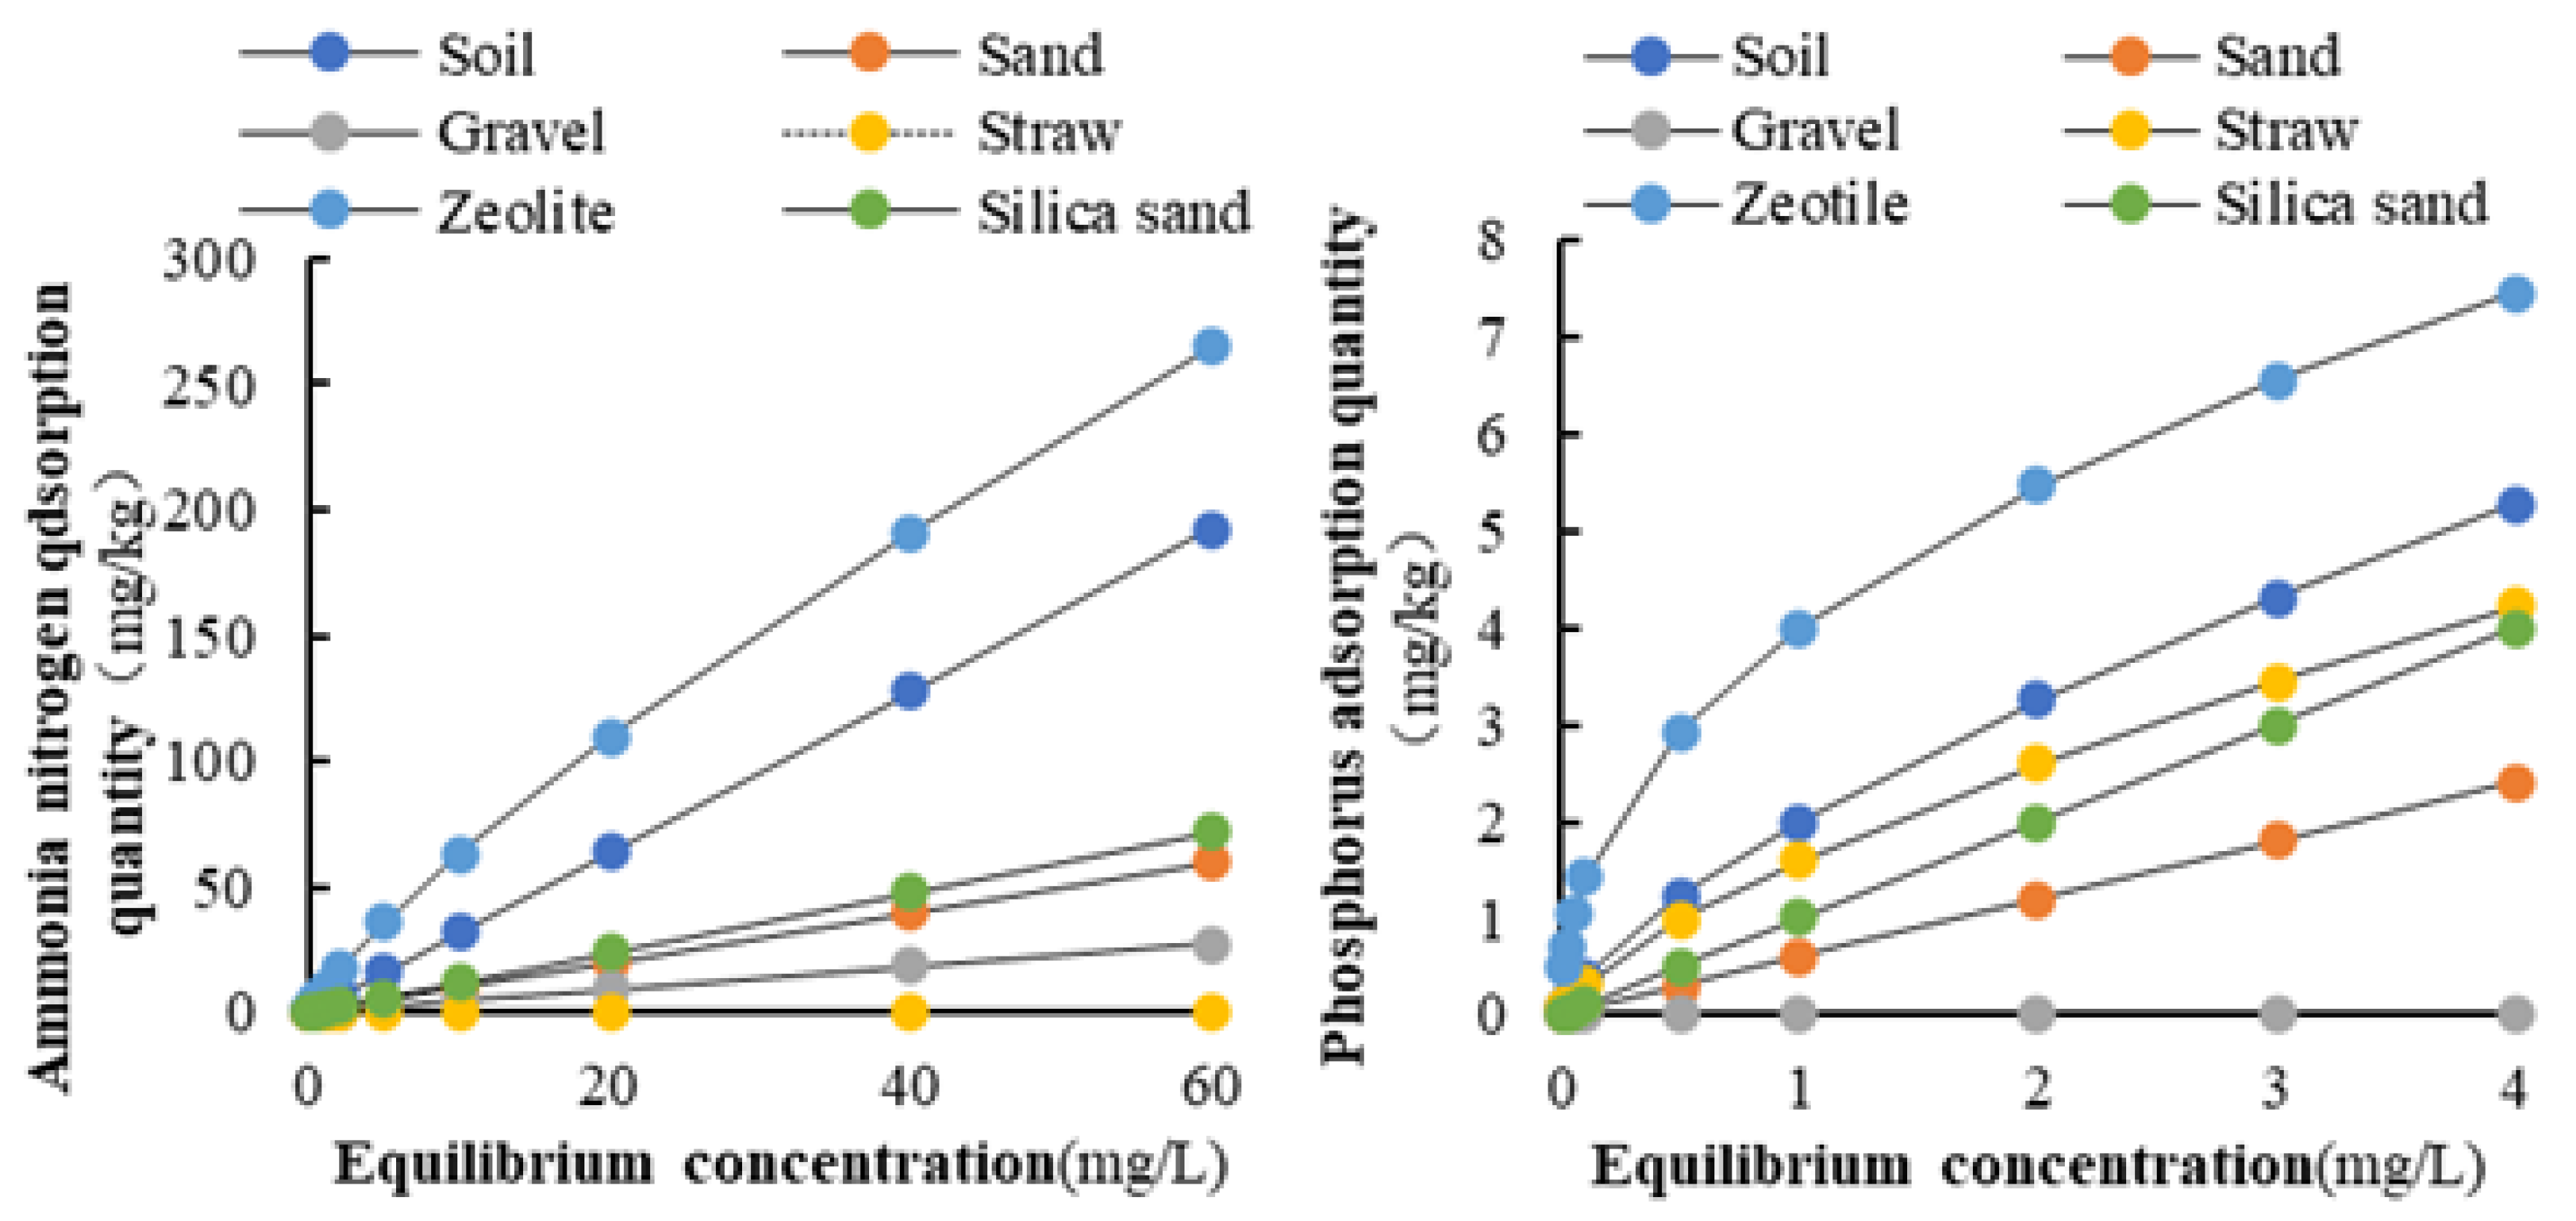
Based on calibration and validation, the adsorption coefficients were given for different materials. In this simulation, the Freundlich isotherm adsorption equation was more suitable for all materials. The Freundlich adsorption curves of NH4+-N and TP are given in Figure 6. The adsorption capacity of NH4+-N from large to small is zeolite, soil, silica sand, sand, gravel, and straw. For TP, the order from large to small is zeolite, soil, straw, silica sand, sand, and gravel. The zeolite showed good adsorption characteristics for both NH4+-N and TP, while the straw’s adsorption characteristics were very different for NH4+-N and TP.
3.2. Effect of Materials in Scenarios 1
The nitrogen and phosphorus losses had a great difference with different filter materials, shown in Figure 7. With materials of zeolite, sand, and straw + zeolite, the NH4+-N concentrations in outflow decreased with the increasing HRT. Because of the good adsorption of zeolite, NH4+-N concentrations under the filter materials of zeolite or straw+ zeolite cases were the lowest. Straw and zeolite + straw filter may lead a larger nitrogen concentration with a larger HRT. The main reason may be that straw would release NH4+-N and the amount of the NH4+-N would increase with the increasing HRT, which may lead to a larger concentration of the outflow. When HRT was 5 d, NH4+-N concentration was 46.3 mg/L for the straw case. It could be seen that filters of straw + zeolite and zeolite + straw generated a big difference in the NH4+-N loss. The materials around the outlet may be more important. For the situation of the sand filter, the effect of NH4+-N reduction may be obvious if the HRT is large enough.
For the phosphorus losses, the sand filter showed a larger phosphorus concentration of 7.4 mg/L when the HRT was 5 d. This is because of the lower phosphorus adsorption of sand material. The phosphorus concentrations under zeolite and straw + zeolite cases were the smallest with about 0.0007 mg/L, and under straw and zeolite + straw filter cases were about 1.9 mg/L. Additionally, with the HRT of 5 d, the situations of straw and zeolite + straw filter may lead to increased phosphorus concentration with increasing HRT. The phosphorus concentration of the outflow is also determined by the materials around the outlet. Molecular diffusion coefficients for phosphorus were much smaller compared with that for nitrogen, which would make the effect of the materials around the outlet be more significant in a short draining time.
3.3. Effect of Soil Depth and Location in Scenario 1
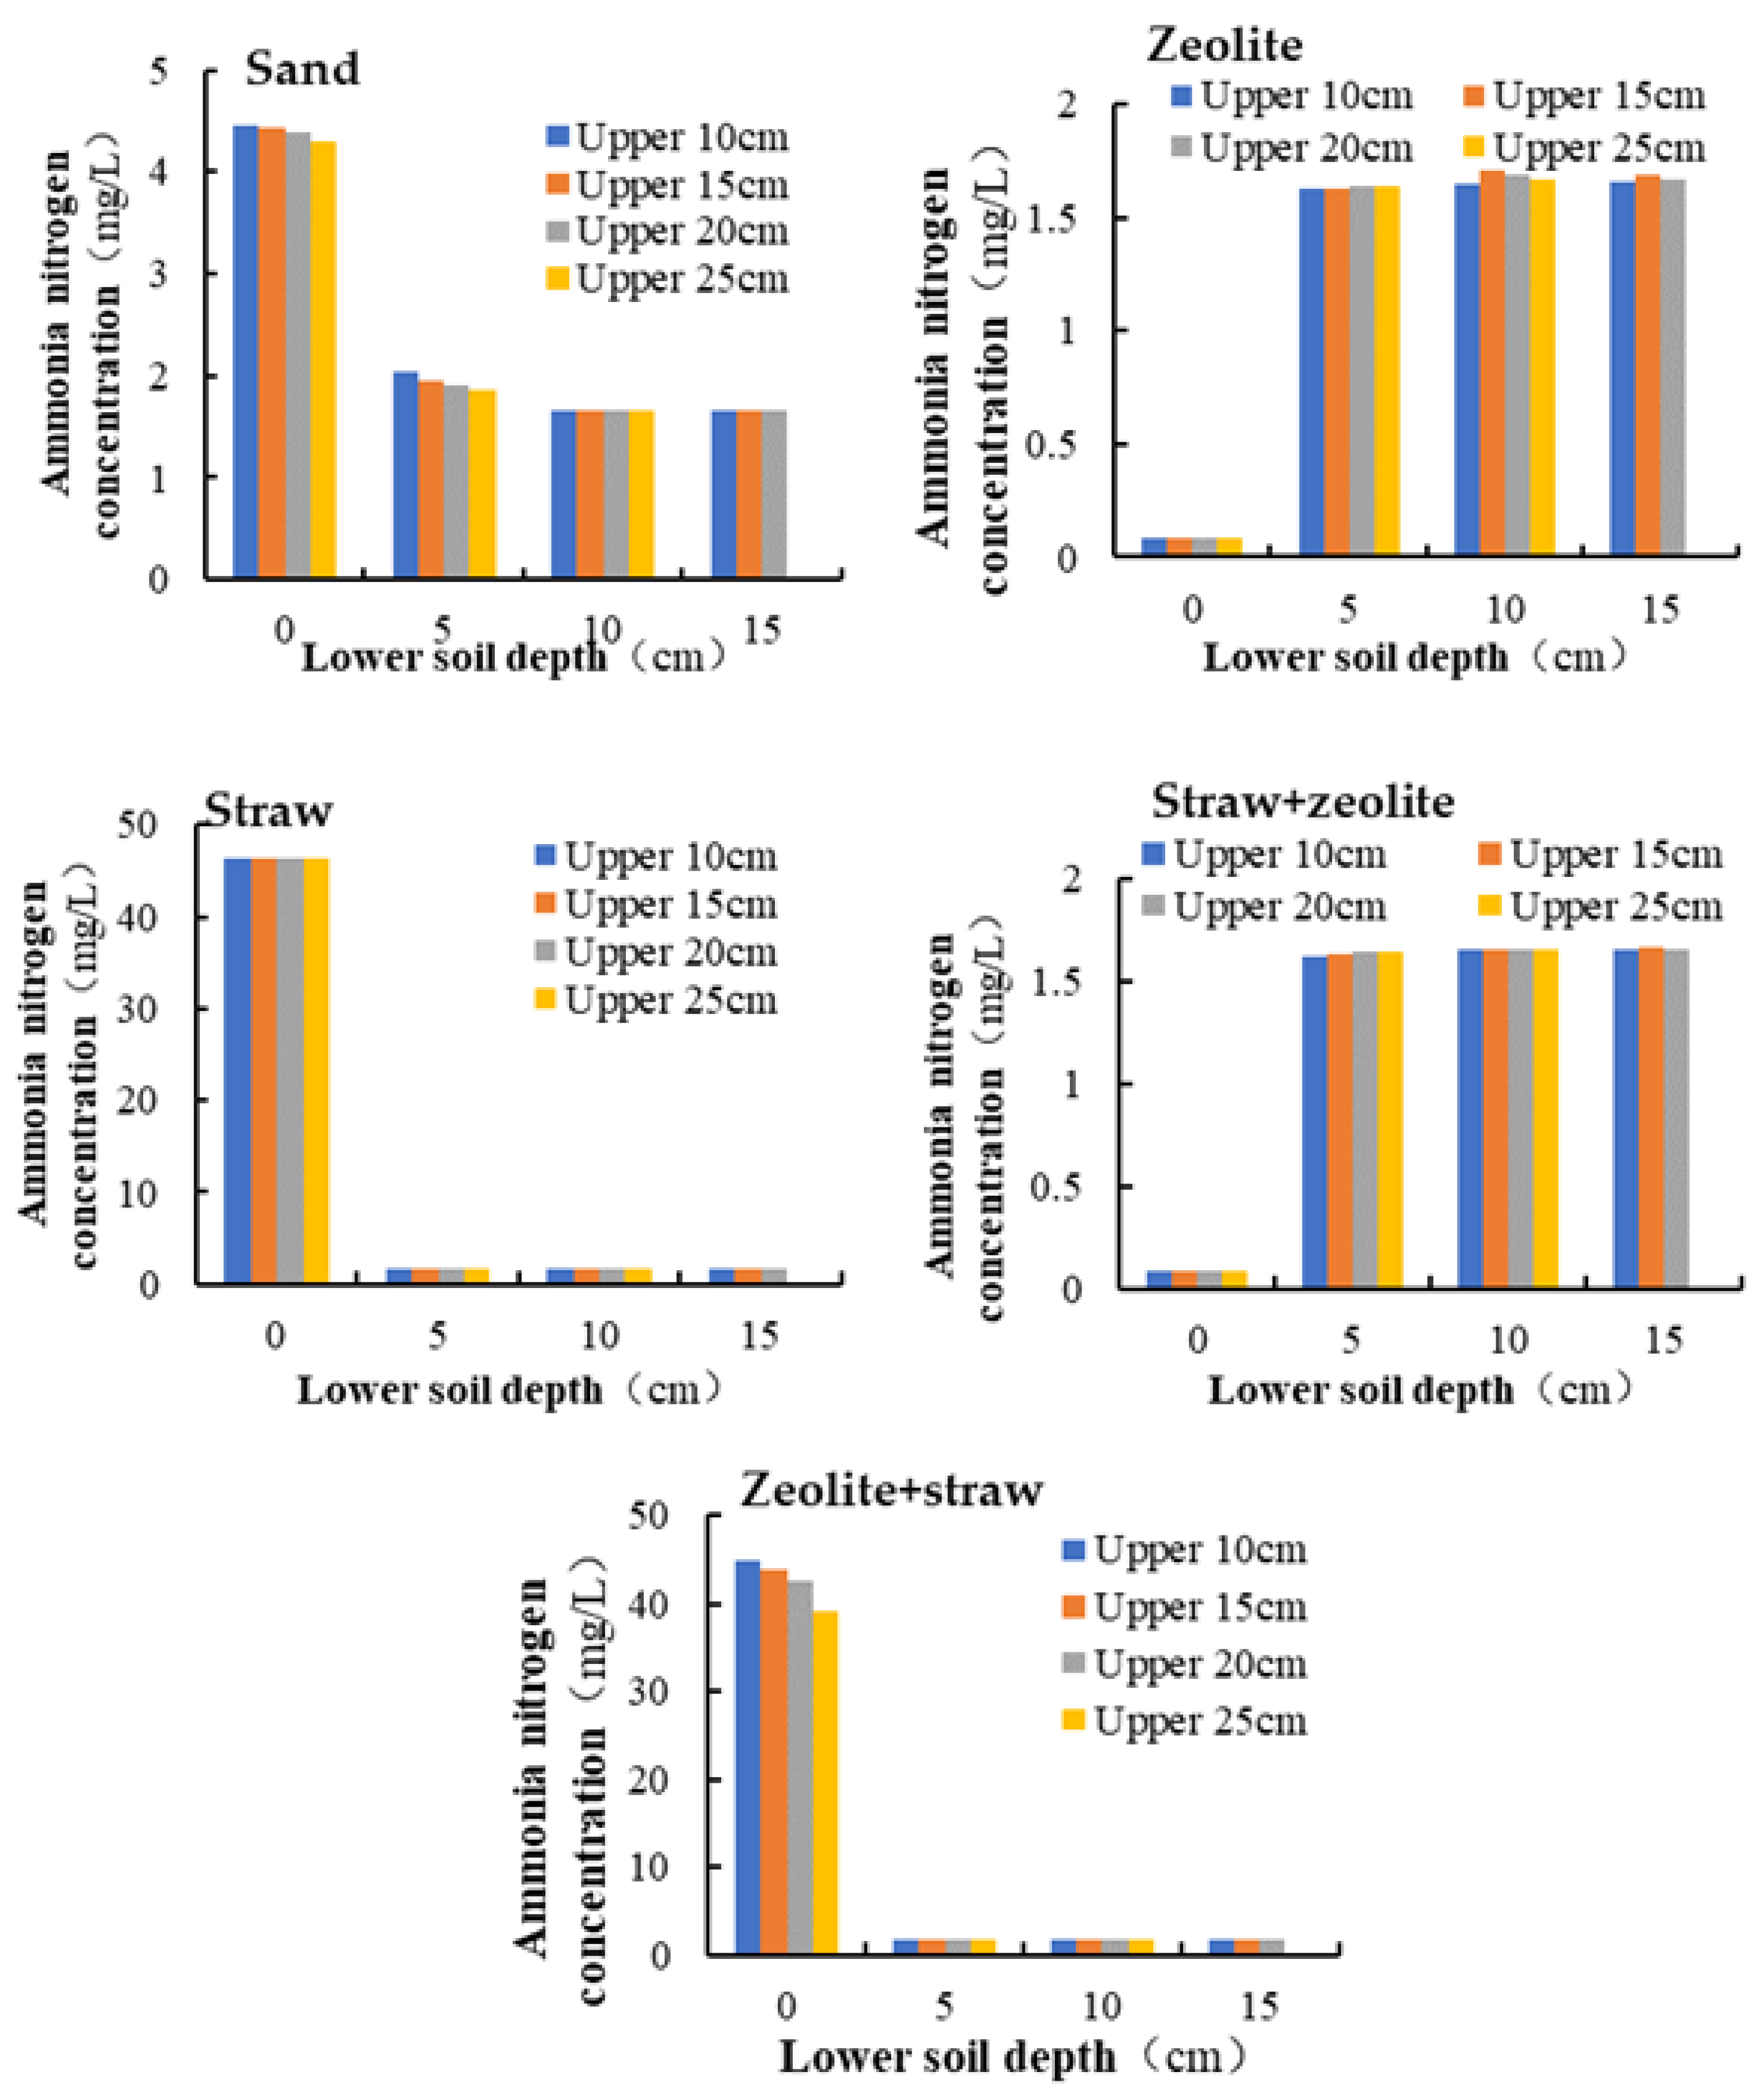
From Figure 8, it can be seen that there was a big difference for different lower soil depths. When lower soil depth was larger than 5 cm, the NH4+-N concentrations were affected little by filter materials, except for the sand filter case, which had a little effect until that lower soil depth was 10 cm. The NH4+-N concentrations with more than a 5 cm-lower soil depth in all cases were about 1.65 mg/L.
Compared with no lower soil cases, when lower soil depth was 5 cm, the NH4+-N concentrations under sand, straw, and zeolite+ straw cases decreased obviously. The decreased percentages from large to small, in turn, were under straw, zeolite + straw, and sand with 96.3%, 96.2%, and 54.5%, respectively. While for the cases of zeolite and straw + zeolite, the lower soil layer may increase the drainage of NH4+-N concentration. When the lower soil depth was 5 cm, the NH4+-N concentrations would be five times more than that without lower soil.
For the influence of upper soil depth, the sand and zeolite + straw cases decreased with the increasing upper soil depth in a small range when lower soil depth was no more than 10 cm. The NH4+-N concentrations were 4.46 mg/L, 4.43 mg/L, 4.38 mg/L, and 4.30 mg/L, respectively, corresponding to upper soil depths of 10 cm, 15 cm, 20 cm, and 25 cm without lower soil.
For TP concentration, the general trends with different upper and lower soil depth were the same as that for NH4+-N concentrations. TP concentrations with more than 5 cm lower in soil depth in all cases, except zeolite filters were about 0.28 mg/L. Compared with no lower soil cases, when lower soil depth was 5 cm, the TP concentrations under sand, straw, and zeolite + straw cases decreased obviously. The decreased percentages from large to small, in turn, were under filters of straw, zeolite + straw, and sand, with 96.2%, 84.1%, and 84.1%.
3.4. Mixed Filter with Straw in Scenario 2
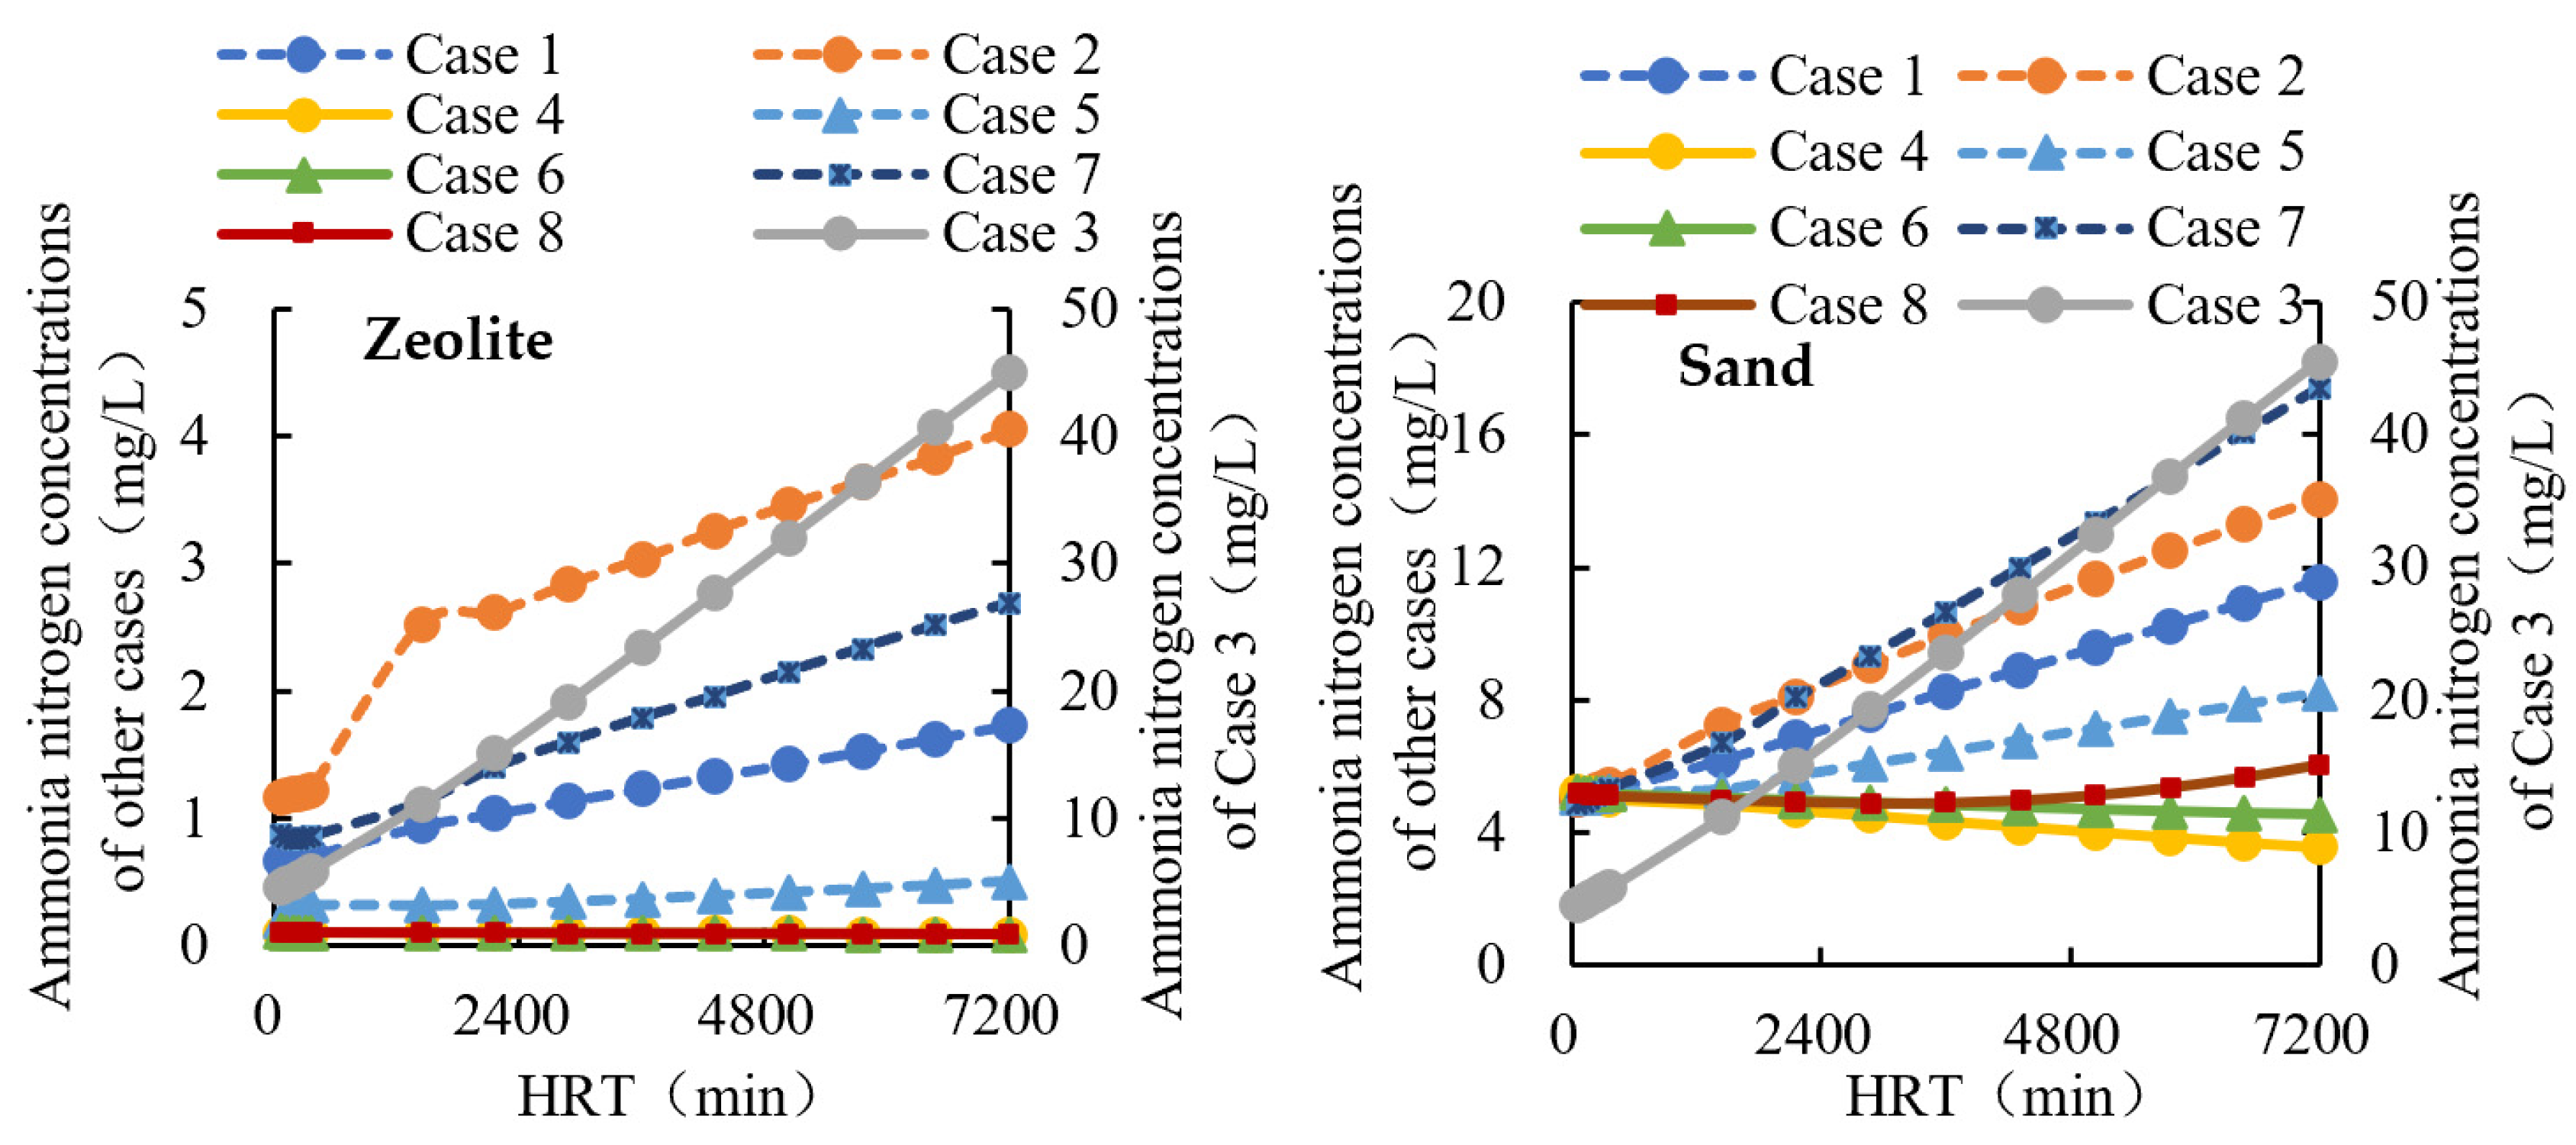
In Figure 9, for Cases 1–4, in which the ratio of straw and zeolite was 1:1, the NH4+-N concentrations from large to small, in turn, were Case 4, Case 1, Case 2, and Case 3 with 0.33 mg/L, 0.67 mg/L, 1.16 mg/L, and 4.56 mg/L, respectively, when HRT was 60 min and 0.09 mg/L, 1.72 mg/L, 4.05 mg/L, and 44.94 mg/L when HRT was 5 d. It could be seen that when the straw was set near the outlet, the NH4+-N concentrations of drainage would become large. In Case 4, the NH4+-N concentration was the same as that of the zeolite filter without the straw case; that is to say, the mixed filter would be feasible. For Case 6 and 8, the ratios of straw and zeolite were 1:2 and 2:1, and the zeolite was set near the outlet without hierarchy, and the NH4+-N concentration was still the same as the whole zeolite filter case. In the view of the cost, the Case 8 may be more suitable.
For the cases of mixed straw and sand filter, the NH4+-N concentrations of Case 3 and Case 7 were the smallest when HRT was 60 min. That was because the NH4+-N volume that came from the straw decomposition was still small. When HRT was 5 h, Case 4 showed the better effect on NH4+-N concentration reduction, with 3.55 mg/L, than Case 6, with 4.55 mg/L. The difference from Case 4 and 6 in Case 8 is that the NH4+-N concentrations with a HRT of 2 d had a slight decrease and then increased. It could be found that when straw and sand are mixed as the filter, the ratio of straw and sand was 1:1, and the sand set near the outlet may be better for NH4+-N reduction.
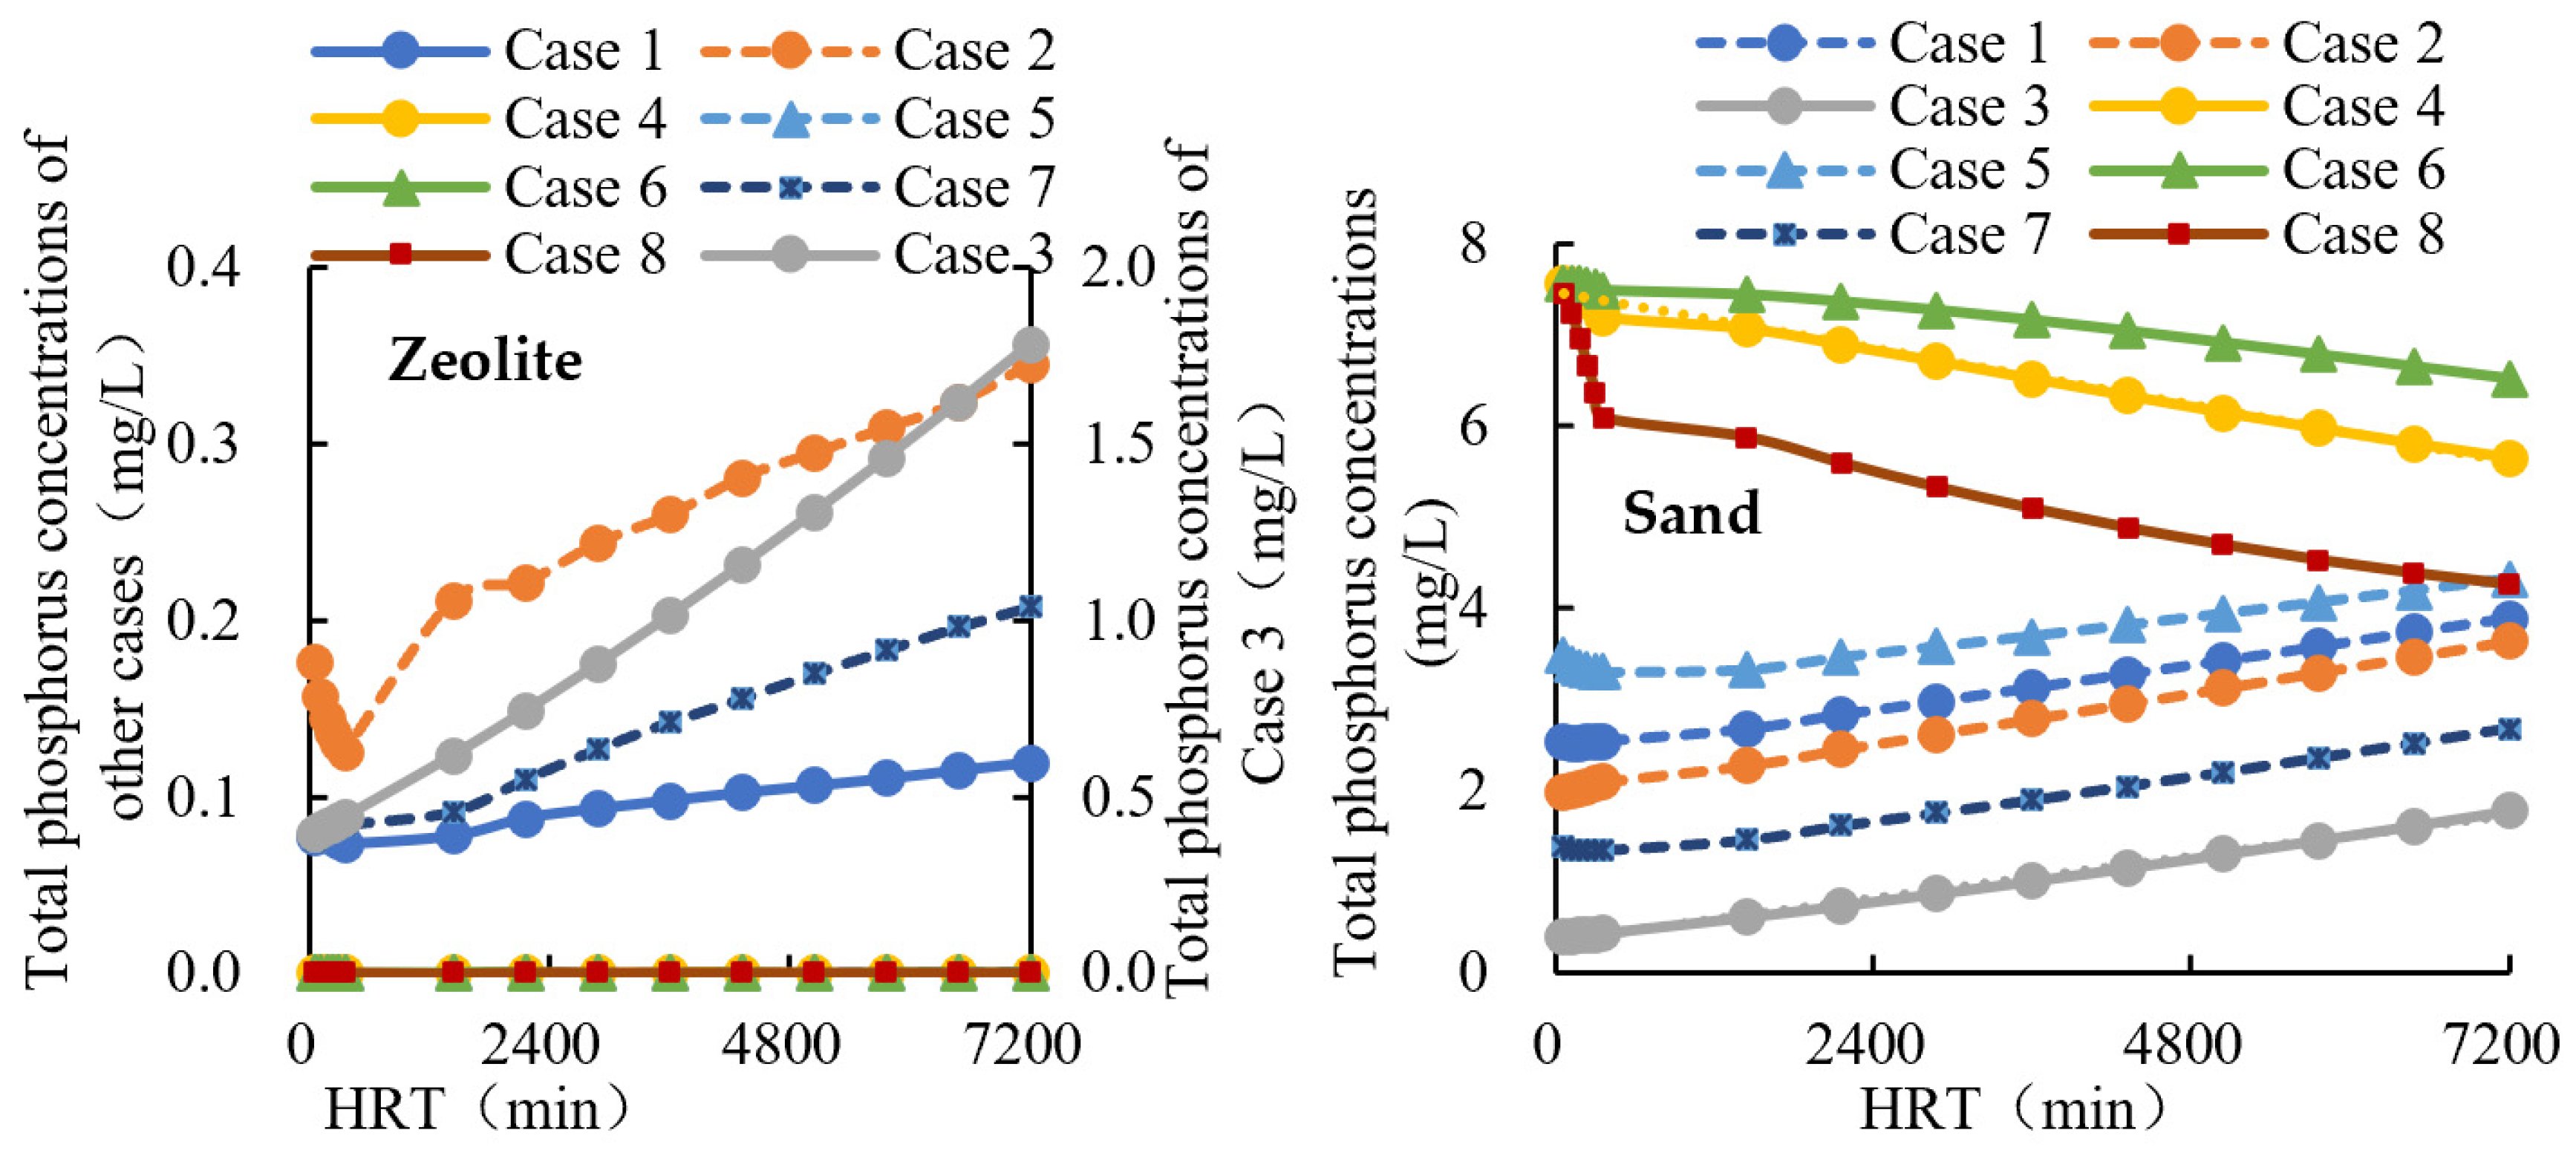
From Figure 10, it could be seen that under Case 4, Case 5, Case 6, and Case 8, the TP concentrations in the drainage were the same as that with the whole zeolite filter. For Case 2, with the increasing HRT, the TP concentrations decreased firstly when HRT was less than 6 h and then increased. Other rules were similar with the results of the NH4+-N concentrations. That the ratio of straw and zeolite was 2:1 and the zeolite was set near the outlet may be better for TP reduction.
For the mixed straw and sand filter, when HRT was 60 min, TP concentrations from large to small, in turn, were Case 3, Case 7, Case 2, Case 1, Case 5, Case 8, Case 4, and Case 6. At this moment, the closer to outlet the sand was, the larger the TP concentration of the drainage was. With the increasing HRT, TP concentrations were decreased in Case 4, Case 6, and Case 8, and increased in other cases. When HRT was 5 d, the TP concentration in Case 8 was equal to that in Case 5 with about 4.3 mg/L, and the TP concentrations with straw filter were still smaller with 1.78 mg/L. If HRT was larger, the mixed straw and sand cases could be chosen. When HRT was more than 10 d, under conditions that the ratio of straw and sand was 1:1 and the sand was set near the outlet, TP concentrations were smaller than that under the straw filter. In view of long-time running, considering the NH4+-N and TP concentrations of the drainage, the case that the ratio of straw and sand was 1:1 and the sand was set near the outlet could be better.
4. Discussion
In this paper, only the short-time running of drainage and the adsorption of filters were considered. For a long-time running, the nitrification and denitrification in the soil and filter may not omitted. Hofstra and Bouwman [30] summarized the information taken from 336 measurements of denitrification in agricultural soils to assess the influence on the denitrification of several factors related to soil, climate, agricultural management, and the measurement techniques. The results show that agricultural fields with high nitrogen application rates and poor soil drainage showed higher denitrification values than those with lower nitrogen application rates and good soil drainage.
The filter with large particle diameter materials will have good air permeability and can reduce the soil water, which influents the nitrification. Drazkiewicz [31] found the nitrification rate positively correlated with the fraction of particles between 20 and 50 μm in diameter. Tao, et al. [3] showed that the improved subsurface drainage with large particles may increase the soil permeability, reduce the soil water content, and increase the nitrification. At the same time, the nitrification rates of the filter were larger than the soil based on the calibration and validation by simulation [4]. Hsieh, et al. [32] showed that the bioretention media with a less permeable bottom soil layer could form an anoxic/anaerobic zone for promoting nitrification/denitrification processes.
Additionally, the particle size of the filter also influents the transport and reaction processes of nitrogen and phosphorus. Mery, et al. [33] carried out an evaluation of natural zeolite as a microorganism carrier in nitrifying reactors operated in batch mode and found that different particle sizes have different ammonium adsorption capacities; the highest ammonium adsorption capacity was observed for a zeolite particle size of 0.5 mm, which was 64% and 31% higher than that observed for particle sizes of 1.0 and 2.0 mm, respectively. Garrido-Fernandez, et al. [34] studied the effect of the particles size of the carrier on biomass accumulation and nitrification performance and found that ammonia conversion rate and removal efficiency were higher in the reactor with lower particle size. Mazeikiene, et al. [35] carried out an experimental investigation of ammonium ion removal from drinking water using natural zeolite (clinoptilolite) fractions of 0.3–0.6 mm and 0.6–1.5 mm and determined that the removal was more efficient using a finer fraction. Piccoli, et al. [36] pointed out that for phosphors removal, filling material particle size appeared to be more important than its composition.
Furthermore, the long-time field experiment should be conducted for the drainage with different materials as the filter. The particle size of the filter should be concerned and the degree of straw decay should also be considered. How to explain the process of adsorption, desorption, nitrification, and denitrification for different materials as filters in subsurface drainage may be a new exploration in the future.
5. Conclusions
Based on calibration and validation according to laboratory data, the leaching characteristic of different materials, which may be used for improved subsurface drainage, were studied by HYDRUS-2D simulation, and the conclusions were as follows:
Firstly, the Freundlich isotherm adsorption equation may be more suitable to describe the adsorption of filter materials and soil. The adsorption capacity of NH4+-N from large to small is zeolite, soil, silica sand, sand, gravel, and straw. While for TP, the order from large to small is zeolite, soil, straw, silica sand, sand, and gravel. Secondly, in views of NH4+-N and TP reduction, upper soil depth has little influence when the HRT was a short time, while the materials around the outlet have obvious effects on the drainage concentrations. The straw was not suggested to be set around the outlet, and if the mixed filter with straw was accepted, the straw would be put in the top layer. Thirdly, considering the mixed ratio and layout of the mixed materials, the ratio of straw and sand was 1:1, but the ratio of straw and zeolite was 2:1 may be better. Long-time running for the drainage with different materials as the filter should be measured, and particle size of the filter and the degree of straw decay should be concerned in the future.
Author Contributions
Y.T. wrote the manuscript. X.C., S.W., X.G. and J.L. analyzed the data. X.G. and Y.T. revised the manuscript. All authors have read and agreed to the published version of the manuscript.
Funding
This research was funded by the National Natural Science Foundation Program of China (Grant Nos. 51909277), Basic research project of Qinghai Province (2021-ZJ-709).
Institutional Review Board Statement
Not applicable.
Informed Consent Statement
Not applicable.
Data Availability Statement
The data presented in this study are available on request from the corresponding author.
Conflicts of Interest
The authors declare no conflict of interest.
References
- Tao, Y.; Wang, S.; Xu, D.; Yuan, H.; Chen, H. Field and numerical experiment of an improved subsurface drainage system in Huaibei plain. Agric. Water Manag. 2017, 194, 24–32. [Google Scholar] [CrossRef]
- Tao, Y.; Wang, S.; Xu, D.; Qu, X. Experiment and analysis on flow rate of improved subsurface drainage with ponded water. Agric. Water Manag. 2016, 177, 1–9. [Google Scholar] [CrossRef]
- Tao, Y.; Wang, S.; Guan, X.; Xu, D. Study on Characteristics of Nitrogen and Phosphorus Loss under an Improved Subsurface Drainage. Water 2019, 11, 1467. [Google Scholar] [CrossRef] [Green Version]
- Tao, Y.; Li, N.; Wang, S.; Chen, H.; Guan, X.; Ji, M. Simulation study on performance of nitrogen loss of an improved subsurface drainage system for one-time drainage using HYDRUS-2D. Agric. Water Manag. 2021, 246, 106698. [Google Scholar] [CrossRef]
- Pan, W.; Zhi-Shan, Z.; Lei, H.; Yi-Gang, H.; Yong-Le, C. Influence of artificially placed substrates on agro-drainage ditch water quality. Chin. J. Eco-Agric. 2012, 20, 578–584. [Google Scholar]
- Bruun, J.; Pugliese, L.; Hoffmann, C.C.; Kjaergaard, C. Solute transport and nitrate removal in full-scale subsurface flow constructed wetlands of various designs treating agricultural drainage water. Ecol. Eng. 2016, 97, 88–97. [Google Scholar] [CrossRef]
- Humphrey, C.P.; Jernigan, J.; Iverson, G.; Serozi, B.; O’Driscoll, M.; Pradhan, S.; Bean, E. Field Evaluation of Nitrogen Treatment by Conventional and Single-Pass Sand Filter Onsite Wastewater Systems in the North Carolina Piedmont. Water Air Soil Pollut. 2016, 227, 225. [Google Scholar] [CrossRef]
- Cui, N.X.; Zhang, X.; Cai, M.; Chen, G.F.; Zhou, L.; Zou, G.Y. Does rice straw addition and/or Vallisneria natans (Lour.) planting contribute to enhancement in nitrate nitrogen and phosphorus removal in constructed wetlands under low temperature? Bioresour. Technol. 2022, 350, 126896. [Google Scholar] [CrossRef] [PubMed]
- Chen, X.; Chen, X.X.; Wan, X.W.; Weng, B.Q.; Huang, Q. Water hyacinth (Eichhornia crassipes) waste as an adsorbent for phosphorus removal from swine wastewater. Bioresour. Technol. 2010, 101, 9025–9030. [Google Scholar] [CrossRef] [PubMed]
- Paul, D.; Hall, S.G. Biochar and Zeolite as Alternative Biofilter Media for Denitrification of Aquaculture Effluents. Water 2021, 13, 2703. [Google Scholar] [CrossRef]
- Le, T.H.X.; Mosley, L.; Marschner, P. Nitrogen and phosphorus removal from wastewater by sand with wheat straw. Environ. Sci. Pollut. Res. 2019, 26, 11212–11223. [Google Scholar] [CrossRef]
- Glaister, B.J.; Fletcher, T.D.; Cook, P.L.M.; Hatt, B.E. Co-optimisation of phosphorus and nitrogen removal in stormwater biofilters: The role of filter media, vegetation and saturated zone. Water Sci. Technol. 2014, 69, 1961–1969. [Google Scholar] [CrossRef]
- Wang, S.; Zhou, M.; Liu, L. Experimental Study on Permeability and Nitrogen Removal of Envelope Materials for Drainage Pipe. J. Irrig. Drain. 2013, 32, 21–23. [Google Scholar]
- Zhang, J.; Zhou, Q.; He, R. Mechanism of nitrogen and phosphorus removal in free-water surface constructed wetland. Ecol. Environ. 2004, 13, 98–101. [Google Scholar]
- Hassan, G.K.; El-Gohary, F.A. Evaluation of Partial Nitritation/Anammox Process for Reduction of Pollutants from Sanitary Landfill Leachate. Water Air Soil Pollut. 2021, 232, 134. [Google Scholar] [CrossRef]
- Hassan, G.K.; Gad-Allah, T.A.; Badawy, M.I.; El-Gohary, F.A. Remediation of ammonia-stripped sanitary landfill leachate by integrated heterogeneous Fenton process and aerobic biological methods. Int. J. Environ. Anal. Chem. 2021, 1–14. [Google Scholar] [CrossRef]
- Sandrin, T.R.; Maier, R.M. Impact of metals on the biodegradation of organic pollutants. Environ. Health Perspect. 2003, 111, 1093–1101. [Google Scholar] [CrossRef] [PubMed]
- Tang, X.Q.; Huang, S.L. Mechanisms of pollutant removal in constructed wetlands and their applications bothat home and abroad. Technol. Water Treat. 2007, 33, 9–13. [Google Scholar]
- Mekala, C.; Nambi, I.M. Experimental and Simulation Studies on Nitrogen Dynamics in Unsaturated and Saturated Soil Using HYDRUS-2D. Procedia Technol. 2016, 25, 122–129. [Google Scholar] [CrossRef] [Green Version]
- Salehi, A.; Navabian, M.; Esmaeili varaki, M.; Pirmoradian, N. Evaluation of HYDRUS-2D model to simulate the loss of nitrate in subsurface controlled drainage in a physical model scale of paddy fields. Paddy Water Environ. 2017, 15, 433–442. [Google Scholar] [CrossRef]
- Hou, L.Z.; Hu, B.X.; Qi, Z.M.; Yang, H. Evaluating equilibrium and non-equilibrium transport of ammonium in a loam soil column. Hydrol. Process. 2018, 32, 80–92. [Google Scholar] [CrossRef]
- Elasbah, R.; Selim, T.; Mirdan, A.; Berndtsson, R. Modeling of Fertilizer Transport for Various Fertigation Scenarios under Drip Irrigation. Water 2019, 11, 893. [Google Scholar] [CrossRef] [Green Version]
- Tao, Y.; Wang, S.; Xu, D.; Qu, X. Effect of structure-type on the improved subsurface drainage performance in laboratory. Trans. Chin. Soc. Agric. Mach. 2016, 47, 113–118. [Google Scholar]
- Filipović, V.; Mallmann, F.; Coquet, Y.; Simunek, J.J. Numerical simulation of water flow in tile and mole drainage systems. Agric. Water Manag. 2014, 146, 105–114. [Google Scholar] [CrossRef] [Green Version]
- Li, Y.; Simunek, J.J.; Zhenting, Z.; Jing, L.; Ni, L. Evaluation of nitrogen balance in a direct-seeded-rice field experiment using Hydrus-1D. Agric. Water Manag. 2015, 148, 213–222. [Google Scholar] [CrossRef]
- Zhang, F.; Kang, S.; Li, Z. Numerical simulation of nutrient transfer and absorption in soil-root system. J. Northwest Sci-Tech Univercity Agric. For. 2002, 30, 7–10. [Google Scholar]
- Zhang, Z. Phosphorus diffusion in soil. Res. Soil Water Conserv. 1987, 2, 27–34. [Google Scholar]
- Hudan, T.; Mulideer, T.; Zhu, Z. Experimental study on longitudinal dispersion coefficient of typical soil in Northern Xinjiang. Xinjiang Agric. Sci. 2021, 58, 151–158. [Google Scholar]
- Plumb, O.A.; Whitaker, S. Dispersion in heterogeneous porous media,1, local volume averaging and large-scale averaging. Water Resour. Res. 1988, 24, 913–926. [Google Scholar] [CrossRef]
- Hofstra, N.; Bouwman, A.F. Denitrification in agricultural soils: Summarizing published data and estimating global annual rates. Nutr. Cycl. Agroecosystems 2005, 72, 267–278. [Google Scholar] [CrossRef]
- Drazkiewicz, M. Is nitrification affected by the diameter and other properties of soil aggregates? Folia Microbiol. 1996, 41, 76–80. [Google Scholar] [CrossRef]
- Hsieh, C.H.; Davis, A.P.; Needelman, B.A. Nitrogen removal from urban stormwater runoff through layered bioretention columns. Water Environ. Res. 2007, 79, 2404–2411. [Google Scholar] [CrossRef]
- Mery, C.; Guerrero, L.; Alonso-Gutierrez, J.; Figueroa, M.; Lema, J.M.; Montalvo, S.; Borja, R. Evaluation of natural zeolite as microorganism support medium in nitrifying batch reactors: Influence of zeolite particle size. J. Environ. Sci. Health Part A-Toxic/Hazard. Subst. Environ. Eng. 2012, 47, 420–427. [Google Scholar] [CrossRef] [PubMed] [Green Version]
- Garrido-Fernandez, J.M.; Mendez, R.; Lema, J.M.; Lazarova, V. The circulating floating bed reactor: Effect of particle size distribution of the carrier on ammonia conversion. Water Sci. Technol. 2000, 41, 393–400. [Google Scholar] [CrossRef]
- Mazeikiene, A.; Valentukeviciene, M.; Jankauskas, J. Laboratory study of ammonium ion removal by using zeolite (clinoptilolite) to treat drinking water. J. Environ. Eng. Landsc. Manag. 2010, 18, 54–61. [Google Scholar] [CrossRef]
- Piccoli, I.; Virga, G.; Maucieri, C.; Borin, M. Digestate Liquid Fraction Treatment with Filters Filled with Recovery Materials. Water 2021, 13, 21. [Google Scholar] [CrossRef]
Figure 1.
(a) Test device. (b) Structure of improved subsurface drainage.

Figure 2.
Ponding depth of surface boundary.

Figure 3.
Comparisons of observed and simulated NH4+-N concentrations.

Figure 4.
Comparisons of observed and simulated TP concentrations.

Figure 5.
Layout of the mixed filter including straw and zeolite or sand.

Figure 6.
Freundlich adsorption curves of NH4+-N and TP.

Figure 7.
Concentrations with a 10 cm depth of upper soil and no lower soil layer.

Figure 8.
NH4+-N concentrations with different depth of upper and lower soil.

Figure 9.
NH4+-N concentrations with different straw volume.

Figure 10.
TP concentrations with different straw volume.


Table 1.
Materials in different test cases.
| Location | Case 1 | Case 2 | Case 3 | Case 4 | Case 5 |
|---|---|---|---|---|---|
| Upper 10 cm | soil | soil | sand | silica sand | silica sand |
| Middle 20 cm | sand | straw | zeolite | straw | zeolite + straw |
| Lower 10 cm | gravel | gravel | gravel | gravel | gravel |
| For short | soil + sand | soil + straw | zeolite | straw | zeolite + straw |
Table 2.
VG model parameters of the soil and filters.
| Material | θr (cm3 cm−3) | θs (cm3 cm−3) | a (cm−1) | n | Ks (cm min−1) | l |
|---|---|---|---|---|---|---|
| Soil | 0.05 | 0.44 | 0.014 | 1.8 | 0.0629 | 0.5 |
| Sand | 0.01 | 0.42 | 0.02 | 1.9 | 2 | 0.5 |
| Gravel | 0.005 | 0.42 | 0.16 | 2.8 | 4 | 0.5 |
| Straw | 0 | 0.48 | 0.018 | 1.9 | 0.69 | 0.5 |
| Zeolite | 0.01 | 0.42 | 0.02 | 1.9 | 2 | 0.5 |
| Silica sand | 0.01 | 0.42 | 0.02 | 1.9 | 0.8 | 0.5 |
Table 3.
Transport and reaction parameters of the soil and filters.
| Material | Adsorption Coefficient of N | DL (cm) | Zero-Order N Transformation Rate Constants KdNo (min−1) | Adsorption Coefficient of P | Zero-order P Transformation Rate Constants KdPo (min−1) | ||
|---|---|---|---|---|---|---|---|
| KdN (cm3·mg−1) | βN | KdP (cm3·mg−1) | βP | ||||
| Soil | 0.0032 | 1 | 3 | - | 0.002 | 0.7 | - |
| Sand | 0.001 | 1 | 20 | - | 0.0006 | 1 | - |
| Gravel | 0.00046 | 1 | 30 | - | 2 × 10⁻⁶ | 1 | - |
| Straw | 0.000085 | 0.51 | 12 | 4 × 10⁻⁹ | 0.0016 | 0.7 | 1.8 × 10⁻⁹ |
| Zeolite | 0.01 | 0.8 | 4 | - | 0.004 | 0.45 | - |
| Silica sand | 0.0012 | 1 | 10 | - | 0.001 | 1 | - |
Table 4.
Statistical parameters for NH4+-N concentration simulation.
| Case | Case 1 Soil + Sand | Case 4 Straw | Case 3 Zeolite | Case 2 Soil + Straw | Case 5 Zeolite + Straw |
|---|---|---|---|---|---|
| R | 0.57 | 0.90 | 0.81 | 0.60 | 0.68 |
| RE (%) | 9.46 | −21.1 | −14.4 | −10.8 | −11.2 |
Table 5.
Statistical parameters for TP concentration simulation.
| Case | Case 1 Soil + Sand | Case 4 Straw | Case 3 Zeolite | Case 2 Soil + Straw | Case 5 Zeolite + Straw |
|---|---|---|---|---|---|
| R | 0.88 | 0.60 | 0.94 | 0.60 | 0.85 |
| RE (%) | −7.49 | −2.3 | 0.31 | −10.8 | 9.45 |
Table 6.
Value of simulation parameters in different situations.
| Impact Factor | Values of the Parameters |
|---|---|
| Upper soil depth | 10 cm, 15 cm, 20 cm, 25 cm |
| Filter material | Straw, zeolite, sand, straw (upper) + zeolite (lower), zeolite (upper) + straw (lower) |
| Filter thickness | Based on the upper and lower soil depth |
| Lower soil depth | 0 cm, 5 cm, 10 cm, 15 cm |
Publisher’s Note: MDPI stays neutral with regard to jurisdictional claims in published maps and institutional affiliations. |
© 2022 by the authors. Licensee MDPI, Basel, Switzerland. This article is an open access article distributed under the terms and conditions of the Creative Commons Attribution (CC BY) license (https://creativecommons.org/licenses/by/4.0/).
Share and Cite
MDPI and ACS Style
Tao, Y.; Chang, X.; Wang, S.; Guan, X.; Liu, J. Simulation of the Nitrogen and Phosphorus Leaching Characteristics under Different Filter Materials of an Improved Subsurface Drainage. Water 2022, 14, 3744. https://doi.org/10.3390/w14223744
AMA Style
Tao Y, Chang X, Wang S, Guan X, Liu J. Simulation of the Nitrogen and Phosphorus Leaching Characteristics under Different Filter Materials of an Improved Subsurface Drainage. Water. 2022; 14(22):3744. https://doi.org/10.3390/w14223744
Chicago/Turabian StyleTao, Yuan, Xiaomin Chang, Shaoli Wang, Xiaoyan Guan, and Jing Liu. 2022. "Simulation of the Nitrogen and Phosphorus Leaching Characteristics under Different Filter Materials of an Improved Subsurface Drainage" Water 14, no. 22: 3744. https://doi.org/10.3390/w14223744
Note that from the first issue of 2016, this journal uses article numbers instead of page numbers. See further details here.