
Effect of pH, Salinity, Dye, and Biomass Concentration on Decolourization of Azo Dye Methyl Orange in Denitrifying Conditions

School of Civil Engineering, Vellore Institute of Technology (VIT), Chennai 600127, India
*
Author to whom correspondence should be addressed.
Water 2022, 14(22), 3747; https://doi.org/10.3390/w14223747
Submission received: 4 October 2022
/
Revised: 3 November 2022
/
Accepted: 5 November 2022
/
Published: 18 November 2022
(This article belongs to the Section Wastewater Treatment and Reuse)
Abstract
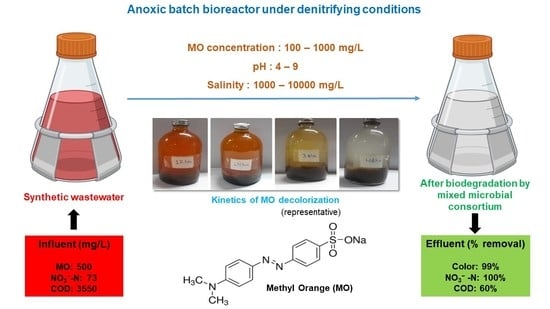
:A recent study by the current authors found simultaneous decolourization and mineralization of high concentrations of methyl orange (500 mg/L) in an anoxic up-flow reactor in denitrifying conditions. To supplement this work, various batch reactor studies were carried out to study the effect of (i) pH (4 to 9), (ii) salinity (1 g/L NaCl to 10 g/L NaCl), (iii) dye concentration (100 mg/L to 1000 mg/L), (iv) biomass concentration (0.3 g/L to 0.21 g/L); on the process, and (iv) kinetics of decolourization in denitrifying conditions. The adapted mixed microbial consortium, originally sourced from the activated sludge process, was capable to simultaneously remove colour, COD, and NO3−-N under denitrifying conditions, even at high methyl orange (MO) concentrations of 1000 mg/L at 84 h. Although the decolourization was possible for wide ranges of pH, better performance was obtained at alkaline pH levels. The decolourization performance increased when biomass concentration increased and was not affected by salinity up to 10 g/L NaCl. This may have been due to enhanced lyses of biomass at high salt concentrations. Batch kinetic studies showed that the MO decolourization followed first-order kinetics, with a rate constant of 0.0612 h−1. Results of this study may help in the future application of textile effluent treatments, using a high biomass retention reactor in denitrifying conditions with minimum sludge disposal costs.
1. Introduction
Nearly 800,000 tons of dyes are manufactured every year all over the world, out of which almost 120,000 tons (15%) of dyes are lost in the effluent during manufacturing processes [1]. Around 60 to 70% of all the dyestuff used in industrial applications are azo dyes [2,3]. More than 3000 different varieties of azo dyes are being used as they are more cost-effective, stable, and available in a wide variety of intense colours compared with natural dyes [2]. However, the azo dyes discharged into the environment pose severe threats, such as toxicity to aquatic life, reduction in photosynthesis because of the colouration of receiving waters, aesthetic concerns in water bodies, and not being easily degradable, with biotransformation products that are recalcitrant and mutagenic to humans [3]. Therefore, the treatment of industrial effluents containing azo dyes is necessary before their discharge into the environment.
Several physicochemical methods such as coagulation [4], flocculation [5], adsorption [6], filtration [7], ozonation [8], the Fenton reaction [9], electrochemical oxidation [10], etc., have been employed to treat effluents containing azo dyes. However, physicochemical methods have a few drawbacks, including: (i) Costs due to the heavy requirement of chemicals and energy; (ii) Less effectiveness in completely removing recalcitrant azo dyes; (iii) Generating a large amount of sludge, which leads to secondary pollution; (iv) Difficulty in managing the facility [11,12]. On the other hand, microbial or enzymatic degradation overcomes all these drawbacks and requires less water consumption compared with other methods [13]. The decolourization of azo dyes can occur under anaerobic and aerobic conditions, mediated by different bacterial species [14]. Azo dyes are not easily degraded under aerobic conditions, owing to the difficulty in oxygenolithic attack on the aromatic ring or the azo group, due to the strong electron-withdrawing character of the azo group. Under anaerobic conditions, the microbial degradation of azo dyes involves the reductive cleavage of the azo bond (–N=N–) with the help of azoreductase enzymes, but leads to the accumulation of potentially hazardous aromatic amines [15]. These secondary metabolites should be removed by employing the aerobic stage or advanced oxidation process. Hence, both reductive (anaerobic) and oxidative (aerobic) steps are required for the effective degradation of azo dyes. Recently, these drawbacks were overcome by employing a mixed microbial culture under microaerophilic conditions for complete mineralization [16]. Along with colour, textile industry effluents are characterized by suspended solids, chemical oxygen demand (COD), a variety of solvents, cellulose fibers, surfactants, acids, bases, salts, dispersants, and detergents [17]. The shock load rates of these elements in influent wastewaters could inhibit a few strains of microbes. Thus, employing a mixed microbial culture is beneficial as synergy between bacterial communities provides a safe environment, with different bacterial species attacking different dye components and using the secondary metabolites produced by other species for complete mineralization [18].
For effective microbial growth and cleavage of azo bonds, organic carbon needs to be supplied [19]. In the aerobic process, oxygen acts as the terminal electron acceptor in azo dye degradation. Similarly, the presence of alternative terminal electron acceptors such as nitrite, nitrate, sulfate, metal-oxides, etc., enhances anaerobic azo dye degradation [20]. Thus, in this study, sucrose was used as the source of organic carbon, and NO3−-N was chosen as a terminal electron acceptor. Generally, 30 to 90 g/L of NaNO3 is added to dye baths to enhance dye fixation, thus small amounts of NO3− exists as a pollutant in textile wastewaters as the dye is not completely exhausted [21]. Though the biodegradation process may work in the absence of organic carbon and NO3−-N, as microbes could utilize azo dyes as its sole carbon source [22], a mixed bacterial culture that could effectively decolourize dye, along with simultaneous removal of COD and NO3−-N is needed for the treatment of real textile effluents. This is because organic carbon and NO3−-N are generally present in textile effluents and are considered pollutants.
The present study aims to investigate the decolourization of methyl orange (MO), a sulfonated azo dye, under anoxic denitrifying conditions utilizing sucrose as an electron donor and nitrate as terminal electron acceptor through various batch studies. From a review of the literature, we did not find any reports on MO decolourization under anoxic denitrifying conditions using mixed microbial culture, except for the very recent work by the current authors [18]. The nutrient requirements of the decolourizing biomass were met through the lyses of obligate aerobic biomass present in the activated sludge, and such an approach has not been reported before. Therefore, this study supplements our previous work through several assessments: (i) MO decolourization in the presence of nitrate by simple SBR operation using activated sludge as the seed biomass, which is usually abundantly available; (ii) Effect of dye concentration, pH, salinity, and biomass concentration on the process, using the adapted biomass from the SBR; (iii) Kinetics of decolourization in denitrifying conditions. Simultaneous decolourization and denitrification were achieved in all the batch reactor studies, indicating that the process had potential for future applications for azo dye removal from real wastewaters using appropriate bioreactors.
2. Materials and Methods
2.1. Dye, Chemicals, and Nutrient Media
Methyl orange dye (C14H14N3NaO3S) was procured from Thomas Baker Chemicals Pvt. Ltd., Mumbai, India. Other chemicals used for analysis, nutrient media, and trace element preparations were obtained from SRL chemicals Pvt Ltd., Mumbai, India. All the chemicals used in this study were of analytical grade and no further purification was required. The MO stock solution of 1000 mg/L was prepared by adding 1000 mg of MO to 1 L of deionized water and stored at 4 °C in the refrigerator until further use. During SBR operations and other batch reactor studies, the requisite concentration of MO in nutrient media was made by diluting the MO stock solution.
The nutrient media composition used was the same as reported by Swathi et al. [18], except that the COD/NO3−-N ratio was kept around 48 (optimized value) to enable denitrifying conditions for effective MO decolourization, based on the experience of our previous work. As some degree of lysis of seed or adapted biomass and corresponding release of N and P is expected during the anoxic conditions in batch experiments, there were no additional sources of N and P added to the nutrient media. This also triggers microbes to work in nutrient-stressed conditions, which may be helpful for decolourization and mineralization of MO, as found in our previous work.
2.2. Seed Sludge
Seed sludge was procured from the extended aeration process of a wastewater treatment plant employed to treat domestic sewage. When collected, seed sludge was brown and showed good settling behaviour with a sludge volume index (SVI) of 145 mL/g and pH of 7.48. The mixed liquor suspended solids (MLSS) was 3.12 g/L and the mixed liquor volatile suspended solids (MLVSS) was 1.25 g/L.
2.3. Enrichment of Biomass in SBR
Initially, the seed sludge was acclimated by culturing in anoxic denitrifying conditions in nutrient media in the presence of 500 mg/L MO. A 10 L plastic cargo was used as the SBR and 4 L of seed sludge with an MLSS of around 12 g was added to it at start-up. After filling the cargo with 6 L of nutrient media, nitrogen purging (5 min) was carried out to expel any dissolved oxygen present in the bulk liquid. Subsequently, a rubber cork with a glass pipe inserted to aid gas escape was used to seal the reactor. The gas escape pipe was fitted with a PVC tube and the other end was immersed in a water seal of 50 mm to maintain the anoxic conditions of the reactor. The SBR was manually mixed at regular intervals and operated in static condition, at an ambient liquid temperature of 30 ± 2 °C in sequencing batch mode for 120 days. Cycle time was varied between 3 and 2 d. The time for feeding, settling, and decanting was negligible compared with the reaction time. The operational parameters of the reactor are given in Table 1. Nitrogen purged and dye-containing fresh nutrient media was added after every cycle and, at particular intervals, the analysis of effluent for pH, NO3−-N, colour, and COD were carried out to assess the performance. The adapted biomass from this enrichment reactor was used for other batch studies, described in Section 2.4.
2.4. Batch Studies
2.4.1. Effect of Dye Concentration
High concentrations of dye can lead to failure in biological treatment. Therefore, the effect of varying concentrations of MO (100, 250, 500, and 1000 mg/L) was studied, in serum bottles of 150 mL capacity, under anoxic denitrifying conditions at an ambient liquid temperature 30 ± 2 °C. The MLSS in each serum bottle was around 1 g/L. Influent COD varied as the initial MO concentrations increased, and the respective COD values were 3070 ± 160, 3358 ± 192, 3550 ± 280, and 3934 ± 280 mg/L. Anoxicity was ensured by filling the serum bottles with nitrogen-purged (for 5 min) dye-containing nutrient media to the brim and sealing immediately with rubber septa and aluminium crimp caps. The reactors were incubated on an orbital shaker (Orbitek, Scigenics Biotech, India) at 110 ± 2 rpm for 12 h. The samples after reaction time were withdrawn and analysed for pH, colour, COD, and NO3−-N.
Another set of reactors were operated in a similar way, except that sucrose was not added and MO concentrations were added from 100 to 500 mg/L at intervals of 100 mg/L. This was done to determine the effect of the external addition of organic carbon on the process. Upon visual observation, the colour was not removed after 12 h. Hence, these reactors were operated for an extended time of 72 h.
2.4.2. Effect of pH
The effect of pH on decolourization in denitrifying conditions was studied using serum bottles of 150 mL capacity. The MLSS in each serum bottle was around 1 g/L and dye concentration was 500 mg/L. Nitrogen-purged nutrient media with pH adjusted to 4, 5, 6, 7, 8, and 9 using 0.1 N HCl/0.1 N NaOH was added to the corresponding serum bottles. Nutrient media was used to fill up serum bottles to the brim, and then they were sealed firmly with rubber septa and aluminium crimp caps. The serum bottles were stirred using an orbital shaker at 110 ± 2 rpm, at an ambient liquid temperature of 30 ± 2 °C. The reactors were operated for a cycle time of 96 h. The withdrawn samples were analysed for pH, colour, NO3−-N, and COD.
2.4.3. Effect of Biomass Concentration
The effect of biomass concentration (MLSS) on MO decolourization was studied in 150 mL serum bottles at 500 mg/L of dye concentration. Each serum bottle was added with varying concentrations of MLSS (in g/L) as 0.03, 0.06, 0.09, 0.12, 0.15, 0.18, and 0.21. Reactor operation was similar to as mentioned before. After 96 h, pH, NO3−-N, colour, and COD were measured.
2.4.4. Effect of Salinity
The effect of salinity on MO decolourization was studied using NaCl in the concentration range of 1 to 10 g/L, with increasing increments of 1 g/L. For this study, serum bottles of 150 mL capacity were filled with 30 mL of enriched sludge (MLSS of 15.26 g/L), nutrient media with 500 mg/L of MO concentration, and respective concentrations of NaCl. The serum bottles were operated on an orbital shaker at 110 ± 2 rpm and the reaction was continued until 96 h, at an ambient liquid temperature of 30 ± 2 °C. The initial and final pH, NO3−-N, colour, COD, MLSS, and MLVSS were measured.
2.4.5. Kinetic Studies
Batch kinetics studies were conducted to determine the order of reaction, using serum bottles of 150 mL capacity for a period of 84 h. For this, serum bottles were prepared by adding enriched sludge and nitrogen-purged nutrient media with an MO concentration of 500 mg/L. The method was similar to that of previous sections. At every 12 h interval, serum bottles were removed from the shaker, and analysis was performed for pH, COD, NO3−-N, and colour. The order and rate coefficients were graphically determined using integrated rate laws [23]. The differential rate law for a zero-order reaction is:
Rate = k[S]0 = k
The integrated rate law is:
where
[S] = −kt + [S]0
[S]0 is the initial substrate concentration,
[S] is the concentration at time ‘t’, and
k is the rate constant.
The plot of [S] versus t is a straight line with slope of −k and intercept of [S]0.
The differential rate law for a first-order reaction is:
Rate = −d[S]/dt = k[S]
The integrated rate law is:
ln[S] = −kt + ln[S]0
The plot of ln[S] versus t is a straight line with slope of −k and intercept of ln[S]0.
The differential rate law for a second-order reaction is:
Rate = k[A]2
The integrated rate law is:
1/[S] = kt + 1/[S]0
The plot of 1/[S] versus t is a straight line with slope of k and intercept of 1/[S]0.
2.4.6. Evaluation of Biomass Growth
Biomass growth was evaluated using 150 mL serum bottles for a period of 72 h. For this, 30 mL of enriched sludge, each with an initial MLSS of 11.9 g/L, was added to nutrient media containing 500 mg/L of MO in every bottle. At every 12 h interval, the samples were analysed for pH, COD, colour, NO3−-N, MLSS, and MLVSS.
2.5. Analytical Techniques
Before analysis of colour and NO3−-N, each sample was centrifuged (REMI R-24, India) at 5000 rpm for 10 min and the clear supernatant was used. The colour was measured using a UV-spectrophotometer (Thermo Scientific, Evolution 300 UV VIS, Mumbai, India) at an absorbance wavelength of 460 nm. All the physico-chemical analyses were carried out according to standard methods for the examination of water and wastewater [24]. NO3−-N was measured using an ultraviolet spectrophotometric screening method (4500-NO3− B; APHA). COD was analyzed by a closed reflux method in a COD digester (WTW CR 3200, WTW, Weilheim, Germany). pH was measured using a pH meter (Systronics, pH system 361). ORP was measured with a calibrated double junction Pt ORP electrode (WTW inoLab pH-720). MLSS and MLVSS were measured by gravimetric analysis. All the batch experiments were performed in triplicate and the average results of the assays, with error bars, are reported throughout the entire study.
3. Results and Discussion
3.1. Enrichment of Biomass in SBR
During phase I, the SBR was operated at a cycle time of 3 d. Effective colour and NO3−-N removal was attained during the initial few days of operation. However, the COD removal was not effective, which may have been due to the lysis of unacclimated microbes. There was also a drop in the pH to 5.6, when the initial pH of nutrient media was 7.48. This may have been due to the fermentation of lysed biomass and sucrose in anoxic conditions [25]. By the end of phase I, at steady state, 99% of colour and almost 100% of NO3−-N removal was achieved. COD removal was only 50%, even after enriching for 90 days. This may have been due to the dye being utilized as the primary carbon source by microbes upon adaptation [26], and subsequent generation of intermediate aromatic amines proportional to increased dye degradation, which are inhibitive to microbial species. This may have triggered the death and ultimate lysis of non-adapted microbes. Similar inhibition was reported by Al-Amrani et al. [27] due to the accumulation of sulfanilic acid and amino naphthol during the bio-decolourization of dye AO7.
In phase II of the operation, the cycle time was decreased to 2 d. Even after decreasing the cycle time, almost complete decolourization and NO3−-N removal occurred. This indicated the presence of enriched microbes and the development of required enzymes for decolourization. Approximately 100% removal of colour and NO3−-N, and 60% removal of COD were achieved in phase II. The ORP values in the entire operation were in the range of −190 to −310 mV, which confirmed that the process was carried out in anoxic conditions. The results specify that MO decolourization in the presence of NO3−-N and COD is possible. Hence, the enriched biomass from SBR was used for carrying out batch studies to know the effect of pH, salinity, dye, and biomass concentrations on the decolourization of azo dye MO in denitrifying conditions, which had not been studied in our previous work [18]. However, the monitoring of the intermediates of dye degradation and microbes involved in the degradation/mineralization process under denitrifying conditions were not performed in this study due to the lack of facilities in the current laboratory; it is suggested as a future direction of research. In addition, any new pathways of dye decolourization and mineralization in denitrifying conditions should be explored in future research. However, the general mechanism of dye degradation by microbes was established in previous studies. Dye components are usually adsorbed to microbial membranes. Simultaneously, the decolourization of dyes in anoxic conditions is driven by various types of enzyme secretion in microorganisms. Reducing equivalents and redox-active coenzyme intermediates act as electron donors in azo dye degradation. For example, as a reducing agent in the anaerobic process, the azo-reductase enzyme transfers electrons to the chromophore group in azo dye (-N=N-), cleaving it [28]. Redox-active coenzymes, such as FADH/NADH, are used by membrane-bound enzymes as an electron shuttle throughout the anaerobic process. Later, two electrons are delivered to the azo dye molecules, where they serve as electron acceptors and produce a colourless solution of hazardous aromatic amines. Later, these amines may mineralize via aerobic or occasionally microaerophilic mechanisms [29].
3.2. Effect of Dye Concentration
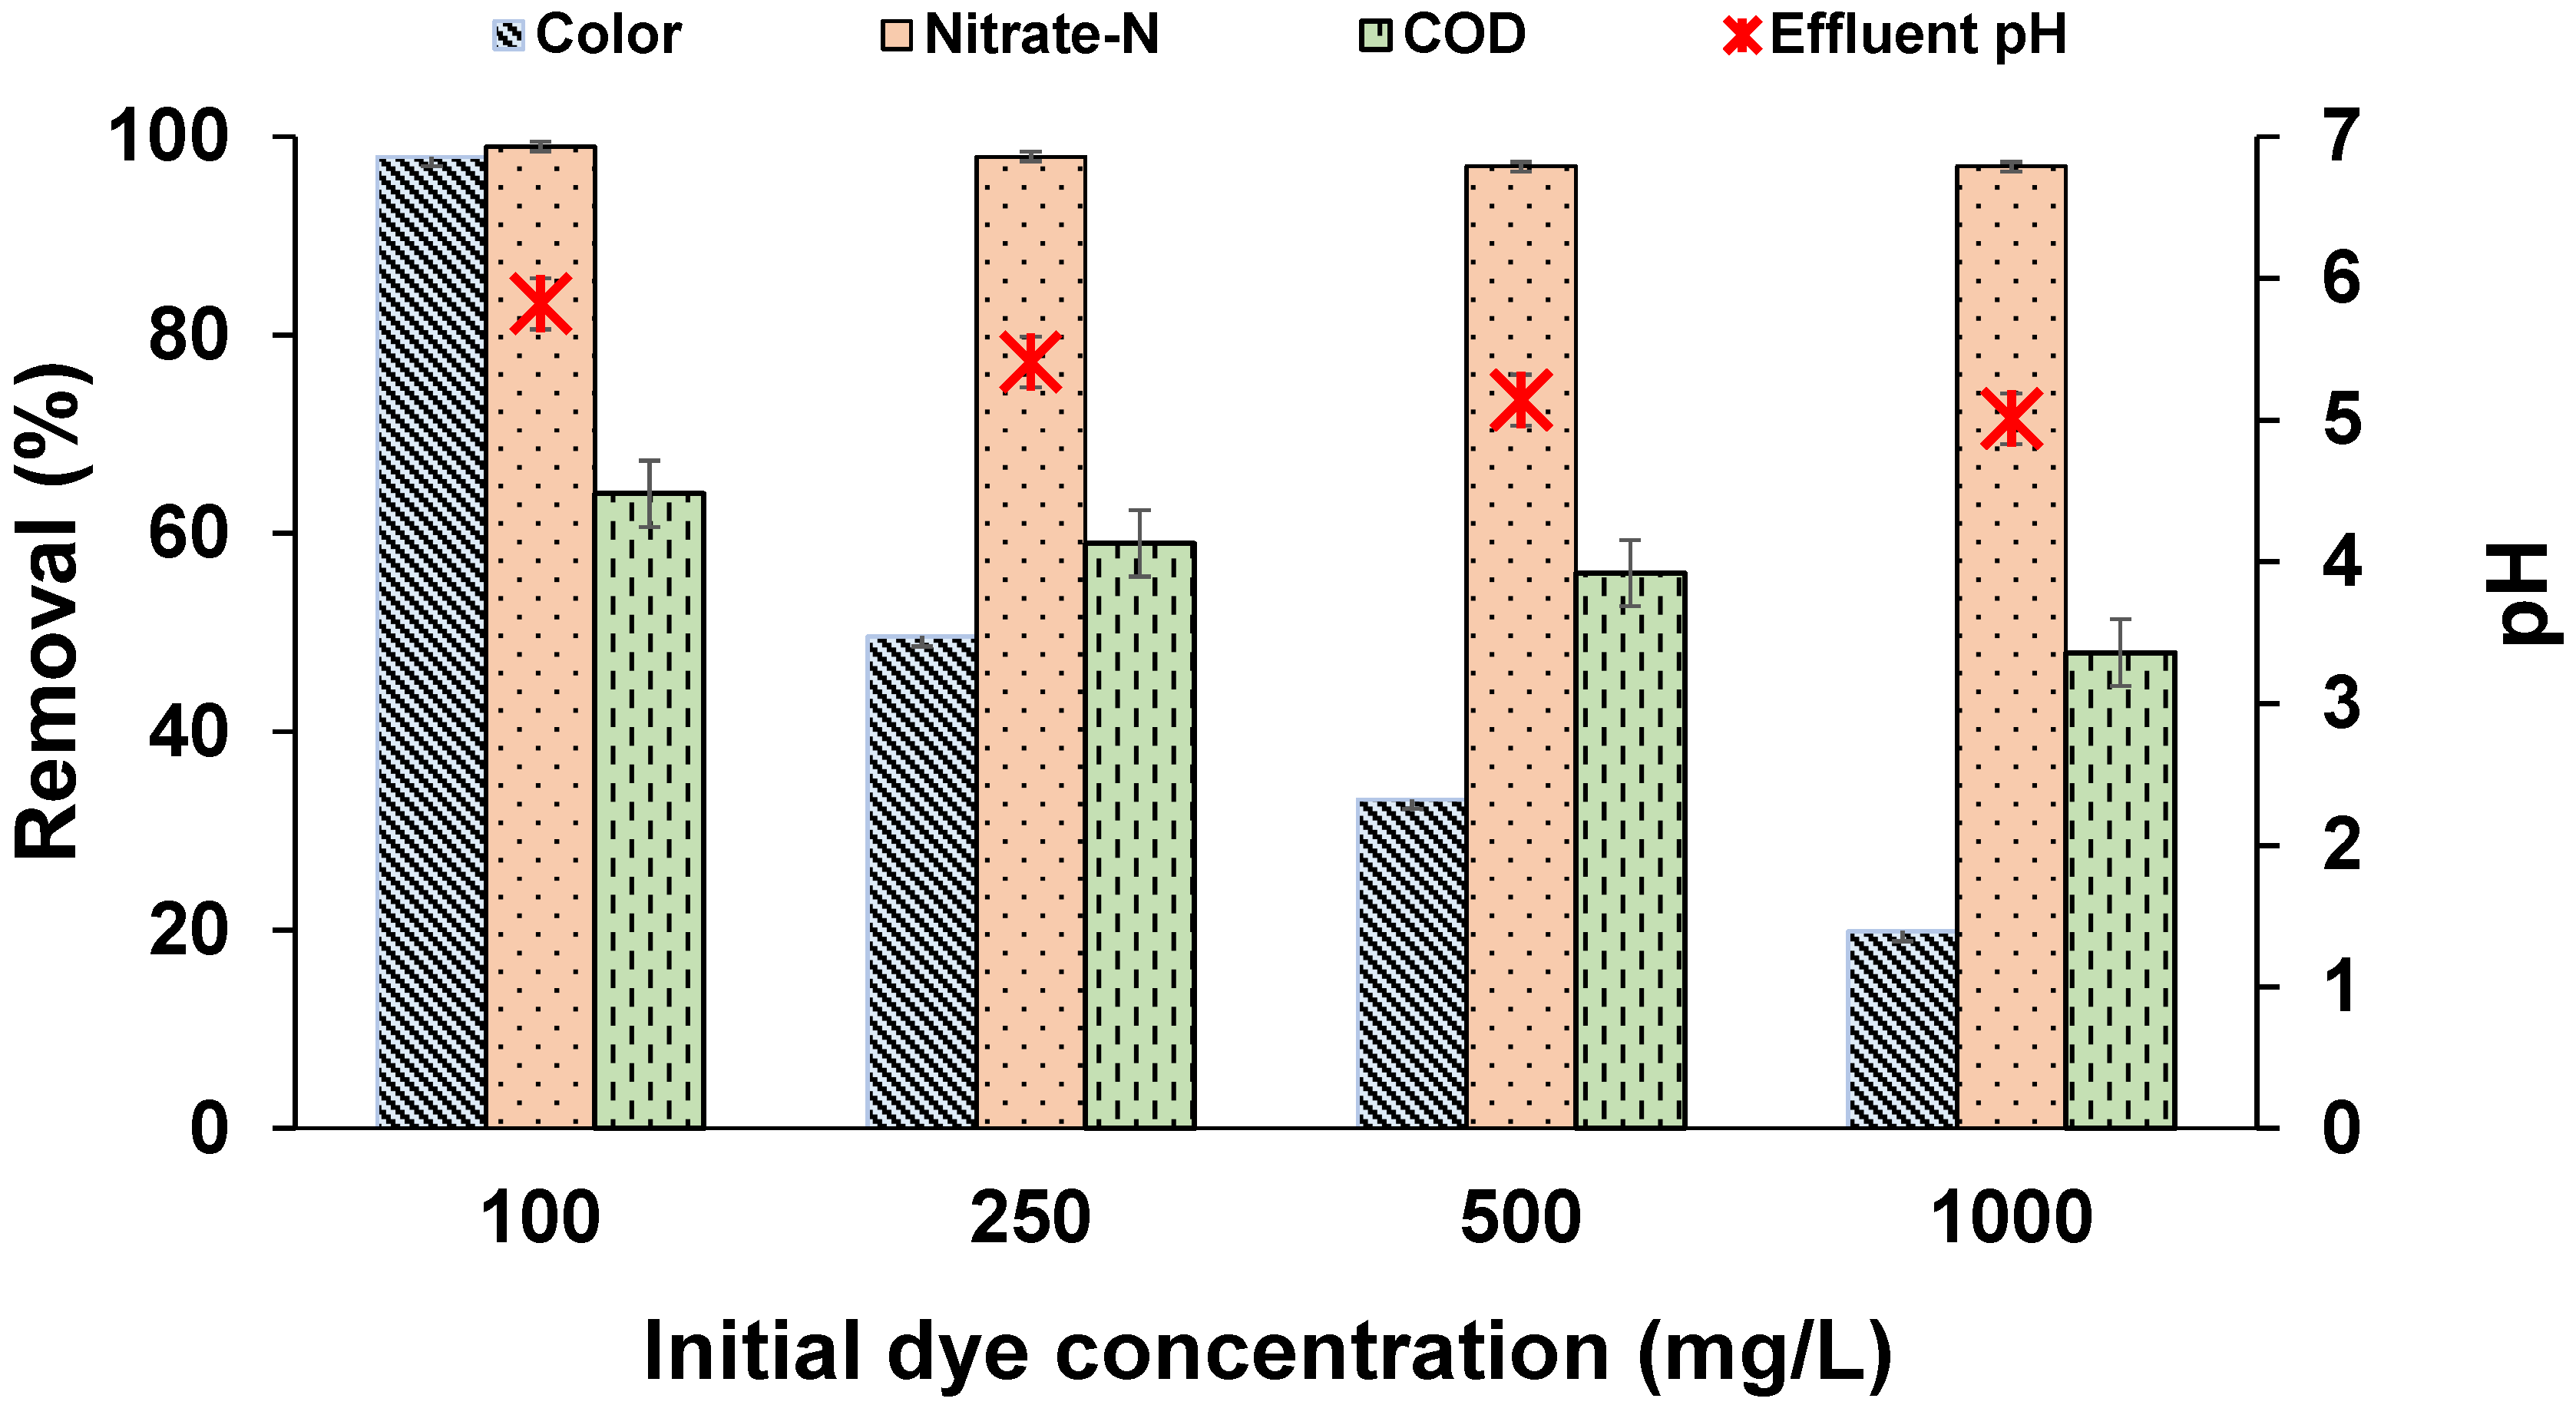
Figure 1 shows the percentage removal of colour, NO3−-N, and COD at different influent dye concentrations. Results indicated a decrease in decolourization efficiency with an increase in initial dye concentration. In the reactor with 100 mg/L of MO, 99% of colour was removed within 12 h. In the other reactors with higher MO concentrations, the decolourization rate was comparatively less. Higher concentrations of azo dyes were reported to be toxic to microbial cells. Hence, it is apparent from the results that higher dye concentrations may cause some inhibition to the biomass through various methods, such as retardation of microbial growth by direct attack on enzymatic systems; blockage of enzymatic sites by adsorption of dye components on microbial cells, affecting the metabolic pathways; or causing shock loading rates of toxic secondary metabolites in the first few hours of the reaction in the presence of high concentrations of MO [30,31]. Similar inhibitive behaviour has been reported in previous studies and may be due to the toxicity of dyes on individual bacteria or insufficient biomass to dye concentrations [32,33]. Methyl orange has a sulfonic acid (SO3H) group at the para position, which inhibits the growth of microbes at higher concentrations of dye [34]. However, upon increasing the cycle time to 84 h, complete decolourization was observed in all the reactors (results not shown). Hence, decreased reactor performance at 12 h may be attributed to insufficient biomass or enzymes required for microbial degradation of MO. On the other hand, NO3−-N removal in all the reactors was >98%, indicating that, apart from MO degradation via the denitrification pathway, the excess organic carbon available enabled effective denitrification. The COD removal was not effective and a gradual decrease was noticed in the final pH with an increase in dye concentrations, which may have been due to biomass lysis attributed to higher concentrations of intermediates that are more toxic and resistant than the dye itself. This kind of result is generally expected in anoxic conditions and at high doses of azo dyes. Similarly, drastic reductions in MLSS and a decrease in COD removal efficiencies were reported by Chen [35], where 50% of biomass was lost after 24 h of reactor operation due to intermediates of reactive black B. Al-Amrani et al. [27] also reported a drastic decrease in MLSS from 2.5 to 1 g/L after 20 h of reactor operation at similar operating conditions. Similar reductions in MLSS was also observed throughout the current study.
3.3. Effect of External Organic Carbon
In effluents with lower COD levels, an external source of organic carbon generally has to be added to aid in the decolourization process, which adds to the cost. This study was conducted to determine whether MO decolourization occurred, even in the absence of sucrose, and whether the dye acted as the sole carbon source under denitrifying conditions. Our results indicated the decolourization of dye in the absence of an externally added organic carbon source in all the reactors. Figure 2 shows that the mixed microbial culture was capable of achieving effective decolourization in the absence of a co-substrate under denitrifying conditions. The decolourization may be due to: (i) The ability of microbes to utilize dye as the sole carbon source; (ii) The metabolism of intermediates by mixed microbial culture, thereby generating the electrons (which act as a substitute to co-substrates) required to cleave azo bonds [36,37]; (iii) The endogenous decay of biomass, which provides enough reducing equivalents for azo dye reduction [36], also evident from the MLSS values where the biomass growth was lower in the reactors without organic carbon compared with the reactors with a carbon source (results not shown). The decolourization trend with respect to dye concentration was similar to what was described in Section 3.2, whereas the rate of decolourization rapidly decreased with increasing dye concentrations in the absence of organic carbon. For example, the time required for complete decolourization of 100 mg/L MO in the reactors without organic carbon was 72 h, whereas the required time was only 12 h in the reactors with a carbon source (Figure 1), a six-fold reduction in treatment time with the presence of sucrose. This has practical significance in reducing the size of the bioreactor while treating the dye effluent. These results indicate that the presence of organic carbon (COD) enhances the degradation of MO. A few azo dyes cannot easily pass through the microbial cell membrane; hence, co-substrates are required to supply reduced equivalents, such as NADH and FADH, which act as electron shuttles and enhance anoxic dye degradation in the cell exterior, decreasing reaction time [38]. The values of effluent pH are shown in Figure 2. In the reactors with sucrose (Figure 1), the drop in pH was higher compared with that of reactors without organic carbon. The drop in pH in reactors with sucrose may have been due to the fermentation of sucrose and accumulation of organic acids under anoxic conditions [30]. Complete NO3−-N removal was achieved in both sets of reactors, which showed that MO degradation occurred under denitrifying conditions; however, decolourization was faster when organic carbon was present. This showed the potential of treating textile effluents cost-effectively along with sewage when nitrate is present in the effluent.
3.4. Effect of Biomass Concentration
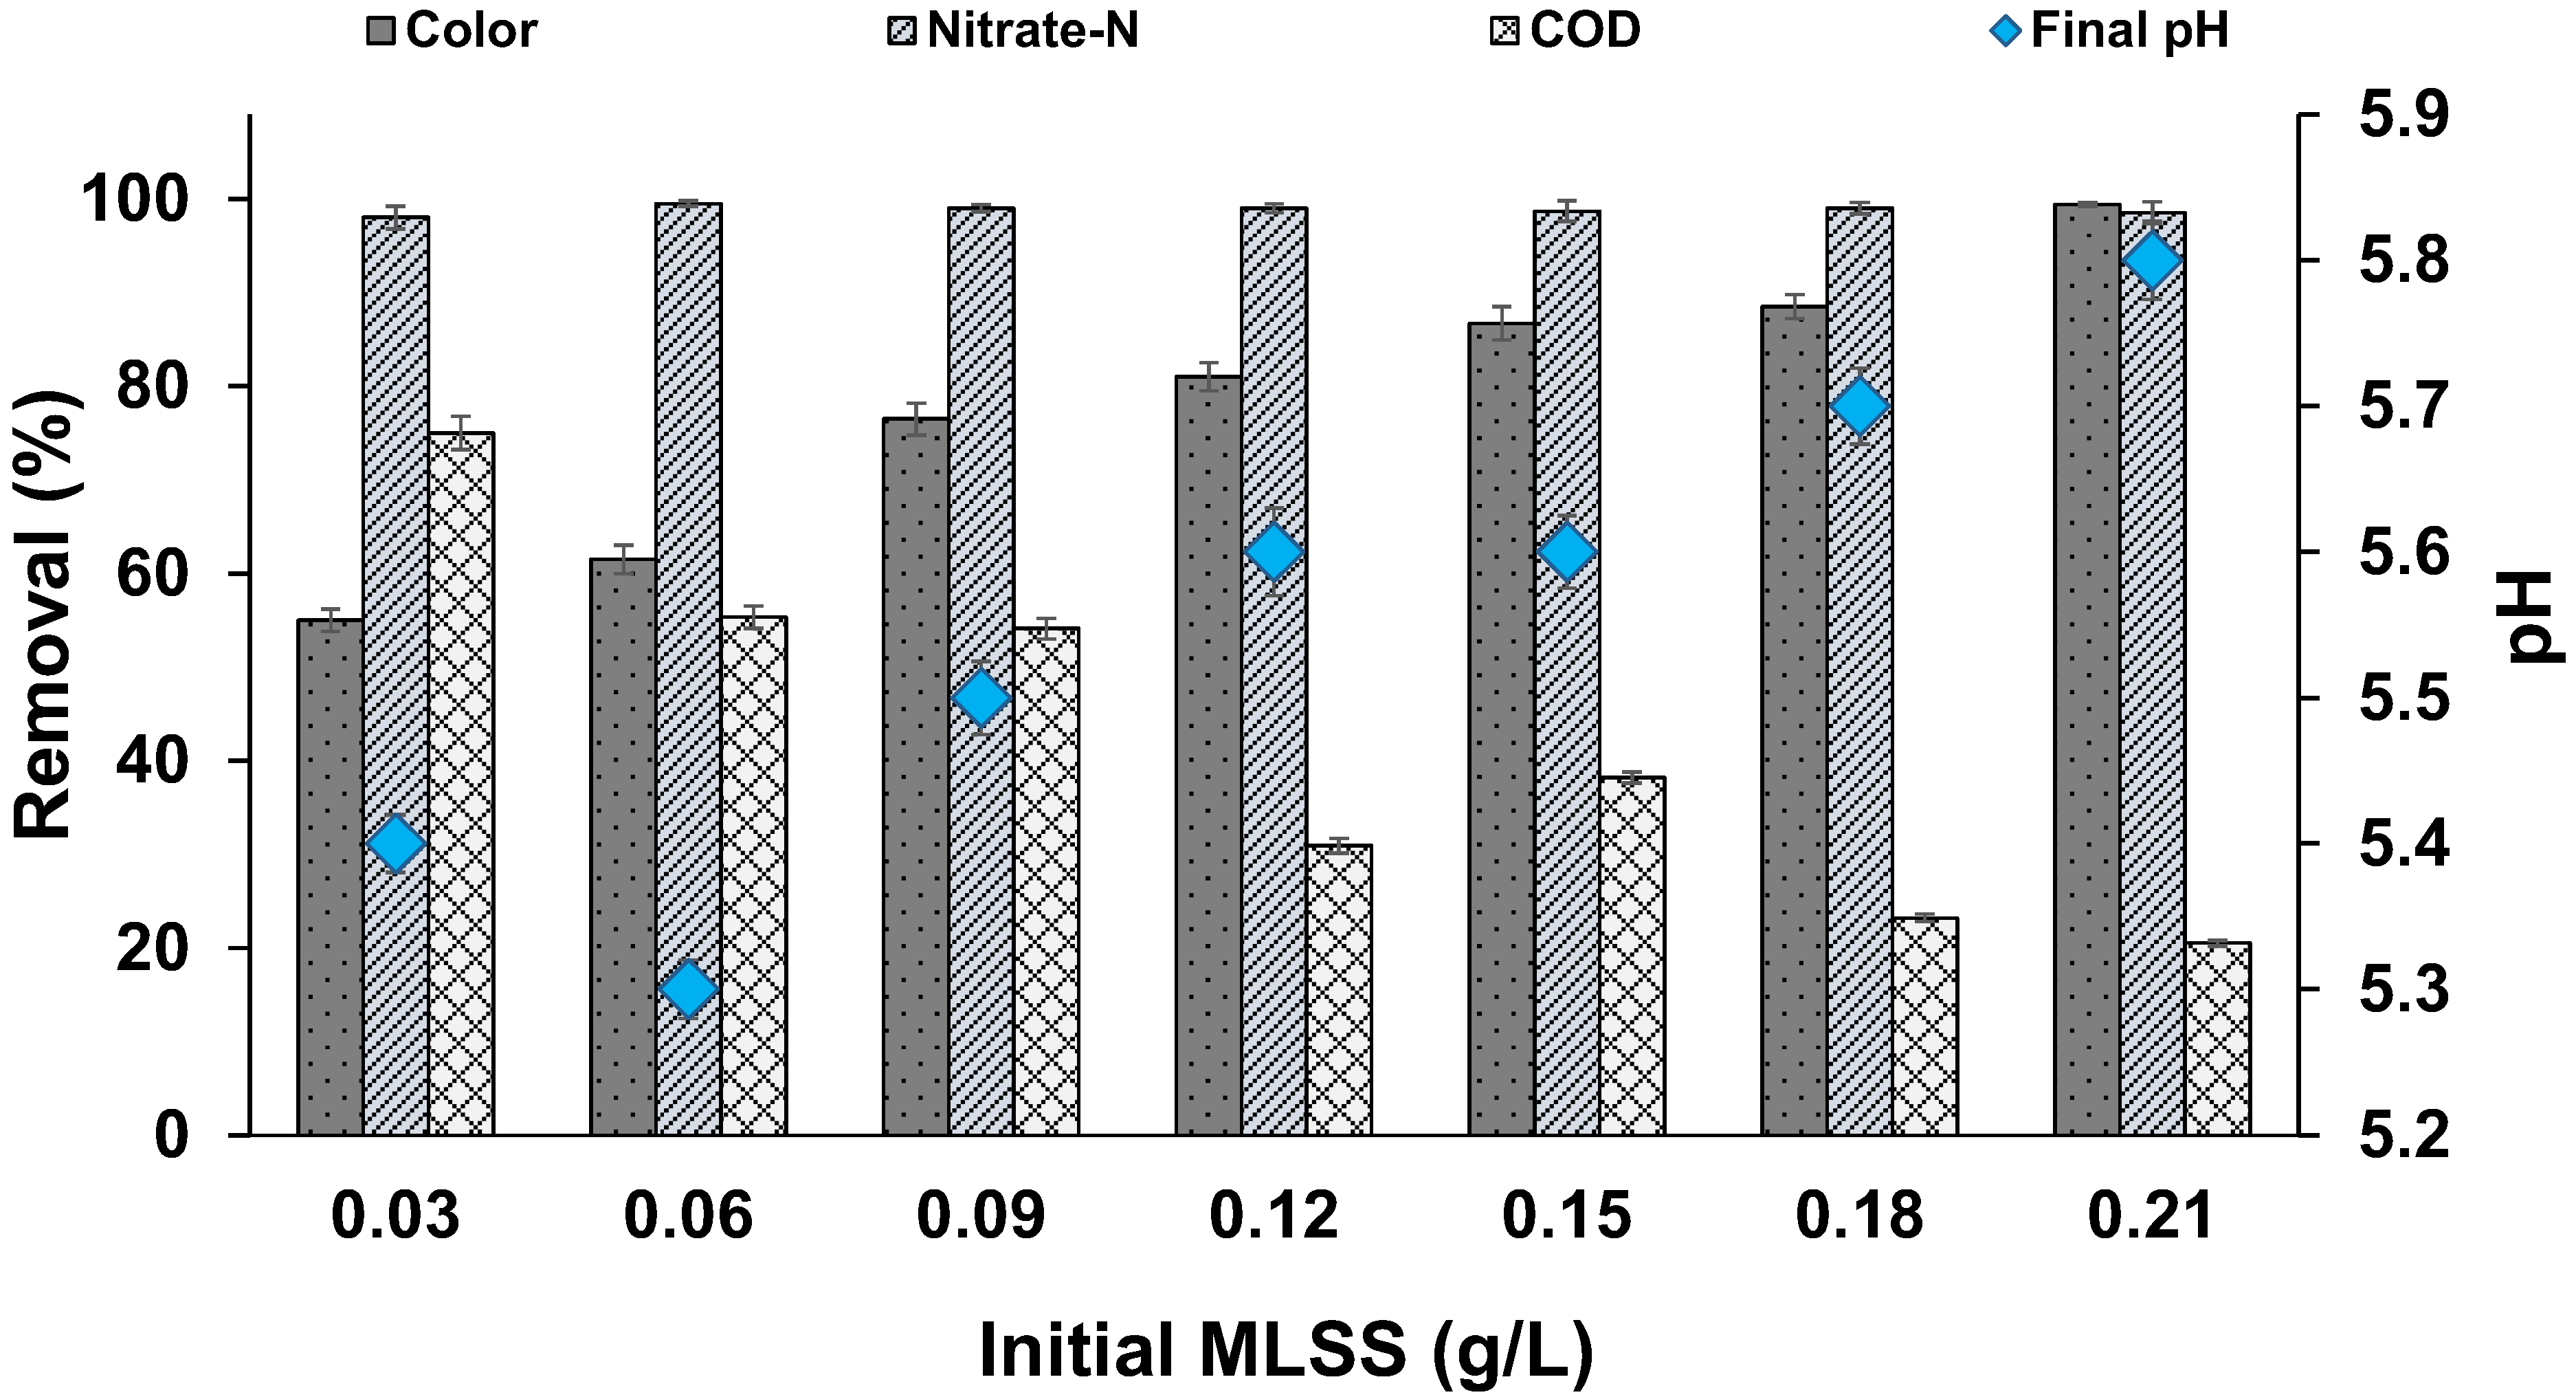
Our results (Figure 3) indicated that the biomass (measured as MLSS) played an important role in MO decolourization. We found a gradual increase in MO decolourization with an increase in MLSS. In the reactor with higher MLSS (0.21 g/L), 99% of colour removal occurred, whereas only a 55% removal of colour was observed in the reactor with low MLSS (0.03 g/L). It is evident from these results that higher cell mass leads to a faster rate of decolourization, and upon proper adaptation, the decolourization can be increased in all the reactors. Previous studies reported similar findings. Kapoor et al. [39] stated that sufficient concentrations of microbial inoculum was required for the effective dye decolourization process. According to Pourbabaee et al. [40], a rise in B. cereus inoculum improved the decolourization of terasil black. In another study, 4% P. putida SKG-1 inoculum was reported to be optimal for acid orange-7 decolourization [41]. Garg and Tripathi [42] reported that a 3% inoculum of B. cereus RMLAU1 demonstrated 68% decolourization of acid orange-7 after 3 days of exposure, whereas a lower inoculum percentage shown ineffective decolourization.
Conversely, COD removal decreased with an increase in MLSS concentration. In all the batch reactor studies, we found clear lysis of the biomass. Hence, in the reactors with high MLSS, the fraction of lysed biomass was higher, leading to an increase in COD levels within the reactor, thereby affecting the COD removal efficiency. As mentioned earlier, another possibility for the lower COD removal in reactors with high MLSS may be due to a higher accumulation of toxic intermediate aromatic amines, leading to the lysis of biomass [27]. We observed that the pH drop was less in the reactors with high MLSS, indicating a higher tolerance in the presence of high MLSS.
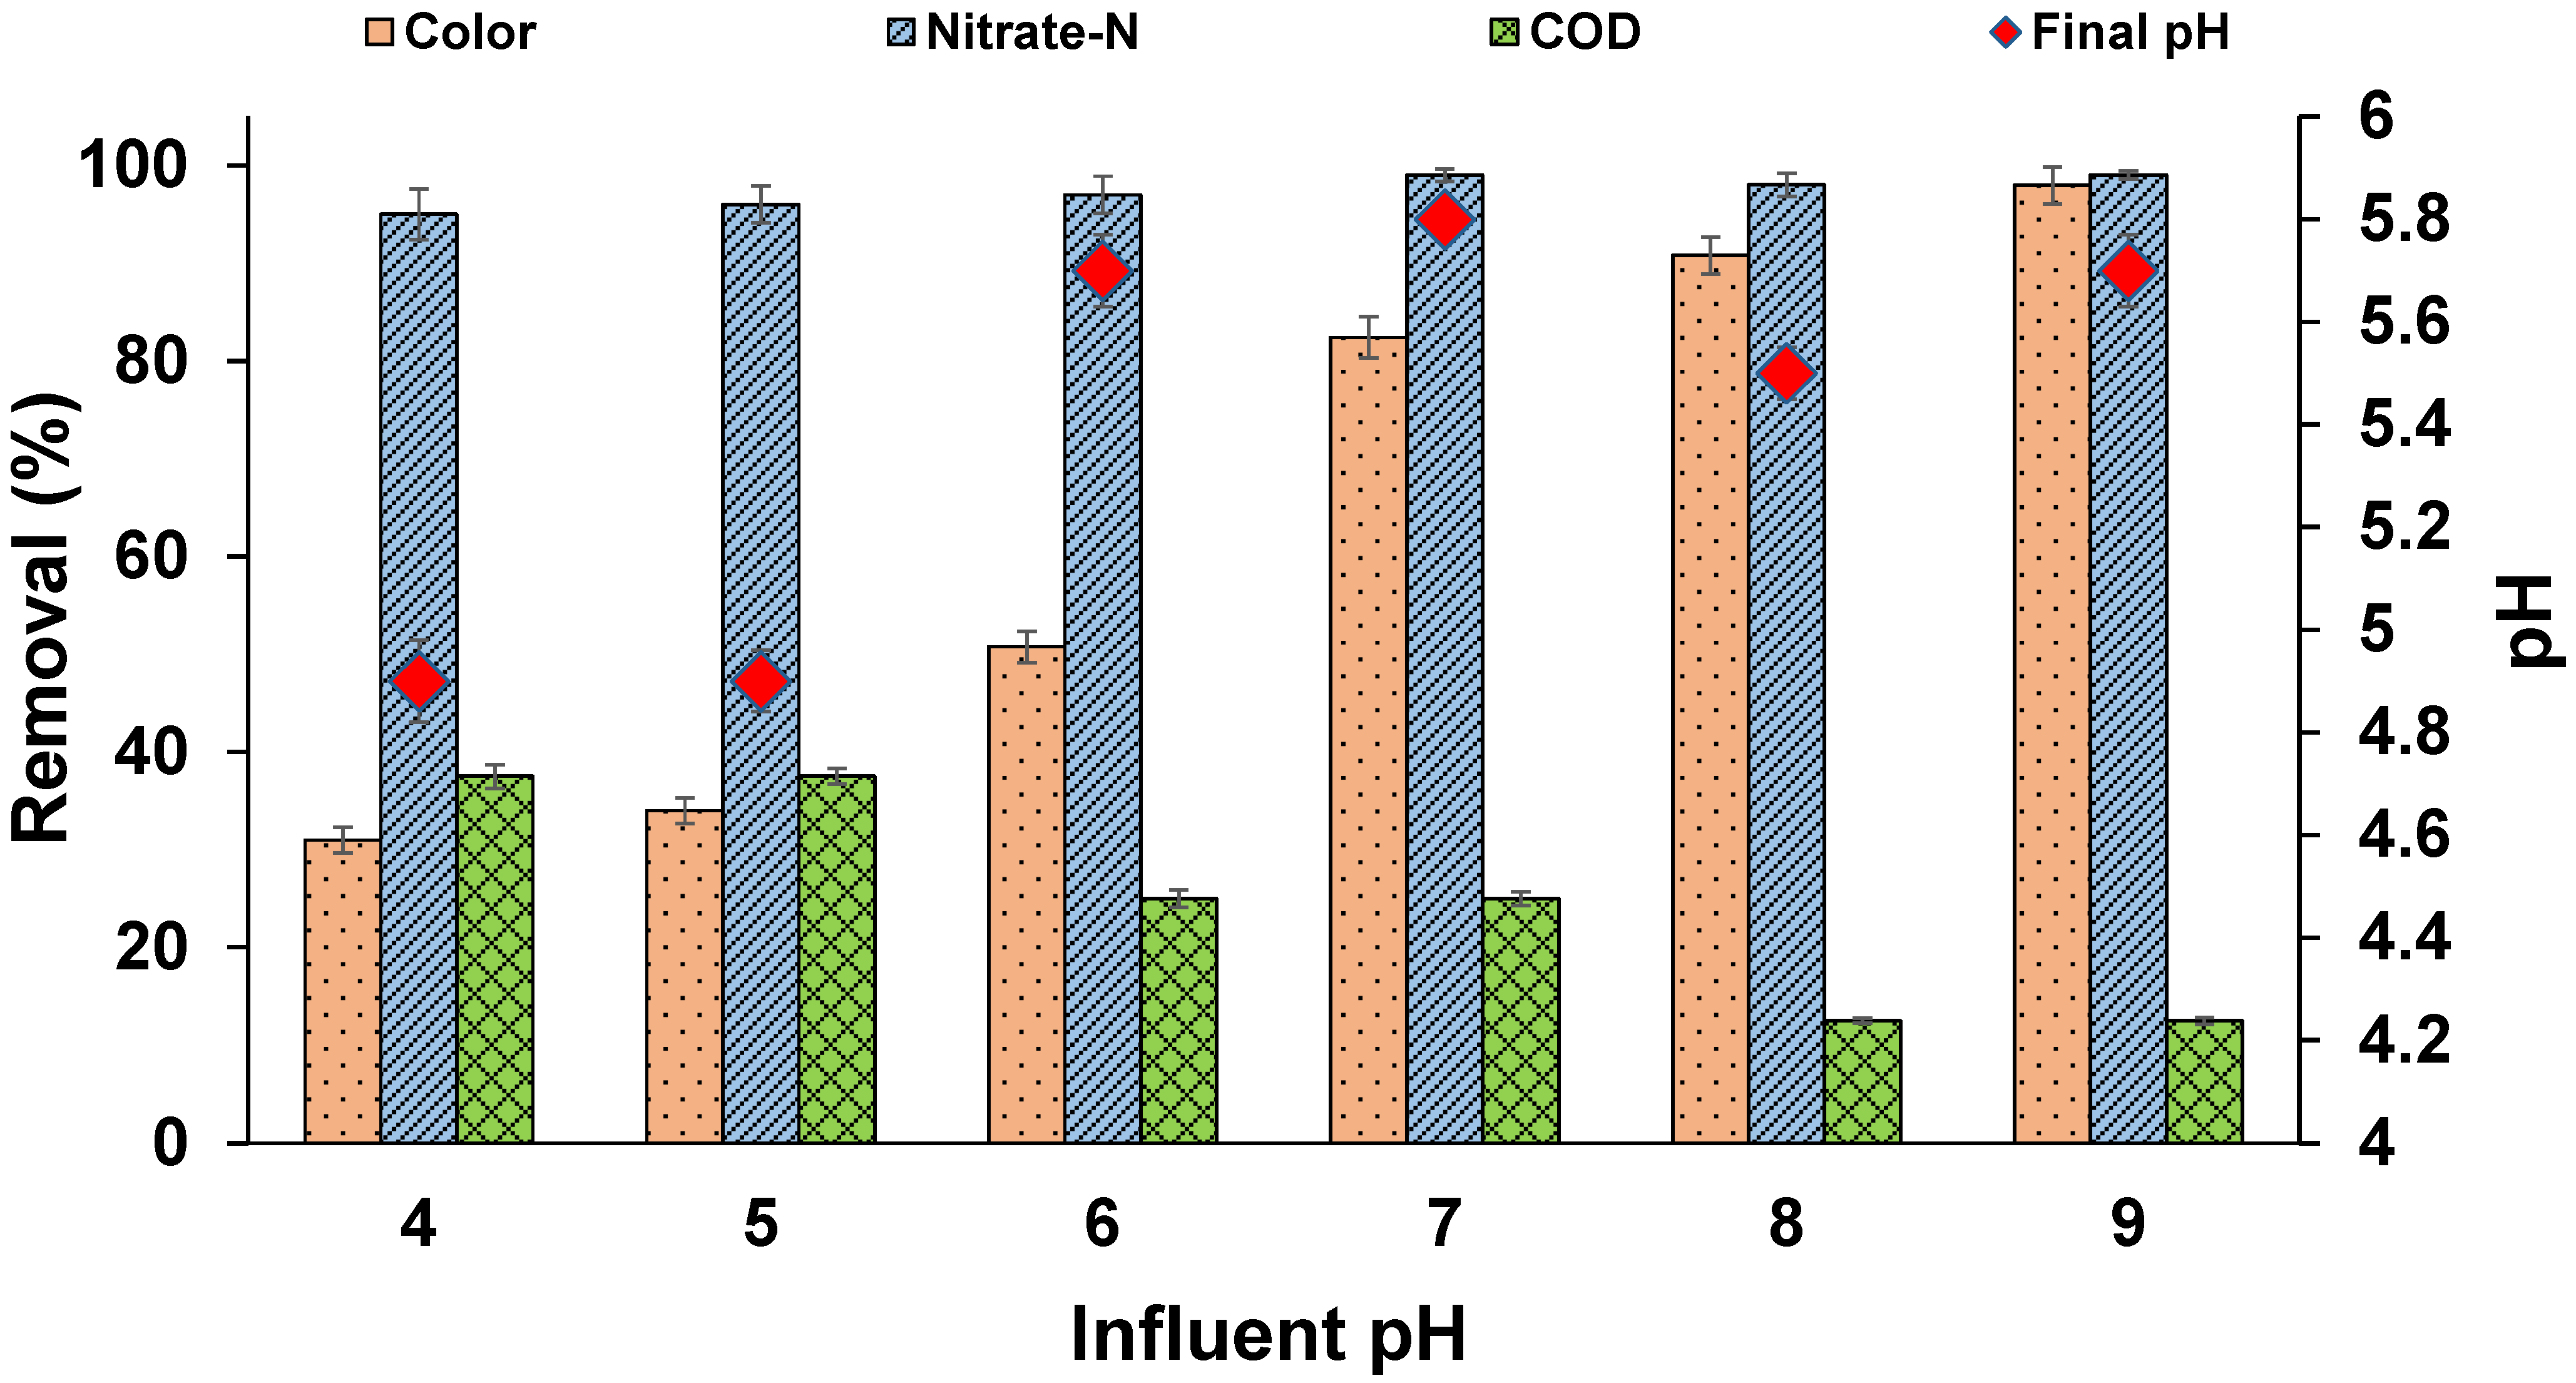
3.5. Effect of pH
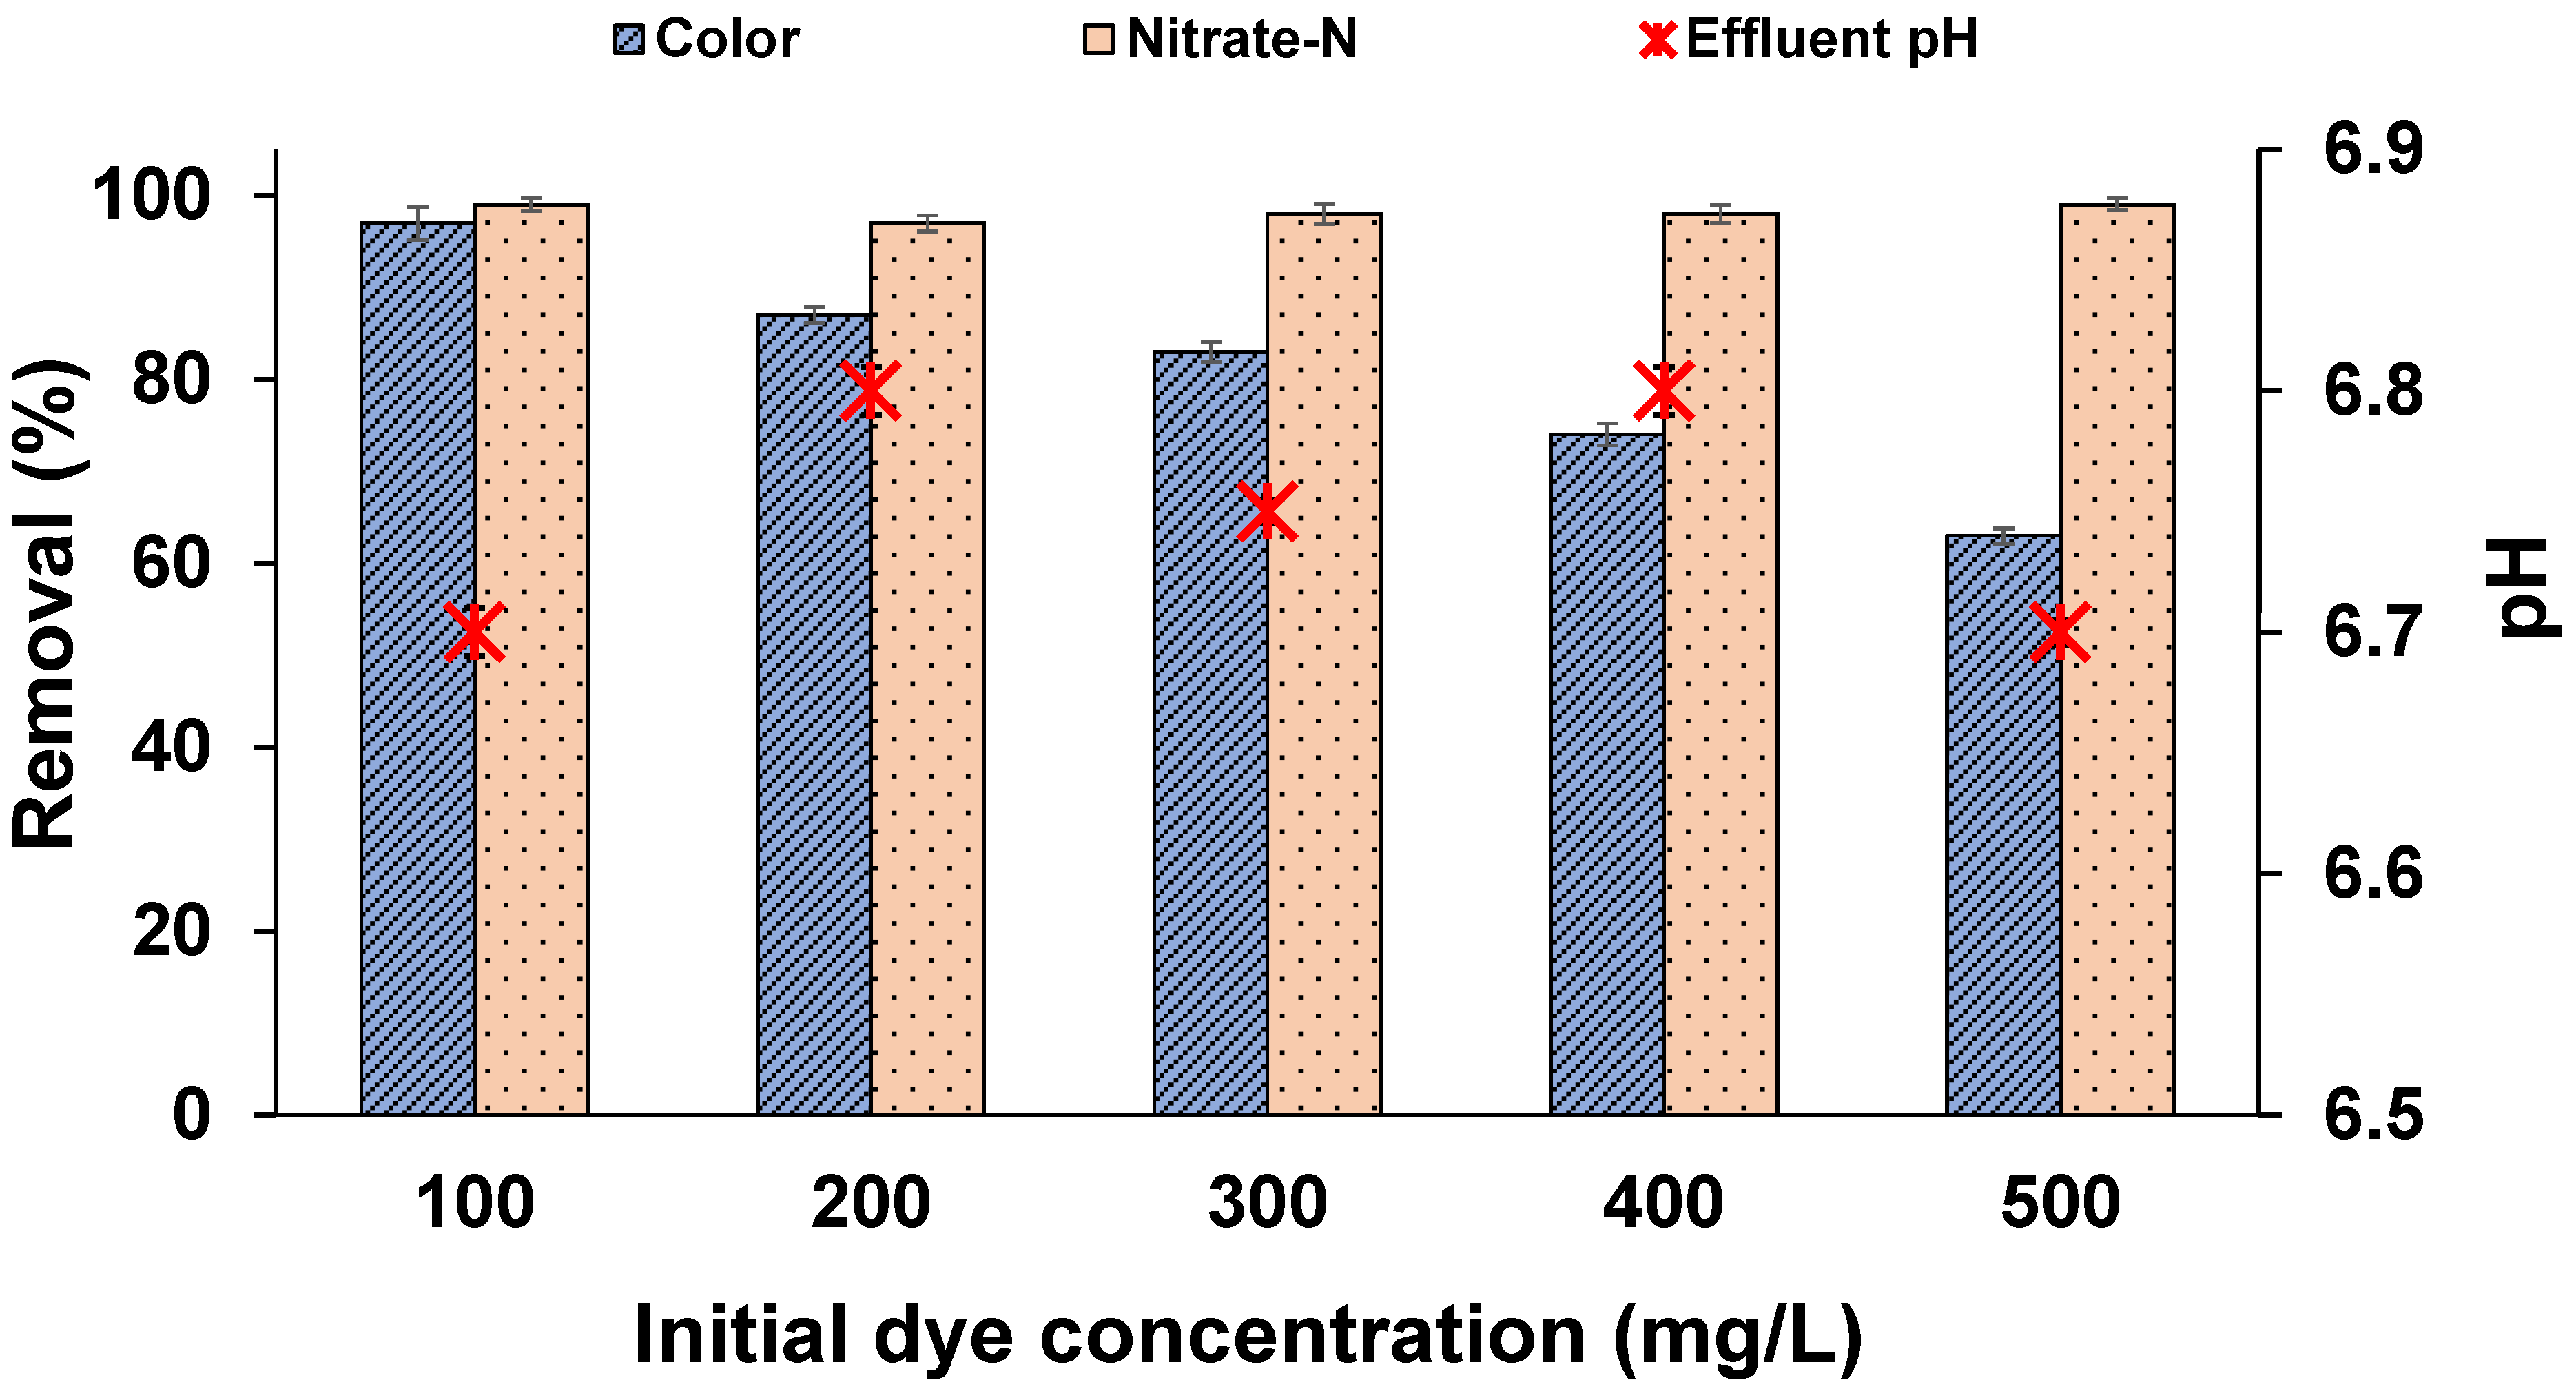
The nutrient medium pH is an important factor in the decolourization process. The results of the pH study are shown in Figure 4. Decolourization was observed in all the reactors. The rate of colour removal was higher in the pH range of 8 to 9 and rapidly decreased at acidic pH levels. A pH within a range of 7 to 9 showed very little effect on the dye degradation process. The effect of pH may be related to the transportation of dye molecules across the cell membrane, which is considered the rate-limiting step of decolourization [32,43] and is effective at alkaline pH levels. Similar results were reported where the effect of pH became insensitive in the range of 7 to 9 and slightly decreased in acidic pH ranges [44]. Previous studies reported that acidic and alkaline conditions are detrimental to azo dye biodegradation, as protonation and deprotonation of azo dyes at lower and higher pH levels leads to changes in chemical structure, thereby restricting the adapted microbes to decolourize [45]. On the other hand, nitrate removal was 100% at all pH levels. The optimum pH for denitrification was found to be in the range of 6 to 8 [46]. Few studies reported the occurrence of denitrification, even in the acidic pH range of 4.8 to 6.2, when a sufficient carbon source was available [47]. The effective denitrification and dominance of denitrifiers was expected in this study. The results of this study show that colour removal can occur at a wide pH range, making it suitable for practical bio-treatments of textile effluents with proper adaptation of mixed microbial culture in denitrifying conditions.
3.6. Kinetics of MO Removal
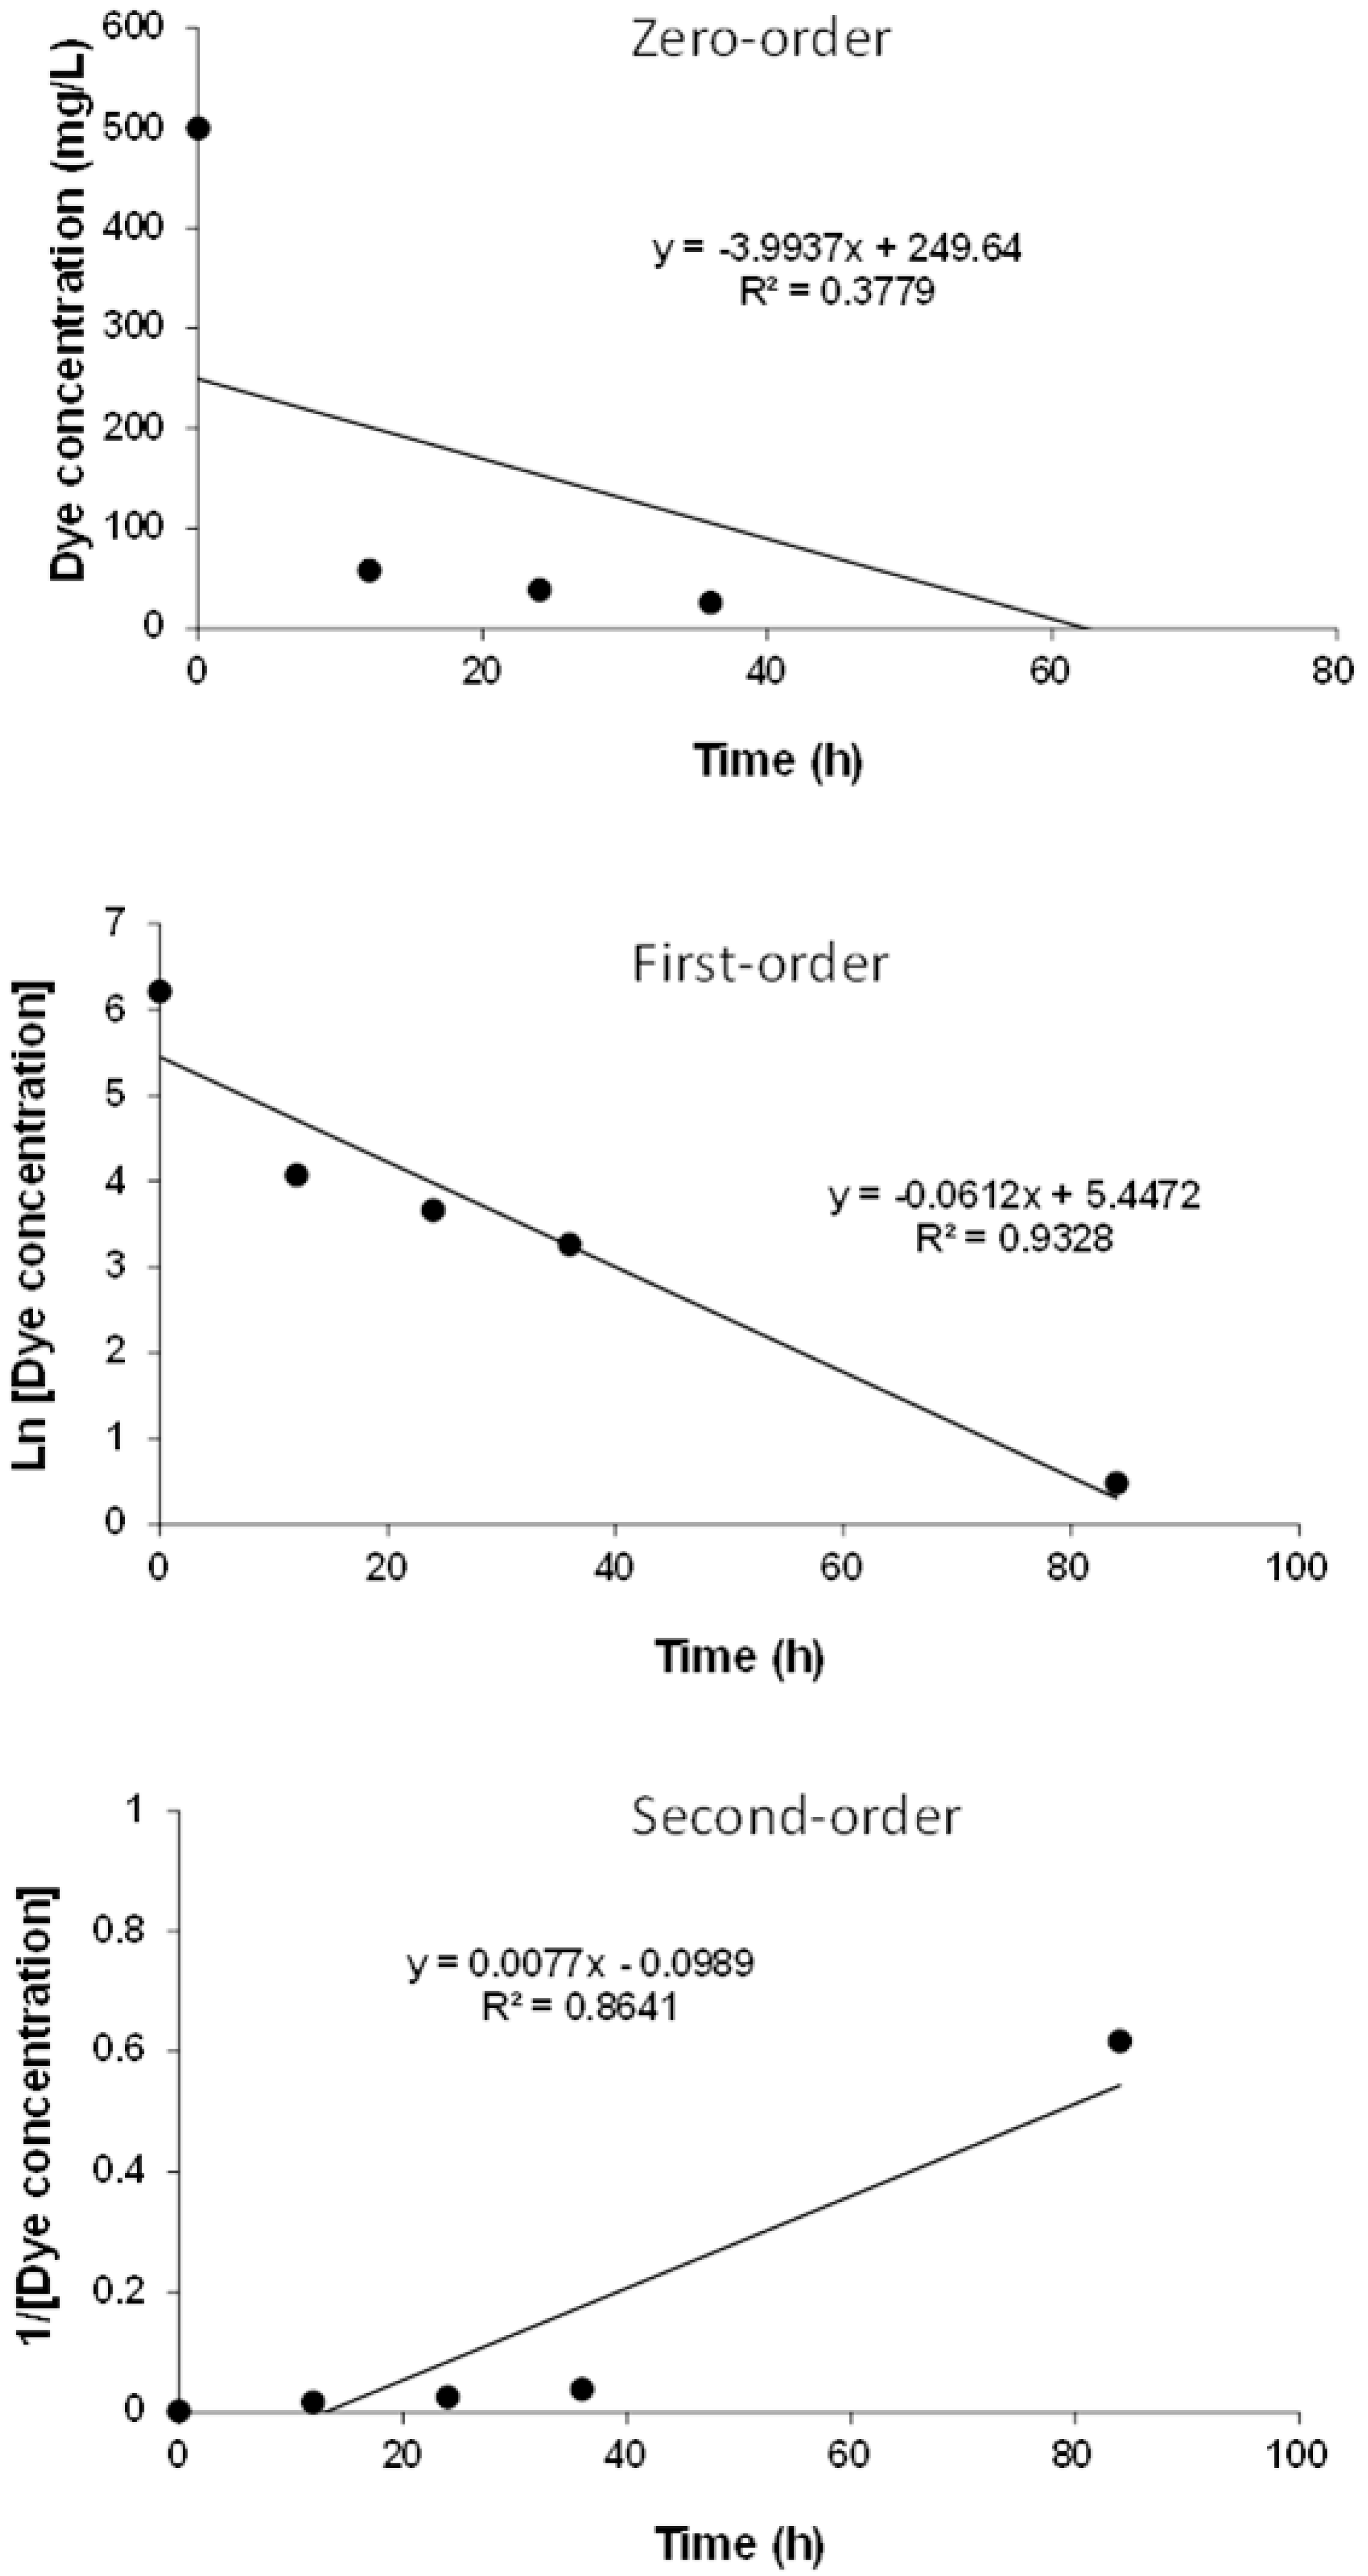
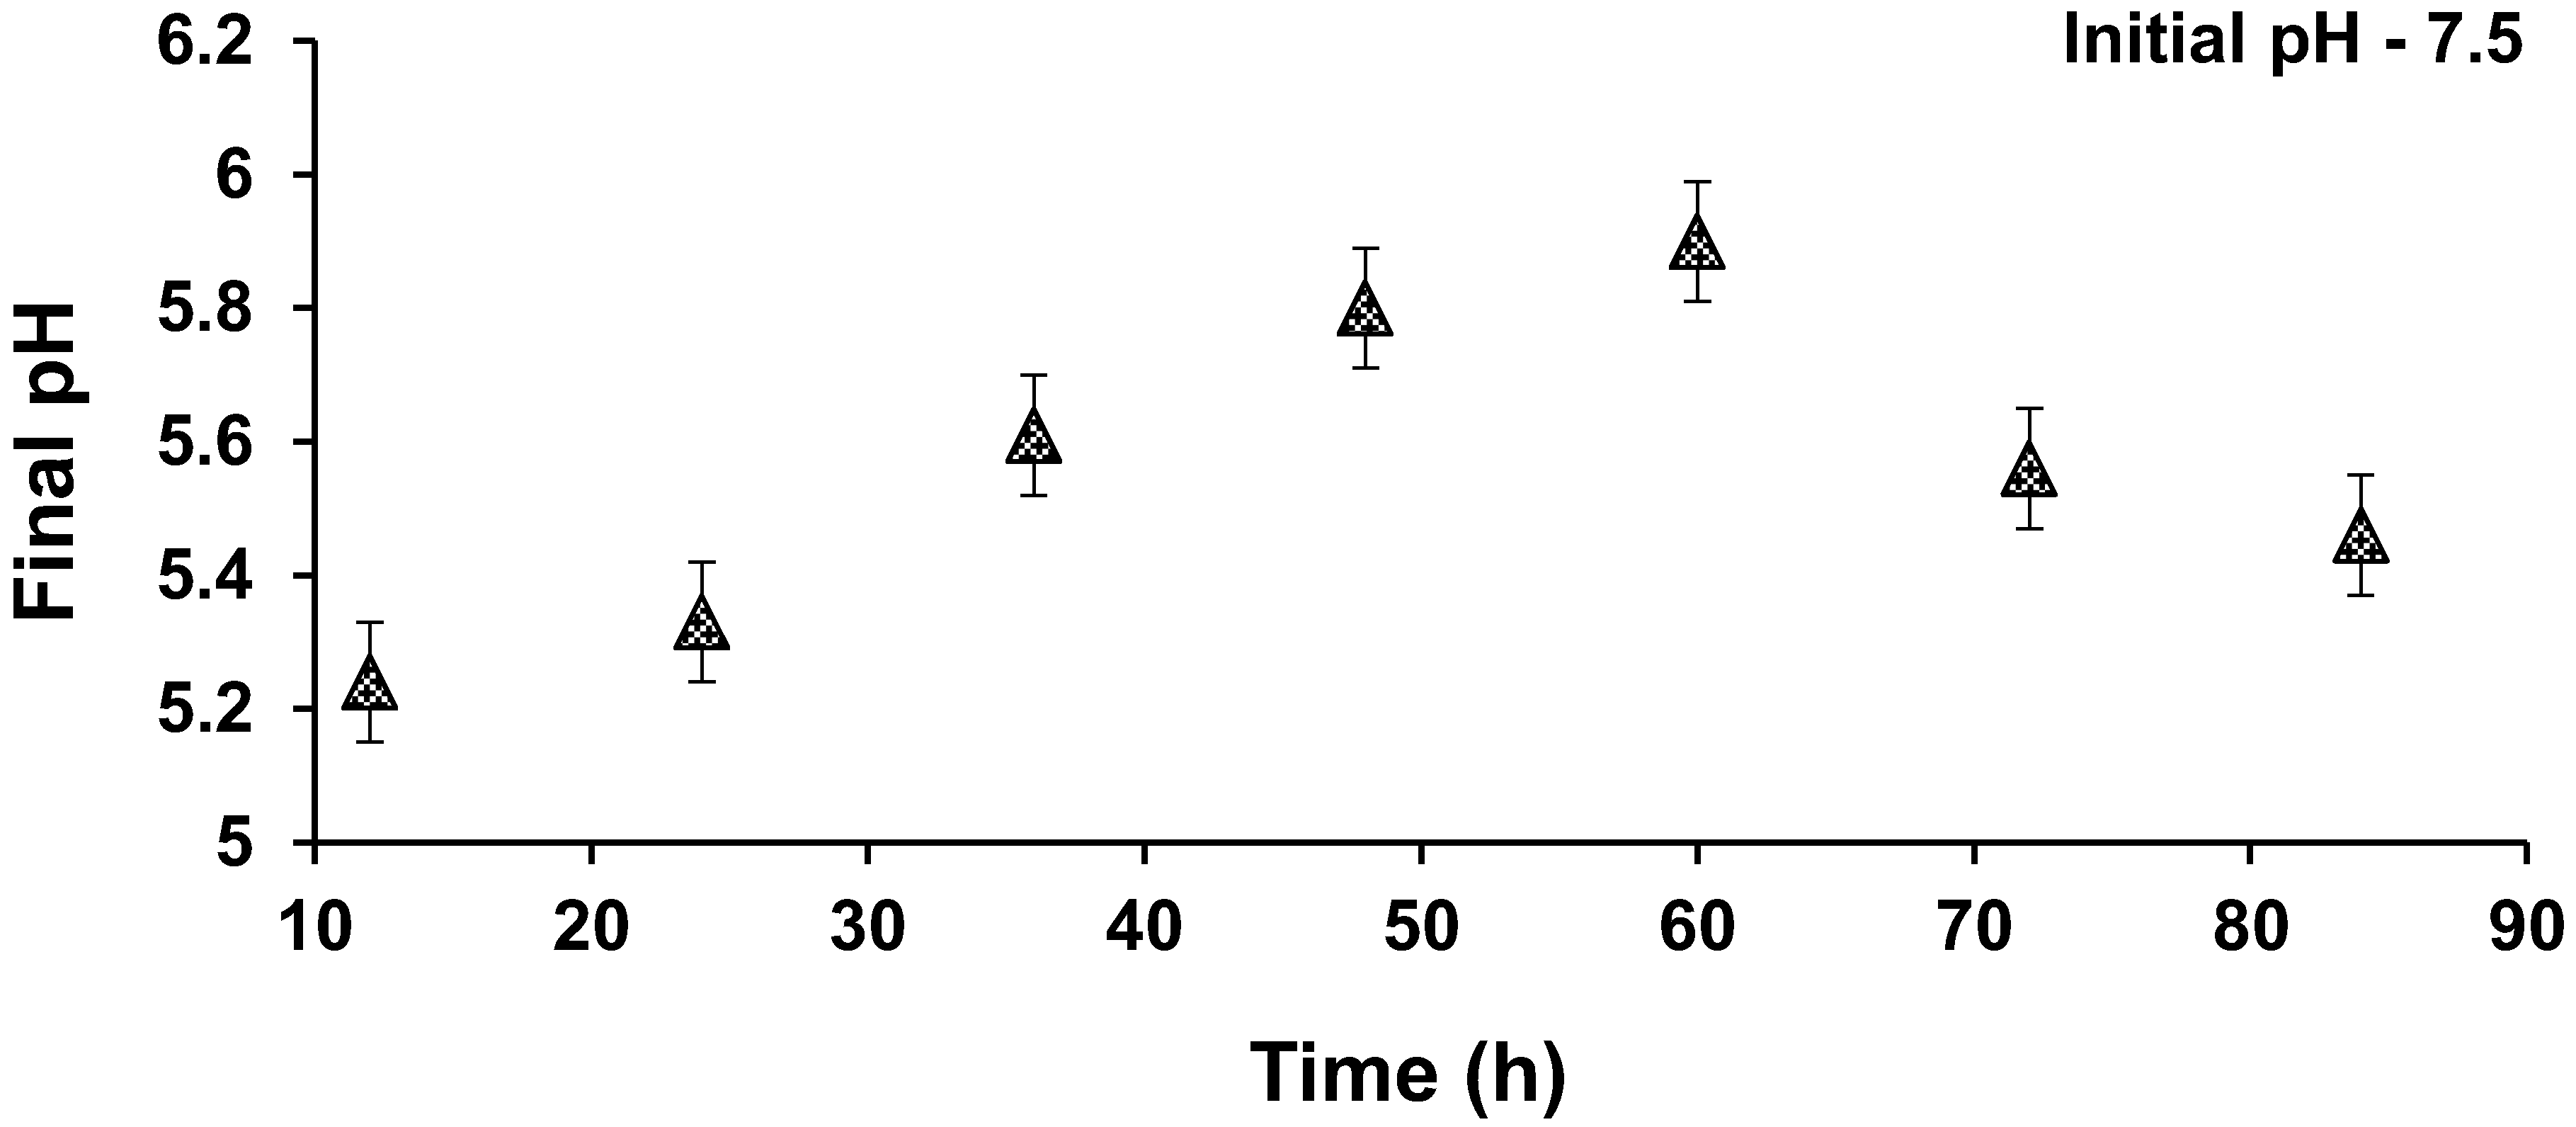
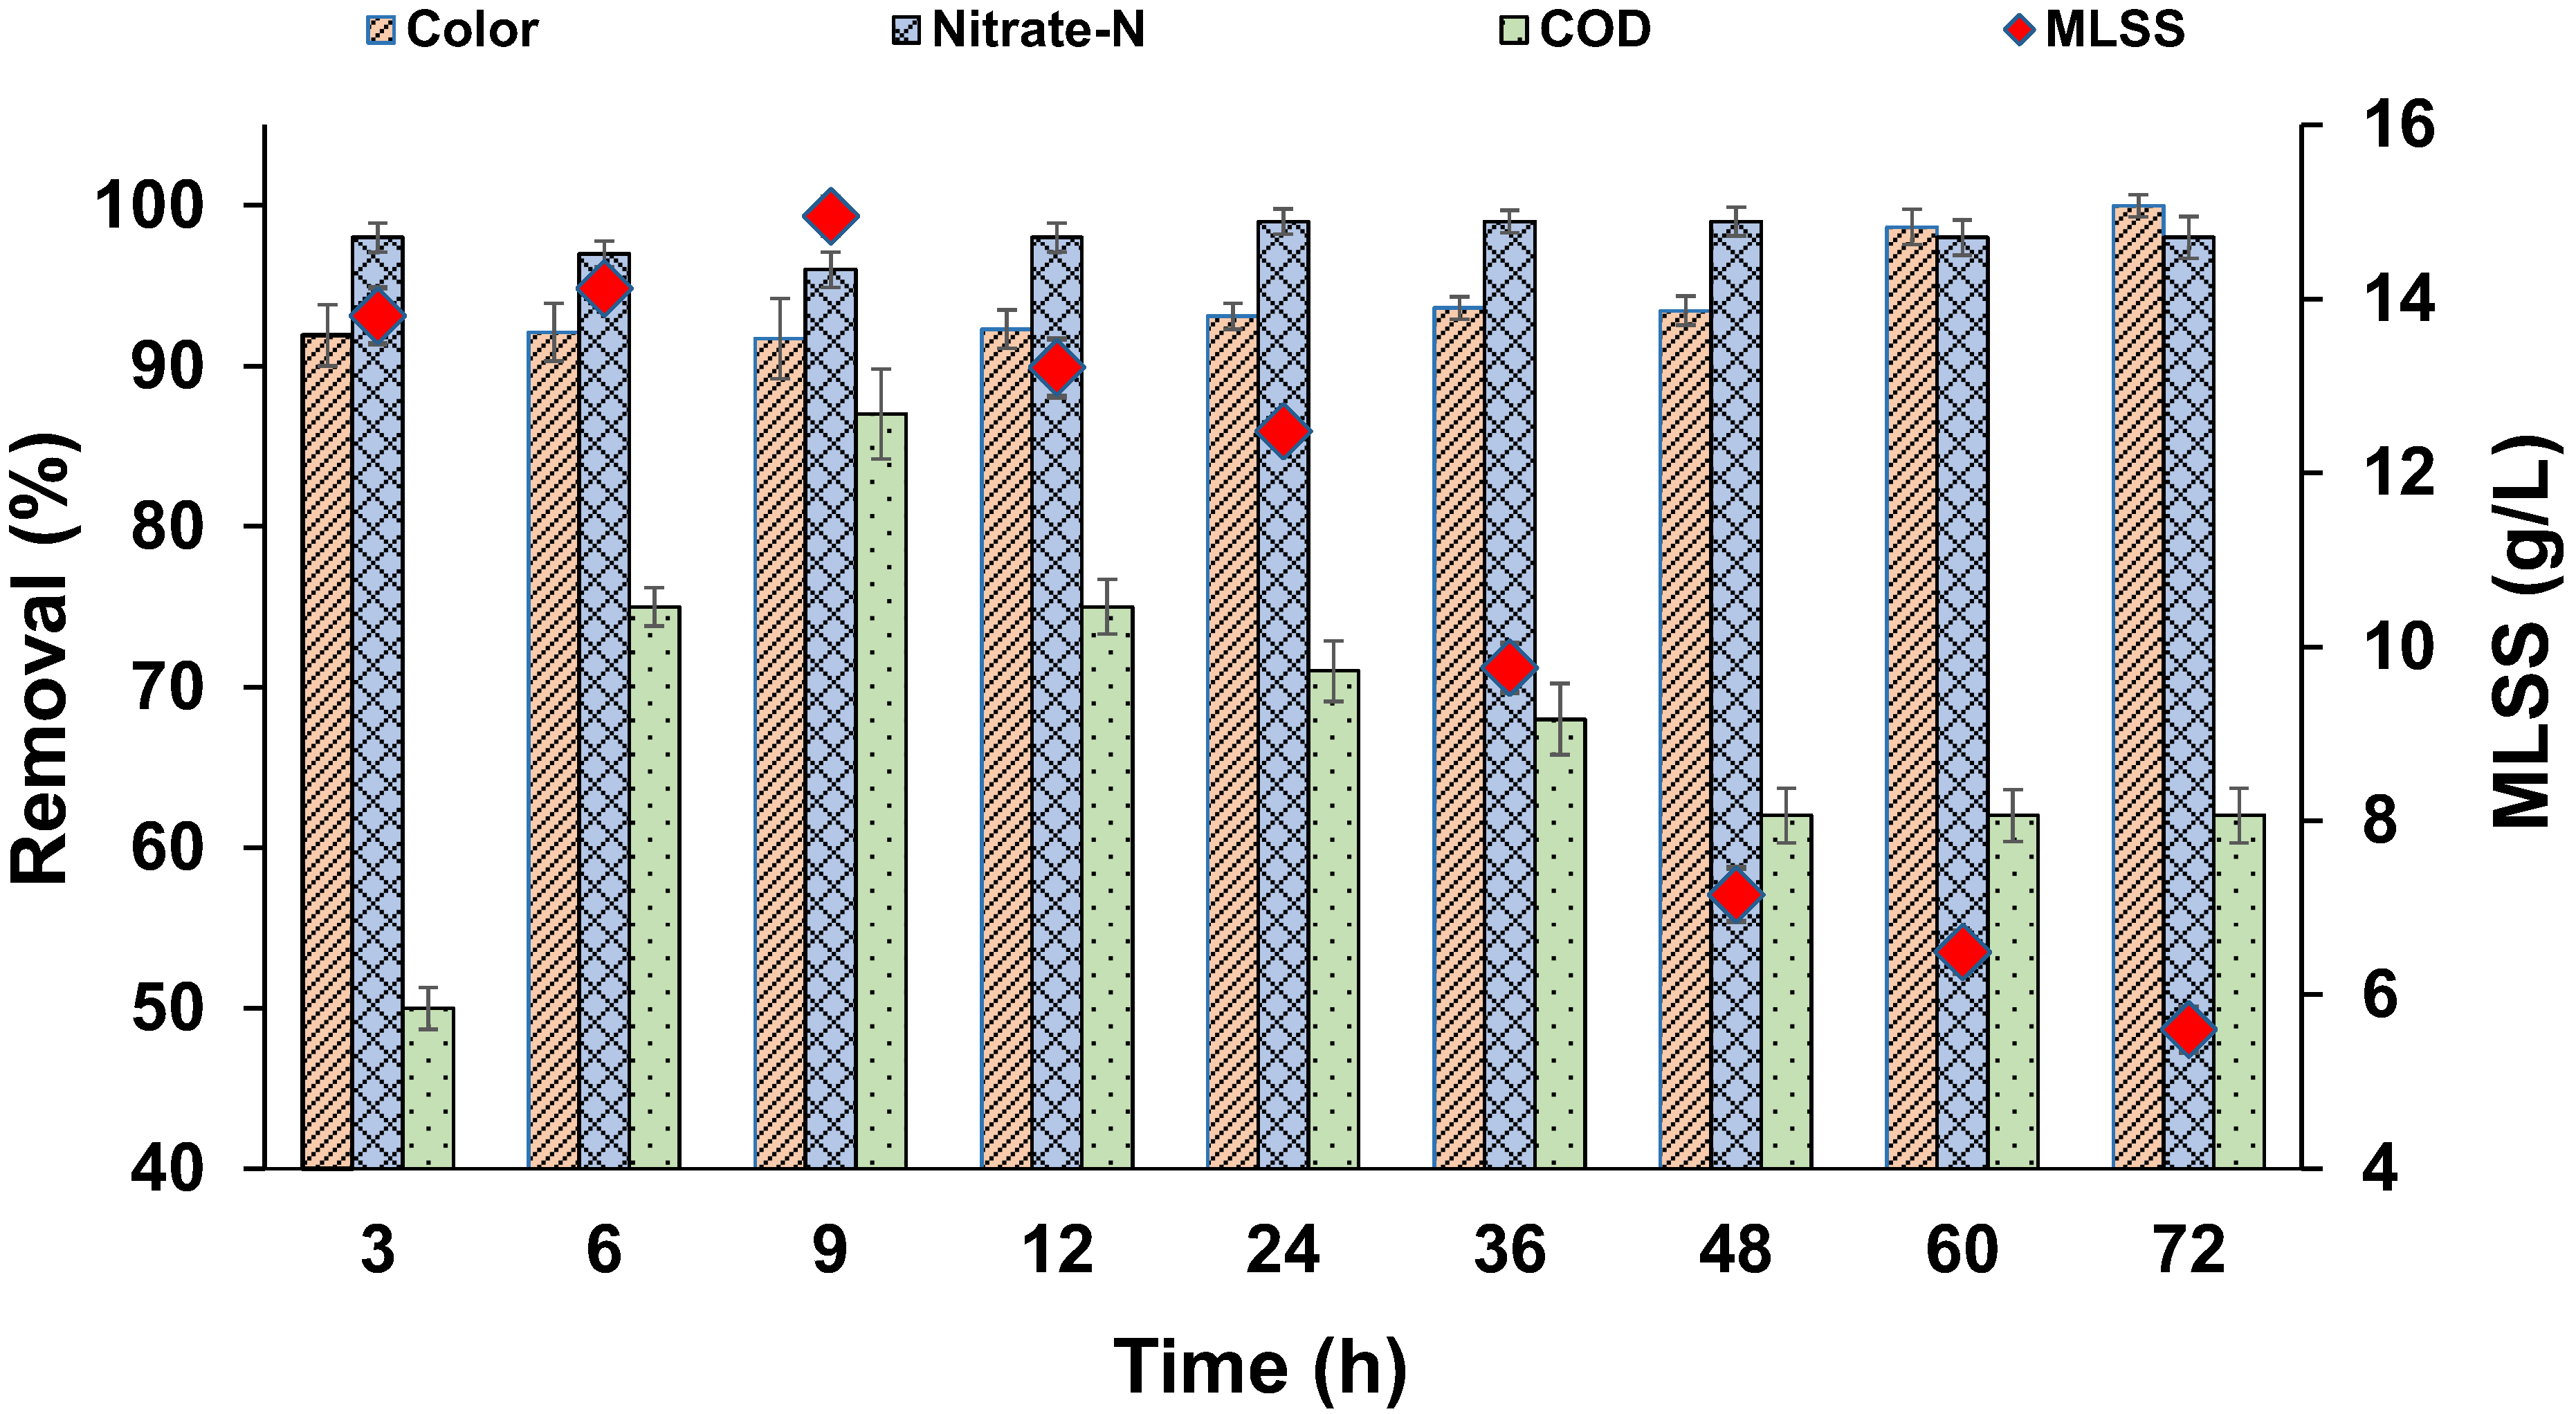
The kinetic study results are shown in Figure 5. Nearly 87% of the colour was removed within the first 12 h, and 98% of colour removal was achieved by 48 h. Maximum colour removal was achieved in a short time, indicating that reduction of MO took place in the cell exterior. Generally, azo dyes such as MO, with a high molecular size and sulfonated groups, cannot pass through the cell membrane; hence, the reduction takes place outside the cell, leading to a faster reaction occur compared with situations where co-substrates are absent. As sucrose (COD) was present, faster colour removal occurred, similar to results that were reported earlier [48]. The MO decolourization followed first-order kinetics and the respective rate constant was 0.0612 h−1 (R2 = 0.9328), based on the best fit from Figure 6. Effective NO3−-N removal was achieved within the first 12 h. Gradual increase in COD removal occurred, with times up to 72 h. Later, a decrease in COD removal was noticed, which may have been due to the lysis of biomass and accumulation of aromatic amines with time. Figure 7 shows the pH profile; a drop in pH was noticed in all the reactors compared with the pH of nutrient media, which was around 7.5.
3.7. Evaluation of Biomass Growth
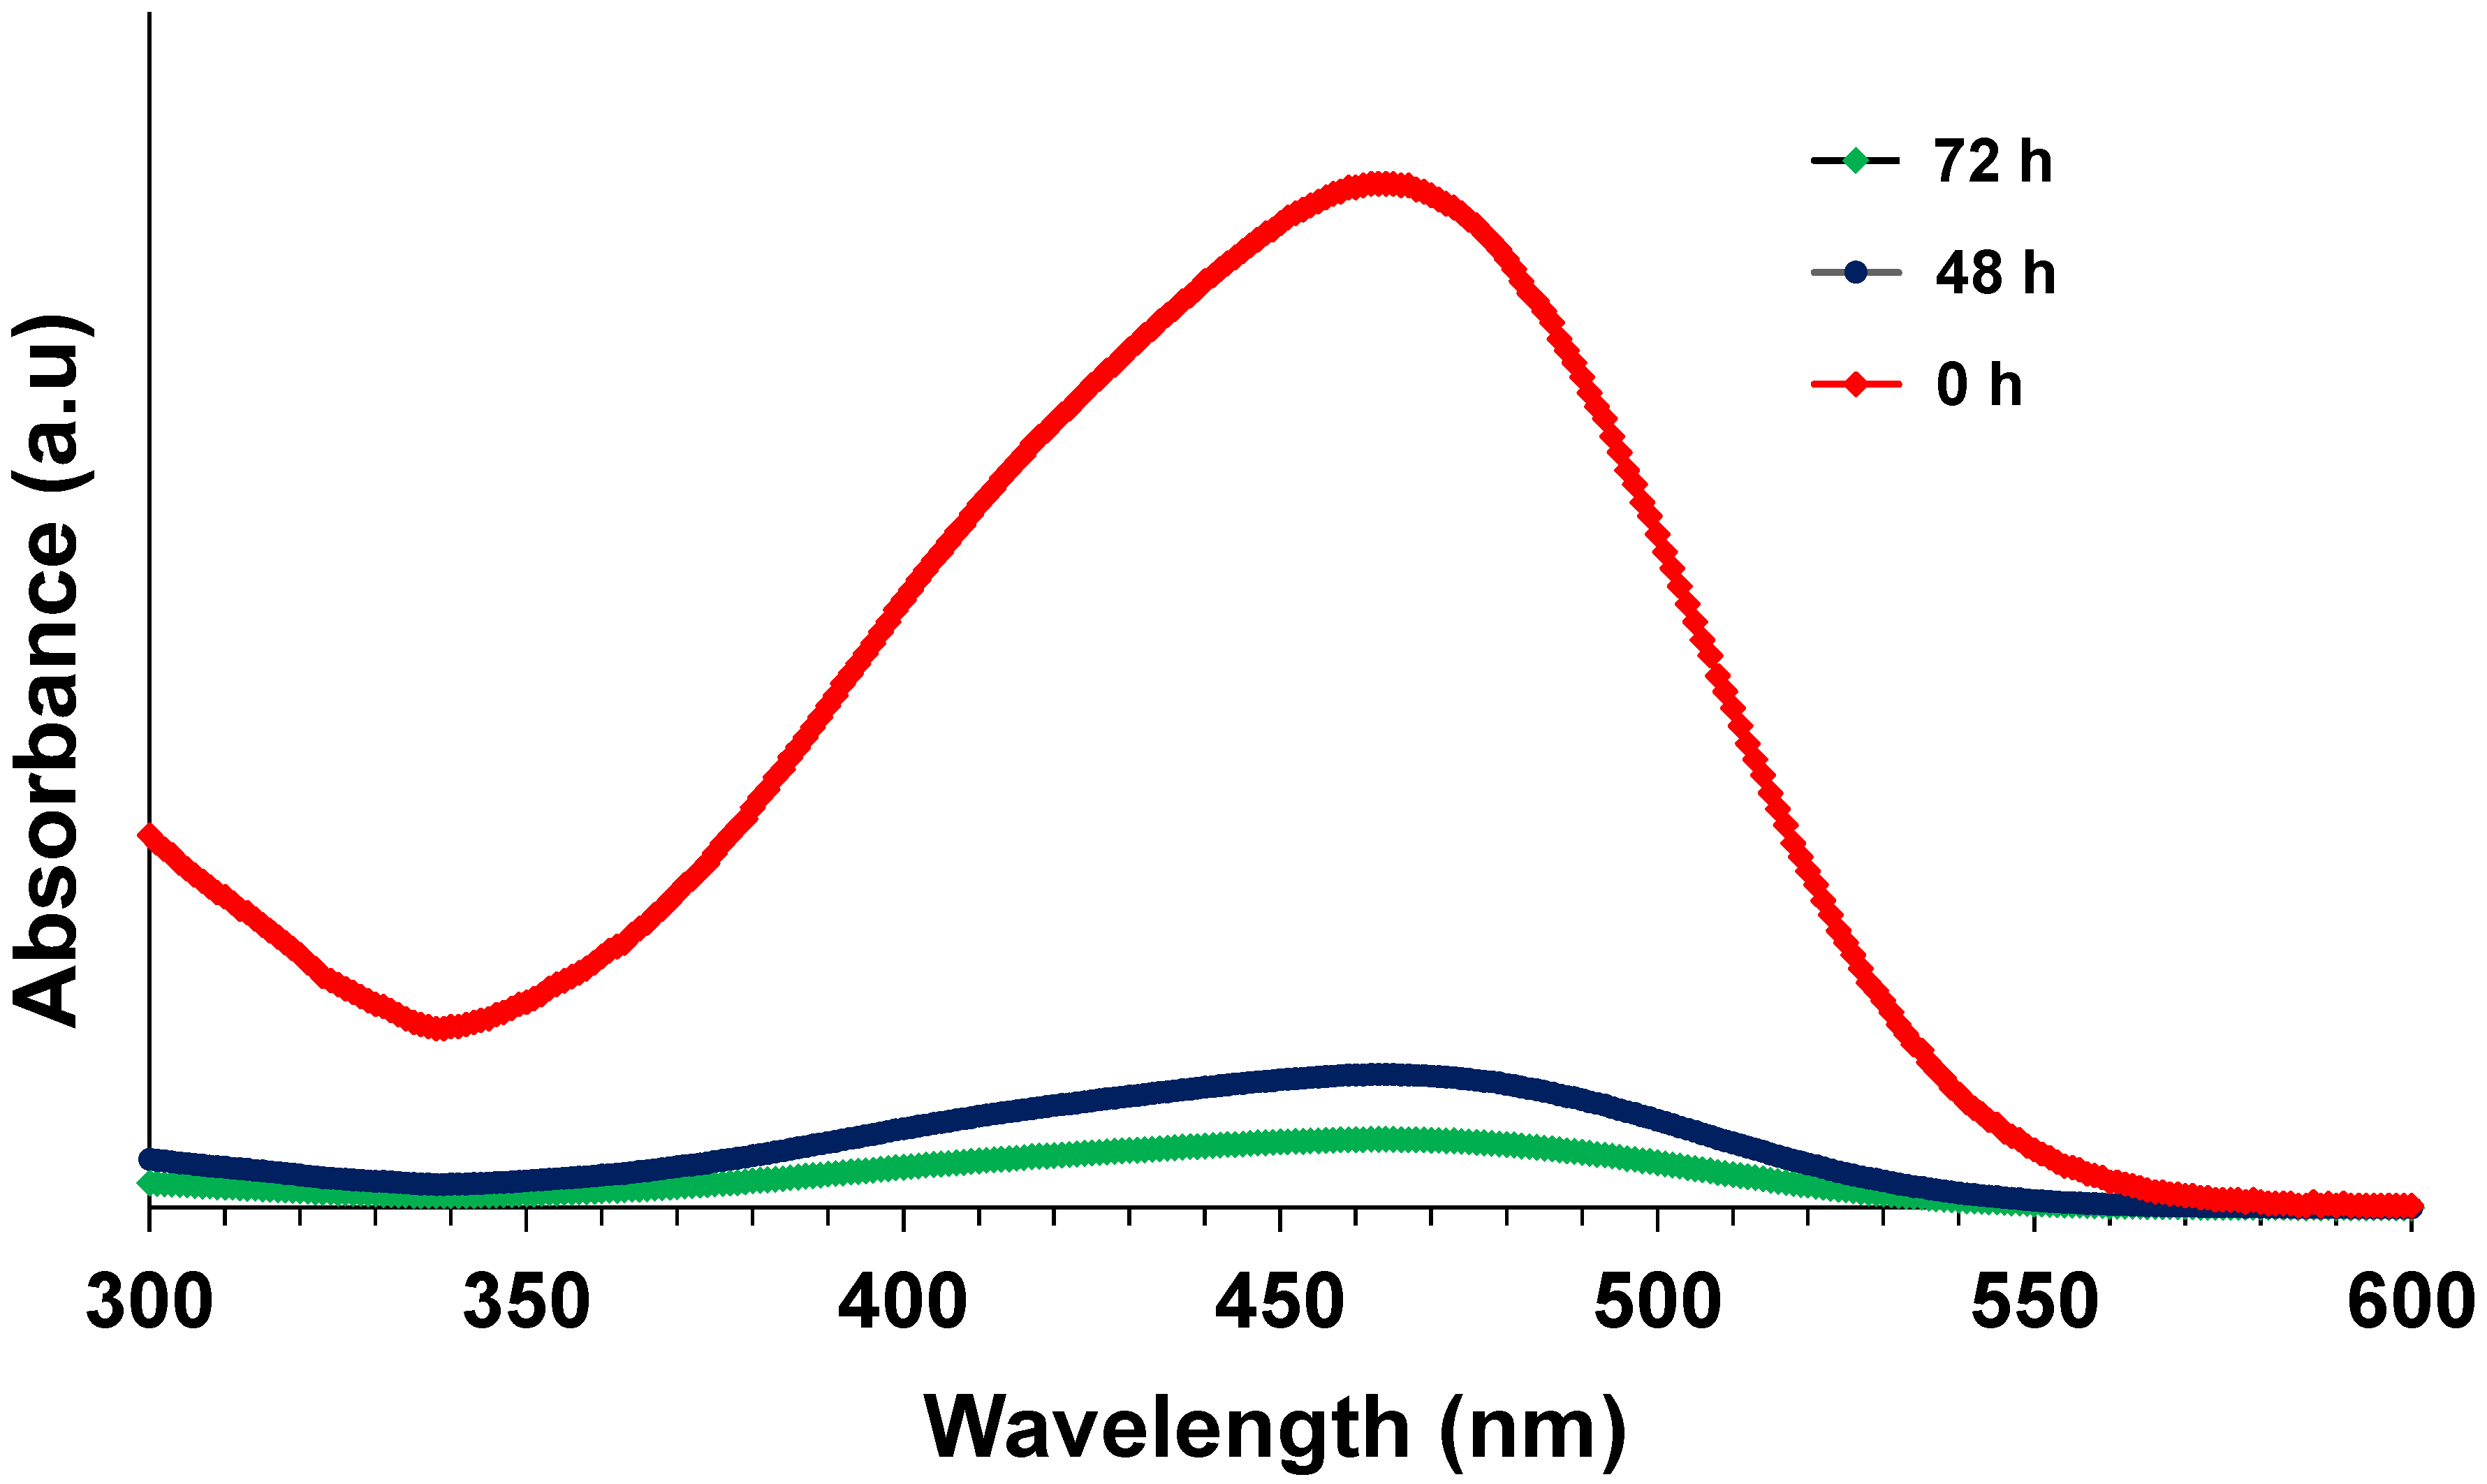
Another set of reactors were operated to study the growth of biomass over time. Figure 8 shows the change in MLSS over time. Slight fluctuations were noticed in MLSS values during the initial few hours of the reaction. MLSS during start-up was 13.8 g/L, whereas it decreased to 5.6 g/L at 72 h. This suggests that continuous lysis of biomass was happening inside the reactor, due to the increased reaction time from the accumulation of toxic intermediates. Higher concentrations of dye may have also caused a toxic effect on microbial cells. Even though continuous lysis of biomass was occurring, effective colour and NO3−-N removal occurred in all the batch reactors, which were beneficial in terms of sludge disposal. Similar behaviour was observed in an anoxic packed bed reactor, operated in denitrifying conditions by Swathi et al. [18], where effective decolourization/mineralization and denitrification occurred with continuous biomass lysis. In another study, authors reported that COD removal efficiency severely declined at shock loading rates of azo dye RO16 (300 to 1000 ppm), owing to the immature microbial enzymatic system. However, COD removal efficiency was gradually enhanced in the adaptation period [49]. Several other studies reported that, after the adaptation period, the microbial consortia that were able to secrete the effective operational enzymes thrived in the system. Subsequently, adequate levels of enzymes could be released, consuming azo dyes as their primary carbon and energy source [50,51,52]. UV-Vis absorbance spectra of the initial sample at 0 h and treated samples at 48 and 72 h are shown in Figure 9. A drastic decrease in the peak was found at 460 nm in the samples at 48 and 72 h, indicating the effective decolourization of MO. Thus, upon proper enrichment, a mixed bacterial culture can decolourize higher concentrations of MO under denitrifying conditions, and enhanced biomass lysis is advantageous in suspended growth systems as it could minimize sludge handling problems. However, tertiary treatment is required to eliminate the remaining COD present in the effluent by either aerobic biological treatment or advanced physico-chemical treatment.
3.8. Effect of Salinity
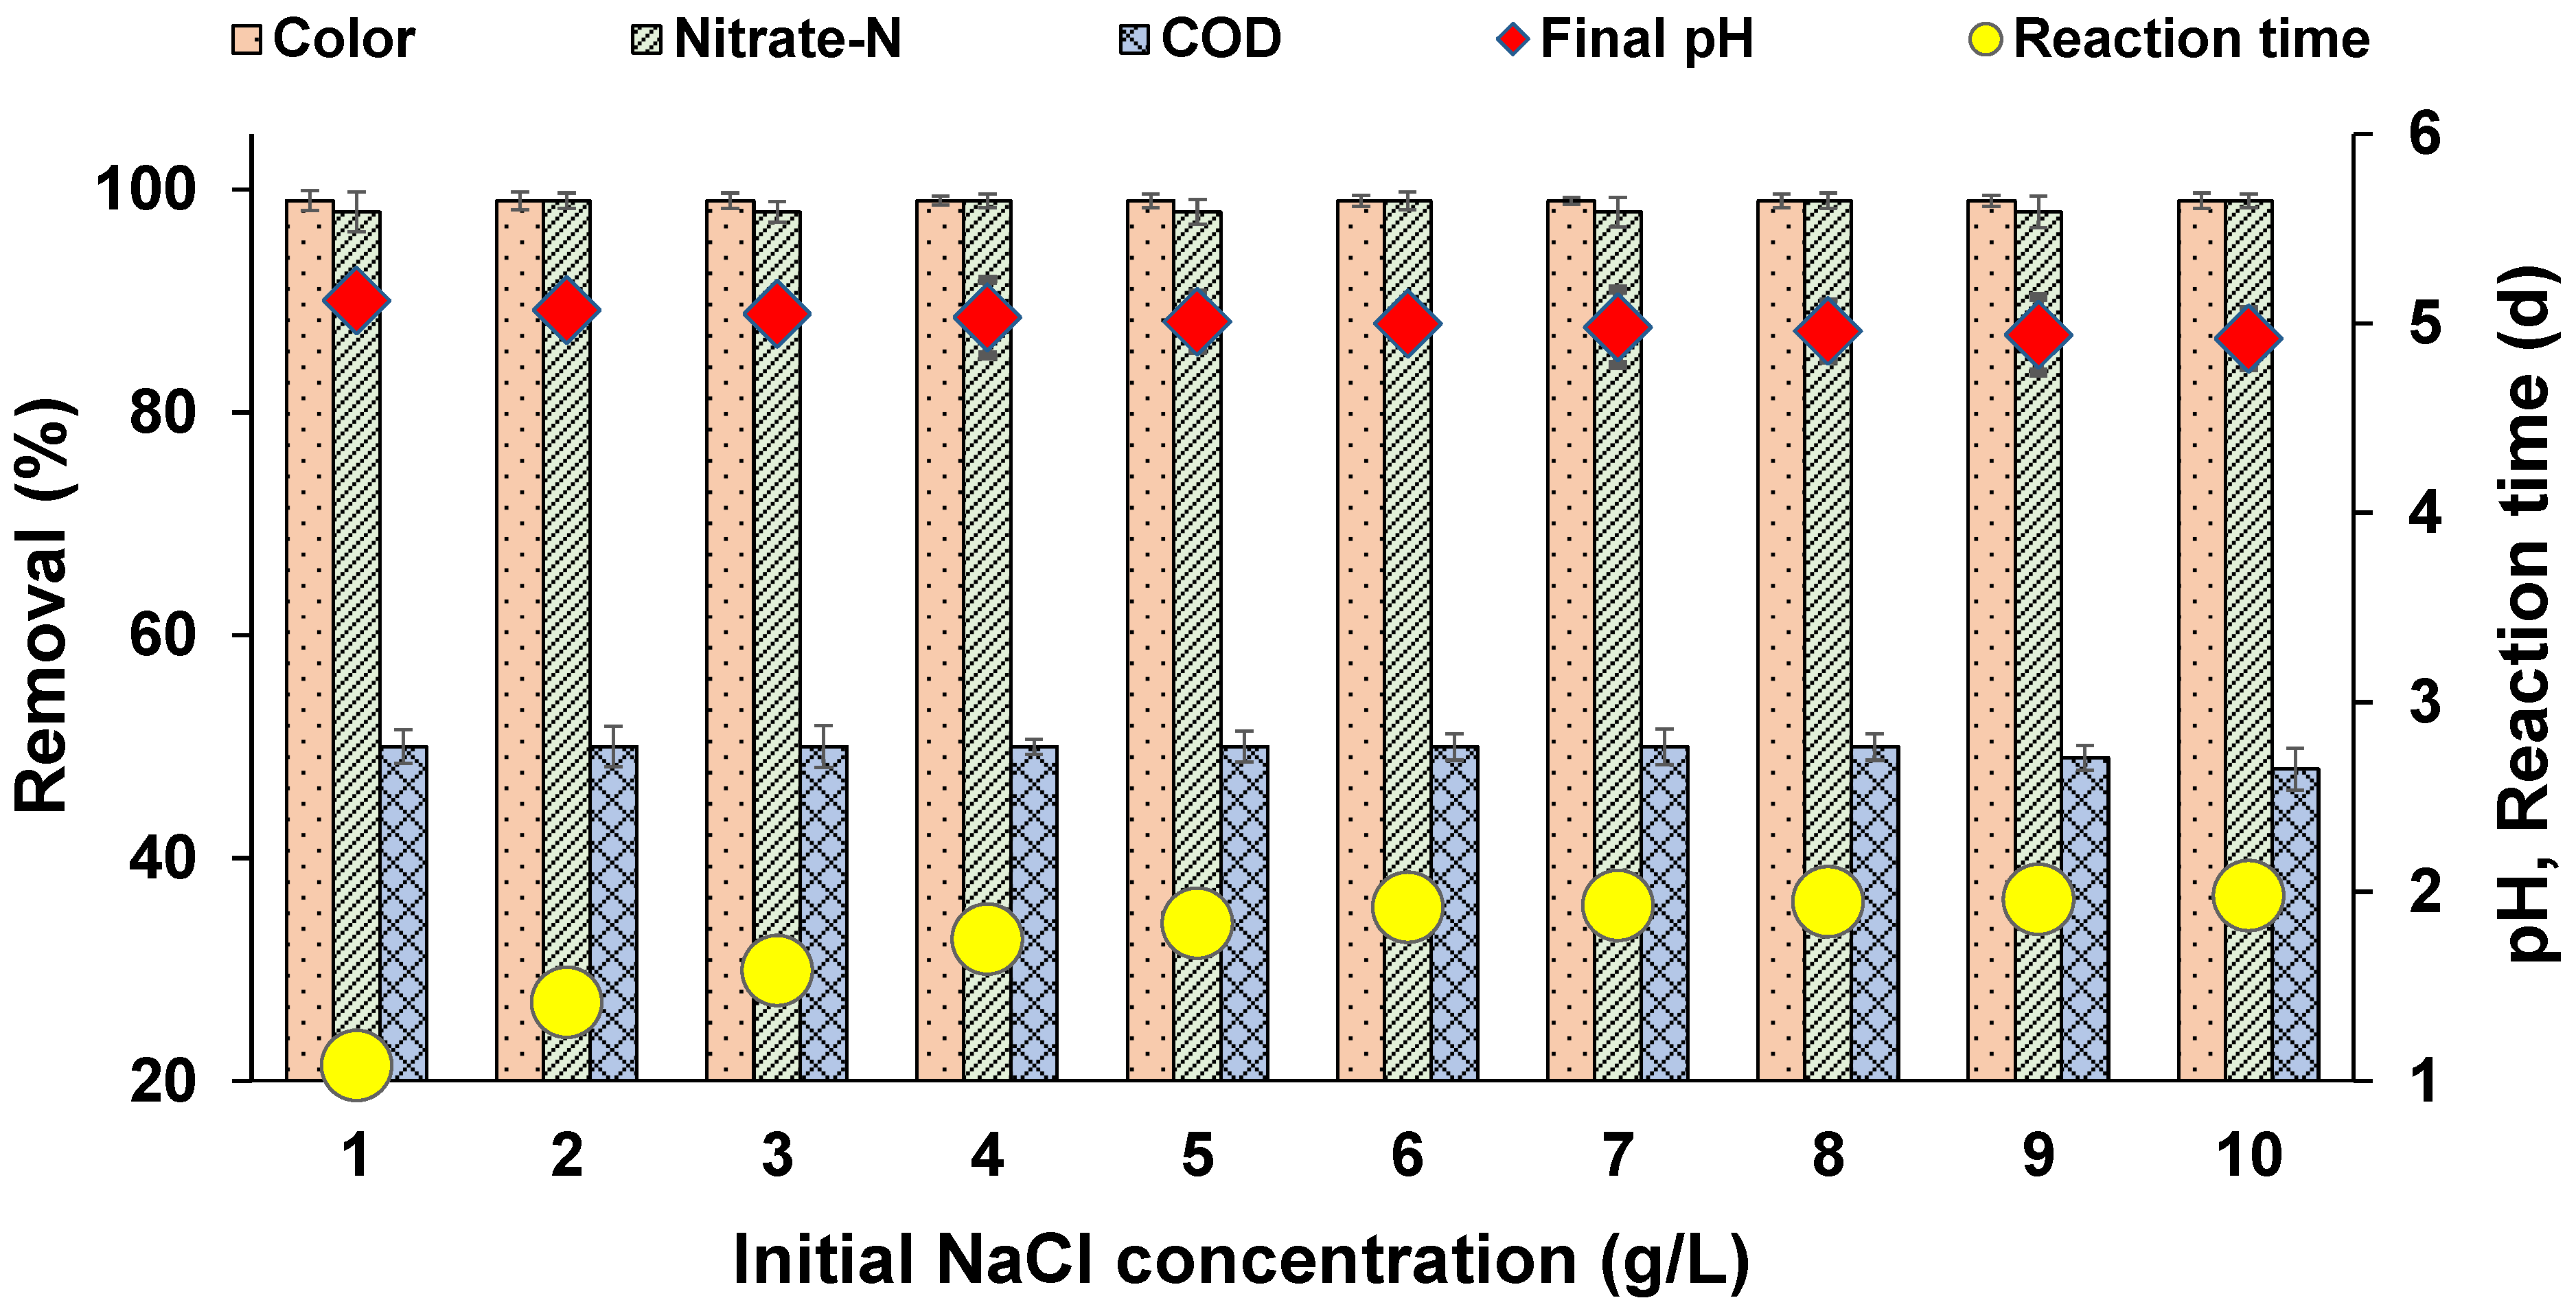
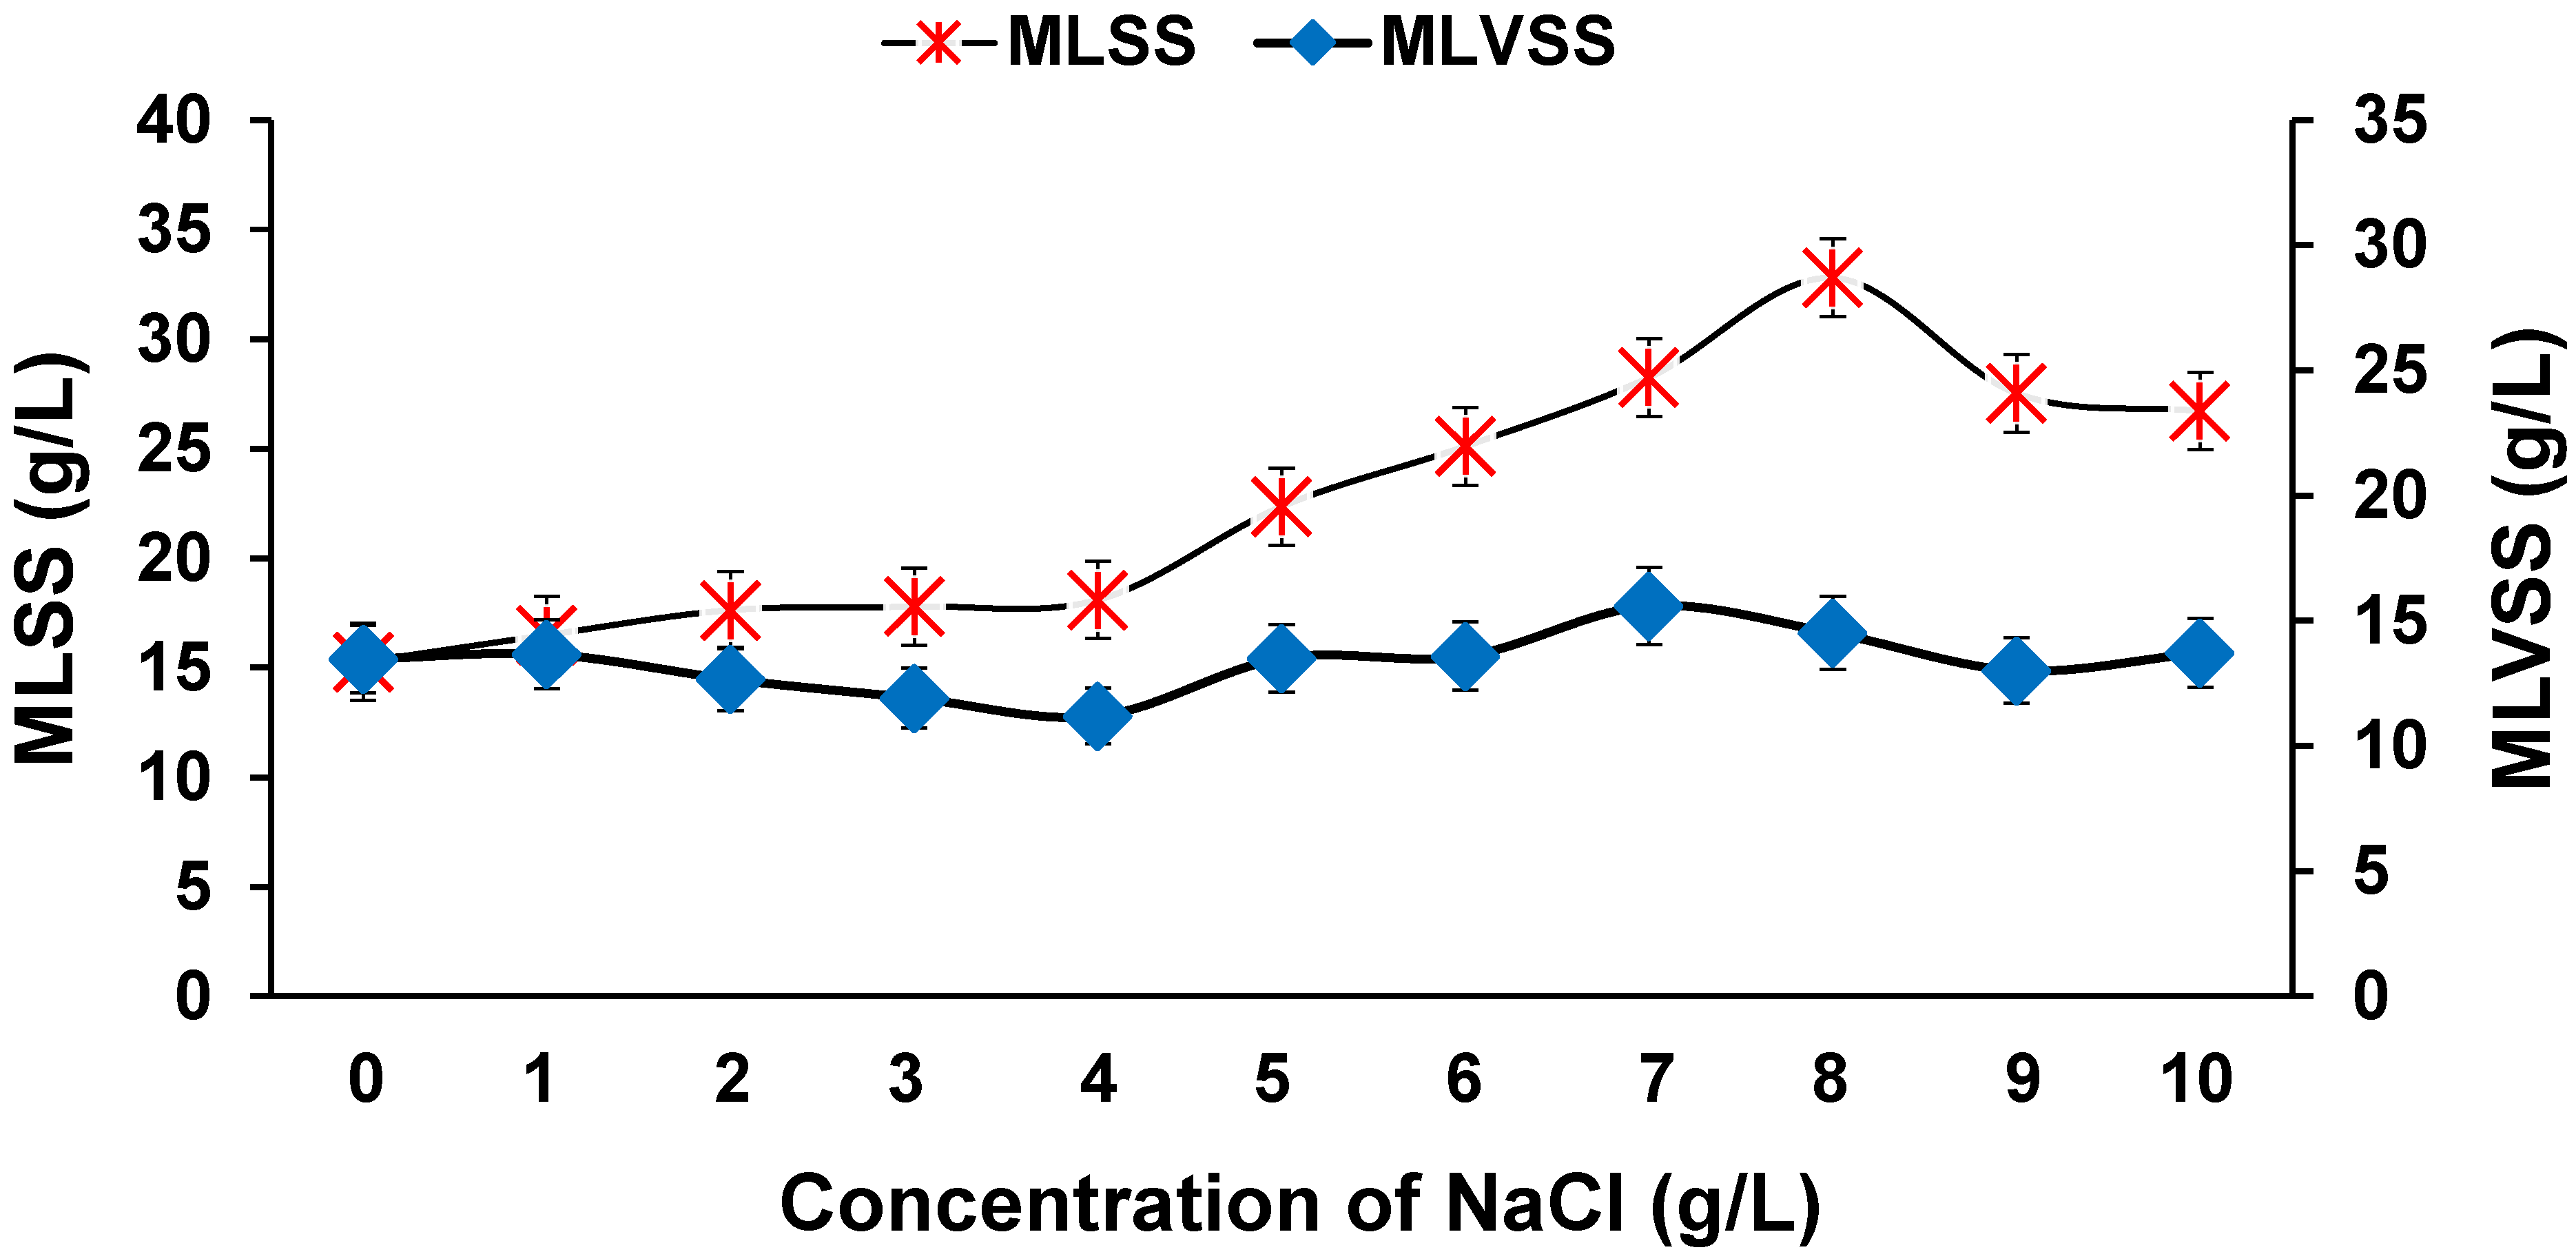
In the textile dyeing process, various salts are used to separate organic contaminants to help in precipitation and standardization of dyestuff. Textile industry effluents are generally characterized by high salt concentrations of about 1 to 10 g/L [53]. Many species of bacteria are sensitive to the high concentration of salts in the saline azo dye wastewater, due to plasmolysis or loss of active cells [54]. However, a few microbial species are capable of surviving in high saline conditions due to certain physiological and morphological adaptations. Hence, this experiment was conducted to determine whether our developed process was capable of being sustained in high salt conditions. As evident from Figure 10, efficient colour (>99%), and NO3−-N (>98%) removal was found in all the reactors, with 1 to 10 g/L of NaCl. In the reactor with 1 g/L of NaCl, complete colour removal occurred within 1 d, and complete decolourization was achieved in 2 d in the reactor with 10 g/L of NaCl. Guo et al. [55] identified that consortium GG-1 (Zobellella, Rheinheimera, and Marinobacterium) could decolourize a wide variety of azo dyes in saline concentrations up to 15 g/L of NaCl, catalyzed by the enzymes azoredyctase, laccase, and lignin peroxidase. In this study, NO3−-N removal was also not affected by high salinity. COD removal was also stable in all the reactors. Interestingly, higher biomass growth was noticed in the reactors with salinity up to 8 g/L (Figure 11). A few studies have reported an increase in growth of biomass under moderate saline conditions, whereas drastic decreases in growth rate are observed in very high saline environments [56,57]. Overall, the results indicate that salinity at moderate concentrations in real textile effluents will not affect the decolourization process.
4. Conclusions
The results of this study show the feasibility of effective decolourization of high concentrations of MO, along with simultaneous removal of NO3−-N and COD under denitrifying conditions. The process is effective in broad pH and salinity ranges, making it suitable for real-life applications. High concentrations of NaCl may enhance biomass lyses, which in turn supplies sufficient organic carbon for effective denitrification. At higher biomass concentrations and increased reaction times (84 h), complete decolourization occurs even at high concentration of MO (1000 mg/L). The synergy between different microbial species under denitrifying conditions appears to help in effective decolourization but requires further research. Although decolourization is possible in the absence of organic carbon, supplementing with sucrose greatly enhances the decolourization rate. Analysis of reaction kinetics showed that an extended reaction time enhanced the removal of COD, and decolourization followed first-order kinetics with a rate constant of 0.0612 h−1. This developed process will be helpful to treat real textile industry wastewaters, as this process has several benefits, including: (i) Cost-effectiveness; (ii) Having a smaller footprint; (iii) Low sludge production; (iv) Greater stability in diverse conditions, such as high concentrations of dye or wide ranges of pH and salinity levels (v) Simultaneous decolourization and denitrification; (vi) Easy process control. However, further studies are needed to find effective ways for the complete mineralization of the treated effluent before releasing it to the environment or being available for reuse.
Author Contributions
S.D. conducted experiments, investigation, formal analysis, validation, and writing (original draft). A.T. was involved in conducting experiments. S.P.C. was involved in conceptualization, data curation, funding acquisition, project administration, supervision, and writing (review and editing). All authors have read and agreed to the published version of the manuscript.
Funding
This research was funded by the Department of Science and Technology (DST), Government of India with grant number DST/TM/WIC/WTI/2K17/82(G3).
Institutional Review Board Statement
Not applicable.
Informed Consent Statement
Not applicable.
Data Availability Statement
Not deposited in any repository.
Acknowledgments
Authors also thank VIT management in supporting the APC for publication in a distinguished open access journal.
Conflicts of Interest
The authors declare no conflict of interest.
References
- Hassaan, M.A.; El Nemr, A.; Hassaan, A. Health and environmental impacts of dyes: Mini review. Am. J. Environ. Sci. Eng. 2017, 1, 64–67. [Google Scholar] [CrossRef]
- Aggarwal, S. Indian dye yielding plants: Efforts and opportunities. In Natural Resources Forum; Wiley Online Library, 2021; pp. 63–86. [Google Scholar] [CrossRef]
- Shabbir, S.; Faheem, M.; Ali, N.; Kerr, P.G.; Wu, Y. Periphyton biofilms: A novel and natural biological system for the effective removal of sulphonated azo dye methyl orange by synergistic mechanism. Chemosphere 2017, 167, 236–246. [Google Scholar] [CrossRef] [PubMed]
- Taheri, M.; Fallah, N.; Nasernejad, B. Which treatment procedure among electrocoagulation, biological, adsorption, and bio-adsorption processes performs best in azo dyes removal? Water Resour. Ind. 2022, 28, 100191. [Google Scholar] [CrossRef]
- Han, G.; Du, Y.; Huang, Y.; Wang, W.; Su, S.; Liu, B. Study on the removal of hazardous Congo red from aqueous solutions by chelation flocculation and precipitation flotation process. Chemosphere 2022, 289, 133109. [Google Scholar] [CrossRef]
- Arshadi, M.; Mehravar, M.; Amiri, M.; Faraji, A. Synthesis and adsorption characteristics of an heterogenized manganese nanoadsorbent towards methyl orange. J. Colloid Interface Sci. 2015, 440, 189–197. [Google Scholar] [CrossRef]
- Cockerham, C.; Caruthers, A.; McCloud, J.; Fortner, L.M.; Youn, S.; McBride, S.P. Azo-Dye-Functionalized Polycarbonate Membranes for Textile Dye and Nitrate Ion Removal. Micromachines 2022, 13, 577. [Google Scholar] [CrossRef]
- Marcus, R.N.; Joseph, C.G.; Taufiq-Yap, Y.H.; Soloi, S.; Hafiz, M.; Abd Majid, Z.J.; Ali, S.A.M.; Vijayan, V.; Pang, C.K. Current Trends on the Utilization of Ozonation Treatment Process for the Remediation of Dye Wastewater: A Short Review. Malays. J. Chem. 2022, 24, 113–124. [Google Scholar]
- Wakrim, A.; Zaroual, Z.; El Ghachtouli, S.; Jamal Eddine, J.; Azzi, M. Treatment and Degradation of Azo Dye Waste Industry by Electro-Fenton Process. Phys. Chem. Res. 2022, 10, 495–504. [Google Scholar] [CrossRef]
- Shao, D.; Li, W.; Wang, Z.; Yang, C.; Xu, H.; Yan, W.; Yang, L.; Wang, G.; Yang, J.; Feng, L. Variable activity and selectivity for electrochemical oxidation wastewater treatment using a magnetically assembled electrode based on Ti/PbO2 and carbon nanotubes. Sep. Purif. Technol. 2022, 301, 122008. [Google Scholar] [CrossRef]
- Selvaraj, V.; Swarna Karthika, T.; Mansiya, C.; Alagar, M. An over review on recently developed techniques, mechanisms and intermediate involved in the advanced azo dye degradation for industrial applications. J. Mol. Struct. 2021, 1224, 129195. [Google Scholar] [CrossRef]
- Parshetti, G.; Telke, A.; Kalyani, D.; Govindwar, S.P. Decolorization and detoxification of sulfonated azo dye methyl orange by Kocuria rosea MTCC 1532. J. Hazard. Mater. 2010, 176, 503–509. [Google Scholar] [CrossRef] [PubMed]
- Varjani, S.; Rakholiya, P.; Ng, H.Y.; You, S.; Teixeira, J.A. Microbial degradation of dyes: An overview. Bioresour. Technol. 2020, 314, 123728. [Google Scholar] [CrossRef] [PubMed]
- Yan, L.K.Q.; Fung, K.Y.; Ng, K.M. Aerobic sludge granulation for simultaneous anaerobic decolorization and aerobic aromatic amines mineralization for azo dye wastewater treatment. Environ. Technol. 2018, 39, 1368–1375. [Google Scholar] [CrossRef] [PubMed]
- Cui, M.-H.; Gao, L.; Lee, H.-S.; Wang, A.-J. Mixed dye wastewater treatment in a bioelectrochemical system-centered process. Bioresour. Technol. 2020, 297, 122420. [Google Scholar] [CrossRef]
- Balapure, K.; Aghera, P.; Bhatt, N.; Madamwar, D. Community Synergism: Degradation of Triazine Dye Reactive Black 1 by Mixed Bacterial Cultures KND_PR under Microaerophilic and Aerobic Conditions. Environ. Process. 2019, 6, 713–739. [Google Scholar] [CrossRef]
- Aleem, M.; Cao, J.; Li, C.; Rashid, H.; Wu, Y.; Nawaz, M.I.; Abbas, M.; Akram, M.W. Coagulation-and adsorption-based environmental impact assessment and textile effluent treatment. Water Air Soil Pollut. 2020, 231, 45. [Google Scholar] [CrossRef]
- Swathi, D.; Sabumon, P.C.; Trivedi, A. Simultaneous decolorization and mineralization of high concentrations of methyl orange in an anoxic up-flow packed bed reactor in denitrifying conditions. J. Water Process Eng. 2021, 40, 101813. [Google Scholar] [CrossRef]
- Guo, G.; Hao, J.; Tian, F.; Liu, C.; Ding, K.; Xu, J.; Zhou, W.; Guan, Z. Decolorization and detoxification of azo dye by halo-alkaliphilic bacterial consortium: Systematic investigations of performance, pathway and metagenome. Ecotoxicol. Environ. Saf. 2020, 204, 111073. [Google Scholar] [CrossRef]
- Hou, C.; Shen, J.; Jiang, X.; Zhang, D.; Sun, X.; Li, J.; Han, W.; Liu, X.; Wang, L. Enhanced anoxic biodegradation of pyridine coupled to nitrification in an inner loop anoxic/oxic-dynamic membrane bioreactor (A/O-DMBR). Bioresour. Technol. 2018, 267, 626–633. [Google Scholar] [CrossRef]
- Saini, R.D. Textile organic dyes: Polluting effects and elimination methods from textile waste water. Int. J. Chem. Eng. Res. 2017, 9, 121–136. [Google Scholar]
- Manogaran, M.; Yasid, N.A.; Othman, A.R.; Gunasekaran, B.; Halmi, M.I.E.; Shukor, M.Y.A. Biodecolourisation of Reactive Red 120 as a Sole Carbon Source by a Bacterial Consortium—Toxicity Assessment and Statistical Optimisation. Int. J. Environ. Res. Public Health 2021, 18, 2424. [Google Scholar] [CrossRef] [PubMed]
- Metcalf; Eddy; Abu-Orf, M.; Bowden, G.; Burton, F.L.; Pfrang, W.; Stensel, H.D.; Tchobanoglous, G.; Tsuchihashi, R.; AECOM. Wastewater Engineering: Treatment and Resource Recovery; McGraw Hill Education: New York, NY, USA, 2014. [Google Scholar]
- APHA; AWWA; WPCF. Standard Methods for the Examination of Water and Wastewater, 20th ed.; American Public Health Association: Washington, DC, USA, 1998. [Google Scholar]
- Desireddy, S.; Raghupatruni Lakshmi, M.; Pothanamkandathil Chacko, S.; Mehta, A. Development of an anoxic nitrification-denitrification process in a granulated nanoscale oxyhydroxides of Fe packed bed reactor for the simultaneous removal of NH4+-N and COD. Environ. Nanotechnol. Monit. Manag. 2021, 15, 100412. [Google Scholar] [CrossRef]
- Pandey, A.; Singh, P.; Iyengar, L. Bacterial decolorization and degradation of azo dyes. Int. Biodeterior. Biodegrad. 2007, 59, 73–84. [Google Scholar] [CrossRef]
- Al-Amrani, W.A.; Lim, P.-E.; Seng, C.-E.; Wan Ngah, W.S. Factors affecting bio-decolorization of azo dyes and COD removal in anoxic–aerobic REACT operated sequencing batch reactor. J. Taiwan Inst. Chem. Eng. 2014, 45, 609–616. [Google Scholar] [CrossRef]
- Patel, D.K.; Tipre, D.R.; Dave, S.R. Enzyme mediated bacterial biotransformation and reduction in toxicity of 1:2 chromium complex AB193 and AB194 dyes. J. Taiwan Inst. Chem. Eng. 2017, 77, 1–9. [Google Scholar] [CrossRef]
- Nikam, M.; Patil, S.; Patil, U.; Khandare, R.; Govindwar, S.; Chaudhari, A. Biodegradation and detoxification of azo solvent dye by ethylene glycol tolerant ligninolytic ascomycete strain of Pseudocochliobolus verruculosus NFCCI 3818. Biocatal. Agric. Biotechnol. 2017, 9, 209–217. [Google Scholar] [CrossRef]
- Zhao, M.; Sun, P.-F.; Du, L.-N.; Wang, G.; Jia, X.-M.; Zhao, Y.-H. Biodegradation of methyl red by Bacillus sp. strain UN2: Decolorization capacity, metabolites characterization, and enzyme analysis. Environ. Sci. Pollut. Res. 2014, 21, 6136–6145. [Google Scholar] [CrossRef]
- Nouren, S.; Bhatti, H.N.; Iqbal, M.; Bibi, I.; Nazar, N.; Iqbal, D.N.; Kanwal, Q.; Kausar, A.; Hussain, F. Redox Mediators Assisted-degradation of Direct Yellow 4. Pol. J. Environ. Stud. 2017, 26, 2885–2890. [Google Scholar] [CrossRef]
- Chang, J.-S.; Chou, C.; Lin, Y.-C.; Lin, P.-J.; Ho, J.-Y.; Lee Hu, T. Kinetic characteristics of bacterial azo-dye decolorization by Pseudomonas luteola. Water Res. 2001, 35, 2841–2850. [Google Scholar] [CrossRef]
- Maniyam, M.N.; Ibrahim, A.L.; Cass, A.E. Decolourization and biodegradation of azo dye methyl red by Rhodococcus strain UCC 0016. Environ. Technol. 2020, 41, 71–85. [Google Scholar] [CrossRef]
- Ayed, L.; Mahdhi, A.; Cheref, A.; Bakhrouf, A. Decolorization and degradation of azo dye Methyl Red by an isolated Sphingomonas paucimobilis: Biotoxicity and metabolites characterization. Desalination 2011, 274, 272–277. [Google Scholar] [CrossRef]
- Chen, B.-Y. Understanding decolorization characteristics of reactive azo dyes by Pseudomonas luteola: Toxicity and kinetics. Process Biochem. 2002, 38, 437–446. [Google Scholar] [CrossRef]
- Ong, S.-A.; Toorisaka, E.; Hirata, M.; Hano, T. Decolorization of Orange II using an anaerobic sequencing batch reactor with and without co-substrates. J. Environ. Sci. 2012, 24, 291–296. [Google Scholar] [CrossRef]
- Işık, M.; Sponza, D.T. Effects of alkalinity and co-substrate on the performance of an upflow anaerobic sludge blanket (UASB) reactor through decolorization of Congo Red azo dye. Bioresour. Technol. 2005, 96, 633–643. [Google Scholar] [CrossRef] [PubMed]
- Wang, H.; Su, J.Q.; Zheng, X.W.; Tian, Y.; Xiong, X.J.; Zheng, T.L. Bacterial decolorization and degradation of the reactive dye Reactive Red 180 by Citrobacter sp. CK3. Int. Biodeterior. Biodegrad. 2009, 63, 395–399. [Google Scholar] [CrossRef]
- Kapoor, R.T.; Danish, M.; Singh, R.S.; Rafatullah, M.; HPS, A.K. Exploiting microbial biomass in treating azo dyes contaminated wastewater: Mechanism of degradation and factors affecting microbial efficiency. J. Water Process Eng. 2021, 43, 102255. [Google Scholar] [CrossRef]
- Pourbabaee, A.; Malekzadeh, F.; Sarbolouki, M.; Najafi, F. Aerobic decolorization and detoxification of a disperse dye in textile effluent by a new isolate of Bacillus sp. Biotechnol. Bioeng. 2006, 93, 631–635. [Google Scholar] [CrossRef]
- Garg, S.K.; Tripathi, M.; Singh, S.K.; Tiwari, J.K. Biodecolorization of textile dye effluent by Pseudomonas putida SKG-1 (MTCC 10510) under the conditions optimized for monoazo dye orange II color removal in simulated minimal salt medium. Int. Biodeterior. Biodegrad. 2012, 74, 24–35. [Google Scholar] [CrossRef]
- Garg, S.K.; Tripathi, M. Process parameters for decolorization and biodegradation of orange II (Acid Orange 7) in dye-simulated minimal salt medium and subsequent textile effluent treatment by Bacillus cereus (MTCC 9777) RMLAU1. Environ. Monit. Assess. 2013, 185, 8909–8923. [Google Scholar] [CrossRef]
- Pearce, C.I.; Lloyd, J.R.; Guthrie, J.T. The removal of colour from textile wastewater using whole bacterial cells: A review. Dye. Pigment. 2003, 58, 179–196. [Google Scholar] [CrossRef]
- Dawkar, V.V.; Jadhav, U.U.; Ghodake, G.S.; Govindwar, S.P. Effect of inducers on the decolorization and biodegradation of textile azo dye Navy blue 2GL by Bacillus sp. VUS. Biodegradation 2009, 20, 777–787. [Google Scholar] [CrossRef] [PubMed]
- Masarbo, R.S.; Karegoudar, T. Decolourisation of toxic azo dye Fast Red E by three bacterial strains: Process optimisation and toxicity assessment. Int. J. Environ. Anal. Chem. 2020, 102, 2686–2696. [Google Scholar] [CrossRef]
- Wu, H.; Sun, Q.; Sun, Y.; Zhou, Y.; Wang, J.; Hou, C.; Jiang, X.; Liu, X.; Shen, J. Co-metabolic enhancement of 1H-1,2,4-triazole biodegradation through nitrification. Bioresour. Technol. 2019, 271, 236–243. [Google Scholar] [CrossRef]
- Anjali, G.; Sabumon, P.C. Unprecedented development of anammox in presence of organic carbon using seed biomass from a tannery Common Effluent Treatment Plant (CETP). Bioresour. Technol. 2014, 153, 30–38. [Google Scholar] [CrossRef] [PubMed]
- Liu, G.; Wang, J.; Lu, H.; Jin, R.; Zhou, J.; Zhang, L. Effects of reduction products of ortho-hydroxyl substituted azo dyes on biodecolorization of azo dyes. J. Hazard. Mater. 2009, 171, 222–229. [Google Scholar] [CrossRef] [PubMed]
- Ong, C.; Lee, K.; Chang, Y. Biodegradation of mono azo dye-Reactive Orange 16 by acclimatizing biomass systems under an integrated anoxic-aerobic REACT sequencing batch moving bed biofilm reactor. J. Water Process Eng. 2020, 36, 101268. [Google Scholar] [CrossRef]
- El Bouraie, M.; El Din, W.S. Biodegradation of Reactive Black 5 by Aeromonas hydrophila strain isolated from dye-contaminated textile wastewater. Sustain. Environ. Res. 2016, 26, 209–216. [Google Scholar] [CrossRef] [Green Version]
- Bajaj, M.; Gallert, C.; Winter, J. Treatment of phenolic wastewater in an anaerobic fixed bed reactor (AFBR)—Recovery after shock loading. J. Hazard. Mater. 2009, 162, 1330–1339. [Google Scholar] [CrossRef]
- Gao, W.; Leung, K.; Qin, W.; Liao, B. Effects of temperature and temperature shock on the performance and microbial community structure of a submerged anaerobic membrane bioreactor. Bioresour. Technol. 2011, 102, 8733–8740. [Google Scholar] [CrossRef]
- Mirbolooki, H.; Amirnezhad, R.; Pendashteh, A.R. Treatment of high saline textile wastewater by activated sludge microorganisms. J. Appl. Res. Technol. 2017, 15, 167–172. [Google Scholar] [CrossRef] [Green Version]
- Meng, X.; Liu, G.; Zhou, J.; Fu, Q.S. Effects of redox mediators on azo dye decolorization by Shewanella algae under saline conditions. Bioresour. Technol. 2014, 151, 63–68. [Google Scholar] [CrossRef] [PubMed]
- Guo, G.; Li, X.; Tian, F.; Liu, T.; Yang, F.; Ding, K.; Liu, C.; Chen, J.; Wang, C. Azo dye decolorization by a halotolerant consortium under microaerophilic conditions. Chemosphere 2020, 244, 125510. [Google Scholar] [CrossRef] [PubMed]
- Meng, X.; Liu, G.; Zhou, J.; Shiang Fu, Q.; Wang, G. Azo dye decolorization by Shewanella aquimarina under saline conditions. Bioresour. Technol. 2012, 114, 95–101. [Google Scholar] [CrossRef] [PubMed]
- Liu, Y.; Gao, W.; Wang, Y.; Wu, L.; Liu, X.; Yan, T.; Alm, E.; Arkin, A.; Thompson, D.K.; Fields, M.W.; et al. Transcriptome analysis of Shewanella oneidensis MR-1 in response to elevated salt conditions. J. Bacteriol. 2005, 187, 2501–2507. [Google Scholar] [CrossRef] [PubMed]
Figure 1.
Effect of dye concentration on MO decolourization after 12 h (temperature: 30 ± 2 °C; volume: 150 mL; MLSS: 1 g/L; RPM: 110 ± 2; time: 12 h).
Figure 1.
Effect of dye concentration on MO decolourization after 12 h (temperature: 30 ± 2 °C; volume: 150 mL; MLSS: 1 g/L; RPM: 110 ± 2; time: 12 h).

Figure 2.
Effect of dye concentration on MO decolourization without organic carbon after 72 h (temperature: 30 ± 2 °C; volume: 150 mL; MLSS: 1 g/L; RPM: 110 ± 2; time: 72 h).
Figure 2.
Effect of dye concentration on MO decolourization without organic carbon after 72 h (temperature: 30 ± 2 °C; volume: 150 mL; MLSS: 1 g/L; RPM: 110 ± 2; time: 72 h).

Figure 3.
Effect of biomass concentration on MO decolourization (temperature: 30 ± 2 °C; volume: 150 mL; MLSS: 0.03 to 0.21 g/L; RPM: 110 ± 2; time: 96 h).
Figure 3.
Effect of biomass concentration on MO decolourization (temperature: 30 ± 2 °C; volume: 150 mL; MLSS: 0.03 to 0.21 g/L; RPM: 110 ± 2; time: 96 h).

Figure 4.
Effect of pH on MO decolourization (temperature: 30 ± 2 °C; volume: 150 mL; MLSS: 1 g/L; RPM: 110 ± 2; time: 96 h).
Figure 4.
Effect of pH on MO decolourization (temperature: 30 ± 2 °C; volume: 150 mL; MLSS: 1 g/L; RPM: 110 ± 2; time: 96 h).

Figure 5.
Kinetics of colour, COD, and NO3−-N.

Figure 6.
Zero-order, first-order, and second-order plots of colour removal.

Figure 7.
pH profile during kinetics.

Figure 8.
Profiles of colour, COD, NO3−-N, and MLSS.

Figure 9.
UV-Vis absorbance spectra of influent and effluent.

Figure 10.
Effect of salinity on MO decolourization (temperature: 30 ± 2 °C; volume: 150 mL; MLSS: 15.26 g/L; RPM: 110 ± 2; time: 96 h).
Figure 10.
Effect of salinity on MO decolourization (temperature: 30 ± 2 °C; volume: 150 mL; MLSS: 15.26 g/L; RPM: 110 ± 2; time: 96 h).

Figure 11.
Effect of salinity on MLSS and MLVSS.


Table 1.
Operational parameters of enrichment of biomass in SBR.
| Phase | Day of Operation | No. of Cycles | MO (mg/L) | COD (mg/L) | NO3-N * (mg/L) | Cycle Time (d) |
|---|---|---|---|---|---|---|
| I | 1–90 | 1–30 | 500 | 3550 ± 280 | 73 ± 2 | 3 |
| II | 91–120 | 31–45 | 500 | 3550 ± 280 | 73 ± 2 | 2 |
* COD/NO3−-N ratio was kept around 48 (optimized value) by Swathi et al. [18].
Publisher’s Note: MDPI stays neutral with regard to jurisdictional claims in published maps and institutional affiliations. |
© 2022 by the authors. Licensee MDPI, Basel, Switzerland. This article is an open access article distributed under the terms and conditions of the Creative Commons Attribution (CC BY) license (https://creativecommons.org/licenses/by/4.0/).
Share and Cite
MDPI and ACS Style
Trivedi, A.; Desireddy, S.; Chacko, S.P. Effect of pH, Salinity, Dye, and Biomass Concentration on Decolourization of Azo Dye Methyl Orange in Denitrifying Conditions. Water 2022, 14, 3747. https://doi.org/10.3390/w14223747
AMA Style
Trivedi A, Desireddy S, Chacko SP. Effect of pH, Salinity, Dye, and Biomass Concentration on Decolourization of Azo Dye Methyl Orange in Denitrifying Conditions. Water. 2022; 14(22):3747. https://doi.org/10.3390/w14223747
Chicago/Turabian StyleTrivedi, Aditi, Swathi Desireddy, and Sabumon Pothanamkandathil Chacko. 2022. "Effect of pH, Salinity, Dye, and Biomass Concentration on Decolourization of Azo Dye Methyl Orange in Denitrifying Conditions" Water 14, no. 22: 3747. https://doi.org/10.3390/w14223747
Note that from the first issue of 2016, this journal uses article numbers instead of page numbers. See further details here.