Article

Fertilizer 15N Fates of the Coastal Saline Soil-Wheat Systems with Different Salinization Degrees in the Yellow River Delta

1
National Engineering Research Center for Efficient Utilization of Soil and Fertilizer, College of Resources and Environment, Shandong Agricultural University, Tai’an 271018, China
2
Engineering Technology Research Center of Shandong Province for Efficient Utilization of Humic Acid, Shandong Nongda Fertilizer Science and Technology Co., Ltd., Feicheng 271600, China
3
Shandong Ludong Road and Bridge Co., Ltd., Dongying 257000, China
*
Authors to whom correspondence should be addressed.
Water 2022, 14(22), 3748; https://doi.org/10.3390/w14223748
Submission received: 26 October 2022 / Revised: 11 November 2022 / Accepted: 16 November 2022 / Published: 18 November 2022
(This article belongs to the Special Issue Monitoring, Reclamation and Management of Salt-Affected Lands)

Abstract

:
In order to clarify the fates of fertilizer N in coastal saline soil-wheat systems with different salinization degrees, this study was conducted to determine the 15N uptake rates in various parts of wheat plant at maturity stage and the residual 15N in three different saline soils and the 15N loss of soil-wheat systems by using the 15N-labeled urea N tracing method in the Yellow River Delta. The results showed that: (1) The increase of soil salinity from 0.2% to 1% promoted the wheat plant to absorb N from soil and not from fertilizer and significantly inhibited the dry matter mass accumulation and 15N uptakes of each wheat parts and whole plant, but especially increased the total N concentration of wheat roots, stems, leaves, and grains. The aggravation of soil salinity significantly enhanced the distribution ratios of 15N uptakes and Ndffs in the wheat roots, stems, and leaves to depress the salt stress. (2) The 15N residues were mainly concentrated in the 0~20 cm saline soil layer and decreased as the soil profile deepened from 0 to 100 cm; the 15N residues decreased in the 0~40 cm soil profile layer and accumulated in the 40~100 cm with the increase of soil salinization degrees significantly. (3) The fates of 15N applied to the coastal saline soil-wheat system were wheat uptakes 1.53~13.96%, soil residues 10.05~48.69%, losses 37.35~88.42%, with the lowest 15N uptake and utilization in the three saline soils, the highest residual rate in lightly saline soils, and the highest loss in moderately and heavily saline soils. The increase of soil salinity inhibits wheat uptakes and soil residues and intensifies the losses from fertilizer 15N. Therefore, the fate of fertilizer N losses significantly increased as the degree of soil salinity increased. The conventional N management that was extremely inefficient for more N loss should be optimized to enhance the N efficiency and wheat yield of the coastal saline soil-wheat system in the Yellow River Delta.

1. Introduction

Soil salinization is a widespread problem on more than 25% of the global soil area, and more than 36 million hectares of land in China are affected by salinization, representing about 4.9% of all available land [1,2,3,4,5,6,7]. The Yellow River Delta, located in the warm temperate subhumid continental monsoon climate zone, has experienced serious soil salinization from the coastline to the interior over the past 20 years due to seawater intrusion [8,9,10,11,12]. The coastal saline soils in the Yellow River Delta are an important back-up land resource for food production in China [13]. However, shallower saline groundwater, high soil pH and salinity, poor soil nutrients and structure, low water retention capacity, and other problems of the coastal saline soils reduce crop growth and yields [14,15,16,17], ultimately constraining sustainable development of agriculture and food security of the Yellow River Delta.
Nitrogen is a basic nutrient required for plant growth and development, and it is one of the especially deficient nutrients in the coastal saline soil of the Yellow River Delta [18]. Nitrogen fertilizers have been widely applied to increase crop yields in the coastal saline soil to address the pressure on the increasing food security due to the population boom in this century [19]. Urea is commonly used as a source of nitrogen fertilizer for its high nitrogen content and stability [20,21]. The conventional amount of urea application in Chinese crop production is 2–3 times higher than that of the world averagely [22]. However, less than 30% of urea nitrogen is absorbed by crops in China, while more than 70% leaches into the soil profile and groundwater with rainfall and irrigation, or runoffs into surface water resulting in eutrophication of water bodies [23,24].
Wheat is one of the major food crops grown in the costal saline soil of the Yellow River Delta and its growth is affected by both N deficiency and salt stress [25]. Currently, many studies have focused on increasing the application amount of the nitrogen fertilizer to close yield gaps in the saline soil, but the effect may be limited by the soil saline environment. Meanwhile, nitrogen deficiency of coastal saline soil increases the severity of salt stress [26,27,28]. So, nitrogen fertilizer management is an important and urgent task of agricultural production in coastal saline soil.
Stable 15N isotope labeling is a well-established technique for tracking and quantifying N transformations mostly applied in various ecosystems and in non-saline soil environment [29,30,31,32]. This technique is also used in some studies of saline soil, but mainly applied to specific saline soil [33], and less used in different saline soils, especially in soil-wheat systems with different degrees of salinization, which has less been reported.
Compared to most of previous studies, which are still confined to indoor pot conditions, this technique with 15N-labeled urea in field is more reflective of the actual fate of urea N in coastal saline soil-wheat systems with different salinization degrees [34]. Therefore, the objectives of this research are to quantify the N uptake by wheat plants at maturity, the N residual distribution and the N loss in the coastal saline soil-wheat system with different degrees of salinity by 15N-labeled urea tracing method, and to provide a theoretical basis for improving nitrogen management in the wheat planting process which may contribute to the sustainable agriculture development of the Yellow River Delta.

2. Materials and Methods

2.1. Experimental Site and Soil Properties

The experimental site is located in Bohai farm, Dongying City, Shandong Province (37°47′ N, 118°36′ E), which is in the hinterland of the Yellow River Delta. The topography of the area is flat, and the degree of soil salinization is unevenly distributed. The soil types are mainly coastal chloride saline fluvo-aquic soils with loamy and clay loamy textures. The burial depth of groundwater is 0.8~1.2 m with salinity 12.69~20.08 g L−1, which is highly mineralized and not suitable for irrigation. The region has a warm temperate semi-arid continental monsoon climate with an average annual temperature of 13.3 °C, an average annual frost-free period of 206 days, an average annual precipitation of 537 mm and an average annual evaporation of 1885 mm. There is light-saline and medium-salinity land, heavy-saline land, and salty wasteland in this area, accounting for 66%, 18%, and 16% respectively, wheat-corn rotation and cotton are cultivated in saline land except for salty wasteland. The natural vegetation is dominated by halophytes, such as suaeda salsa (Suaeda salsa L.), reeds (Phragmites australis L.), and tamarisk (Tamarix chinensis L.).
The three different salinization experimental coastal saline soils were the light (LS), medium (MS), and heavy (HS) salinity with the classification of the soil water-soluble salt contents: 0.2%–0.4%, 0.4%–0.6%, and 0.6%–1.0%, respectively (China Soil Census Office, 1992), and the basic physicochemical properties are shown in Table 1.

2.2. Experimental Design

The field experiment of wheat (Triticum aestivum L., Jimai 23) was conducted from October 2017 to June 2018 with a field micro-zonal randomized block trial design. The treatments consisted of three fields with different salinization degrees: LS (light-salinity soil), MS (medium-salinity soil), and HS (heavy-salinity soil) and each treatment was repeated three times. The field micro-zones with 1 m2 square area were delimited in the middle area of each field and were separated by 1.5 m distance. The plastic cloth was buried into a ditch dug 0.2 m wide and 0.6 m deep to form a ridge 0.2 m wide and 0.05 m high above the soil surface and surrounding every micro-zone, which prevented the 15N-labeled urea run offing from each micro-zone.
The conventionally chemical fertilizers were applied with 225 kg N hm−2 (urea, N ≥ 46.4%)-150 kg P2O5 hm−2 (superphosphate, P2O5 ≥ 18%)-75 kg K2O hm−2 (potassium sulfate, K2O ≥ 50%) in the experimental fields. All the superphosphate, potassium sulfate and 1/2 amount of urea were basely applied and mixed with topsoil before wheat sown, another 1/2 amount of urea was top-dressed at the jointing stage of wheat. The amount and method of the chemical fertilizers applied in each micro-zone were as the same as the outside fields except for the 15N labeled urea (N ≥ 46.4%, 2.0% 15N abundance, produced by Shanghai Research Institute of Chemical Industry, Shanghai, China) which was applied plot by plot before the application of outside field. All the other management measures were consistent with the local farmer practices.

2.3. Sampling, Measurement Methods and Assessment of Nitrogen Accumulation

Plant and soil samples were collected during wheat harvest stage in June 2018. All wheat plant samples in the micro-zone were harvested, and the roots, stems, leaves, sheaths, and grains were separated and dried at 60 °C to determine the dry matter masses. Soil samples were collected in 5 layers: 0~20 cm, 20~40 cm, 40~60 cm, 60~80 cm, 80~100 cm.
Soil total salt content was measured with the drying residue method (water-soil ratio 5:1), and soil total N content was determined with the semi-micro Kjeldahl method. Plant total N concentration was determined by H2SO4-H2O2 digestion and the Kjeldahl method. Soil and plant 15N abundance was determined using a mass spectrometer (Isoprime, Manchester, UK).
The percentage of plant nitrogen derived from fertilizer nitrogen (Ndff, %) was calculated as
Ndff = (NP − NA) / (Nf − NA) × 100
where NP represents the 15N abundance (%) in plant samples, NA represents the natural abundance of 15N (NA = 0.365%), and Nf represents the 15N abundance (%) in fertilizer.
The percentage of plant nitrogen derived from soil nitrogen (Ndfs, %) was calculated as
Ndfs = 1 − Ndff
The plant 15N uptake (FN, g m−2) was calculated as
FN = Ndff × DM × NC
where DM is plant dry matter mass (g m−2) and NC is plant total nitrogen concentration (%).
The 15N fertilizer utilization efficiency (15NUE, %) in the current season was calculated as the wheat 15N uptake, dividing the amount of N applied, which is the 15N uptake rate:
15NUE = FN / 15Nap × 100
where 15Nap is the amount of 15N applied per square of wheat (g m−2).
Soil 15N residue (RN, g m−2) was calculated as
RN = DMS × NCS × (15NS − NA) × 100
where DMS is dry weight of soil sample (g), NCS is total soil nitrogen content (%), and 15NS is soil 15N abundance (%).
Soil 15N residual rate (RNr, %) was calculated as
RNr = RN / 15NAP × 100
15N loss (LN, g m−2) was calculated as
LN = 15NAP − FN − RN
15N loss rate (LNr, %) was calculated as
LNr = 100% − NUE − RNr

2.4. Statistical Analysis

The data of wheat plant and soil properties from the experimental field were analyzed by one-way analysis of variance (ANOVA) using SPSS 19.0 software (IBM Corporation, Armonk, NY, USA), and multiple comparisons of means were performed using Duncan’s test (p < 0.05). Data calculation and graphing were respectively implemented with Excel 2016 software (Microsoft Corporation, Redmond, WA, USA) and Origin 2019 software (Origin Lab Corporation, Northampton, MA, USA).

3. Results

3.1. Dry Matter Mass of Each Wheat Parts

With the aggravation of soil salinization, the dry matter masses of the same wheat parts and whole plant of different salinization soil treatments showed a downward trend (Table 2). There were significant differences of the dry matter masses of the wheat root and stem between MS and LS treatments, HS and LS treatments with no significant differences of these between MS and HS treatments. However, there were significant differences of the dry matter masses of the wheat leaf, sheath, grain, and whole plant among the three treatments.
Compared with LS treatment, HS treatment and MS treatment significantly reduced the dry matter masses of the wheat root, stem, leaf, sheath, grain, and whole plant by 92.28%, 94.47%, 93.32%, 92.56%, 93.36%, and 93.41%; and by 84.97%, 84.99%, 83.77%, 71.79%, 62.92%, and 73.75%, respectively (p < 0.05). The dry matter masses of the wheat leaves, sheaths, grains, and whole plants in HS treatment significantly decreased than those of corresponding parts of wheat plants in MS treatment by 58.83%, 73.61%, 82.09%, and 74.89%, respectively (p < 0.05).
The order from high to low of each wheat part dry matter mass in the same saline soil treatment with the same salinization degree were basically in accordance with the order of grain, sheath, stem, leaf, and root, and the dry matter mass of the wheat grain was higher than those of the other parts with 77.41~2328.79%. So, the dry matter masses of wheat plants in saline soils were mainly concentrated in wheat grains than the other wheat parts, and the increase of soil salinization would inhibit the accumulation of the dry matter masses in various wheat parts and the whole plants.

3.2. Total N Concentration, 15N Uptake, Distribution Ratio of 15N Uptake, Ndff and Ndfs in Wheat Parts

With the increase of soil salinization, the total N concentrations in all wheat parts and the whole wheat plant showed an upward trend (Table 3).
The total N concentration of the wheat roots, stems and leaves were significantly different among the three treatments (p < 0.05). Compared with those of LS treatment, the total N concentrations of the wheat roots, stems, leaves, sheaths, grains, and the whole wheat plant in HS and MS treatments significantly increased by 33.22~98.73% and 25.47~59.12%, respectively (p < 0.05). The total N concentrations of the wheat roots, stems, and leaves in HS treatment were higher than those of the corresponding wheat parts in MS treatment with 11.55%, 56.51% and 4.10% (p < 0.05). In the three saline soil treatments, the total N concentrations order of each wheat parts in the same soil treatment were obtained according with grain, sheath, leaf, root and stem. Therefore, compared with the other wheat parts, the total N concentrations in wheat grains were significantly highest. The increase of soil salinization increased the total N concentrations in all wheat parts, especially in the wheat root, stem, and leaf in the highest salinization soil to resist salt stress.
The 15N uptake per unit area of the same wheat parts or the amounts of fertilizer nitrogen absorbed by the same wheat parts were different in different salinization soil treatments (Table 3). Compared with the 15N uptakes per unit area of each wheat parts in LS treatment, the 15N uptakes per unit area of the wheat roots, stems, leaves, sheaths, grains, and the whole plants in MS and HS treatment significantly decreased by 80.32% and 84.94%, 75.30% and 83.59%, 74.19% and 88.16%, 52.80% and 86.63%, 51.93% and 89.98%, and 55.82% and 89.03% (p < 0.05). In the three saline soil treatments, the 15N uptake order of each wheat parts in the same soil treatment were all obtained according with grain, sheath, leaf, stem, and root. The 15N uptake of wheat grains was higher than that of other wheat parts by 3.72~111.00 times (p < 0.05). So, compared with the other wheat parts, the 15N uptake of wheat grains were all significantly highest in the three saline soil treatments. With the aggravation of soil salinization, the amount of fertilizer nitrogen absorbed by each wheat part and the whole plant decreased significantly.
The distribution ratios of 15N uptakes (the ratio of 15N uptakes in each part of wheat to 15N uptakes in whole wheat plant) in various wheat parts were different in different salinization soil treatments (Table 3). Although the distribution ratio of 15N uptakes of the wheat leaf in LS treatment was significantly higher than that in MS treatment by 72.22%, those of the wheat roots, stems, sheaths, and grains in LS treatment were not significantly different between MS treatment and HS treatment (p < 0.05). The distribution ratios of 15N uptakes in the wheat root, stem and leaf in HS treatment were significantly higher than those of the corresponding wheat part in MS treatment by 207.91%, 160.68% and 82.37% except for that of the wheat sheath between HS and MS. Meanwhile, that of wheat grain in HS treatment was significantly lower than that in MS treatment by 15.54% (p < 0.05). The order from high to low of the 15N uptakes distribution ratios of various wheat parts in the same saline soil treatment was accordance with the grain, sheath, leaf, stem, and root. Hence, when the degree of soil salinization increased to HS level, the 15N uptakes distribution ratio of the wheat root, stem, and leaf increased significantly. Meanwhile, there was no effect on the wheat sheath, but that in the wheat grain decreased significantly. The changes of soil salinization degree had no significant effects on the high and low order of the 15N uptakes distribution ratio in each part of wheat plant.
The Ndffs of the same wheat parts in different saline soil treatments were different (Table 3). The wheat root Ndff of HS treatment was significantly higher than that of LS treatment, but the wheat root Ndff of MS treatment was not significantly different from those of LS treatment and HS treatment (p < 0.05). The Ndffs of wheat stem and leaf in HS treatment were significantly higher than those in MS and LS treatments, and the Ndffs of wheat stem of MS treatment was significantly higher than that of LS treatment except for the wheat leaf Ndff (p < 0.05). There were no significant differences of the Ndffs in wheat sheath and whole plant among LS, MS, and HS treatments and of the wheat grain Ndff between HS and MS, but the wheat grain Ndffs of HS and MS treatments was significantly higher than that of LS treatment (p < 0.05).
Compared with those of the corresponding wheat parts in LS treatment, the Ndffs of the wheat root, stem, leaf, and grain in HS treatment were significantly increased by 46.70%, 34.21%, 21.48%, and 22.46%, respectively (p < 0.05). Meanwhile, the trends of the Ndfs in various wheat parts of different saline soil treatments were opposite to those of Ndff. Above all, the Ndffs of each wheat parts in different saline soil treatments showed an upward trend with the increase of soil salinization degrees, except for the wheat sheath and the whole plant, indicating that the increase of soil salinization degree improved the more N absorption of wheat roots, stems, leaves, and grains from fertilizer source and not from soil source to depress salt stress.

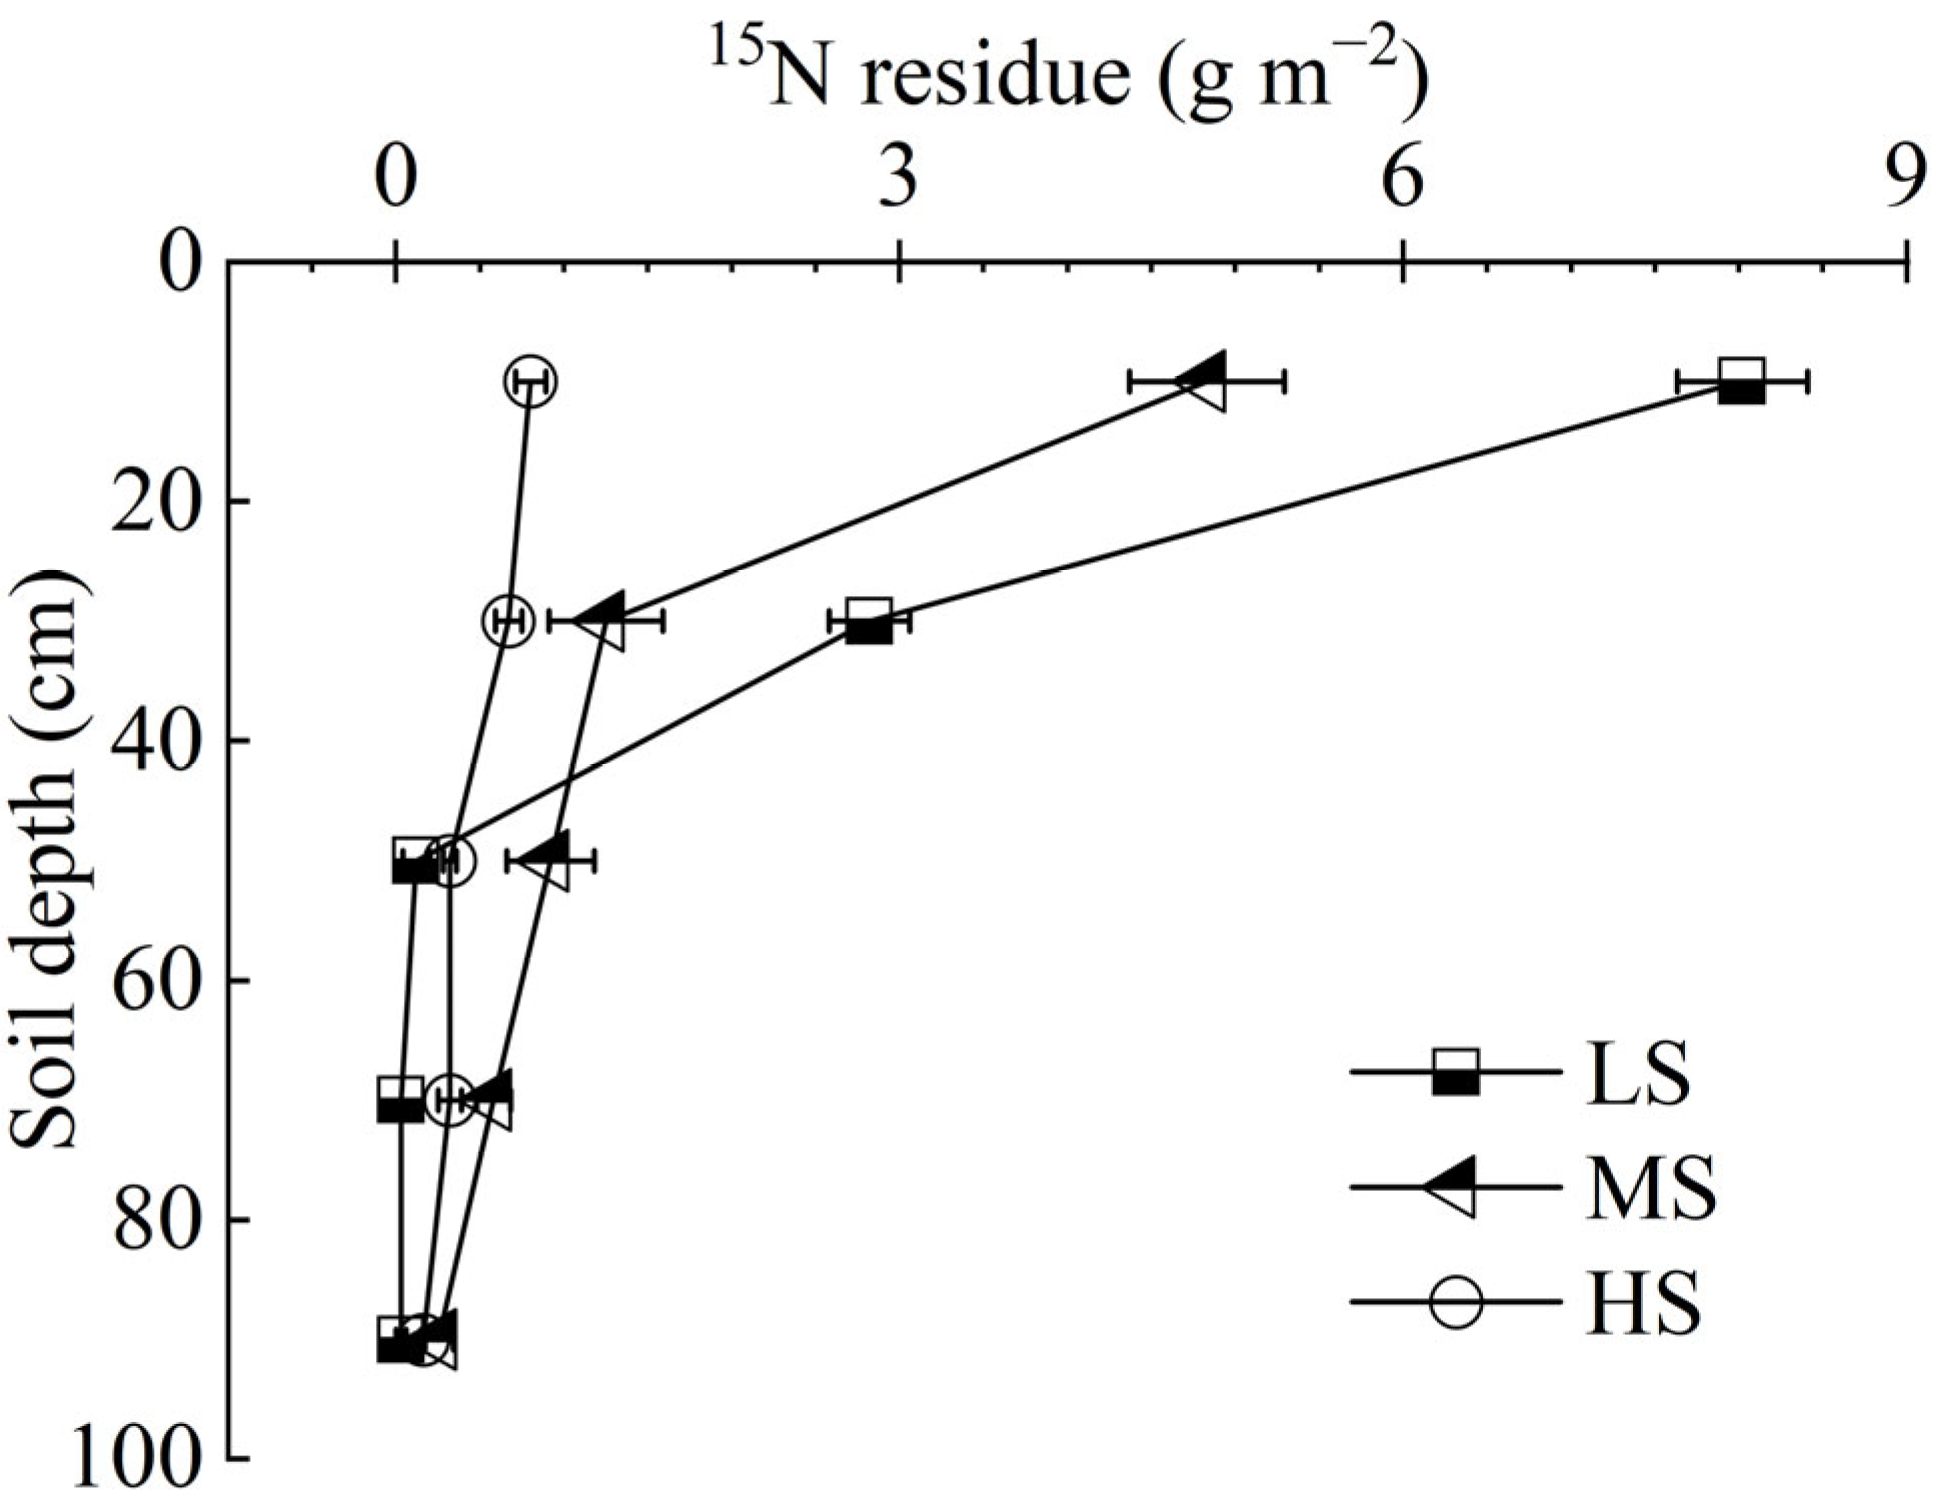
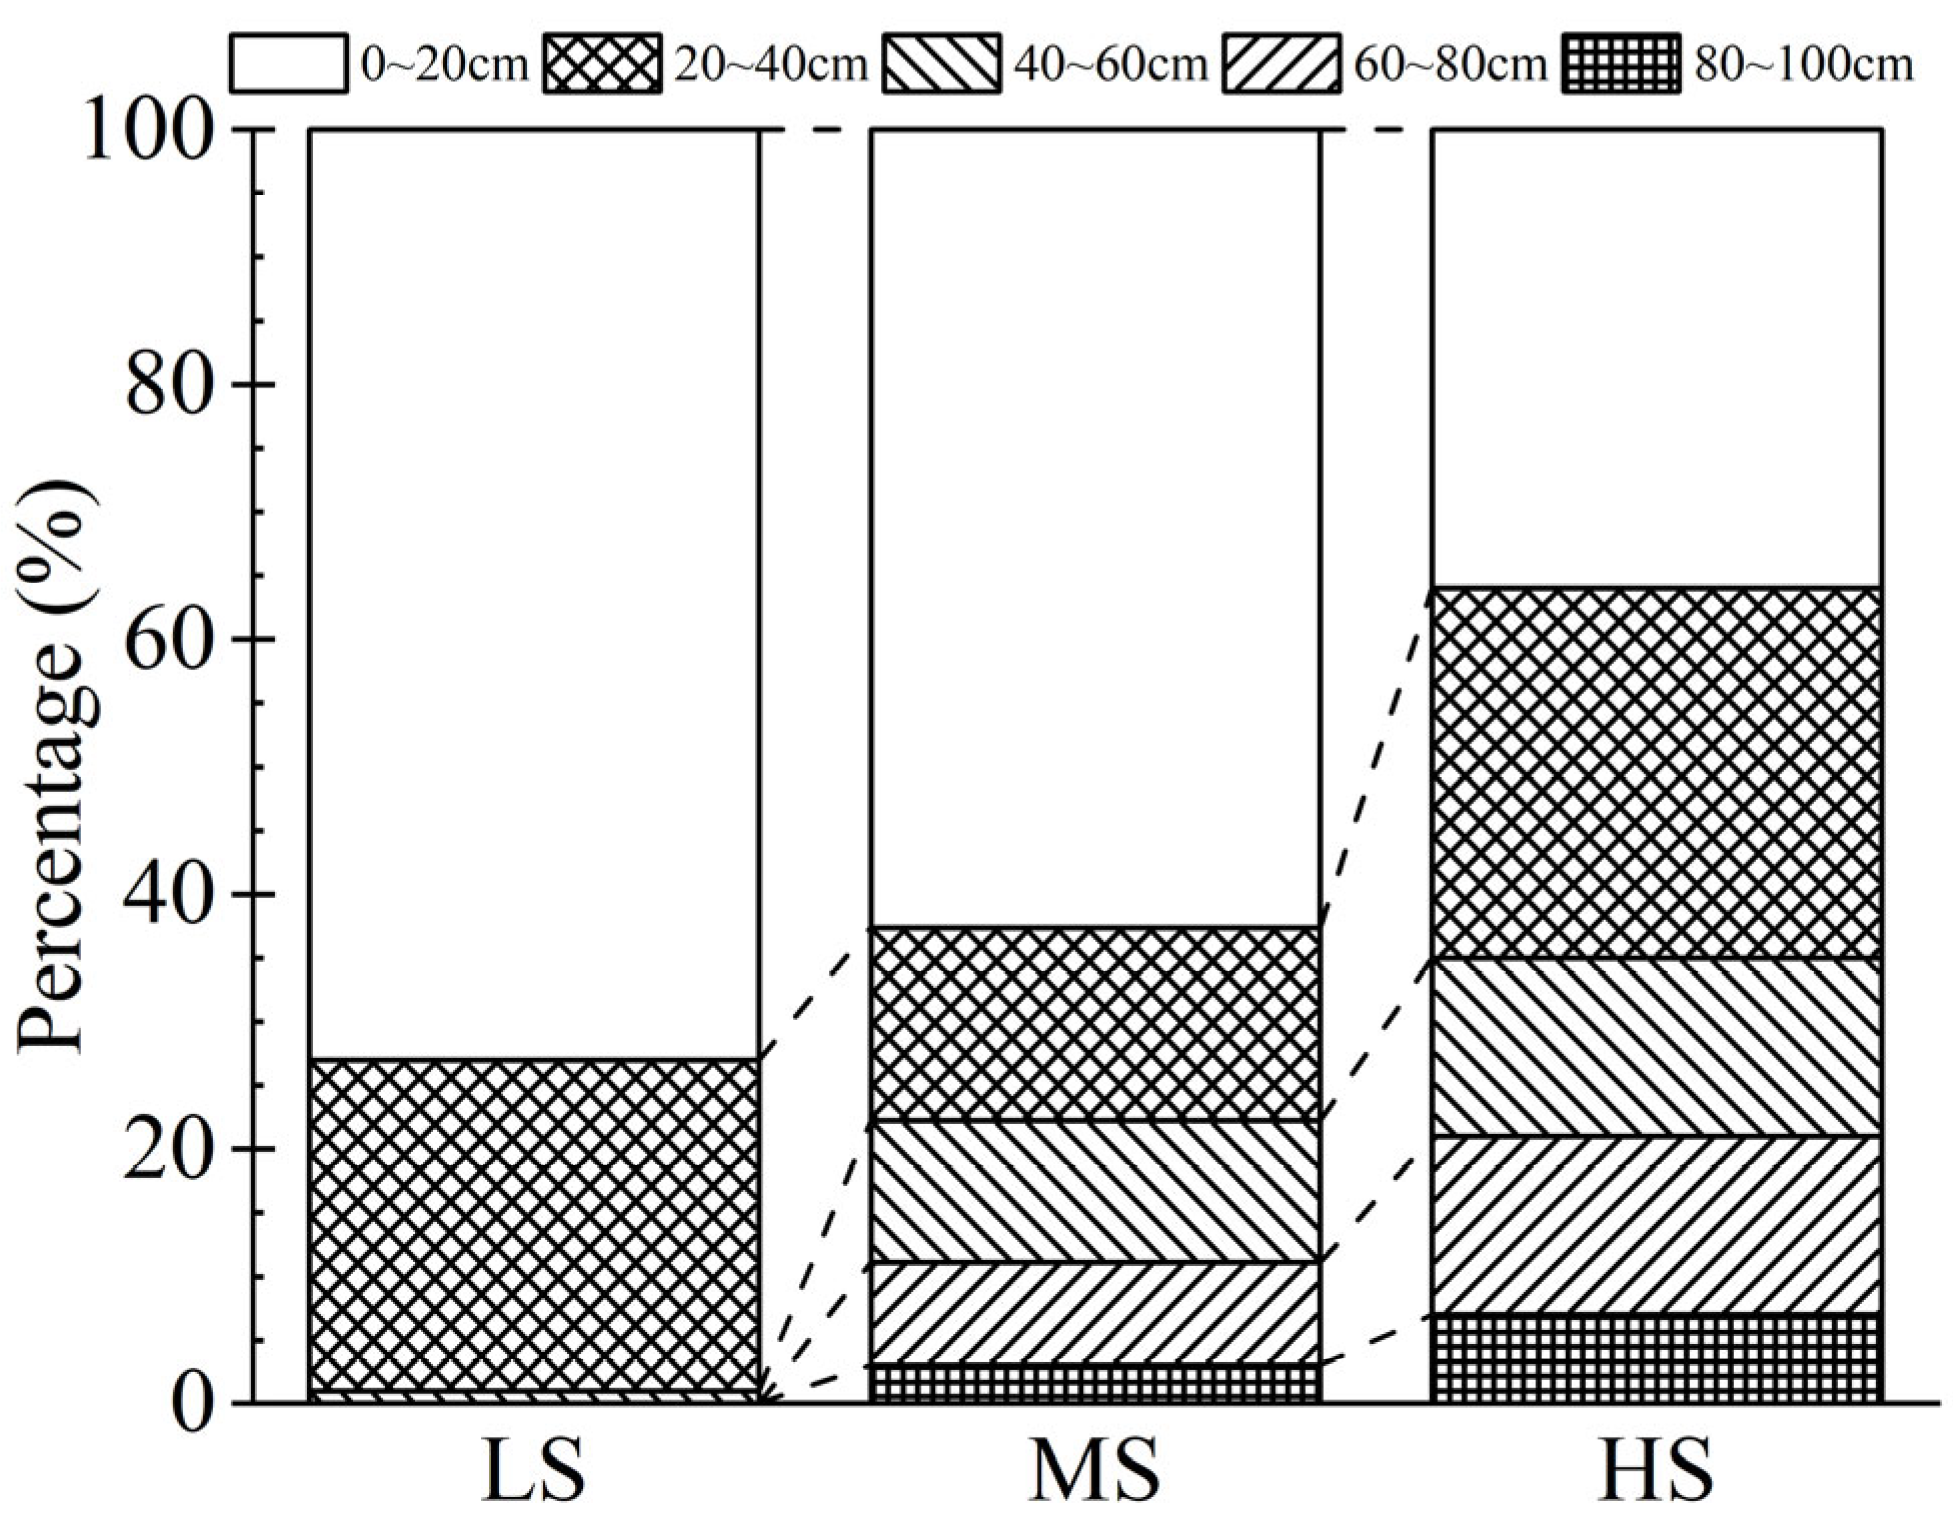
3.3. 15N Residues and Distribution in Each 20 cm Soil Layer in 0~100 cm Soil Profile

The soil 15N residues in three different saline treatments decreased significantly with the increase of soil profile depth (Figure 1).
The 15N residues in the 0~20 cm soil layer were higher than those in 20~100 cm soil profile by 0.20~317.08 times (p < 0.05). Compared with the upper layer (0~20 cm, 20~40 cm, 40~60 cm and 60~80 cm), the 15N residues of the lower layer (20~40 cm, 40~60 cm, 60~80 cm and 80~100 cm) in the same treatment decreased by 16.68~74.16%, 26.43~95.91%, 0.92~74.81%, 13.19~56.73%, respectively (p < 0.05). The 15N residues of the 0~20 cm soil layer were significantly different among LS, MS and HS treatments which decreased significantly with the increase of soil salinization.
The 15N residues of 0~20 cm soil layer in MS and HS treatments were significantly lower than those in LS treatment by 39.73% and 90.01%, and the 15N residues of 0~20 cm soil layer in HS treatment were significantly lower than those in MS treatment by 83.42% (p < 0.05). The 15N residues of 20~40 cm soil layer had no significant difference between MS and HS treatments, but both treatments were significantly lower than LS treatment by 55.70% and 76.32% (p < 0.05). There was no significant difference in 15N residues of 40~60 cm soil layers between LS and HS treatments, and both treatments were significantly lower than those of MS treatment respectively by 87.45% and 65.03% (p < 0.05). The 15N residues of 60~80 cm soil layer in MS treatment were higher than those of LS and HS treatments with 1896.16% and 82.07%, and those in HS treatment were higher than those in LS treatment by 996.39% (p < 0.05). The 15N residues of the 80~100 cm soil layer in MS treatment were higher than those in LS treatment by 895.05% except for between both treatments and HS treatment (p < 0.05).
Compared with other corresponding treatments at different soil profile depths, the significantly highest 15N residues in 0~20 cm and 20~40 cm soil layers and in 40~60 cm and 60~80 cm soil layers were LS treatment and MS treatment respectively, but the 15N residues in 80~100 cm soil layers were not significantly different between HS and LS, and between HS and MS. The above showed that the 15N residues of different salinization degrees soil treatments mainly remained in 0~20 cm and 20~40 cm, which in other soil layers was significantly reduced. The soil salinization mainly affected the 15N residues in 0~20 cm and 20~40 cm. With the increase of soil salinization, the 15N residues in different soil layers also increased significantly with the increase of soil profile depth.
The 15N residue distribution ratios of 0~20 cm soil layer in three soil treatments with different salinization degrees were significantly higher than those of other soil layers and decreased with the increase of soil profile depth (Figure 2).
With the increase of soil salinization, the 15N residue distribution ratios in the upper soil layers of 0~100 cm soil profile decreased while those in the lower soil layers increased. However, the 15N residue distribution ratios in the 0~100 cm soil profile were mainly concentrated in the 0~20 cm soil layer of LS treatment with 72.82%, in the 0~40 cm soil layer of MS treatment with 77.69%, and in the 0~60 cm soil layer of HS treatment with 78.91%, respectively.
The 15N residue distribution ratio of 0~20 cm soil layer in LS treatment was significantly higher than those in MS and HS treatments respectively by 16.97% and 104.74%, and which in MS treatment was significantly higher than that of HS treatment by 75.04% (p < 0.05). The 15N residue distribution ratio of 20~40 cm soil layer in LS treatment was not significantly different from that in HS treatment, but those of both treatments were significantly higher than that in MS treatment respectively by 66.16% and 89.61% (p < 0.05). The 15N residue distribution ratios of the 40~60 cm soil layer in LS treatment were significantly lower than those in MS and HS treatment respectively by 90.63% and 92.46%, except for that between MS and HS treatment (p < 0.05). The 15N residue distribution ratios of 60~80 cm and 80~100 cm soil layers in LS treatment were significantly lower than those in MS and HS treatments respectively by 96.62% and 98.10%, 93.42% and 97.08%, and those in MS treatment were significantly lower than those in HS treatment respectively by 43.75%, 55.62% (p < 0.05). With the aggravation of soil salinization, the 15N residue distribution ratios of different soil layers in 0~100 cm soil profile increased significantly with the increase of soil profile depth.
The above showed that fertilizer N in saline soil mainly remained in the upper soil layers, such as the topsoil and subsurface layers. However, with the aggravation of soil salinization, the ratio of fertilizer N moving to the deeper soil layer in the 0~100 cm soil profile increased significantly, while the upper soil layer decreased correspondingly.

3.4. 15N Fate in Coastal Saline Soil-Wheat System

After wheat harvest in the field micro-zone, the fates of wheat uptake, soil residue, and system loss of fertilizer nitrogen (15N) applied to different saline soil-wheat systems were significantly different (Table 4).
The soil 15N residues and residual rates were significantly higher than the wheat 15N uptakes and uptake rates by 248.89%, the system 15N losses and loss rates by 30.38% in LS treatment (p < 0.05). The system 15N losses and loss rates in MS and HS treatments were significantly higher than the soil 15N residues and residual rates of them respectively by 70.84% and 779.78%, and these in MS and HS treatments were significantly higher than wheat 15N uptakes and uptake rates respectively by 8.60 and 56.73 times, 4.62 and 5.56 times (p < 0.05). Therefore, the wheat 15N uptakes and uptake rates in the different saline soil-wheat systems were all significantly lower than the soil 15N residues and residual rates and the system15N losses and loss rates. The soil 15N residues and residual rates in lightly salinity soil were significantly higher than the system 15N losses and loss rates. However, the trend was contrary in medium-salinity and heavy-salinity soils. The aggravation of soil salinization promoted the 15N loss fate from the saline soil-wheat system.
The wheat 15N uptakes or uptake rates, the soil 15N residues or residual rates in HS treatment were significantly lower than those in LS and MS treatment respectively by 89.03% and 75.16%, 79.36% and 70.99%; and those in MS treatment were significantly lower than those in LS treatment respectively by 55.82%, 28.85% (p < 0.05). The system 15N losses or loss rates in HS treatment were significantly higher than those in LS and MS treatment by 136.74% and 49.39%, and this in MS treatments were significantly higher than those in LS treatment by 58.48% (p < 0.05). The above showed that with the increase of soil salinization, the system 15N losses and loss rates increased significantly, while the wheat 15N uptakes and uptake rates, the soil 15N residues, and residual rates decreased significantly. With higher degree of soil salinization, the fates of wheat 15N uptake and soil 15N residue were reduced, and the fate of 15N loss was significantly promoted.

4. Discussion

The uptake and utilization of nitrogen was an important factor affecting wheats dry matter mass forming through photosynthesis [35]. Our results showed that the order of total N concentration in each part of wheat plant at maturity stage under different salinization degrees soil treatments from high to low was grains, sheaths, leaves, roots, and stems, which was consistent with the result in non-saline soil studied by Wang et al. [36,37,38]. Our research further found that the total N concentration of wheat roots was between that of leaves and stems, and the order of dry matter masses of wheat plants from high to low was basically as the same as that of total N concentration of wheat plants. Akhtar et al. and Bassil et al. found that the uptake of potassium by crops promoted the N uptake by crops through the joint application of nitrogen and potassium fertilizers [39,40]. Because saline soil has a greater ability to supply potassium, which is rich in available potassium, the total N concentration of each wheat part and the whole plant in our research increased significantly with the aggravation of soil salinization degree.
Our results showed that the dry matter mass accumulation of all wheat parts and the whole plant was inhibited with the fertilizer 15N uptakes decreased. Soil salinity has adverse effects on crops through two processes: osmotic stress and ion toxicity. Osmotic stress delayed seeds germination, reduced seedling emergence rate and inhibited seedling growth. The high concentration of sodium ions in saline soil rhizosphere resulted in ion imbalance. Sodium and Chloride ions respectively competed with NH4+ and NO3 for crop uptake, inhibited leaves development and photosynthesis, affected the dry matter mass accumulation of crops, and reduced the number and weight of grains [41,42,43,44,45]. When the nitrogen supply of each plant part was limited due to insufficient nitrogen uptake of crops, the dry matter mass of grains might be reduced [46]. Wang et al. found that salt stress inhibited the transport of nitrogen nutrients from vegetative organs (roots and stems) to reproductive organs (grains and sheaths) of crops at maturity, resulting in a decrease of crop grain yield in saline soil [25], which was consistent with the results of our research that the fertilizer 15N uptakes and its distribution ratios of wheat roots, stems and leaves increased and those of grains decreased in saline soil with aggravation of soil salinization.
Our results showed that the Ndff of wheat grains was 47.1~57.6%, so about half of the N uptake came from fertilizer 15N. The Ndff of other wheat parts was 25.5~46.1%, and the wheat 15N uptake mainly came from soil nitrogen. Davis et al. found that the ratio of fertilizer nitrogen absorbed by crops in the current season was only about 20% in the field crop nitrogen balance experiment [47], and the results of crops preferring to absorb soil nitrogen rather than fertilizer nitrogen were consistent with that of wheat parts except grains in our study. Our study also found that with the aggravation of soil salinization, the ratio of total nitrogen from fertilizer nitrogen in each wheat part increased, while the ratio from soil nitrogen in each wheat part decreased.
Previous studies on the fertilizer nitrogen residue distribution in soil profile showed that the residual rate in different soil layers was inversely proportional to the depth of the soil layer, and the residue of fertilizer nitrogen was mainly concentrated in 0~20 cm soil layer [22], which was consistent with our results. Our study also found that the aggravation of salinization significantly reduced the residues of fertilizer nitrogen in 0~100 cm soil profile and promoted the migration of fertilizer nitrogen to deeper soil layer, which might be one of the reasons for the reduction of fertilizer nitrogen residue in the heavy-salinity soil. Miller et al. had found that the nitrogen accumulation in the soil layer below 20 cm was related to the soil texture [48]. The higher the soil salinity was, the heavier the soil texture was, and the more soil cracks easily resulted in fertilizer nitrogen leaching into the deep soil layer with water [26], which illustrated the results of our study that the fertilizer nitrogen increased significantly with the increase of soil profile depth with the aggravation of soil salinization.
Fertilizer nitrogen applied to saline soil has three main destinations: plant uptake, soil residue, and nitrogen loss in various ways, such as ammonia volatilization, nitrification denitrification, surface runoff, and leaching. Through the study on the fates of fertilizer nitrogen in the saline soil-wheat system, our results found that the current season wheat plants uptake rate of fertilizer nitrogen was only 1.53~13.96% of saline soil in the Yellow River Delta, which was far lower than the average utilization rate of wheat nitrogen in China of 28.2% and the global utilization rate of wheat nitrogen of 30~50% [49]. Our research also found that the utilization of fertilizer nitrogen in the current wheat season was far lower than soil residue and system loss of fertilizer nitrogen, and the aggravation of soil salinization reduced the uptake and residue of fertilizer nitrogen and increase its loss. The above results were because denitrification of nitrogen, volatilization of ammonia, and intensified leaching and migration were the main reasons for less residue and higher loss of fertilizer nitrogen in saline soil [50], and N2O emission and ammonia volatilization were significantly increased after nitrogen application in saline soils with the aggravation of soil salinity [51].
Therefore, the characteristic of the conventional nitrogen fertilizer application method in the coastal saline soil of the Yellow River Delta was higher nitrogen loss and lower crop uptake and soil residue, which resulted in insufficient nitrogen nutrition for regional crop growth and high yield. Hence, it is recommended to scientifically improve the nitrogen fertilizer application method and strengthen nitrogen management in the coastal saline soil area, so as to reduce fertilizer nitrogen loss, increase crop uptake and soil residue, improve soil nitrogen fertility and crop yield, and achieve high efficiency, high yield, and sustainable development in the coastal saline soil region. Whereas the grades of different soil salinization degrees in our study were relatively less, the fates of fertilizer nitrogen of more soil salinization grades should be deeply studied in order to establish the optimal mode of the utilization and management of fertilizer nitrogen in the coastal saline soil-wheat system in the Yellow River Delta.

5. Conclusions

Under the coastal saline soil conditions in the Yellow River Delta, the aggravation of soil salinity from 0.2% to 1% significantly inhibited the dry matter masses accumulation and the 15N uptakes of various wheat parts and whole plant but promoted the total N concentrations of various wheat parts, especially in wheat roots, stems, and leaves parts absorbed from soil. The dry matter masses and total N concentrations of wheat grains in saline soil were significantly higher than those in other wheat parts. The aggravation of soil salinity significantly increased the 15N distribution ratios of wheat roots, stems, and leaves, but decreased that of wheat grains, and significantly increased the Ndffs of wheat roots, stems, leaves, and grains, but had no significant effects on the order from high to low of 15N distribution ratios in various wheat parts. The fates of 15N applied in the coastal saline soil-wheat system were wheat uptake 1.53~13.96%, soil residue 10.05~48.69%, and 15N loss 37.35~88.42%. Compared the lighter salinity soil, the heavier salinity soil reduced the 15N fate of wheat uptakes and soil residues by 89.03% and 79.36%, but significantly increased the 15N fate of losses by 136.74% in the coastal saline soil-wheat system. Therefore, the conventional nitrogen management of the coastal saline soil in the Yellow River Delta should be optimized to reduce the nitrogen loss and to improve the productivity of the soil-wheat system to ensure food security.

Author Contributions

Methodology, X.G. and P.H.; Investigation, Q.Y.; Data curation, F.D.; Writing—original draft, K.Z.; Writing—review & editing, F.S.; Supervision, Y.Z. and W.C.; Project administration, L.W. and Q.L. All authors have read and agreed to the published version of the manuscript.

Funding

This research was supported by National Key Research and Development Program Subproject of China (2021YFD190090205) and Key Research and Development Plan of Shandong Province (Major Scientific and Technological Innovation Project, 2021CXGC010704, 2017CXGC0301).

Data Availability Statement

Not applicable.

Acknowledgments

We thank the reviewers for their useful comments and suggestions.

Conflicts of Interest

The authors declare that they have no known competing financial interests or personal relationships that could have appeared to influence the work reported in this article.

References

  1. Zhang, Y.; Wang, W.; Yuan, W.; Zhang, R.; Xi, X. Cattle Manure Application and Combined Straw Mulching Enhance Maize (Zea Mays L.) Growth and Water Use for Rain-Fed Cropping System of Coastal Saline Soils. Agriculture 2021, 11, 745. [Google Scholar] [CrossRef]
  2. Zhang, Y.; Yuan, W.; Han, L. Residue Mulching Alleviates Coastal Salt Accumulation and Stimulates Post-Fallow Crop Biomass under a Fallow–Maize (Zea Mays L.) Rotation System. Agriculture 2022, 12, 509. [Google Scholar] [CrossRef]
  3. Yu, J.; Chen, S.; Zhao, Q.; Wang, T.; Yang, C.; Diaz, C.; Sun, G.; Dai, S. Physiological and Proteomic Analysis of Salinity Tolerance in Puccinellia Tenuiflora. J. Proteome Res. 2011, 10, 3852–3870. [Google Scholar] [CrossRef]
  4. Hussain, M.I.; Farooq, M.; Muscolo, A.; Rehman, A. Crop Diversification and Saline Water Irrigation as Potential Strategies to Save Freshwater Resources and Reclamation of Marginal Soils—A Review. Environ. Sci. Pollut. Res. 2020, 27, 28695–28729. [Google Scholar] [CrossRef]
  5. Lv, Z.Z.; Liu, G.M.; Yang, J.S.; Zhang, M.M.; He, L.D.; Shao, H.B.; Yu, S.P. Spatial Variability of Soil Salinity in Bohai Sea Coastal Wetlands, China: Partition into Four Management Zones. Plant Biosyst. 2013, 147, 1201–1210. [Google Scholar] [CrossRef] [Green Version]
  6. Liu, S.; Hou, X.; Yang, M.; Cheng, F.; Coxixo, A.; Wu, X.; Zhang, Y. Factors Driving the Relationships between Vegetation and Soil Properties in the Yellow River Delta, China. Catena 2018, 165, 279–285. [Google Scholar] [CrossRef]
  7. Yu, P.; Liu, S.; Yang, H.; Fan, G.; Zhou, D. Short-Term Land Use Conversions Influence the Profile Distribution of Soil Salinity and Sodicity in Northeastern China. Ecol. Indic. 2018, 88, 79–87. [Google Scholar] [CrossRef]
  8. Yang, C.; Sun, J. Soil Salinity Drives the Distribution Patterns and Ecological Functions of Fungi in Saline-Alkali Land in the Yellow River Delta, China. Front. Microbiol. 2020, 11, 594284. [Google Scholar] [CrossRef]
  9. Zhao, Q.; Bai, J.; Gao, Y.; Zhao, H.; Zhang, G.; Cui, B. Shifts in the Soil Bacterial Community along a Salinity Gradient in the Yellow River Delta. Land Degrad. Dev. 2020, 31, 2255–2267. [Google Scholar] [CrossRef]
  10. Kumawat, K.C.; Nagpal, S.; Sharma, P. Potential of Plant Growth-Promoting Rhizobacteria-Plant Interactions in Mitigating Salt Stress for Sustainable Agriculture: A Review. Pedosphere 2022, 32, 223–245. [Google Scholar] [CrossRef]
  11. Marsack, J.M.; Connolly, B.M. Generalist Herbivore Response to Volatile Chemical Induction Varies along a Gradient in Soil Salinization. Sci. Rep. 2022, 12, 1689. [Google Scholar] [CrossRef] [PubMed]
  12. Li, Y.Q.; Chai, Y.H.; Wang, X.S.; Huang, L.Y.; Luo, X.M.; Qiu, C.; Liu, Q.H.; Guan, X.Y. Bacterial Community in Saline Farmland Soil on the Tibetan Plateau: Responding to Salinization While Resisting Extreme Environments. BMC Microbiol. 2021, 21, 119. [Google Scholar] [CrossRef] [PubMed]
  13. Zhang, J.; Jiang, X.; Xue, Y.; Li, Z.; Yu, B.; Xu, L.; Lu, X.; Miao, Q.; Liu, Z.; Cui, Z. Closing Yield Gaps through Soil Improvement for Maize Production in Coastal Saline Soil. Agronomy 2019, 9, 573. [Google Scholar] [CrossRef] [Green Version]
  14. Yin, S.; Suo, F.; Kong, Q.; You, X.; Zhang, X.; Yuan, Y.; Yu, X.; Cheng, Y.; Sun, R.; Zheng, H.; et al. Biochar Enhanced Growth and Biological Nitrogen Fixation of Wild Soybean (Glycine Max Subsp. Soja Siebold & Zucc.) in a Coastal Soil of China. Agriculture 2021, 11, 1246. [Google Scholar] [CrossRef]
  15. Saifullah; Dahlawi, S.; Naeem, A.; Rengel, Z.; Naidu, R. Biochar Application for the Remediation of Salt-Affected Soils: Challenges and Opportunities. Sci. Total Environ. 2018, 625, 320–335. [Google Scholar] [CrossRef]
  16. Saboor, A.; Ali, M.A.; Ahmed, N.; Skalicky, M.; Danish, S.; Fahad, S.; Hassan, F.; Hassan, M.M.; Brestic, M.; EL Sabagh, A.; et al. Biofertilizer-Based Zinc Application Enhances Maize Growth, Gas Exchange Attributes, and Yield in Zinc-Deficient Soil. Agriculture 2021, 11, 310. [Google Scholar] [CrossRef]
  17. Xiao, L.; Yuan, G.; Feng, L.; Bi, D.; Wei, J.; Shen, G.; Liu, Z. Coupled Effects of Biochar Use and Farming Practice on Physical Properties of a Salt-Affected Soil with Wheat–Maize Rotation. J. Soils Sediments 2020, 20, 3053–3061. [Google Scholar] [CrossRef]
  18. Ennan, Z. Influence of Water-Saving Irrigation and Nitrogenous Fertilizer Application on Assessment of the Rice Quality. Int. J. Agric. Biol. 2017, 19, 1213–1219. [Google Scholar] [CrossRef]
  19. Hussain, T.; Hussain, N.; Ahmed, M.; Nualsri, C.; Duangpan, S. Impact of Nitrogen Application Rates on Upland Rice Performance, Planted under Varying Sowing Times. Sustainability 2022, 14, 1997. [Google Scholar] [CrossRef]
  20. Jin, Q.; You, J.; Xie, M.; Qiu, Y.; Lei, S.; Ding, Q.; Chen, J. Drip Irrigation Reduced Fertilizer Nitrogen Loss from Lettuce Field—A Case Study Based on 15N Tracing Technique. Water 2022, 14, 675. [Google Scholar] [CrossRef]
  21. Li, G.; Zhao, B.; Dong, S.; Zhang, J.; Liu, P.; Lu, W. Controlled-Release Urea Combining with Optimal Irrigation Improved Grain Yield, Nitrogen Uptake, and Growth of Maize. Agric. Water Manag. 2020, 227, 105834. [Google Scholar] [CrossRef]
  22. Gong, P.; Zhang, Y.; Liu, H. Effects of Irrigation and N Fertilization on 15N Fertilizer Utilization by Vitis Vinifera L. Cabernet Sauvignon in China. Water 2022, 14, 1205. [Google Scholar] [CrossRef]
  23. Tyagi, J.; Ahmad, S.; Malik, M. Nitrogenous Fertilizers: Impact on Environment Sustainability, Mitigation Strategies, and Challenges. Int. J. Environ. Sci. Technol. 2022, 19, 11649–11672. [Google Scholar] [CrossRef]
  24. Ahmed, M.; Rauf, M.; Mukhtar, Z.; Saeed, N.A. Excessive Use of Nitrogenous Fertilizers: An Unawareness Causing Serious Threats to Environment and Human Health. Environ. Sci. Pollut. Res. 2017, 24, 26983–26987. [Google Scholar] [CrossRef] [PubMed]
  25. Wang, L.; Zheng, J.; You, J.; Li, J.; Qian, C.; Leng, S.; Yang, G.; Zuo, Q. Effects of Phosphorus Supply on the Leaf Photosynthesis, and Biomass and Phosphorus Accumulation and Partitioning of Canola (Brassica Napus L.) in Saline Environment. Agronomy 2021, 11, 1918. [Google Scholar] [CrossRef]
  26. Song, F.; Zhuge, Y.; Guo, X.; Lou, Y.; Wang, H.; Pan, H.; Feng, H. Optimizing Irrigation and Fertilization Can Improve Degraded Saline Soils and Increase Wheat Grain Yield. Land Degrad. Dev. 2021, 32, 494–504. [Google Scholar] [CrossRef]
  27. Singh, K. Microbial and Enzyme Activities of Saline and Sodic Soils. Land Degrad. Dev. 2016, 27, 706–718. [Google Scholar] [CrossRef]
  28. Wang, Z.; Zhao, G.; Gao, M.; Chang, C. Spatial Variability of Soil Salinity in Coastal Saline Soil at Different Scales in the Yellow River Delta, China. Environ. Monit. Assess. 2017, 189, 80. [Google Scholar] [CrossRef]
  29. Wang, F.; Wang, C.; Zheng, Y.; Li, X.; Qin, H.; Ding, W. Estimating Nitrogen Fates and Gross Transformations in Bioretention Systems with Applications of 15N Labeling Methods. Chemosphere 2021, 270, 129462. [Google Scholar] [CrossRef]
  30. Templer, P.H.; Mack, M.C.; Iii, F.S.C.; Christenson, L.M.; Compton, J.E.; Crook, H.D.; Currie, W.S.; Curtis, C.J.; Dail, D.B.; D’Antonio, C.M.; et al. Sinks for Nitrogen Inputs in Terrestrial Ecosystems: A Meta-Analysis of 15N Tracer Field Studies. Ecology 2012, 93, 1816–1829. [Google Scholar] [CrossRef]
  31. Sheng, W.; Yu, G.; Fang, H.; Jiang, C.; Yan, J.; Zhou, M. Sinks for Inorganic Nitrogen Deposition in Forest Ecosystems with Low and High Nitrogen Deposition in China. PLoS ONE 2014, 9, e89322. [Google Scholar] [CrossRef] [PubMed]
  32. Cheng, Y.; Wang, J.; Zhang, J.-B.; Wang, S.-Q.; Cai, Z.-C. The Different Temperature Sensitivity of Gross N Transformations between the Coniferous and Broad-Leaved Forests in Subtropical China. Soil Sci. Plant Nutr. 2015, 61, 506–515. [Google Scholar] [CrossRef] [Green Version]
  33. Gao, L.; Liu, M.; Wang, M.; Shen, Q.; Guo, S. Enhanced Salt Tolerance under Nitrate Nutrition is Associated with Apoplast Na+ Content in Canola (Brassica Napus L.) and Rice (Oryza Sativa L.) Plants. Plant Cell Physiol. 2016, 57, 2323–2333. [Google Scholar] [CrossRef] [Green Version]
  34. Ma, T.; Chen, K.; He, P.; Dai, Y.; Yin, Y.; Peng, S.; Ding, J.; Yu, S.; Huang, J. Sunflower Photosynthetic Characteristics, Nitrogen Uptake, and Nitrogen Use Efficiency under Different Soil Salinity and Nitrogen Applications. Water 2022, 14, 982. [Google Scholar] [CrossRef]
  35. Dinh, T.H.; Watanabe, K.; Takaragawa, H.; Nakabaru, M.; Kawamitsu, Y. Photosynthetic Response and Nitrogen Use Efficiency of Sugarcane under Drought Stress Conditions with Different Nitrogen Application Levels. Plant Prod. Sci. 2017, 20, 412–422. [Google Scholar] [CrossRef] [Green Version]
  36. Wang, L.; Chen, J.; Shangguan, Z. Photosynthetic Characteristics and Nitrogen Distribution of Large-Spike Wheat in Northwest China. J. Integr. Agric. 2016, 15, 545–552. [Google Scholar] [CrossRef] [Green Version]
  37. Fageria, N.K.; Knupp, A.M. Upland Rice Phenology and Nutrient Uptake in Tropical Climate. J. Plant Nutr. 2013, 36, 1–14. [Google Scholar] [CrossRef]
  38. Holaday, A.S.; Schwilk, D.W.; Waring, E.F.; Guvvala, H.; Griffin, C.M.; Lewis, O.M. Plasticity of Nitrogen Allocation in the Leaves of the Invasive Wetland Grass, Phalaris Arundinacea and Co-Occurring Carex Species Determines the Photosynthetic Sensitivity to Nitrogen Availability. J. Plant Physiol. 2015, 177, 20–29. [Google Scholar] [CrossRef] [PubMed]
  39. Akhtar, M.N.; Ul-Haq, T.; Ahmad, F.; Imran, M.; Ahmed, W.; Ghaffar, A.; Shahid, M.; Saleem, M.H.; Alshaya, H.; Okla, M.K.; et al. Application of Potassium along with Nitrogen under Varied Moisture Regimes Improves Performance and Nitrogen-Use Efficiency of High- and Low-Potassium Efficiency Cotton Cultivars. Agronomy 2022, 12, 502. [Google Scholar] [CrossRef]
  40. Bassil, E.; Tajima, H.; Liang, Y.-C.; Ohto, M.; Ushijima, K.; Nakano, R.; Esumi, T.; Coku, A.; Belmonte, M.; Blumwald, E. The Arabidopsis Na+/H+ Antiporters NHX1 and NHX2 Control Vacuolar pH and K+ Homeostasis to Regulate Growth, Flower Development, and Reproduction. Plant Cell 2011, 23, 3482–3497. [Google Scholar] [CrossRef]
  41. Huang, M.; Zhang, Z.; Zhai, Y.; Lu, P.; Zhu, C. Effect of Straw Biochar on Soil Properties and Wheat Production under Saline Water Irrigation. Agronomy 2019, 9, 457. [Google Scholar] [CrossRef] [Green Version]
  42. Zheng, C.; Jiang, D.; Liu, F.; Dai, T.; Jing, Q.; Cao, W. Effects of Salt and Waterlogging Stresses and Their Combination on Leaf Photosynthesis, Chloroplast ATP Synthesis, and Antioxidant Capacity in Wheat. Plant Sci. 2009, 176, 575–582. [Google Scholar] [CrossRef] [PubMed]
  43. Saqib, M.; Akhtar, J.; Qureshi, R.H. Pot Study on Wheat Growth in Saline and Waterlogged Compacted Soil. Soil Tillage Res. 2004, 77, 169–177. [Google Scholar] [CrossRef]
  44. Sarangi, S.K.; Singh, S.; Srivastava, A.K.; Choudhary, M.; Mandal, U.K.; Lama, T.D.; Mahanta, K.K.; Kumar, V.; Sharma, P.C.; Ismail, A.M. Crop and Residue Management Improves Productivity and Profitability of Rice–Maize System in Salt-Affected Rainfed Lowlands of East India. Agronomy 2020, 10, 2019. [Google Scholar] [CrossRef]
  45. Shahzad, M.; Witzel, K.; Zörb, C.; Mühling, K.H. Growth-Related Changes in Subcellular Ion Patterns in Maize Leaves (Zea mays L.) under Salt Stress. J. Agron. Crop Sci. 2012, 198, 46–56. [Google Scholar] [CrossRef]
  46. Savill, G.P.; Michalski, A.; Powers, S.J.; Wan, Y.; Tosi, P.; Buchner, P.; Hawkesford, M.J. Temperature and Nitrogen Supply Interact to Determine Protein Distribution Gradients in the Wheat Grain Endosperm. J. Exp. Bot. 2018, 69, 3117–3126. [Google Scholar] [CrossRef] [Green Version]
  47. Davis, A.M.; Tink, M.; Rohde, K.; Brodie, J.E. Urea Contributions to Dissolved ‘Organic’ Nitrogen Losses from Intensive, Fertilised Agriculture. Agric. Ecosyst. Environ. 2016, 223, 190–196. [Google Scholar] [CrossRef] [Green Version]
  48. Miller, A.; Schimel, J.; Meixner, T.; Sickman, J.; Melack, J. Episodic Rewetting Enhances Carbon and Nitrogen Release from Chaparral Soils. Soil Biol. Biochem. 2005, 37, 2195–2204. [Google Scholar] [CrossRef]
  49. Dai, X.; Zhou, X.; Jia, D.; Xiao, L.; Kong, H.; He, M. Managing the Seeding Rate to Improve Nitrogen-Use Efficiency of Winter Wheat. Field Crops Res. 2013, 154, 100–109. [Google Scholar] [CrossRef]
  50. Wang, J.; Chadwick, D.R.; Cheng, Y.; Yan, X. Global Analysis of Agricultural Soil Denitrification in Response to Fertilizer Nitrogen. Sci. Total Environ. 2018, 616–617, 908–917. [Google Scholar] [CrossRef]
  51. Ghosh, U.; Thapa, R.; Desutter, T.; He, Y.; Chatterjee, A. Saline-Sodic Soils: Potential Sources of Nitrous Oxide and Carbon Dioxide Emissions? Pedosphere 2017, 27, 65–75. [Google Scholar] [CrossRef]
Figure 1. 15N residues in different depth soil layers of different treatments.
Water 14 03748 g001
Figure 2. 15N residues distribution ratios in different depth soil layers of different treatments.
Water 14 03748 g002
Table 1. Properties of light-salinity soil (LS), medium-salinity soil (MS), and heavy-salinity soil (HS).
SoilpHEC
(dS m−1)
TS
(g kg−1)
BD
(g cm−3)
OM
(g kg−1)
TN
(g kg−1)
AP
(mg kg−1)
AK
(mg kg−1)
LS7.90 ± 0.010.42 ± 0.022.97 ± 0.281.38 ± 0.0515.23 ± 0.191.05 ± 0.0118.75 ± 0.49185.70 ± 0.80
MS7.98 ± 0.011.24 ± 0.015.02 ± 0.241.32 ± 0.0512.72 ± 0.090.93 ± 0.0312.08 ± 0.10227.05 ± 3.15
HS7.99 ± 0.022.97 ± 0.036.91 ± 0.551.30 ± 0.097.99 ± 0.070.76 ± 0.029.33 ± 0.10250.30 ± 8.70
Note: EC, soil electrical conductivity; TS, soil total salt; BD, soil bulk density; OM, soil organic matter; TN, soil total nitrogen; AP, soil available phosphorus; and AK, soil available potassium.
Table 2. Dry matter mass (g m−2) of each wheat parts in different treatments.
TreatmentRootStemLeafSheathGrainWhole Plant
LS22.63 ± 0.93 a125.60 ± 7.64 a94.69 ± 3.83 a103.26 ± 2.19 a222.83 ± 25.61 a569.02 ± 18.97 a
MS3.40 ± 0.43 b18.85 ± 1.41 b15.37 ± 0.26 b29.13 ± 3.34 b82.64 ± 6.40 b149.38 ± 4.44 b
HS1.75 ± 0.02 b6.95 ± 0.24 b6.33 ± 0.13 c7.69 ± 0.15 c14.80 ± 0.59 c37.51 ± 0.52 c
Note: The values in the table are the mean ± standard error and different letters in each column indicate significant difference (p < 0.05).
Table 3. Total N concentration, 15N uptake, distribution ratio of 15N uptake, Ndff, and Ndfs in wheat parts of different treatments.
ItemTreatmentRootStemLeafSheathGrainWhole Plant
Total N Concentration/%LS0.74 ± 0.02 c0.47 ± 0.02 c0.80 ± 0.02 c0.84 ± 0.01 b1.87 ± 0.01 b1.15 ± 0.04 b
MS1.02 ± 0.02 b0.60 ± 0.02 b1.27 ± 0.01 b1.33 ± 0.05 a2.34 ± 0.11 a1.78 ± 0.03 a
HS1.13 ± 0.01 a0.93 ± 0.03 a1.32 ± 0.00 a1.47 ± 0.10 a2.49 ± 0.19 a1.74 ± 0.07 a
15N Uptake/(g m−2)LS0.05 ± 0.01 a0.15 ± 0.01 a0.32 ± 0.01 a0.36 ± 0.01 a2.28 ± 0.30 a3.15 ± 0.28 a
MS0.01 ± 0.00 b0.04 ± 0.00 b0.08 ± 0.00 b0.17 ± 0.01 b1.09 ± 0.13 b1.39 ± 0.12 b
HS0.01 ± 0.00 b0.02 ± 0.00 b0.04 ± 0.00 c0.05 ± 0.00 c0.23 ± 0.01 c0.35 ± 0.01 c
Distribution Ratio of 15N Uptake/%LS1.59 ± 0.18ab4.88 ± 0.72ab10.23 ± 1.26 a11.66 ± 1.13 a71.64 ± 3.17ab/
MS0.70 ± 0.09 b2.73 ± 0.45 b5.94 ± 0.57 b12.59 ± 2.04 a78.04 ± 3.06 a/
HS2.16 ± 0.45 a7.12 ± 1.11 a10.84 ± 1.33 a13.97 ± 1.77 a65.91 ± 1.66 b/
Ndff/%LS25.52 ± 0.55 b28.16 ± 1.00 c36.85 ± 0.44 b41.56 ± 1.30 a47.05 ± 2.21 b45.63 ± 1.72 a
MS29.53 ± 1.53ab32.89 ± 0.86 b40.28 ± 0.97 b43.50 ± 2.02 a55.47 ± 1.39 a45.42 ± 1.54 a
HS37.44 ± 3.93 a37.79 ± 0.56 a44.76 ± 1.46 a46.13 ± 1.09 a57.62 ± 3.15 a50.42 ± 2.48 a
Ndfs/%LS74.48 ± 0.55 a71.84 ± 1.00 a63.15 ± 0.44 a58.44 ± 1.30 a52.95 ± 2.21 a54.37 ± 1.72 a
MS70.47 ± 1.53ab67.11 ± 0.86 b59.72 ± 0.97 a56.50 ± 2.02 a44.53 ± 1.39 b54.58 ± 1.54 a
HS62.56 ± 3.93 b62.21 ± 0.56 c55.24 ± 1.46 b53.87 ± 1.09 a42.38 ± 3.15 b49.58 ± 2.48 a
Note: The values in the table are the mean ± standard error and different letters in each column indicate significant difference (p < 0.05).
Table 4. Balance of 15N fate in soil-wheat systems of different saline soils treatments.
Treatment15N Input
(g m−2)
Plant 15N UptakeSoil 15N ResidueSystem 15N Loss
Uptake
(g m−2)
Uptake Rate
(%)
Residue
(g m−2)
Residual Rate
(%)
Loss
(g m−2)
Loss Rate
(%)
LS22.603.15 ± 0.28 a13.96 ± 1.22 a11.00 ± 0.42 a48.69 ± 47.15 a8.44 ± 0.70 c37.35 ± 3.08 c
MS22.601.39 ± 0.12 b6.17 ± 0.51 b7.83 ± 0.98 b34.65 ± 4.33 b13.37 ± 1.04 b59.19 ± 4.60 b
HS22.600.35 ± 0.01 c1.53 ± 0.04 c2.27 ± 0.25 c10.05 ± 1.11 c19.98 ± 0.25 a88.42 ± 1.09 a
Note: The values in the table are the mean ± standard error and different letters in each column indicate significant difference (p < 0.05).
Publisher’s Note: MDPI stays neutral with regard to jurisdictional claims in published maps and institutional affiliations.

