
Study on the Application of Shell-Activated Carbon for the Adsorption of Dyes and Antibiotics

1
College of Environmental Science and Engineering, Nanjing Tech University, Nanjing 211816, China
2
College of Urban Construction, Nanjing Tech University, Nanjing 211800, China
*
Author to whom correspondence should be addressed.
Water 2022, 14(22), 3752; https://doi.org/10.3390/w14223752
Submission received: 13 October 2022
/
Revised: 15 November 2022
/
Accepted: 16 November 2022
/
Published: 18 November 2022
(This article belongs to the Special Issue Water-Sludge-Nexus)
Abstract
:In this study, we prepared homemade fruit shell-activated carbon (SAC) with efficient adsorption of new pollutants and used it in the removal of methylene blue dye (MB) and ofloxacin antibiotic (OFL) in water. We fitted the experimental data for MB and OFL adsorption with isothermal and kinetic models and performed extensive characterization to study the properties of SAC. We also studied the effects of solution pH, dosage amount, initial concentration, and coexisting ions on the adsorption capacity. The results show that SAC has a rich pore structure, and electrostatic interactions are its main adsorption mechanism. Adjusting the solution pH by changing the SAC dosage and removing the K+, SO42−, and Cu2+ could increase the removal of MB and OFL to 99.9% and 97.6%, respectively. In addition, the adsorption capacity of SAC for MB remained at more than 50% of the initial state after three iterations of adsorption regeneration, showing a good regeneration ability. These results show the potential of SAC in replacing conventional activated carbon to remove new pollutants.
1. Introduction
Organic dyes are commonly used to color paper, glass, plastics, textiles, wood, and food materials. The discharge of dye effluents from these industries can cause environmental water pollution [1], leading to potential problems for ecosystems and human health [2]. Methylene blue (MB) is a toxic cationic dye used to color tannin, wool, leather, cotton, calico, and silk materials [3]. MB dyes are rich in organic matter [4], difficult to treat biochemically [5], and toxic and hazardous to the environment [6]. Methylene blue is one of the contaminants in dye effluent, and although methylene blue is less toxic, it can cause headaches, nausea, and confusion after the ingestion of a certain dose [7,8]. China is one of the countries with the largest volume of textile printing and dyeing, and the textile printing and dyeing industry also contributes heavily to the overall industrial wastewater discharge, which accounts for approximately one-tenth of the industrial wastewater discharge [9]. The large amount of dye effluent discharge results in China being one of the countries with more serious water pollution, and the accumulation of dyes over the years can cause irreversible damage to surface water and groundwater [10], so it is very important to study this economically and elucidate practical technological processes for the treatment of dye wastewater [10,11,12].
Approximately 100,000 to 200,000 tons of antibiotics are used worldwide every year. Antibiotics are widely used to treat human diseases [13], with the average Chinese person using more than 10 times as many antibiotics as Americans and accounting for approximately 75% of patients and 80% of seasonal flu hospitalizations in China [14]. Antibiotics entering humans and animals are not fully absorbed, and approximately 50–90% are excreted as metabolites and residues. In industrial production, the wastewater from antibiotic production is treated in pharmaceutical plants [15], but it is difficult to remove all of the antibiotics with existing wastewater treatment technologies, so antibiotics and intermediate products of antibiotic production are still present in the wastewater and are discharged into water bodies, causing pollution of these water bodies. Ofloxacin (OFL) is a representative antimicrobial agent [16]. Due to its wide range of activities, it is widely used in human and veterinary medicine [17]. However, as with many other antibiotics, ofloxacin is not fully absorbed by animals or humans [18]. As a result, large amounts of the drug are released into the water in its raw form or as metabolites, and the biodegradability and natural degradation of ofloxacin are limited, leading to the accumulation of ofloxacin in the environment, causing environmental pollution and thus threatening ecosystems and human health [19].
There are various methods for removing dye and antibiotic contaminants, including adsorption, bioremediation, catalysis, photocatalytic degradation, chemical precipitation, and membrane filtration, among others [20]. After much trial and error, adsorption is the most widely used due to its easy-to-prepare materials, ease of use, and general applicability to a variety of common contaminants [21]. Adsorption treatment of this type of pollutant is rarely reported in the literature, and the adsorption results are not satisfactory; therefore, there is an urgent need to investigate an effective adsorbent for the removal of methylene blue and ofloxacin from wastewater [17,22].
Activated carbon is an environmentally friendly adsorbent that has many advantages, such as high-temperature resistance, resistance to strong acids and bases, chemical stability, good adsorption properties, a wide range of raw materials for preparation, and easy regeneration [23]. It can effectively adsorb organic pollutants dissolved in water [24]. Some organic pollutants such as dyes and antibiotics are difficult to remove with biological and other chemical methods but are better removed with activated carbon [25]. Adsorption processes are the preferred method for removing various types of aqueous pollutants [19]. This is due to factors such as low operating costs, simple design, high selectivity, high efficiency in treating a wide range of aqueous pollutants, and the fact that no secondary by-products are formed during the treatment process [26]. Activated carbon is widely known for its use as an adsorbent, although various other applications exist, primarily because of its highly porous nature and high surface area to facilitate adsorption [2].
The efficiency of the adsorption process mainly depends on the availability, adsorption capacity, regenerability, porosity, and specific surface area of the adsorbent [12]. Therefore, in this study, the adsorption performance of activated carbon for the removal of MB and OFL from aqueous solutions was evaluated [27,28]. It was further used to optimize the key parameters of adsorption (solution pH, adsorbent dosage, initial concentration of solution, and coexisting ions) in order to obtain a clear understanding of the effect of the nature of activated carbon on its adsorption capacity [29]. In addition, the adsorption isotherms, kinetics, thermodynamics, and adsorption mechanism of SAC’s adsorption of MB and OFL have also been studied [30]. The aim of this study was to explore the optimum conditions for MB and OFL adsorption by activated carbon and achieve efficient adsorption of MB and OFL [31]. The MB and OFL adsorption isotherms and kinetic models were fitted, the thermodynamic parameters were calculated, and the mechanism for the efficient adsorption of MB and OFL on activated carbon was proposed. The samples were characterized by BET, FTIR, XRD, and SEM tests. After the adsorption experiments [32,33], the excellent regeneration performance of the activated carbon was tested and used for the treatment of dyestuff and antibiotic wastewater with removal rates of up to 99.9% and 97.6%, respectively.
Apparently, this method of activated carbon adsorption of dyes and antibiotics has the advantages of low cost, easy availability, simple production, good cycling stability, and good application prospects.
2. Materials and Methods
2.1. Materials
The main reagents used in this experiment were NaCl, HCl, NaOH, NaCl, CuSO4, KCl, Na2 CO3, Na2 SO4, and methylene blue-tris (MB), produced by Sinopharm Chemical Reagent Co. (Shanghai, China), and ofloxacin (OFL), produced by Shanghai Maclean Biochemical Technology Co. (Shanghai, China).
For the production of SAC, a certain number of fruit shells was selected and washed with water to remove dust and some impurities, washed with a NaOH solution and a HCl solution, washed with deionized water until the solution became neutral, and dried and crushed in a drying oven at 333 K. A certain amount of crushed and sieved husk was poured into a corundum crucible and then placed in a tube furnace; it was heated to 673 K at a heating rate of 10 K/min⋅and kept for 60 min, and after the process was completed, the sample was brought down to room temperature in a N2 atmosphere and then the sample was removed [32].
2.2. Experimental Methods
The concentrations of methylene blue and ofloxacin after adsorption at 664 nm and 294 nm were determined by a UV-Vis spectrophotometer (UV-5500PC 510 × 610 × 370 mm, Shanghai Yuananalysis Instruments Co. (Shanghai, China)) [13,16,32]. The pH was adjusted with HCl or NaOH during the adsorption. The adsorption isotherms were determined for the best system at three temperatures of 298, 308, and 318 K. Stock solutions of 100 mg/L were prepared with the appropriate reagents and distilled water, and all different concentrations were prepared by diluting these stock solutions. The pKa of OFL was determined spectrophotometrically [16]. Ofloxacin exists in different dissociated forms in acidic and basic ranges with 2 dissociation constants, i.e., pKa1 and pKa2 values of 5.77 and 8.44, respectively.
Deionized water was used as a blank sample, and a spectrophotometer was used to measure the absorbance of the dye and antibiotic solutions at 664 nm and 294 nm, respectively, as shown in Figure S1. Activated carbon was added to the conical flask after 200 mL was added to the target solution with a concentration in this range. Then, it was placed in an oscillator with a rotation speed of 200 rpm and a temperature of 298 K to reach the adsorption equilibrium. The amount of target adsorbed by the activated carbon and the removal rate were calculated after measuring the adsorption equilibrium time of the activated carbon [27].
The values are various factors of the experiment are as follows: Dye solution volume = 200 mL, adsorbent dosage = 20 mg, stirring time = 1440 min (adsorption equilibrium time of approximately 24 h), MB dye initial concentration = 15–25 mg/L, adsorption temperature = 298–318 K; antibiotic solution dye solution volume = 200 mL, adsorbent dosage = 50 mg, stirring time = 1440 min, OFL dye initial concentration = 20–45 mg/L, adsorption temperature = 298–318 K. After adsorption reached equilibrium, the adsorbent–adsorbent mixture was quickly filtered using a 0.45 μm syringe filter, and the equilibrium concentration of MB was determined qualitatively using a UV-Vis spectrophotometer at a maximum absorption wavelength of 664 nm for MB and 294 nm for OFL. Samples of adsorbents loaded with MB dye and OFL antibiotics were collected from the adsorption experiments by filtration and then these activated carbons were dried overnight at 378 K and analyzed using different characterization techniques to obtain surface chemical information to interpret the properties of the shell-activated carbon adsorbents [16].
Evaluation of the regeneration performance of activated carbon requires several successive cycles of adsorption and desorption experiments. The adsorbed SAC samples were separated by filtration followed by three ultrasonic washes with acetic acid, after which the desorbed SAC was dried and added to a fresh solution for the next cycle [16,32].
3. Results and Discussion
3.1. Characterization of Fruit Shell Activated Carbon
The pore volume, pore size, and adsorption properties of SAC were analyzed using ASAP-2020 from Micromeritics, USA. The results of the BET characterization results showed that the specific surface area of the shell-activated carbon was 579.3 m2/g, the pore volume was 0.2353 cm3/g, and the average pore size was 4.183 nm, indicating that the shell-activated carbon was a mesoporous activated carbon. In addition, the adsorption–desorption curves provided qualitative information about the adsorption mechanism and porous structure of the carbonaceous material.
Based on the adsorption-desorption isotherm curves of SAC shown in Figure S2, according to the International Union of Pure and Applied Chemistry (IUPAC) classification system, a combination of type I and type II isotherms was observed. This observation suggests that the presence of many micro- and mesopores contributes to the adsorption of adsorbates on the surface of SAC adsorbents [34].
Figure S3 shows the pore size distribution of the shell-activated carbon, which shows the average pore size of SAC is 4.183 nm, the pore size is mainly focused between 2 and 5 nm, and this shell-activated carbon has a large number of medium and micro pores, which has a good effect on adsorption.
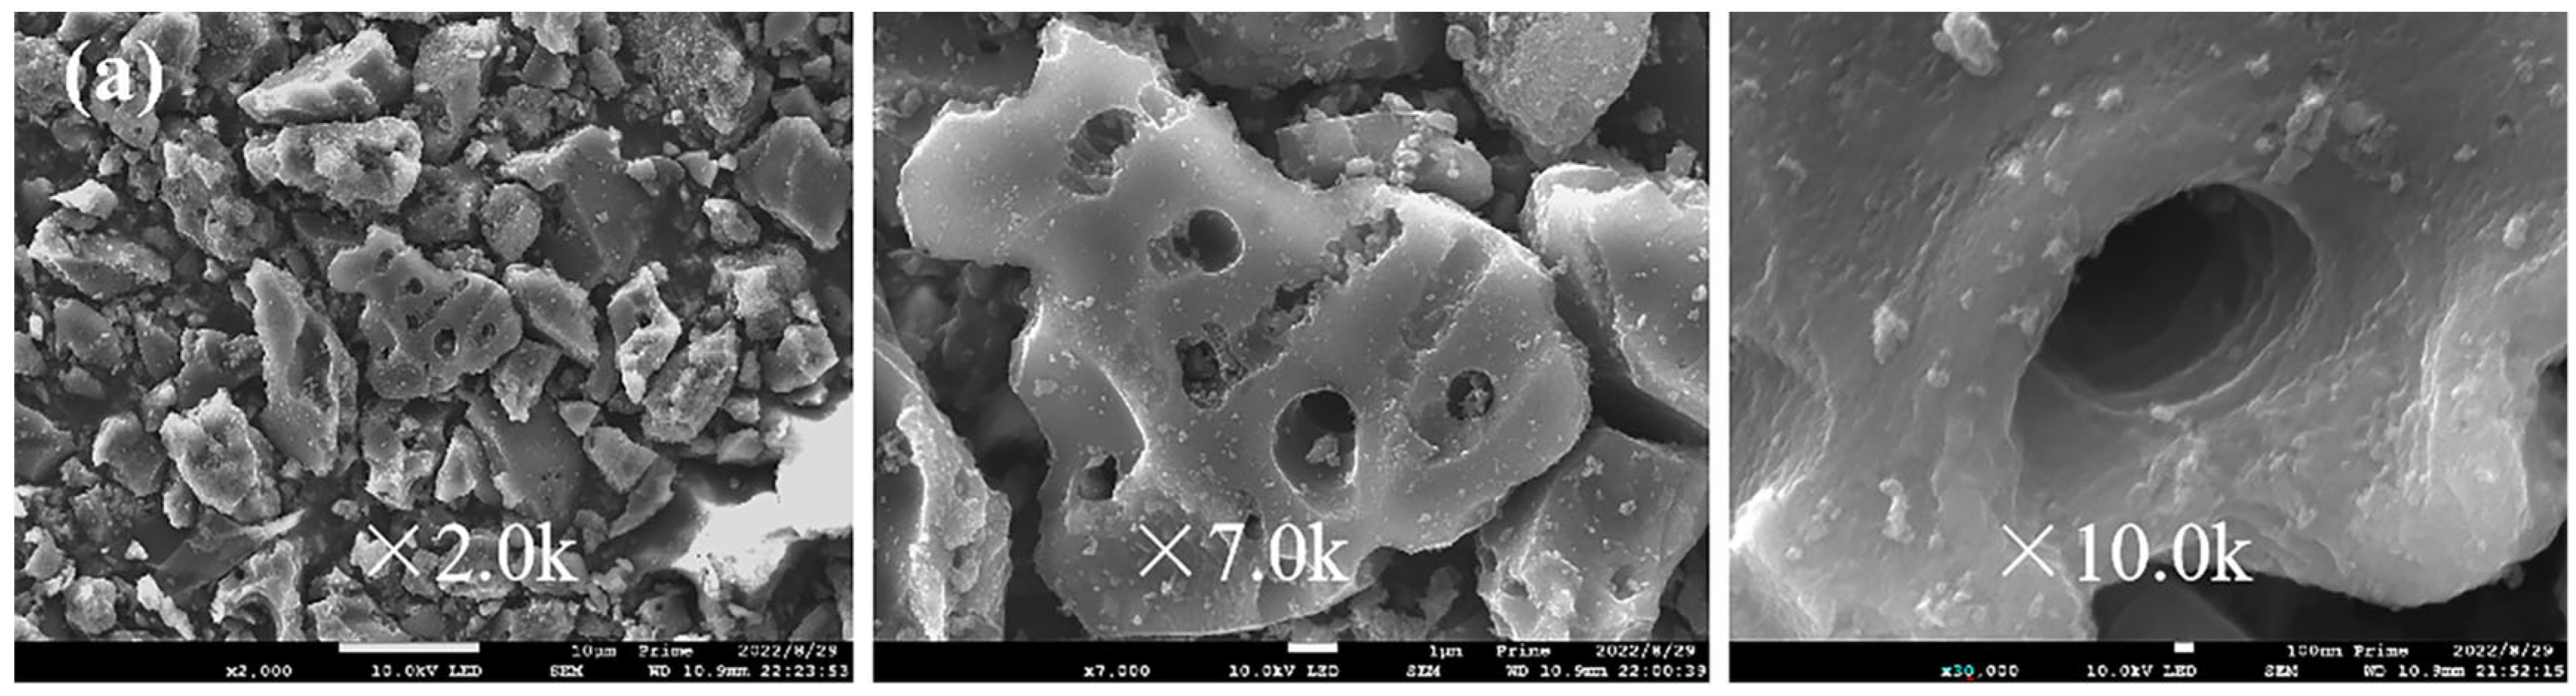
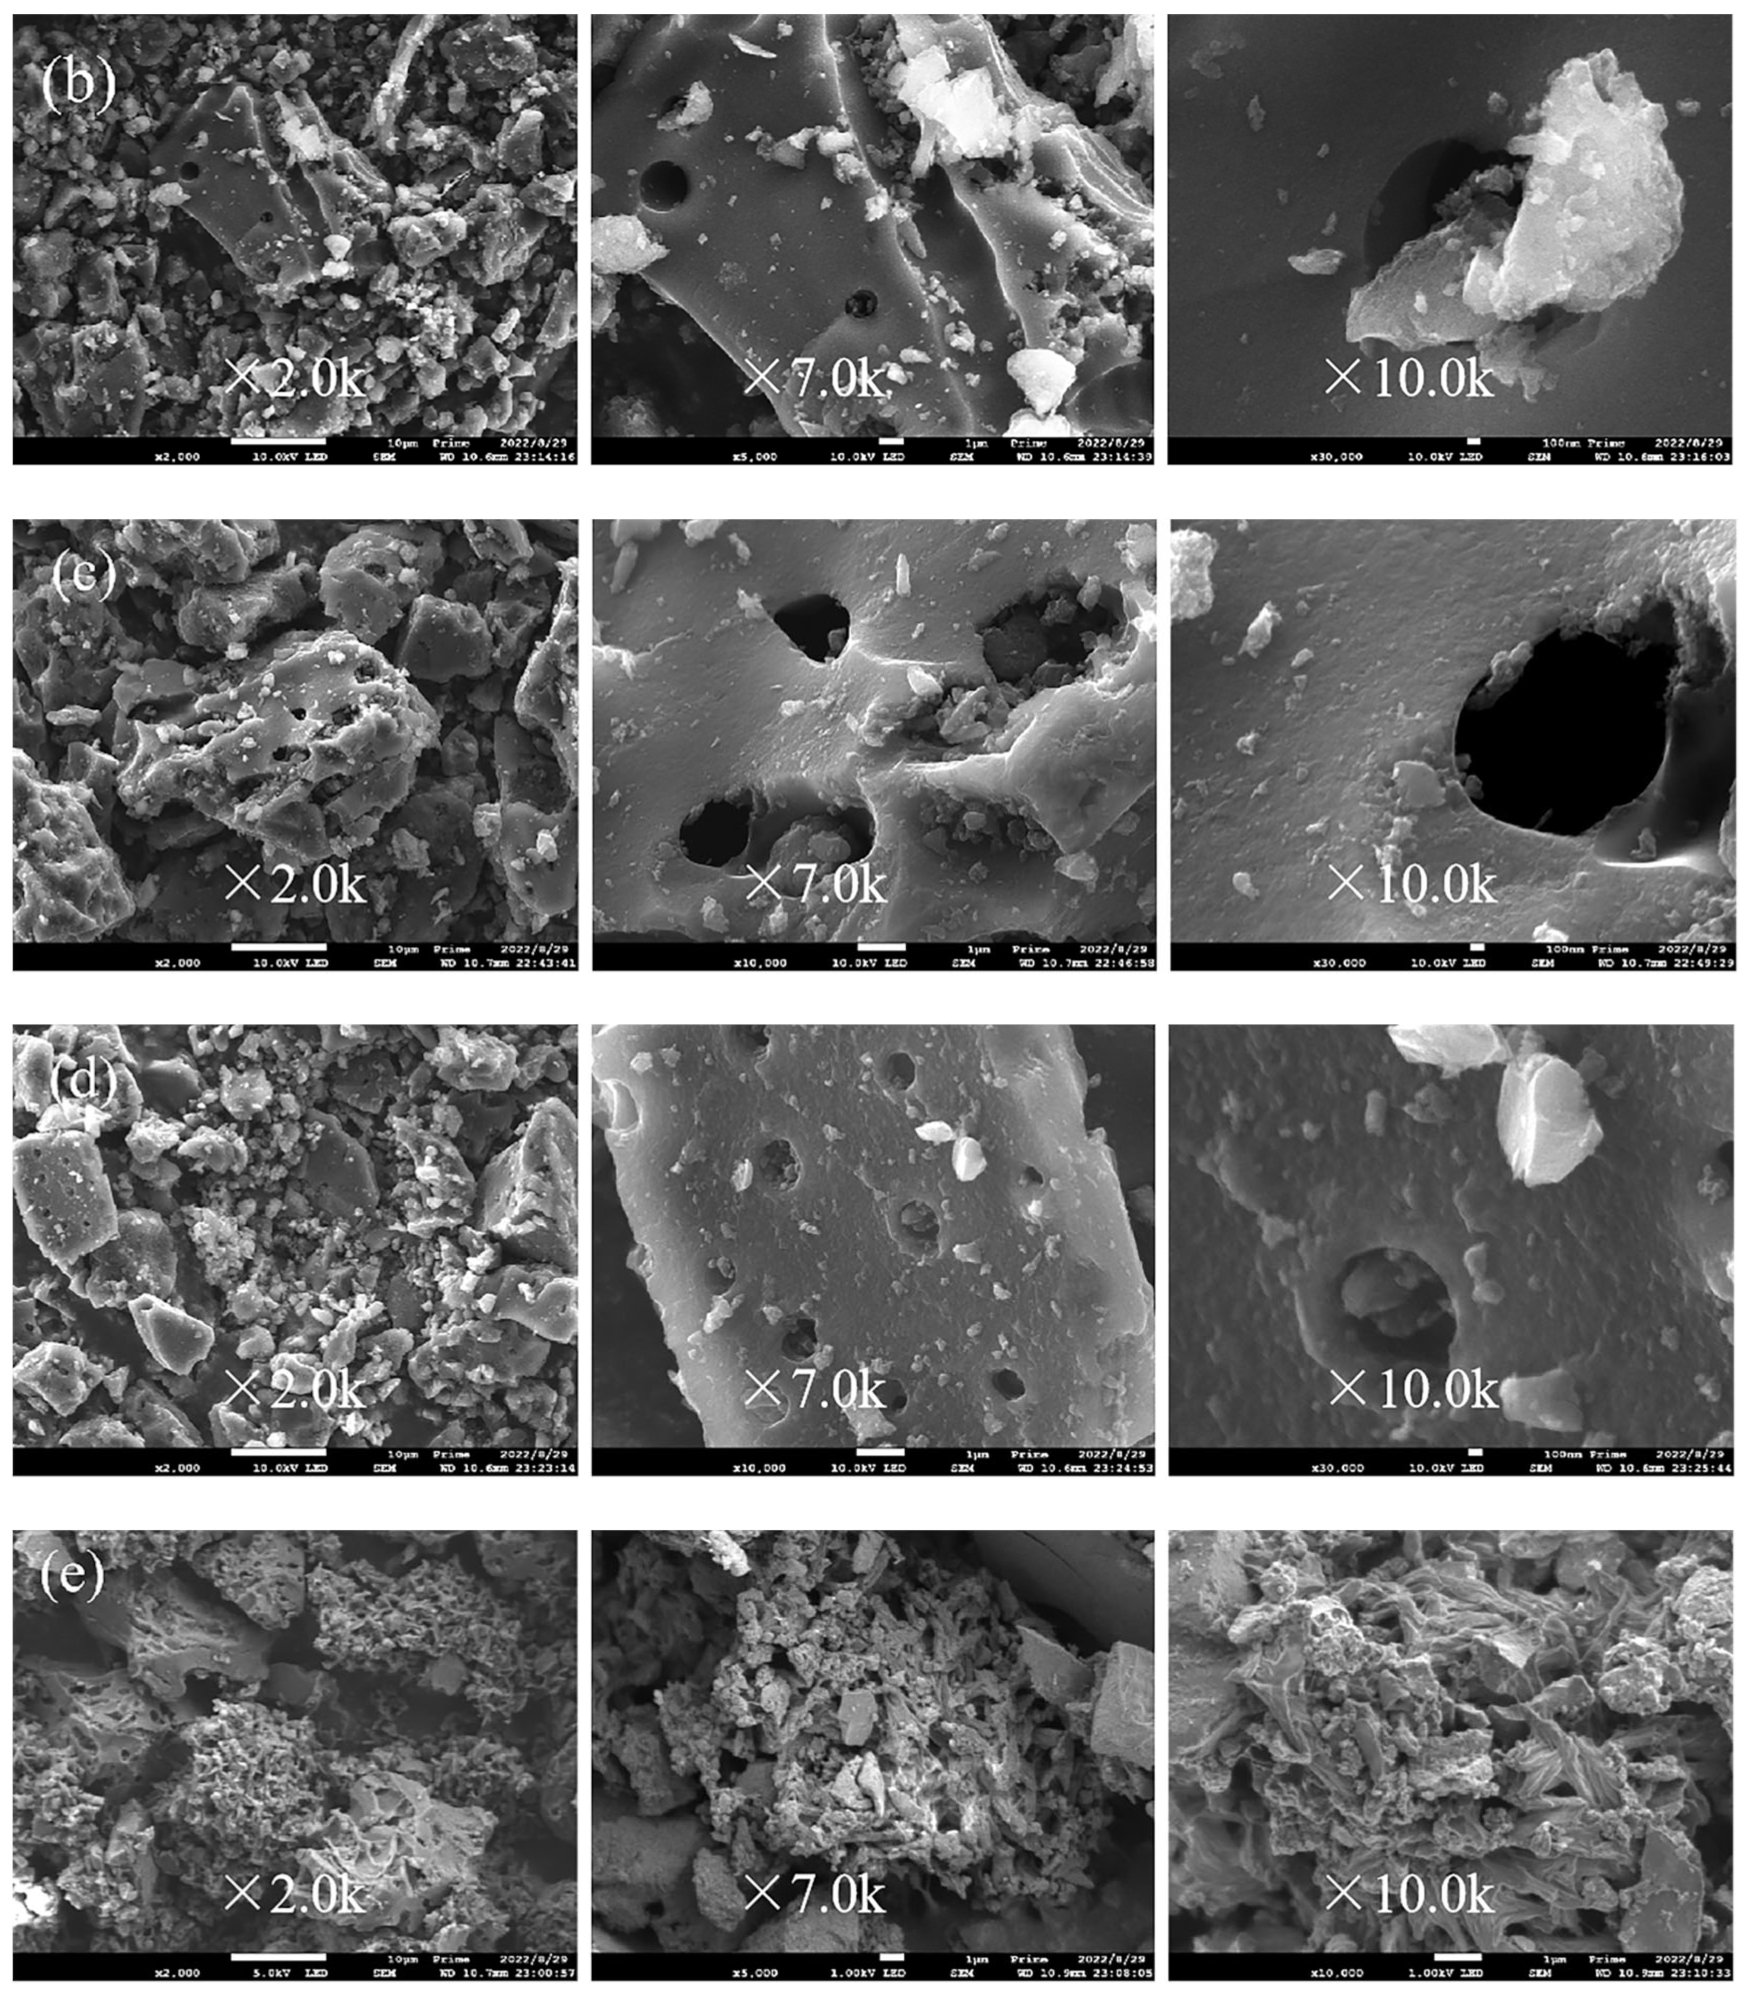
SEM helps to observe the micro morphology of the composites, and ZEISS Merlin SEM of Zeiss Germany was used to analyze the micro morphology of SAC. SEM images of SAC are shown at different magnifications, which clearly shows that the surface of SAC is rough and has a rich pore structure.
Figure 1a shows the SEM image of SAC before adsorption in which the surface exhibits a highly irregular shape and inhomogeneous structure with different pore sizes, cavities, and cracks with a highly porous internal structure. This surface morphology is the preferred feature of adsorbent surfaces and is considered an ideal surface for the adsorption of aqueous pollutants, as these porous structural features facilitate the adsorption of organic dyes and antibiotics in an aqueous solution. Particular attention should be paid to the fact that not only are the pores filled after adsorption and regeneration but the shape and spatial structure of the activated carbon changes significantly. After MB adsorption (Figure 1b), the morphological features of SAC became less porous and more compact due to the loading of MB dye molecules on the surface of the SAC, and the porous structure became less pronounced, showing a smoother morphology. This may be the result of the adsorption of MB molecules into the particles, forming a thin MB layer covering the pores, which is similar to after OFL adsorption (Figure 1d). After MB adsorption regeneration (Figure 1c), SAC regains a certain porous structure with evident cavities and cracks. In contrast, after OFL adsorption regeneration (Figure 1e), SAC’s spatial structure was destroyed and it lost its porous structure characteristics as the internal structure was more compact and SAC was covered [35].
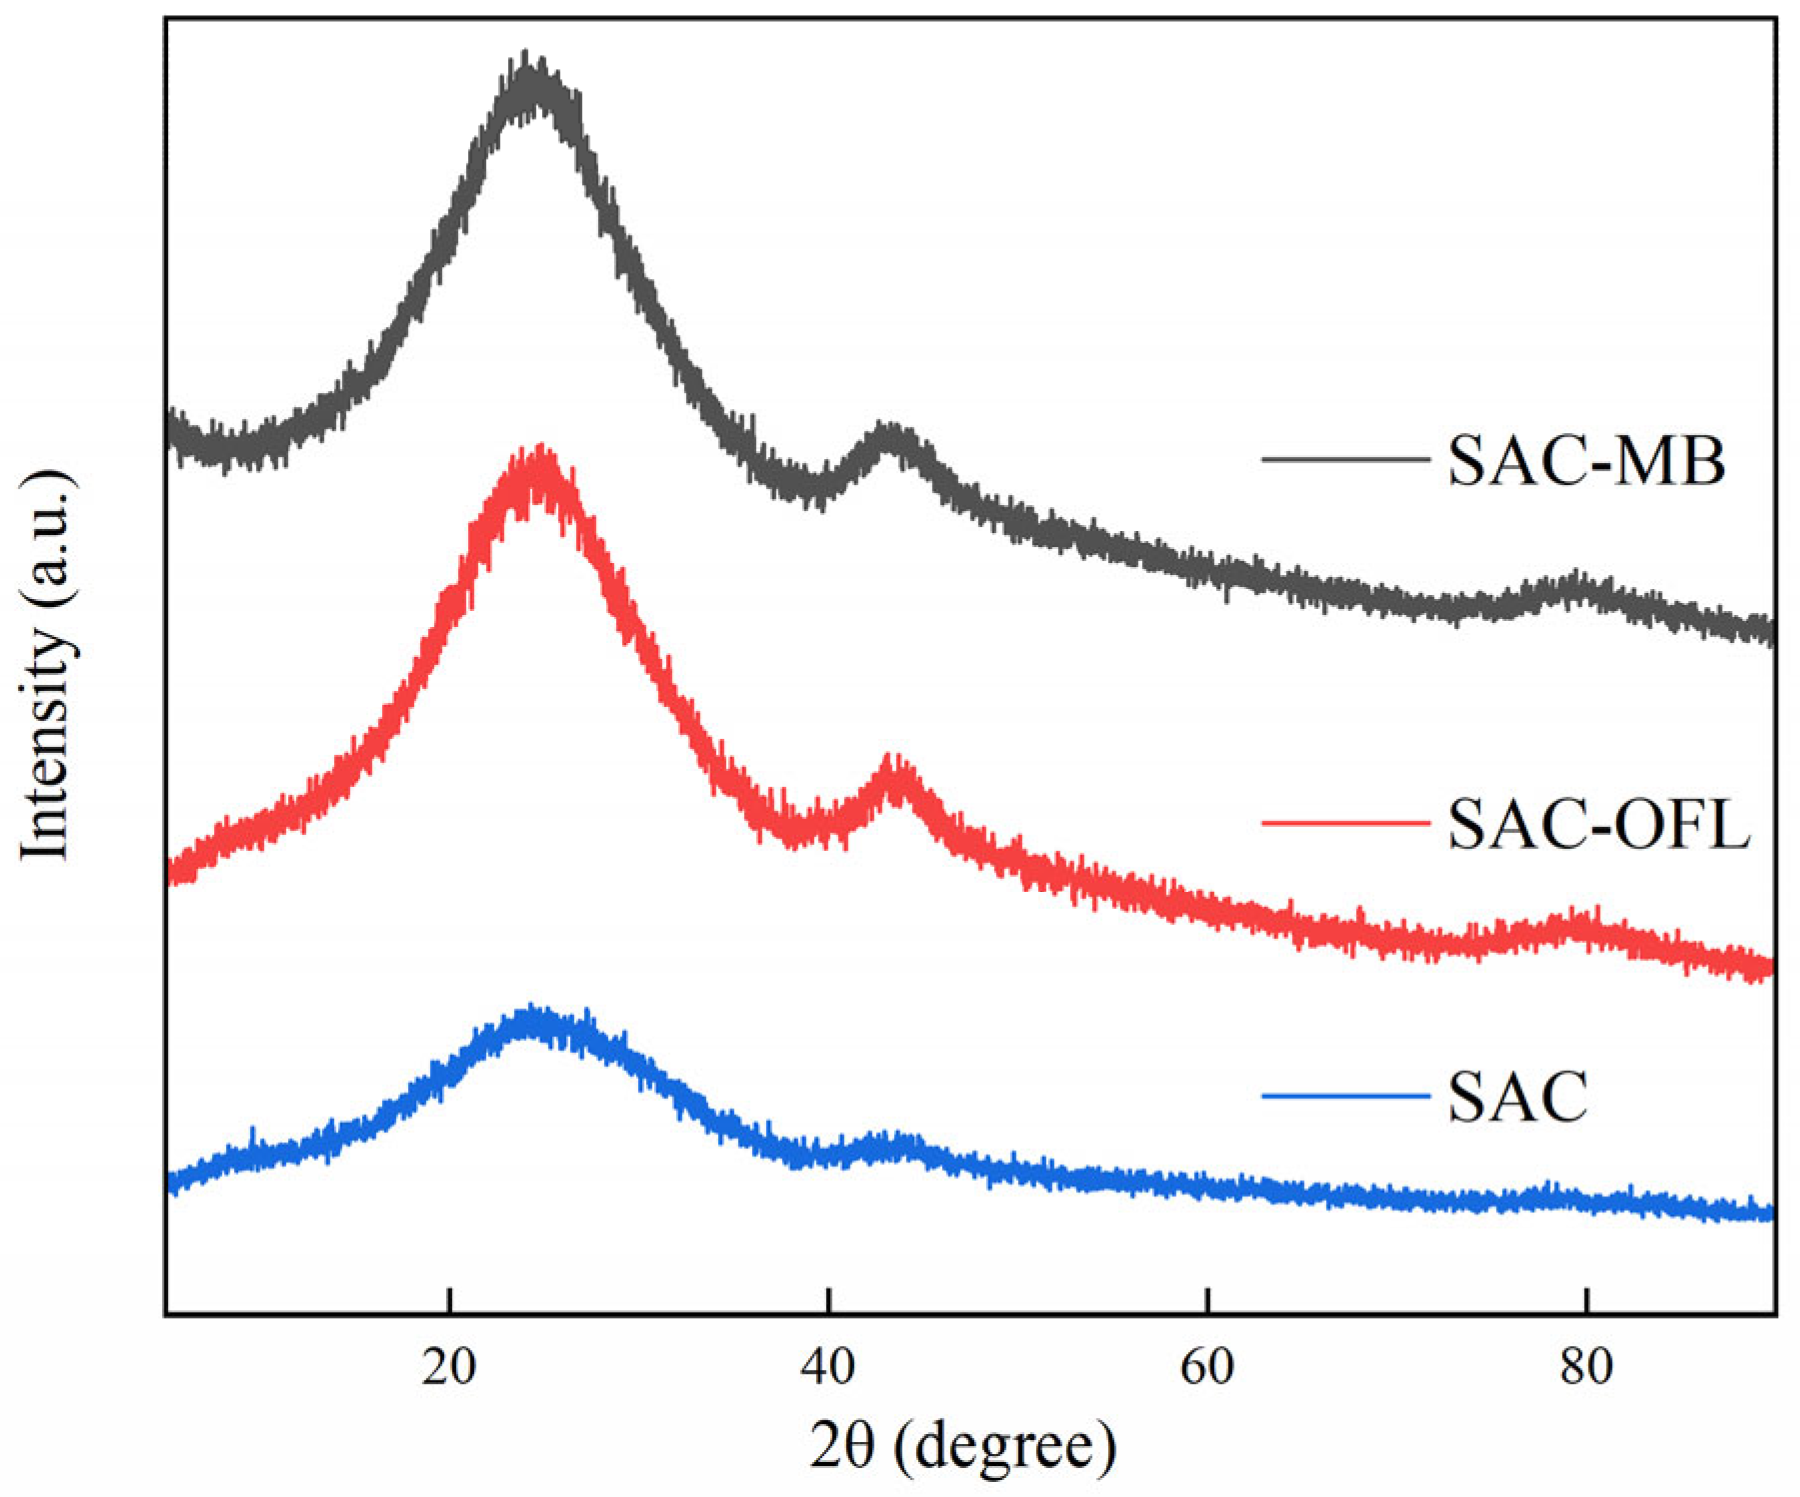
X-ray diffraction (XRD) analysis in reflection mode (Cu-Ka radiation) was carried out on a Bruker D8 Advance fully resolved X-ray diffractometer, Germany, using the X-ray diffraction (XRD) technique to determine the crystallinity or amorphous nature of this shell-activated carbon. Scans were recorded at a scan rate of 5°/min over a range of 5°–90°.
The XRD curves of the shell-activated carbon in its initial state and the adsorption-saturated MB and OFL are shown in Figure 2. In Figure 2, a single major peak is shown at 2θ of 24.26°. Activated carbon is generally classified as amorphous carbon, single-network planar carbon, and graphitic microcrystals. It can be seen from Figure 2 that the fruit shell-activated carbon shows an amorphous structure. The amorphous phase is evidenced by a wide reflection 2θ range between 10° and 40°, with a broad peak characteristic at 2θ = 24.26°, which may be related to the lignin content present in the sample and can be considered non-crystalline cellulose in biomass waste. The recurrence of this XRD diffraction pattern in the lignocellulosic material also suggests that the preparation process of carbonization activation did not result in the formation of a graphitic microcrystalline structure. The amorphous nature of activated carbon prior to its use as an adsorbent is highlighted by its wide reflection range between 20° and 30°. The XRD curves of SAC-MB and SAC-OFL in Figure 2 show two reflections at angles of 24.26° and 42.52°. Thus, these two broad peaks correspond to the amorphous graphitic carbon structure present in the SAC [26]. The diffractograms of these activated carbons do not change significantly after the adsorption of MB and OFL, thus indicating that the adsorption process does not lead to a change in the crystallinity of the material [36].
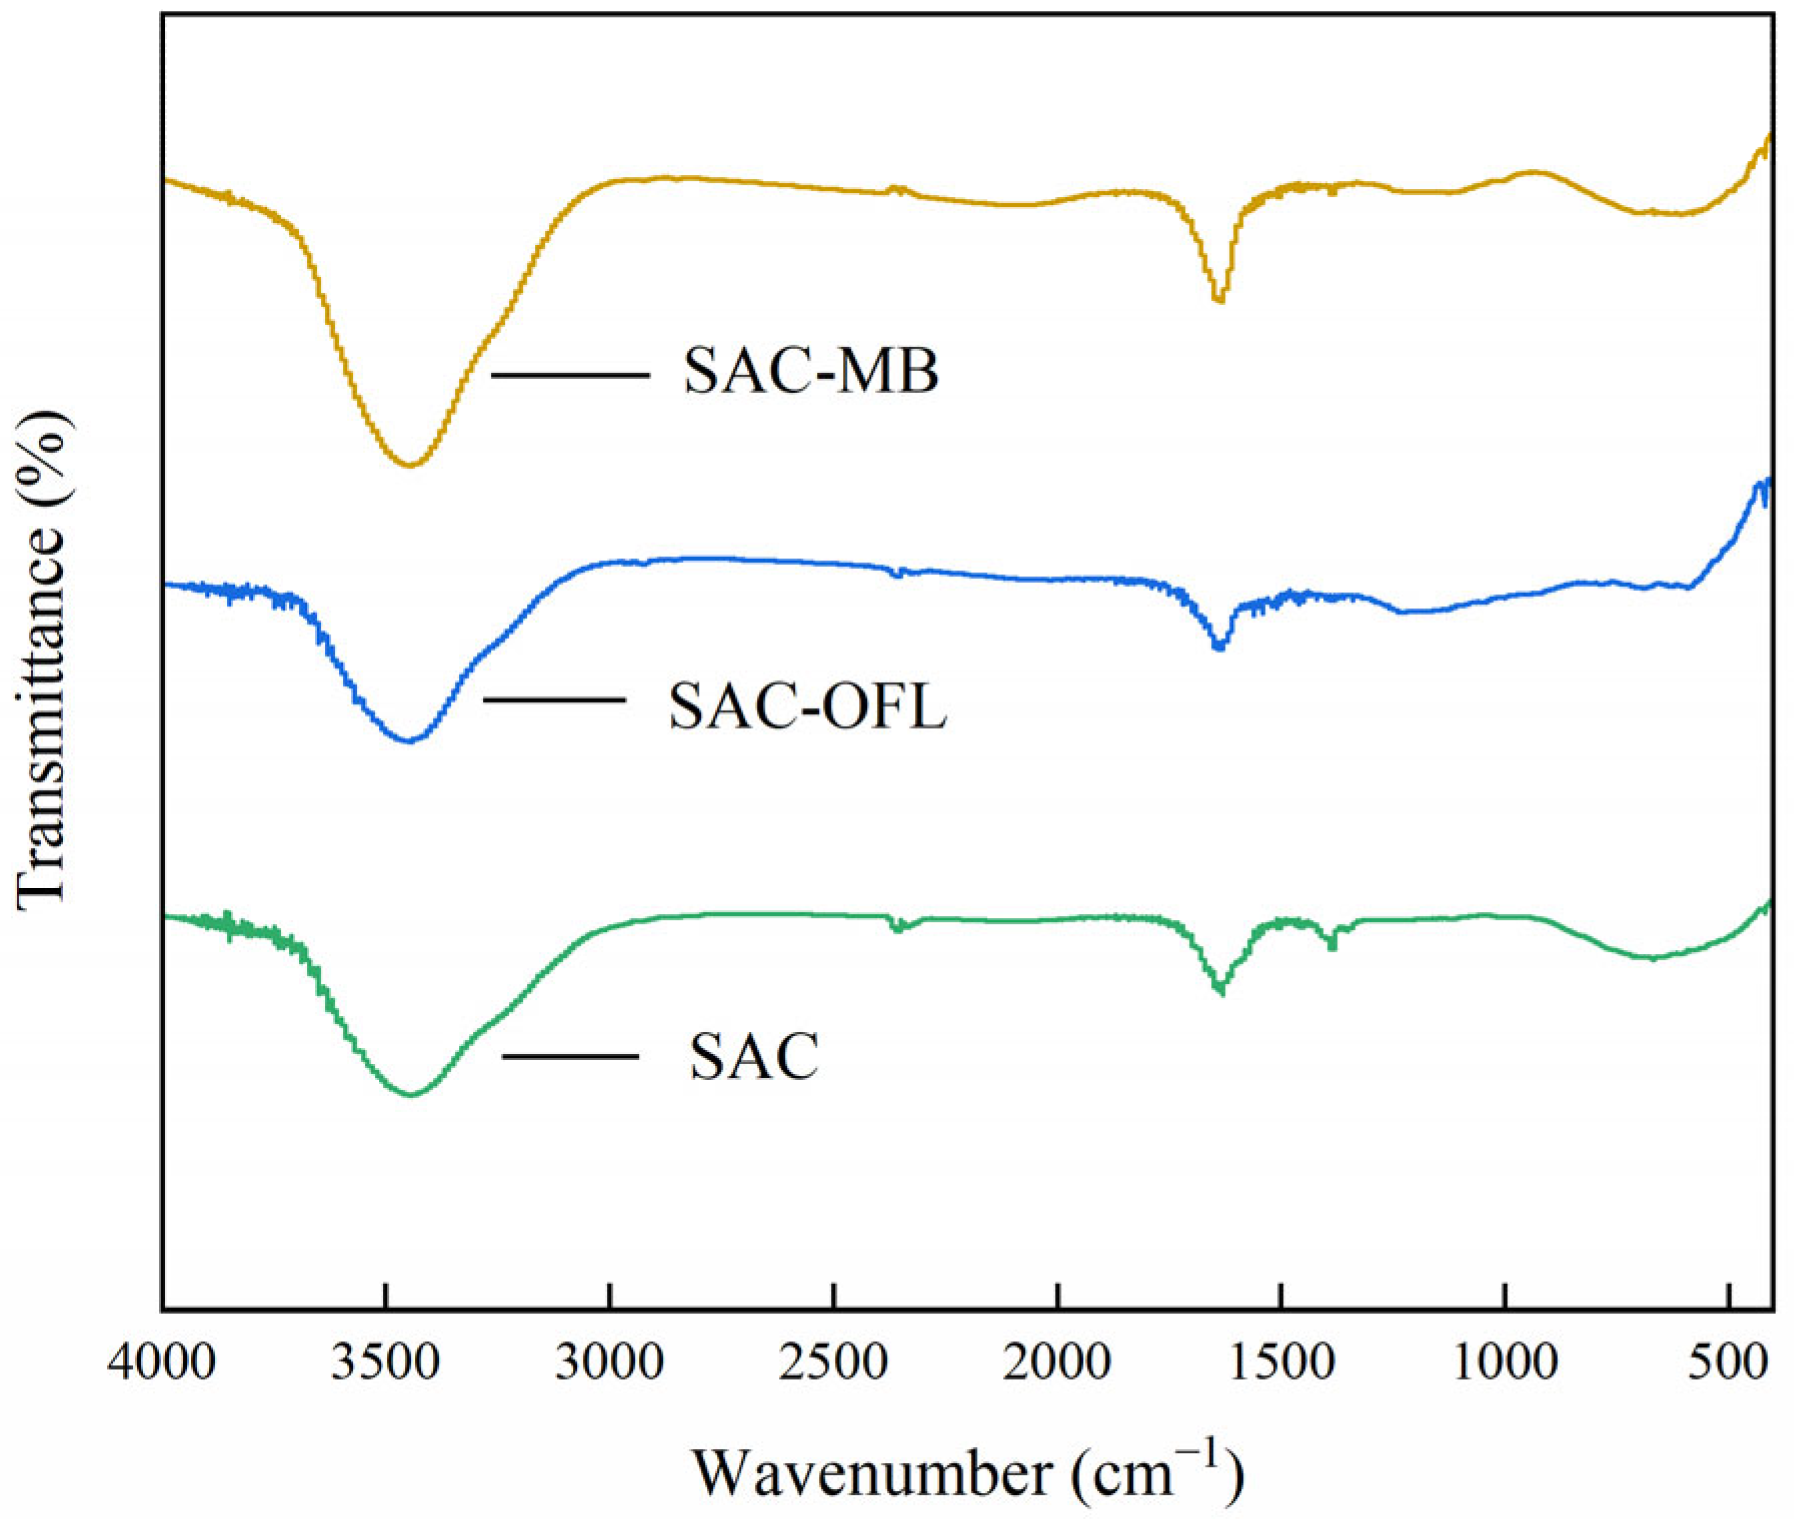
The functional groups on the SAC surface before and after the adsorption of MB and OFL were observed with an FT-IR spectrophotometer from ZEISS Merlin, Germany. The spectra obtained are shown in Figure 2.
The infrared spectrum of SAC (Figure 3) shows a series of unique vibrational bands as follows: 3200–3600 cm−1 corresponds to hydroxyl vibrations, 2300 cm−1 involves -CH vibrations in methyl groups, and 1700 cm−1 is assigned to C=O vibrations in carboxylic acids or esters. The broad peaks in the wavenumber range 3500–3000 cm−1 indicate the presence of O-H stretching vibrations in phenols, alcohols, and carboxyl groups. Furthermore, 1600 cm−1 and 1400 cm−1 are assigned to asymmetric and symmetric vibrations of carboxylic acid groups (-COOH), respectively. These spectra at approximately 3400 cm−1 have absorption bands corresponding to O-H bond elongation vibrations,1600 cm−1 bands are associated with C=C bond stretching, while bands at 1380 cm−1 correspond to the loss of C-C-C bond bending leading to a decrease in carbon content. After the adsorption of MB and OFL, the IR spectra of SAC show a change in the bands at 3200–3600 cm−1 where there is a slight shift and change in the intensity of the bands of other functional groups. This indicates that some functional groups of SAC may interact with MB dye and OFL antibiotics during adsorption. Furthermore, the peaks located at 1568 and 700–900 cm−1 were attributed to the C-C and C-H stretching vibrations of the aromatic ring, respectively. The absorption band observed at 1300 cm−1 was identified as C-O stretching vibrations from the -COO group. As described in several studies, oxygen-containing functional groups (e.g., -COOH and -OH) exhibit high binding capacity to aromatic structures through n–π interactions and hydrogen bond formation. The presence of these groups on the SAC surface promotes the adsorption of MB and OFL, and the cationic MB can be attached to the negatively charged -COOH group via electrostatic attraction. The FTIR spectra did not change significantly after the adsorption of MB and OFL on the adsorbent, and the intensity of the characteristic peaks decreased. This finding suggests that the activated carbon surface adsorbs reactive substrates via electrostatic attraction [24]. This finding indicates that no new bonds were broken or formed after adsorption, suggesting that physical adsorption occurred during MB and OFL removal.
3.2. Adsorption of Fruit Shell-Activated Carbon
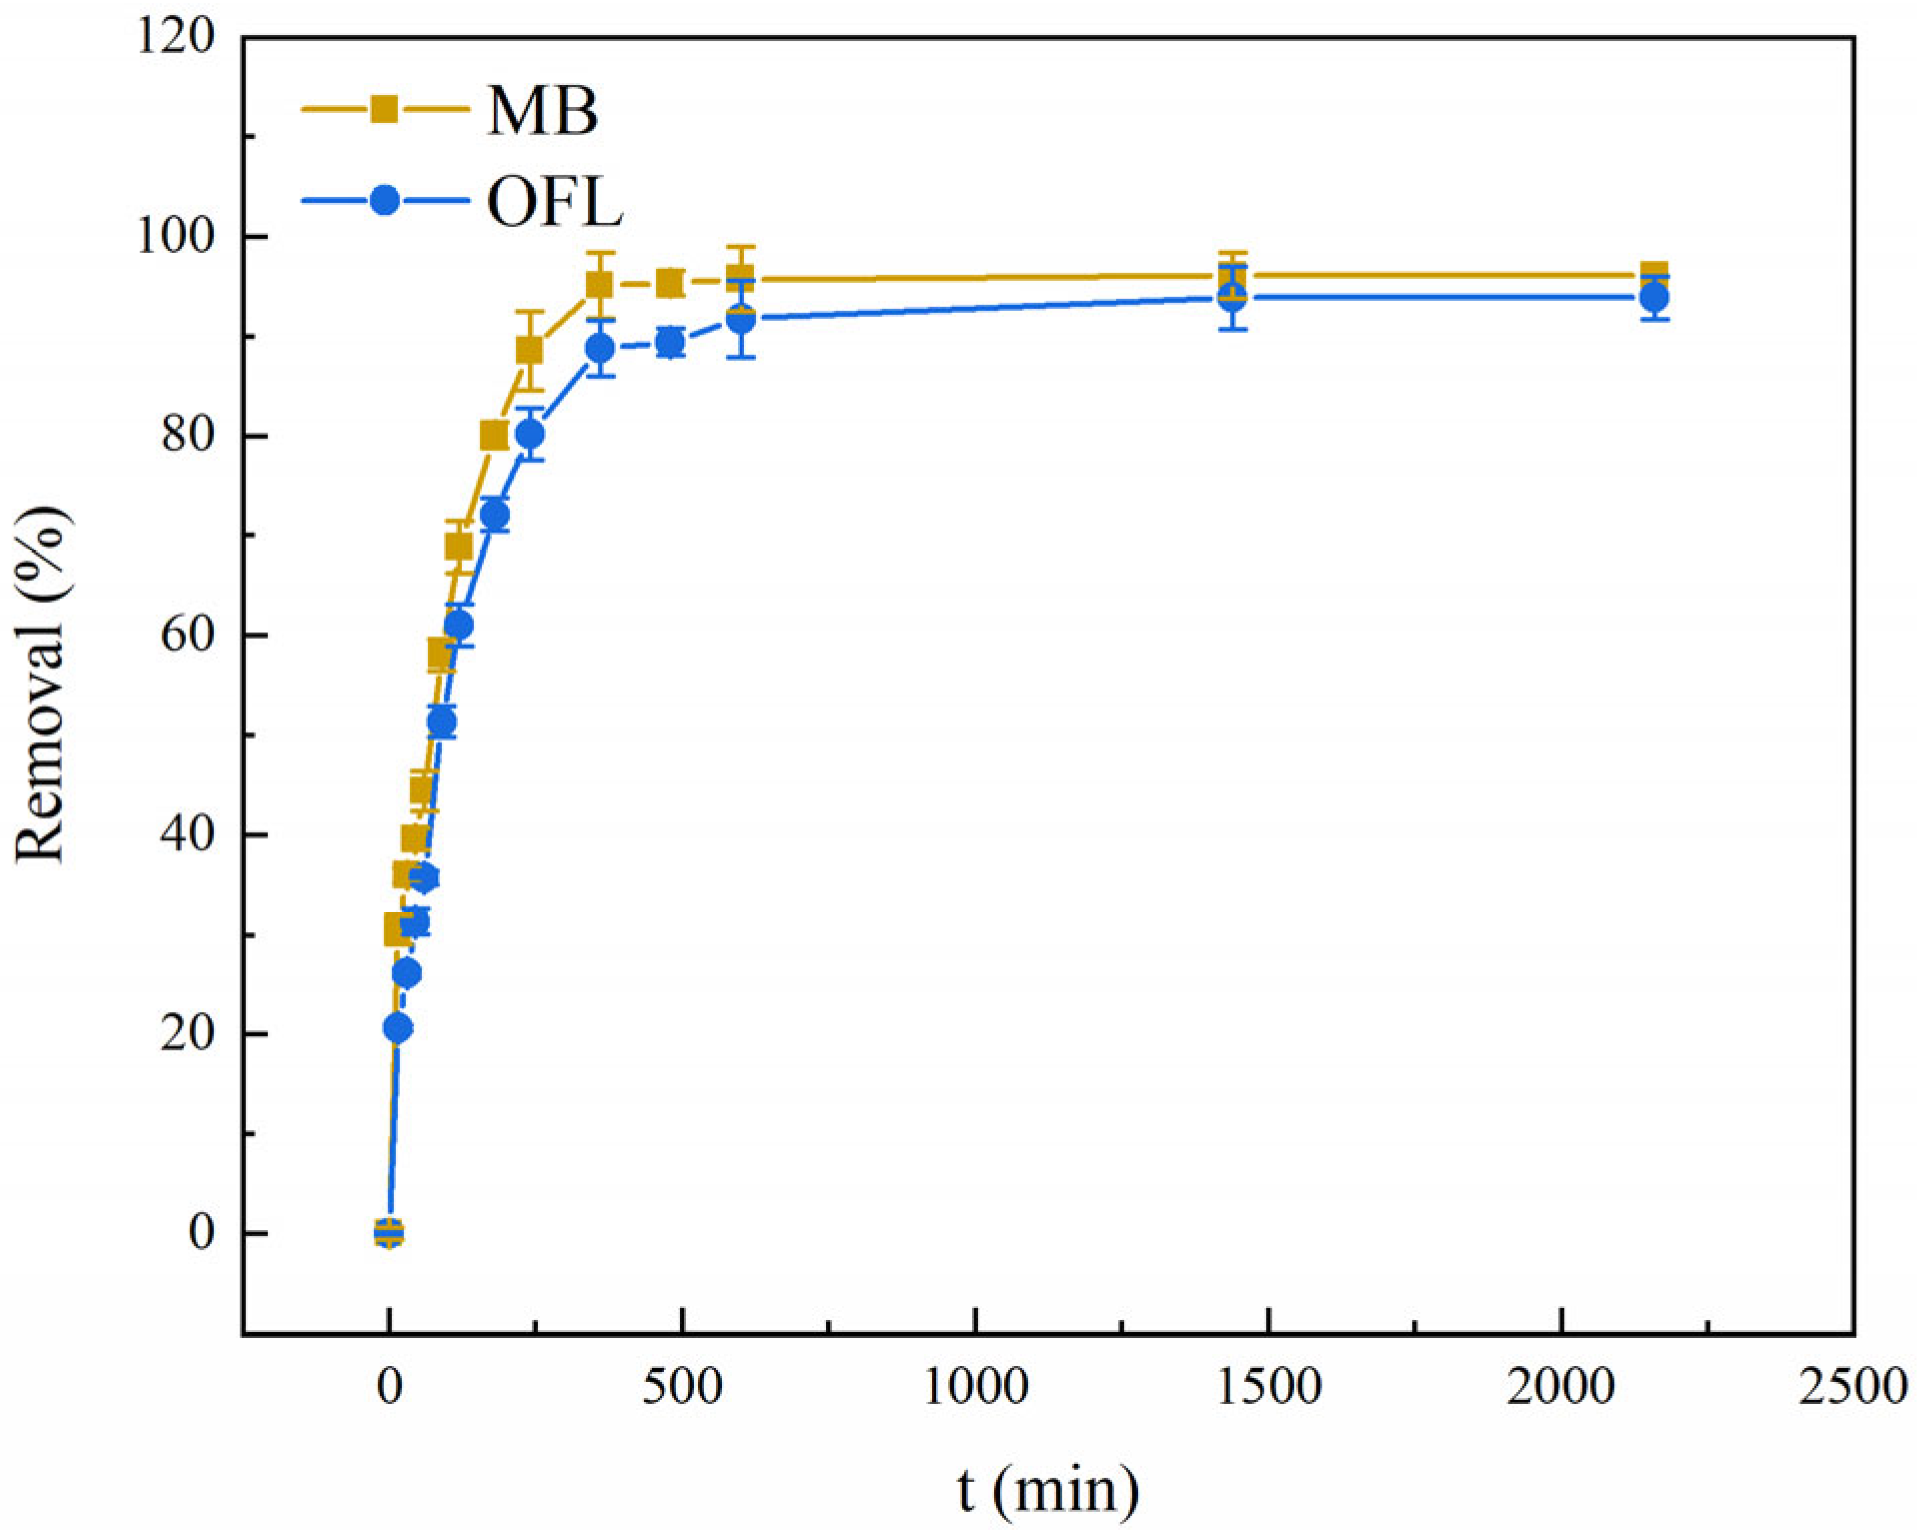
The adsorption of the activated carbon material on the solute of the solution can be seen in Figure 4. It can be seen that when the adsorption is in the early stage, the removal efficiency increases rapidly with time, with the removal efficiency of methylene blue dye and ofloxacin antibiotic reaching more than 60% within 2 h. After the activated carbon adsorption proceeds to 10 h, the adsorption of methylene blue dye and ofloxacin antibiotic on the activated carbon essentially reaches equilibrium with removal rates of 95% and 92%, after which it remained essentially unchanged. When the adsorption proceeded to 24 h, the adsorption of methylene blue dye and ofloxacin antibiotic on activated carbon reached equilibrium.
The rapid adsorption process essentially took place within the first 2 h. When the adsorption lasted up to 10 h, the adsorption of methylene blue by activated carbon reached its maximum, and the removal rate was sustained at over 90% by comparative analysis. When the adsorption proceeded to 24 h, the concentration of the remaining dye in the solution remained at dynamic equilibrium. For the convenience and uniformity of the experiment, the final equilibrium time for the adsorption of methylene blue dye by activated carbon was determined to be 24 h in this study.
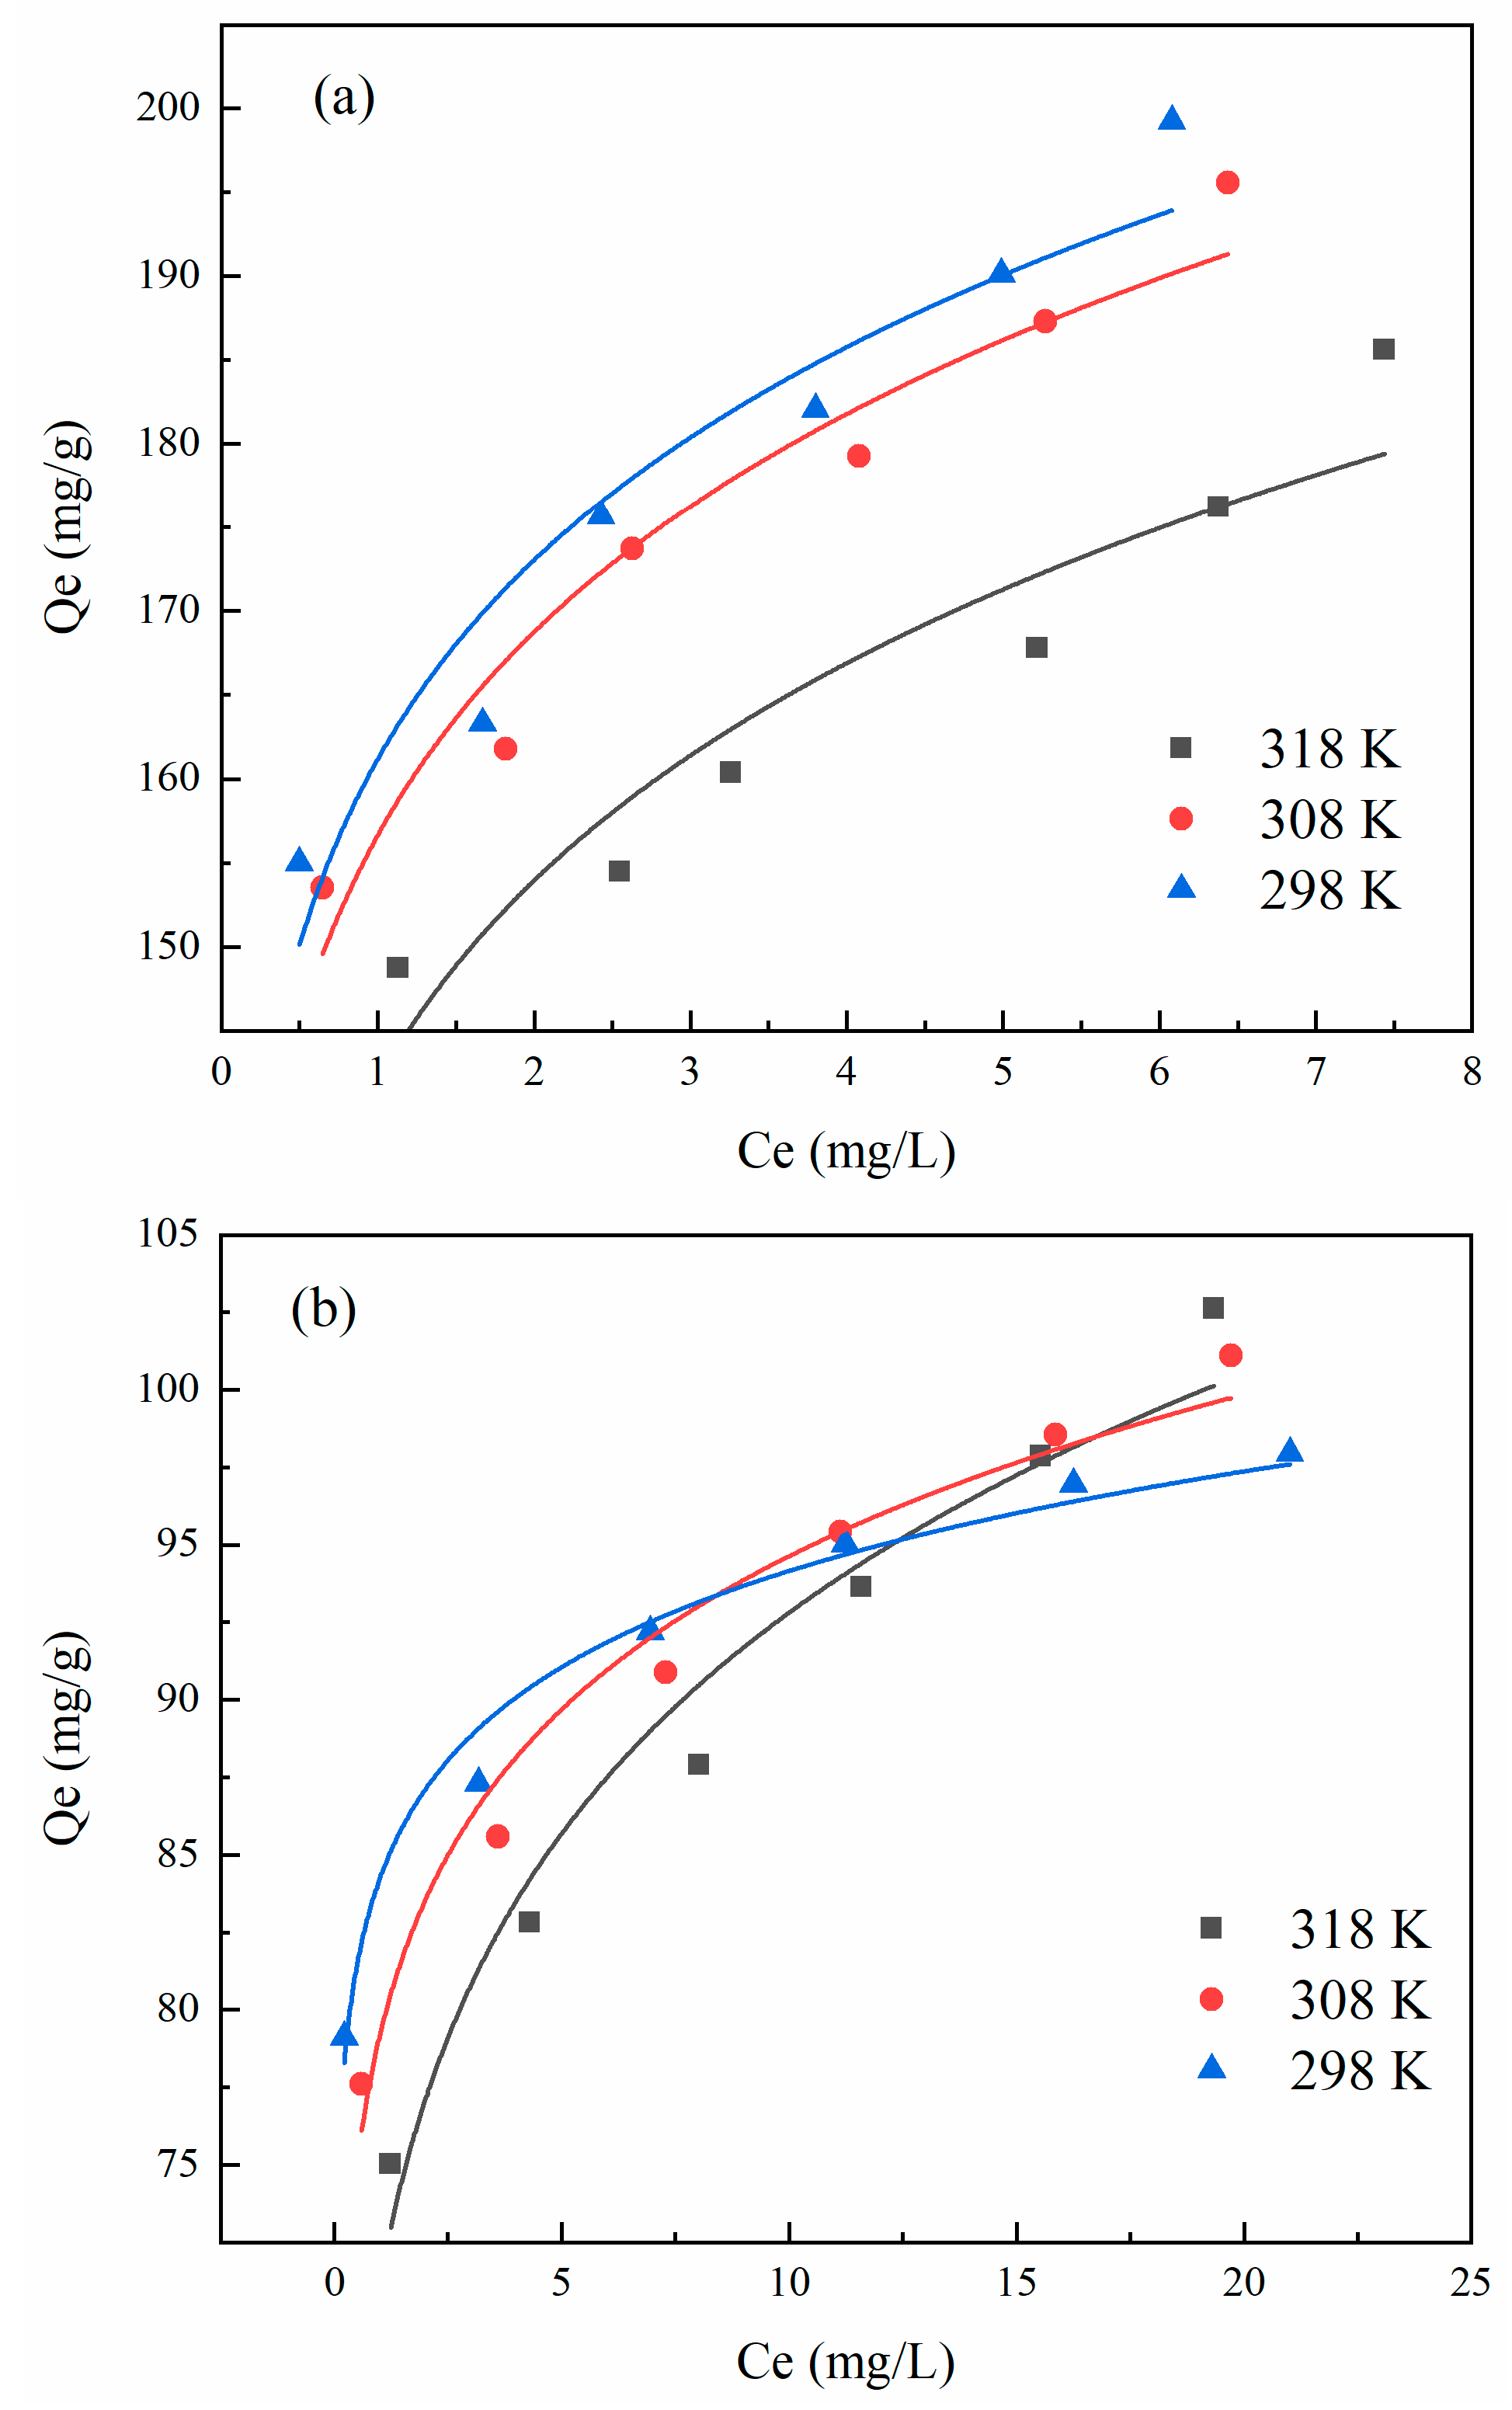
The trend of adsorption of both solutions to the equilibrium concentration of activated carbon can be seen in Figure 5, and it is evident that the adsorption of activated carbon increases rapidly with the increase in the remaining concentration of methylene blue dye in the solution. In order to better investigate the mechanism of adsorption and removal of MB and OFL on activated carbon, as well as the adsorption capacity and adsorption characteristics of activated carbon for methylene blue, two isotherm models, Langmuir and Freundlich, were performed for the above data in this experiment.
As shown in Figure S4, using the experimentally measured data, we obtained the Langmuir isotherm plot by fitting the curve with the ratio of the remaining concentration of MB and OFL to the equilibrium adsorption capacity of activated carbon as the horizontal coordinate and the remaining concentration of solution as the vertical coordinate; meanwhile, we obtained the Freundlich isotherm plot by fitting the curve with lnCe as the horizontal coordinate and lnQe as the vertical coordinate. Figure S4a,b show the Langmuir and Freundlich isotherm models for MB, respectively, while Figure S4c,d show the Langmuir and Freundlich isotherm models for OFL, respectively. It can be clearly seen from the plots that the R2 value of the Freundlich model is poorer compared to the Langmuir model. Activated carbon adsorption of MB and OFL is better in the Langmuir model than in the Freundlich model, and the specific model parameters are shown in Table 1 [37].
From the data in Table 1, it can be seen that the fitted linear coefficients R2 of the activated carbon on the Langmuir model are greater than 0.99, indicating a good linear relationship, while the R2 values of Freundlich versus Langmuir are poor. The values of the adsorption model parameters for all systems are presented in Table 1. The fit of the adsorption data (T = 298 K) is reported in the Supplementary file. The adsorption capacity of SAC increases with increasing MB and OFL concentrations. More importantly, the isotherms indicate that the adsorption capacity of SAC for MB is greater than that for OFL under the same conditions, as shown in Figure S4, and the Langmuir isotherm model fits the MB/SAC and OFL/SAC adsorption systems better than the Freundlich isotherm model. On the other hand, as shown in Table 1 in terms of the correlation, the R2 of the Langmuir model for the adsorbents was higher than that of the Freundlich isotherm model. Therefore, the adsorption isotherm model for the SAC adsorption of MB and OFL was more consistent with the Langmuir isotherm model, which confirmed that the whole adsorption process in this study was monolayer adsorption [38].
Common behaviors of all adsorption systems was observed, especially the effect of temperature on the variation of the adsorption capacity of dyes and antibiotics. The experimental data showed that an increase in temperature also increased the adsorption capacity for MB and OFL. SAC had a higher surface affinity for the dye molecules compared to other adsorbents. Saturation of the adsorbent was reached on both days. This saturation phenomenon may be the result of the formation of a limited number of adsorbent layers (one or more possible) on the adsorbent’s surface. It is obvious that the temperature increased the adsorption capacity of SAC for both solutions. The increase in the adsorption capacity may be related to the increase in the mobility of MB and OFL molecules, and the temperature promoted the interaction of both solutions with the main adsorption receptor sites on the surface of the adsorption SAC [4]. In summary, the adsorption of MB and OFL on activated carbons is in accordance with the Langmuir model, so the adsorption behaviour of MB and OFL by activated carbons is considered monolayer adsorption [39].
Figure S5 shows the fitted primary and secondary kinetic curves for the adsorption of methylene blue dye and ofloxacin antibiotic by activated carbon. It can be understood that the linearity of the fitted secondary kinetics is higher than that of the fitted primary kinetics, and the proposed secondary kinetic coefficients of determination R2 > 0.99 for MB and OFL are higher than the proposed primary kinetic coefficient of determination. The proposed primary kinetic coefficient of determination R2 for MB is 0.9046 and the proposed first-order kinetic coefficient of determination R2 for OFL is 0.9386, indicating that the adsorption of MB and OFL by SAC was a proposed second-order kinetic process with both chemisorption and physical adsorption mechanisms.
This is a good indication that the proposed secondary kinetics are closer to the simulation of the adsorption experiments, so the proposed secondary kinetic model can better fit the adsorption of MB and OFL by activated carbon, showing that the initial adsorption is particularly fast, and the later adsorption gradually becomes slower.
The ∆G, ∆H, and ∆S of the adsorption were calculated and are tallied in Table 2. The ∆G values are negative from 298 K to 318 K. Therefore, the adsorption is spontaneous [37]. The magnitude of the ∆G value represents the magnitude of the spontaneity of the adsorption, and the higher the negative value, the easier the adsorption proceeds. The adsorption of MB with ∆H < 0 and ∆S > 0 in the experiments was spontaneous at all temperatures, and the adsorption of OFL with ∆H < 0 and ∆S < 0 in the experiments was more likely to proceed spontaneously at low temperatures. In the experiments for the adsorption of OFL, as the temperature increases, |∆G| decreases, which leads to a lower adsorption rate at high temperatures than at low temperatures. A negative value of ∆S indicates that the disorder decreases as the adsorption proceeds, and a positive value of ∆S for MB indicates that the entropy of the system increases as the adsorption proceeds. It is noteworthy that ∆S > 0 for the adsorption of MB, which could explain this behavior considering that the MB molecules change their interaction with the primary adsorption site during the removal process. The results show that temperature does not act in exactly the same way in the adsorption of both solutions. Due to thermal stirring, the temperature promotes the binding of MB dye molecules to the adsorbent SAC but does not promote the binding of OFL through the adsorption sites, and an increase in the temperature can lead to a decrease in the space on the adsorbent, especially in the occupied receptor sites [4].
3.3. Effect of Single Factors on Adsorption Capacity
3.3.1. Effect of pH
The pHpzc measurement was designed as a specific experiment to determine the pHpzc of the samples: 50 mL of the 0.01 mol L−1 NaCl solution was poured into a closed conical flask. We then added 0.01 mol L−1 HCl and 0.01 mol L−1 NaOH solutions. Therefore, 0.15 g of the AC sample was added, and the final pH was measured after shaking for 24 h at 298 K and 200 r/min in a constant-temperature shaker. pHpzc is the point where the curve pHfinal intersects with the line pHfinal = pHinital. The pH of the solute ion can lead to ionization and changes in the surface charge of the adsorbent, thus affecting the adsorption process of ofloxacin. The results showed that the pHpzc of this sample was approximately 8 [16].
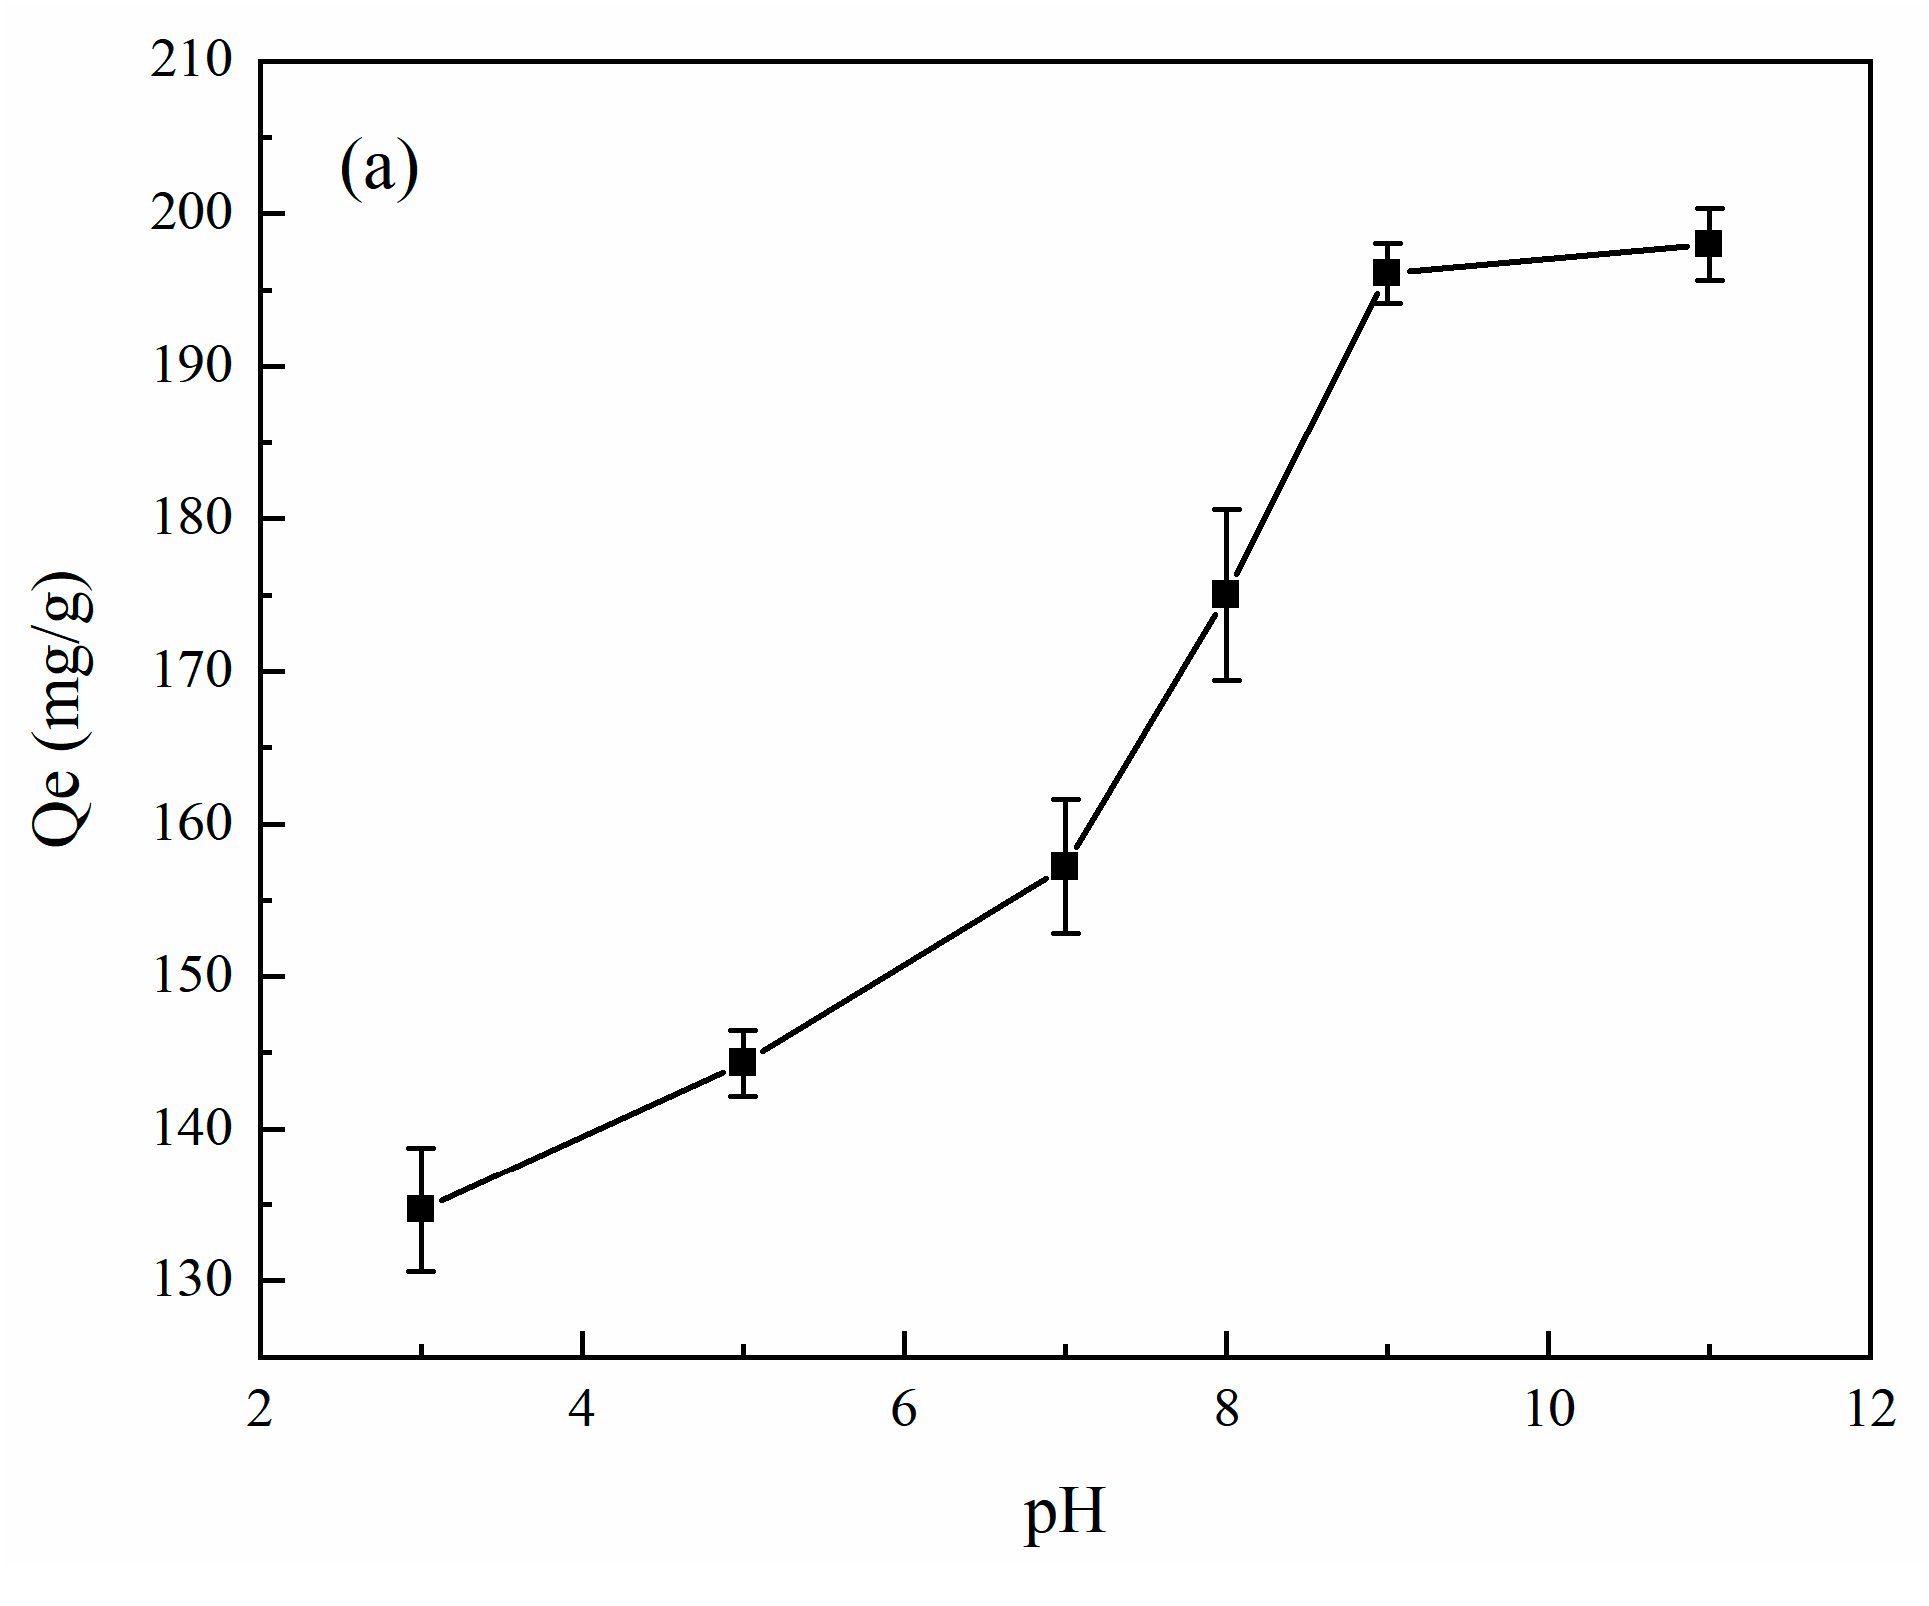
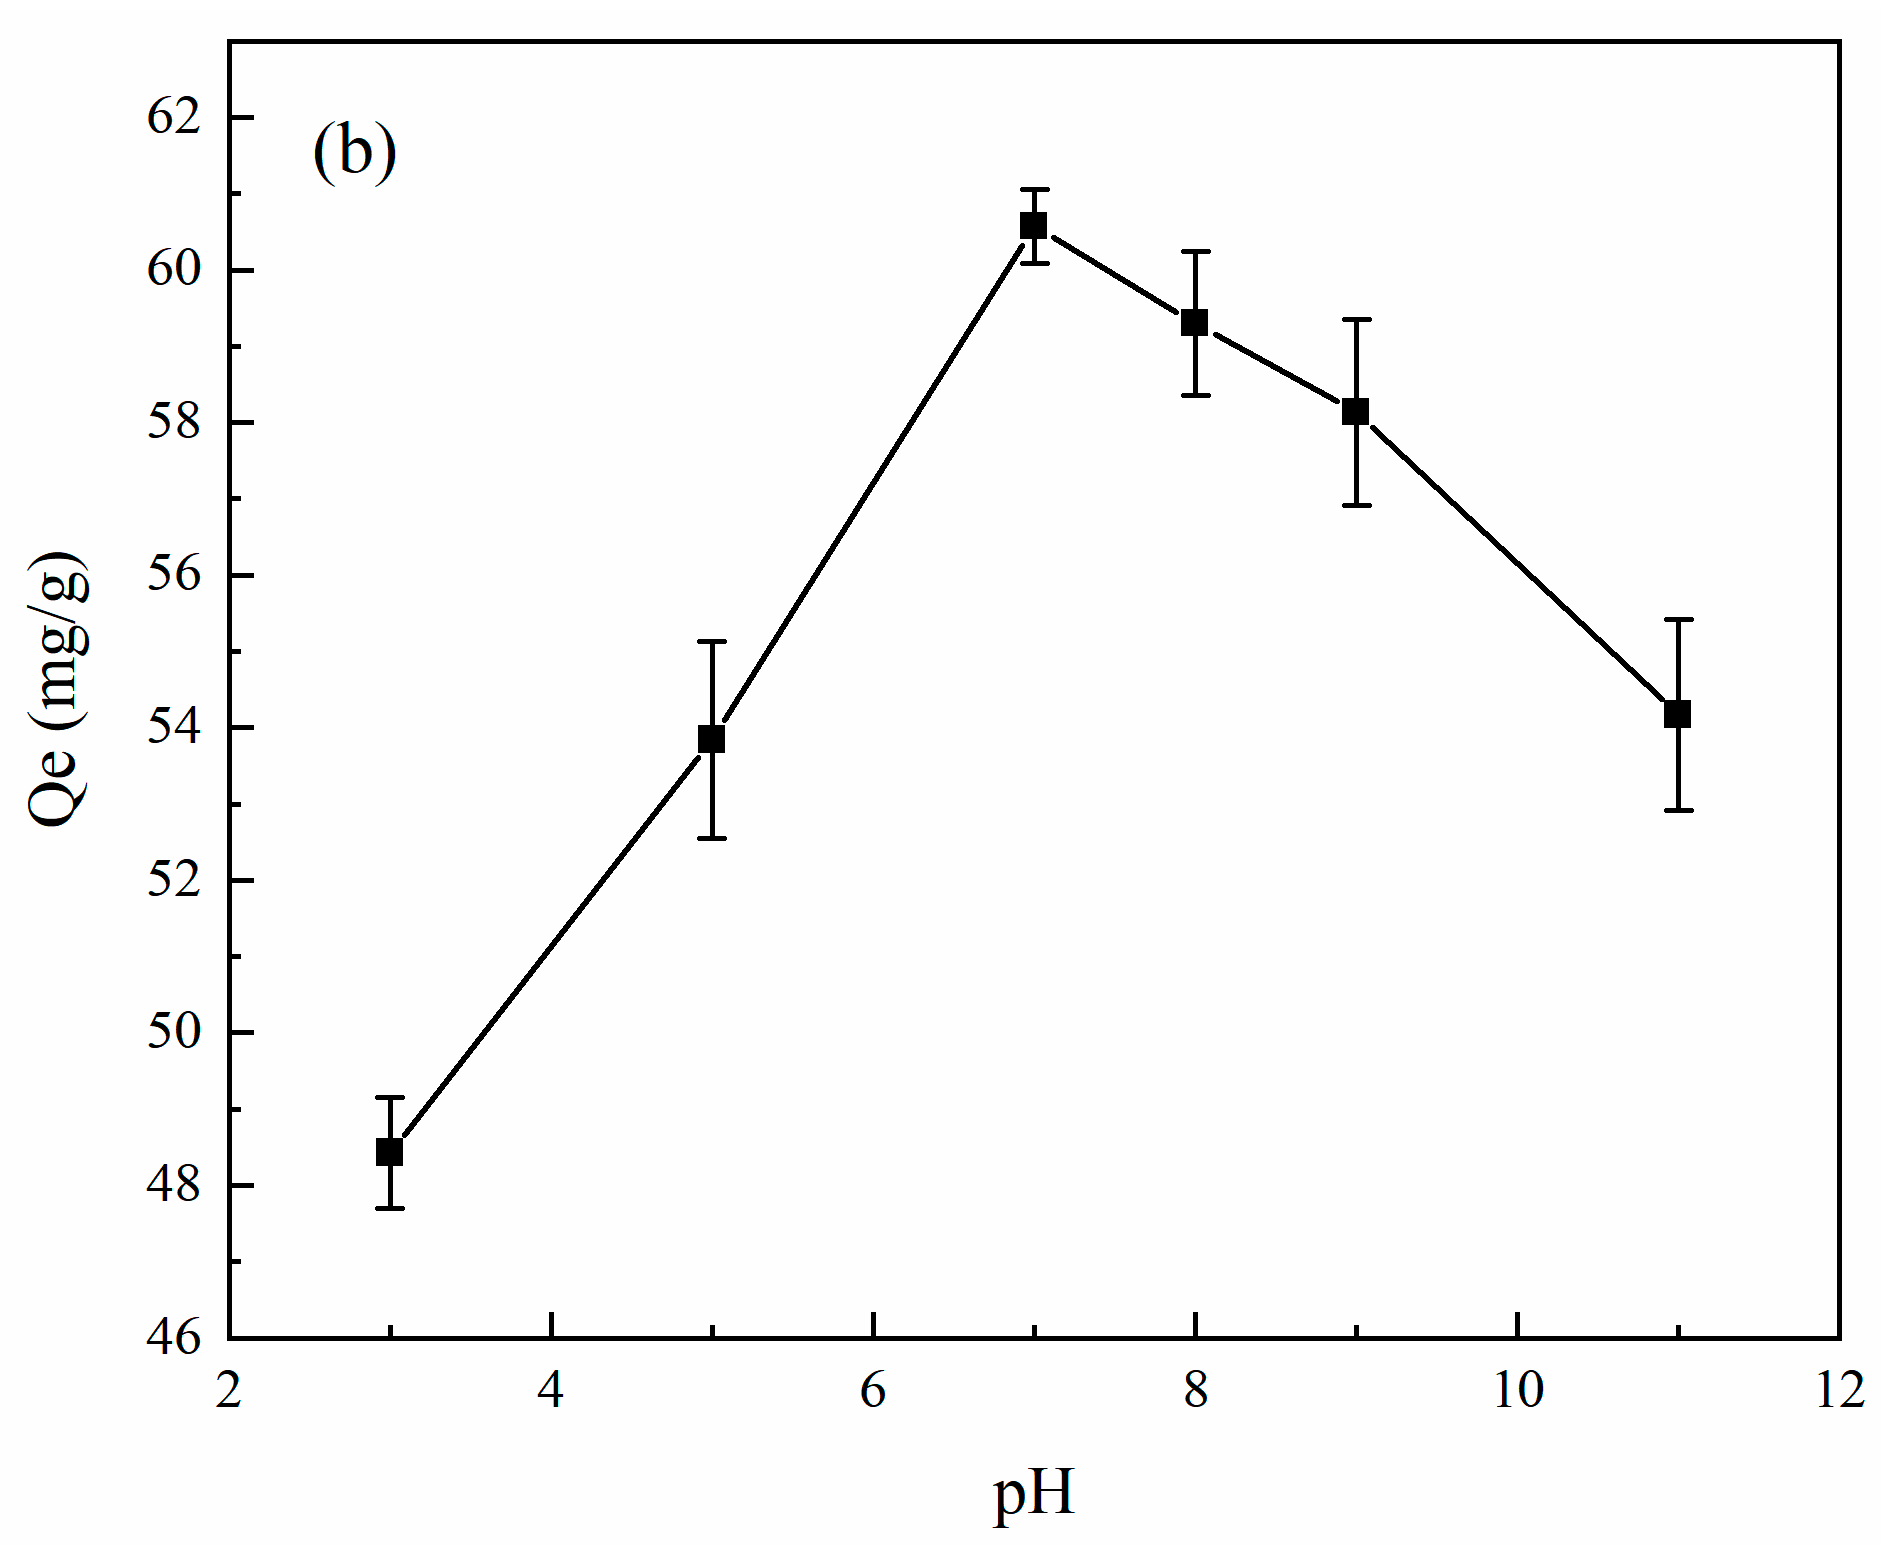
The pH of the adsorbent directly affects the adsorption capacity, so a control experiment was established to investigate the adsorption capacity of MB and OFL at initial concentrations of 20 mg L−1 and 30 mg L−1 and SAC dosing of 0.1 g L−1 and 0.25 g L−1 at 298 K, respectively. As can be seen from Figure 6, the adsorption of methylene blue by activated carbon increased sharply with the increase in pH first, and then increased slowly when the pH was greater than 9. As the solution pH changed from 3 to 11, the adsorption of activated carbon increased from 134.70 mg/g to 197.99 mg/g. The adsorption of activated carbon on ofloxacin showed a process of increasing and then decreasing as the solution pH changed from 3 to 7. The adsorption amount of activated carbon increased from 48.43 mg/g to 60.57 mg/g and decreased from 60.57 mg/g to 24.17 mg/g as the pH of the solution changed from 7 to 11.
It can be seen that the adsorption of MB is more effective in an alkaline environment and OFL is more effective in a neutral environment, and the adsorption of OFL is affected by either a strong acid or strong alkaline environment. The reason for this phenomenon may be that activated carbon shows a negative charge on its activated carbon surface in a solution with pH 11, which can react with the cationic basic dye methylene blue via electrostatic adsorption, contributing to a significant increase in the adsorption of activated carbon, while OFL hydrolysis molecules are present in three forms in an aqueous solution. When the pH value is acidic, the ofloxacin hydrolysis molecule is mainly present in the form of cations, and when the pH value is basic, the ofloxacin hydrolysis molecule is mainly present in the form of anions. At pH values between 6 and 8, most of the amphoteric ions in the solution have different pH values. When pH > 1, the surface of activated carbon is negatively charged. The ofloxacin hydrolysis molecule is present in the form of cations, and both are present in the form of cations and electrostatic attraction between the two occurs, causing the removal rate to continuously increase. When the pH is greater than 7, the activated carbon surface and the ofloxacin hydrolysis molecules have the same charge, and they are electrostatically repelled, so the removal rate and the equilibrium adsorption amount decrease. It is also possible that the cation exchange, hydrophobic interactions, and electron donor–electron acceptor interactions that occur during adsorption led to the best removal of ofloxacin occurring at a pH between 7 and 8 [3].
3.3.2. Effect of SAC Dosing
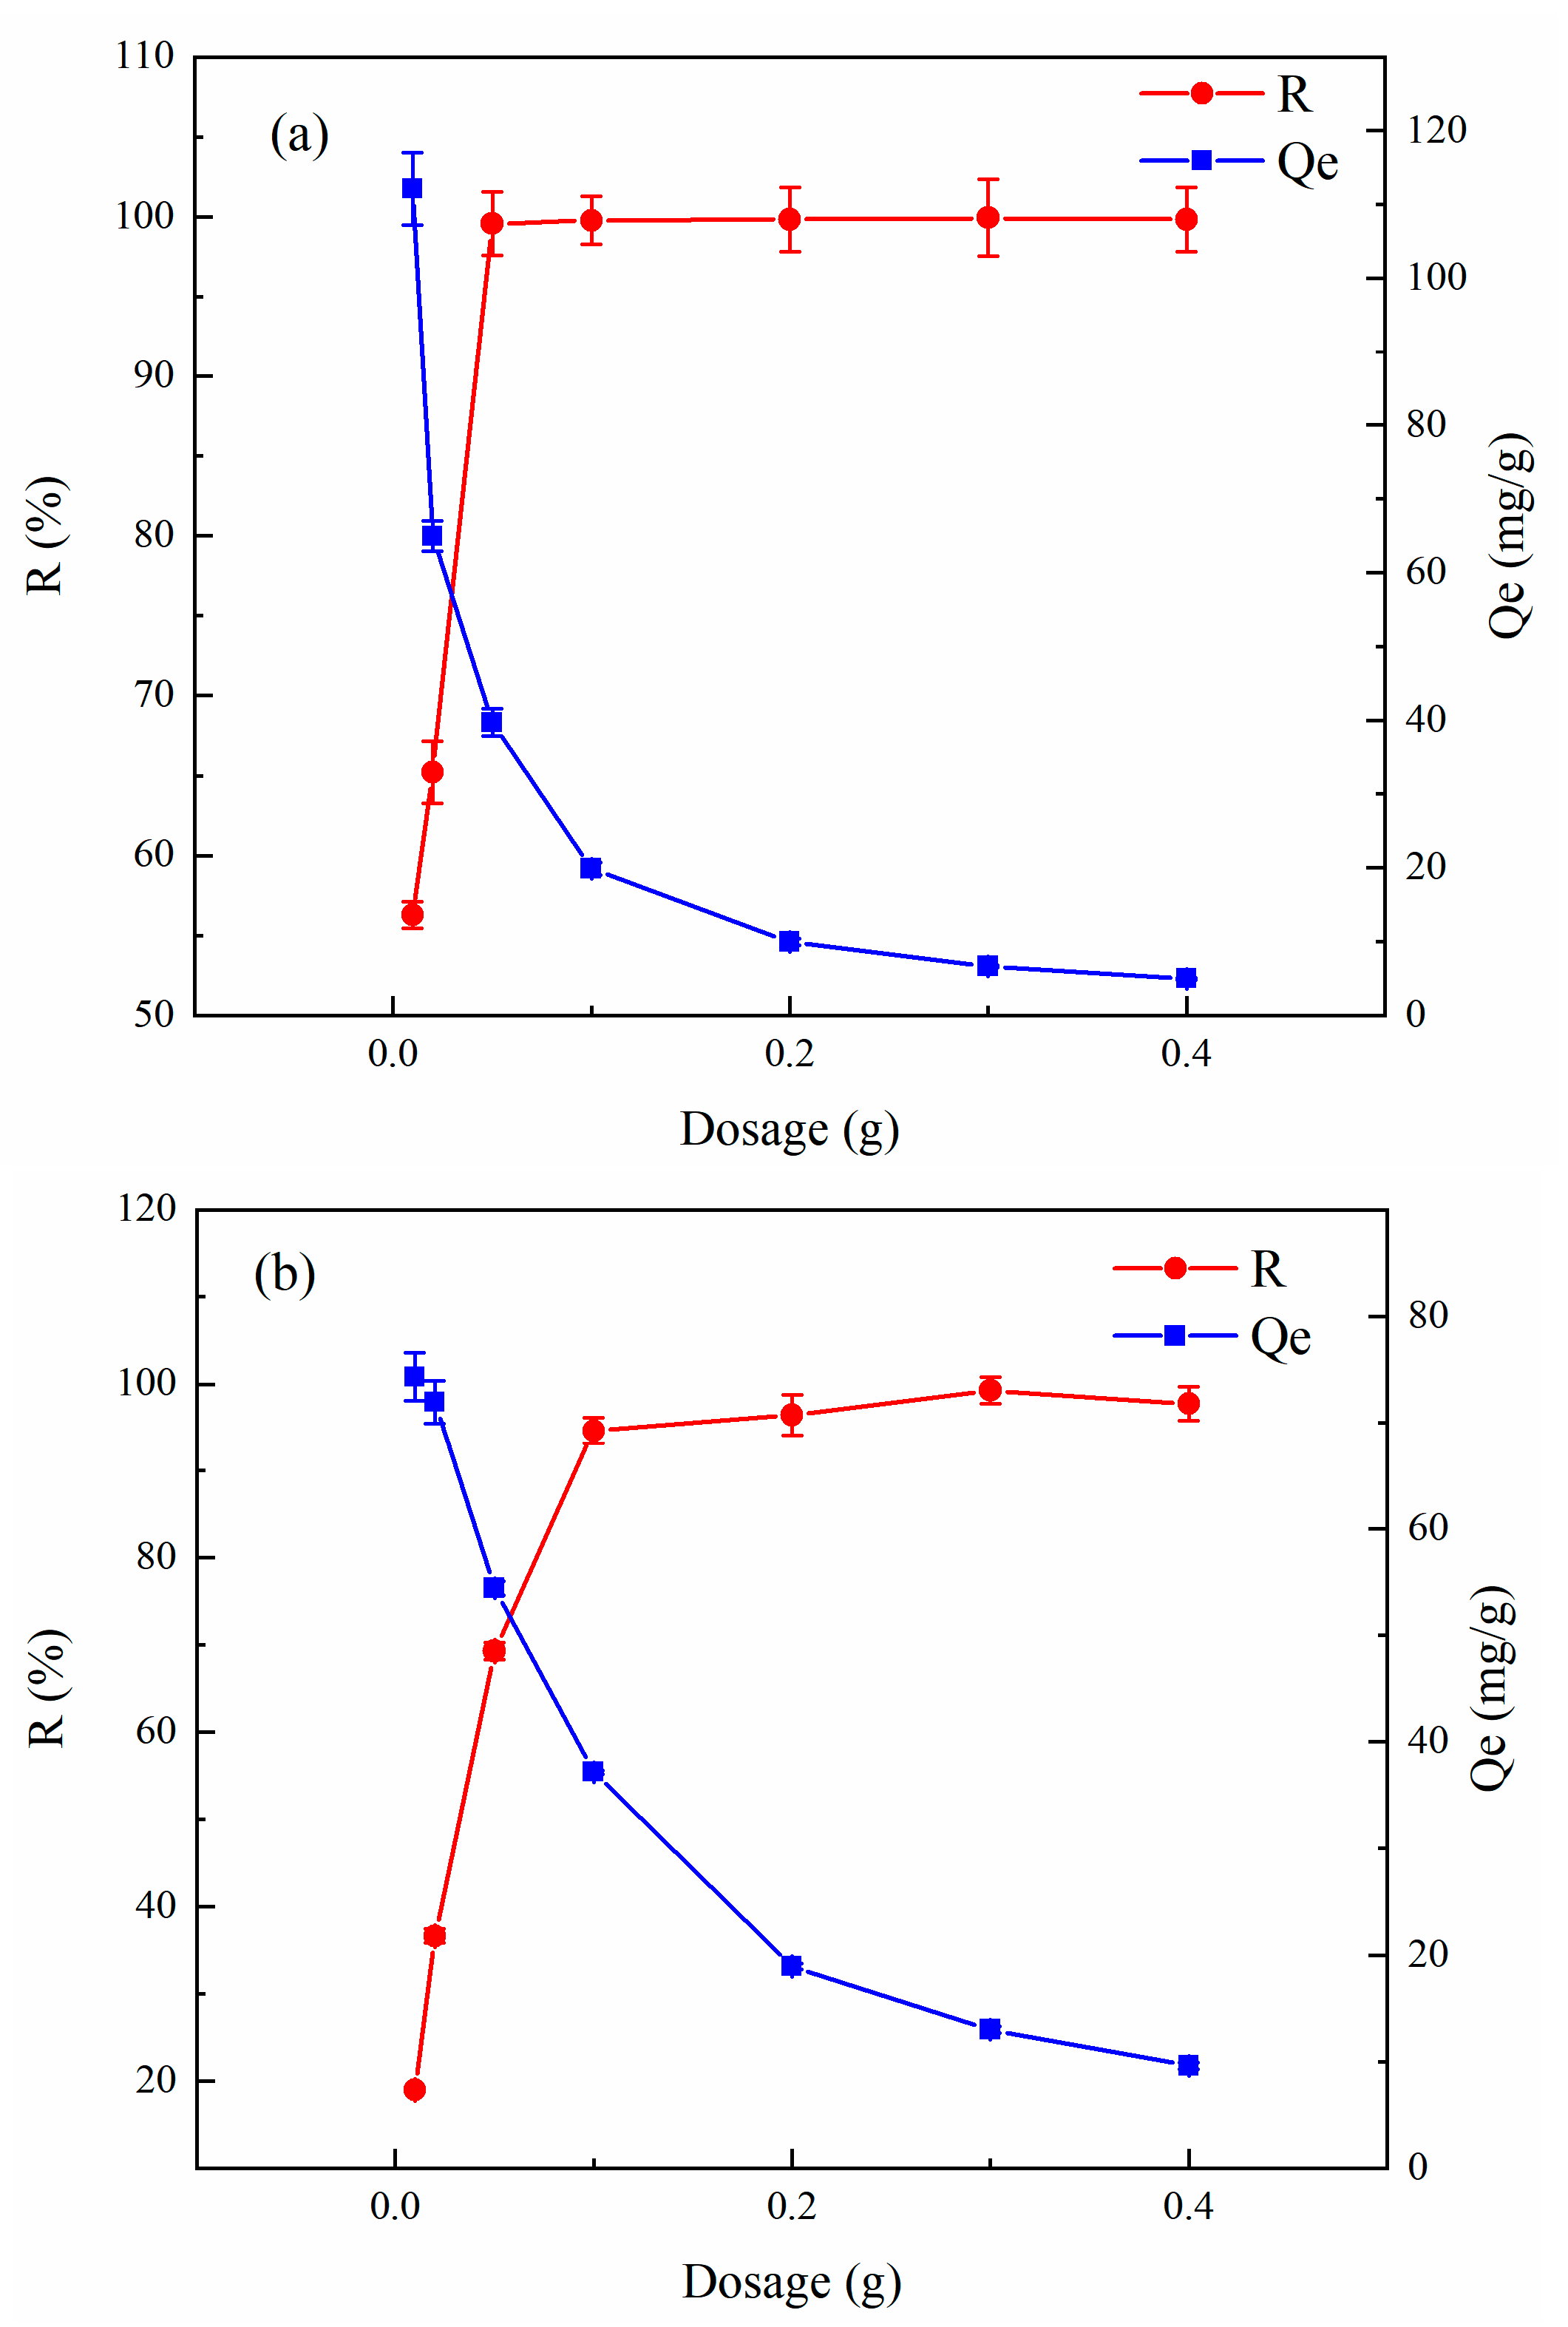
The adsorption capacities of MB at an initial concentration of 20 mg L−1 and OFL at an initial concentration of 30 mg L−1 were investigated at pH 8 and 298 K for different SAC dosing rates, respectively. The effect of activated carbon dosing on the removal rate and equilibrium adsorption of methylene blue and ofloxacin is shown in Figure 7. As the amount of activated carbon dosing increased from 0.05 g/L to 2 g/L, the solution removal rate first increased rapidly and then the growth rate tended to slow down. The amount of adsorption gradually decreased, and the rate of decrease tended to be moderate.
This is because, in the beginning, as the amount of activated carbon increases, the adsorbent molecules can rapidly occupy sufficient adsorption sites on the adsorbent’s surface, and therefore, the removal rate of the adsorbent grows rapidly. The equilibrium adsorption capacity gradually decreases with the increase in activated carbon dosing. Because the adsorbent hydrolysis molecules are finite, the equilibrium adsorption capacity decreases as the excess adsorbent competes for the finite adsorbent. The removal rate of MB approaches 100% when the amount of activated carbon is 0.05 g/L and the removal rate of OFL approaches 100% when the amount of activated carbon is 0.1 g/L. Adding more activated carbon to the solution barely increases the removal efficiency but does decrease the equilibrium adsorption capacity. Therefore, the dosing amounts of 0.02 g/L and 0.05 g/L were selected for the subsequent adsorption experiments to achieve both effective removal and the efficient use of activated carbon.
3.3.3. Effect of Initial Concentration
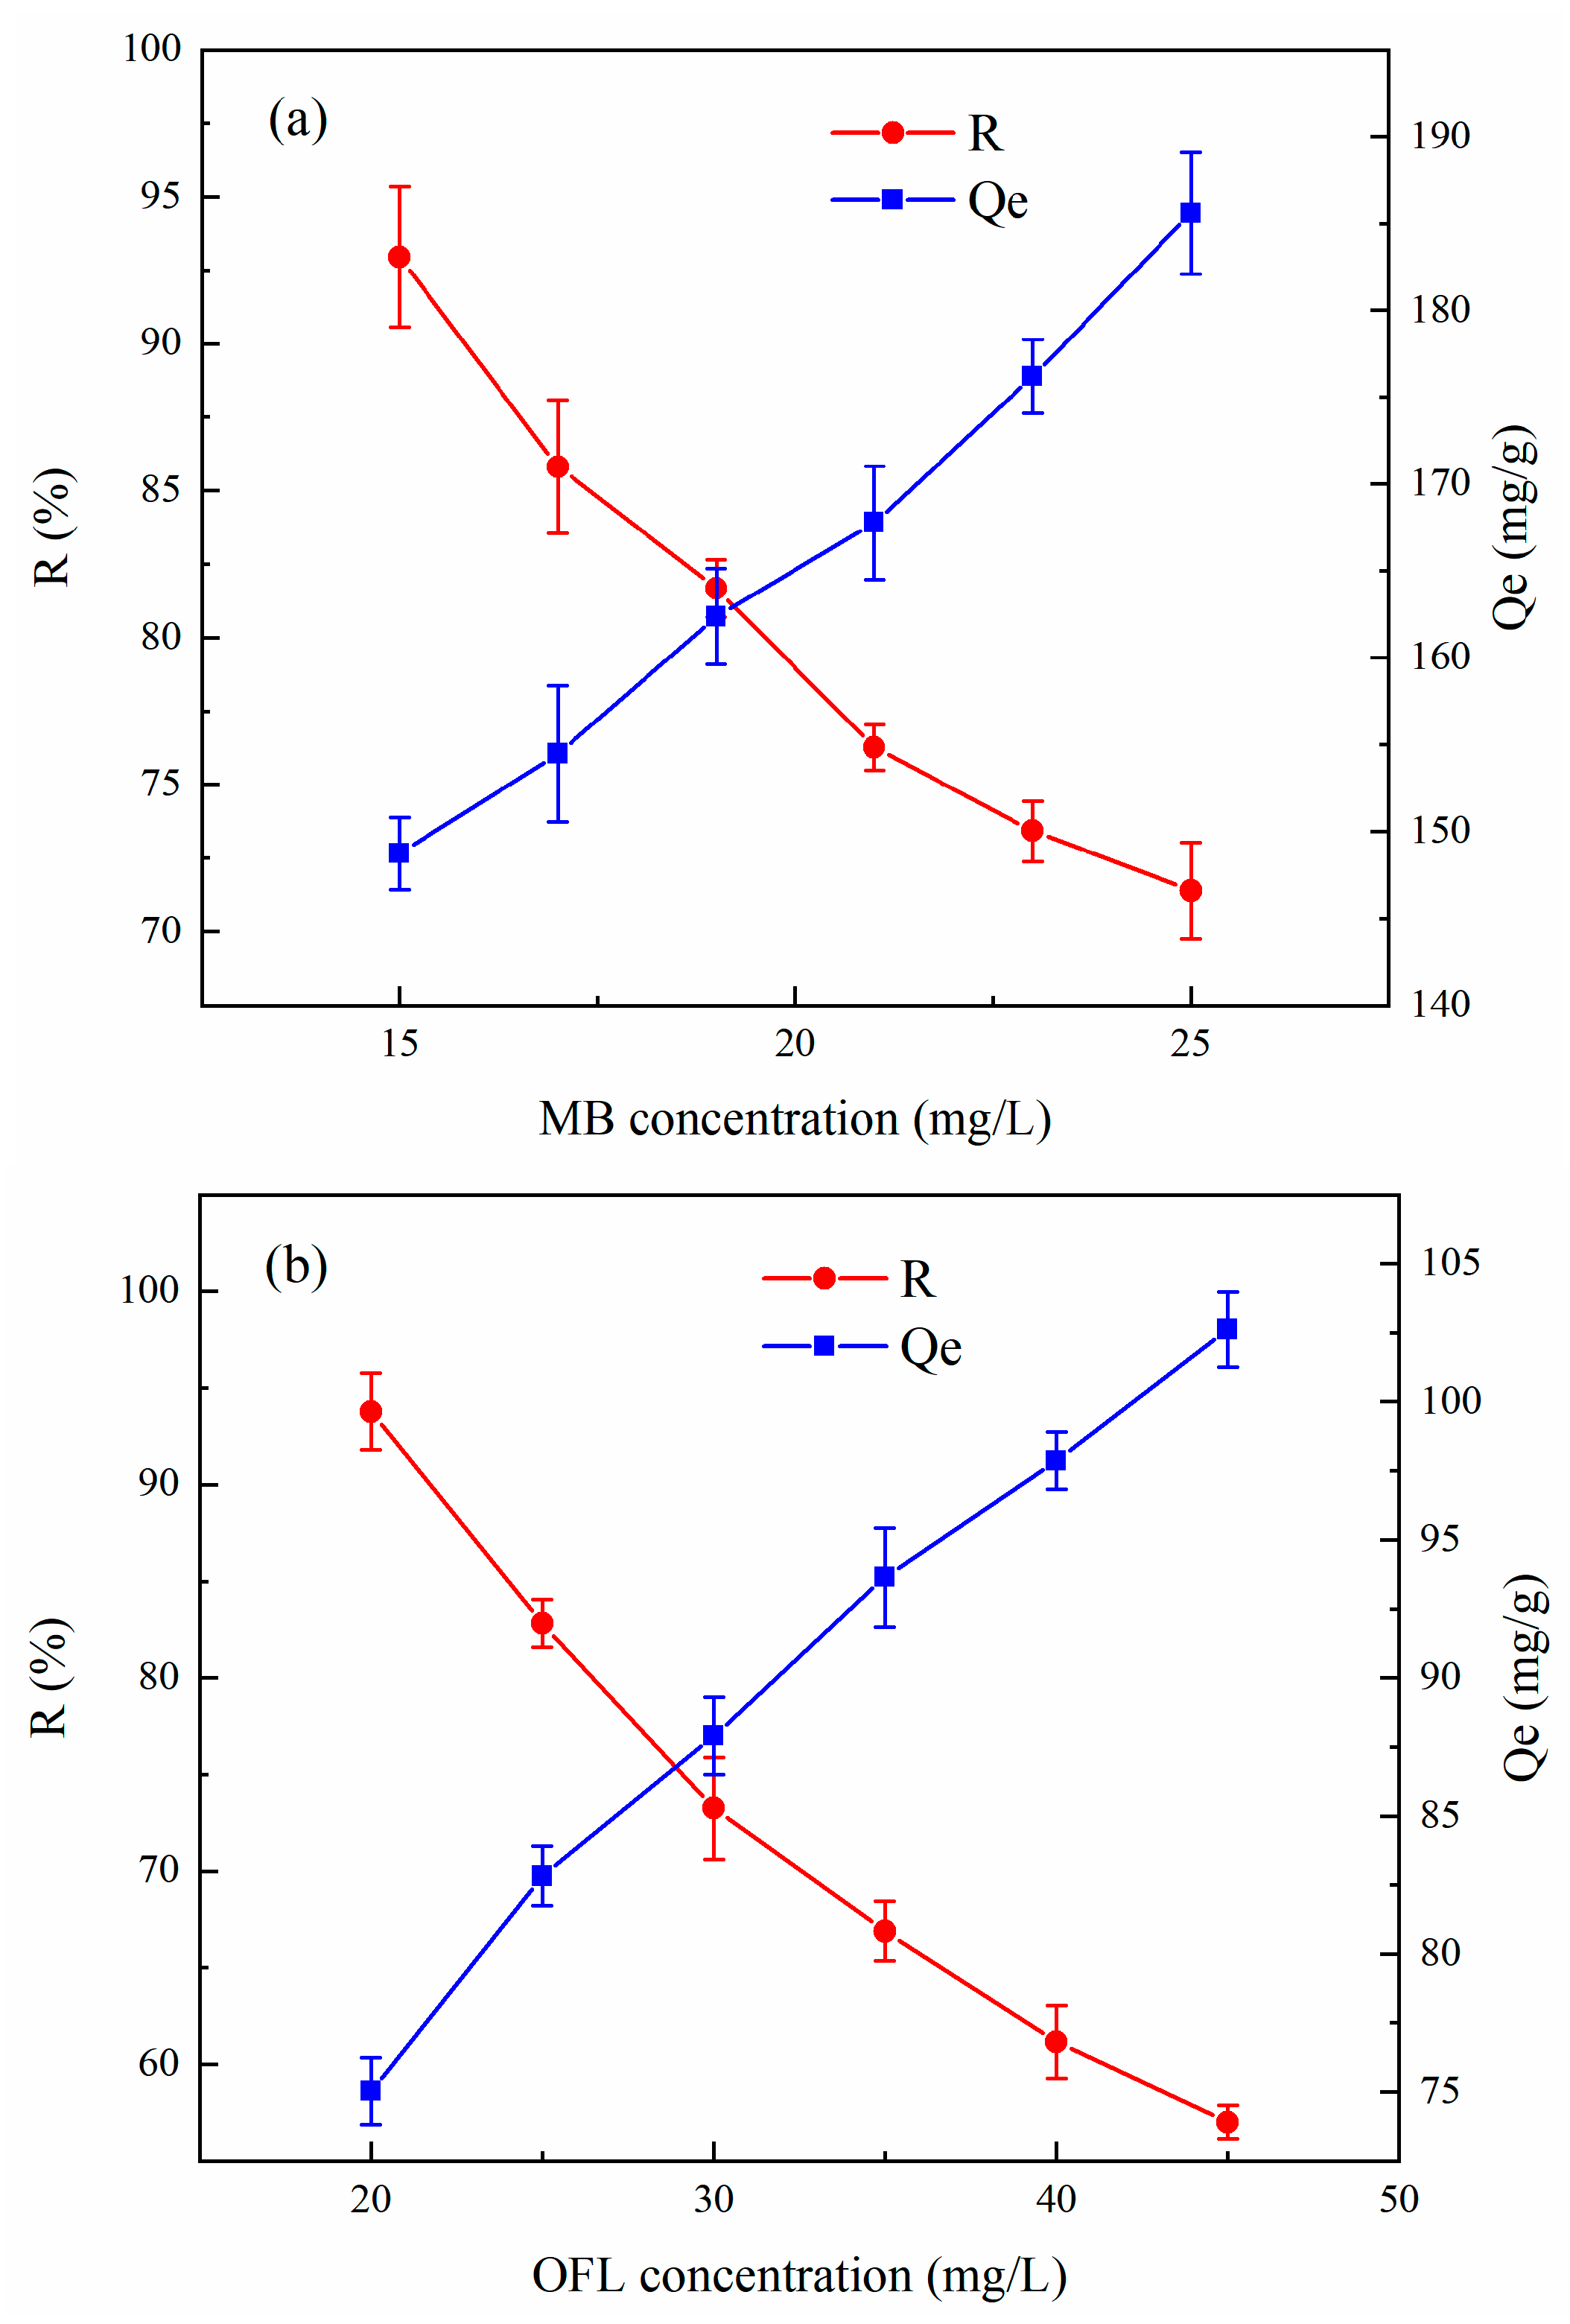
The variation of the adsorption capacity and removal efficiency of MB and OFL solutions at pH 8 and a temperature of 298 K was examined with the initial concentrations of SAC of 0.1 g L−1 and 30 mg L−1, respectively. Figure 8 shows the effect of the initial concentrations of methylene blue and ofloxacin on the removal rate and the equilibrium sorption capacity, where the removal rate decreases and the equilibrium sorption capacity increases with increasing initial concentrations of methylene blue and ofloxacin.
Because the effective free adsorption sites on activated carbon are limited, resulting in a gradual increase in adsorbent hydrolysis molecules competing for limited surface adsorption sites, the removal rate decreases with an increasing initial concentration. As the concentration of ofloxacin increased, the driving force behind the transfer between the solid and liquid increased, and this driving force drove the hydrolysis molecules through the native solution to the adsorbent surface, so the adsorption amount increased. As the concentration increased, although the adsorption amount increased, the adsorption was not very effective at high concentrations because the number of active sites on the activated carbon was not sufficient for the large number of hydrolyzed molecules. Therefore, the ratio of the solution’s concentration to the activated carbon dose should not be too large when carrying out the adsorption of dyes and antibiotics on fruit shell-activated carbon.
3.3.4. Effect of Coexisting Ions
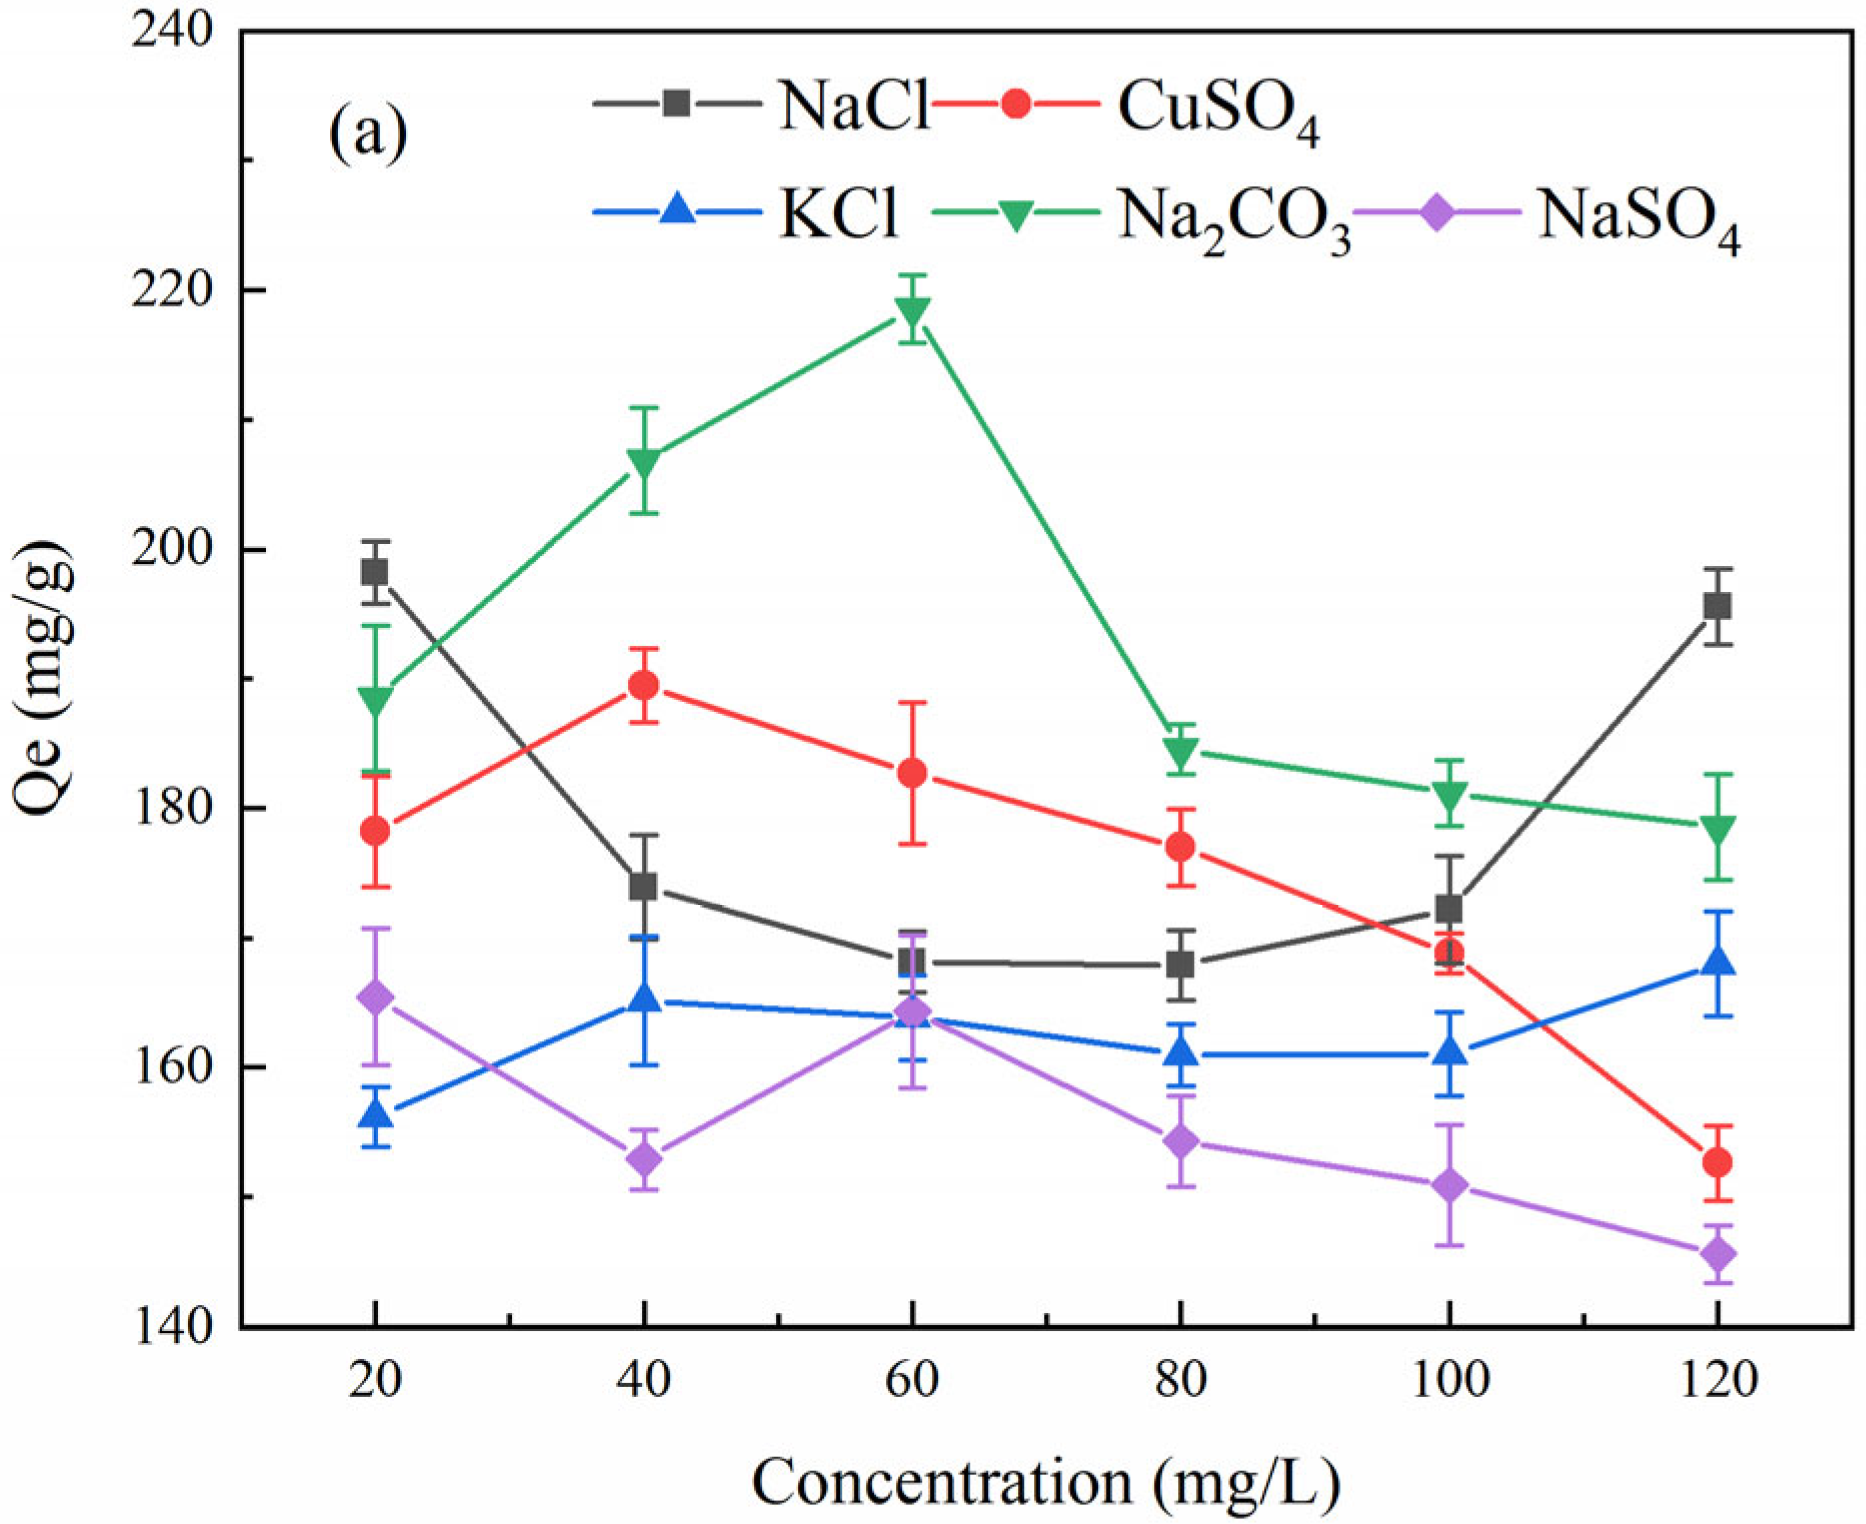
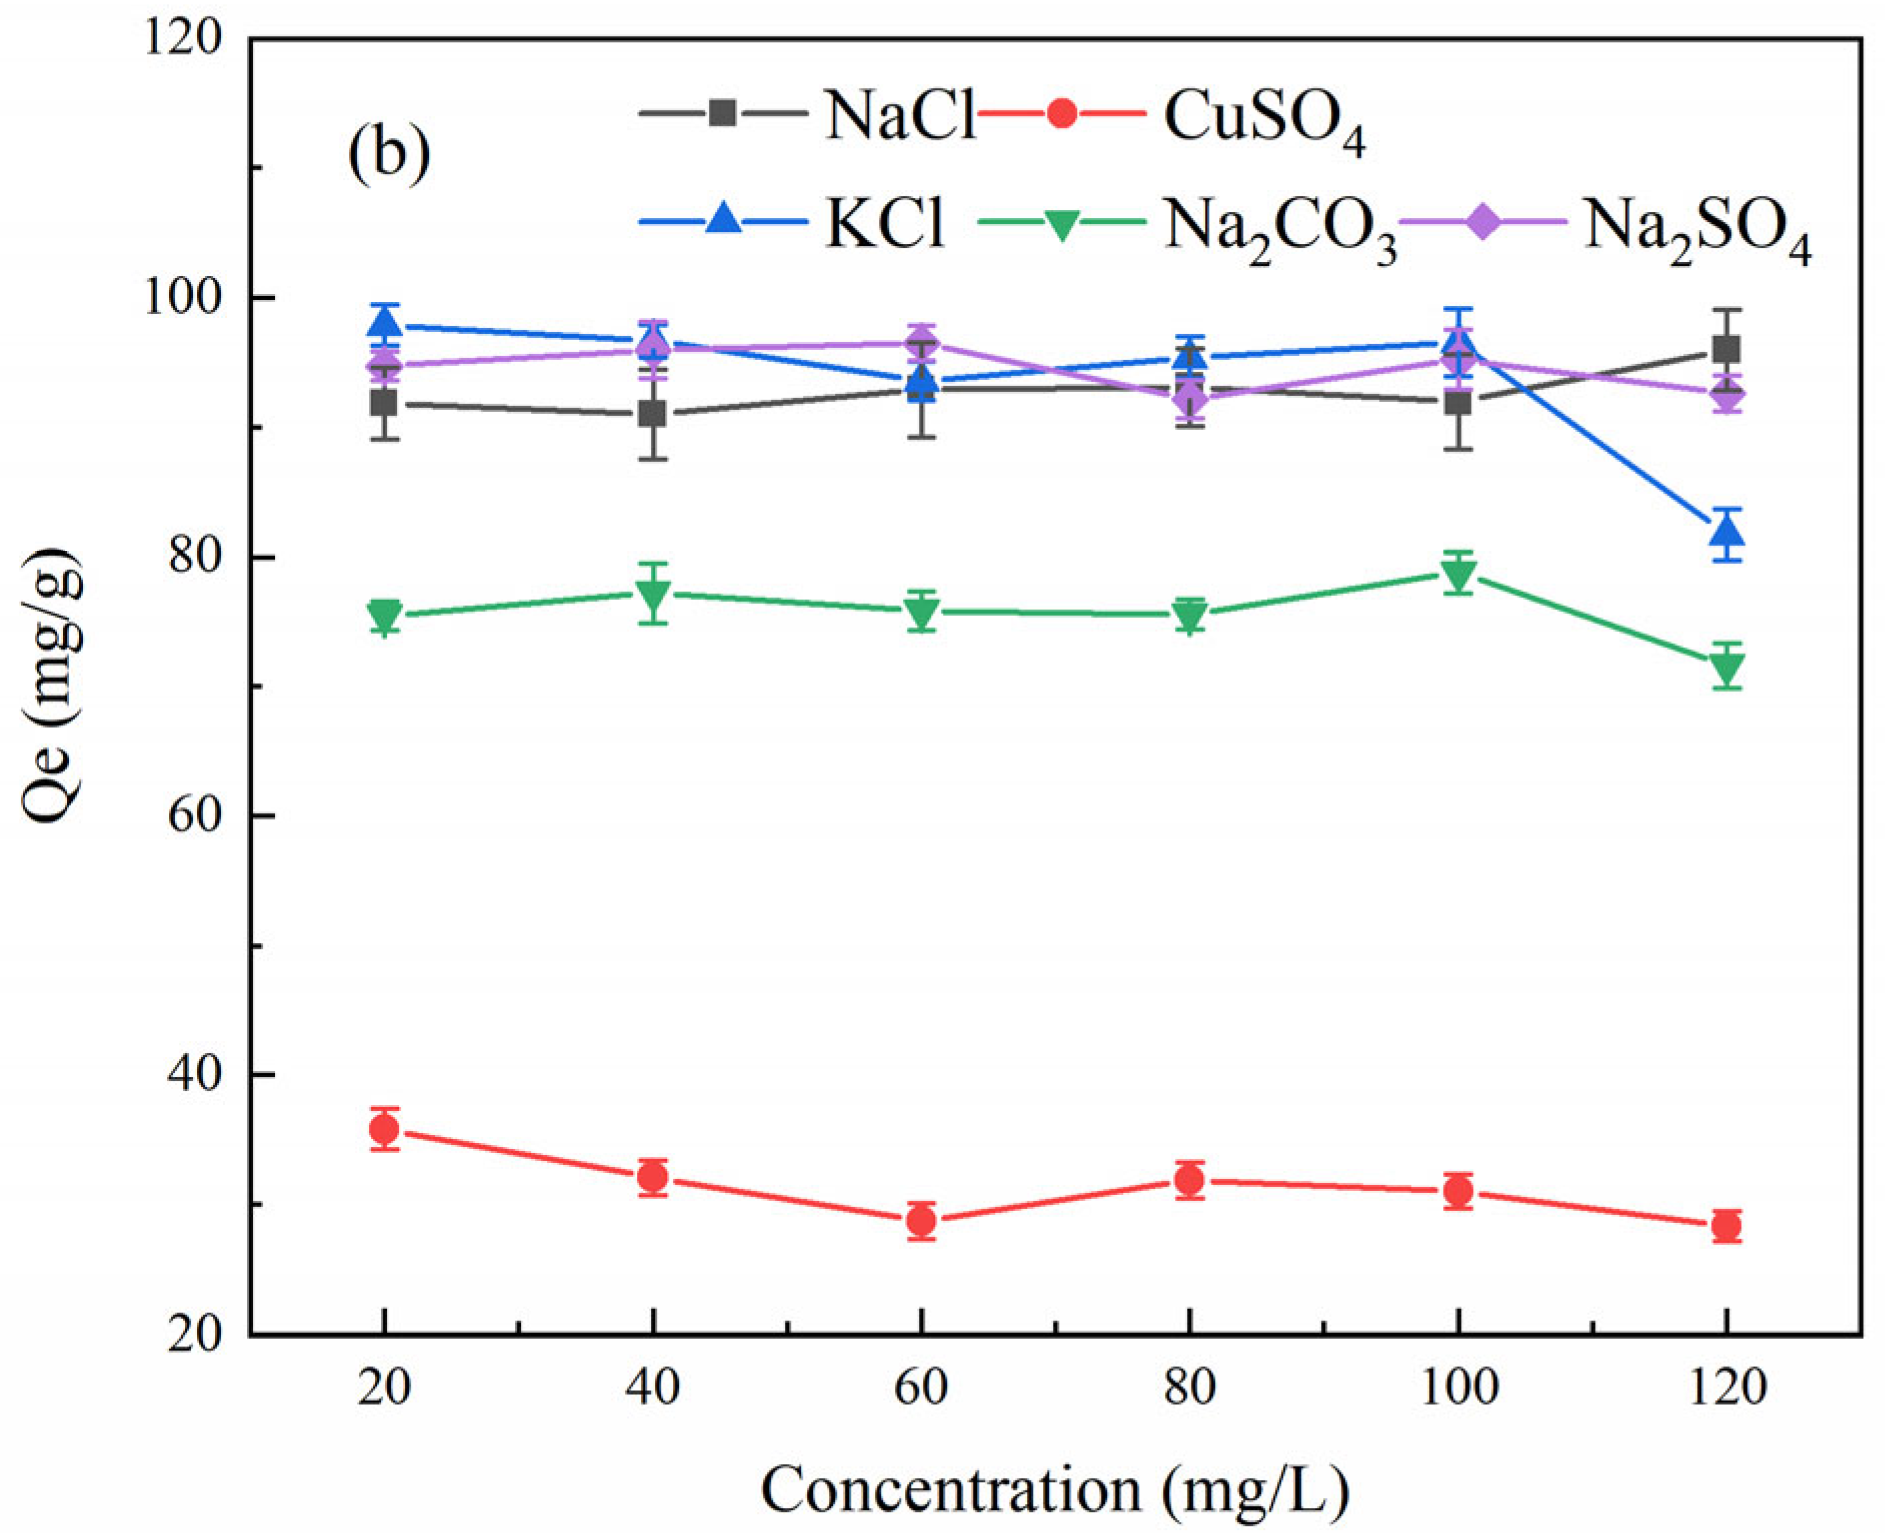
Actual wastewater usually has multiple coexisting impurities, and during adsorption, these anions and cations may compete for chemical sites on the surface of SAC, exhibiting a strong or weak complexation ability. Therefore, the effect of coexisting ions on the adsorption of MB and OFL on SAC was investigated. We selected the most common ions in wastewater (K+, Na+, Cu2+, Cl−, CO32−, and SO42−)
From Figure 9, it can be seen that the adsorption of methylene blue and OFL by activated carbon showed different trends with the coexisting ion species as the concentration of coexisting ions in the solution increased. The change in the adsorption of MB by activated carbon showed a large variation when the ion concentration was increased from 20 mg/g to 120 mg/g, while the adsorption of OFL did not vary much with the coexisting ion concentration and was only related to the coexisting ion species.
This phenomenon suggests that the presence of Cl− promotes the adsorption of methylene blue dye on the activated carbon and that the lower concentration of Cl− has less of an effect on the adsorption of activated carbon. This likely occurred because the addition of Cl− weakened the charge-shielding effect between the activated carbon and methylene blue in the solution, and the anions in the solution neutralized the surface charge between methylene blue and activated carbon, thus weakening the electrostatic interaction between them. The presence of Cu2+ and CO32− in the solution affected the OFL adsorption, and the presence of coexisting ions competed for the adsorption of OFL [4,40]. The presence of K+ and SO42− reduced the MB adsorption to less than 160 mg/g, and the presence of Cu2+ reduced the OFL adsorption to less than 30 mg/g. There is some interaction between the organic matter in the solution and the activated carbon, mainly electrostatic gravitational or repulsive forces, which can be shielded if the ionic strength is increased [41]. Another scenario may be due to the salt precipitation effect caused by the addition of anions, which reduces the solubility of methylene blue in the solution and forces it to migrate towards the surface of the activated carbon, increasing the chance of contact with the activated carbon [30].
The above adsorption studies were performed to assess the effects of adsorbent dosage, contaminant concentration, solution pH, and temperature and compare them with the accuracy of three replicates. MB was assessed at the optimized conditions of an adsorbent dosage of 0.1 g/L, pH of 11, and temperature of 298 K, and OFL was assessed at the optimized conditions of an adsorbent dosage of 0.25 g/L, pH of 7, and temperature of 318 K. SAC had higher adsorption capacity for MB and OFL with a high adsorption capacity. The results of this study are consistent with those of Jan, Dao, Li, and Nizam [4,20,42,43].
3.4. Regeneration of Adsorbent
From Table 3, it can be seen that after SAC adsorption of OFL, the adsorption amount dropped dramatically even after two regenerations at a higher recovery efficiency, and the regeneration effect was poor. The recovery of SAC after the adsorption of MB is lower than that of the adsorption of OFL, likely because the SAC of adsorption of MB is better regenerated in the process of regenerating activated carbon via a filtration transfer, and the particles are smaller than those of SAC of adsorption of OFL, and the loss is greater. The reduction in sorbent efficiency can be attributed to the loss of certain active sites on the SAC surface due to the coordination of MB and OFL with surface functional groups after successive reproducible cycles [44]. Therefore, SAC is a promising material for the adsorption of MB and OFL from contaminated water [45].
4. Conclusions
In this study, homemade shell-activated carbon (SAC) has a good adsorption effect, and satisfactory results were obtained in its application to remove new pollutants from aqueous solutions. The experimental adsorption data were best fitted by Langmuir’s isothermal model and the proposed secondary kinetic model. The adsorption behavior of SAC on MB and OFL was classified as monolayer adsorption, and both chemisorption and physical adsorption mechanisms were present. Analysis of the model-fitting constants showed that the theoretical maximum adsorption capacities of SAC for MB and OFL were 204.08 mg/g and 105.26 mg/g, respectively, and the adsorption of MB and OFL by SAC was calculated as spontaneous exothermic adsorption by thermodynamic equations. The characterization results showed that SAC has a good specific surface area (579.3 m2/g) with an average pore size of 4.183 nm, making it an excellent mesoporous material. SEM images showing SAC at different magnifications clearly show that the surface of SAC is rough and rich in pore structure, but with adsorption saturation, its irregular shape and inhomogeneous spatial structure are destroyed. Furthermore, the XRD images of SAC before and after the adsorption of MB and OFL show that SAC has a non-crystalline structure with a broad peak characteristic, indicating that the adsorption process does not lead to a change in the crystallinity of the material. Furthermore, FTIR plots of SAC before and after the adsorption of MB and OFL demonstrated that physical and chemical adsorption occurred on the surface of SAC in dye and antibiotic removal occurred via electrostatic attraction of the adsorbed adsorption substrate. After studying the factors affecting the adsorption capacity of SAC, the optimization of adsorption conditions significantly improved the removal of MB and OFL. With a SAC dosage of 50 mg/L, a solution pH = 11, and a process temperature = 298 K, the maximum adsorption capacity of SAC for MB was 199.22 mg/g. With a SAC dosage of 100 mg/l, a solution pH = 7, and a process temperature = 318 K, the maximum adsorption capacity of SAC for OFL was up to 102.62 mg/g. The presence of coexisting ions competed for the adsorption of OFL. The presence of K+ and SO42− reduces the adsorption capacity of MB by 20% and the presence of Cu2+ reduces the OFL adsorption capacity by 70%. In addition to this, there is an electrostatic gravitational or repulsive interaction between the organic matter in the solution and the SAC, and increasing the ionic strength improves the adsorption of MB by SAC. Finally, SAC was able to adsorb more than 50 % of the initial state of MB even after three adsorption regenerations. Thus, this work may provide new insight into the application of shell-activated carbon to efficiently remove new pollutants in aqueous environmental pollution.
Supplementary Materials
The following supporting information can be downloaded at: https://www.mdpi.com/article/10.3390/w14223752/s1, Figure S1: Standard curve plots of SAC adsorption of (a) MB and (b) OFL; Figure S2: SAC adsorption-desorption curve; Figure S3: SAC pore size distribution; Figure S4: SAC adsorption MB and OFL experiments of (a) MB Langmuir; (b) MB Freundlich (c) OFL Langmuir (d) OFL Freundlich isothermal adsorption fitted curves; Figure S5: SAC adsorption MB and OFL experiments of (a) MB fitted primary kinetics; (b) MB secondary kinetics; (c) OFL fitted primary kinetics; (d) OFL adsorption secondary kinetics fitted curves.
Author Contributions
Conceptualization, J.W., R.W. and Y.S.; methodology, J.W., J.M. and Y.S.; validation, J.W., J.M. and Y.S.; formal analysis, J.W., R.W. and Y.S.; investigation, J.W., J.M. and Y.S.; resources, J.W. and Y.S.; data curation, J.M. and Y.S.; writing—original draft preparation, J.M. and Y.S.; writing—review and editing, R.W. and Y.S.; visualization, R.W. and Y.S.; supervision, J.W. and Y.S.; project administration, J.W. and Y.S.; funding acquisition, J.W. and Y.S. All authors have read and agreed to the published version of the manuscript.
Funding
This research was supported by the National Natural Science Foundation of China (No. 51508268), the Natural Science Foundation of Jiangsu Province in China (No. BK20201362), and the 2018 Six Talent Peaks Project of Jiangsu Province (JNHB-038).
Data Availability Statement
Data are contained within the article.
Conflicts of Interest
The authors declare no conflict of interest.
References
- Guillossou, R.; Le Roux, J.; Mailler, R.; Pereira-Derome, C.S.; Varrault, G.; Bressy, A.; Vulliet, E.; Morlay, C.; Nauleau, F.; Rocher, V.; et al. Influence of dissolved organic matter on the removal of 12 organic micropollutants from wastewater effluent by powdered activated carbon adsorption. Water Res. 2020, 172, 115487. [Google Scholar] [CrossRef] [PubMed]
- Solangi, N.H.; Kumar, J.; Mazari, S.A.; Ahmed, S.; Fatima, N.; Mubarak, N.M. Development of fruit waste derived bio-adsorbents for wastewater treatment: A review. J. Hazard. Mater. 2021, 416, 125848. [Google Scholar] [CrossRef]
- Nizam, N.U.M.; Hanafiah, M.M.; Mahmoudi, E.; Halim, A.A.; Mohammad, A.W. The removal of anionic and cationic dyes from an aqueous solution using biomass-based activated carbon. Sci. Rep. 2021, 11, 8623. [Google Scholar] [CrossRef]
- Li, Z.; Hanafy, H.; Zhang, L.; Sellaoui, L.; Schadeck Netto, M.; Oliveira, M.L.S.; Seliem, M.K.; Luiz Dotto, G.; Bonilla-Petriciolet, A.; Li, Q. Adsorption of congo red and methylene blue dyes on an ashitaba waste and a walnut shell-based activated carbon from aqueous solutions: Experiments, characterization and physical interpretations. Chem. Eng. J. 2020, 388, 124263. [Google Scholar] [CrossRef]
- Kuang, Y.; Zhang, X.; Zhou, S. Adsorption of Methylene Blue in Water onto Activated Carbon by Surfactant Modification. Water 2020, 12, 587. [Google Scholar] [CrossRef] [Green Version]
- Cai, Z.; Deng, X.; Wang, Q.; Lai, J.; Xie, H.; Chen, Y.; Huang, B.; Lin, G. Core-shell granular activated carbon and its adsorption of trypan blue. J. Clean. Prod. 2020, 242, 118496. [Google Scholar] [CrossRef]
- Bouzikri, S.; Ouasfi, N.; Benzidia, N.; Salhi, A.; Bakkas, S.; Khamliche, L. Marine alga “Bifurcaria bifurcata”: Biosorption of Reactive Blue 19 and methylene blue from aqueous solutions. Environ. Sci. Pollut. Res. 2020, 27, 33636–33648. [Google Scholar] [CrossRef]
- Song, T.; Deng, R.; Gao, J.; Yi, J.; Liu, P.; Yang, X.; Zhang, Z.; Han, B.; Zhang, Y. Comprehensive resource utilization of peony seeds shell: Extraction of active ingredients, preparation and application of activated carbon. Ind. Crop. Prod. 2022, 180, 114764. [Google Scholar] [CrossRef]
- Scigliano, G.; Scigliano, G.A. Methylene blue in COVID-19. Med. Hypotheses 2021, 146, 110455. [Google Scholar] [CrossRef]
- Alvarenga, G.; Lima, J.P.; Goszczynski, A.C.F.; Rosa, C.H.; Rosa, G.R.; Lopes, T.J. Methylene blue adsorption by timbaúva (Enterolobium contortisiliquum)-derived materials. Environ. Sci. Pollut. Res. 2020, 27, 27893–27903. [Google Scholar] [CrossRef]
- Elkady, M.; Shokry, H.; Hamad, H. New Activated Carbon from Mine Coal for Adsorption of Dye in Simulated Water or Multiple Heavy Metals in Real Wastewater. Materials 2020, 13, 2498. [Google Scholar] [CrossRef] [PubMed]
- Alver, E.; Metin, A.Ü.; Brouers, F. Methylene blue adsorption on magnetic alginate/rice husk bio-composite. Int. J. Biol. Macromol. 2020, 154, 104–113. [Google Scholar] [CrossRef] [PubMed]
- Bednárek, J.; Matějová, L.; Koutník, I.; Vráblová, M.; Cruz, G.J.F.; Strašák, T.; Šiler, P.; Hrbáč, J. Revelation of high-adsorption-performance activated carbon for removal of fluoroquinolone antibiotics from water. Biomass Convers. Biorefinery 2022. [Google Scholar] [CrossRef]
- Igwegbe, C.A.; Oba, S.N.; Aniagor, C.O.; Adeniyi, A.G.; Ighalo, J.O. Adsorption of ciprofloxacin from water: A comprehensive review. J. Ind. Eng. Chem. 2021, 93, 57–77. [Google Scholar] [CrossRef]
- Wang, C.; Wu, Q.; Zeng, Y.; Huang, D.; Yu, C.; Wang, X.; Mei, W. Synthesis, characterization and DNA-binding properties of Ru(II) complexes coordinated by ofloxacin as potential antitumor agents. J. Coord. Chem. 2015, 68, 1489–1499. [Google Scholar] [CrossRef]
- He, S.; Chen, Q.; Chen, G.; Shi, G.; Ruan, C.; Feng, M.; Ma, Y.; Jin, X.; Liu, X.; Du, C.; et al. N-doped activated carbon for high-efficiency ofloxacin adsorption. Microporous Mesoporous Mat. 2022, 335, 111848. [Google Scholar] [CrossRef]
- Jaswal, A.; Kaur, M.; Singh, S.; Kansal, S.K.; Umar, A.; Garoufalis, C.S.; Baskoutas, S. Adsorptive removal of antibiotic ofloxacin in aqueous phase using rGO-MoS2 heterostructure. J. Hazard. Mater. 2021, 417, 125982. [Google Scholar] [CrossRef]
- Antonelli, R.; Martins, F.R.; Malpass, G.R.P.; Da Silva, M.G.C.; Vieira, M.G.A. Ofloxacin adsorption by calcined Verde-lodo bentonite clay: Batch and fixed bed system evaluation. J. Mol. Liq. 2020, 315, 113718. [Google Scholar] [CrossRef]
- Eke-Emezie, N.; Etuk, B.R.; Akpan, O.P.; Chinweoke, O.C. Cyanide removal from cassava wastewater onto H3PO4 activated periwinkle shell carbon. Appl. Water Sci. 2022, 12, 157. [Google Scholar] [CrossRef]
- Dao, M.U.; Le, H.S.; Hoang, H.Y.; Tran, V.A.; Doan, V.D.; Le, T.T.N.; Sirotkin, A.; Le, V.T. Natural core-shell structure activated carbon beads derived from Litsea glutinosa seeds for removal of methylene blue: Facile preparation, characterization, and adsorption properties. Environ. Res. 2021, 198, 110481. [Google Scholar] [CrossRef]
- Sessa, F.; Merlin, G.; Canu, P. Pine bark valorization by activated carbons production to be used as VOCs adsorbents. Fuel 2022, 318, 123346. [Google Scholar] [CrossRef]
- Lin, L.; Jiang, W.; Xu, P. Comparative study on pharmaceuticals adsorption in reclaimed water desalination concentrate using biochar: Impact of salts and organic matter. Sci. Total Environ. 2017, 601–602, 857–864. [Google Scholar] [CrossRef]
- Gayathiri, M.; Pulingam, T.; Lee, K.T.; Sudesh, K. Activated carbon from biomass waste precursors: Factors affecting production and adsorption mechanism. Chemosphere 2022, 294, 133764. [Google Scholar] [CrossRef]
- Mozhiarasi, V.; Natarajan, T.S. Bael fruit shell–derived activated carbon adsorbent: Effect of surface charge of activated carbon and type of pollutants for improved adsorption capacity. Biomass Convers. Biorefinery 2022. [Google Scholar] [CrossRef]
- Atallah Al-Asad, H.; Parniske, J.; Qian, J.; Alex, J.; Ramaswami, S.; Kaetzl, K.; Morck, T. Development and application of a predictive model for advanced wastewater treatment by adsorption onto powdered activated carbon. Water Res. 2022, 217, 118427. [Google Scholar] [CrossRef]
- Kali, A.; Amar, A.; Loulidi, I.; Jabri, M.; Hadey, C.; Lgaz, H.; Alrashdi, A.A.; Boukhlifi, F. Characterization and adsorption capacity of four low-cost adsorbents based on coconut, almond, walnut, and peanut shells for copper removal. Biomass Convers. Biorefinery 2022. [Google Scholar] [CrossRef]
- Abisha, B.R.; Anish, C.I.; Beautlin, N.R.; Daniel, S.N.; Jaya, R.M. Adsorption and equilibrium studies of methyl orange on tamarind shell activated carbon and their characterization. Phosphorus Sulfur Silicon Relat. Elem. 2022, 197, 225–230. [Google Scholar]
- Rodríguez-Sánchez, S.; Díaz, P.; Ruiz, B.; González, S.; Díaz-Somoano, M.; Fuente, E. Food industrial biowaste-based magnetic activated carbons as sustainable adsorbents for anthropogenic mercury emissions. J. Environ. Manag. 2022, 312, 114897. [Google Scholar] [CrossRef]
- Partlan, E.; Ren, Y.; Apul, O.G.; Ladner, D.A.; Karanfil, T. Adsorption kinetics of synthetic organic contaminants onto superfine powdered activated carbon. Chemosphere 2020, 253, 126628. [Google Scholar] [CrossRef]
- Deng, Z.; Sun, S.; Li, H.; Pan, D.; Patil, R.R.; Guo, Z.; Seok, I. Modification of coconut shell-based activated carbon and purification of wastewater. Adv. Compos. Hybrid Mater. 2021, 4, 65–73. [Google Scholar] [CrossRef]
- Omokafe, S.M.; Department of Metallurgical Materials Engineering, F.U.O.T. Fabrication of Activated Carbon from Coconut Shells and its Electrochemical Properties for Supercapacitors. Int. J. Electrochem. Sci. 2020, 15, 10854–10865. [Google Scholar] [CrossRef]
- Qin, Y.; Luo, J.; Zhao, Y.; Yao, C.; Li, Y.; An, Q.; Xiao, Z.; Zhai, S. Dual-wastes derived biochar with tailored surface features for highly efficient p-nitrophenol adsorption. J. Clean. Prod. 2022, 353, 131571. [Google Scholar] [CrossRef]
- Mubarak, M.F.; Zayed, A.M.; Ahmed, H.A. Activated Carbon/Carborundum@Microcrystalline Cellulose core shell nano-composite: Synthesis, characterization and application for heavy metals adsorption from aqueous solutions. Ind. Crop. Prod. 2022, 182, 114896. [Google Scholar] [CrossRef]
- Veeramalai, S.; Ramlee, N.N.; Mahdi, H.I.; Manas, N.H.A.; Ramli, A.N.M.; Illias, R.M.; Azelee, N.I.W. Development of organic porous material from pineapple waste as a support for enzyme and dye adsorption. Ind. Crop. Prod. 2022, 181, 114823. [Google Scholar] [CrossRef]
- Oba, O.A.; Pasaoglulari, A.N. Preparation of mesoporous activated carbon from novel African walnut shells (AWS) for deltamethrin removal: Kinetics and equilibrium studies. Appl. Water Sci. 2022, 12, 149. [Google Scholar] [CrossRef]
- Thirumal, V.; Yuvakkumar, R.; Ravi, G.; Dineshkumar, G.; Ganesan, M.; Alotaibi, S.H.; Velauthapillai, D. Characterization of activated biomass carbon from tea leaf for supercapacitor applications. Chemosphere 2022, 291, 132931. [Google Scholar] [CrossRef]
- Sulaiman, N.S.; Mohamad, A.M.H.; Danish, M.; Sulaiman, O.; Hashim, R. Kinetics, Thermodynamics, and Isotherms of Methylene Blue Adsorption Study onto Cassava Stem Activated Carbon. Water 2021, 13, 2936. [Google Scholar] [CrossRef]
- Zhao, T.; Liu, R.; Lu, J.; Zhu, X.; Zhu, X.; Lu, K.; Zhu, H. Photocatalytic degradation of methylene blue solution by diphenylanthrazoline compounds. J. Phys. Org. Chem. 2017, 30, e3712. [Google Scholar] [CrossRef]
- Mirzaie, M.; Talebizadeh, A.R.; Hashemipour, H. Mathematical modeling and experimental study of VOC adsorption by Pistachio shell–based activated carbon. Environ. Sci. Pollut. Res. 2021, 28, 3737–3747. [Google Scholar] [CrossRef]
- Salomón, Y.L.D.O.; Georgin, J.; Franco, D.S.P.; Netto, M.S.; Foletto, E.L.; Piccilli, D.G.A.; Sellaoui, L.; Dotto, G.L. Transforming pods of the species Capparis flexuosa into effective biosorbent to remove blue methylene and bright blue in discontinuous and continuous systems. Environ. Sci. Pollut. Res. 2021, 28, 8036–8049. [Google Scholar] [CrossRef]
- Wang, X.; Cheng, H.; Ye, G.; Fan, J.; Yao, F.; Wang, Y.; Jiao, Y.; Zhu, W.; Huang, H.; Ye, D. Key factors and primary modification methods of activated carbon and their application in adsorption of carbon-based gases: A review. Chemosphere 2022, 287, 131995. [Google Scholar] [CrossRef]
- Moradi, O.; Sharma, G. Emerging novel polymeric adsorbents for removing dyes from wastewater: A comprehensive review and comparison with other adsorbents. Environ. Res. 2021, 201, 111534. [Google Scholar] [CrossRef]
- Li, Y.; Wang, X.; Zou, S.; Ding, Y.; You, N.; Fan, H. Nanocomposites of immobilized nano-zirconia on low-cost activated carbon derived from hazelnut shell for enhanced removal of 3-Nitro-4-Hydroxy-Phenylarsonic acid from water. Environ. Res. 2022, 209, 112851. [Google Scholar] [CrossRef] [PubMed]
- Sahnoun, A.Y.; Selatnia, A.; Alouache, A.; Tidjani, A.E.B.; Bellil, A.; Ayeche, R. Valorization of sewage sludge for methylene blue removal from aqueous solution. Biomass Convers. Biorefinery 2022. [Google Scholar] [CrossRef]
- Georgin, J.; Salomón, Y.L.D.O.; Franco, D.S.P.; Netto, M.S.; Piccilli, D.G.A.; Foletto, E.L.; Dotto, G.L. Successful adsorption of bright blue and methylene blue on modified pods of Caesalpinia echinata in discontinuous system. Environ. Sci. Pollut. Res. 2021, 28, 8407–8420. [Google Scholar] [CrossRef] [PubMed]
Figure 1.
SEM images of SAC: (a) SAC (initial); (b) SAC-MB (adsorption saturation); (c) SAC-MB (regeneration); (d) SAC-OFL (adsorption saturation); (e) SAC-OFL (regeneration).
Figure 1.
SEM images of SAC: (a) SAC (initial); (b) SAC-MB (adsorption saturation); (c) SAC-MB (regeneration); (d) SAC-OFL (adsorption saturation); (e) SAC-OFL (regeneration).


Figure 2.
XRD plots of the initial state of the SAC and the adsorbed saturated MB and OFL.

Figure 3.
FTIR plots of the initial state of SAC and adsorption-saturated MB and OFL.

Figure 4.
Effect of adsorption time on the removal rate of MB and OFL.

Figure 5.
SAC adsorption isotherms for (a) MB and (b) OFL.

Figure 6.
SAC adsorption of (a) MB and (b) OFL as a function of pH.


Figure 7.
Removal efficiency of (a) MB and (b) OFL adsorbed by SAC versus adsorption amount with dosing.
Figure 7.
Removal efficiency of (a) MB and (b) OFL adsorbed by SAC versus adsorption amount with dosing.

Figure 8.
Removal efficiency of (a) MB and (b) OFL adsorbed by SAC versus adsorption amount with initial concentration.
Figure 8.
Removal efficiency of (a) MB and (b) OFL adsorbed by SAC versus adsorption amount with initial concentration.

Figure 9.
Variation of adsorption of (a) MB and (b) OFL by SAC with coexisting ion concentration.


Table 1.
SAC adsorption MB and OFL adsorption isotherm fitting constants.
| Solution (Chemistry) | Langmuir Isotherm | Freundlich Isotherm | ||||
|---|---|---|---|---|---|---|
| Qm (mg/g) | KL (L/mg) | R2 | KF (mg/g)1/n | N | R2 | |
| MB | 204.08 | 2.88 | 0.995 | 161.73 | 10.15 | 0.922 |
| OFL | 96.15 | 4.52 | 0.999 | 84.28 | 22.78 | 0.983 |
Table 2.
Thermodynamic parameters of adsorption of MB and OFL by SAC.
| Solution (Chemistry) | ∆G (kJ/mol) | ∆H (J/mol K) | ∆S (kJ/mol) | ||
|---|---|---|---|---|---|
| 298 K | 308 K | 318 K | |||
| MB | −220.031 | –250.898 | –274.001 | –151.415 | 2.770 |
| OFL | –313.624 | –152.631 | –24.408 | –680.027 | –14.765 |
Table 3.
SAC regeneration parameters.
| Number of Regenerations | MB | OFL | ||||
|---|---|---|---|---|---|---|
| Qe (mg/g) | Removal Efficiency (%) | Recovery Efficiency (%) | Qe (mg/g) | Removal Efficiency (%) | Recovery Efficiency (%) | |
| 0 | 190.79 | 99.9 | / | 82.88 | 97.6 | / |
| 1 | 134.21 | 70.3 | 73.0 | 75.03 | 88.3 | 84.0 |
| 2 | 131.67 | 68.9 | 62.6 | 18.84 | 22.2 | 80.0 |
| 3 | 117.67 | 51.1 | 43.8 | 11.58 | 13.6 | 70.0 |
Publisher’s Note: MDPI stays neutral with regard to jurisdictional claims in published maps and institutional affiliations. |
© 2022 by the authors. Licensee MDPI, Basel, Switzerland. This article is an open access article distributed under the terms and conditions of the Creative Commons Attribution (CC BY) license (https://creativecommons.org/licenses/by/4.0/).
Share and Cite
MDPI and ACS Style
Wang, J.; Wang, R.; Ma, J.; Sun, Y. Study on the Application of Shell-Activated Carbon for the Adsorption of Dyes and Antibiotics. Water 2022, 14, 3752. https://doi.org/10.3390/w14223752
AMA Style
Wang J, Wang R, Ma J, Sun Y. Study on the Application of Shell-Activated Carbon for the Adsorption of Dyes and Antibiotics. Water. 2022; 14(22):3752. https://doi.org/10.3390/w14223752
Chicago/Turabian StyleWang, Jinlong, Rui Wang, Jingqian Ma, and Yongjun Sun. 2022. "Study on the Application of Shell-Activated Carbon for the Adsorption of Dyes and Antibiotics" Water 14, no. 22: 3752. https://doi.org/10.3390/w14223752
Note that from the first issue of 2016, this journal uses article numbers instead of page numbers. See further details here.