
The Evaluation of Groundwater Carrying Capacity in Xi’an
1
School of Water and Environment, Chang’an University, 126 Yanta Road, Xi’an 710054, China
2
Key Laboratory of Subsurface Hydrology and Ecological Effects in Arid Region, Ministry of Education, Chang’an University, 126 Yanta Road, Xi’an 710054, China
3
Northwest Engineering Corporation Limited of PowerChina, Xi’an 710065, China
*
Author to whom correspondence should be addressed.
Water 2022, 14(22), 3756; https://doi.org/10.3390/w14223756
Submission received: 23 September 2022
/
Revised: 7 November 2022
/
Accepted: 16 November 2022
/
Published: 18 November 2022
(This article belongs to the Section Hydrogeology)
Abstract
:With the development of the economy and society, the importance of water as a necessary resource has increased. The resource attribute capacity of groundwater is limited, and excessive consumption depletes groundwater resources. The extremely serious and highly integrated groundwater problem necessitates the determination of the carrying capacity of groundwater resources. Based on the research findings of the carrying capacity of groundwater resources in China and other parts of the world, in this study, we proposed a new method to determine the carrying capacity of groundwater resources. We evaluated the carrying capacity of groundwater resources in Xi’an by using the probabilistic neural network method based on the ‘W–F extension law’. The results showed that the extremely low and low bearing capacity areas of groundwater in Xi’an are located in the southern plain area of Zhouzhi county and Huyi district, the southern suburbs of Xi’an city, and the loess platform source area. Due to the constant supply from the riverside water source, the groundwater associated with the Bahe river, Fengzaohe river, and Weibin water sources have a higher bearing capacity than other evaluation areas. Compared to the traditional evaluation method, in this study, we redefined the evaluation index standard of the carrying capacity of groundwater. The groundwater carrying capacity is only related to groundwater and its storage medium. The pressure index of groundwater carrying, such as the population, economy, and environment in the traditional evaluation method, is considered overexploitation. The interaction between surface water and groundwater can be distinguished, and the level limit of the evaluation index can be determined more accurately. Additionally, the probabilistic neural network method of the ‘W–F extension law’ does not allocate weights but calculates the clustering center. Thus, to avoid subjectivity, parameter weighting is not required. This method does not have regional restrictions and can reflect the non-linear relationship of the groundwater system. It can reflect the sensitivity and recovery ability of groundwater under the same future exploitation load. The evaluation results of this method were consistent with the evaluation results of the third groundwater resources survey in Xi’an in 2019, and the evaluation results were very similar to the actual situation. The accuracy and practicability of the evaluation method were verified.
1. Introduction
Xi’an is the center of the Guanzhong-Tianshui Economic Development Zone and the Xi-Xian New Area. Due to extensive construction and rapid urbanization, the city has become larger, the water resources have decreased, and the climate has become warm and dry [1]. This is an important grain-producing area where groundwater is used for agriculture. Thus, the groundwater in this area has been overexploited for a long time, and the regional groundwater level has decreased, forming many groundwater depression cones, and resource and environmental problems, such as land subsidence, ground subsidence, and ground fissures. These problems have drawn the attention of the international community and severely restricted the healthy development of the regional economy. ‘What is the upper limit of the carrying capacity of groundwater resources for the social economy? Is there still room for regulation?‘ Such issues have become a concern of the Chinese government, the public, and even the international community. Hence, these issues need to be addressed. Evaluating the carrying capacity of groundwater resources is the key to answering the above questions. This is not only an important issue concerning the study of the water cycle and sustainable development of groundwater resources in Xi’an, but it also has significance in ensuring the coordinated and sustainable development of water resources, ecology, social economy, and food security. The serious and highly integrated water problem has shown that the groundwater resource carrying capacity needs to be studied urgently.
Developed countries neglected the study of the carrying capacity of water resources because they were abundant. Therefore, studies on the carrying capacity of water resources in the world are limited, and most discussions are included in the theory of sustainable development [2,3,4,5,6]. The North American Lakes Association has defined the carrying capacity of lakes. The URS company in the United States has studied the carrying capacity of the Keys River Basin in Florida. Some studies by researchers such as Falkenmark have also involved the carrying limit of water resources. However, in China, a country with less than one-third of the world’s per capita water resources, the study of the carrying capacity of water resources is necessary. In China, many studies have investigated the carrying capacity of water resources, especially since the 1990s [7,8,9,10,11,12], and many concepts and research methods have been proposed. The water carrying capacity can be elaborated by two main theories: the scale of water resources development and the largest scale of the carrying capacity of water resources. The representative studies were performed by Yanchun Gao [13] and Benqing Ruan [14], and many other researchers, who hold the second theory [15,16]. The research methods of the carrying capacity of water resources include the conventional trend method, background analysis method, analytic hierarchy process, dynamic simulation recursive algorithm, state space method, fuzzy evaluation method, principal component analysis method, system dynamics method, etc. These methods can be mainly classified into three categories, including the empirical estimation method, the index system evaluation method, and the complex system analysis method. Among them, the empirical estimation method generally has low accuracy, the selection of the evaluation index of the index system method has certain limitations, and the complex system method has many parameters that are not easy to understand and explain.
Studies on the carrying capacity of groundwater resources are limited, and they are in the exploratory stage. It was not until 2000 that the correlation of the carrying capacity of groundwater resources was established [17,18,19,20,21], and various methods and indicators were also quite abundant. Advancements in these methods and indicators encouraged studies on the carrying capacity of water resources. The concept and method of determining the carrying capacity of groundwater resources were followed by the method of determining the carrying capacity of water resources. There is no unified and clear definition and well-established method to determine the carrying capacity. Commonly used methods can be roughly divided into qualitative and quantitative evaluation methods. These methods assume a linear relationship between each index and the evaluation results, which cannot accurately reflect the complex and non-linear relationship between the factors of the groundwater system. The index classification is arbitrary and cannot reflect the influence of continuous change in each evaluation index value on the carrying capacity of groundwater. Additionally, the weight of such methods is generally estimated directly. Subjective factors have a greater impact on the results, and thus, evaluating the carrying capacity of groundwater from the same area at the same time might show different results.
The evaluation of groundwater carrying capacity follows the method for evaluating the carrying capacity of water resources. The indicators are comprehensively considered based on the society, economy, environment, and groundwater conditions. The methods cannot easily separate the influence of surface water and groundwater, and there are certain limitations and differences in the determination of the threshold of the carrying capacity of groundwater. This study considers that the bearing capacity of groundwater is the attribute of groundwater and its storage medium-aquifer. Society, the environment, and the economy are only the external factors that affect groundwater. They do not affect the bearing capacity of groundwater. For example, the load capacity of a car is only related to its performance, regardless of the object it carries. Therefore, in this study, all social, economic, environmental, and other external indicators are unified with the groundwater overexploitation coefficient as the external force object carried by groundwater. The evaluation index of the carrying capacity of groundwater only considers the characteristics of underground aquifers and groundwater.
Based on the above-mentioned background, in this study, we proposed a new method to determine the carrying capacity of groundwater resources in Xi’an, using the probabilistic neural network method based on the ‘W–F extension law’. The probabilistic neural network method of the ‘W–F extension law’ does not assign weights but calculates the clustering center, so it does not need to add weights to the parameters to avoid subjectivity. The method is not subject to regional restrictions. It can reflect the non-linear relationship between the groundwater system and the sensitivity and recovery ability of groundwater under the same future exploitation load. The evaluation and analysis of the carrying capacity of groundwater resources in Xi’an provided a reference for the rational development, utilization, and distribution of groundwater resources.
2. Overview of the Study Area
2.1. Geographical Overview
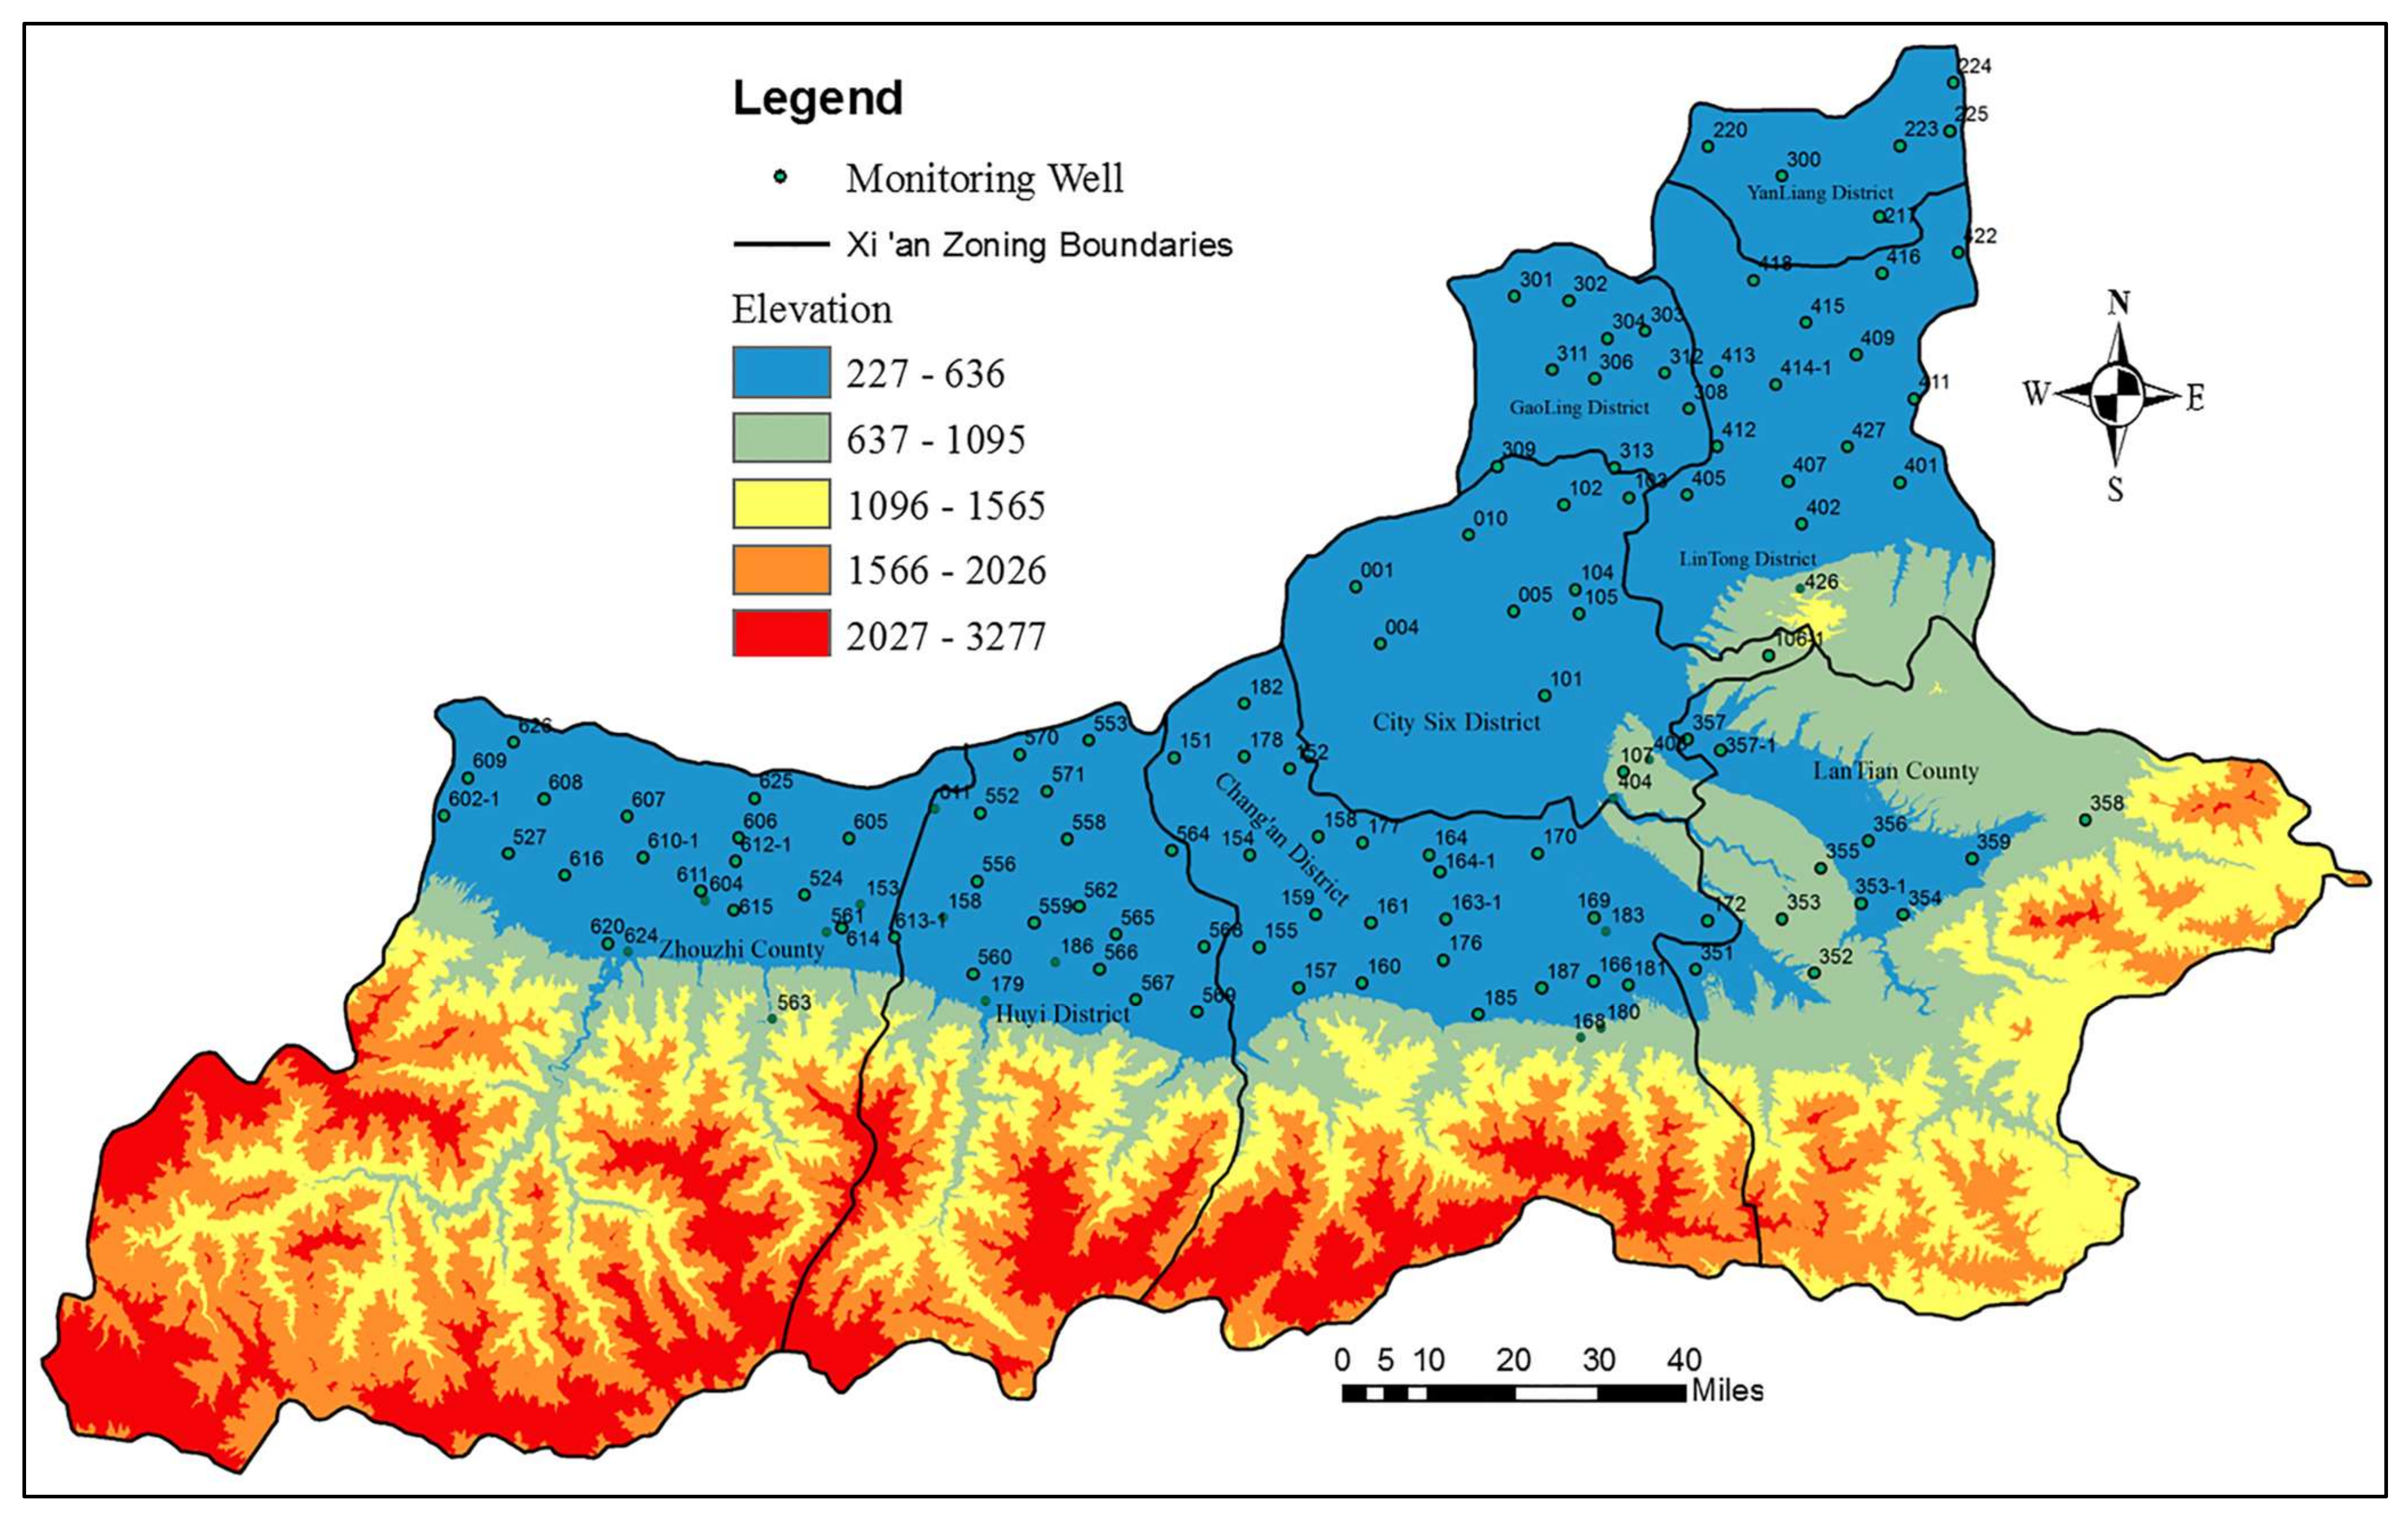
Xi’an (33°39′~34°45′ N, 107°40′~109°49′ E) is located in the hinterland of the Guanzhong plain. It is 204 km in the east–west direction and 116 km in the north–south direction and covers an area of 10,108 km2. The terrain is elevated in the south and low in the north, with a ladder structure. From south to north, the Qinling mountains, loess hills and gullies, loess tablelands, piedmont alluvial fans, the Weihe river, and its tributaries are present (Figure 1). Xi’an has a warm temperate semi-arid, semi-humid, continental monsoon climate. The average annual temperature in the city is 13.3 °C, the sunshine hours are 1684~2243 h, the drought index in the plain area is 1.29~2, the frost-free period is about 220 d, and the maximum frozen soil thickness is 45 cm. The average annual precipitation in Xi’an is 740.4 mm, including 835.6 mm in the Qinling mountain area, 708.5 mm in the tableland area, 700.1 mm in hilly areas, and 637.5 mm in plain areas. The precipitation is strongly affected by topography, and it increases from north to south. The lowest precipitation occurs in Weibei. The average annual precipitation in the Guanshan station is 515.7 mm, and the highest value is 960.3 mm in the Qinling mountains, which is nearly twice that of Guanshan. Precipitation occurs unevenly throughout the year, mostly concentrated in July, August, September, and October, accounting for more than 60% of the total annual precipitation, which can go up to 77.1%. The regional distribution of evaporation is opposite to that of precipitation. The change trend of evaporation gradually decreases from north to south, and the plain area decreases to the mountain area.
2.2. Overview of Groundwater Resources
According to hydrological data, Xi’an has 2.762 billion m3 of groundwater resources. The per capita water resource is 234 m3, which is equivalent to 11.6% of the national average (2098 m3). In Xi’an city, the surface water resource is 2.357 billion m3, the underground water resource is 1.172 billion m3, and repeated calculation indicated that surface water and underground water are 767 million m3. The groundwater in the south of the Weihe river has low salinity and good water quality, but some parts are polluted. Most areas north of the Weihe river have high salinity and poor water quality.
2.3. Hydrogeological Conditions
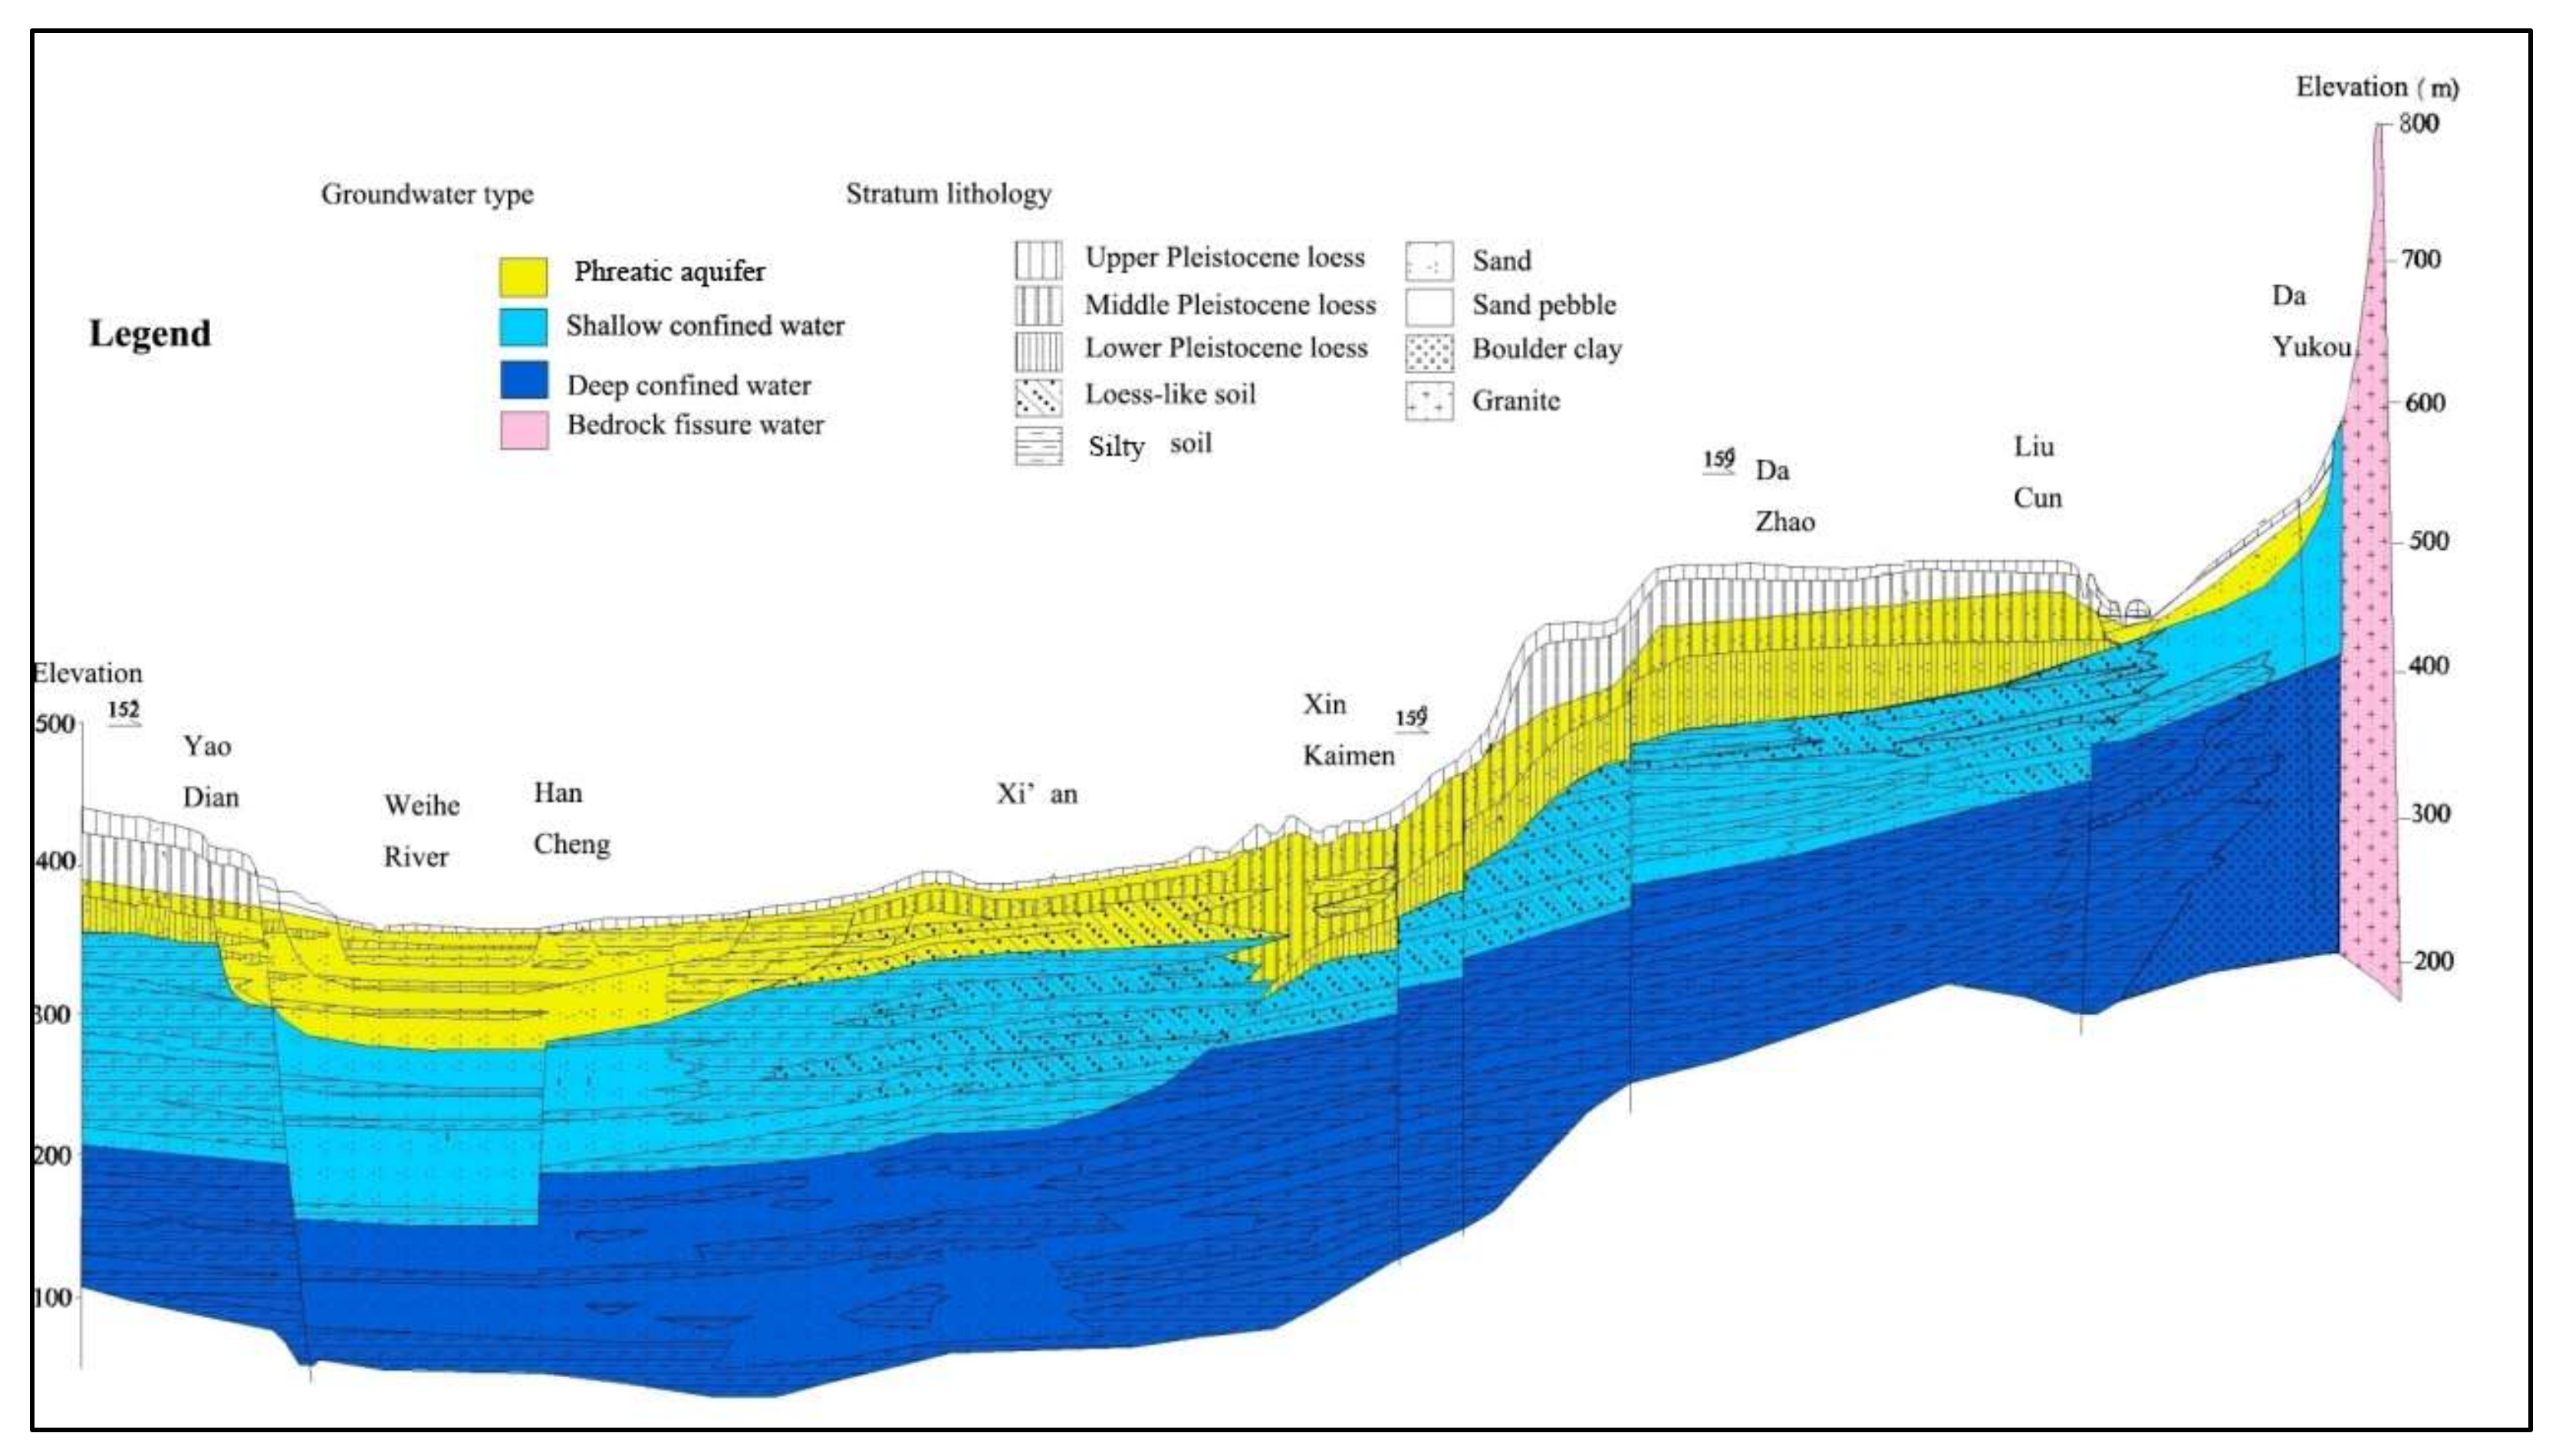
In this study, we mainly investigated the groundwater in plain areas. Xi’an is located in the middle of the Weihe fault basin, where thick Cenozoic continental loose strata are present. This provides favorable conditions for the formation and storage of groundwater. The Quaternary strata in the study area are widely distributed; they are thick and have a good water yield. According to the landform, groundwater depth, hydraulic conditions, and the actual situation of groundwater development and utilization, the water bearing rock group within a depth of 300 m can be divided into the phreatic water group and the confined water group (see Figure 2).
2.3.1. Phreatic Aquifers
The burial and distribution of the phreatic aquifer are closely related to the geomorphic conditions. According to the geomorphic types, the phreatic aquifer in the plain area can be divided into three zones [22].
- (1)
- River valley plain phreatic aquifer rock group
It is distributed in the floodplain and the first, second, third, and fourth terraces of the Weihe river and its tributaries. The lithology of the aquifer is dominated by Holocene, Upper Pleistocene, and Middle Pleistocene alluvial sand, gravel, and pebble intercalated with clay. The thickness of the aquifer decreases from the floodplain to the fourth terrace, and the buried depth of the groundwater level increases with the increase in the terrace series. The water yield of the water bearing stratum is the highest in the flood plain on the south bank of the Weihe river and the first and second terraces. The second terrace takes the second place, and the fourth terrace has a thin aquifer, which is nearly dried. In the north of the Weihe river, the lithology of the flood plain and first and second terrace aquifers is considerably different from south to north. In the floodplain of the Weihe river in the south, the first terrace is mostly sand and sandy pebbles, the rock phase changes from west to east, and the thickness decreases. The central area mostly consists of fine sand, and the northern part has clayey sand with poor water availability.
- (2)
- The phreatic aquifer in the piedmont alluvial plain
It is mainly distributed in the first, second, third, and fourth alluvial fans in the piedmont of Zhouzhi county, Huyi Xian district, Chang’an district, and the skirt of the Lishan alluvial fan. With the increase in the number of alluvial fans, the buried depth increases, and the buried depth of the piedmont is the largest. The lithology of the aquifer is Holocene, Upper Pleistocene, and Middle Pleistocene alluvial sand gravel with clay and Upper and Middle Pleistocene aeolian loess. The distribution of gravel pebbles is uneven, the valleys are thicker on both sides, and the inter-fan and leading edge areas are thinner and even pinch out. The water availability in the water bearing strata varies greatly, decreasing from the low-level alluvial fan to the high-level alluvial fan. The lithology of the alluvial fan skirt in the front of the Lishan mountain is gravel with sub-clay near the mountain, and the water abundance is poor. The lithology of the aquifer from the north to the front of the alluvial fan is sand and sand gravel, with unstable distribution and medium water abundance.
- (3)
- Loess tableland phreatic aquifer rock group
It is mainly distributed in the Shenhe, Shaoling, Bailu, and Ma’e loess tableland areas. The water bearing lithology is the upper and middle Pleistocene aeolian loess, and upper and middle aeolian loess. On the loess tableland, the water richness of phreatic water in pores and fissures decreases with the increase in the buried depth of pores and fissures in the vertical direction. The surface Malan loess has a loose structure, large pores, developed vertical cracks, and very high water permeability. It is the main water-rich area in the depression of the source area. The water availability of loess also follows certain rules in the horizontal direction. The larger the source surface, the greater the water availability. In the narrow area of the source surface and the edge of the source edge, the water availability is very poor.
2.3.2. Confined Aquifers Rock Group
The confined water is distributed under the phreatic water bearing rock group of each geomorphic unit in the plain area. It is composed of lacustrine, diluvial, alluvial sand and gravel; medium-coarse-fine sand; and sandy soil in the middle and lower Pleistocene of the Quaternary. It is dominated by diluvial in the piedmont. The loess source is dominated by interlaced flood and lake, and the first and second terraces of the Weihe river are dominated by lake sediments. The lithology has a certain change rule in the horizontal direction. In the near-mountain front zone, the particles are coarse, thick, and muddy. In the inter-fan and leading edge, the particles become thinner, the level decreases, and the thickness reduces.
The buried depth of the confined water bearing rock group is divided into shallow confined water and deep confined water. The shallow confined aquifer group has a floor buried depth of 120–180 m, and the aquifer is mainly in the Pleistocene sand. The deep confined aquifer group is buried below 120–180 m to about 300 m, and the aquifer is mainly in the lower Pleistocene sand layer [23]. According to the landform, the confined water bearing rock group can be divided into the confined water bearing rock group in (1) the piedmont alluvial and Weihe terrace plain area and (2) the loess source area.
- (1)
- Confined water bearing rock group in the piedmont diluvial and Weihe terrace plain area
The buried depth of the confined water level in this area is generally between 50 and 300 m. The buried depth of the confined aquifer roof, confined water level, aquifer thickness, and water availability differ between places.
The lithology of the aquifer is mainly sand, and the thickness gradually decreases from west to east, from the shore to the far shore. It is often connected with the phreatic rock group in the Weihe river and its main tributaries, forming a large and thick aquifer. In the river floodplain, the thickness of the first terrace aquifer is 20–100 m. The second and third terraces and the northern part of the loess plateau aquifer have a thickness of 5–60 m. In the southern part of the near-mountain proluvium fan zone, the aquifer thickness is 48–56 m and is mostly comprised of mud sand pebbles. The water quality near the river zone is rich, while that away from the river area is poor.
- (2)
- The confined water bearing rock group in the loess source area
The thickness of the confined aquifer in the loess source area is 20–70 m, the buried depth of the roof is 110–224 m, and the buried depth of the confined water level is 50–150 m.
Lintong Ma’e yuan confined aquifer roof buried depth is 100–200 m, and the general depth is 200–300 m. The distribution law of tertiary confined aquifers exposed in Lantian is worse in the east than in the west. This is because the eastern terrain cuts strongly and varies greatly. The buried depth of the tertiary confined aquifer in Bailuyuan is below 194–224 m, the water head is deep, and the unit water inflow is small.
3. ‘W–F Extension Law’ Standard
The Weber–Fechner law (W–F law) was proposed by the German physiologists Weber and Fechner, who showed the relationship between psychological quantity and physical quantity and considered the influence of subjective and objective factors. Zhayong et al. applied it to the formulation of ambient air quality standards [24], and the evaluation results were similar to those of national standards. In this study, we used it to determine the evaluation criteria of groundwater carrying capacity.
3.1. W–F Law (Weber–Fechner Law)
The Weber–Fechner Law represents the relationship between psychological quantities and physical quantities and is at the base of the foundation of psychophysics as a new discipline. The German physiologist Weber found that the difference of the same stimulus must reach a certain proportion to cause the sense of difference. This ratio is a constant, and its expression is known as Weber’s law.
K = ∆r/r
In the formula, K represents a constant, also known as the Weber rate; ∆r represents the threshold of difference, also known as the minimum detectable difference; r represents the amount of stimulation.
To describe the relationship between sensory quantities and physical quantities in a continuous sense, the German physicist Fechner, based on Weber’s research, proposed a hypothesis in 1860 regarding the minimal perceptible difference (continuous differential threshold) as a unit of sensory quantities. For each additional differential threshold, the sensory quantity is increased by one unit, which can be expressed as follows:
S = K·logR + C
In the formula, S represents the sensory quantity, also known as sensory intensity; R represents a physical quantity, also known as stimulus intensity; C represents the integral constant.
The sensory quantity is proportional to the logarithm of the physical quantity, i.e., the increase in the sensory quantity lags behind the increase in the physical quantity. The physical quantity increases in geometric progression, while the sensory quantity increases in arithmetic progression. This empirical formula is called the Weber–Fechner law (W–F law), which is suitable for medium-intensity stimulation.
The W–F law shows that all human senses, including vision, hearing, skin sense (including pain, itching, touch, and temperature), taste, smell, electric shock, etc., are proportional to the common logarithm of the intensity of the corresponding physical quantity, rather than the intensity of the corresponding physical quantity.
3.2. Extension of the W–F Law
The evaluation of the carrying capacity of groundwater can be regarded as the relationship between human feeling and each carrying capacity index. To apply the ‘W–F law’ for evaluating the carrying capacity of groundwater, it is necessary to extend the ‘W–F law’. The degree of influence of the index on the groundwater carrying capacity also satisfies Equation (2). The objective stimulus R can be regarded as the index value of the carrying capacity, and the human response S can be regarded as the measure of the carrying capacity of the index. Equation (2) describes the influence of the evaluation index on the carrying capacity of groundwater.
The difference on both sides of Equation (2) can be expressed as follows:
∆S = K·∆R/R
As shown in Equation (3), when the index value changes in equal proportion, its impact on the carrying capacity of groundwater changes in equal difference.
Therefore, when formulating the grading standard limit of a certain index, although the index limit between the adjacent standard levels of the index changes in an equal ratio, the degree of influence of this change on the carrying capacity of groundwater should be graded. The range of variation between the minimum value Rimin and the maximum value Rimax of the ith index can be divided into 11 levels, such as n = 0, 1, 2, …, 10, where n = 0 and n = 10 correspond to the levels of Rimin and Rimax, respectively. The objective importance ratio between n and m of any two levels of the i index is:
Pin/Rim = Kin–m (n, m = 0, 1, 2, …,10)
When m = 0, the above equation can be expressed as:
Pin = RimKin
In the formula, Ki = (Rimax/Rimin)1/10 indicates the ratio of the ith index to the two adjacent standards affecting the groundwater carrying capacity, i.e., the Weber rate in Formula (1).
In the classification standard, the classification number can be changed according to the requirements; the determination of its standard limits depends on the minimum and maximum values of the evaluation of sample data. Samples with different minimum and maximum values have different standard limits for classification.
According to the number of classifications, different n can be selected to divide the carrying capacity of groundwater into four categories, including extremely low, low, medium, and high. The standard limits when n = 0, 2, 5, and 8 correspond to levels VL (very low), L (low), M (medium), and H (high), and the corresponding levels are VL = 1, L = 2, M = 3, and H = 4. Each index has four standard limits corresponding to four levels, which constitute the standard model of probabilistic neural network learning. According to the Rimin and Rimax values and Formula (5) of the index values in the evaluation area, different n values can be used to calculate the corresponding standard limits R of each index of the very low, low, medium, and high bearing capacity levels.
For the indices with a higher evaluation index value, a higher bearing capacity, and a higher level, such as precipitation, the permeability coefficient of the phreatic aquifer, the thickness of the phreatic aquifer, the permeability coefficient of the confined aquifer, and confined aquifer thickness, the 0, 2, 5, and 8 levels in the standard ‘W–F extension law’ correspond to the VL, L, M, and H levels of the evaluation results, respectively. The smaller the index value, the higher the bearing capacity, and the higher the level of the index, such as phreatic water level depth, phreatic water level drop, and the buried depth of the confined water level. The 10, 8, 5, and 2 levels in the ‘W–F extension law’ correspond to the VL, L, M, and H levels of the evaluation results. The standard limits of the eight bearing capacity indices of groundwater were calculated, as shown in Table 1.
3.3. Probabilistic Neural Network (PNN)
The probabilistic neural network (PNN) is a variant of the radial basis network, which is a feedforward neural network with a radial basis function layer and a competitive output layer. The network can use a linear learning algorithm to complete the work of a non-linear learning algorithm with high precision. This network is used for classification. It has been widely used in the field of pattern recognition classification [25], but it has not been used for evaluating the carrying capacity of groundwater.
The probabilistic neural network method does not need to determine the weight of the evaluation index, and can be classified, which reduces the subjectivity of the evaluation. It is specifically used for recognition classification, and the evaluation of the carrying capacity of groundwater is a typical pattern classification problem. Because the artificial neural network (ANN) can express any non-linear relationship and learning, it can also reflect the non-linear relationship between the groundwater system evaluation index and the evaluation results. These two features are not available in the overlapping index method and fuzzy comprehensive evaluation method, and thus, the probabilistic neural network method is better for evaluating the carrying capacity of groundwater. However, there is a problem with determining the index limit in the groundwater carrying capacity. While evaluating the carrying capacity of groundwater, the selection of indicators has a certain subjectivity, and cannot reflect the mutation between the various levels of evaluation criteria [26,27,28,29,30]. Therefore, the ‘W–F extension law’ needs to be used to improve the evaluation criteria, and then, evaluate the groundwater carrying capacity based on the probabilistic neural network.
3.4. Probabilistic Neural Network Method Based on the ‘W–F Extension Law’
After analysis, the ‘W–F extension law’ standard can be used to evaluate the bearing capacity of groundwater, which is not limited by regional restrictions, avoids subjectivity, reflects the abrupt relationship between various levels of the evaluation standard, and can determine any number of classifications as needed. The probabilistic neural network can avoid subjectivity in the process of weight determination and can reflect the non-linear relationship between the evaluation index and the evaluation result. The probabilistic neural network is specially used for classification because of its fast operation speed and no local minima.
Therefore, a probabilistic neural network method based on the ‘W–F extension law’ is proposed by combining the ‘W–F extension law’ with a probabilistic neural network. The W–F extension law is used to determine the index standard limit of the evaluation of groundwater carrying capacity, and the probabilistic neural network method is used to classify groundwater carrying capacity. The new evaluation method can avoid subjectivity while determining the index standard and weight, and the index standard is not limited by regional restrictions. It can broaden the scope of evaluation and evaluate the bearing capacity of groundwater. It can reflect the non-linear relationship between different levels and also between evaluation indices and evaluation results, improve the operation speed, and determine the number of classifications according to requirements. The method is verified below.
4. Xi’an Groundwater Carrying Capacity Evaluation Process
4.1. Division of the Evaluation Area
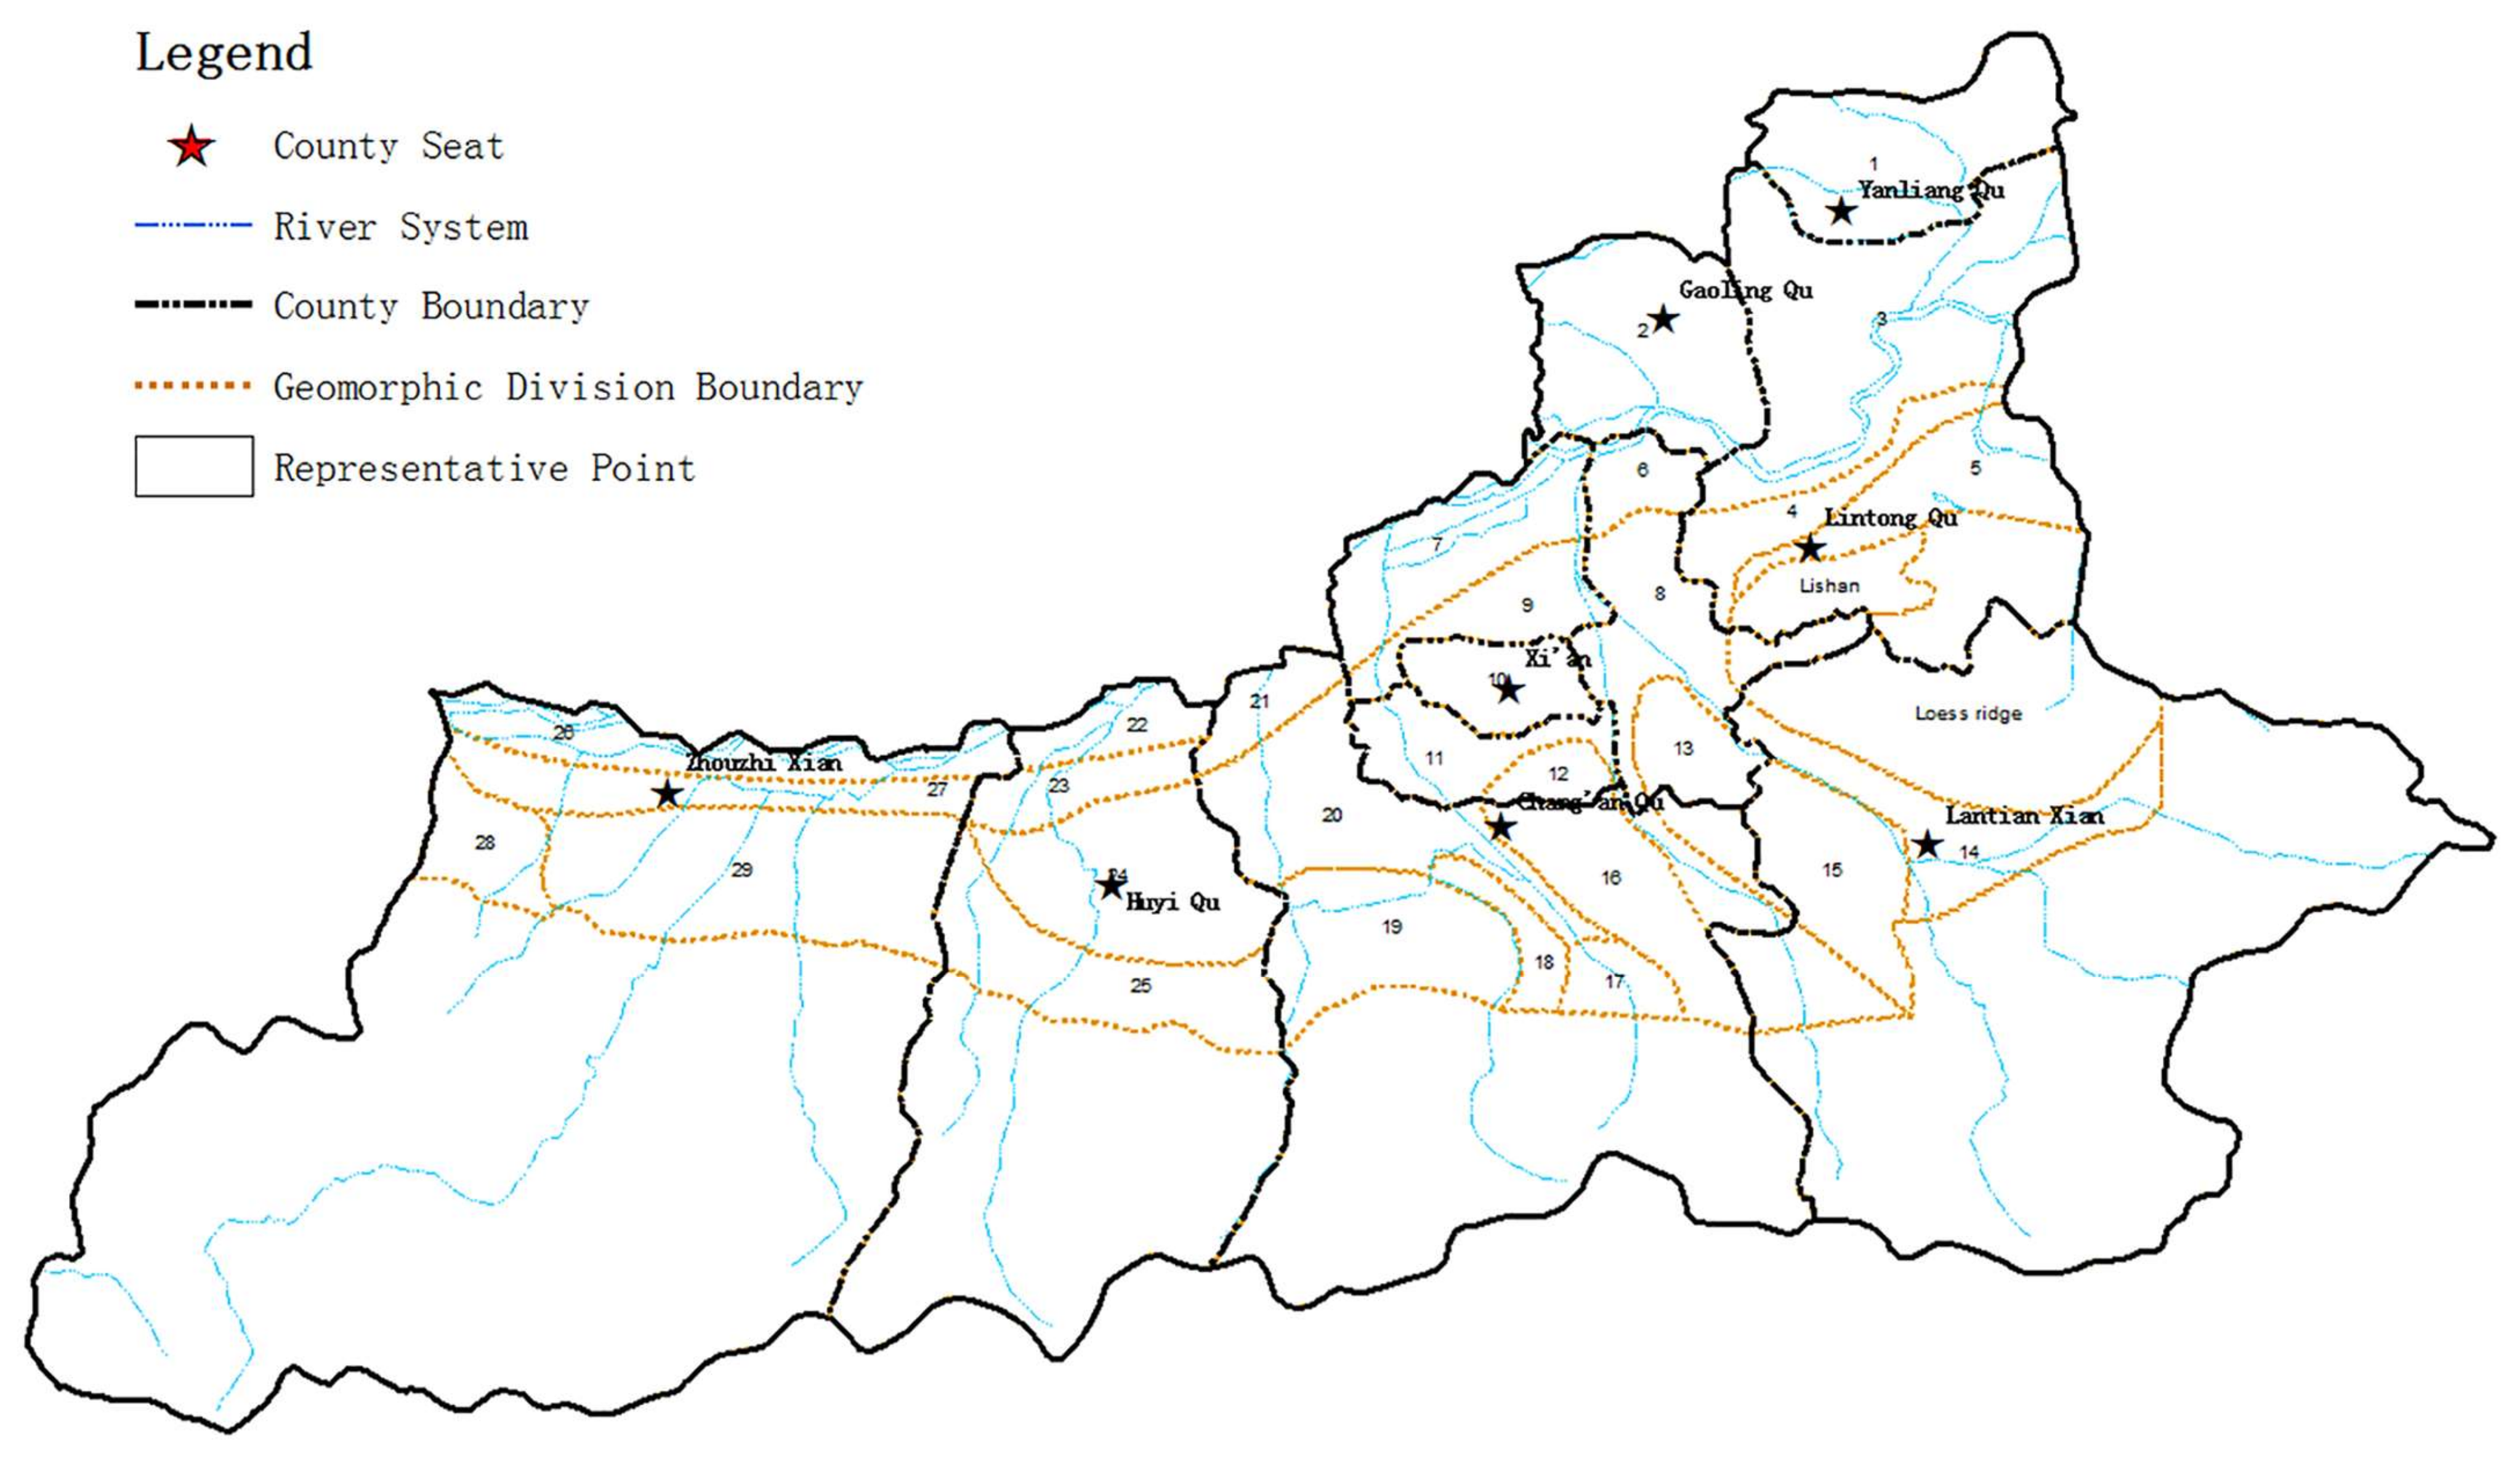
Based on the administrative divisions and geomorphological characteristics, the plain area of Xi’an was divided into 29 sub-areas, which were the basic units for groundwater overload evaluation. A representative point was selected in each zone for evaluation, as shown in Figure 3.
The name, number, and landform of each zone are shown in Table 2.
4.2. Establishment of the Evaluation Index System
The traditional evaluation index of the carrying capacity of groundwater is considered based on the aspects of society, economy, and environment. This method has certain limitations and differences in the determination of the threshold of groundwater carrying capacity because the connection between surface water and groundwater is difficult to distinguish. We assumed that the bearing capacity of groundwater is the attribute of its storage medium-aquifer and groundwater. The population, economy, environment, and other indicators are only the external force of groundwater, and do not affect the carrying capacity of groundwater. For example, the load capacity of a car is only related to its performance, regardless of the object it carries. Therefore, in this study, all external indicators were unified into the external force of groundwater by the groundwater overexploitation index. The groundwater carrying capacity only considers the characteristics of the underground aquifer and the groundwater. According to the analysis of stratigraphic lithology, hydrogeological conditions, and recharge, runoff, and discharge conditions of the aquifer group in the second chapter of this paper, the evaluation indices of the carrying capacity of groundwater were determined as follows.
There were eight indices in total, including precipitation, buried depth of the phreatic water level, the permeability coefficient of phreatic aquifer, thickness of the phreatic aquifer, decline range of the phreatic water level, the permeability coefficient of the confined aquifer, the thickness of the confined aquifer, and buried depth of the confined water level. Among these, four indicators were time-relevant and required the value of the evaluation year and included precipitation, groundwater depth, groundwater level drop, and confined water depth. These accounted for 50% of the total number of water carrying capacity evaluation indices.
The relationship between each index and the carrying capacity of groundwater is described as follows:
Precipitation: higher general precipitation is associated with the greater recharge of phreatic and confined water and higher carrying capacity of groundwater.
Phreatic water level depth: lesser depth of the phreatic water level indicates that the precipitation recharge is more vulnerable and the carrying capacity is higher.
Permeability coefficient of phreatic aquifer: a higher permeability coefficient of the phreatic aquifer indicates faster water migration in the aquifer and a higher carrying capacity.
Phreatic aquifer thickness: a greater thickness of the phreatic aquifer indicates greater aquifer water storage and a higher bearing capacity.
Decline range of the phreatic water level: a smaller decline range of the phreatic water level indicates a higher quantity of water in the phreatic aquifer and a higher carrying capacity.
The permeability coefficient of confined aquifer: a higher permeability coefficient of the confined aquifer indicates a faster movement of water in the aquifer and a higher bearing capacity.
Confined aquifer thickness: a higher thickness of a confined aquifer indicates greater water storage capacity of the confined aquifer and a higher bearing capacity.
The buried depth of confined water level: a lesser buried depth of the confined water level indicates a lower water bearing capacity of the confined aquifer, greater water storage, and a higher bearing capacity.
4.3. Construction of the Probabilistic Neural Network Model
Based on the learning mechanism of the probabilistic neural network, the probabilistic neural network evaluation model of the groundwater carrying capacity was constructed, i.e., the normalized value of the evaluation index in the evaluation standard was taken as the input sample, and the corresponding level was taken as the output sample to form the evaluation standard sample mode. When evaluating, we only needed to input the normalized evaluation factor sample value as the input sample into the mature network to directly receive the evaluation results.
- (1)
- Determination and normalization of the standard pattern P of network learning
Because the neural network has high accuracy in training and predicting [0, 1] data, the input data need to be normalized. There are two types of evaluation indicators, one is the larger, where the level of indicators is higher. The other is the smaller, but the level of indicators is higher. These indexes are normalized by the definition of relative membership degree in fuzzy mathematics [31].
For the higher grade index, the relative membership degree of the maximum value max xij of index i in the original value set to the highest grade target was 1; the relative membership degree of the target value 0 to the highest level target was 0, which constituted the two poles of the reference continuum. The larger the level, the higher the relative membership degree of the target (referred to as the relative membership degree of the target) (also known as the normalized formula), i.e.,
rij = xij/ximax
For the index with a low level and a high level, the definition of relative membership degree was applied. The minimum value min xij of the index i in the original value set was taken as the relative membership degree l of the highest level target. When xij was substantially larger than min xij, the relative membership degree of the highest level target was approximately 0, which constituted the two poles of the reference continuum. The formula for the relative membership degree of the smaller level and the higher target were obtained as follows:
rij = ximin/xij
According to the standard model of probabilistic neural network learning, the standard limits of each index were established and normalized. After normalizing the standard limit of the ‘W–F extension law’, as shown in Table 1, the standard mode of the probabilistic neural network learning, i.e., input vector P, was obtained. The normalized results of the standard limit of the groundwater index for Xi’an are shown in Table 3.
- (2)
- Determination of network target output vector T
According to the construction rules of the probabilistic neural network, the target output vector of the network is defined as . A row vector in is the response state of four neurons in the output layer of the network at four evaluation levels (VL, L, M, H) in the groundwater carrying capacity evaluation standard.
- (3)
- Calculation of the probabilistic neural network
The probabilistic neural network model was calculated to compare the classification sample to be determined (unknown pattern) with the learning pattern sample (standard pattern) P to obtain the maximum response output.
The sample index values of the area to be evaluated were normalized, and the constructed probabilistic neural network model was used for learning to obtain the response output of the standard model with the maximum probability, i.e., the evaluation result of the carrying capacity of groundwater.
5. Evaluation Results
Based on the limit value of the groundwater carrying capacity evaluation index determined by the ‘W–F extension law’, the standard model of network learning was obtained after normalization.
Here, represents the input vector, the number of elements of the input vector R = 5, and the number of radial basis function neurons Q = 4. The probabilistic neural network output layer for groundwater carrying capacity evaluation:
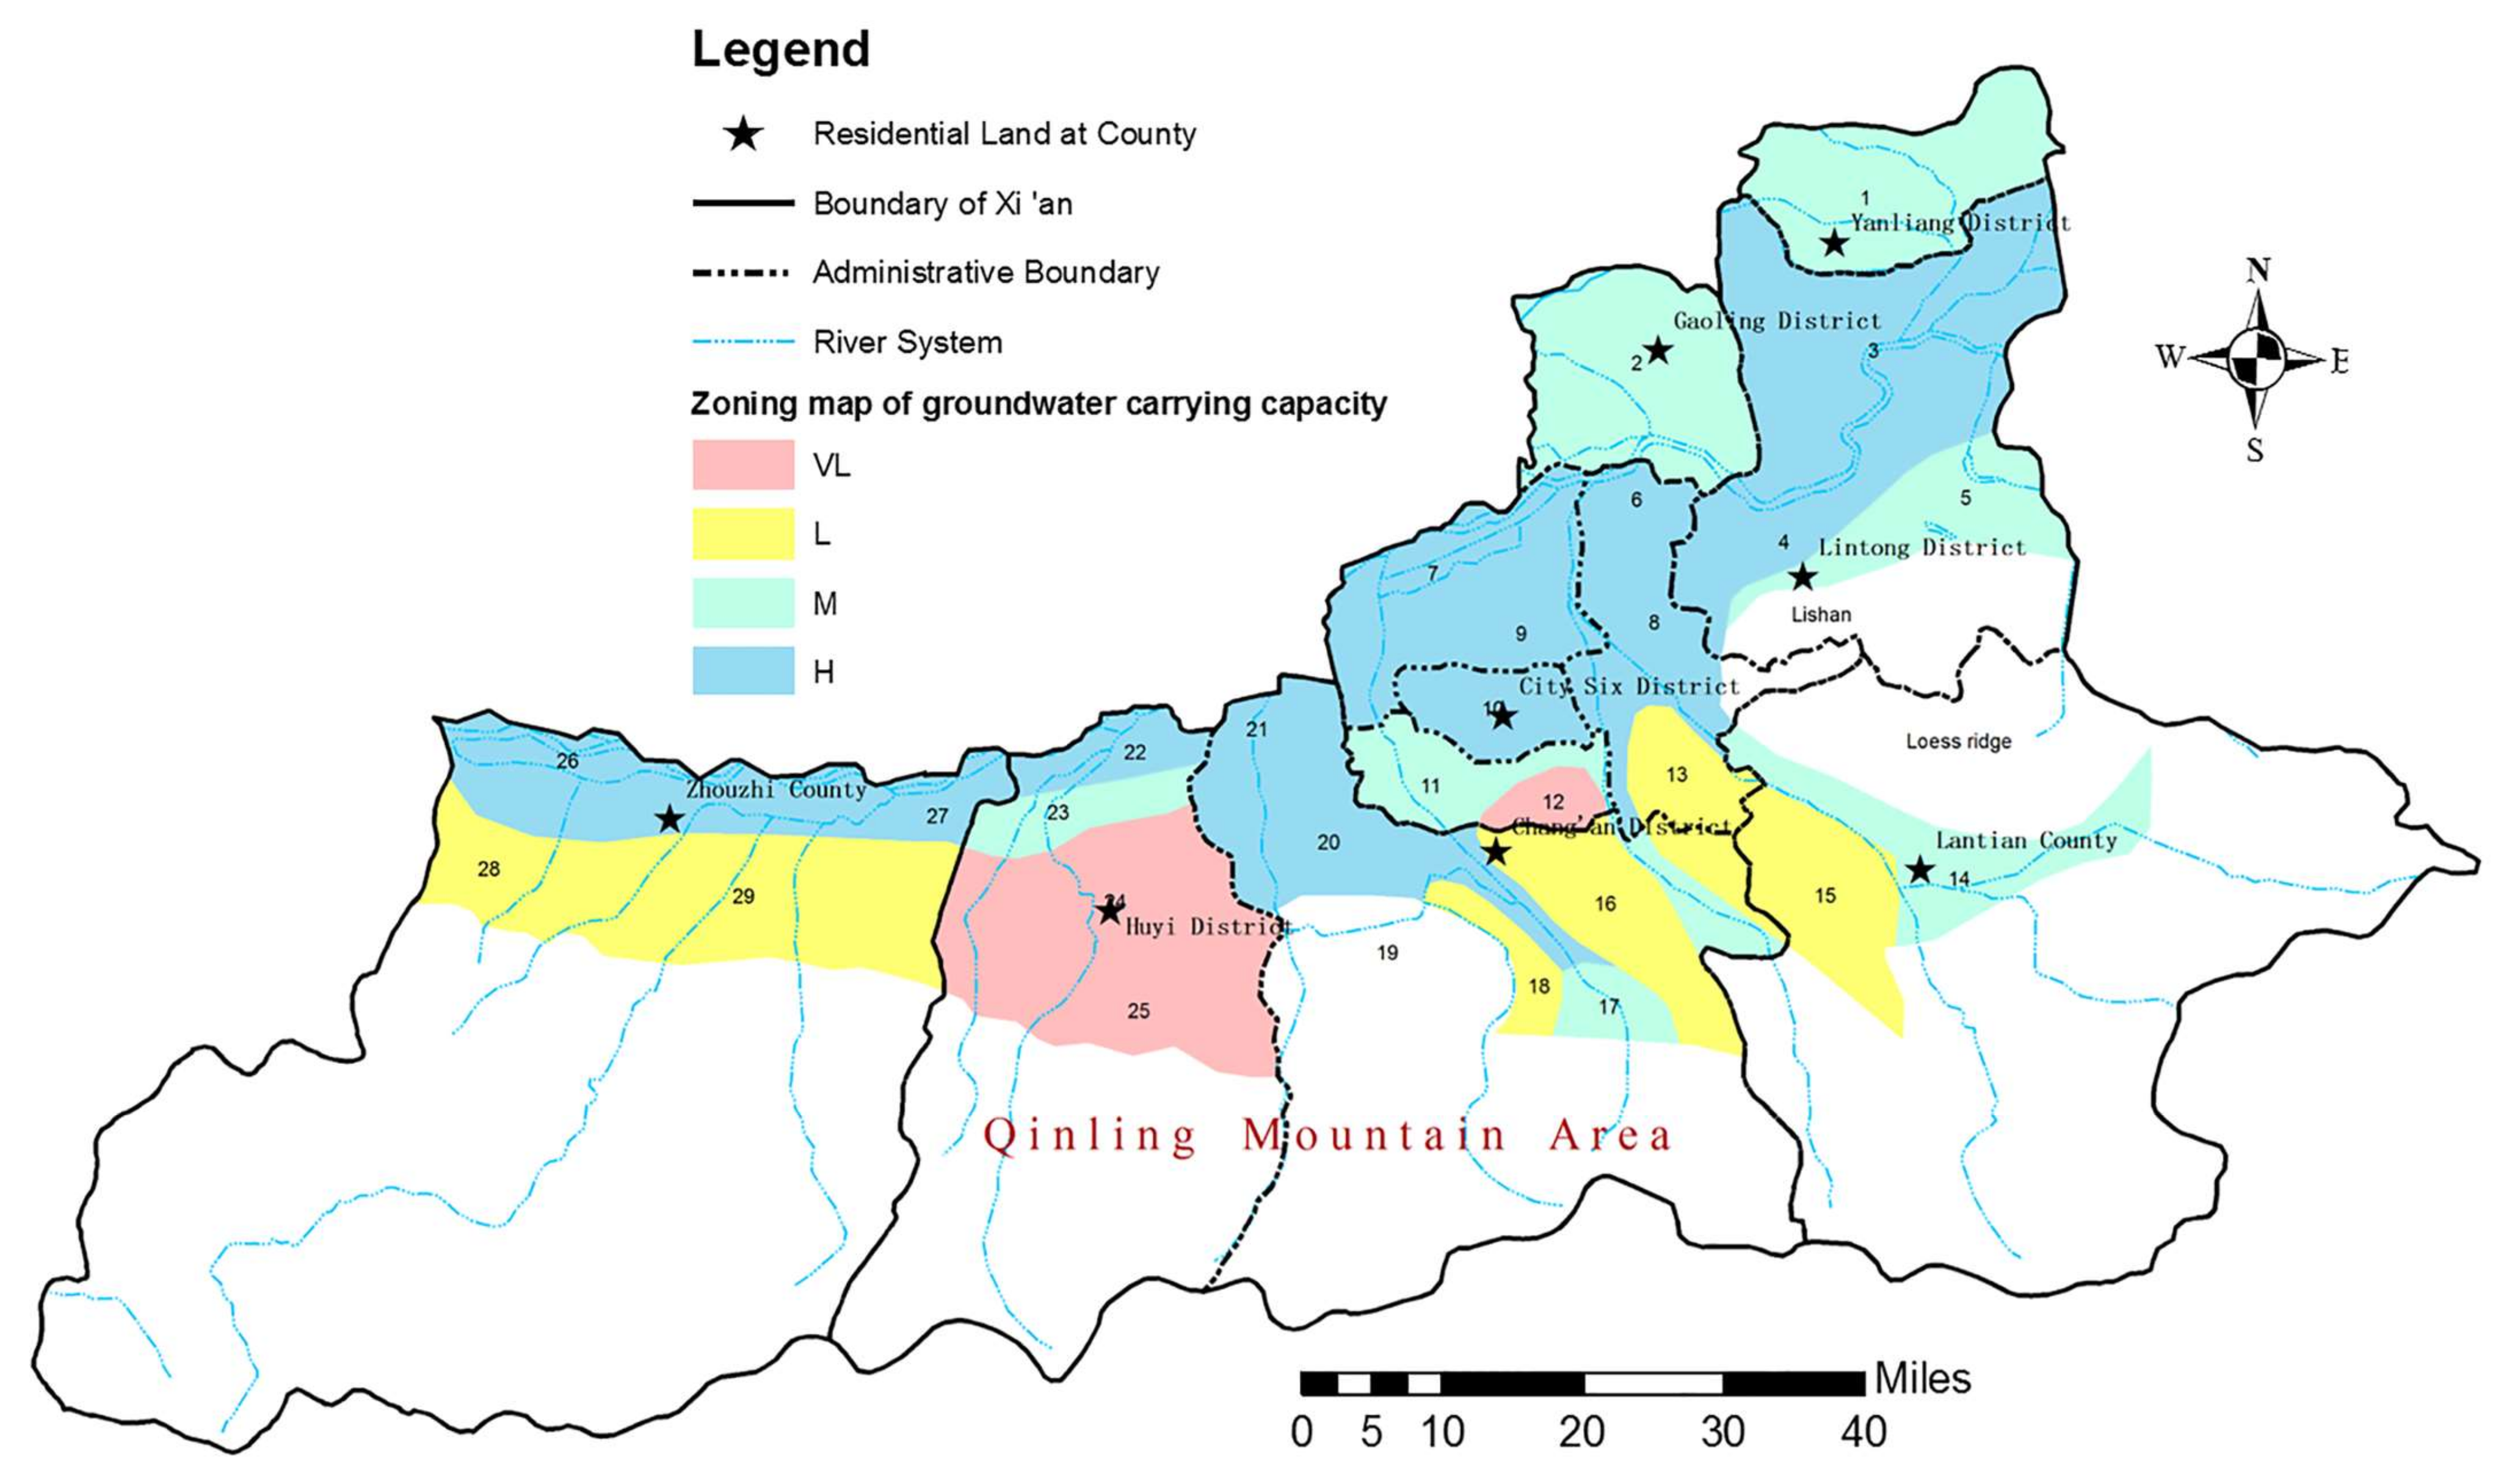
The evaluation results of groundwater carrying capacity are shown in the following figure. The five index values of the 29 zones were normalized and calculated by the probabilistic neural network model.
As shown in Figure 4, the phreatic water carrying capacity in the plain area of Xi’an decreased from floodplain, first-order terrace, second-order terrace, third-order terrace, and alluvial fan to loess table source, and the water availability worsened. The characteristics of each area for which the phreatic water carrying capacity was evaluated are as follows:
Two areas had a very low water carrying capacity. The representative points of the partition were 12 and 25, which were located at Shaolingyuan in the sixth district of the city and the alluvial fan of the Huyi district, respectively. Shaolingyuan in the sixth district of the city was located in the source side area of the loess platform source. The buried depth of the phreatic water level was about 80 m, the thickness was about 40 m, and the permeability coefficient of the aquifer was about 1 m/d. Additionally, the phreatic water level decreased greatly (by about 32 m) from 2000 to 2018, which indicated the overexploitation of phreatic water in this area. The phreatic water level decreased further, and the quantity of phreatic water decreased. The depth of the phreatic water level of the alluvial fan in the Huyi district was about 40 m, and the thickness was about 15 m. From 2000 to 2018, the phreatic water level decreased by about 37 m, and thus, it was categorized as an area with very low groundwater bearing capacity; the quantity of water used from this source should be strictly controlled.
Six areas had a low groundwater carrying capacity, and the representative points 13, 15, 16, 18, 28, and 29 were located in Zhouzhi county, Chang’an district, the sixth district, and Bailuyuan, respectively. The permeability coefficient of the phreatic aquifer in the loess platform source area was about 1 m/d, and the representative points were 15, 16, 18, and 28. The depth of the phreatic water level was more than 80 m, and the thickness of the aquifer was 40–45 m. The phreatic water level decreased by 2–8 m from 2000 to 2018, and representative point 29 was the alluvial fan area of Zhouzhi county. The permeability coefficient of the phreatic aquifer was about 10 m/d, the buried depth of the phreatic water level was about 41 m, the thickness of the aquifer was about 10 m, and the decline in the phreatic water level from 2000 to 2018 was about 9 m. The quantity of groundwater utilized in a low carrying capacity area should be limited.
Seven areas with a medium carrying capacity of groundwater, and the representative points of 1, 2, 5, 11, 14, 17, and 23 were located in Huyi district, Chang’an district, the sixth district, Lantian county, Lintong district, Yanliang district, and Gaoling district, which were the first, second, and third terraces or alluvial fans. Representative points 1 and 2 in the study area were the first-order terraces. The buried depth of the phreatic water level was 13–20 m, and the drawdown of the phreatic water level was about 6–10 m. The indicators, such as water abundance and exploitation, were at a medium level in the evaluation area. The representative point 17 of the partition was the alluvial fan, which was positioned at the front edge of the loess platform in Chang’an district. The rest were located in the second and third terraces, and the water yield and exploitation of phreatic were at a medium level in the evaluation area. Areas with a medium carrying capacity of groundwater should plan groundwater usage to prevent overexploitation.
There were 12 high carrying capacity areas of groundwater, which were located in the floodplain or first-class terrace. The phreatic water supply conditions in this area were good, and the water availability was high. From 2000 to 2018, the phreatic water level did not change much, and the decline was small, about 0–9 m. The phreatic water level of the Chanba river and Fengzao river water sources decreased considerably, which were 21 m and 15 m, respectively. However, because of riverside mining, the large permeability coefficient of the phreatic aquifer (about 40–50 m/d), and the thickness of the aquifer (about 50–55 m), we considered that recharging the aquifer would be easy and categorized the region as a high carrying capacity area of groundwater. In the high bearing capacity area, groundwater should not be overexploited, and the use should be determined based on the relationship between the current water level and the ecological water level of groundwater.
6. Discussion and Conclusions
6.1. Discussion
To verify the practicability of the new evaluation method of groundwater carrying capacity, the above results were taken as an example to compare with the traditional comprehensive fuzzy discriminant method. Bai Peng [32] used the fuzzy comprehensive evaluation model to evaluate the carrying capacity of groundwater resources in Xi’an and selected several indicators as the evaluation factors of the carrying capacity of groundwater, including the development rate of groundwater resources, the quantity of groundwater per capita, the modulus of groundwater supply, the modulus of groundwater recharge, the modulus of groundwater discharge, the reuse rate of water resources (including surface water and groundwater), and the water consumption per unit of GDP. The evaluation results showed that the comprehensive score of the carrying capacity of groundwater resources in most administrative regions of Xi’an was below 0.5, and the highest score was for the carrying capacity of groundwater resources in Zhouzhi county. Gaoling district had the lowest score of 0.2573, and the carrying capacity of groundwater resources was low for this region.
To facilitate the comparison, the study area was unified, and the results were represented as H (high), M (medium), and L (low). We found that the results obtained by the comprehensive fuzzy discriminant method were too conservative according to the actual situation of groundwater in Xi’an. The results of this study were more realistic than those obtained by traditional methods. The results of the comparative analysis are shown in Table 4.
6.2. Conclusions
- (1)
- By analyzing the definition of the concept of groundwater carrying capacity, we proposed a more comprehensive method for evaluating the carrying capacity of groundwater and the corresponding characteristics and evaluation principles. We discussed the evaluation method of groundwater carrying capacity. We proposed the probabilistic neural network method based on the ‘W–F extension law’. This method combined the advantages of the index standard classification of the ‘W–F extension law’ and the classification advantages of the probabilistic neural network. It avoided subjectivity while determining the index system and weight of the groundwater carrying capacity. The evaluation results were objective and unique, the index standard was not limited by regionality, the evaluation scope was broadened, the non-linear relationship between the evaluation indices and the evaluation results was determined, the analysis was quick, and the number of classifications could be determined according to the requirements. Compared to the evaluation results of other methods, the evaluation results of this method were more realistic and informative for formulating measures to protect and manage groundwater. It is a new and reasonable method for evaluating the carrying capacity of groundwater.
- (2)
- Based on the detailed study of the concept and research results of groundwater carrying capacity, the indicators of groundwater carrying capacity were optimized and improved. The indexes of the population, economy, and environment carried by groundwater were not taken as the indexes to determine the bearing capacity, and only the properties of groundwater and its storage medium aquifer were considered.
- (3)
- The evaluation index system of the groundwater carrying capacity in Xi’an was established. The probabilistic neural network method based on the ‘W–F extension law’ was used to evaluate the groundwater carrying capacity in Xi’an, and the results were plotted. The results of the carrying capacity of groundwater in Xi’an were consistent with the mining situation. Due to the lack of data in individual partitions, the representative points of the partitions were poor, resulting in differences in evaluation results, which might be improved by selecting more representative points. According to the evaluation results, the very low and low bearing capacity areas of groundwater were located in the southern plain area of Zhouzhi county and Huyi district, the southern suburbs of Xi’an city, and the loess platform source area. The aquifer was easily drained, and thus, the groundwater exploitation in these areas should be strictly controlled. Due to the good recharge conditions of the riverside water source area, compared to the other evaluation zones, the groundwater of the Bahe, Fengzaohe, and Weibin water source areas had a high carrying capacity. However, due to the long-term overexploitation of water sources, different degrees of groundwater level depression funnels were found, and groundwater exploitation in these areas also needs to be limited.
- (4)
- Compared to the results of traditional methods, the results of this study were more consistent with the actual situation of groundwater in Xi’an.
Author Contributions
Conceptualization, resources, and methodology, W.Z. and S.L.; evaluation system, formal analysis, and investigation, writing—original draft preparation, J.G.; writing—review and editing, C.L. and H.C.; writing—review and methodology. All authors have read and agreed to the published version of the manuscript.
Funding
This research was funded by the Natural Science Basic Research Program of Shaanxi (Program No.2022JQ-457).
Data Availability Statement
Not applicable.
Conflicts of Interest
The authors declare no conflict of interest.
References
- Fan, C. Discussion on sustainable utilization of water resources in Xi’an. Groundwater 2007, 29, 17–19. [Google Scholar]
- Villarroya, F.; Aldwell, C.R. Sustainable management of groundwater resources. Environ. Geol. 1998, 34, 111–115. [Google Scholar] [CrossRef]
- Filho, W.L. Climate Change and the Sustainable Use of Water Resources; Springer: Berlin/Heidelberg, Germany, 2012. [Google Scholar]
- Varis, O.; Vakkilainen, P. China’s 8 challenges to water resources management in the first quarter of the 21st Century. Geomorphology 2001, 41, 93–104. [Google Scholar] [CrossRef]
- Tiwari, P.C.; Joshi, B. Environmental Changes and Sustainable Development of Water Resources in the Himalayan Headwaters of India. Water Resour. Manag. 2012, 26, 883–907. [Google Scholar] [CrossRef]
- Thomas, B.F.; Famiglietti, J.S. Sustainable groundwater management in the Arid Southwestern US: Coachella Valley, California. Water Resour. Manag. 2015, 29, 4411–4426. [Google Scholar] [CrossRef] [Green Version]
- Zhu, Y.; Xia, J.; Tan, G. A primary study on the theories and process of water resources carrying capacity. Prog. Geogr. 2002, 21, 180–188. [Google Scholar]
- Yuan, Y.; Gan, H.; Wang, Z.J.; Bao, W.F. Discussion on progress and development trend of the research on water resources carrying capacity. J. China Inst. Water Resour. Hydropower Res. 2006, 4, 62–67. [Google Scholar]
- Chen, S.Y.; Hu, J.M. Variable fuzzy assessment method and its application in assessing water resources carrying capacity. J. Hydraul. Eng. 2006, 37, 264–277. [Google Scholar]
- Zhang, B.C.; Sun, L.Y. Literature review on water carrying capacity. Mod. Econ. Sci. 2006, 28, 97–101,126. [Google Scholar]
- Yuan, W.; Lou, H.; Tian, J. Comprehensive evaluation of Water resources carrying capacity in Fuyang city. J. Hydraul. Eng. 2008, 39, 103–108. [Google Scholar]
- Zai, S.; Wen, J.; Wu, F. Evalution of water resources carrying capacity in Xinxiang City. J. Hydraul. Eng. 2011, 42, 783–788. [Google Scholar]
- Gao, Y.; Liu, C. Limit analysis on the development and utilization of regional water resources. J. Hydraul. Eng. 1997, 8, 73–79. [Google Scholar]
- Ruan, B.; Jin, S. Calculating model for moderaterly bearing capacity of regional water resources. J. Water Soil Conserv. 1998, 4, 57–61. [Google Scholar]
- Hui, Y.; Jiang, X.; Huang, Q. Research on evaluation index system of water resources bearing capacity. Bull. Soil Water Conserv. 2000, 21, 30–34. [Google Scholar]
- Long, T.; Jiang, W.; He, Q. Water resources carrying capacity: New perspectives based on economic analysis and sustainable development. J. Hydraul. Eng. 2004, 1, 38–45. [Google Scholar]
- Liu, M.; Nie, Z.L.; Wang, J.Z.; Wang, L.F. Fuzzy comprehensive evaluation of groundwater resources carrying capacity in North China Plain. Bull. Soil Water Conserv. 2014, 34, 311–315. [Google Scholar]
- Wang, R.; Zhang, Y.; Zhang, Y. Study on the theory and evaluation method of Large scale irrigation district groundwater resources carrying capacity. J. North China Univ. Water Resour. Electr. 2009, 30, 4–8. [Google Scholar]
- Han, X.; Xiao, L.; Qiu, L. The evaluation method of irrigation district groundwater resources carrying capacity based on catastrophe theory. J. Irrig. Drain. 2011, 30, 113–116. [Google Scholar]
- Wang, H.; Xue, H. Simulation of groundwater resources reserve capacity based on system dynamics. Comput. Simul. 2012, 29, 240–244. [Google Scholar]
- Xing, G.; Shi, W.; Zhang, Y. Assessment of groundwater resources carrying capacity in Xi’an city based on principal component analysis. J. China Hydrol. 2013, 33, 35–38. [Google Scholar]
- Gao, G.; Liu, J.; He, J. Investigation and Evaluation of Water Resources and Water Conservancy Division in Xi’an; Xi’an Water Conservancy Building Survey and Design Institute: Xi’an, China, 1986. [Google Scholar]
- Shaanxi Provincial Department of Geology and Mineral Resources, Shaanxi Provincial Planning Committee. Environmental Geological Atlas of Xi’an Region; Xi’an Map Press: Xi’an, China, 1999; p. 4. [Google Scholar]
- Li, Z.; Peng, L. Ambient air quality standard based on Weber-Fechner extension law. Environ. Monit. China 2003, 19, 17–18. [Google Scholar]
- Yan, M. The Response of Groundwater System Vulnerability to Human Activities; Chinese Academy of Geological Sciences: Shijiazhuang, China, 2006. [Google Scholar]
- Antonakos, A.K.; Lambrakis, N.J. Development and testing of three hybrid methods for the assessment of aquifer vulnerability to nitrates, based on the drastic model, an example from NE Korinthia, Greece. J. Hydrol. 2007, 288–304. [Google Scholar] [CrossRef]
- Garrett, P.; Williams, J.S.; Rossoll, C.F.; Tolman, A.L. Are groundwater vulnerability elassifieation systems workable? In In National Ground Water Association Columbus. In Proceedings of the FOCUS Conference on Eastern Regional Ground-Water Issues, Kitchener, ONT, Canada, 17–19 October 1989; pp. 329–343. [Google Scholar]
- Vrba, J.; ZaPorozec, A. Guidebook on Mapping Groundwater Vulnerability. International Association of Hydrogeologists Intemational Contributions to Hydrogeology; FGR, Heise Publication: Hannover, Germany, 1994; Volume 16. [Google Scholar]
- Merehant, J. GIS-based groundwater Pollution hazard assessment: A critical review of the DRASTIC model. Photogramm. Eng. Remote Sens. 1994, 60, 1117–1127. [Google Scholar]
- Rosen, L. A study of the DRASTIC methodology with emphasis on Swedish conditions. Ground Water 1994, 278–285. [Google Scholar] [CrossRef]
- Chen, S. Engineering Fuzzy Set Theory and Application; National Defense Industry Press: Beijing, China, 1998; pp. 4–5, 39, 46. [Google Scholar]
- Bai, P.; Song, X. Evaluation of groundwater resources carrying capacity in Xi’an based on fuzzy comprehensive evaluation. Agric. Res. Arid. Areas 2010, 28, 141–145. [Google Scholar]
Figure 1.
A distribution map of Xi’an shows the distribution of the landform, administrative division, and groundwater monitoring well.
Figure 1.
A distribution map of Xi’an shows the distribution of the landform, administrative division, and groundwater monitoring well.

Figure 2.
A hydrogeological map of Xi’an.

Figure 3.
The distribution of representative points of groundwater overload assessment zones in the plain area of Xi’an city.
Figure 3.
The distribution of representative points of groundwater overload assessment zones in the plain area of Xi’an city.

Figure 4.
Evaluation results of groundwater carrying capacity.


Table 1.
Standard limits of the groundwater carrying capacity evaluation index.
| Index | ki | Rimin | I | Ri2 | II | Ri5 | III | Ri8 | IV | Rimax |
|---|---|---|---|---|---|---|---|---|---|---|
| Precipitation | 1.065 | 390.30 | 442.94 | 535.49 | 647.39 | 734.70 | ||||
| Phreatic water level depth | 1.450 | 82.21 | 39.10 | 12.82 | 4.21 | 2.00 | ||||
| Permeability coefficient of phreatic aquifer | 1.479 | 1.00 | 2.19 | 7.07 | 22.87 | 50.00 | ||||
| Phreatic aquifer thickness | 1.231 | 10.00 | 15.16 | 28.28 | 52.78 | 80.00 | ||||
| The decline range of phreatic water level | 1.576 | 37.73 | 15.20 | 3.88 | 0.99 | 0.40 | ||||
| The permeability coefficient of confined aquifer | 1.427 | 1.00 | 2.04 | 5.92 | 17.19 | 35.00 | ||||
| Confined aquifer thickness | 1.223 | 20.00 | 29.93 | 54.77 | 100.25 | 150.00 | ||||
| The buried depth of confined water level | 1.540 | 150.00 | 63.25 | 17.32 | 4.74 | 2.00 |
Table 2.
Evaluation zoning table of groundwater carrying capacity in study area.
| Regions | Sub-Regions | Evaluation Area Number | Geomorphology of The Evaluation Area |
|---|---|---|---|
| Yanliang District | First terrace | 1 | First terrace |
| Gaoling District | First terrace | 2 | First terrace |
| Lintong District | Floodplain and first terrace | 3 | Floodplain and first terrace |
| Second terrace | 4 | Second terrace | |
| Ma’e plateau | 5 | Loess plain | |
| City Six Districts | Weibin water resource | 6 | Floodplain |
| Floodplain | 7 | Floodplain | |
| Bahe water resource | 8 | First terrace | |
| Northern suburb | 9 | First terrace | |
| Near the western wall | 10 | Second terrace | |
| Southern suburb | 11 | Third terrace | |
| Shaoling plateau | 12 | Loess plain | |
| Madu Wang | 13 | First terrace | |
| Liantian County | Third terrace | 14 | Third terrace |
| Bailu plateau | 15 | Loess plain | |
| Chang’an District | Shaoling plateau | 16 | Loess plain |
| Diluvial fan | 17 | Diluvial fan | |
| Shenhe plateau | 18 | Loess plain | |
| Second or third terrace | 19 | Second or third terrace | |
| First terrace | 20 | First terrace | |
| Fengzaohe water resource | 21 | Floodplain | |
| Huyi District | Floodplain | 22 | Floodplain |
| First terrace | 23 | First terrace | |
| Second terrace | 24 | Second terrace | |
| Diluvial fan | 25 | Diluvial fan | |
| Zhouzhi County | Floodplain | 26 | Floodplain |
| First terrace | 27 | First terrace | |
| Lanmei plateau | 28 | Loess plain | |
| Diluvial fan | 29 | Diluvial fan |
Table 3.
Normalized results of the standard limit of groundwater carrying capacity evaluation index.
Table 3.
Normalized results of the standard limit of groundwater carrying capacity evaluation index.
| Precipitation | Phreatic Water Level Depth | Permeability Coefficient of Phreatic Aquifer | Phreatic Aquifer Thickness | Phreatic Water Level Drop | The Permeability Coefficient of Confined Aquifer | Confined Aquifer Thickness | The Buried Depth of Confined Water Level | |
|---|---|---|---|---|---|---|---|---|
| I | 0.531 | 1.000 | 0.020 | 0.125 | 1.000 | 0.029 | 0.133 | 1.000 |
| II | 0.603 | 0.476 | 0.044 | 0.189 | 0.403 | 0.058 | 0.200 | 0.422 |
| III | 0.729 | 0.156 | 0.141 | 0.354 | 0.103 | 0.169 | 0.365 | 0.115 |
| IV | 0.881 | 0.051 | 0.457 | 0.660 | 0.026 | 0.491 | 0.668 | 0.032 |
Table 4.
Comparative analysis of the results of the evaluation methods.
| Region | Yanliang District | Gaoling District | Lintong District | City Six Districts | Liantian County | Chang’an District | Huyi District | Zhouzhi County |
|---|---|---|---|---|---|---|---|---|
| Probabilistic neural network method based on ‘W–F extension law’ | M | M | H | H | L | L | L | L |
| Comprehensive fuzzy discriminant method | L | L | L | L | L | L | L | L |
Publisher’s Note: MDPI stays neutral with regard to jurisdictional claims in published maps and institutional affiliations. |
© 2022 by the authors. Licensee MDPI, Basel, Switzerland. This article is an open access article distributed under the terms and conditions of the Creative Commons Attribution (CC BY) license (https://creativecommons.org/licenses/by/4.0/).
Share and Cite
MDPI and ACS Style
Gao, J.; Zhou, W.; Li, S.; Li, C.; Chen, H. The Evaluation of Groundwater Carrying Capacity in Xi’an. Water 2022, 14, 3756. https://doi.org/10.3390/w14223756
AMA Style
Gao J, Zhou W, Li S, Li C, Chen H. The Evaluation of Groundwater Carrying Capacity in Xi’an. Water. 2022; 14(22):3756. https://doi.org/10.3390/w14223756
Chicago/Turabian StyleGao, Jing, Weibo Zhou, Shuwu Li, Changhu Li, and Haiyun Chen. 2022. "The Evaluation of Groundwater Carrying Capacity in Xi’an" Water 14, no. 22: 3756. https://doi.org/10.3390/w14223756
Note that from the first issue of 2016, this journal uses article numbers instead of page numbers. See further details here.