Article

Dams Pose a Critical Threat to Rivers in Brazil’s Cerrado Hotspot

by
Manuel Eduardo Ferreira
1,*,
Sérgio Henrique de Moura Nogueira
1,
Edgardo Manuel Latrubesse
2,
Marcia Nunes Macedo
3,4,
Marcos Callisto
5,
José Fernandes Bezerra Neto
5 and
Geraldo Wilson Fernandes
5
1
Image Processing and Geoprocessing Laboratory—LAPIG, Social Environmental Studies Institute, Federal University of Goiás, Campus II, Goiânia 74001-970, GO, Brazil
2
Graduate Program in Environmental Sciences, Federal University of Goiás, Campus II, Goiânia 74001-970, GO, Brazil
3
Woodwell Climate Research Center, 149 Woods Hole Road, Falmouth, MA 02540-1644, USA
4
Amazon Environmental Research Institute—IPAM, CLN 211 Bloco B Sala 201, Asa Norte, Brasília 70863-520, DF, Brazil
5
Institute of Biological Sciences, Department of Genetics, Ecology & Evolution, Federal University of Minas Gerais, Belo Horizonte 31270-901, MG, Brazil
*
Author to whom correspondence should be addressed.
Water 2022, 14(22), 3762; https://doi.org/10.3390/w14223762
Submission received: 20 September 2022 / Revised: 6 November 2022 / Accepted: 12 November 2022 / Published: 19 November 2022
(This article belongs to the Special Issue Tropical Rivers and Wetlands in the Anthropocene)

Abstract

:
Hydropower dams are touted as one of the cleanest forms of energy production, yet they are associated with severe environmental impacts on both the physical structure and functioning of river ecosystems. The threat is particularly acute in the Brazilian Cerrado—a biodiverse savanna region, spanning over 2 million km2, that concentrates the headwaters of several critical South American watersheds. Our study analyzed the current distribution of large and small hydroelectric plants in the Cerrado and focused on understanding their effect on land use changes. We also propose a Dam Saturation Index (DSI) to help spur more integrated planning for this region. Results indicate that the Cerrado river basins contains 116 (30%) of Brazil’s large hydroelectric plants and 352 (36%) of its small hydroelectric plants. Moreover, these plants spurred significant land use changes within a 5-km buffer of the dams, with over 2255 km2 of native vegetation cleared by 2000 and an additional 379 km2 in the ensuing 20 years, could reach ~1000 km2. Based on the historical anthropization process in the Brazilian savannas, we expect new crops, pastures, and urban equipment to be incorporated into this landscape, with different impact loads.

1. Introduction

The growing demand for energy in Brazil has spurred a massive increase in the planning and construction of new hydropower dams, particularly in the Amazon (tropical forest) and Cerrado (savanna) biomes [1,2]. The Brazilian government aims to supply three-quarters of its energy demand through this network of dams [3,4]. Although touted as one of the cleanest forms of energy generation in terms of greenhouse gas emissions [5], hydroelectric dams are known to have a suite of other hydrophysical and environmental impacts [1,6,7,8,9,10]. Moreover, these hydropower systems may be even less “green” than generally assumed, given recent evidence that their reservoirs are important sources of methane (CH4) and carbon dioxide (CO2) emissions into the atmosphere. These emissions stem from the anoxic decomposition of organic matter submerged in dam reservoirs, particularly during extreme droughts [11,12,13].
As in other parts of the world, the construction of dams has drastically altered the hydrology and sediment dynamics of Brazilian river systems, fundamentally changing sediment loads, the transport of suspended and bedload sediments, and river geomorphology [1,14,15,16]. The conversion of lotic habitats into semi-lentic habitats creates novel environments that are inhospitable to many species, particularly those adapted to flowing waters (rheophilic) and seasonal flood pulses [17,18,19,20,21,22,23,24,25]. This can trigger important negative impacts on ecosystem functioning, with cascading effects on biodiversity and the livelihoods of local populations, both of which are adapted to the natural seasonality of the rivers [24,25,26,27,28].
Most large hydropower dam projects in Brazil were established in the 1970s and 1980s [29] and were conceived under a development paradigm that did not consider the environmental impacts in the project plans. But today, the country finds itself engaged in a broad and unavoidable debate—weighing historic energy policies that have depended largely on the construction of large hydropower dams against the need to diversify the energy grid and develop a legal framework that guarantees the conservation of water resources and socio-environmental sustainability.
The Brazilian Cerrado biome, a neotropical savanna spanning over 2 million km2, is the region with the largest potential for hydroelectric development given its topography, central location in the country, and concentration of headwaters that feed some of the principal watersheds of South America [2,30]. As of 2021, the Cerrado had 116 large hydropower dams (UHE, Portuguese acronym) installed or under construction, generating over 30 megawatts of power, and 352 small hydropower dams (PCH, Portuguese acronym), generating 5–30 megawatts of power. Of these, 35 UHEs and 124 PCHs were already in operation, and the remaining were under construction or in the advanced planning stages. The Cerrado’s great potential for further hydroelectric development is worrisome, given that 39.69% of the UHEs and 39.32% of the PCHs in Brazil are already located in this biome [4].
Recent studies focusing on hydroelectric energy development in the Amazon point to critical threats to freshwater ecosystems due to hydrological alterations by dams. These threats are exacerbated by a lack of integrated planning that considers water resources, conservation targets, and the electric sector as part of comprehensive management plans [1,14,28,31]. The situation is even more dire for the Cerrado, where the sheer number of dam projects and the high rate of conversion of native vegetation far outpaces that of the Amazon [2,30]. Nearly half of Cerrado’s native vegetation has already been converted to other uses, representing approximately 1 million km2 [30,32], and few protections exist to prevent further clearing. There is no clear pathway for improved territorial planning, particularly with respect to hydroelectric development.
Add to this the growing water scarcity observed in the region, where severe droughts are becoming increasingly common and annual rainfall has decreased in recent years [33,34]. The demand for water and energy in the Cerrado is increasing rapidly because of the expansion of irrigation to augment the production of grains, as well as secondarily for urban expansion [35]. In this context, furthering the research of [2], which analyzed hydroelectric plants in the face of land use and land cover changes and biodiversity, our study presents the current distribution of large (UHEs) and small (PCHs) hydropower dams (existing and planned) in the Cerrado biome and analyzes their impacts on the surrounding areas. The study also aims to propose a dam saturation index (DSI) for this region and contribute to the understanding of the consequences of hydropower dams on land use changes in their areas of influence, which include protected areas and priority areas for biodiversity conservation.

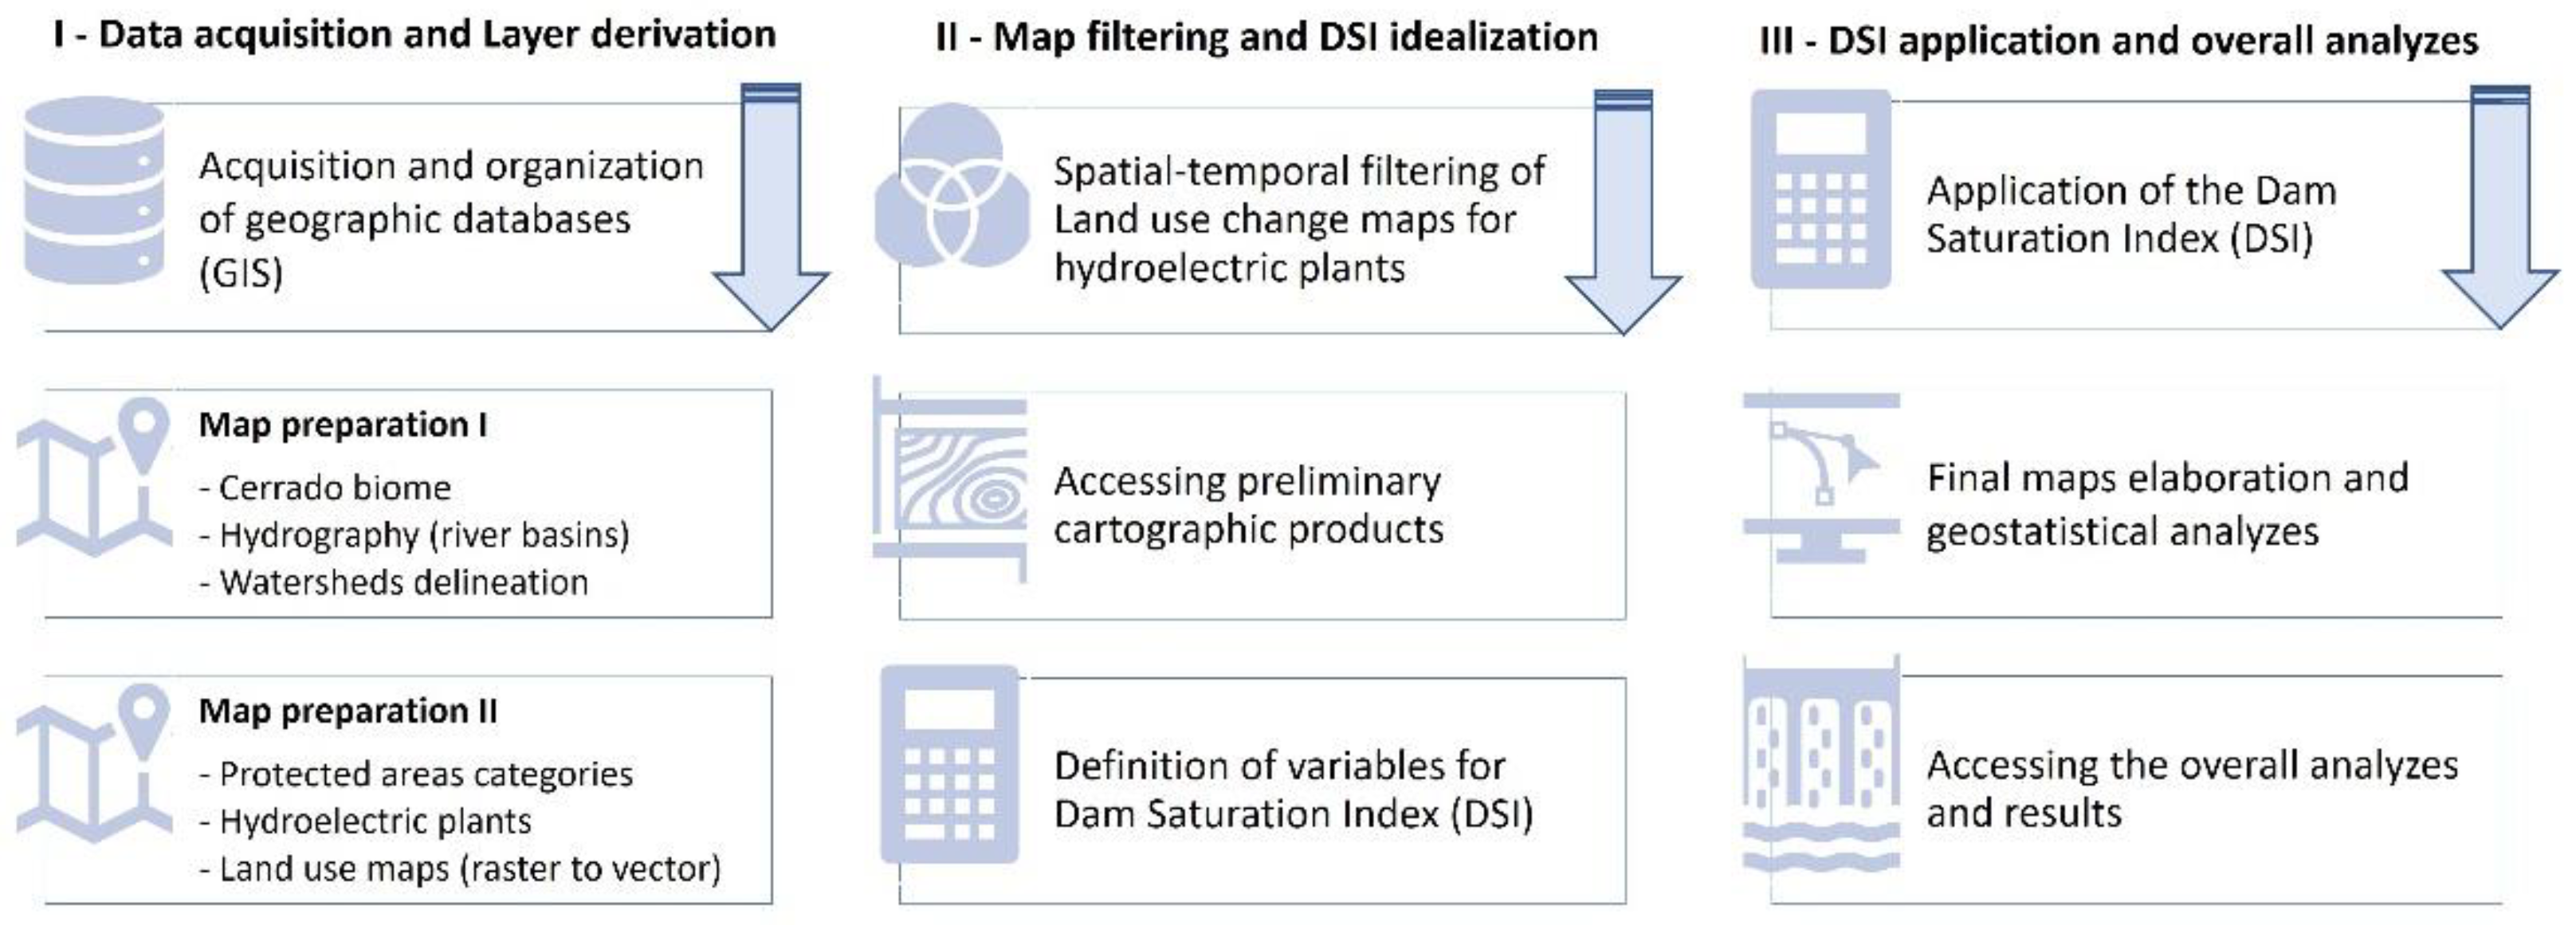
2. Materials and Methods

The methodological steps of this study are briefly presented in a flowchart, as shown in Figure 1, highlighting three sequential phases: I—Data acquisition and layers derivation (e.g., geographic database and map preparation); II—Map filtering and dam saturation index (DSI) idealization (e.g., spatial-temporal filtering of land use change maps, and terms of DSI); and III—DSI application and overall analyzes. In the following paragraphs, these phases are detailed, with a complete description of the study area, databases, and analysis procedures.
Located in the central region of Brazil, the Cerrado is the largest biome in South America and encompasses the headwaters of many of the country’s main hydrographic basins [30]. We adopted the official National Hydrographic Division by the Brazilian National Water and Sanitation Agency (ANA, Portuguese acronym) [36] to harmonize our results with the geographic and territorial framework of the National Water Resources Plan. The official limit of the Cerrado was obtained from the Brazilian Institute of Geography and Statistics (IBGE, Portuguese acronym). Thus, the biome spans nine of the twelve hydrographic regions (HRs) established by the National Council on Water Resources (Figure 2).
Figure 2. Distribution of planned and operational dams in the Cerrado biome as of 2021. Dataset from ANEEL [4] and IBGE [37].
Water 14 03762 g002
The locations of PCHs and UHEs were obtained from the Electric Sector Georeferenced Information System (SIGEL, Portuguese acronym) [38], published by the Brazilian National Agency of Electric Energy (ANEEL, Portuguese acronym) [4]. Data tables and shapefiles were organized with the best available information about planned and operational PCHs and UHEs as of 2021.
To evaluate the impact of hydroelectric projects within protected areas, we used the dataset from Brazilian Ministry of Environment (MMA, Portuguese acronym) [29]. As of 2021, the Cerrado had 484 protected areas, including 204 Conservation Units (designated strictly for environmental conservation) and 280 Sustainable Use Areas (designated for sustainable resource use) according to Brazil’s National System of Conservation Units (SNUC, Law No. 9.985, 18 July 2000). Conservation Units (e.g., Ecological Stations, Biological Reserves, National Parks, Natural Monuments, and Wildlife Refuges) aim to conserve native vegetation and expressly prohibit the consumption, collection, damage, or destruction of natural resources. Sustainable Use Areas (e.g., Environmental Protected Areas, Areas of Relevant Ecological Interest, National Forests, Extractive Reserves, Fauna Reserves, Sustainable Development Reserves, and Private Nature Reserves), on the other hand, aim to promote conservation while permitting sustainable use of natural resources within their boundaries. Currently, the total area protected in all categories of Conservation Units is around 175,091 km2, just 8.82% of the Cerrado biome [39].
To evaluate the potential impact of hydroelectric projects outside protected areas, we combined the maps of UHEs and PCHs with the location of sensitive biodiversity areas. These areas were identified through the initiative on Priority Areas for Biodiversity Conservation in the Cerrado and Pantanal biomes led by WWF (World Wide Fund For Nature) [40] in cooperation with MMA. This project aimed to guide environmental management and develop strategies for on-the-ground actions to improve effective protection of these two biomes. The prioritization was completed based on field surveys of flora and fauna, reviews of the scientific literature, and watersheds delineated using the hydrosheds database [41]. Priority categories used to guide the implementation of these actions included extremely high (I), very high (II), and high (III) priorities [40].
The spatial distribution analysis of planned and operational UHEs and PCHs in the Cerrado (dataset from 2021) was combined in a geographic information system (GIS), where we crossed their coordinates with different datasets: hydrographic regions, protected areas, priority areas for biodiversity conservation, and land use maps from the MapBiomas project (1:50,000 scale, based on Landsat imagery) [42]. To assess the proximity of hydroelectric dams to strictly protected conservation areas, we included a 10-km buffer zone to evaluate impacts within the area of influence around each protected area. Because there is no established minimum buffer zone for these areas, the de facto buffer zone is defined by the protected area Management Plans and can vary considerably.
Aiming to evaluate the distribution of planned hydropower dams according to different land use and land cover classes, we considered the most recent land cover classification for the Cerrado biome [42]. The resulting map was analyzed by means of 5-km buffers around the central coordinate of each PCH/UHE included in the SIGEL [38] database (Figure 3). These regions were produced to characterize the land use and land cover within the area of influence of the plant for each hydroelectric dam.
Based on the areas in each land use category (Agriculture, Urban Area, Pasture, and Native Vegetation), we calculated the percentage of each class present in the buffer and identified the dominant cover class. This procedure was repeated using land use maps from 2000 and 2020 (Mapbiomas project collection 6) [42], allowing us to quantify land- use changes occurring around hydropower dams over two decades.
The use of indices such as the dam environmental vulnerability index (DEVI) to assess the impacts and vulnerability of rivers and fluvial basins to dams has been successful in Brazil [1]. Following that methodological rationale, we created a Dam Saturation Index (DSI) for Level 5 watersheds [43], which have an average basin area of 47,000 km2. The DSI represents a proxy for potential watershed degradation, as measured by the number of planned and operational hydroelectric dams (UHEs e PCHs) and the percent remaining native vegetation.
We attributed a higher weight (1.0) to large hydroelectric dams (UHEs), representing their higher expected environmental impact (e.g., flow changes and flooded area) [44]. Small hydropower dams (PCHs) were given half the weight (0.5) of the UHEs, since they have smaller reservoirs and a smaller expected environmental impact. That said, the index was also designed to capture the large number of small PCHs in some watersheds, which could lead to cumulative impacts that exceed those of UHEs [7]. Planned PCHs and UHEs were given values of 0.2 and 0.1, respectively. This was done in recognition of the fact that giving a similar weight to planned dams would lead to “saturation” of the index in many watersheds, masking the important existing impact of operational dams on the DSI score.
The scaling factors (weights) applied in the DSI index were based on input from researchers with expertise on physical and ecological processes in the Cerrado biome. We aimed to provide an integrated measure of the environmental impact of different categories of hydroelectric dams within Level 5 watersheds. It is worth noting, however, that the index only accounts for the number of dams per watershed and their cumulative impacts on flooded area or land clearing (e.g., neighborhood impact). We do not quantify impacts on flow changes, water temperature, sediment loading, or greenhouse gas emissions, or mercury methylation, although we recognize that these have important impacts on dams and their reservoirs [7].
As noted above, the DSI also reflects the proportion of remaining native vegetation in each watershed, applying weights as follows: 1.0 for watersheds with 0–20% remaining native vegetation (i.e., the least conserved watersheds and the ones to which the DSI will be least sensitive); 1.5 for watersheds with 21–40% native vegetation; 2.0 for watersheds with 41–60% native vegetation; 2.5 for watersheds with 61–80% native vegetation; and 3.0 for watersheds with 81–100% native vegetation (i.e., the most conserved watersheds and the ones most sensitive to the DSI). We adopted an interval of 0.5 here so as not to diminish the influence of planned and operational UHEs and PCHs on the DSI. We calculated the Dam Saturation Index (DSI) for each watershed in the Cerrado (Level 5 in the ottobacia framework) using Equation (1).
DSI = ((UHE_op × 1.0) + (PCH_op × 0.5) + (UHE_pl × 0.2) + (PCH_pl × 0.1)) × WR_pct
where,
UHE_op = 
number of operational UHEs,
PCH_op = 
number of operational PCHs,
UHE_pl = 
number of planned UHEs,
PCH_pl = 
number of planned UHEs,
WR_pct = 
Weight corresponding to the percentage of remaining Cerrado in the watersheds: 1.0 (if 0–20%), 1.5 (if 21–40%), 2.0 (if 41–60%), 2.5 (if 61–80%), or 3.0 (if 81–100%).
The result was normalized and categorized using Jenks natural breaks [45,46] into the following five categories of watershed sensitivity/vulnerability to dams: very low, low, moderate, high, and very high.

3. Results

In 2021, the region comprised of the Cerrado biome had 468 hydroelectric plants, of which 116 UHEs (35 in operation) and 352 PCHs (124 in operation). Most of the large planned hydroelectric plants are in the Araguaia-Tocantins watershed, as illustrated in Figure 4, followed by the Paraná, São Francisco, and Amazon basins.
Considering the hydrographic basins most impacted by the large hydroelectric plants in operation, the Paraná basin stands out, with approximately 20 generating plants. The hydrographic region of Paraná, with the country’s highest population and industry density, also encompasses the rivers with the highest total number of planned and operational UHEs (Table 1).
This basin (Paraná) also concentrated the vast majority of small hydroelectric plants, both those in operation (20) and planned (about 120), followed by the Tocantins-Araguaia and São Francisco hydrographic regions (Figure 4).

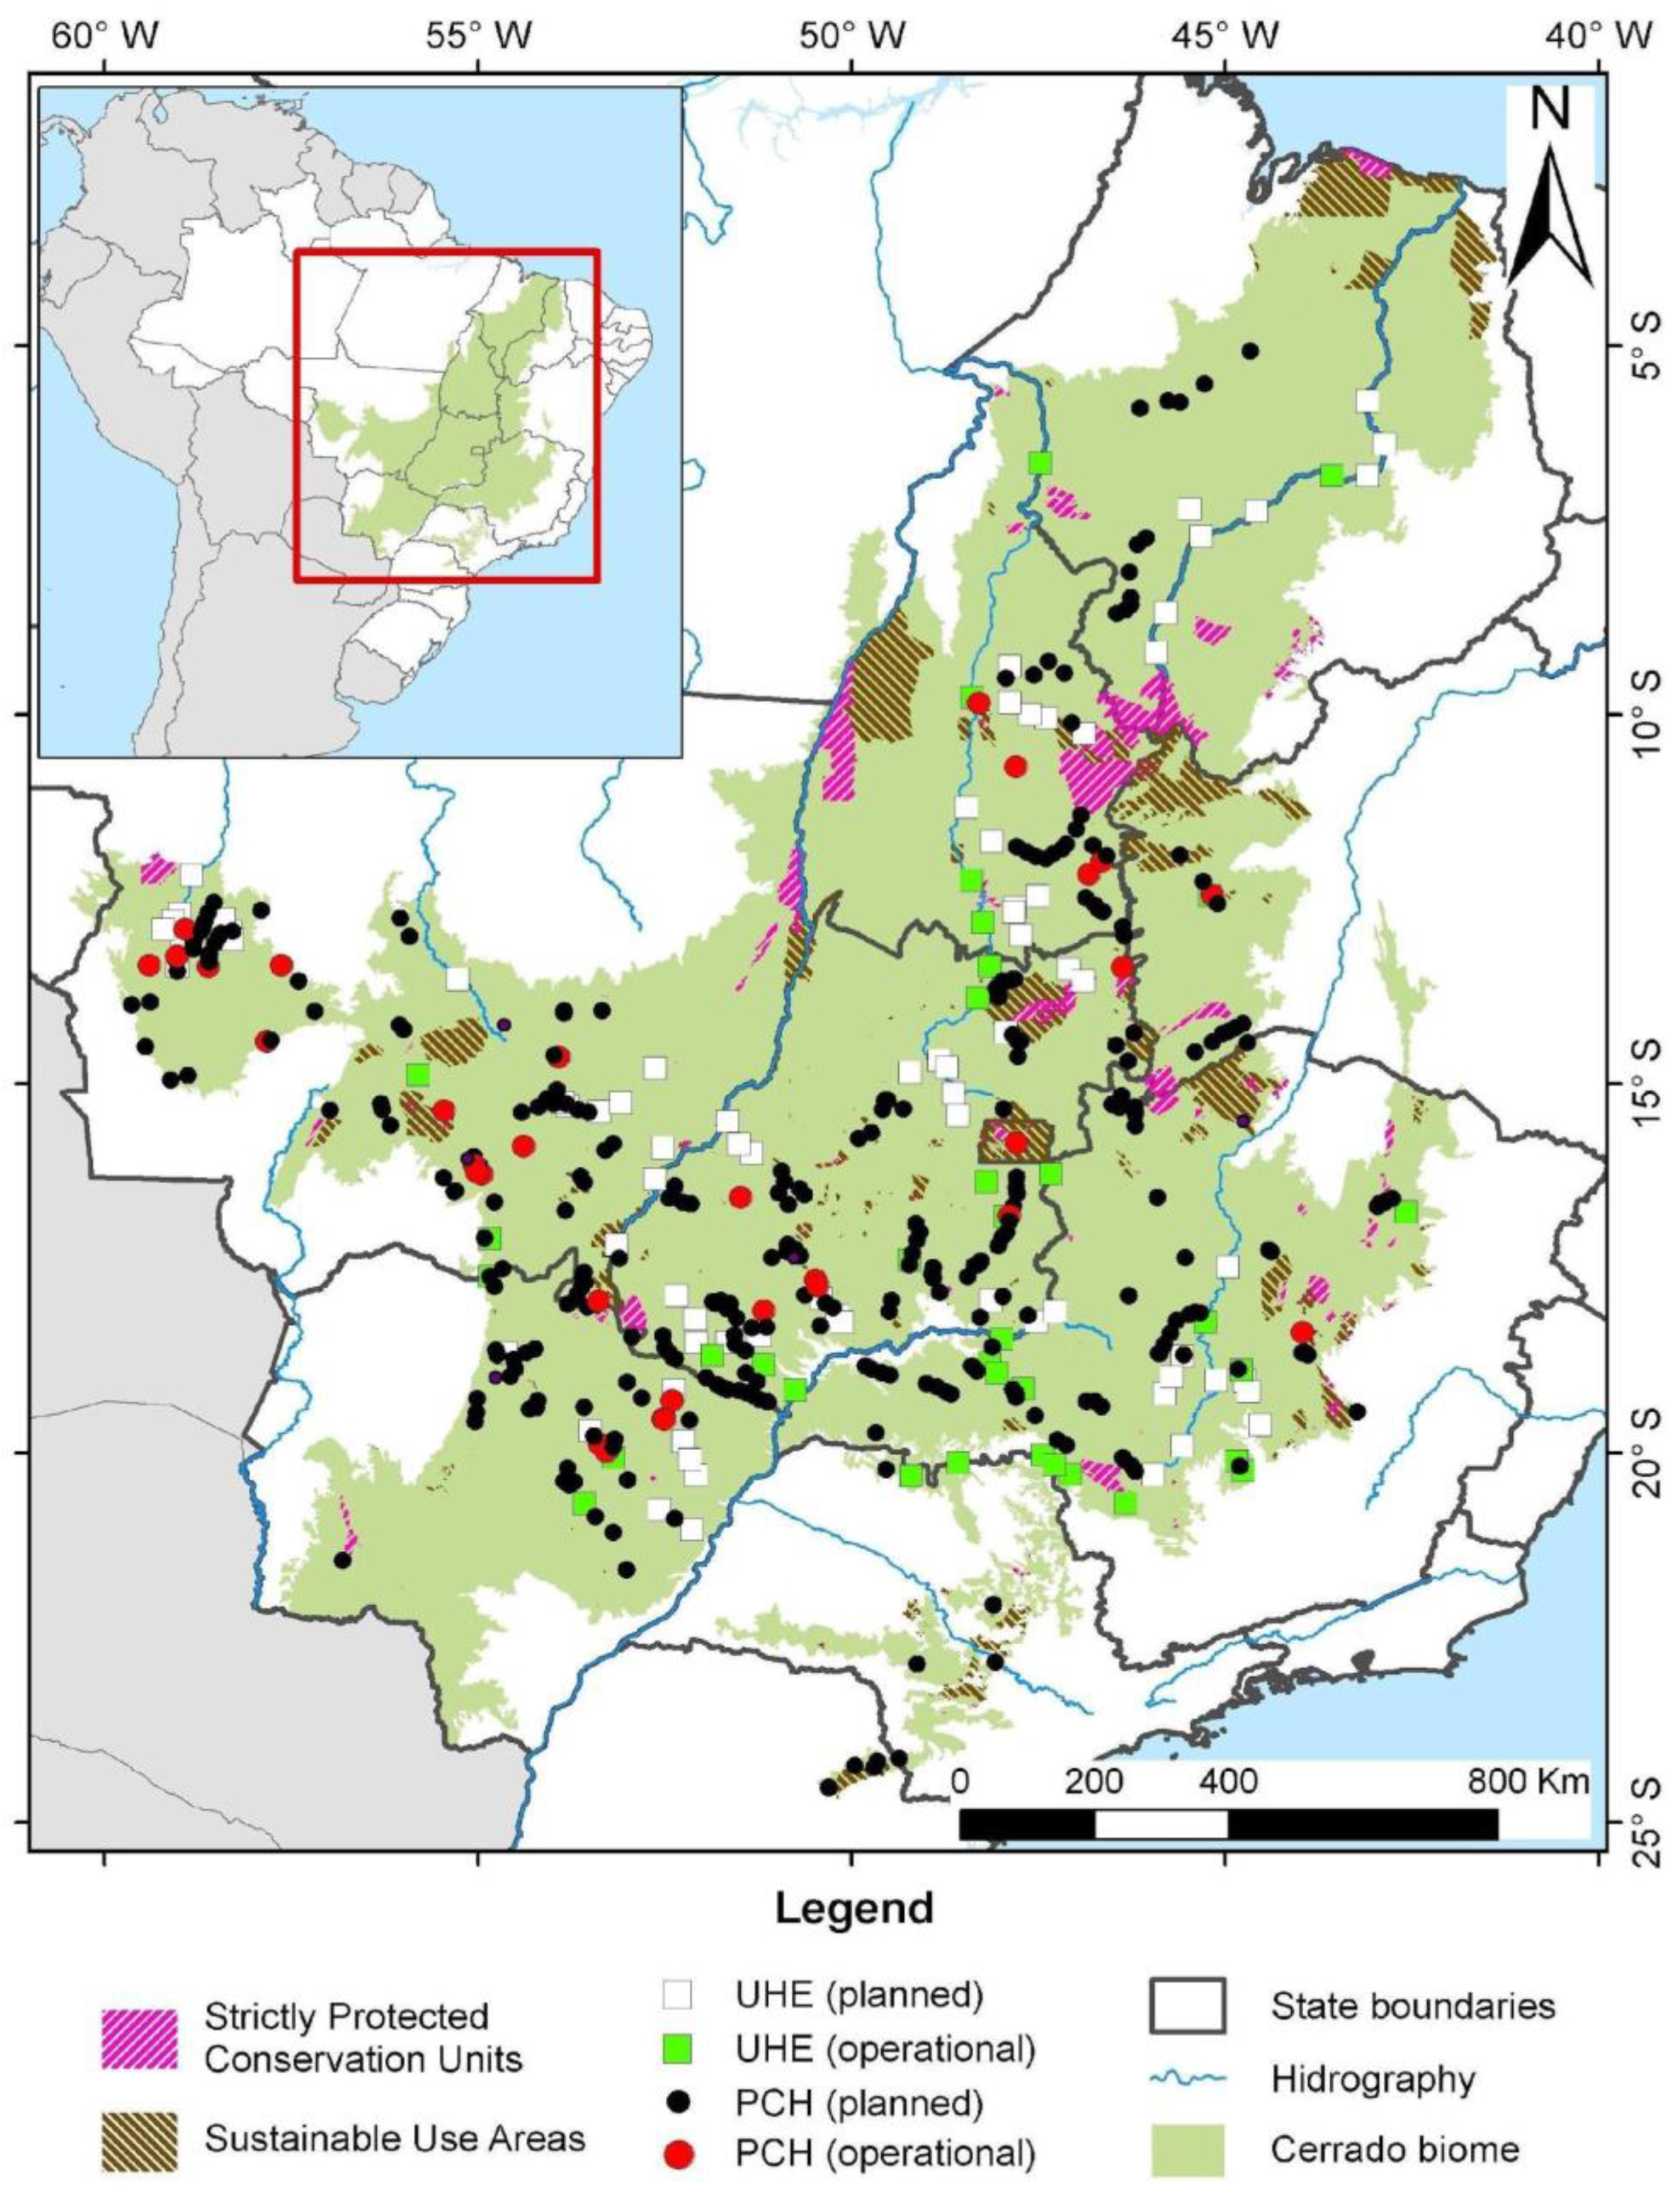
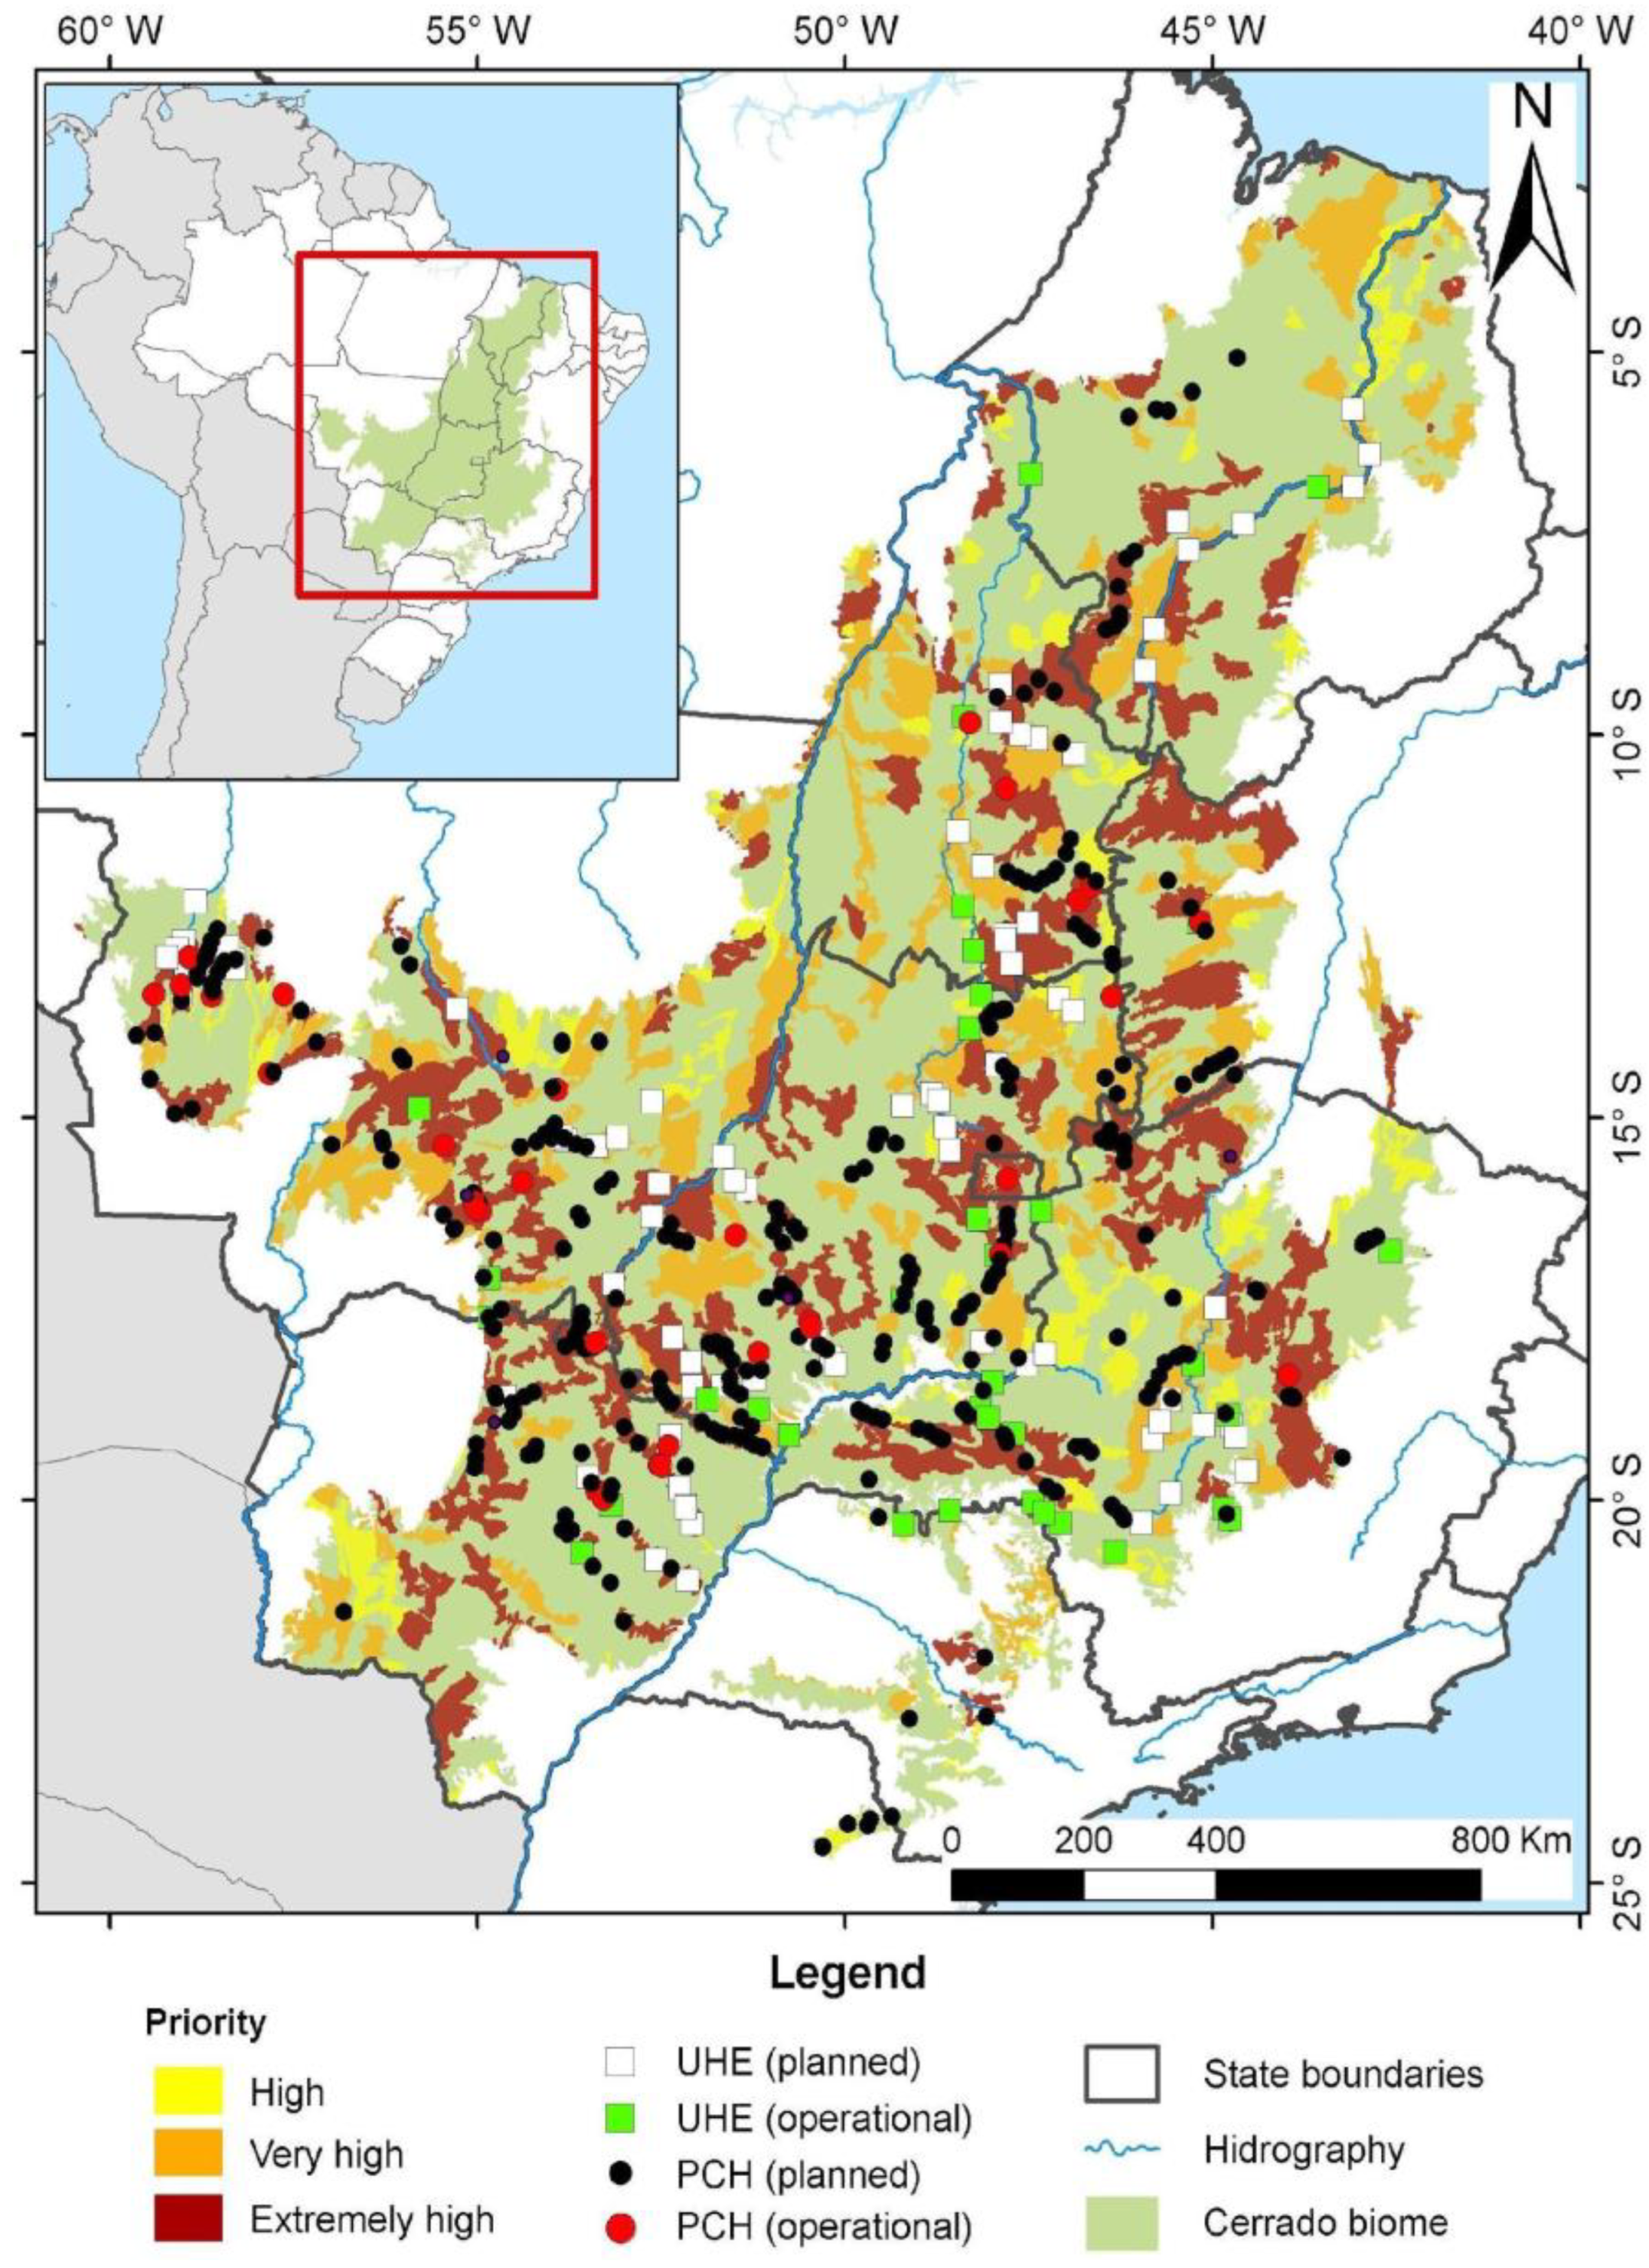
3.1. Proximity of Dams to Cerrado Priority Conservation Areas

Our analysis showed that three UHEs and 23 PCHs are operational or planned within Sustainable Use Areas (Figure 5). No UHE occurred within strictly protected conservation units, but four PCHs were found in these areas. Four of the PCHs in these conservation units had their licenses revoked, yet one of them remains operational. The remainder were listed as planned at the time of this analysis (last available data from 2021). Of the four UHEs located within sustainable use areas, three were operational and one was planned. One of the operational UHEs was created before the creation of the conservation unit. The main objective of creating the unit was to protect the remnants around the hydroelectric reservoir. Three of the 23 PCHs overlapping sustainable use areas were already operational.
We found 5 large hydropower dams (2 operational and 3 planned) to be operational within 10 km of strictly protected conservation units, affecting the following areas: Jalapão National Park (TO), Lambari Wildlife Refuge (GO), Serra da Canastra National Park (MG), Pau Furado State Park (MG), and Cristalina Wildlife Refuge (GO). In addition, 27 small hydropower dams (planned or operational PCHs) operate within the buffer zone of Conservation Units. Three of these PCHs were operational at the time of this analysis. Grão Mogol State Park (MG) had the largest number of planned dams (5 inventoried projects) within a 10 km buffer, whereas Cachoeira do Córrego do Café Natural Park (GO), Nascentes do Rio Taquari State Park (MS) and Guartelá State Park (PR) already have 2 operational PCHs in their buffer zone.
Considering the priority classes designated in the “Map of Priority Areas for Conservation, Use, and Benefit Sharing of Brazilian Biodiversity”, most hydropower dams are in regions of high, very high, or extremely high ecological value, though not necessarily those legally protected by Conservation Units (Table 2). As of 2021, a total of 77 UHEs were in priority conservation areas, with 22 in operation. A total of 219 PCHs operate within these areas, with 22 in operation (Figure 6).

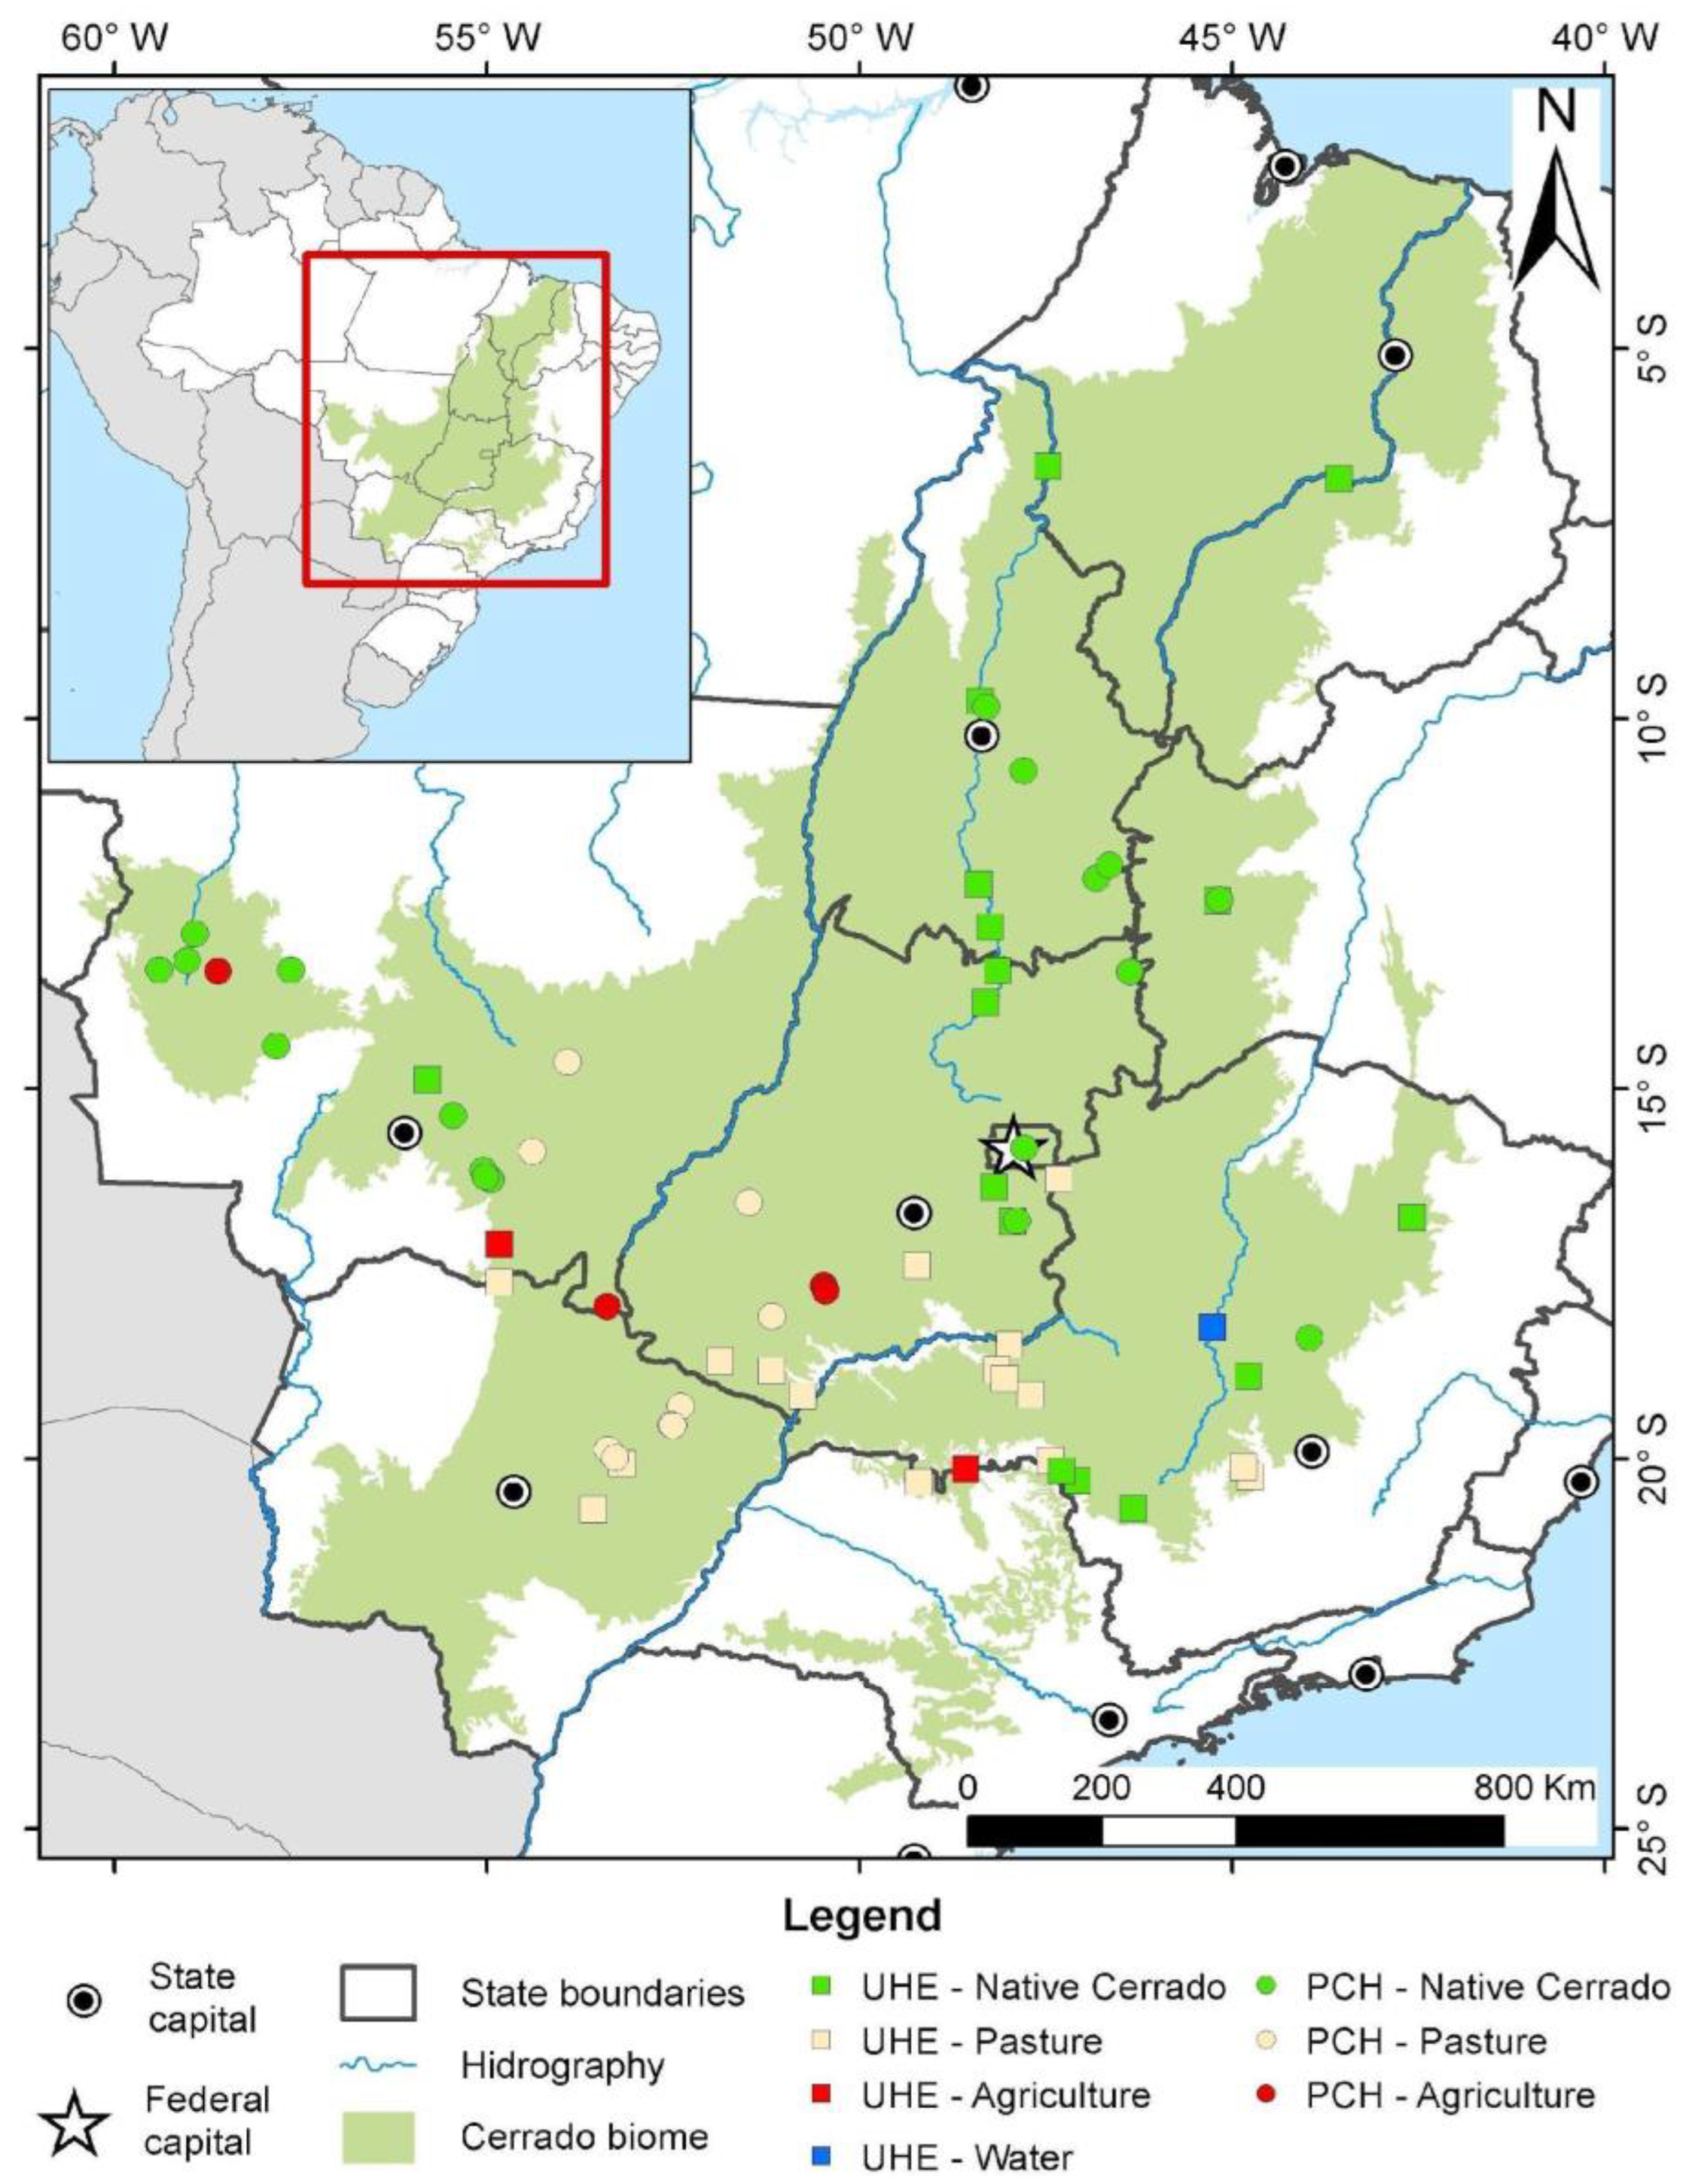
3.2. Influence of UHEs and PCHs on Remaining Native Vegetation

Based on our analysis of land use and remaining native vegetation located within a 5-km radius of each hydroelectric operation, we found that the highest concentration of PCHs and UHEs in remaining native vegetation occurs in the northern part of the Cerrado biome (Figure 7). This region also contains the majority of the remaining (~50%) Cerrado vegetation, although it is under increasing pressure for conversion to other uses [31,32].

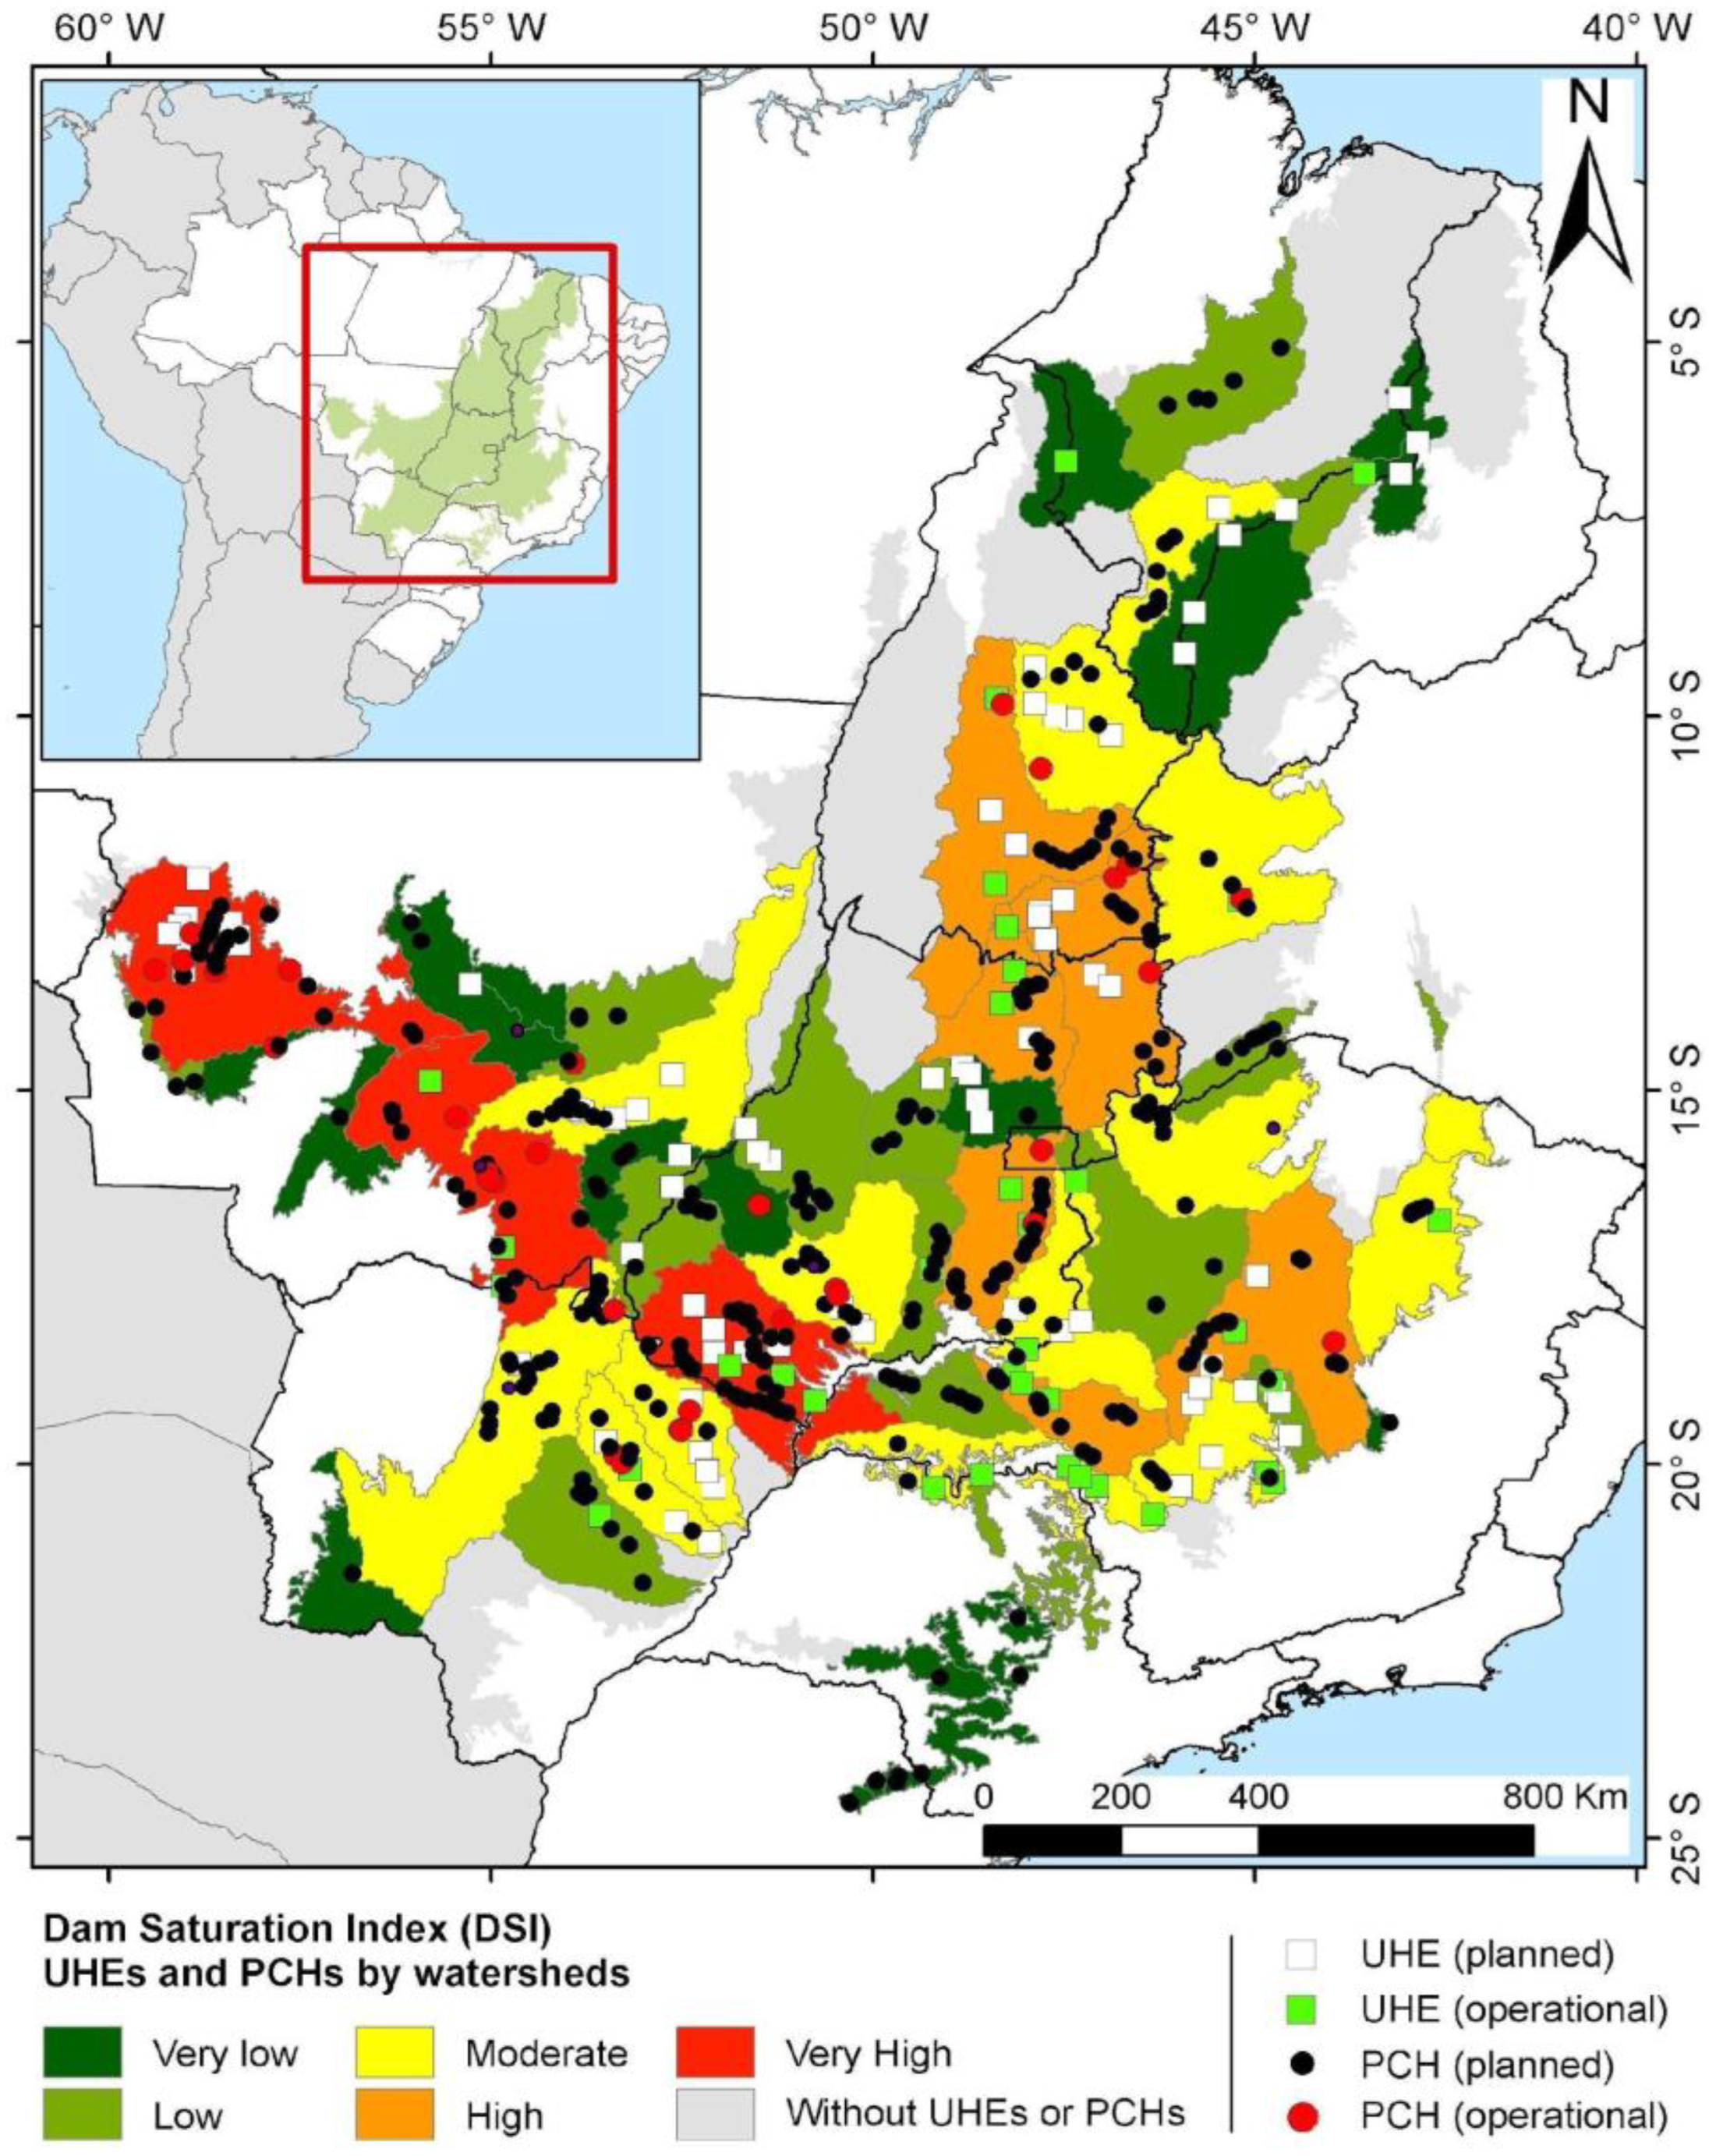
3.3. Environmental Saturation Index

We used the dam saturation index (DSI) to evaluate the spatial distribution of UHEs e PCHs and quantify their relative impacts on a given watershed (Pfafstetter Level 5), considering both their conservation value and potential environmental impacts. Watersheds with high and very high DSI scores are listed in Table 3. In general, watersheds with high and very high DSI scores were concentrated in the central and western portions of the biome (Figure 8).

4. Discussion

Our results show that most of the planned hydropower dams in the Cerrado operate in sensitive areas dominated by native vegetation, the majority of which have no legal protection. Such condition poses an imminent threat, considering that 6.65% of all native vegetation within a 5-km radius of dams spillway was cleared from 2000–2020 [42].
Hydroelectric reservoirs have affected large stretches of rivers on the Brazilian craton and plateau, transforming river corridors from lotic to semi-lentic systems (i.e., those with long periods of water retention) [47]. Simultaneously, rapid land cover and land use changes have accelerated erosion processes [48] and altered sediment regimes in these catchments, with profound impacts on the geomorphology of major rivers [49,50]. In this context, the construction of PCHs on smaller rivers, with lower discharge and more favorable geology (i.e., higher slope, with flows embedded in rocks) has emerged as an alternative strategy for hydroelectric development. Otherwise, we cannot discard the additive/synergic impact they have on the ecosystem, a matter which needs further attention.
Today, the most impacted system is the Paraná HR, where the sheer number of operational UHEs (18) suggests that this large river basin may be close to attaining full hydroelectric potential. Consequently, the Paraná has experienced notable changes in water quality, sediment dynamics, and river morphology. These physicochemical changes have increased fish mortality, degraded riparian zones, and escalated the cost of reservoir water treatment, among many other negative environmental consequences [50,51].
Several factors have contributed to the high concentration of UHEs and PCHs in the Paraná HR. First, it is the most populous and urbanized region of Brazil, concentrating 35% of the population (~74.8 million people), of which 93% live in urban areas [52]. Second, it accounts for 30% of the country’s water demand but has only 7% of the country’s total available water [53]. Finally, it is the most developed region in Brazil, with over 45% of the national GDP (gross domestic product) [54] and a significant industrial zone that requires both water and electricity. The resulting proliferation of dams has the potential to cause transboundary impacts on the neighboring countries of Argentina, Bolivia, Paraguay, and Uruguay—which share the Paraná basin and are already experiencing conflicts provoked by water scarcity and river mismanagement [55,56,57]. While beyond the scope of this paper, we believe this is a fertile area for future research.
Another region worth highlighting is the Tocantins-Araguaia HR, which spans the largest area once covered by native Cerrado vegetation and occupies a central location in the biome. It is also the region with the second largest number or planned UHEs. Its sheer size is of note, equivalent to 11% of the country’s area and spanning the largest drainage area completely within Brazil’s national territory. According to the official population estimate [52], its total population was 16.6 million in habitants or 7.8% of Brazil’s population. For these reasons, the Tocantins-Araguaia HR plays a strategic role in the country’s national development policy, which favors the expansion of the agricultural frontier, exploration of mineral resources, and hydropower development [58].
In 2021, the Tocantins River itself had 10 large hydropower dams, with 7 already in operation and 6 occurring within the limits of the Cerrado biome. Several natural characteristics of the Tocantins, including terrain with low permeability and the presence of high-slope drainage areas [59], together with large-scale deforestation (conversion of native vegetation to pastures and croplands), have led to a significant increase in discharge and delivery of sediments to the Araguaia and Tocantins rivers. These and other impacts on the river system have been documented by several studies [50,55,59,60,61,62].
The creation of Environmental Protection Areas (EPAs) has been used to justify the installation of several hydroelectric dams. In the Tocantins-Araguaia basin, two EPAs were created in the context of the São Salvador and Peixe Angical hydropower dams. EPAs are intended to guide land use and control land occupation of the surrounding power plants and reservoirs in the wake of their construction. They are common in other regions, including the João Leite watershed near Goiânia (central Goiás state) and the Pandeiros River watershed in northern Minas Gerais state, where they have helped protect infrastructure, guarantee water quality (if intended for human consumption), and promote the ecological restoration required by the Brazilian Forest Code. Despite these efforts, the direct impacts of damming on biodiversity remain.
The prevalence of PCHs within protected areas highlights the dissonance between conservation and development goals in these regions, underscoring the need to reevaluate the criteria established for the construction of infrastructure projects within conservation areas. For instance, the EPAs of Escarpa Devoniana (Paraná HR), Pouso Alto (Tocantins-Araguaia HR), and Rio Cênico Rotas Monçoeiras (Paraguai HR) include as many as 4 planned hydropower dams. The EPAs of Serra do Lajeado (Tocantins-Araguaia HR), São Bartolomeu (Paraná HR), and “Cachoeira do Ribeirão da Laje, do Rio Taquari, and Ribeirão das Furnas” already contain 1 PCH each. The number of new hydroelectric dams (UHEs and PCHs) planned within areas of remaining native Cerrado vegetation is also alarming, given that well over half of this biodiversity hotspot has already been cleared for other uses, and that less than 8.82% of the biome is formally protected. This situation is mirrored by the operational plants, with most UHEs and PCHs occurring in areas of native Cerrado, followed by pasturelands and croplands.
Our results agree with previous research indicating that the construction of dams not only degrades freshwater ecosystems, but also promotes additional clearing of native vegetation in the surrounding areas [2]. We found that the loss of native vegetation within a 5-km radius of hydroelectric dam spillways totaled 357 km2 from 2000–2020. The majority of the area cleared (328 km2) was attributable to dams that became operational after 2000, with new clearings in the order of 165 km2 for UHEs, and 163 km2 for PCHs.
Considering only the 116 UHEs already defined in the Cerrado, of which 35 are already in operation with the significant flooded area, the potential deforestation/degradation in this 5-km analyzed perimeter could reach ~1000 km2 (or 100,000 hectares). Based on the historical anthropization process in the Brazilian savannas, we expect new crops, pastures, and urban equipment to be incorporated into this landscape, with different impact loads. Thus, these data suggest that, in addition to direct deforestation for the construction of dams and their reservoirs, the installation of hydroelectric plants stimulates additional clearing of Cerrado vegetation in the surrounding landscape. Furthermore, this is a very conservative estimate as it only evaluates the area around the dam spillway, leaving out the entire region around the dam; hence, this is an issue deserving further evaluation. The resulting land use changes (Table 4) cause environmental degradation, which is especially problematic when they are located inside EPAs. As presented in Table 4, the largest gain in area occurred in the pasture class, with an increase in agricultural areas also occurring near UHEs.
The map illustrating the DSI index highlights the co-occurrence of watersheds with “very high” DSI and those with high environmental vulnerability. Given that many investments occur in close proximity to remaining cerrado vegetation, there is a high risk that these areas will be converted into croplands or pastures. This underscores the impacts of these changes on biodiversity, sediment loading in rivers, emissions of CO2, and ultimately on ecosystem services.

5. Conclusions

This study was carried out with an extensive dataset at local and regional scales (vector, raster, and census categories), drawn from multidisciplinary projects and government agencies and, therefore, limited to the products and services provided by the institutions described in the methodology section. Our weighted analysis for determining the DSI (dam saturation index) has considered the land use changes during the 1985–2020 period and the location of the most hydroelectric plants in the major river basins of the Cerrado biome, considering the publicly available information and experts’ knowledge. Hence, future research should regard some improvements, such as mappings based on high spatial resolution satellite images, in situ characterization of a sampling of hydroelectric plants (large and small, throughout the South–North biome transect), and a proposal for continuous landscape monitoring using multispectral indices by orbital and aerial remote sensing technics.
The Cerrado’s water resources and ecosystems are currently impacted by 116 existing dams, and the 394 planned dams will only exacerbate the negative environmental impacts on one of the most threatened biomes in the world. This research underscores the need for well-designed environmental studies that identify cumulative basin-scale impacts, as well as local impacts of hydroelectric projects and their compliance with existing environmental laws.
Establishing UHEs and PCHs in the Cerrado has produced direct and indirect environmental impacts. As such, the effects of installing UHEs and PCHs should be analyzed in an integrated manner at the scale of entire watersheds and in consideration of the local impacts on surrounding areas, as identified here. The expansion of hydropower development projects in the Cerrado has been justified by a recent increase in energy demand and economic development in Brazil, attracting new investments to the region from sectors such as agriculture and mining. In the current environmental scenario, we conclude that the proposed new plans for hydroelectric dams will concentrate overwhelmingly in sensitive areas with pristine Cerrado vegetation, as well as in river basins that are already highly fragmented by dams. This will promote further expansion of agriculture and ranching, particularly in the northern portion of the biome (i.e., the MATOPIBA region, which includes the states of Maranhão, Tocantins, Piauí, and Bahia).
Over the last decade, there have been several efforts to increase oversight and improve standards for licensing of new hydroelectric dams, but this planning has failed on several fronts and has concentrated primarily in the Amazon biome. We argue that the situation in the Cerrado today is even more dire. A high concentration of operational PCHs e UHEs is located within Priority Areas for Biodiversity Conservation or within legally protected areas designated for conservation or sustainable use. In some EPAs, these operational PCHs contradict the norms established by their own Management Plans and fail to comply with environmental laws (e.g., the Forest Code).
Hydroelectric dams have proliferated in the watersheds of all major Cerrado rivers. According to our dam saturation index, both large and small hydroelectric dams are concentrated in environmentally sensitive areas and many more projects are already planned. In the absence of holistic basin-scale management plans and comprehensive socio-environmental impact assessments, the Cerrado will remain at the center of Brazil’s agricultural and hydropower development plans—likely pushing this global biodiversity hotspot and its river systems past the breaking point.

Author Contributions

Conceptualization, M.E.F. and S.H.d.M.N.; methodology, M.E.F. and S.H.d.M.N.; software, S.H.d.M.N.; validation, M.E.F., S.H.d.M.N., M.N.M. and E.M.L.; formal analysis, M.E.F., S.H.d.M.N. and E.M.L.; writing—original draft preparation, M.E.F., S.H.d.M.N., E.M.L., M.N.M., M.C., J.F.B.N. and G.W.F.; writing—review and editing, M.E.F., S.H.d.M.N., E.M.L., M.N.M. and G.W.F. All authors have read and agreed to the published version of the manuscript.

Funding

This research received no external funding.

Institutional Review Board Statement

Not applicable.

Informed Consent Statement

Not applicable.

Data Availability Statement

Not applicable.

Acknowledgments

This article was developed under the Cerrado Knowledge Platform project, supported by the Critical Ecosystem Partnership Fund (CEPF—Cerrado). Additional funding was provided by the Conselho Nacional de Desenvolvimento Científico e Tecnológico—CNPq (Nexus-Cerrado #441463/2017-7) and NSF (INFEWS #1739724). M.E.F. and M.C. are a CNPq Research Fellow (grants #315699/2020-5, #304060/2020-8). M.C. and G.W.F. thank CNPq, FAPEMIG (PPM-00104-18), and MCTI/PPBio for grant support.

Conflicts of Interest

The authors declare no conflict of interest.

References

  1. Latrubesse, E.M.; Arima, E.Y.; Dunne, T.; Park, E.; Baker, V.R.; D’Horta, F.M.; Wight, C.; Wittmann, F.; Zuanon, J.; Baker, P.A.; et al. Damming the rivers of the Amazon basin. Nature 2017, 546, 363–369. [Google Scholar] [CrossRef] [PubMed] [Green Version]
  2. Latrubesse, E.M.; Arima, E.; Ferreira, M.E.; Nogueira, S.H.; Wittmann, F.; Dias, M.S.; Dagosta, F.C.P.; Bayer, M. Fostering water resource governance and conservation in the Brazilian Cerrado biome. Conserv. Sci. Pract. 2019, 1, e77. [Google Scholar] [CrossRef] [Green Version]
  3. Ministério de Minas e Energia—MME. Plano Nacional de Energia 2030. 2022. Available online: https://biblioteca.aneel.gov.br/ (accessed on 17 September 2022).
  4. Agência Nacional de Energia Elétrica—ANEEL. Banco de Informações de Geração da Agência Nacional de Energia Elétrica; ANEEL: Brasília, Brazil, 2022. Available online: https://dados.gov.br/dataset/siga-sistema-de-informacoes-de-geracao-da-aneel (accessed on 17 September 2022).
  5. Ometto, J.P.; Cimbleris, A.C.; dos Santos, M.A.; Rosa, L.P.; Abe, D.; Tundisi, J.G.; Stech, J.L.; Barros, N.; Roland, F. Carbon emission as a function of energy generation in hydroelectric reservoirs in Brazilian dry tropical biome. Energy Policy 2013, 58, 109–116. [Google Scholar] [CrossRef]
  6. Peluso, L.M.; Mateus, L.; Penha, J.; Bailly, D.; Cassemiro, F.; Suárez, Y.; Fantin-Cruz, I.; Kashiwaqui, E.; Lemes, P. Climate change negative effects on the Neotropical fishery resources may be exacerbated by hydroelectric dams. Sci. Total Environ. 2022, 828, 154485. [Google Scholar] [CrossRef]
  7. Castello, L.; Macedo, M.N. Large-scale degradation of Amazonian freshwater ecosystems. Glob. Chang. Biol. 2015, 22, 990–1007. [Google Scholar] [CrossRef] [PubMed]
  8. Val, A.; Fearnside, P.M.; Almeida-Val, V. Environmental disturbances and fishes in the Amazon. J. Fish Biol. 2016, 89, 192–193. [Google Scholar] [CrossRef] [PubMed]
  9. Freitas, C.E.; Mereles, M.D.A.; Pereira, D.V.; Siqueira-Souza, F.; Hurd, L.; Kahn, J.; Morais, G.; Sousa, R.G.C. Death by a thousand cuts: Small local dams can produce large regional impacts in the Brazilian Legal Amazon. Environ. Sci. Policy 2022, 136, 447–452. [Google Scholar] [CrossRef]
  10. Benchimol, M.; Peres, C.A. Widespread Forest Vertebrate Extinctions Induced by a Mega Hydroelectric Dam in Lowland Amazonia. PLoS ONE 2015, 10, e0129818. [Google Scholar] [CrossRef] [Green Version]
  11. Ferreira, J.; Aragão, L.E.O.C.; Barlow, J.; Barreto, P.; Berenguer, E.; Bustamante, M.; Gardner, T.A.; Lees, A.C.; Lima, A.; Louzada, J.; et al. Brazil’s environmental leadership at risk. Science 2014, 346, 706–707. [Google Scholar] [CrossRef]
  12. Almeida, R.M.; Nóbrega, G.N.; Junger, P.C.; Figueiredo, A.V.; Andrade, A.S.; de Moura, C.G.B.; Tonetta, D.; Oliveira, E.S.J.; Araújo, F.; Rust, F.; et al. High Primary Production Contrasts with Intense Carbon Emission in a Eutrophic Tropical Reservoir. Front. Microbiol. 2016, 7, 717. [Google Scholar] [CrossRef]
  13. Deemer, B.R.; Harrison, J.A.; Li, S.; Beaulieu, J.J.; DelSontro, T.; Barros, N.; Bezerra Neto, J.F.; Powers, S.M.; dos Santos, M.A.; Vonk, J.A. Greenhouse Gas Emissions from Reservoir Water Surfaces: A New Global Synthesis. BioScience 2016, 66, 949–964. [Google Scholar] [CrossRef] [PubMed] [Green Version]
  14. Timpe, K.; Kaplan, D. The changing hydrology of a dammed Amazon. Sci. Adv. 2017, 3, e1700611. [Google Scholar] [CrossRef] [PubMed] [Green Version]
  15. Stevaux, J.C.; Martins, D.P.; Meurer, M. Changes in a large regulated tropical river: The Paraná River downstream from the Porto Primavera Dam, Brazil. Geomorphology 2009, 113, 230–238. [Google Scholar] [CrossRef]
  16. Fontes, L.C.; Latrubesse, E.M.; Holanda, F.S.; Aquino, S. Major hydrological changes and bank e rosion in the lower São Francisco River, Brazil, as a consequence of dams. In RCEM 2009 River Coastal and Estuarine Morphodynamics; Garcia, C., Latrubesse, E.M., Perillo, E.G., Eds.; Taylor Francis Group: Amsterdam, The Netherlands, 2010; Volume 1, pp. 131–136. [Google Scholar]
  17. Junk, W.J.; Bayley, P.B.; Sparks, R.E. The flood pulse concept in river-floodplain systems. Canadian Journal of Fishers and Aquatic 1989, 106, 110–127. [Google Scholar]
  18. Agostinho, A.; Pelicice, F.; Gomes, L. Dams and the fish fauna of the Neotropical region: Impacts and management related to diversity and fisheries. Braz. J. Biol. 2008, 68, 1119–1132. [Google Scholar] [CrossRef] [Green Version]
  19. Stevaux, J.C.; Corradini, F.A.; Aquino, S. Connectivity processes and riparian vegetation of the upper Paraná River, Brazil. J. South Am. Earth Sci. 2013, 46, 113–121. [Google Scholar] [CrossRef]
  20. Assahira, C.; Piedade, M.T.F.; Trumbore, S.E.; Wittmann, F.; Cintra, B.B.L.; Batista, E.S.; de Resende, A.F.; Schöngart, J. Tree mortality of a flood-adapted species in response of hydrographic changes caused by an Amazonian river dam. For. Ecol. Manag. 2017, 396, 113–123. [Google Scholar] [CrossRef]
  21. Barthem, R.; Ribeiro, M.C.L.D.B.; Jr, M.P. Life strategies of some long-distance migratory catfish in relation to hydroelectric dams in the Amazon Basin. Biol. Conserv. 1991, 55, 339–345. [Google Scholar] [CrossRef]
  22. Duponchelle, F.; Pouilly, M.; Pécheyran, C.; Hauser, M.; Renno, J.-F.; Panfili, J.; Darnaude, A.M.; García-Vasquez, A.; Carvajal-Vallejos, F.; García-Dávila, C.; et al. Trans-Amazonian natal homing in giant catfish. J. Appl. Ecol. 2016, 53, 1511–1520. [Google Scholar] [CrossRef] [Green Version]
  23. Lees, A.C.; Peres, C.A.; Fearnside, P.M.; Schneider, M.; Zuanon, J.A.S. Hydropower and the future of Amazonian biodiversity. Biodivers. Conserv. 2016, 25, 451–466. [Google Scholar] [CrossRef]
  24. Winemiller, K.O.; McIntyre, P.B.; Castello, L.; Fluet-Chouinard, E.; Giarrizzo, T.; Nam, S.; Baird, I.G.; Darwall, W.; Lujan, N.K.; Harrison, I.; et al. Balancing hydropower and biodiversity in the Amazon, Congo, and Mekong. Science 2016, 351, 128–129. [Google Scholar] [CrossRef] [PubMed]
  25. Park, E.; Latrubesse, E.M. The hydro-geomorphologic complexity of the lower Amazon River floodplain and hydrological connectivity assessed by remote sensing and field control. Remote Sens. Environ. 2017, 198, 321–332. [Google Scholar] [CrossRef]
  26. Dayrell, J.S.; Magnusson, W.E.; Bobrowiec, P.E.D.; Lima, A.P. Impacts of an Amazonian hydroelectric dam on frog assemblages. PLoS ONE 2021, 16, e0244580. [Google Scholar] [CrossRef] [PubMed]
  27. Bohada-Murillo, M.; Castaño-Villa, G.J.; Fontúrbel, F.E. Effects of Dams on Vertebrate Diversity: A Global Analysis. Diversity 2021, 13, 528. [Google Scholar] [CrossRef]
  28. Latrubesse, E.M.; D’Horta, F.M.; Ribas, C.C.; Wittmann, F.; Zuanon, J.; Park, E.; Dunne, T.; Arima, E.Y.; Baker, P.A. Vulnerability of the biota in riverine and seasonally flooded habitats to damming of Amazonian rivers. Aquat. Conserv. Mar. Freshw. Ecosyst. 2020, 31, 1136–1149. [Google Scholar] [CrossRef]
  29. Ministério do Meio Ambiente—MMA. Caderno Setorial de Recursos Hídricos: Geração de Energia Hidrelétrica; MMA: Brasília, Brazil, 2006.
  30. Fernandes, G.W.; Pedroni, F.; Sanchez, M.; Scariot, A.; Aguiar, L.M.S.; Ferreira, G.B.; Machado, R.; Ferreira, M.E.; Diniz, S.; Pinheiro, R.; et al. Cerrado: Em Busca de Soluções Sustentáveis; Vertente: Rio de Janeiro, Brazil, 2016. [Google Scholar]
  31. Rodrigues, A.A.; Macedo, M.N.; Silvério, D.V.; Maracahipes, L.; Coe, M.T.; Brando, P.M.; Shimbo, J.Z.; Rajão, R.; Soares-Filho, B.; Bustamante, M.M.C. Cerrado deforestation threatens regional climate and water availability for agriculture and ecosystems. Glob. Chang. Biol. 2022, 28, 6807–6822. [Google Scholar] [CrossRef] [PubMed]
  32. Alencar, A.; Shimbo, J.Z.; Lenti, F.; Marques, C.B.; Zimbres, B.; Rosa, M.; Arruda, V.; Castro, I.; Ribeiro, J.P.F.M.; Varela, V.; et al. Mapping Three Decades of Changes in the Brazilian Savanna Native Vegetation Using Landsat Data Processed in the Google Earth Engine Platform. Remote. Sens. 2020, 12, 924. [Google Scholar] [CrossRef] [Green Version]
  33. Bettiol, G.; Ferreira, M.; Motta, L.; Cremon; Sano, E. Conformity of the NASADEM_HGT and ALOS AW3D30 DEM with the Altitude from the Brazilian Geodetic Reference Stations: A Case Study from Brazilian Cerrado. Sensors 2021, 21, 2935. [Google Scholar] [CrossRef]
  34. Pereira, C.C.; Fernandes, G.W. Cerrado conservation is key to the water crisis. Science 2022, 377, 270. [Google Scholar] [CrossRef]
  35. Rattis, L.; Brando, P.M.; Macedo, M.N.; Spera, S.A.; Castanho, A.D.A.; Marques, E.Q.; Costa, N.Q.; Silverio, D.V.; Coe, M.T. Climatic limit for agriculture in Brazil. Nat. Clim. Chang. 2021, 11, 1098–1104. [Google Scholar] [CrossRef]
  36. Agência Nacional de Águas e Saneamento Básico—ANA. Portal HidroWeb - ferramenta integrante do Sistema Nacional de Informações sobre Recursos Hídricos (SNIRH). ANA: Brasília, Brazil, 2022. Available online: https://www.snirh.gov.br/hidroweb/mapa (accessed on 17 September 2022).
  37. Instituto Brasileiro de Geografia e Estatística—IBGE. Biomas e Sistema Costeiro-Marinho do Brasil: Compatível com a Escala 1:250,000; IBGE: Rio de Janeiro, Brazil, 2022. Available online: www.ibge.gov.br (accessed on 17 September 2022).
  38. Sistema de Informações Georreferenciadas do Setor Elétrico—SIGEL/ANEEL. Portal de Geoprocessamento da ANEEL: Brasília, Brazil, 2022. Available online: https://sigel.aneel.gov.br/portal/home (accessed on 17 September 2022).
  39. Pacheco, A.A.; Neves, A.C.O.; Fernandes, G.W. Uneven conservation efforts compromise Brazil to meet the Target 11 of Convention on Biological Diversity. Perspect. Ecol. Conserv. 2018, 16, 43–48. [Google Scholar] [CrossRef]
  40. WWF-Brasil. Áreas Prioritárias para Conservação da Biodiversidade no Cerrado e Pantanal; WWF-Brasil: Brasília, Brazil, 2022; Available online: https://bityli.com/jCmPsIYZK (accessed on 18 September 2022).
  41. Lehner, B.; Verdin, K.; Jarvis, A. New Global Hydrography Derived from Spaceborne Elevation Data. Eos Trans. Am. Geophys. Union 2008, 89, 93–94. [Google Scholar] [CrossRef]
  42. Souza, C.M.; Shimbo, J.Z.; Rosa, M.R.; Parente, L.L.; Alencar, A.; Rudorff, B.F.; Hasenack, H.; Matsumoto, M.; Ferreira, L.G.; Souza-Filho, P.W.; et al. Reconstructing Three Decades of Land Use and Land Cover Changes in Brazilian Biomes with Landsat Archive and Earth Engine. Remote. Sens. 2020, 12, 2735. [Google Scholar] [CrossRef]
  43. Pelicice, F.M.; Pompeu, P.S.; A Agostinho, A. Large reservoirs as ecological barriers to downstream movements of Neotropical migratory fish. Fish Fish. 2014, 16, 697–715. [Google Scholar] [CrossRef]
  44. He, F.; Thieme, M.; Zarfl, C.; Grill, G.; Lehner, B.; Hogan, Z.; Tockner, K.; Jähnig, S.C. Impacts of loss of free-flowing rivers on global freshwater megafauna. Biol. Conserv. 2021, 263, 109335. [Google Scholar] [CrossRef]
  45. North, M.A. A method for implementing a statistically significant number of data classes in the Jenks algorithm. In Proceedings of the 2009 Sixth International Conference on Fuzzy Systems and Knowledge Discovery, Tianjin, China, 14–16 August 2009; Volume 1, pp. 35–38. [Google Scholar]
  46. Jenks, G.F. The Data Model Concept in Statistical Mapping. In International Yearbook of Cartography; Bertelsmann: Gütersloh, Germany, 1967; Volume 7, pp. 186–190. [Google Scholar]
  47. Castro, S.S.; Queiroz Neto, J.P. Soil erosion in Brazil from coffee to the present-day soybean production. In Geomorphology of Natural Hazards and Human Exacerbated Disasters in Latin America; Latrubesse, E.M., Ed.; Elsevier: Amsterdam, The Netherlands, 2009; pp. 195–221. [Google Scholar]
  48. Cunha, S.B. Geomorfologia Fluvial. In Geomorfologia: Uma Atualização de BASES e conceitos, 2nd ed.; Guerra, A.J.T., Cunha, S.B., Eds.; Rio de Janeiro: Bertrand Brasil, Brazil, 1995; pp. 211–252. [Google Scholar]
  49. Latrubesse, E.M.; Amsler, M.; de Morais, R.; Aquino, S. The geomorphologic response of a large pristine alluvial river to tremendous deforestation in the South American tropics: The case of the Araguaia River. Geomorphology 2009, 113, 239–252. [Google Scholar] [CrossRef]
  50. Agostinho, A.A.; Gomes, L.C.; Pelicice, F.M. Ecologia e Manejo dos Recursos Pesqueiros em Reservatórios do Brasil; Editora da Universidade Estadual de Maringá: Maringá, Brazil, 2007. [Google Scholar]
  51. Bonetto, A.A.; Wais, J.R.; Castello, H.P. The increasing damming of the Paraná basin and its effects on the lower reaches. Regul. Rivers: Res. Manag. 1989, 4, 333–346. [Google Scholar] [CrossRef]
  52. Instituto Brasileiro de Geografia e Estatística—IBGE. Censo Demográfico; IBGE: Brasília, Brazil, 2010.
  53. Instituto Brasileiro de Geografia e Estatística—IBGE. Estimativas da População; IBGE: Brasília, Brazil, 2021.
  54. Instituto Brasileiro de Geografia e Estatística—IBGE. Produto Interno Bruto dos Municípios: 2002–2019; IBGE: Brasília, Brazil, 2020.
  55. Villar, P.C.; Ribeiro, W.C.; Sant’Anna, F.M. Transboundary governance in the La Plata River basin: Status and prospects. Water Int. 2018, 43, 978–995. [Google Scholar] [CrossRef] [Green Version]
  56. Espíndola, I.B.; Ribeiro, W.C. Transboundary waters, conflicts and international cooperation-examples of the La Plata basin. Water Int. 2020, 45, 329–346. [Google Scholar] [CrossRef]
  57. Espíndola, I.B.; de Leite, M.L.T.A.; Ribeiro, W.C. South American Transboundary Waters: The Management of the Guarani Aquifer System and the La Plata Basin Towards the Future. In The Palgrave Handbook of Climate Resilient Societies; Springer International Publishing: Cham, Switzerland, 2021; pp. 251–285. [Google Scholar] [CrossRef]
  58. Secretaria do Planejamento e Meio Ambiente do Tocantins—SEPLAN-TO. Anuário Estatístico do Estado do Tocantins; DPI: Palmas, Brazil, 2009. Available online: https://www.to.gov.br/seplan/edicao-2009/6y7ozaciw0qe (accessed on 18 September 2022).
  59. Costa, M.H.; Botta, A.; Cardille, J. Effects of large-scale changes in land cover on the discharge of the Tocantins River, Southeastern Amazonia. J. Hydrol. 2003, 283, 206–217. [Google Scholar] [CrossRef]
  60. Aquino, S.; Latrubesse, E.M.; Bayer, M. Assessment of wash load transport in the Araguaia River (Aruanã gauge station), Central Brazil. Lat. Am. J. Sedimentol. Basin Anal. 2009, 16, 119–128. [Google Scholar]
  61. Coe, M.T.; Latrubesse, E.M.; Ferreira, M.E.; Amsler, M.L. The effects of deforestation and climate variability on the streamflow of the Araguaia River, Brazil. Biogeochemistry 2011, 105, 119–131. [Google Scholar] [CrossRef]
  62. Lininger, K.B.; Latrubesse, E.M. Flooding hydrology and peak discharge attenuation along the middle Araguaia River in central Brazil. CATENA 2016, 143, 90–101. [Google Scholar] [CrossRef]
Figure 1. Methodological flowchart of the study, with emphasis on sequential phases I (database and map preparation), II (spatial-temporal filtering of land use change maps) and III (application of the DSI—Dam Saturation Index).
Water 14 03762 g001
Figure 3. Example of a 5-km buffer surrounding a UHE in the Cerrado biome, considering the land use classes near the dam structure.
Water 14 03762 g003
Figure 4. Distribution of small (PCH) and large (UHE) hydroelectric dams by Hydrographic Region (HR) in the Cerrado. Dataset from ANA [36] and ANEEL [4].
Water 14 03762 g004
Figure 5. Location of the planned and operational PCHs and UHEs, relative to protected areas in the Cerrado biome. Dataset from ANEEL [4], MMA [29] and IBGE [37].
Water 14 03762 g005
Figure 6. Location of PCHs and UHEs in relation to Priority Areas for Biodiversity Conservation in the Cerrado biome (2021). Dataset from ANEEL [4], MMA [29], IBGE [37] and WWF [40].
Water 14 03762 g006
Figure 7. Distribution of operational dams, classified by type (UHE/PCH) and primary land use. Dataset from ANEEL [4] and MapBiomas [42].
Water 14 03762 g007
Figure 8. Dam Saturation Index (DSI) by watershed in the Cerrado biome. Dataset from ANEEL [4].
Water 14 03762 g008
Table 1. Rivers with the greatest number of UHEs in the Cerrado biome. Dataset from ANA [36] and ANEEL [4].
RiverPlannedOperationalHydrographic Region (ANA)
Tocantins46Tocantins-Araguaia
Grande06Paraná
Araguari03Paraná
Corumbá02Paraná
Pará-2Paraná
Verde32Paraná
Parnaíba71Parnaíba
São Francisco31São Francisco
das Mortes5-Tocantins-Araguaia
Sucuriú4-Paraná
Table 2. Distribution of PCHs and UHEs by type (operational vs. planned) and conservation priority class within the Cerrado biome. Dataset from the ANEEL [4], MMA [29] and WWF [40].
Priority ClassPCHsUHEs
OperationalPlannedOperationalPlanned
Extremely high17106628
Very high364617
High2271010
Table 3. River basins with high or very high Dam Saturation Index (DSI).
River BasinDSIUHEsPCHsNative Vegetation (%)Watershed
OperationalPlannedOperationalPlanned
JuruenaVery High01052468.74Amazonas
Low ParanaíbaVery High3613021.24Paraná
São LourençoVery High3051649.35Paraná
Maranhão/TocantinsHigh3101170.66Tocantins
CorumbáHigh2021832.17Paraná
ParanãHigh0631164.08Paraná
das VelhasHigh1411542.44São Francisco
São JoãoHigh3001323.15Paraná
High TocantinsHigh221959.81Tocantins
Table 4. Area (in km2) of each land use class occurring in the buffer around operational UHEs and PCHs (as of 2000 and 2020).
Land Use20002020Gain/Loss
UHEPCHUHEPCHUHEPCH
Agriculture76.50155.95186.25267.62 109.75 111.67
Urban Area52.1419.46 59.1425.30 7.00 5.85
Others22.475.6137.659.87 15.17 4.26
Pasture1195.66727.49 1041.64724.23 −154.01 −3.27
Native Cerrado1235.101531.66 1060.291349.82 −174.81 −181.84
Water310.4530.24 506.8593.57 196.41 63.33
Publisher’s Note: MDPI stays neutral with regard to jurisdictional claims in published maps and institutional affiliations.

