Article

Path Analysis of the Main Control Factors of Transpiration in Greenhouse, Drip-Irrigated Grapes in Cold Areas of Northeast China

College of Water Conservancy, Shenyang Agricultural University, Shenyang 110866, China
*
Author to whom correspondence should be addressed.
Water 2022, 14(22), 3764; https://doi.org/10.3390/w14223764
Submission received: 26 October 2022 / Revised: 14 November 2022 / Accepted: 17 November 2022 / Published: 19 November 2022
(This article belongs to the Section Soil and Water)

Abstract

:
To investigate the characteristics of grape transpiration water consumption and its environmental coupling mechanism in a greenhouse growing environment in cold areas of Northeast China, the dynamic monitoring of greenhouse grape sap flow and microenvironmental factors in a greenhouse was carried out for two years. Correlation analysis and path analysis were used to study the characteristics of grape transpiration environmental factors at different temporal scales (instantaneous, daily, and growth period) and the influence mechanisms on greenhouse grape transpiration. The results of correlation analysis by growth period showed that, on the instantaneous scale, the correlation between each meteorological factor and grape transpiration reached a significant level (coefficient of determination R2 ranged from 0.25 to 0.84). On the daily scale, the correlation of solar radiation (Rs) was the best except for the new growth period (R2 ranged from 0.49 to 0.89). The results of the split-fertility path analysis showed that the total effects of Rs on instantaneous transpiration were the largest at all stages of fertility, with decision coefficients (R) ranging from 0.69 to 0.90. On the daily scale, the total and direct effects of Rs on daily transpiration were the largest (R ranged from 0.70 to 0.94), except for the new growth period. The results of the whole growth period path analysis showed that Rs had the greatest effect on instantaneous transpiration, with R of 0.86. On the daily scale, Rs was also the most influential factor in grape transpiration, with R of 0.81. On the growth period scale, only air temperature (Ta) and leaf area index (LAI) were significantly correlated with transpiration (p < 0.05), and Rs had the largest total effect on transpiration with R of 0.68. To sum up, on each time scale, Rs was always the most important factor influencing grape transpiration. However, as the time scale increased, the effects of LAI and soil water content (SW) on transpiration increased while the effects of Rs, Ta, RH, and VPD on transpiration gradually decreased.

1. Introduction

Transpiration is not only a major pathway for water consumption by crops but also an important link in the soil–plant–atmosphere continuum [1,2,3]. It also plays a key role in irrigation water use [4]. By reasonably controlling the frequency and amount of irrigation, the yield and quality of crops can be significantly improved [5,6]. Previous studies on water consumption by transpiration in greenhouses have focused on water consumption characteristics, irrigation systems, and mechanisms and patterns of efficient water and fertilizer use [7,8,9]. Among them, the research on water consumption characteristics, main environmental control factors, and their regulatory mechanisms at different spatial and temporal scales of crops is the basis for precise crop water management [10].
Nalevanková et al. [11] used principal component analysis to study the transpiration and environmental shadow of European beech, and the results showed that daily transpiration was closely related to solar radiation, air temperature, and relative humidity, and seasonal transpiration was closely related to soil water deficit. Xu et al. [12] used stepwise linear regression analysis to investigate the effects of environmental variables on desert shrub transpiration, and the results showed that solar radiation was the main driver of evapotranspiration. Zhang et al. [13] studied the spatial scale effect of evapotranspiration in summer maize using path analysis and showed that net radiation was always the main influence on evapotranspiration at leaf, monocot, and farm scales. Han et al. [14] used regression analysis to study evapotranspiration in savannas, and the results showed that evapotranspiration was controlled by net radiation on an instantaneous scale while evapotranspiration was controlled by leaf area index and soil moisture content on a daily scale. Sun et al. [15] used correlation analysis to analyze evapotranspiration in different ecosystems and showed that leaf area index and air temperature were the main controlling factors in determining evapotranspiration at the growing season and annual scales. Pour et al. [16] conducted a sensitivity analysis on rice evapotranspiration in Peninsular Malaysia. The results showed that minimum air temperature was the main meteorological factor affecting daily rice evapotranspiration. Liu et al. [17] used sensitivity analysis to quantify the relationship between meteorological factors and reference evapotranspiration in Beijing, and the results showed that at the daily scale, net radiation and relative humidity dominated. Qiao et al. [18] used correlation analysis to analyze the transpiration characteristics of date palm trees, and the results showed that leaf area index was the main influencing factor of transpiration at the growth period scale. Li et al. [19] studied the time-scale effect of transpiration in white hairy poplar by path analysis, and the results showed that the main influencing factors of transpiration at the instantaneous scale were solar radiation and vapor pressure deficit, while the main influencing factors of transpiration at the daily scale were solar radiation and air temperature. Cai et al. [20] used path analysis to study the spatio-temporal scale effect of winter wheat evapotranspiration. The results showed that net radiation was the main controlling factor of winter wheat evapotranspiration on a daily scale; leaf area index and underlying vegetation height were the main factors controlling evapotranspiration at the plot and field scales, respectively. Su et al. [21] used correlation analysis to show that temperature was the main influencing factor of evapotranspiration at the temporal and daily scales. Anandacoomaraswamy et al. [22] found that the instantaneous transpiration of tea plants determines soil moisture content and solar radiation. Mellander et al. [23] found that soil temperature was the main control factor affecting the transpiration of forest ecosystems in cold regions. Alvarez et al. [24] studied calla lily and found that soil water stress was the main controlling factor affecting daily transpiration. Albertoa et al. [25], Irmark et al. [26], and Granier et al. [27] analyzed the main influencing factors of crop transpiration, and the results showed that at different scales, the main controlling factor of transpiration was solar radiation followed by saturated water pressure difference.
Water management is an important aspect of growing greenhouse crops. Under greenhouse growing conditions, in order to reduce air humidity, diseases, and insect pests, irrigation is mainly implemented in the form of under-membrane drip irrigation [28], and the evaporative water consumption is almost zero, so the water consumption mode of the greenhouse crop is mainly transpiration [29]. Li et al. [30] used correlation and path analysis to investigate the daily transpiration of greenhouse melon and its influencing factors, and the results showed that the magnitude of influence of each factor on the transpiration of greenhouse melon was leaf area index > average daily temperature > average daily relative air humidity > solar radiation intensity. Li et al. [7] used regression analysis to study the relationship between the characteristics of sap flow and the main environmental influencing factors for greenhouse grapes in cold regions of northeast China, and the results showed that the main influencing factors for instantaneous and daily evapotranspiration were photosynthetically effective radiation and vapor pressure deficit, and the main influencing factor for month-by-month and whole growth period evapotranspiration was photosynthetically effective radiation. Gong et al. [10] studied the spatial scale effect of evapotranspiration in tomatoes in greenhouse using path analysis, and the results showed that solar radiation was the main control factor of evapotranspiration at leaf, single plant, and population scales. Previous studies on the spatial and temporal scale effects of crop water consumption characteristics have mainly focused on field crops. However, systematic studies on water consumption and the main influencing factors at different temporal scales (instantaneous, daily, monthly, decadal, reproductive stage, full growth period, etc.) of crops in greenhouse, especially those on crop water consumption and environmental regulation and its scale effects in cold and cold regions under heliophile growing conditions, are not available.
In this paper, through systematic analysis of transpiration and its related influencing factors of greenhouse grapes on different time scales, the main influencing factors and influence degrees of grape transpiration on each time scale are explored and the time scale effects are clarified. The research results can provide a reference for the formulation of irrigation systems and the regulation of greenhouse environments.

2. Materials and Methods
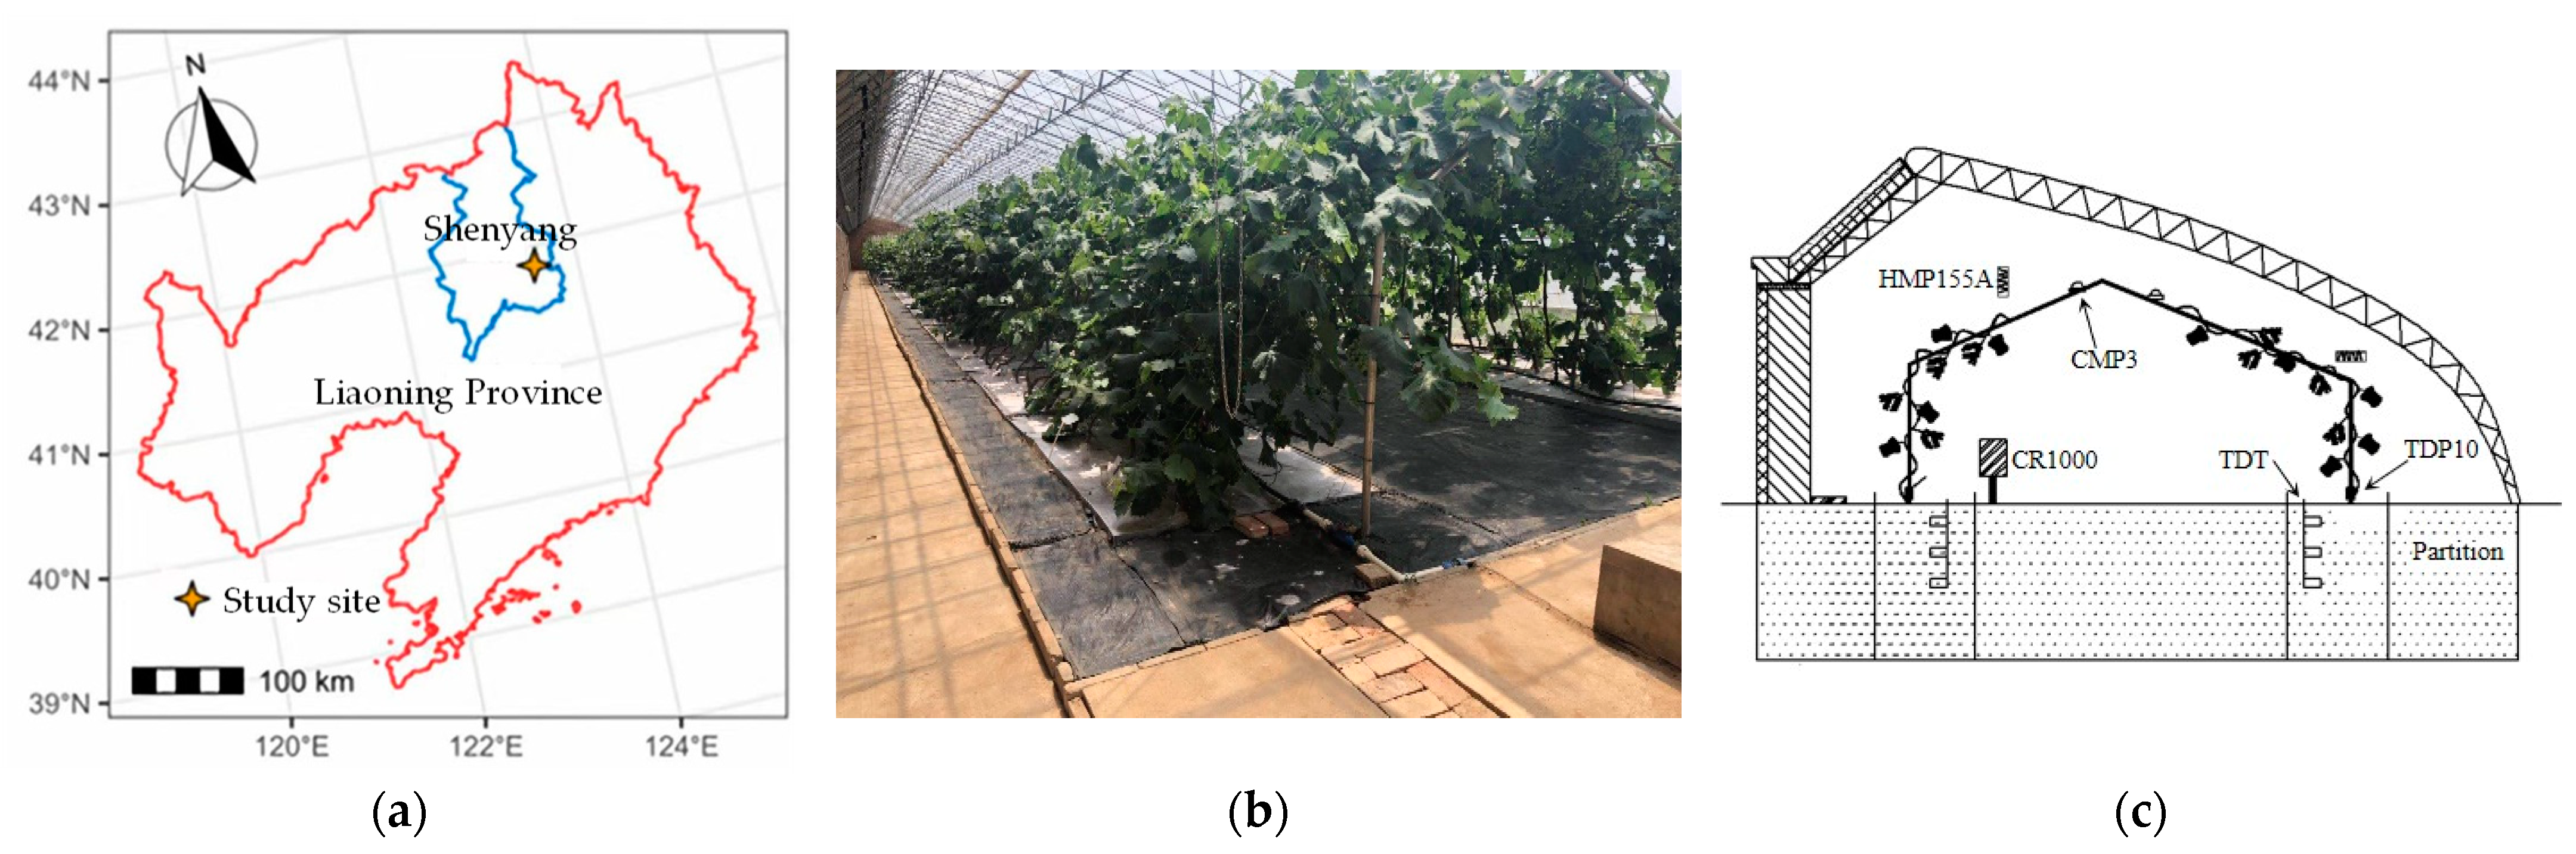
2.1. Study Site

The experiment was carried out from 1 April 2020 to 31 October 2021 in the solar greenhouse No. 44 of Shenyang Agricultural University Research and Experimental Base in China (123°57 ′E, 42°82 ′N) with an east–west direction, span of 8 m, ridge height of 4 m, and length of 60 m. The greenhouse was a Chinese Liaoshen III (ZGLSSG-III) solar greenhouse. The indoor temperature could be adjusted through the vents at the top and bottom. The maximum opening of the top vent was 50 cm. The opening could be automatically adjusted. There was a rainproof quilt driven by a motor on the top. During the test, when the ambient temperature was lower than 16 °C, the quilt was put down at night for insulation.
A total of 111 five-year-old Vitis vinifera L. cv. Muscat Ham-burg grapes planted in 2016 were used as test materials, with plant spacing of 0.5 m and row spacing of 4.7 m. Israel Netafim drip irrigation pipe was selected as the drip irrigation pipe with a diameter of 16 mm. The dripper adopted a pressure compensation dripper with a spacing of 0.3 m. The designed flow rate of the dripper was 8 L h−1. The upper and lower limits of irrigation were 90%θf and 60%θff is the field water holding rate, cm3 cm−3), and the fertilizer application rate N, P2O5, K2O was 260, 119, 485 kg hm−2, respectively. The test soil was a medium loam with a planned wetting layer depth of 60 cm and a capacity of 1.44 g cm−3 from 0 to 60 cm. Other field agronomic management measures were consistent (e.g., pruning of branching stems and pest control) and were based on local experience with grape production. The overview of the test area is shown in Figure 1. Two years of growth periods and transpiration are shown in Table 1.

2.2. Data Collection

Meteorological indicators: a small environmental element monitoring system including a data collector (CR1000, Campbell Scientific, USA), temperature and humidity sensor (HMP155A, Vaisala, Finland), and solar radiation sensor (CMP3, Kipp & Zonen, Netherlands) with a data collection frequency of 10 min. The main monitoring elements were solar radiation (Rs, W m−2), air temperature (Ta, °C), and relative humidity (RH, %). The vapor pressure deficit (VPD, kPa) was calculated according to the method provided by Allen [31].
Soil water content: Soil water content (SW, %) was monitored in real time using a soil moisture sensor (time domain moisture, TDT) (Campbell Scientific, USA) with a collection frequency of 10 min. In this study, soil moisture sensors were deployed at the depths of 15, 30, and 45 cm respectively, and the average value of 3 sensors was taken as the soil moisture content value.
Leaf area index: The total leaf area of the corresponding grape plants was estimated using a random sampling method, and the leaf area index (LAI) of the plant was obtained by dividing the leaf area projection by the canopy projection area. The measurement frequency was 7 to 10 d.
Sap flow rate and transpiration: A set of thermal dissipation probes (TDP10) were installed 20 cm from the ground in each of the selected vines, and the collection frequency was 10 min. The transpiration rate was calculated as follows:
F d = 118 . 99 × 10 6 [ ( Δ V max Δ V ) / Δ V ] 1 . 231
F s = F d × A s × 3600
Tr d = 1 6 i = 1 144 F si 1000 A
Tr p = i = 1 n Tr di
where Fd is the sap flow rate, m s−1; ΔVmax is the thermodynamic potential of the thermocouple when the sap flow rate is zero, V; ΔV is the thermodynamic potential of the thermocouple in the presence of sap flow, V; Fs is the instantaneous transpiration, g h−1; As is the cross-sectional area of the water-conducting sapwood section, m2; Trd is the daily transpiration, mm d−1; A is the grape shade area, m2; Trp is the transpiration during the growth period, mm; and n is the number of days in the growth period, d.

2.3. Path Analysis Method

The path analysis method was proposed by Sewall Wright [32] in 1921 and has been refined by scholars to form a multivariate statistical method. It investigates the relative importance of the dependent variable by decomposing the independent and dependent variables into each other. This method elucidates the direct and indirect effects of all factors related to the dependent variable to determine the multivariate linear equation. For an interrelated system, if there is a linear relationship between the n independent variables Xi and the dependent variable Y, the regression equation is
Y = b 0 + b 1 X 1 + b 2 X 2 + + b n X n
According to the simple correlation coefficient rij (i, jn) between the respective variables and the simple correlation coefficient riy between the respective variables and the dependent variable, the matrix equation is obtained by transforming Equation (5),
[ 1 r 12 r 1 n r 21 1 r 2 n r n 1 r n 2 1 ] [ P y 1 P y 2 P y n ] = [ r 1 y r 2 y r n y ]
where Pyi is the direct path coefficient of the independent variable Xi on the dependent variable Y, i.e., the direct effect of Xi on Y. rijPyi is the indirect path coefficient of the independent variable Xi on Y through Xj, i.e., the indirect path coefficient of Xi on Y through pairs of Xj.

3. Results

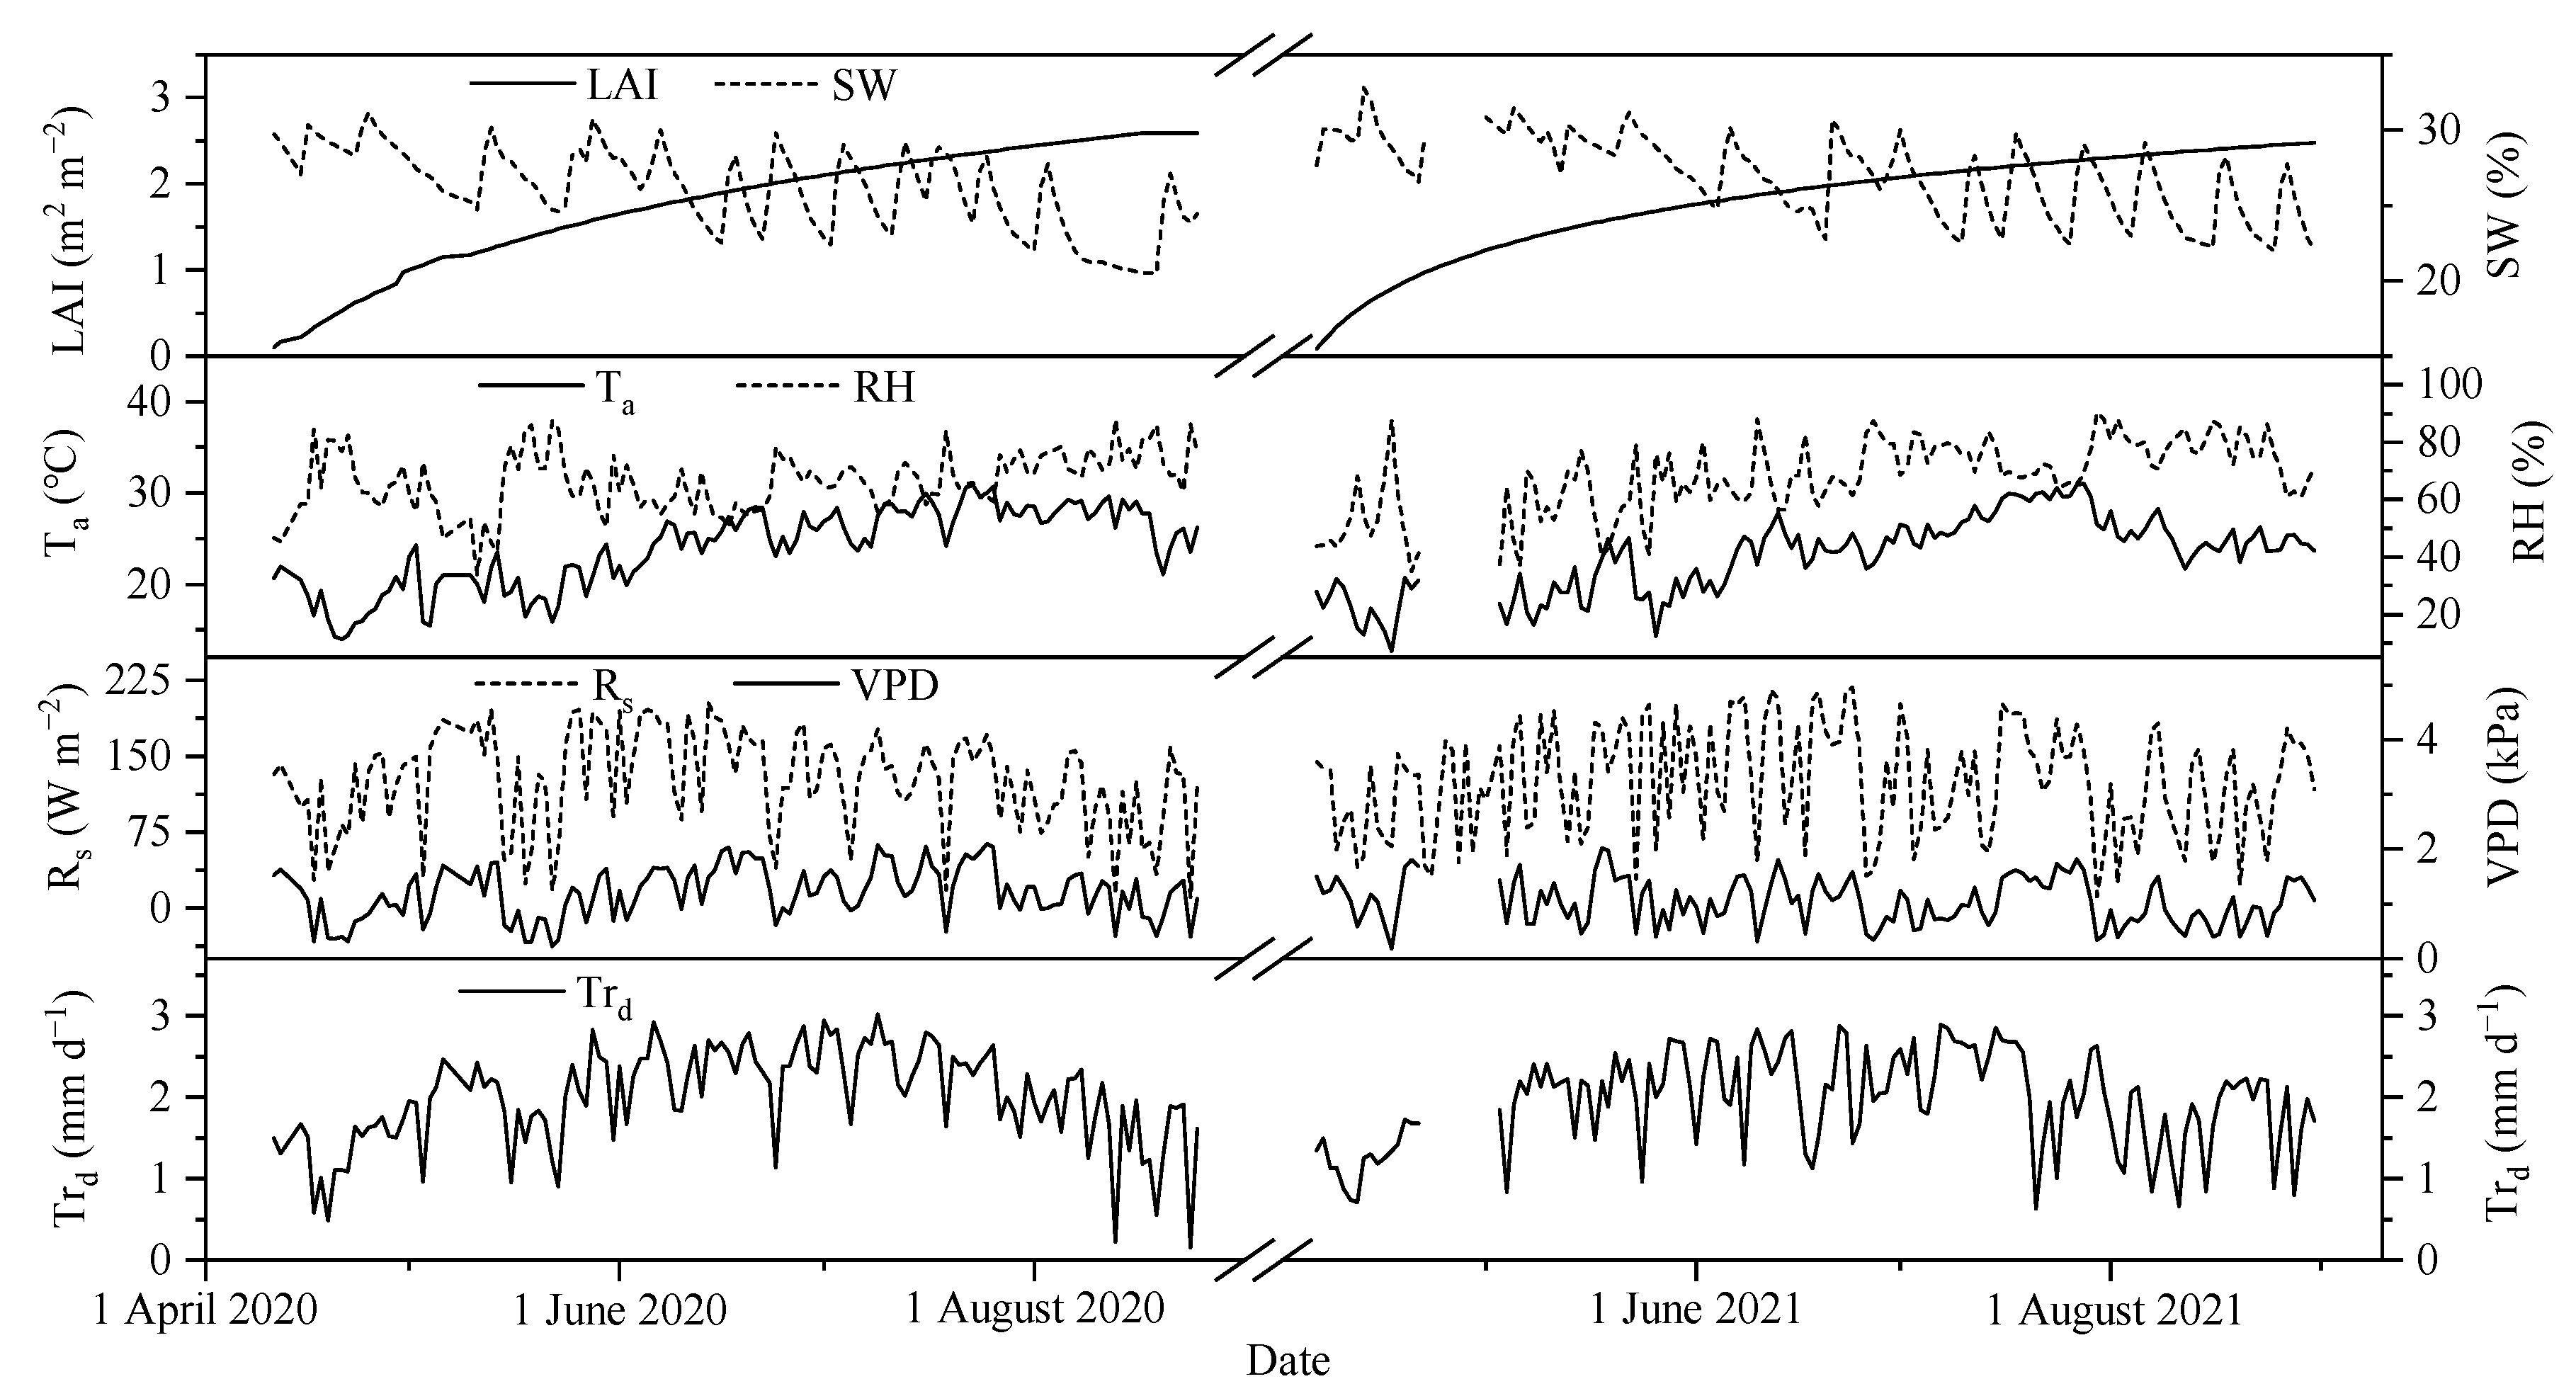
3.1. Dynamics of Transpiration and Environmental Factors in Grapes throughout the Growth Period

As can be seen in Figure 2, daily transpiration (Trd), solar radiation (Rs), and temperature (Ta) of grapes showed an overall unimodal trend throughout the whole growth period. The maximum Rs appeared in June, and the maximum daily Rs in 2020 and 2021 were 203 W m−2 (14 June) and 218 W m−2 (24 June), respectively. In 2020 and 2021, the transpiration reached 332 mm and 306 mm, respectively. The maximum Trd occurred in July, and the maximum Trd in 2020 and 2021 were 3.02 mm (9 July) and 2.89 mm (7 July), respectively. The maximum Ta occurred in late July with a maximum daily average Ta value of 30.6 °C and 31.1 °C in 2020 and 2021, respectively. LAI showed a continuous increase throughout the whole growth period with a faster increase in April and May and a slower increase in the later part of the whole growth period. RH and VPD fluctuated greatly during the whole growth period in 2020 and 2021. The average daily RH varied between 34.0% and 84.6%, 34.9%, and 88.1%, respectively. The average daily VPD varied between 0.23 kPa and 2.08 kPa, 0.19 kPa~1.98 kPa in 2020 and 2021, respectively. SW varied between 20.5% and 32.8% in two years.

3.2. Correlation Analysis between Grape Transpiration and Environmental Factors

To investigate the relationship between grape growth status, greenhouse environmental factors, and grape transpiration, the correlations between instantaneous transpiration (Fs), daily transpiration (Trd), and each factor were analyzed for different growth periods of greenhouse grapes. On the instantaneous scale (Figure 3), Rs, Ta, and VPD showed significant positive correlations (p < 0.01) with Fs. While RH showed a significant negative correlation (p < 0.01) with Fs at each growth period. The effect of meteorological factors on instantaneous transpiration differed among the different growth periods. The two-year data showed that the fruit maturation period had the greatest correlation with each meteorological factor (R2 is between 0.67 and 0.84), with the highest correlation between Fs and meteorological factors (R2 between 0.67 and 0.84), followed by the fruit expansion period. The new growth period and the flowering and fruit setting period were less correlated with Fs. Among the environmental factors, Rs and Fs had the highest correlation, and their R2 fluctuated between 0.78 and 0.84, 0.49 and 0.84 in 2020 and 2021, respectively. The maximum R2 reached 0.84 at the fruit maturation period in both years. Ta, VPD, and Fs also showed good positive correlations. RH and Fs had the lowest R2, especially in the flowering and fruit setting period, with only 0.38 and 0.21 in 2020 and 2021. In general, on the instantaneous scale, the effects of environmental factors and instantaneous transpiration were the most significant during the fruit maturation period, and the effect of Rs was the most significant. The correlation of each factor on the instantaneous transpiration scale was Rs > VPD > Ta > RH.
On the daily scale (Figure 4), except for Ta reaching significant correlations (p < 0.05) at the flowering and fruit setting period and fruit expansion period in 2021, the effects of Trd reached highly significant levels (p < 0.01) for all growth periods of Rs, RH, VPD, and LAI. However, the SW was not significant with Trd. Among the meteorological factors, Rs and Trd had the best correlation, and R2 for the four growth periods in 2020 and 2021 is between 0.49 and 0.89, with the overall performance of fruit maturation period > fruit expansion > flowering and fruit setting period > new growth period. The correlation between Ta and Trd is good; R2 in each growth period over the two years varies from 0.06 to 0.48. The correlation between Ta and Trd in the flowering and fruit setting period and fruit expansion period is lower than that in the new growth period and fruit maturation period. The correlation between RH and Trd varied from 0.43 to 0.80. The correlation between VPD and Trd varied from 0.51 to 0.80. R2 of LAI and Trd ranged from 0.21 to 0.44. The four growth periods were flowering and fruit setting period > new growth period > fruit expansion period > fruit maturation period. As can be seen from Figure 4, SW was not correlated with Trd, which may be due to the fact that water was not a limiting factor for grape transpiration due to the relatively adequate water supply in the vineyard during the test cycle. Overall, the correlations between meteorological factors and daily transpiration were the highest during the fruit maturation period, except for SW and LAI, with the correlations of each factor showing Rs > VPD > RH > Ta.

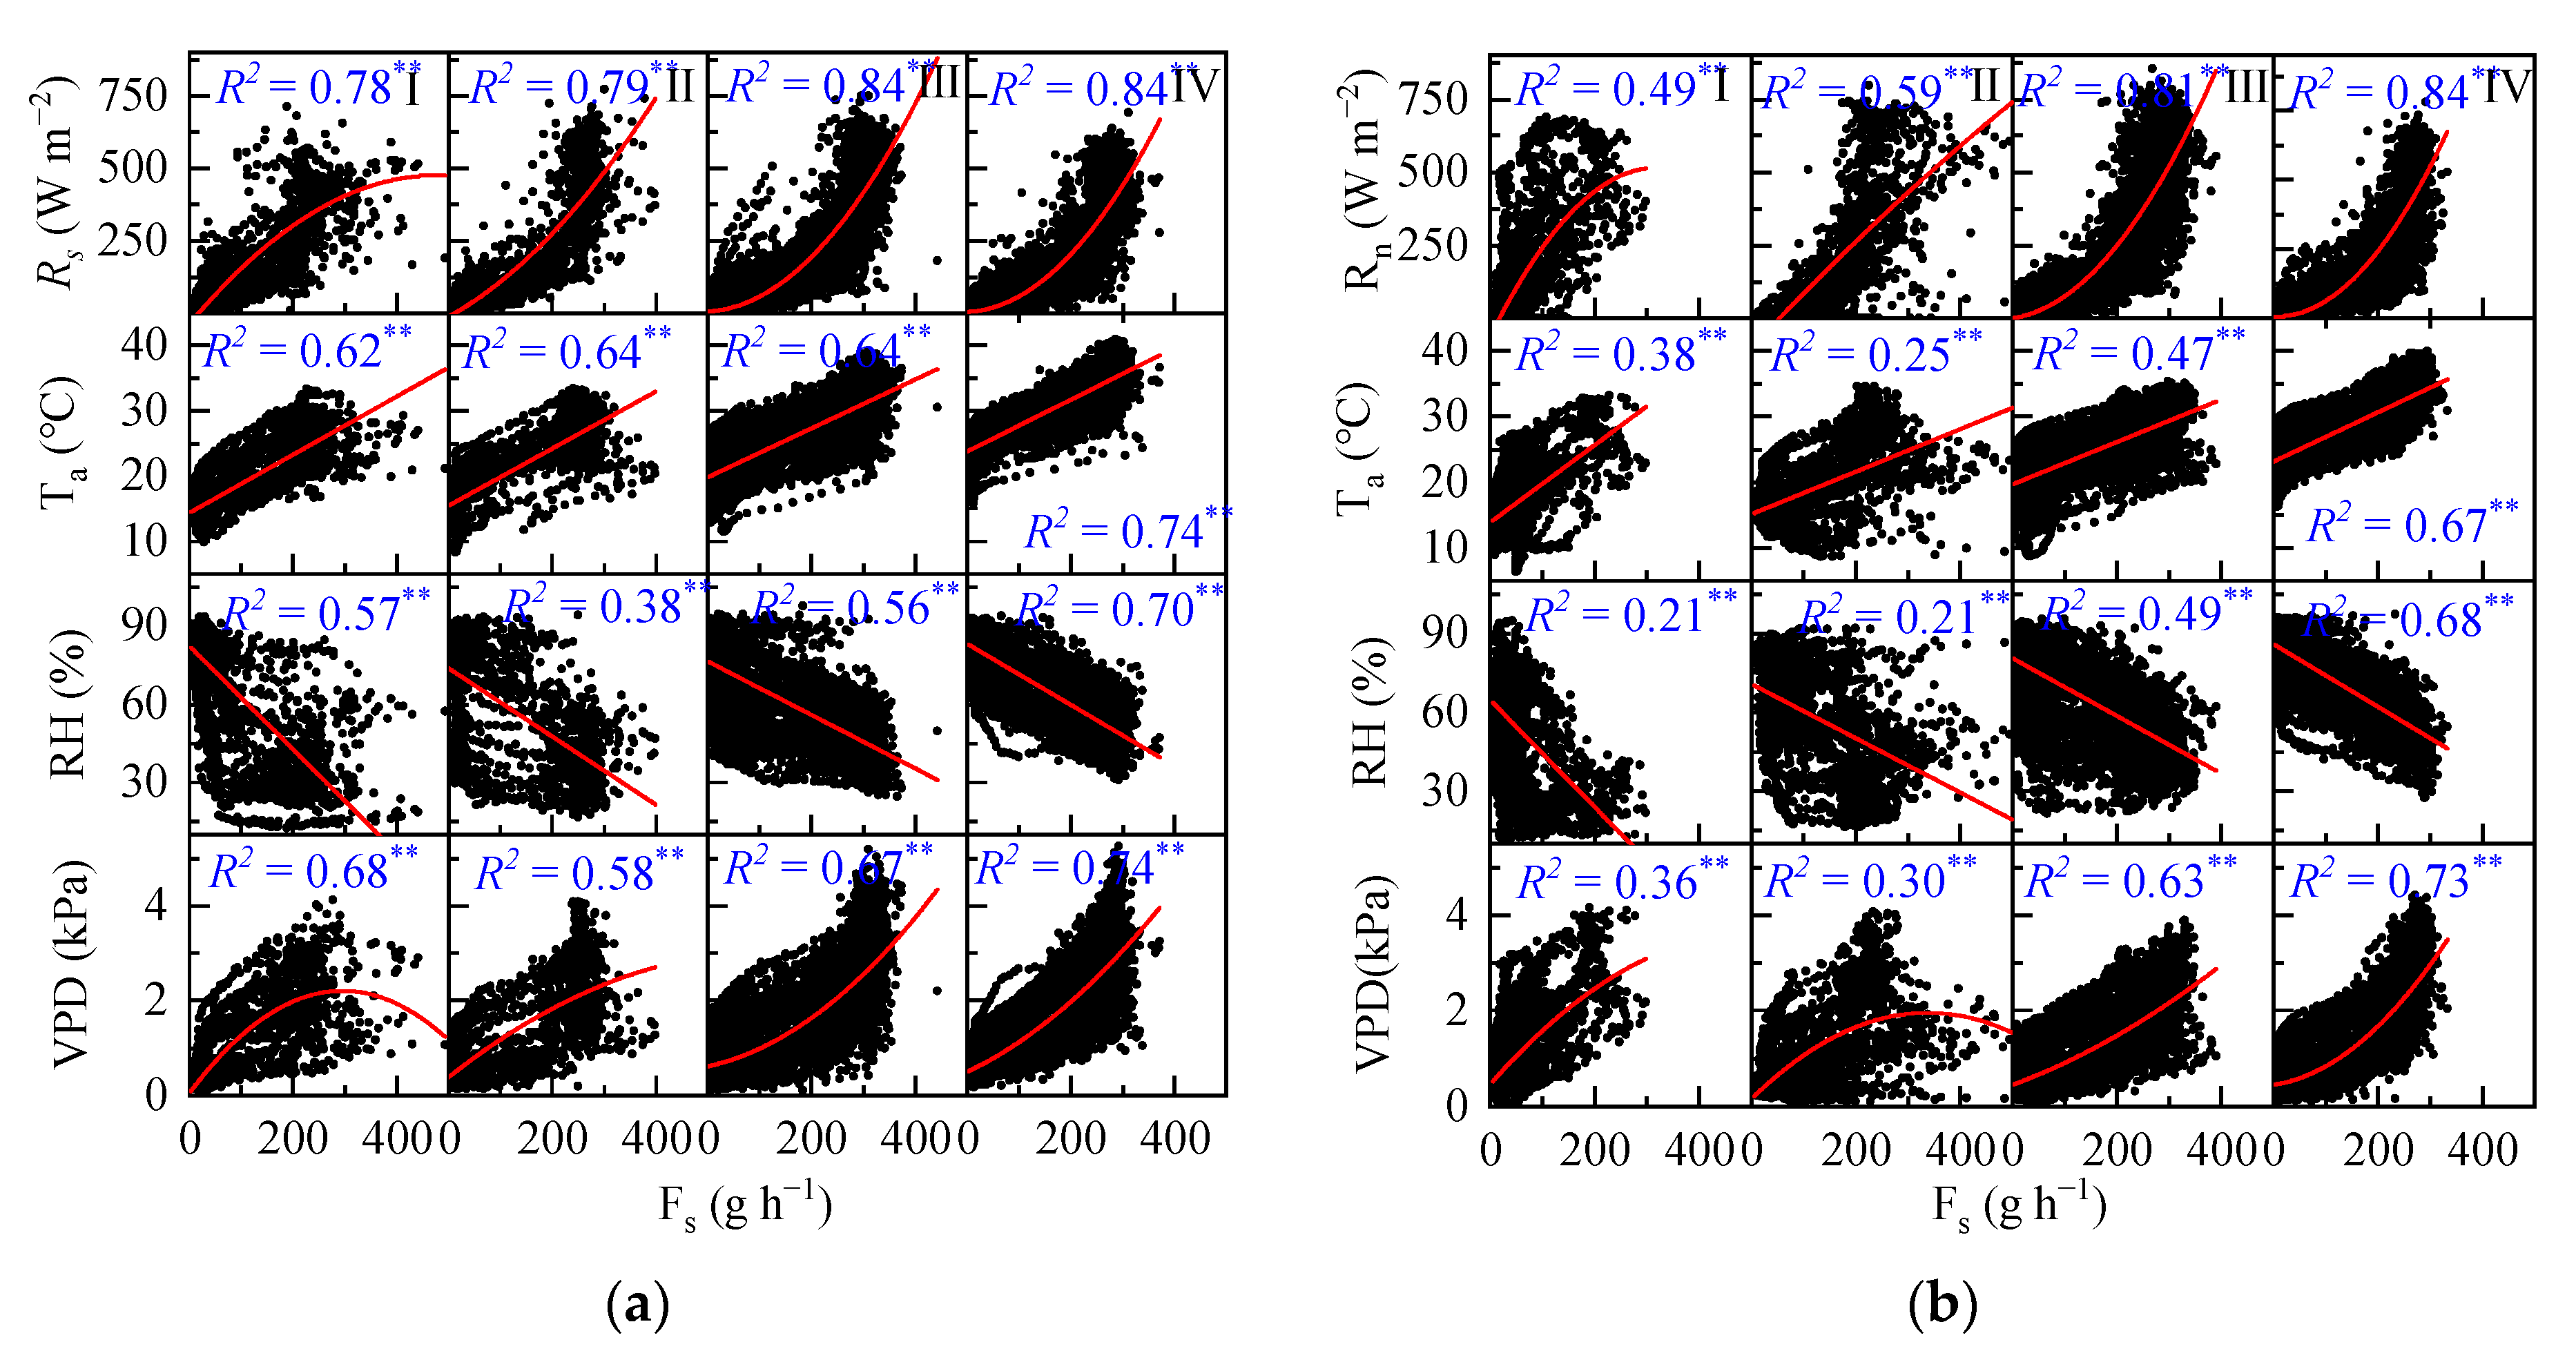
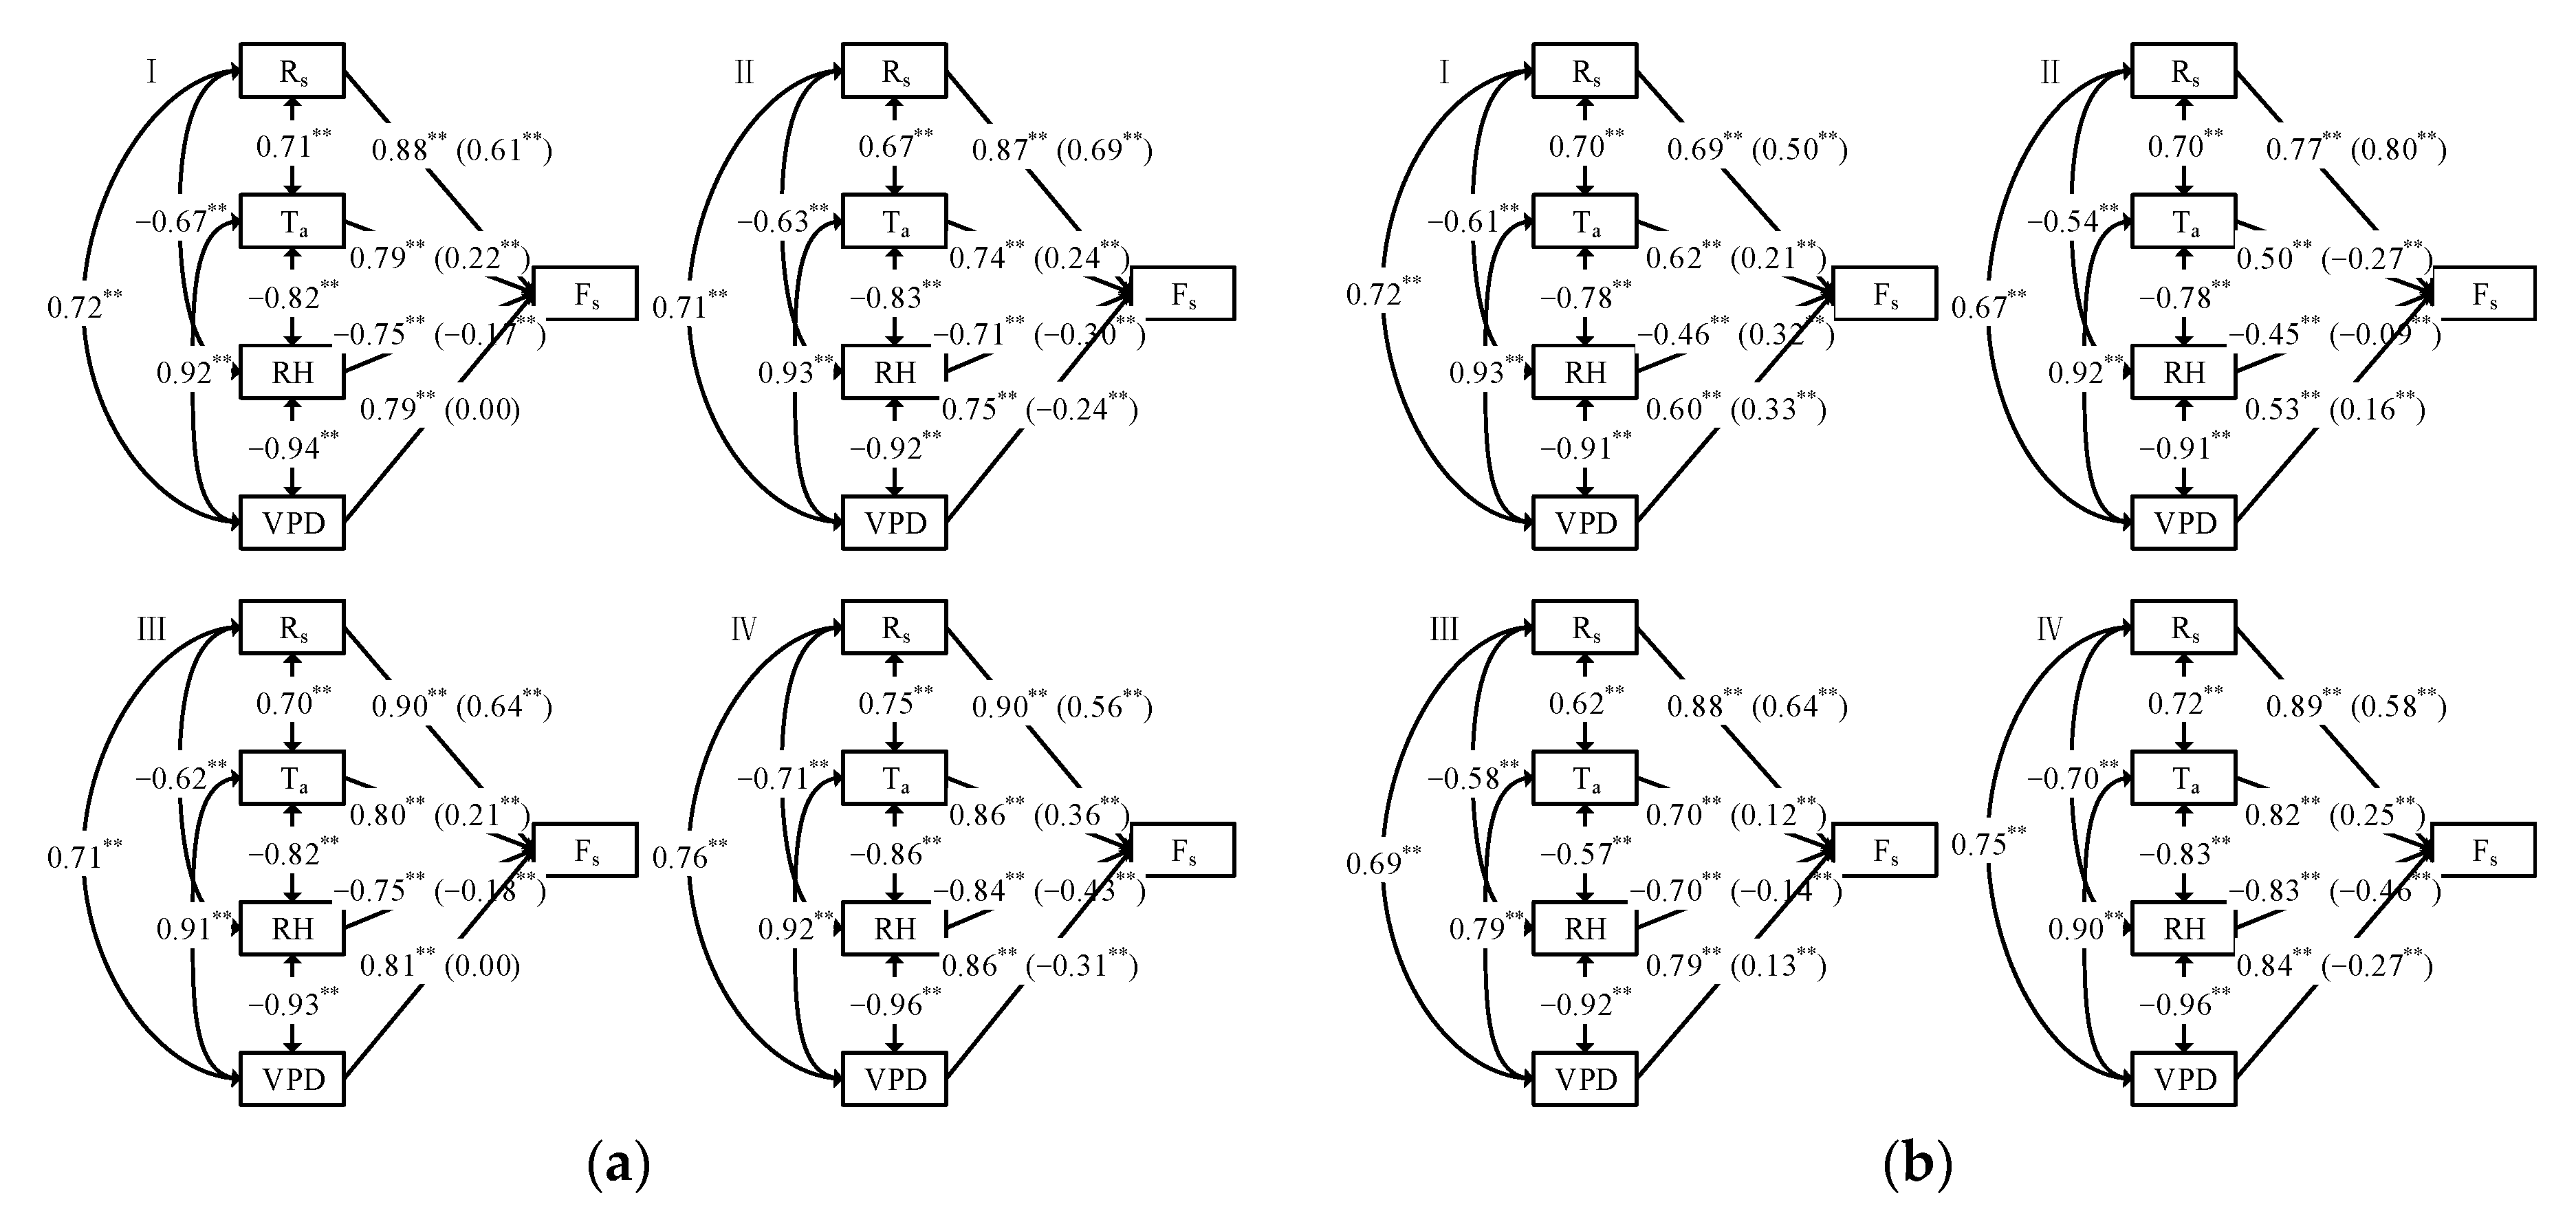
3.3. Path Analysis of Instantaneous Transpiration Influence Factors in Grapes

As shown in Figure 3 and Figure 4, the correlation between grape transpiration and meteorological factors was not consistent at different temporal scales. In addition, different environmental factors not only affect grape transpiration directly, but a single factor can also indirectly affect grape transpiration by affecting other factors. Therefore, it is necessary to systematically analyze the direct, indirect, and overall effects of environmental factors on grape transpiration at different temporal scales using path analysis.
Figure 5 shows the correlation between each meteorological factor on the daily scale, and the correlation between each meteorological factor and grape transpiration all reached the most significant level (p < 0.01). In terms of decision coefficients, in 2020, all four growth periods showed Rs > VPD > Ta > RH, and the decision coefficients (R) of Rs were 0.88, 0.87, 0.90, and 0.90. In 2021, the new growth period showed Rs > Ta > VPD > RH. The flowering and fruit setting period and fruit expansion period showed similar results as those in 2020. The fruit maturation period showed Rs > VPD > RH > Ta, with the R of 0.69, 0.77, 0.88, and 0.89 for Rs at the four growth periods. In addition, the R also showed that Rs, VPD, and Ta were positively correlated with Fs, which promoted grape transpiration. While RH was negatively correlated with Fs, which inhibited grape transpiration. In terms of direct path coefficients (P), the influence factors of the new growth period and fruit expansion period in 2020 showed Rs > Ta > RH > VPD, and in the flowering and fruit setting period and fruit maturation period were Rs > RH > Ta > VPD and Rs > RH > Ta > VPD. The P of Rs with the largest direct effect in the four growth periods were 0.61, 0.69, 0.64, and 0.56, respectively. The results in 2021 were quite different from those in 2020. The new growth period was Rs > VPD > RH > Ta, the flowering and fruit setting period was Rs > Ta > VPD > RH, and the fruit expansion period and fruit maturation period were Rs > RH > VPD > Ta, where the P of Rs in the four growth periods were 0.50, 0.80, 0.64, and 0.58, respectively. In terms of indirect path coefficients (r), VPD had the greatest indirect effect on Fs through Rs, and the indirect path coefficients were 0.44, 0.49, 0.45, and 0.43, respectively. The results in 2021 were slightly different from those in 2020. Especially in the flowering and fruit setting period, Ta had the largest indirect effect on Fs through Rs and r of 0.56. From the sum of indirect path coefficients, it can be seen that in 2020, the new growth period was VPD > RH > Ta > Rs, and the other three periods were VPD > Ta > RH > Rs. The sum of the indirect path coefficients of VPD with the largest indirect effect on Fs through other factors were 0.80, 0.99, 0.81, and 1.17 in the four periods, respectively. In 2021, the new growth period showed RH > Ta > VPD > Rs, the flowering and fruit setting period showed Ta > VPD > RH > Rs, and the results of other growth periods were similar to those in 2020. Therefore, Rs was the main control factor for the transient transpiration of grapes.

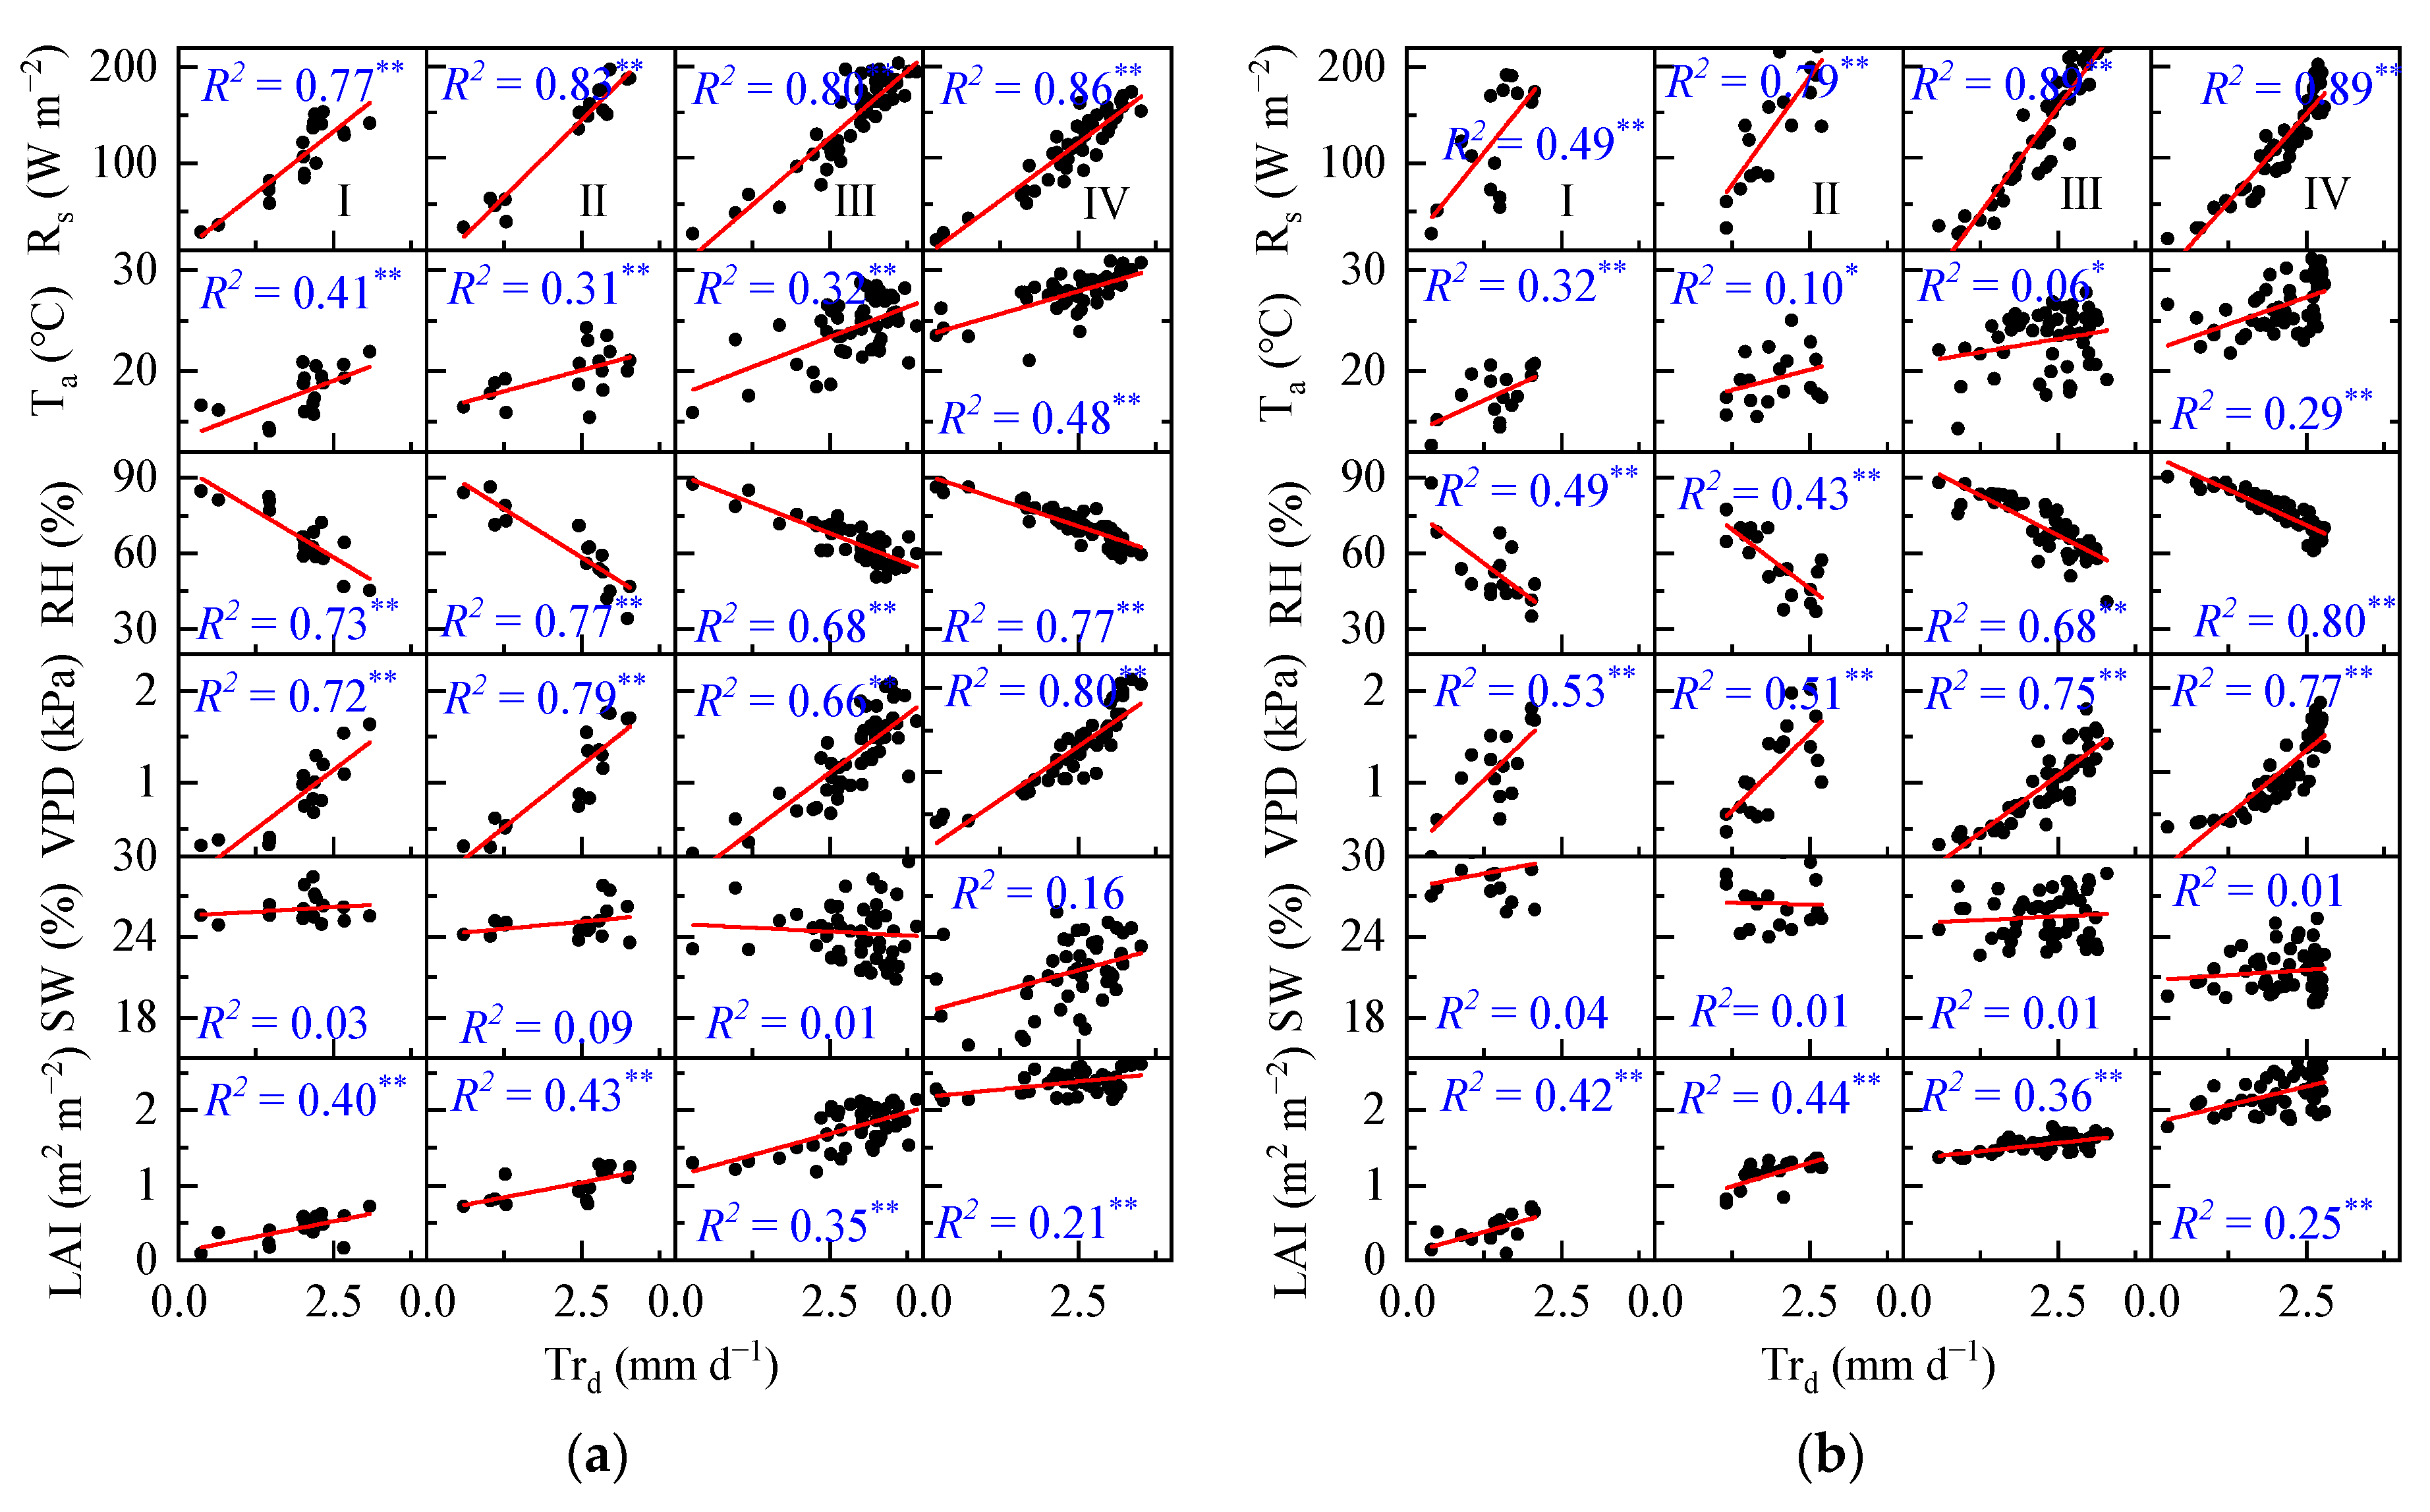
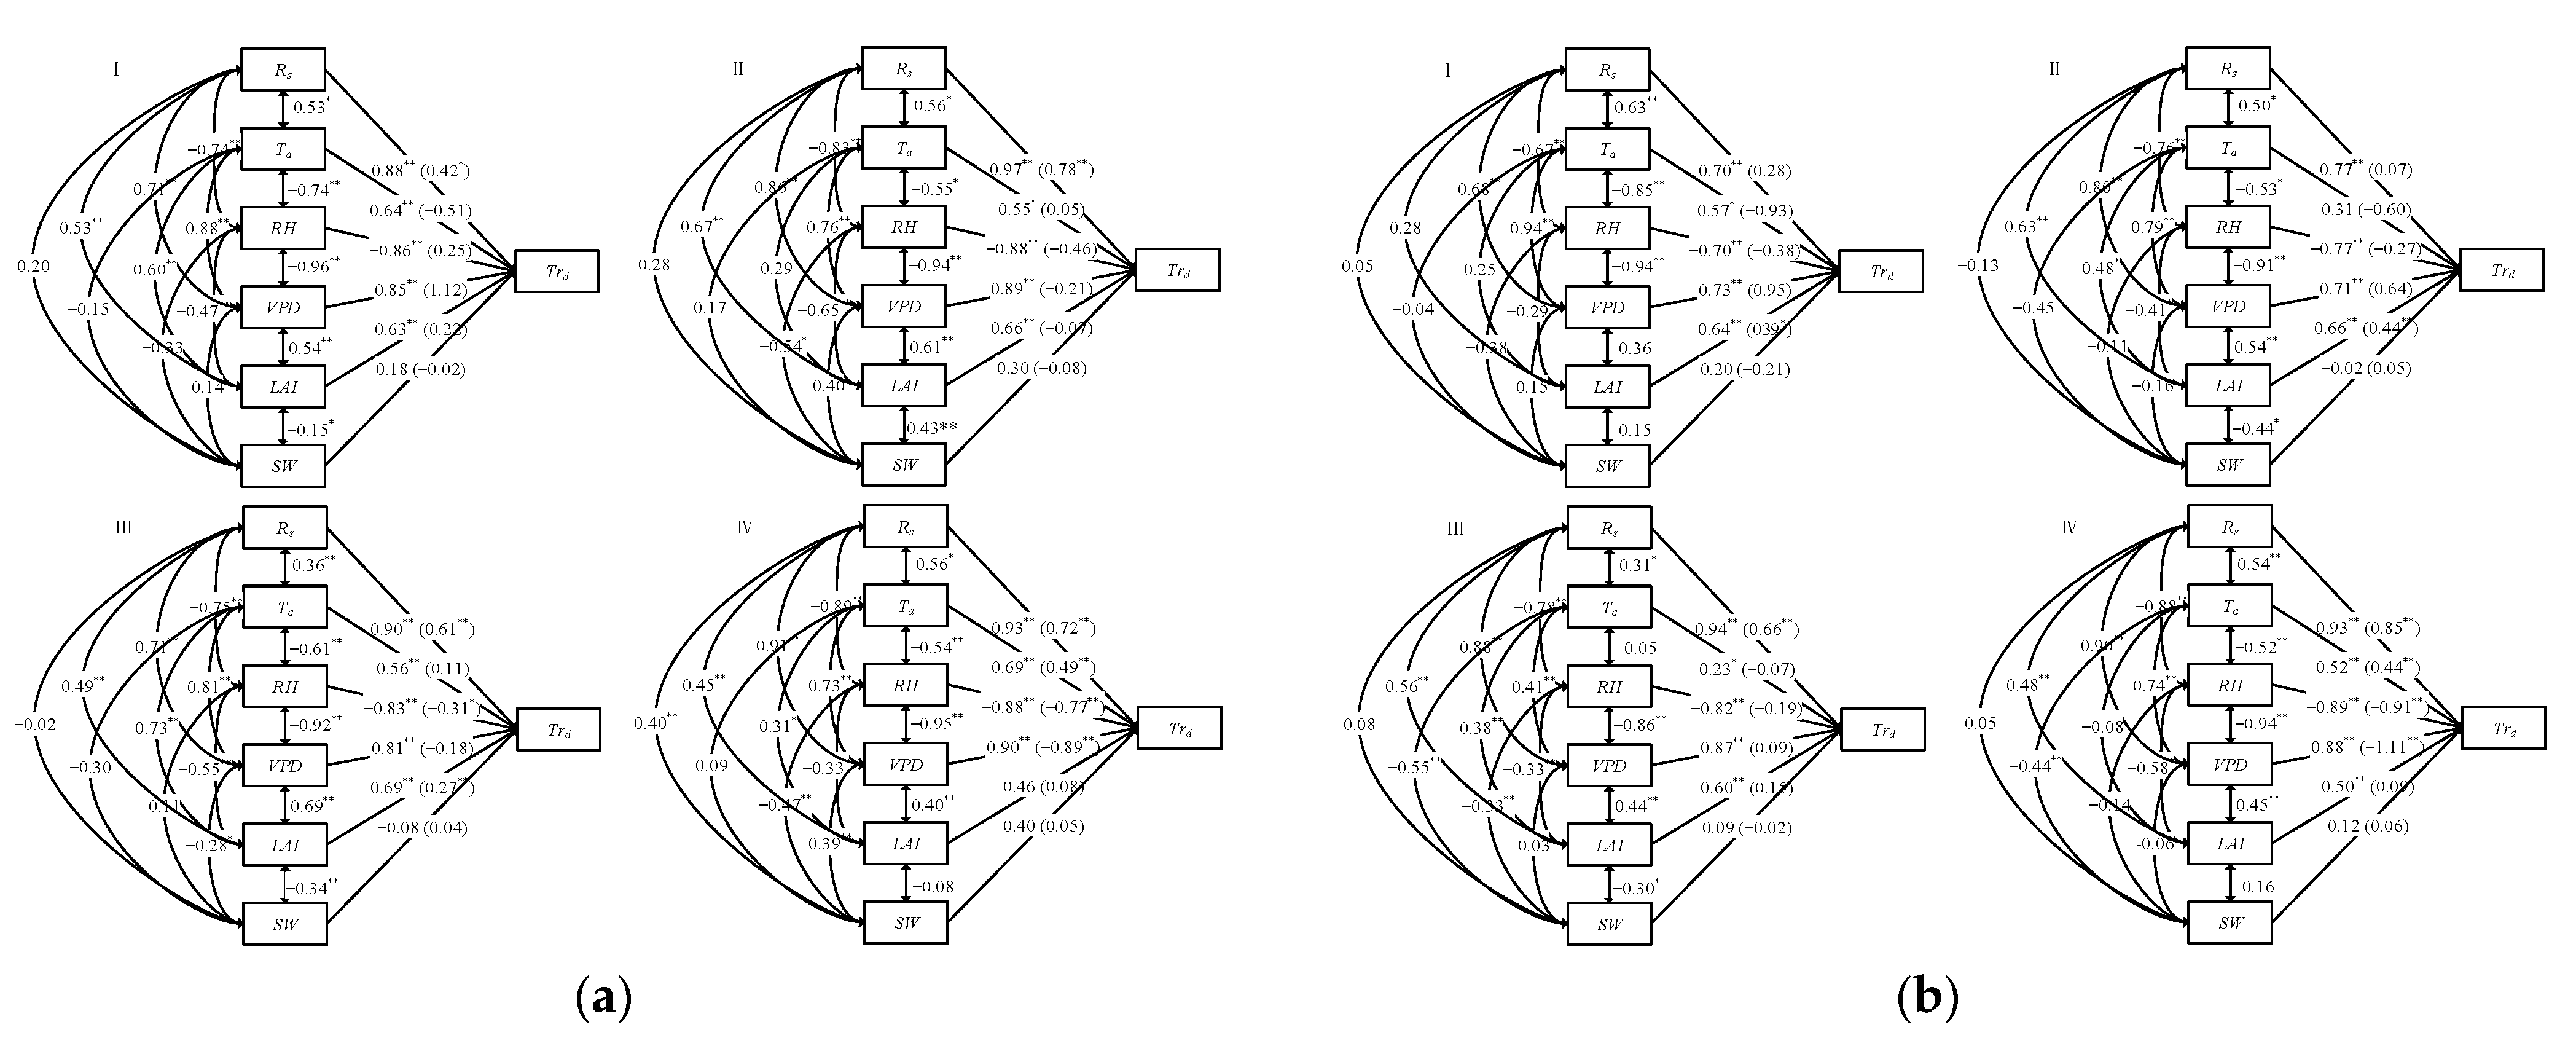
3.4. Path Analysis of Daily Transpiration Influence Factors in Grapes

Figure 6 shows the correlation between each meteorological factor on the daily scale, and the correlation between each meteorological factor, LAI, and grape transpiration all reached the significant level (p < 0.05). However, the correlation between SW and various meteorological factors and grape transpiration reached the significant level only in certain growth periods, and there was no correlation with Trd. In terms of decision coefficients, the influencing factors in 2020 in the new growth period were Rs > RH > VPD > Ta > LAI > SW, Rs > VPD > RH > LAI > Ta > SW in the flowering and fruit setting period, and Rs > RH > VPD > LAI > Ta > SW in the fruit expansion period. The results in the fruit maturation period were similar to those in the flowering and fruit setting period, where the R of Rs were 0.88, 0.97, 0.90, and 0.93 in the four growth periods. The results in 2021 were slightly different from those in 2020, with VPD > Rs > RH > LAI > Ta > SW at the new growth period, Rs > RH > VPD > LAI > Ta > SW at the flowering and fruit setting period, Rs > VPD > RH > LAI > Ta > SW at the fruit expansion period, and Rs > RH > VPD > Ta > LAI > SW at the fruit maturation period. The R also showed that Rs, Ta, VPD, and LAI were positively correlated with Trd, which promoted grape transpiration, while the RH was negatively correlated with Trd, which inhibited grape transpiration. SW was negatively correlated with Trd at some growth periods. In terms of direct path coefficients, each influence factor showed VPD > Ta > Rs > RH > LAI > SW during the new growth periods in 2020, Rs > RH > VPD > SW > Ta > LAI during the flowering and fruit setting period, Rs > RH > LAI > VPD > Ta > SW during fruit expansion periods, and VPD > RH > Rs > Ta > LAI > SW during the fruit maturation period. The factors with the greatest direct effect on Trd at each growth period were VPD, Rs, Rs, and VPD, with P of 1.12, 0.78, 0.61, and −0.89, respectively. The results in 2021 were quite different from those in 2020, showing VPD > Ta > LAI > RH > Rs > SW at the new growth periods, VPD > Ta > LAI > RH > Rs > SW at the flowering and fruit setting period, Rs > RH > LAI > VPD > Ta > SW at the fruit expansion periods, and the results at the fruit maturation period were similar to those in 2020. In terms of the indirect path coefficients, RH had the greatest indirect effect on Trd through VPD in the new growth period in 2020. The indirect effect of VPD on Trd through Rs was the greatest at the flowering and fruit setting period. The indirect effect of RH on Trd through Rs was the greatest during fruit expansion periods. In the fruit maturation period, the indirect effect of RH on Trd through VPD was the largest, and the r were −1.08, 0.67, −0.46, and 0.84 in the four growth periods, respectively. The results in 2021 differed from 2020: the new growth period was similar to that in 2020, the indirect effect of RH on Trd through VPD was greatest at the flowering and fruit setting period, the indirect effect of VPD on Trd through Rs was greatest at the fruit expansion period, and the indirect effect of RH on Trd through VPD was greatest at fruit maturation period. The r were −0.89, −0.58, 0.58, and 1.04, respectively. The sum of indirect path coefficients showed that the factors were Ta > RH > Rs > LAI > VPD > SW during the new growth period in 2020, VPD > LAI > Ta > RH > SW > Rs during the flowering and fruit setting period, VPD > RH > Ta > LAI > Rs > SW during the fruit expansion period, and VPD > LAI > SW > Rs > Ta > RH during the fruit maturation period. During the four growth periods, the factors with the largest indirect total effects were Ta, VPD, VPD, and VPD, and the sums of the indirect path coefficients were 1.17, 1.10, 0.98, and 1.78, respectively. The results of 2021 differed significantly from those of 2020, with Ta > Rs > SW > RH > LAI > VPD during the new growth period, Ta > Rs > RH > LAI > VPD > SW during the flowering and fruit setting period, VPD > RH > LAI > Ta > Rs > SW during fruit expansion period, and VPD > LAI > Rs > Ta > SW > RH during the fruit maturation period. Therefore, Rs was the main control factor for the daily transpiration of grapes.

3.5. Path Analysis of Transpiration Influence Factors during the Whole Grape Growth Period

Table 2 shows the results of the path analysis of transpiration, with each factor at different temporal scales throughout the whole growth period. The effects of Rs, Ta, RH, and VPD on Fs were all highly significant at the instantaneous scale (p < 0.01). In terms of decision coefficients, the factors were Rs > VPD > Ta > RH, with the R of Rs reaching 0.86; in terms of direct path coefficients, the factors were Rs > VPD > Ta > RH, with the P of Rs reaching 0.61. The total indirect effect of each factor is RH > Ta > VPD > Rs, and the indirect effect of VPD on Fs through Rs is the largest, with r of 0.43. On the daily scale, the effects of Rs, Ta, RH, VPD, and LAI on Trd all reached a highly significant level (p < 0.01) while the effect of SW is not significant. In terms of decision coefficients, the factors were Rs > VPD > RH > Ta > LAI > SW, with the R of Rs reaching 0.81. In terms of direct path coefficients, the factors were VPD > Rs > LAI > RH > Ta > SW, with the P of Rs reaching 0.51. The total indirect effect of each factor was RH > Ta > Rs > VPD > SW > LAI. Among them, Rs had the largest indirect effect on Trd through VPD with an indirect path coefficient of 0.47. At the growth period scale, the significance of Rs, Ta, RH, and VPD decreased, except for Ta and LAI, which reached a significant level (p < 0.05) while the other factors were not significant. In terms of decision coefficients, the factors showed that Rs > LAI > VPD > Ta > SW > RH, among which the R of Rs reached 0.68. In terms of direct path coefficients, the factors showed that Rs > LAI > RH > VPD > Ta >SW, among which the P of Rs reached 0.61. The total indirect effect of each factor was Ta > RH > VPD > Rs > SW > LAI, with Ta having the largest indirect effect on Trp through LAI with an indirect path coefficient of 0.35. Therefore, Rs was the main control factor of grape transpiration at all temporal scales throughout the whole growth period.

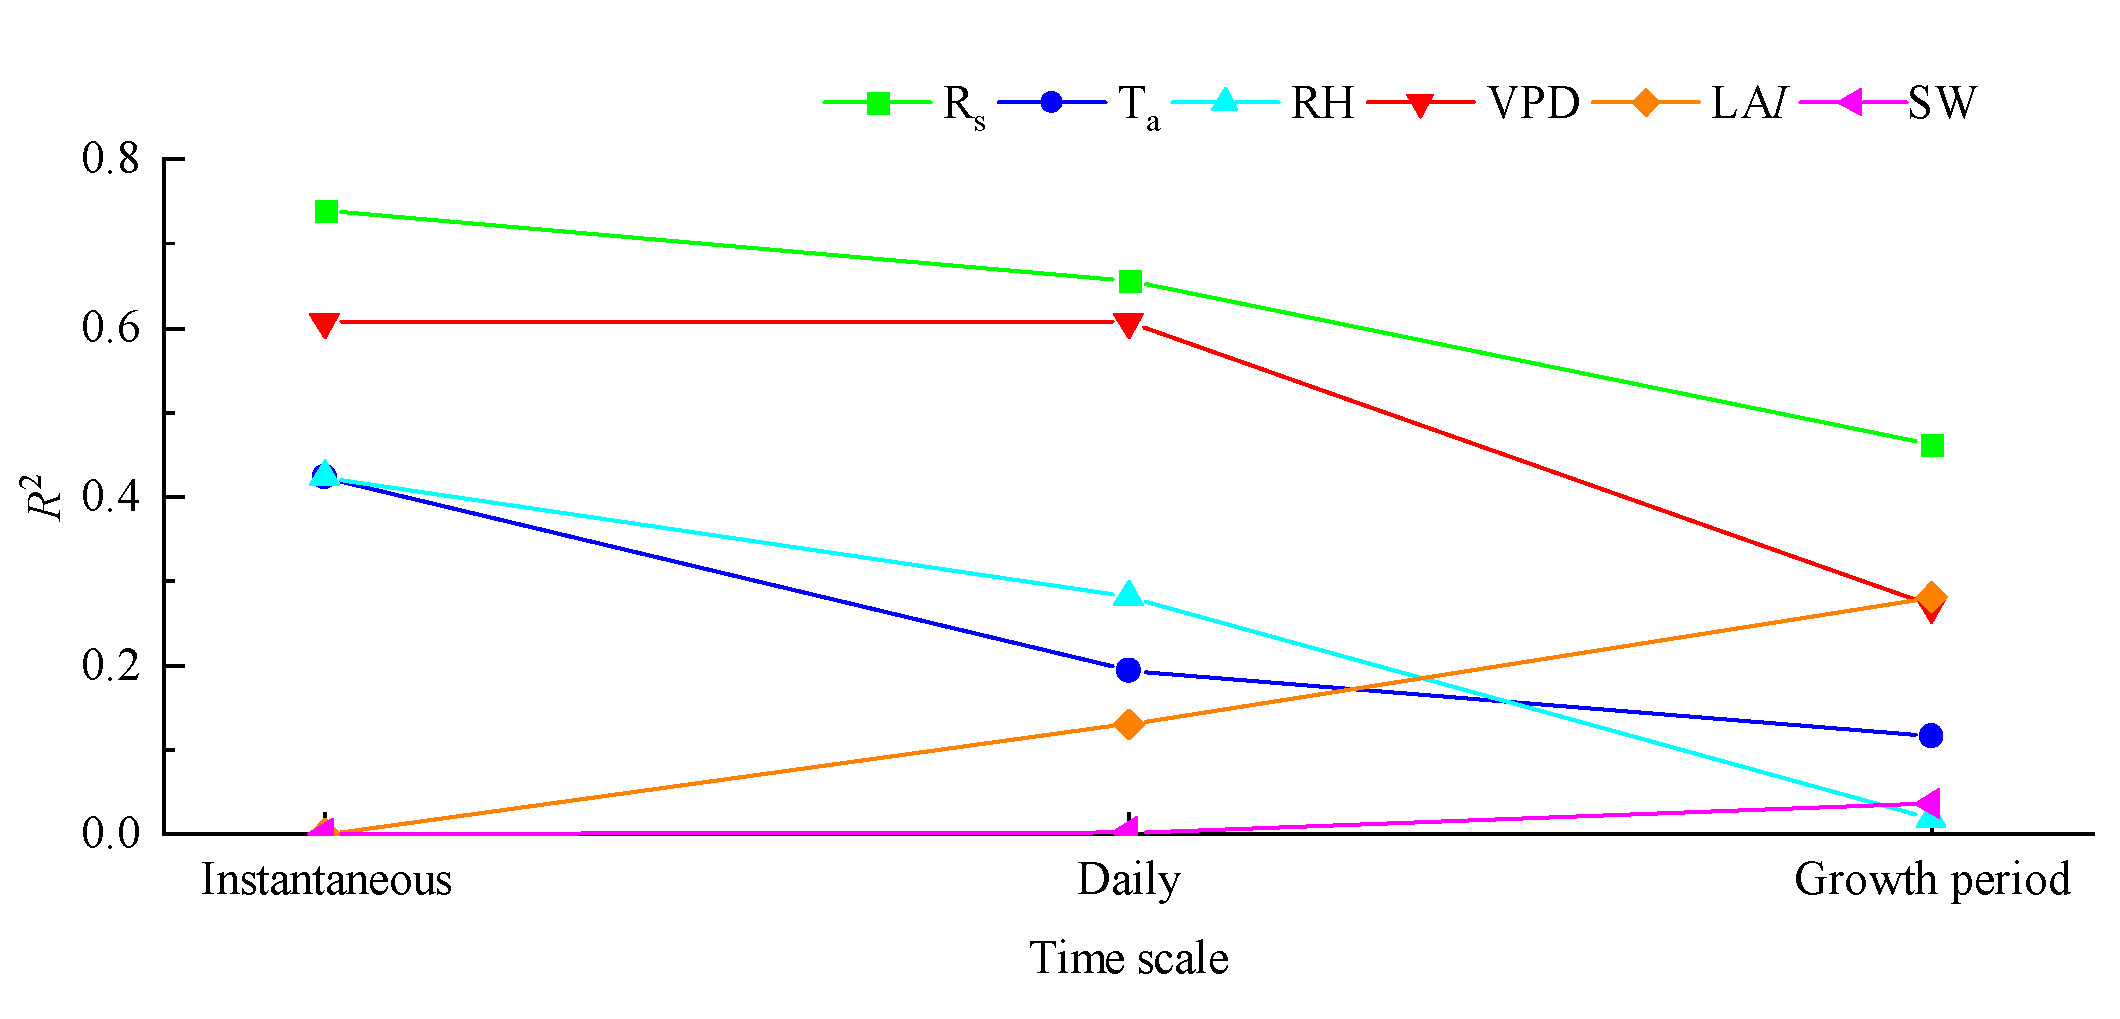
3.6. Time Scale Effects of Transpiration Master Control Factors at Different Scales

Figure 7 illustrates the variation of R2 between grape transpiration and the main influencing factors at three temporal scales: instantaneous, daily, and growth period. Among them, the R2 of RH and Ta decreased obviously, and the R2 at the growth period scale were only 0.02 and 0.12, respectively. The correlation between Rs and grape transpiration decreased with increasing scale but not significantly. Rs is always the most important factor affecting grape transpiration in terms of instantaneous, daily, and growth period scales. In addition, this study also found that with the improvement of the research scale, the influence of LAI on transpiration was gradually enhanced, and its R2 at the growth period scale reached 0.28, which exceeded other influencing factors except Rs.

4. Discussion

4.1. Analysis of Main Control Factors of Instantaneous Transpiration

In this study, the correlation and path analysis of instantaneous transpiration and meteorological factors at different growth periods revealed that at the instantaneous scale, Rs, Ta, and VPD were significantly positively correlated with Fs (p < 0.05). RH was significantly negatively correlated with Fs (p < 0.05). Among them, the correlation between Rs and Fs is the best and the decision coefficient is the largest, which is the main control factor of instantaneous transpiration. However, the order of other influencing factors except Rs varied in different years at different growth periods. This study also found that the direct effect of Rs was the largest, but the order of the direct effect of other influencing factors varied in different years at different growth periods. The indirect effect on instantaneous transpiration and the indirect total effect on instantaneous transpiration also differed in different growth periods in different years. This is similar to the results of Cheng et al. [33], who concluded that the dominant meteorological factor affecting instantaneous transpiration is not unique, but the contribution of solar radiation is large. The main reason for the differences in results at different growth periods or in different years is that grape instantaneous transpiration is the result of a combination of internal and external factors. Internal factors include canopy structure, stomatal opening, trunk hydraulic structure, and root hydraulic transmission characteristics. External factors refer to environmental factors, mainly irrigation methods, soil moisture conditions, and meteorological factors [34]. In this study, only meteorological factors of transpiration were analyzed at the instantaneous scale, and the effects of internal factors such as canopy structure and stomatal opening on transpiration were not considered in different years and different growth periods. Therefore, the results were different for the results of different growth periods in different years. At some growth periods, due to high solar radiation, transpiration of the crop is intense, and the water uptake rate of the root system cannot be fully adapted to the water demand of transpiration, resulting in a short “siesta” phenomenon. This phenomenon was not considered in this study, which is also the reason for the differences in results at different growth periods [10]. In addition, continuous observation is difficult because LAI and SW vary less on the temporal scale. Therefore, the effects of LAI and SW at instantaneous scales were not considered in this study, which may also be the reason for the differences in results at different growth periods. Zhang et al. [35] found that at the instantaneous scale, the total effect of ground temperature on Fs was the largest, and the direct effect of VPD on Fs was the largest, which was different from this study. This may be due to species differences, or it may be due to differences in the growing seasons of winter wheat and grapes.

4.2. Analysis of Main Control Factors of Daily Transpiration

In this study, we found that the daily transpiration of grapes showed a single-peak trend during the whole growth period and reached the maximum value at the end of the fruit expansion period and the beginning of the fruit maturation period. This is different from the research of Li et al. [7] and Du et al. [34]. Du et al. found that the peak of daily transpiration occurred at the end of flowering and the beginning of fruit expansion, while Li et al. found that the maximum daily transpiration occurred at the mature period. This is mainly because the different site conditions, growing environment, water, and horticultural management measures of grapes can significantly affect grape transpiration.
In this study, the correlation and path analysis of daily transpiration and meteorological factors at different growth periods revealed that at the instantaneous scale, Rs, Ta, VPD, and LAI were significantly positively correlated with Trd (p < 0.05), and RH was significantly negatively correlated with Trd (p < 0.05). SW did not reach a significant level with Trd, and SW showed a negative correlation with Trd at some growth periods. SW was negatively correlated with Trd at some growth periods. Cai et al. [20] found that SW was positively correlated with Trd, which may be due to the fact that this experiment was fully irrigated and did not produce water stress. Zhang et al. [35] concluded that in the absence of soil water stress, the effect of soil water on evapotranspiration can be ignored. This study also found that, on the daily scale, R2 and the decision coefficients were greater than Rs for VPD during the new growth period in 2021, except for Rs, which showed the best correlation with Trd and the largest decision coefficient and was the main control factor for daily transpiration. This is similar to the results of Gong et al. [10] and Li et al. [7]. However, Cai et al. [20] considered LAI as the main control factor of daily transpiration, followed by Rs, which is inconsistent with the results of this study. The main reason for this difference may be due to the different daily management measures of the crop. In this study, the changes in grape canopy structure and LAI were artificially intervened through pruning measures. It may also be due to the significant effect of insulation and warming in the greenhouse under heliostat growing conditions. The temperature at night is not only higher than the outdoor temperature but also increases rapidly and cools slowly, so the temperature is no longer a major factor restricting the liquid flow. At the same time, under greenhouse growing conditions, air convection was poor, and there is no obvious wind speed. This leads to the above conclusions differing from this paper. This study also found that the factors with the greatest direct, indirect, and total indirect effects on Trd differed in different years at different growth periods. This is mainly because soil temperature is also an important factor in controlling the plant growth process and interacts with solar radiation to affect the water and heat conditions of the near-surface atmosphere, thereby affecting crop transpiration [35]. The effect of ground temperature on grape transpiration was not considered in this experiment and differed significantly between growth periods.

4.3. Analysis of the Main Control Factors of Transpiration at the Growth Scale

In this study, path analysis of transpiration and meteorological factors at the growth period scale revealed that the significance of Rs, Ta, RH, and VPD decreased at the growth period scale. Except for Ta and LAI, which reached a significant level (p < 0.05), other factors were not significant. The total and direct effects of Rs on transpiration were the largest, with decision coefficient and direct path coefficients reaching 0.79 and 0.61, respectively. The indirect effect of LAI on Trp through Ta was the largest, and RH had the largest indirect total effect. Thus, at the growth period scale, Rs was the main control factor of grape transpiration. This is similar to the results of Nalevanková et al. [11], but the results of Zhang et al. [35] showed that soil temperature was the main controlling factor driving transpiration at the growth period scale. While the effect of soil temperature on transpiration was not considered in this study, some studies have shown that the effect of soil temperature on transpiration is not negligible [36,37]. Therefore, the effects of soil temperature on transpiration and the interaction between soil temperature and other meteorological factors need to be considered in subsequent studies to further reveal the time-scale effect of transpiration. This study also found that the effects of meteorological factors such as Rs, Ta, VPD, and RH on transpiration gradually weakened, and the correlations of LAI gradually increased as the scale increased, and similar results were obtained by Wei et al. [9]. This is mainly because, in the growth of grapes, LAI first affects the land surface coverage and then affects the canopy transpiration surface area. The size and distribution of leaf area directly affect the interception and utilization of light energy by vegetation and thus affect the transpiration of vegetation.

5. Conclusions

Transpiration under greenhouse conditions is a complex process that is driven both by the characteristics of the plant and the greenhouse micro-environment. In this study, based on the measured data in 2020 and 2021, the transpiration and the influencing factors were analyzed at different time scales. The main findings of the study include: At the instantaneous scale, the effects of all meteorological factors on grape transpiration reached significant (p < 0.05) or highly significant (p < 0.01) levels at all growth periods. R2 was between 0.25 and 0.84. At the daily scale, Rs, Ta, RH, VPD, and LAI were significantly correlated with transpiration (p < 0.05) at all growth periods, while SW had no correlation with transpiration. Except for the new growth period in 2021, the correlation between VPD and transpiration was the largest (R2 = 0.53); other growth periods showed the best correlation between Rs and transpiration, with R2 ranging from 0.77 to 0.89. The results of the path analysis by growth period showed that the direct and total effects of Rs on Fs were the largest at all growth periods at the instantaneous scale, with decision coefficients ranging from 0.69 to 0.90. On the daily scale, the sum of the total effect of Rs on daily transpiration was the largest, except for the new growth period, and the decision coefficients ranged from 0.70 to 0.94. The results of the whole growth period path analysis showed that Rs had the greatest effect on instantaneous transpiration with decision coefficients of 0.86. At the daily scale, Rs remained the most influential factor in grape transpiration with a decision coefficient of 0.81. On the scale of growth period, only Ta and LAI were significantly correlated with transpiration (p < 0.05). The total effects of Rs on transpiration were the largest, and the decision coefficient was 0.68. Rs is always the most important factor affecting grape transpiration in terms of instantaneous, daily, and growth period scales. However, with an increase in time scale, LAI and SW have enhanced their effects on transpiration, while Rs, Ta, RH, and VPD have gradually weakened their effects on transpiration.

Author Contributions

Conceptualization, X.W. and D.P.; methodology, Y.B.; software, Y.L.; validation, D.P., X.W. and Y.L.; formal analysis, D.P.; investigation, S.J.; resources, X.W.; data curation, S.J.; writing—original draft preparation, D.P.; writing—review and editing, C.W. and X.W.; visualization, C.W.; supervision, X.W.; project administration, Y.B. All authors have read and agreed to the published version of the manuscript.

Funding

The study was funded by the Natural Science Foundation of Liaoning (No. 2021-MS-233), Liaoning provincial key research and development plan (NO. 2021JH2/10200022).

Institutional Review Board Statement

Not applicable.

Informed Consent Statement

Not applicable.

Data Availability Statement

Not applicable.

Acknowledgments

We acknowledge the staff of Shenyang Agricultural University for their technical support.

Conflicts of Interest

The authors declare no conflict of interest.

References

  1. Di, N.; Xi, B.; Clothier, B.; Wang, Y.; Li, G.; Jia, L. Diurnal and nocturnal transpiration behaviors and their responses to groundwater-table fluctuations and meteorological factors of Populus tomentosa in the North China Plain. For. Ecol. Manag. 2019, 448, 445–456. [Google Scholar] [CrossRef]
  2. Jiao, L.; Lu, N.; Fang, W.; Li, Z.; Wang, J.; Jin, Z. Determining the independent impact of soil water on forest transpiration: A case study of a black locust plantation in the Loess Plateau, China. J. Hydrol. 2019, 572, 671–681. [Google Scholar] [CrossRef]
  3. Kumagai, T.o.; Tateishi, M.; Miyazawa, Y.; Kobayashi, M.; Yoshifuji, N.; Komatsu, H.; Shimizu, T. Estimation of annual forest evapotranspiration from a coniferous plantation watershed in Japan (1): Water use components in Japanese cedar stands. J. Hydrol. 2014, 508, 66–76. [Google Scholar] [CrossRef]
  4. Yan, H.; Li, M.; Zhang, C.; Zhang, J.; Wang, G.; Yu, J.; Ma, J.; Zhao, S. Comparison of evapotranspiration upscaling methods from instantaneous to daytime scale for tea and wheat in southeast China. Agric. Water Manag. 2022, 264, 107464. [Google Scholar] [CrossRef]
  5. Jiankun, G.; Yanfei, L.; Xuewen, G.; Zengjin, L.; Yanbin, L.; Cundong, X. Response of greenhouse crop ecophysiology, water consumption and yield to ventilation environment regulation. J. Inst. Eng. Ser. A 2019, 100, 743–752. [Google Scholar] [CrossRef]
  6. Nassar, A.; Torres-Rua, A.; Kustas, W.; Alfieri, J.; Hipps, L.; Prueger, J.; Nieto, H.; Alsina, M.; White, W.; McKee, L. Assessing daily evapotranspiration methodologies from one-time-of-day suas and ec information in the grapex project. Remote Sens. 2021, 13, 2887. [Google Scholar] [CrossRef]
  7. Li, B.; Zheng, S.; Wei, X.; Wang, T.; Sun, J.; Ge, D. Study on sap flow characteristics of grape and its environment influencing factors in cold regions of northeastern China. Trans. Chin. Soc. Agric. Eng. 2019, 35, 185–193. [Google Scholar] [CrossRef]
  8. Shao, D.; Sun, C.; Wang, H.; Liu, H.; Yuan, J.; Wang, J.; Zheng, C. Simulation on regulation for efficient utilization of water and fertilizer resources in paddy fields. Trans. Chin. Soc. Agric. Eng. 2010, 26, 72–78. [Google Scholar] [CrossRef]
  9. Wei, X.; Chen, D.; Wang, X.; Wang, Y.; Wei, X. Time scale effect on main factors that influence jujube transpiration in hillside jujube orchard. Trans. Chin. Soc. Agric. Eng. 2014, 30, 149–156. [Google Scholar] [CrossRef]
  10. Gong, X.; Liu, H.; Sun, J.; Zhang, H.; Ma, X.; Wang, W. Variation of evapotranspiration in different spatial scales for solar greenhouse tomato and its controlling meteorological factors. Trans. Chin. Soc. Agric. Eng. 2017, 33, 166–175. [Google Scholar] [CrossRef]
  11. Nalevanková, P.; Sitková, Z.; Kučera, J.; Střelcová, K. Impact of water deficit on seasonal and diurnal dynamics of European beech transpiration and time-lag effect between stand transpiration and environmental drivers. Water 2020, 12, 3437. [Google Scholar] [CrossRef]
  12. Xu, S.; Yu, Z. Environmental control on transpiration: A case study of a desert ecosystem in northwest china. Water 2020, 12, 1211. [Google Scholar] [CrossRef]
  13. Zhang, B.; Xu, D.; Liu, Y.; Li, F.; Cai, J.; Du, L. Multi-scale evapotranspiration of summer maize and the controlling meteorological factors in north China. Agric. For. Meteorol. 2016, 216, 1–12. [Google Scholar] [CrossRef]
  14. Han, Q.; Wang, T.; Wang, L.; Smettem, K.; Mai, M.; Chen, X. Comparison of nighttime with daytime evapotranspiration responses to environmental controls across temporal scales along a climate gradient. Water Resour. Res. 2021, 57, e2021WR029638. [Google Scholar] [CrossRef]
  15. Sun, J.; Sun, X.; Hu, Z.; Wang, G. Exploring the influence of environmental factors in partitioning evapotranspiration along an elevation gradient on Mount Gongga, eastern edge of the Qinghai-Tibet Platea, China. J. Mt. Sci. 2020, 17, 384–396. [Google Scholar] [CrossRef]
  16. Pour, S.H.; Abd Wahab, A.K.; Shahid, S.; Ismail, Z.B. Changes in reference evapotranspiration and its driving factors in peninsular Malaysia. Atmos. Res. 2020, 246, 105096. [Google Scholar] [CrossRef]
  17. Liu, W.; Zhang, B.; Han, S. Quantitative analysis of the impact of meteorological factors on reference evapotranspiration Changes in Beijing, 1958–2017. Water 2020, 12, 2263. [Google Scholar] [CrossRef]
  18. Qiao, Y.; Ma, Y.; Xin, M. Analysis of evapotranspiration characteristics of Ziziphus jujuba Mill. orchards in arid areas based on improved S-W and structural equation model. Trans. Chin. Soc. Agric. Mach. 2021, 52, 307–317. [Google Scholar]
  19. Li, G.; Zhang, Y.; Deng, T.; Li, D.; Liu, J.; Jia, L.; Xi, B. Responses of tree stem sap flow and its main influencing factors to bud pruning. Trans. Chin. Soc. Agric. Eng. 2021, 37, 131–139. [Google Scholar] [CrossRef]
  20. Cai, J.; Xu, D.; Liu, Y.; Zhang, B. Path analysis on spatio-temporal scaling effect of crop evapotranspiration in growing seasons for winter wheat after reviving. Trans. Chin. Soc. Agric. Eng. 2011, 27, 69–76. [Google Scholar] [CrossRef]
  21. Su, Y.; Fan, X. Study of main meteorological factors affecting evapotranspiration based on gravimetric method. Agric. Res. Arid Areas 2020, 38, 40–48. [Google Scholar] [CrossRef]
  22. Anandacoomaraswamy, A.; De Costa, W.; Shyamalie, H.; Campbell, G. Factors controlling transpiration of mature field-grown tea and its relationship with yield. Agric. For. Meteorol. 2000, 103, 375–386. [Google Scholar] [CrossRef]
  23. Mellander, P.E.; Bishop, K.; Lundmark, T. The influence of soil temperature on transpiration: A plot scale manipulation in a young Scots pine stand. For. Ecol. Manag. 2004, 195, 15–28. [Google Scholar] [CrossRef]
  24. Álvarez, S.; Navarro, A.; Nicolás, E.; Sánchez-Blanco, M.J. Transpiration, photosynthetic responses, tissue water relations and dry mass partitioning in Callistemon plants during drought conditions. Sci. Hortic. 2011, 129, 306–312. [Google Scholar] [CrossRef] [Green Version]
  25. Alberto, M.C.R.; Quilty, J.R.; Buresh, R.J.; Wassmann, R.; Haidar, S.; Correa Jr, T.Q.; Sandro, J.M. Actual evapotranspiration and dual crop coefficients for dry-seeded rice and hybrid maize grown with overhead sprinkler irrigation. Agric. Water Manag. 2014, 136, 1–12. [Google Scholar] [CrossRef]
  26. Irmak, S.; Mutiibwa, D.; Irmak, A.; Arkebauer, T.; Weiss, A.; Martin, D.; Eisenhauer, D. On the scaling up leaf stomatal resistance to canopy resistance using photosynthetic photon flux density. Agric. For. Meteorol. 2008, 148, 1034–1044. [Google Scholar] [CrossRef]
  27. Granier, A.; Biron, P.; Lemoine, D. Water balance, transpiration and canopy conductance in two beech stands. Agric. For. Meteorol. 2000, 100, 291–308. [Google Scholar] [CrossRef]
  28. Cheng, C.; Feng, L.; Dong, C.; Gong, Z.; Liu, T.; Li, Z. Simulation of inside environmental factors in solar greenhouses using Elman neural network in North China. Trans. Chin. Soc. Agric. Eng. 2021, 37, 200–208. [Google Scholar] [CrossRef]
  29. Zhang, Y.; Wang, J.; Gong, S.; Xu, D.; Sui, J.; Wu, Z. Analysis of water saving and yield increasing mechanism in maize field with drip irrigation under film mulching based on transpiration estimated by sap flow meter. Trans. Chin. Soc. Agric. Eng. 2018, 34, 89–97. [Google Scholar] [CrossRef]
  30. Li, J.; Fan, X.; Yan, F.; Li, H.; Cai, D. Effect of different irrigation amount based on transpiration model on yield and quality of muskmelon. Trans. Chin. Soc. Agric. Eng. 2017, 33, 156–162. [Google Scholar] [CrossRef]
  31. Allen, R.G.; Pereira, L.S.; Raes, D.; Smith, M. Crop evapotranspiration-Guidelines for computing crop water requirements-FAO Irrigation and drainage paper 56. Fao Rome 1998, 300, D05109. [Google Scholar]
  32. Wright, S. The biometric relations between parent and offspring. Genetics 1921, 6, 111–123. [Google Scholar] [CrossRef] [PubMed]
  33. Cheng, P.; Li, H.; Li, C.; Zhang, Z.; Liu, B.; Sun, M. Stem sap flow dynamic of jujube and its response to meteorological factors in the arid area under pit irrigation. Agric. Res. Arid Areas 2017, 35, 263–270. [Google Scholar] [CrossRef]
  34. Du, T.; Kang, S.; Zhang, B.; Li, S.; Yang, X. Effects of alternate partial rootzone irrigation on roots activity, stem sap flow and fruit of apple. Chin. J. Appl. Ecol. 2008, 299–305. [Google Scholar] [CrossRef]
  35. Zhang, X.; Yan, Y.; Hu, Z. Using path analysis to identify impacting factors of evapotranspiration at different time scales in farmland. Chin. J. Agrometeorol. 2017, 38, 201–210. [Google Scholar] [CrossRef]
  36. Sun, X.; Yang, W.; Jiao, L.; Li, Z.; Zhou, W.; Wang, X.; Zhang, Y.; Wang, A. Relationship between sapflux density of pinustabuliformis trees and environmental factors at different temporal scales in Manghan National Forest Park of Beijing, China. Acta Ecol. Sin. 2022, 42, 4113–4123. [Google Scholar] [CrossRef]
  37. Zhang, R.; Bi, H.; Wang, N.; Zhao, D.; Huang, J.; Zhao, S. Relationship between transpiration of pseudoacacia and environmental factors at different times scales. J. Soil Water Conserv. 2022, 36, 204–211. [Google Scholar] [CrossRef]
Figure 1. Experimental planting area of drip irrigation under plastic film and sensor layout. (a) Study site; (b) experimental planting area of drip irrigation under plastic film; (c) greenhouse structure and sensor layout.
Water 14 03764 g001
Figure 2. Dynamic changes of daily transpiration (Trd), solar radiation (Rs), air temperature (Ta), relative humidity (RH), vapor pressure deficit (VPD), soil water content (SW), and leaf area index (LAI).
Water 14 03764 g002
Figure 3. Correlation analysis between instantaneous transpiration (Fs) and environmental factors. (a) 2020; (b) 2021. * Indicates significant correlation between independent variable and dependent variable (p < 0.05); ** Indicates highly significant correlation between independent variables and dependent variables (p < 0.01). I, II, III, and IV respectively represent the new growth period, flowering and fruit setting period, fruit expansion period, and fruit maturation period.
Water 14 03764 g003
Figure 4. Correlation analysis between daily transpiration and environmental factors. (a) 2020; (b) 2021. * Indicates significant correlation between independent variable and dependent variable (p < 0.05); ** Indicates highly significant correlation between independent variables and dependent variables (p < 0.01). I, II, III, and IV respectively represent the new growth period, flowering and fruit setting period, fruit expansion period, and fruit maturation period.
Water 14 03764 g004
Figure 5. Path analysis results of instantaneous transpiration and meteorological factors in each growth period. (a) 2020; (b) 2021. I, II, III, and IV respectively represent the new growth period, flowering and fruit setting period, fruit expansion period, and fruit maturation period. * Indicates significant correlation between independent variable and dependent variable (p < 0.05); ** Indicates highly significant correlation between independent variables and dependent variables (p < 0.01).
Water 14 03764 g005
Figure 6. Path analysis results of instantaneous transpiration and meteorological factors in each growth period. (a) 2020; (b) 2021. I, II, III, and IV respectively represent the new growth period, flowering and fruit setting period, fruit expansion period, and fruit maturation period. * Indicates significant correlation between independent variable and dependent variable (p < 0.05); ** Indicates highly significant correlation between independent variables and dependent variables (p < 0.01).
Water 14 03764 g006
Figure 7. The determinants of each factor change with the increase of scale.
Water 14 03764 g007
Table 1. Growth period division and transpiration in 2020 and 2021.
Growth Period20202021
DateTranspiration (mm)DateTranspiration (mm)
New growth period4.11~5.235.374.6~4.2922.75
Flowering and fruit setting period5.3~5.2838.824.30~5.2534.95
Fruit expansion period5.29~7.12147.275.26~7.15138.39
Fruit maturation period7.13~8.25110.597.16~8.31109.95
Table 2. Path analysis results of transpiration and factors at different time scales in the whole growth period.
Dependent VariableVariableDecision CoefficientDirect PathIndirect PathTotal Indirect Path
RsTaRHVPDSWLAI
FsRs0.86 **0.61 **--0.040.000.21----0.25
Ta0.65 **0.070.35--0.000.23----0.58
RH−0.65 **0.00−0.35−0.03--−0.26----−0.65
VPD0.78 **0.31 **0.430.050.00------0.48
TrdRs0.81 **0.51 **--−0.04−0.180.470.030.020.30
Ta0.44 **−0.18 *0.12--0.030.310.24−0.070.62
RH−0.53 **0.26 *−0.35−0.02--−0.460.09−0.05−0.79
VPD0.78 **0.61 **0.39−0.09−0.20--0.080.000.18
LAI0.36 **0.30 **0.05−0.150.080.15--−0.080.06
SW−0.040.11 *0.080.12−0.12−0.01−0.21--−0.15
TrPRs0.680.61--−0.09−0.120.160.050.070.07
Ta0.34 *−0.320.16--0.250.140.35−0.240.66
RH−0.130.36−0.2−0.22--−0.150.22−0.15−0.49
VPD0.520.350.27−0.12−0.15--0.22−0.050.17
LAI0.53 *0.510.05−0.220.160.15--−0.130.02
SW0.190.260.160.29−0.21−0.06−0.26--−0.07
Note: * Indicates significant correlation between independent variable and dependent variable (p < 0.05); ** Indicates highly significant correlation between independent variables and dependent variables (p < 0.01).
Publisher’s Note: MDPI stays neutral with regard to jurisdictional claims in published maps and institutional affiliations.

