Article

Effects of Aeration on Pollution Load and Greenhouse Gas Emissions from Agricultural Drainage Ditches

1
State Key Laboratory of Water Resources and Hydropower Engineering Science, Wuhan University, Wuhan 430072, China
2
Key Laboratory of Ecological Environment Protection and Restoration in the Yellow River Basin of Henan Province, Institute of Yellow River Hydraulic Research, Zhengzhou 450003, China
*
Authors to whom correspondence should be addressed.
These authors contributed equally to this work.
Water 2022, 14(22), 3783; https://doi.org/10.3390/w14223783
Submission received: 24 October 2022 / Revised: 17 November 2022 / Accepted: 18 November 2022 / Published: 21 November 2022
(This article belongs to the Section Water, Agriculture and Aquaculture)

Abstract

:
Human activities input a large amount of carbon and nitrogen nutrients into water, resulting in inland freshwater becoming an important source of greenhouse gas (GHG) emissions. Agricultural drainage ditches are the main transport route of non-point source pollution. Understanding the rules for how greenhouse gas emissions from drainage ditches impact the environment can help to accurately estimate the greenhouse effect of agricultural systems. However, current research mainly focuses on the effect of different measures on the migration and transformation process of pollutants in drainage ditches. The process of greenhouse gas emissions when the non-point source of pollution is transported by drainage ditches is still unclear. In this study, the influence of aeration on the pollution load and GHG emission process of a drainage ditch in a paddy field was explored. The following conclusions were drawn: Aeration reduced the content of nitrate nitrogen in the water but had no significant effect on the content of ammonium nitrogen and it reduced the chemical oxygen demand (COD) of water by 24.9%. Aeration increased the potential of hydrogen (PH), dissolved oxygen (DO) and oxidation–reduction potential (ORP) of water and reduced the total organic carbon content, microbial carbon content and soluble carbon content of the soil in the sediment. Aeration reduced the N2O and CH4 emission fluxes and increased the CO2 emission fluxes in the drainage ditch, but it reduced the greenhouse effect generated by the drainage ditch by 33.7%. This study shows that aeration can reduce both the pollution load and the greenhouse gas emission flux in drainage ditches.

1. Introduction

Human activities, such as the use of pesticides, the application of fertilizers and the discharge of heavy metal pollutants, have not only caused serious water pollution problems [1,2], but also inputted a large amount of carbon and nitrogen nutrients into water resulting in inland freshwater becoming an important source of greenhouse gas emissions [3,4,5,6]. With the enhancement of public awareness and the improvement of supervision, point source pollution is gradually being comprehensively controlled and non-point source pollution, especially agricultural non-point source pollution caused by the massive use of chemical fertilizers and pesticides, has attracted increasing attention [7]. As the main method of transporting agricultural non-point source pollution, agricultural drainage ditches are an important source of greenhouse gas emissions in agricultural systems [8,9]. Agricultural drainage ditches can be regarded as linear wetlands. At present, there are many studies on wetland pollution loads and greenhouse gas emission laws [10,11]. However, due to the flow state of water in a drainage ditch and the periodic alternation of dry and wet conditions, it forms a unique ecological structure. Its purification mechanism of pollutants is different from that of wetlands in the general sense [12,13,14]. Therefore, it is necessary to explore the GHG emission process when the pollution load is transported by agricultural drainage ditches.
GHG emission flux is affected by the water temperature, water velocity, wind speed, photosynthetically active radiation, PH value and ORP of water, dissolved oxygen in water, carbon and nitrogen content in the soil, nutrient content in water, biological factors, hydrodynamic factors, dry and wet conditions and human activities [15,16,17]. Methane, a greenhouse gas, can only be produced in an anaerobic environment. In vegetation-free regions, methane is emitted mainly by bubbles, while carbon dioxide is emitted mainly by diffusion. In areas with plants, the gas conduction tissue of plants is the main channel of greenhouse gas emissions [18,19]. Nitrous oxide is produced mainly through nitrification and denitrification processes; the denitrification process is produced under anaerobic conditions, while the nitrification process is produced under aerobic conditions. The main route for nitrous oxide production from sediment in drainage ditch is the denitrification process [20]. It can be seen that changing the concentration of dissolved oxygen, hydraulic retention time, dry and wet conditions and density of aquatic plants in drainage ditches may affect the type and intensity of GHG emissions. As a common water treatment measure, aeration can rapidly increase the concentration of dissolved oxygen in water, improve water mobility and significantly enhance the ability to remove pollutants from water [21,22,23,24]. The oxygenation conditions created by aeration not only promote the degradation of organic matter by aerobic organisms and significantly reduce the COD content in water but also stimulate the degradation of anaerobic organic matter and effectively reduce the emission flux of greenhouse gases [23,25,26]. The effects of aeration measures in sewage treatment, constructed wetlands and rivers have been proven [27,28]. However, there are few studies on the influence of aeration on the pollution load and GHG emission process of agricultural drainage ditches [28]. Therefore, as a supplement to the research cases in this field, this study explored the influence of aeration on the pollution load and GHG emission process of agricultural drainage ditches.
We used a paddy drain as the research object to carry out the drain aeration experiment in situ. We explored the influence of greenhouse gas emissions and pollution load using the aeration to drain. We also investigated the greenhouse gas emissions for conveying agricultural non-point source pollution via a load response study. We explored the relationship between the two to provide a theoretical basis for the ecological design of the drainage ditches and technical support.

2. Materials and Methods

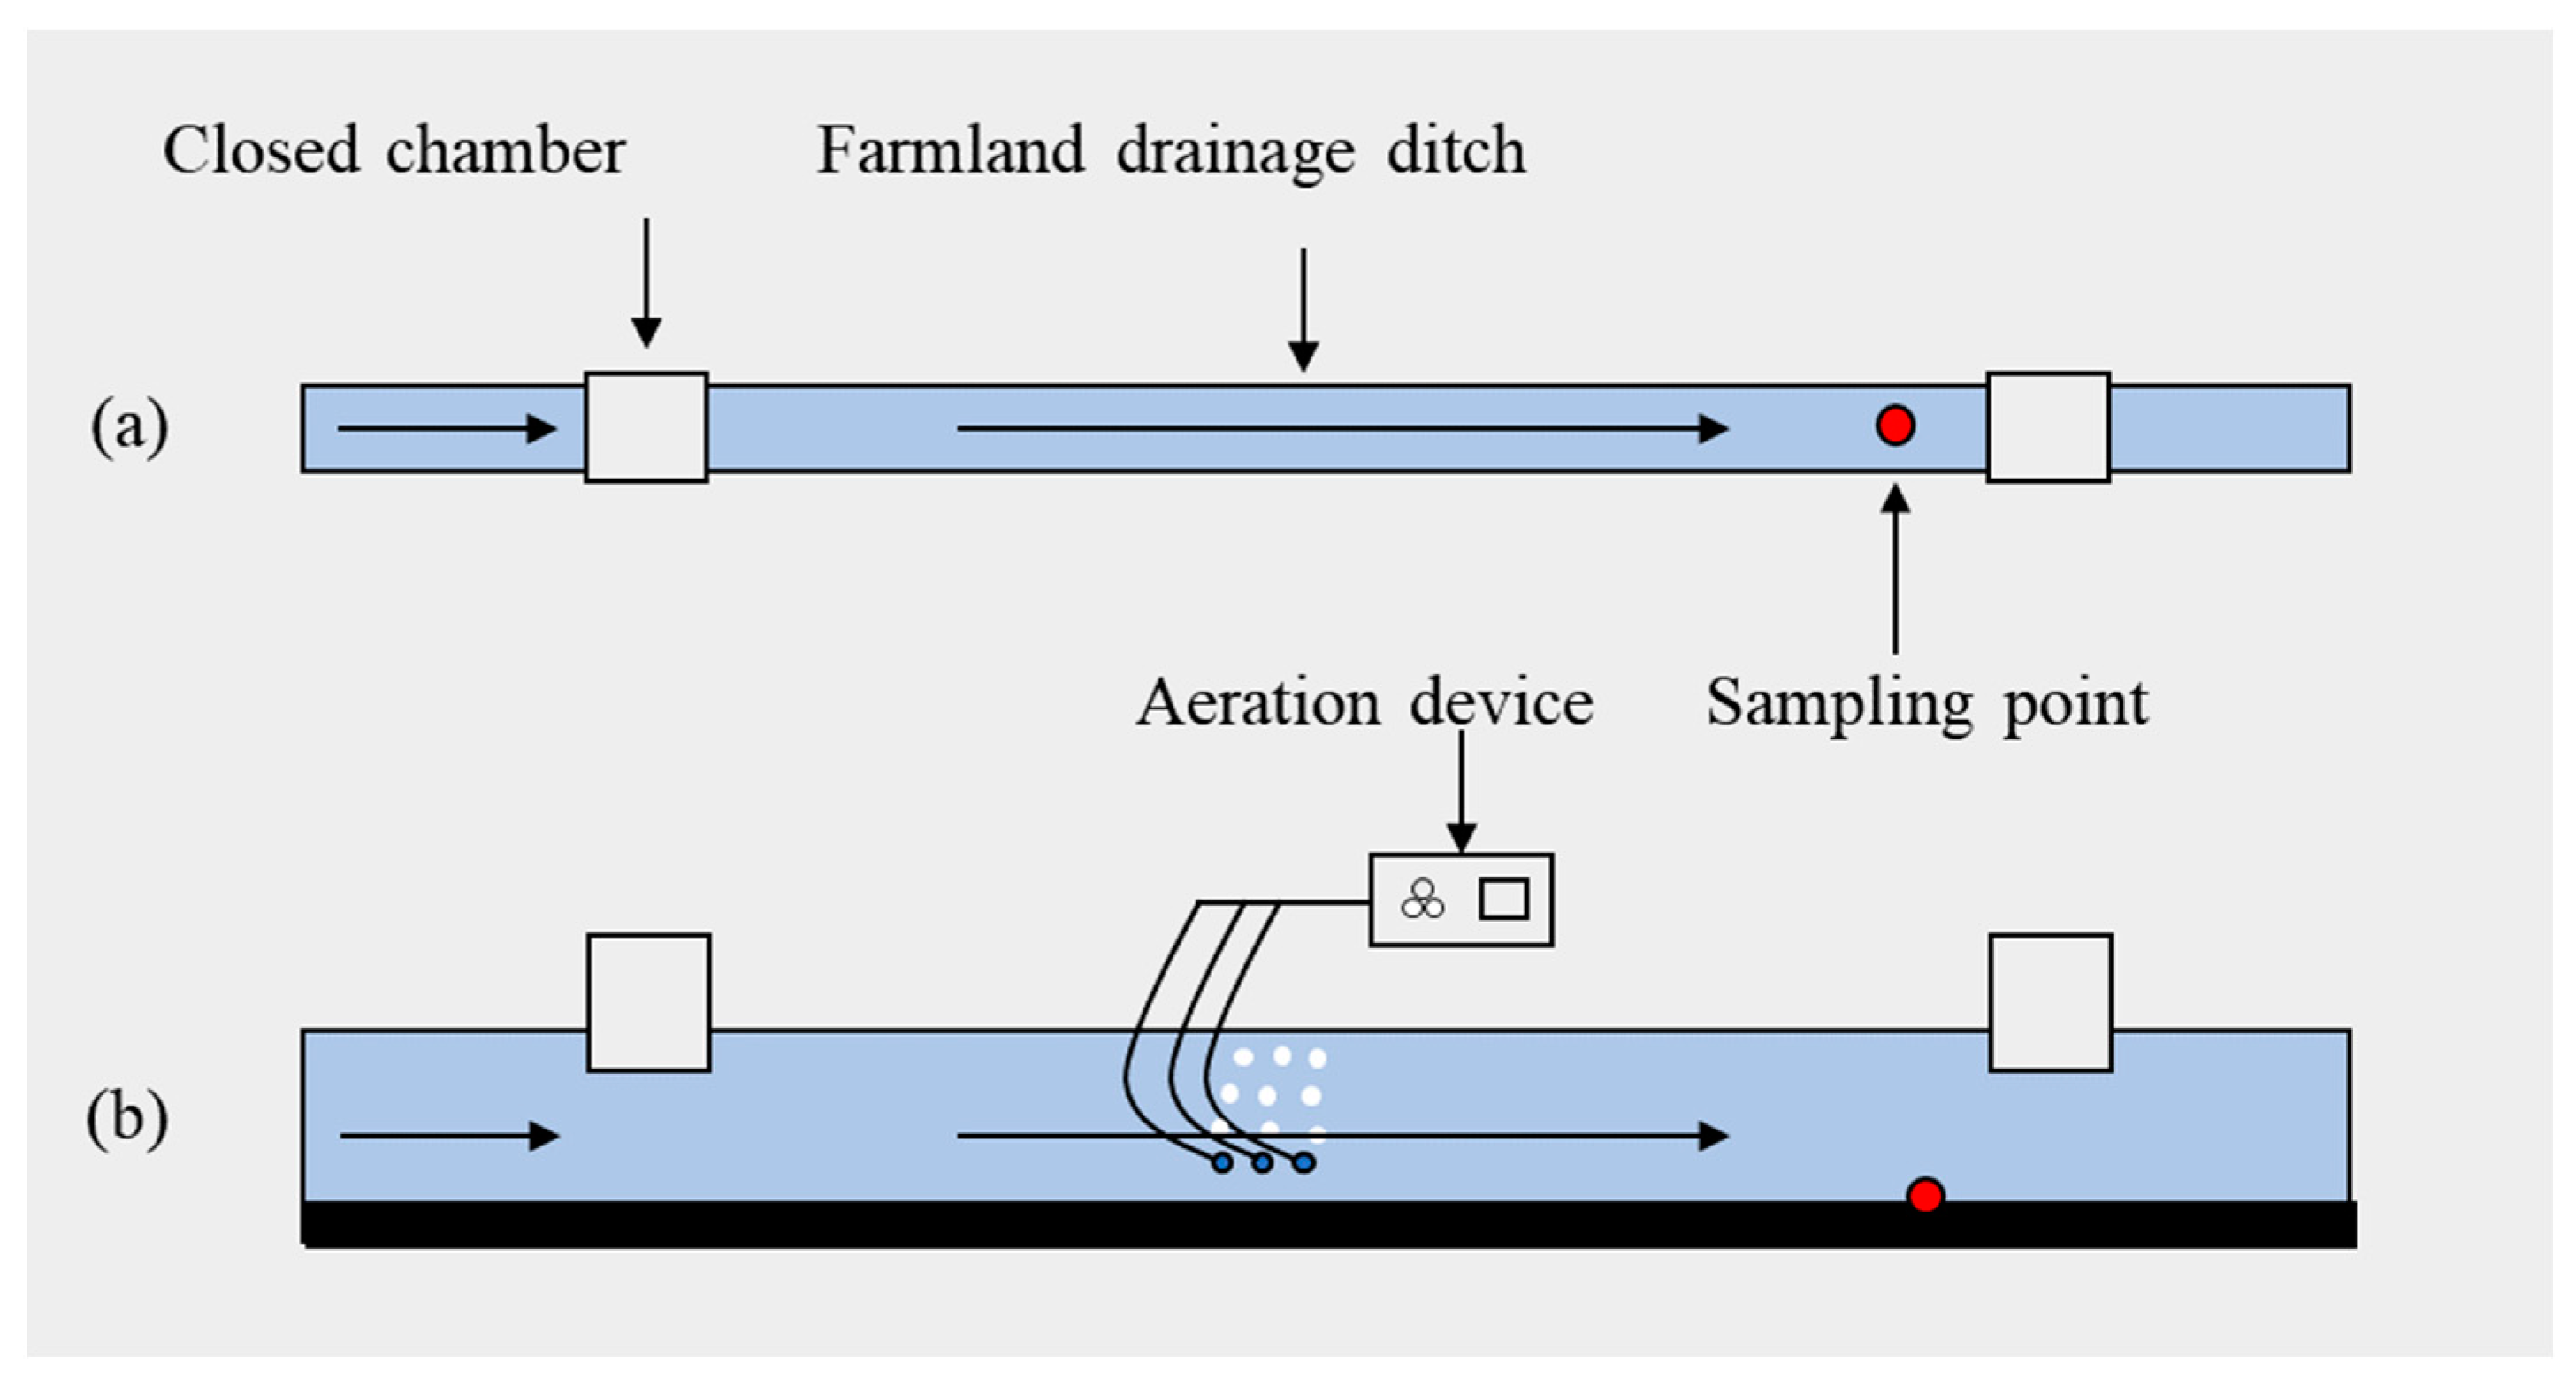
2.1. Materials and Devices

A cylindrical floating static camera obscura (diameter 20 cm, height 20 cm) was used to collect the gas discharged in the drainage ditch. A GC2010 plus gas chromatograph (Shimadzu, Tokyo, Japan) was used to analyze the concentration of the relevant gases in the collected gas samples. A HYDROLAB HL7 multiparameter water quality analyzer (Hash, Colorado, USA) was used to determine the water body’s related parameters. A UV2600 spectrophotometer (Shimadzu, Tokyo, Japan) was used to determine the nitrogen content in water and the sediment. We also used a BT100-2J peristaltic pump (Lange, Hebei Province, China) and solar aeration pump (Zhishang, Beijing, China). Two nitrogen sources were utilized: ammonium chloride (24% nitrogen) and urea (46% nitrogen). The maximum aeration capacity of the solar aeration pump was 9 L/min.

2.2. Experimental and Analytical Methods

The experimental site is located in the Irrigation Experimental Station of Wuhan University, Qujialing Management District, Jingshan County, Jingmen City, Hubei Province, China. Experiments were conducted in the drainage ditch in the experimental station from 6 August to 8 August 2022. The specific experimental arrangement and treatment are as follows.
A gutter with a stable flow was selected and the section shape of the gutter was trapezoidal. On that day, the water depth was 25 ± 5 cm and the drain flow was stable at about 208 L/min. Sedge is the main vegetation in the drainage ditch. See Figure 1 for the specific layout, two static boxes were arranged in the middle part of the drainage ditch. The two boxes are respectively the treatment affected by the aeration device (SP) and the treatment not affected by the aeration device(S). The one on the upstream was the S treatment and the one on the downstream was the SP treatment. The static boxes were 5.0 m apart and the aeration device was in the middle of the two boxes. To ensure that the aeration would not affect the upstream static box, the bubble generated by aeration could not enter the downstream static box. The aeration device was composed of a pump, bubble stone, PVC perforated pipe, solar panels, batteries and switch. The aeration method consisted of continuous aeration from 22:00 on 6 August to 3:00 on 8 August. The aeration volume was controlled by different amounts of PVC perforated pipes. The aeration volume selected in this experiment was 9 L/min and the ratio of the aeration volume to the drainage flow rate was about 1:23. Before aeration, the DO content in water was 0.77 mg/L and aeration increased the DO content in the water by 1.49 mg/L, on average.
The CO2, CH4 and N2O emissions of the drainage ditch were measured by gas chromatography with a closed box. Each static box was used at 6:00, 8:00, 10:00, 12:00, 14:00, 16:00, 18:00 and 21:00 of the same day and at 0:00 and 3:00 of the next day. Gas samples were collected 10 times for each treatment and three duplicate samples were taken each time. One bag of gas was extracted at 0, 15, 30 and 45 min after sealing the static chamber for each gas recovery. CO2, CH4 and N2O emission fluxes were calculated using the following formula:
F = ρ V A P P 0 T 0 T d C t dt
In the formula, F is the measured gas emission flux (mg/m2·h); V is the volume of air in the static box (m3). A is the box coverage area (m2); dCt/dt is the slope of the trend line of the gas concentration in the box with time during the observation time. ρ is the density of the measured gas in the standard state (kg/m3); T0 is the absolute air temperature under standard conditions (K). P0 is the air pressure under standard conditions (kPa). P is the air pressure at the sampling site (kPa) and T is the absolute temperature (K) at the time of sampling.
In addition, the comprehensive global warming potential (GWP) is often used to evaluate the CO2 equivalent of various greenhouse gases corresponding to the same effect on the 100-year time scale. The global warming potential of CH4 and N2O per unit mass was 25 and 298 times that of CO2, respectively [29]. The GWP of each treatment was calculated according to the following formula:
GWP (CO2/mg·m−2) = F (CO2) +25 × F (CH4) + 298 × F (N2O)
When collecting gas, we collected water samples directly below the static box at the same time and used a soil drill to collect the bottom mud around the static box at 8:00, 16:00 and 24:00 on the same day. The total organic carbon content of the sediment was determined by the potassium dichromate oxidation method (HJ615-2011). Chloroform fumigation extraction [30] was used to determine the microbial biomass carbon content of the sediment. Deionized water was added to the bottom sediment and then the filtrate was placed on a carbon and nitrogen analyzer (Jena, Multi N/C 3100) to determine the soluble organic carbon content. The COD content of water was determined by the potassium dichromate method [31] and the nitrate and ammonium nitrogen contents in the water and sediment were determined by a spectrophotometer. The temperature, PH, ORP and DO of water were directly determined by the HYDROLAB HL7 multi-parameter water quality analyzer.
The following formula was used to calculate the variance of the data:
S2 = (1/n)[(x1 − m)2 + (x2 − m)2 + … + (xn − m)2]
where n is the number of samples, xn is the value of each sample and m is the average of n sample values.
All data were collated by Microsoft Excel 2021 and the average value and standard deviation were calculated. SPSS data analysis software was used for data correlation analysis, drawn with Origin.

3. Results

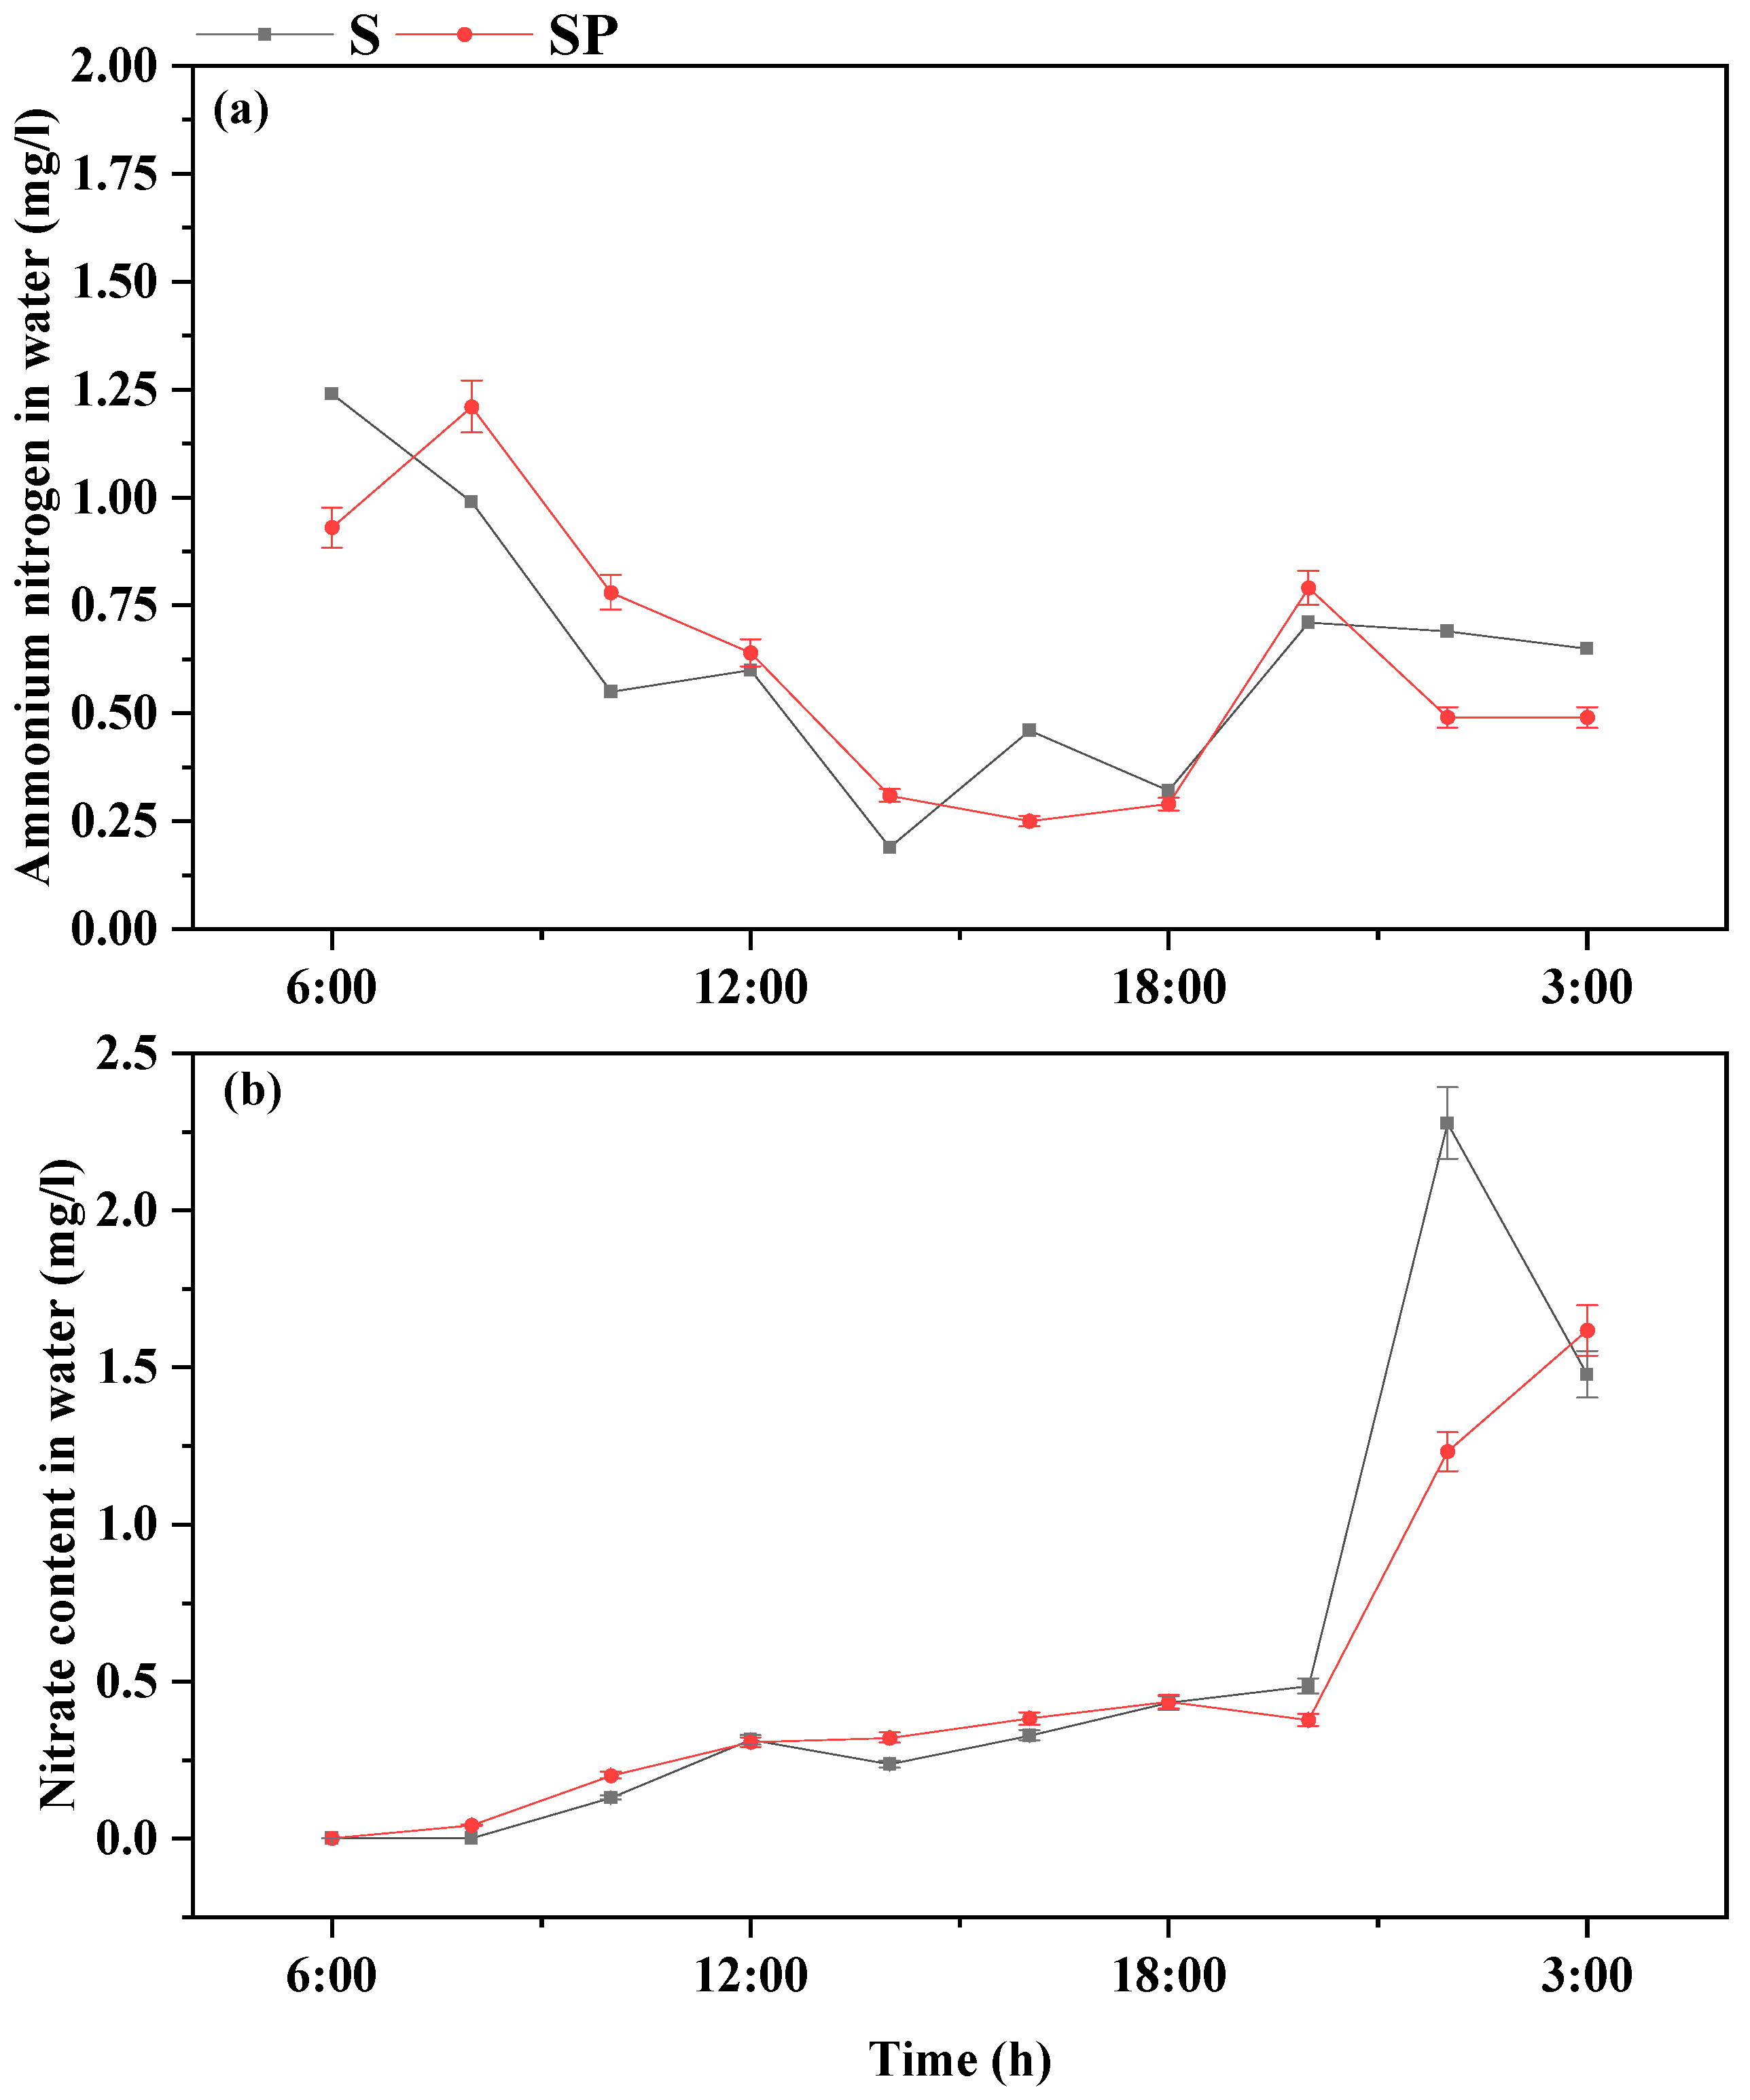
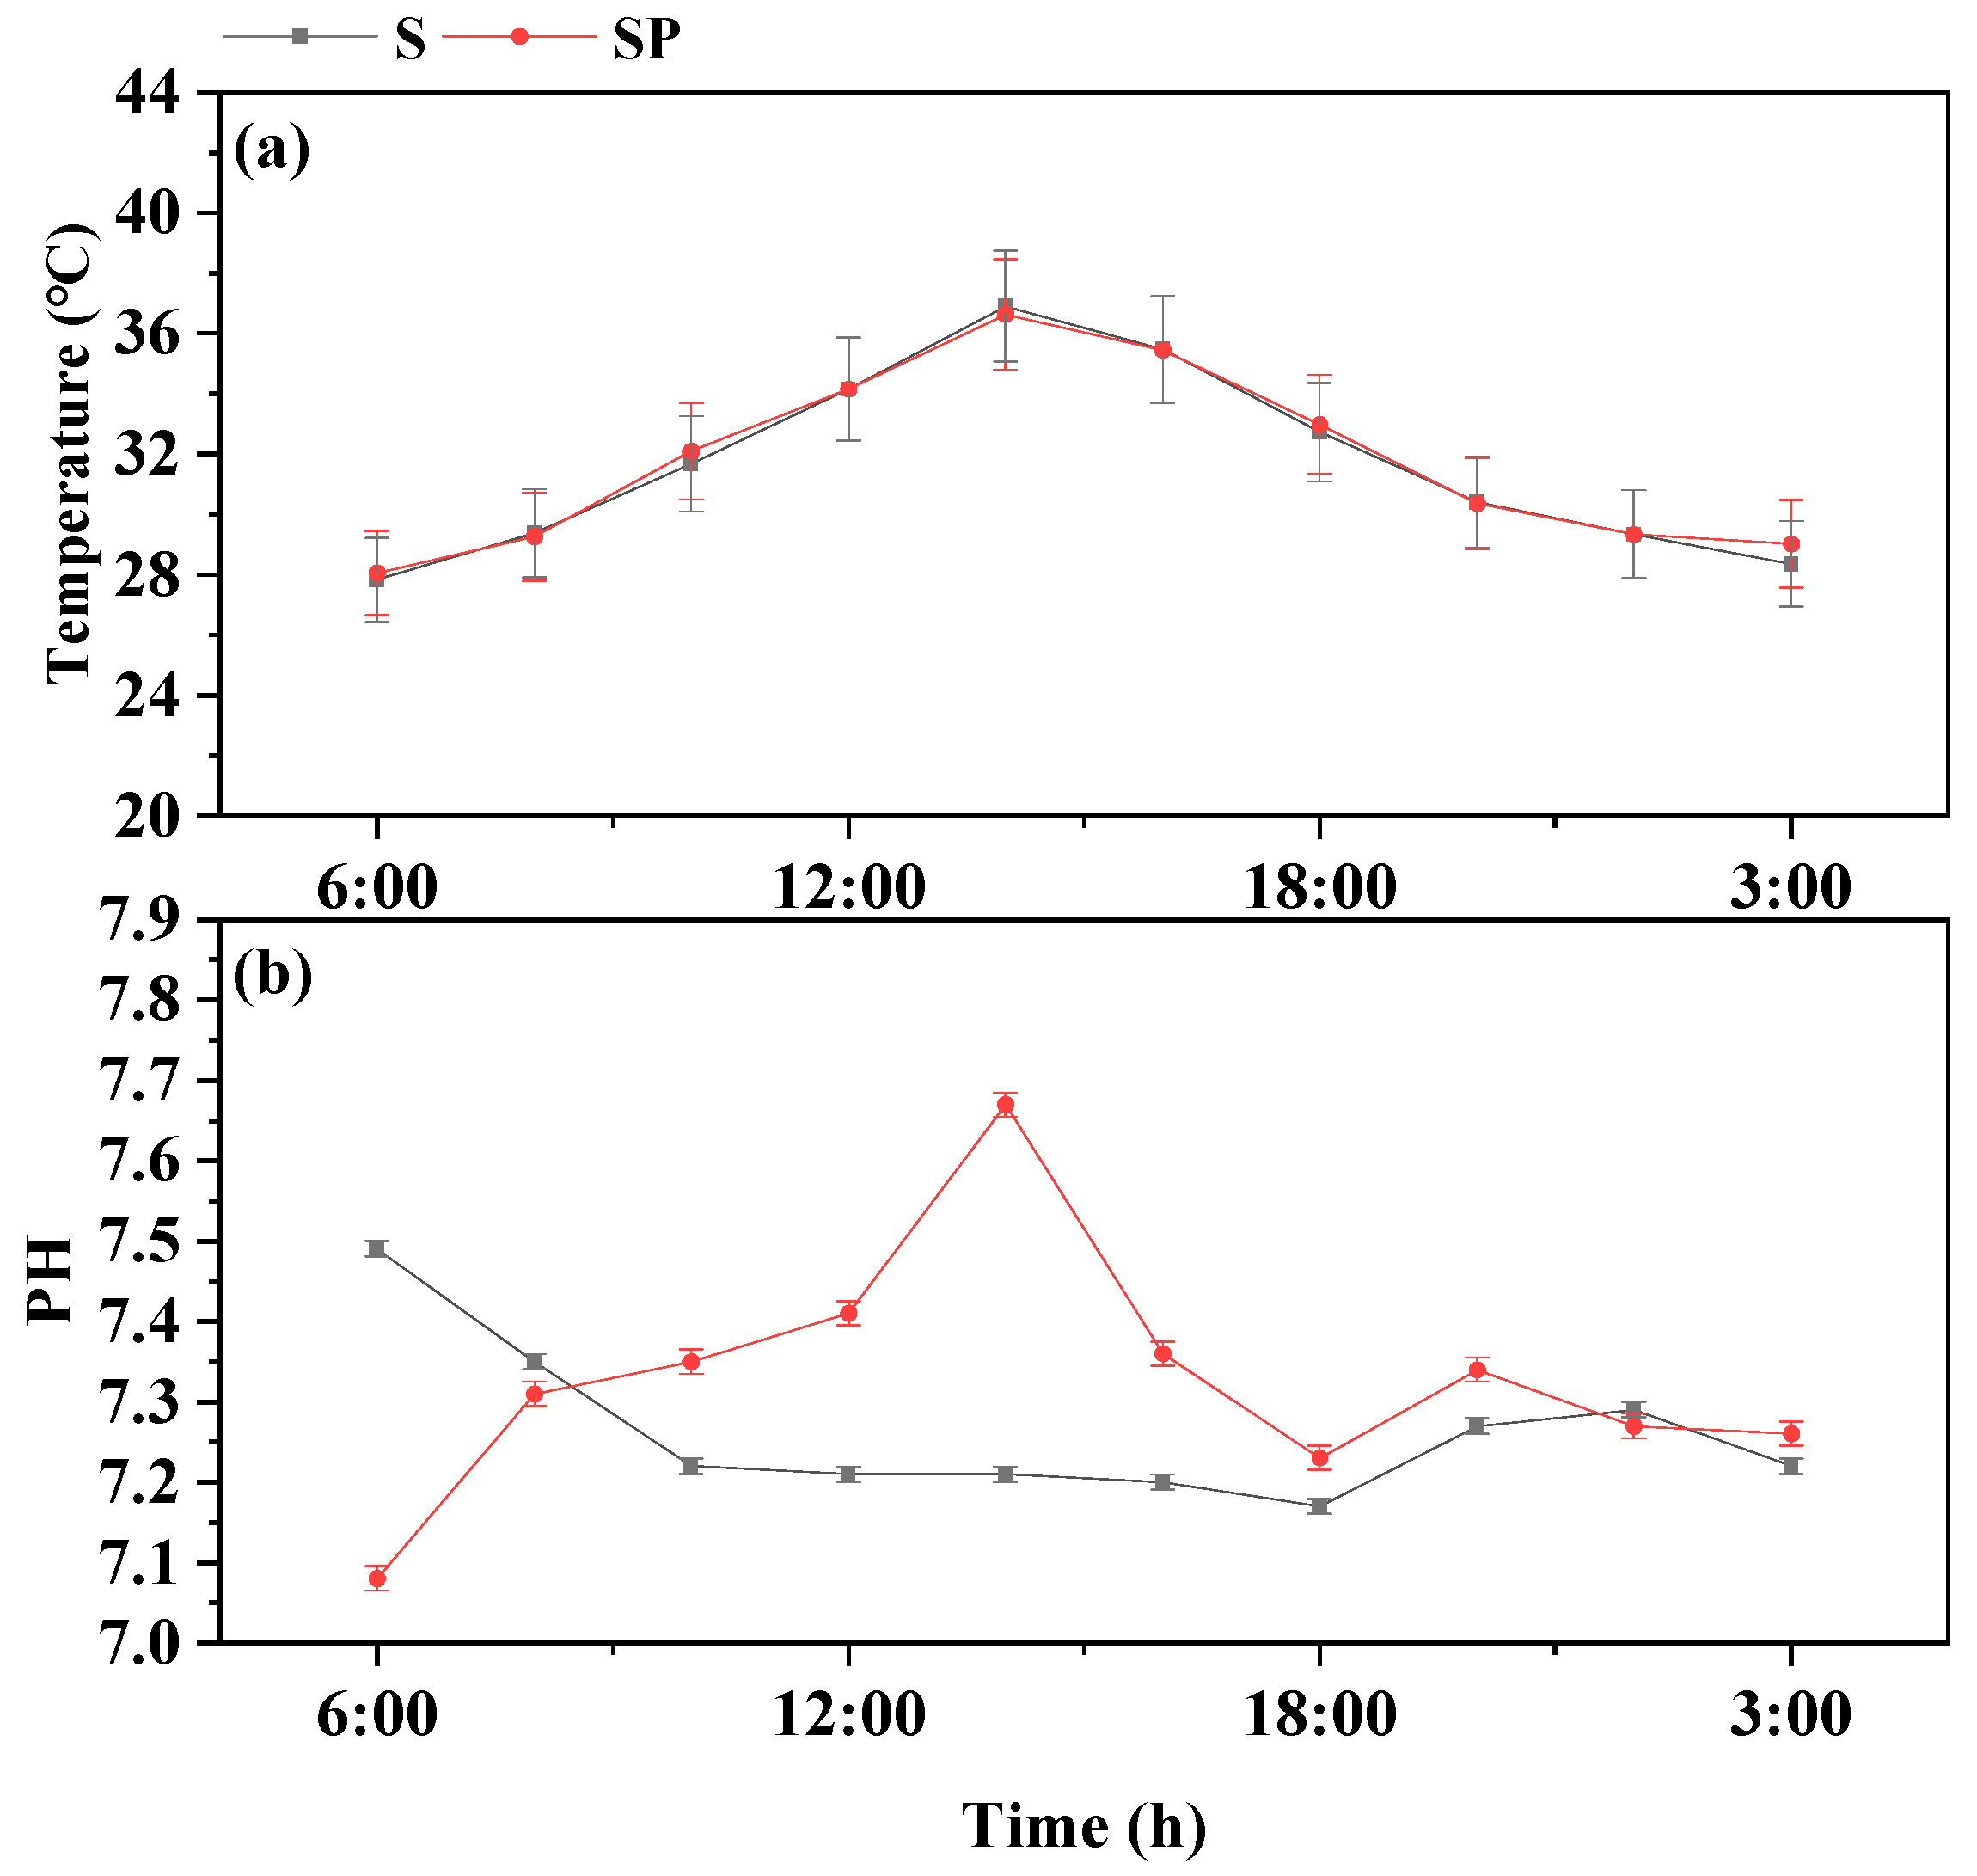
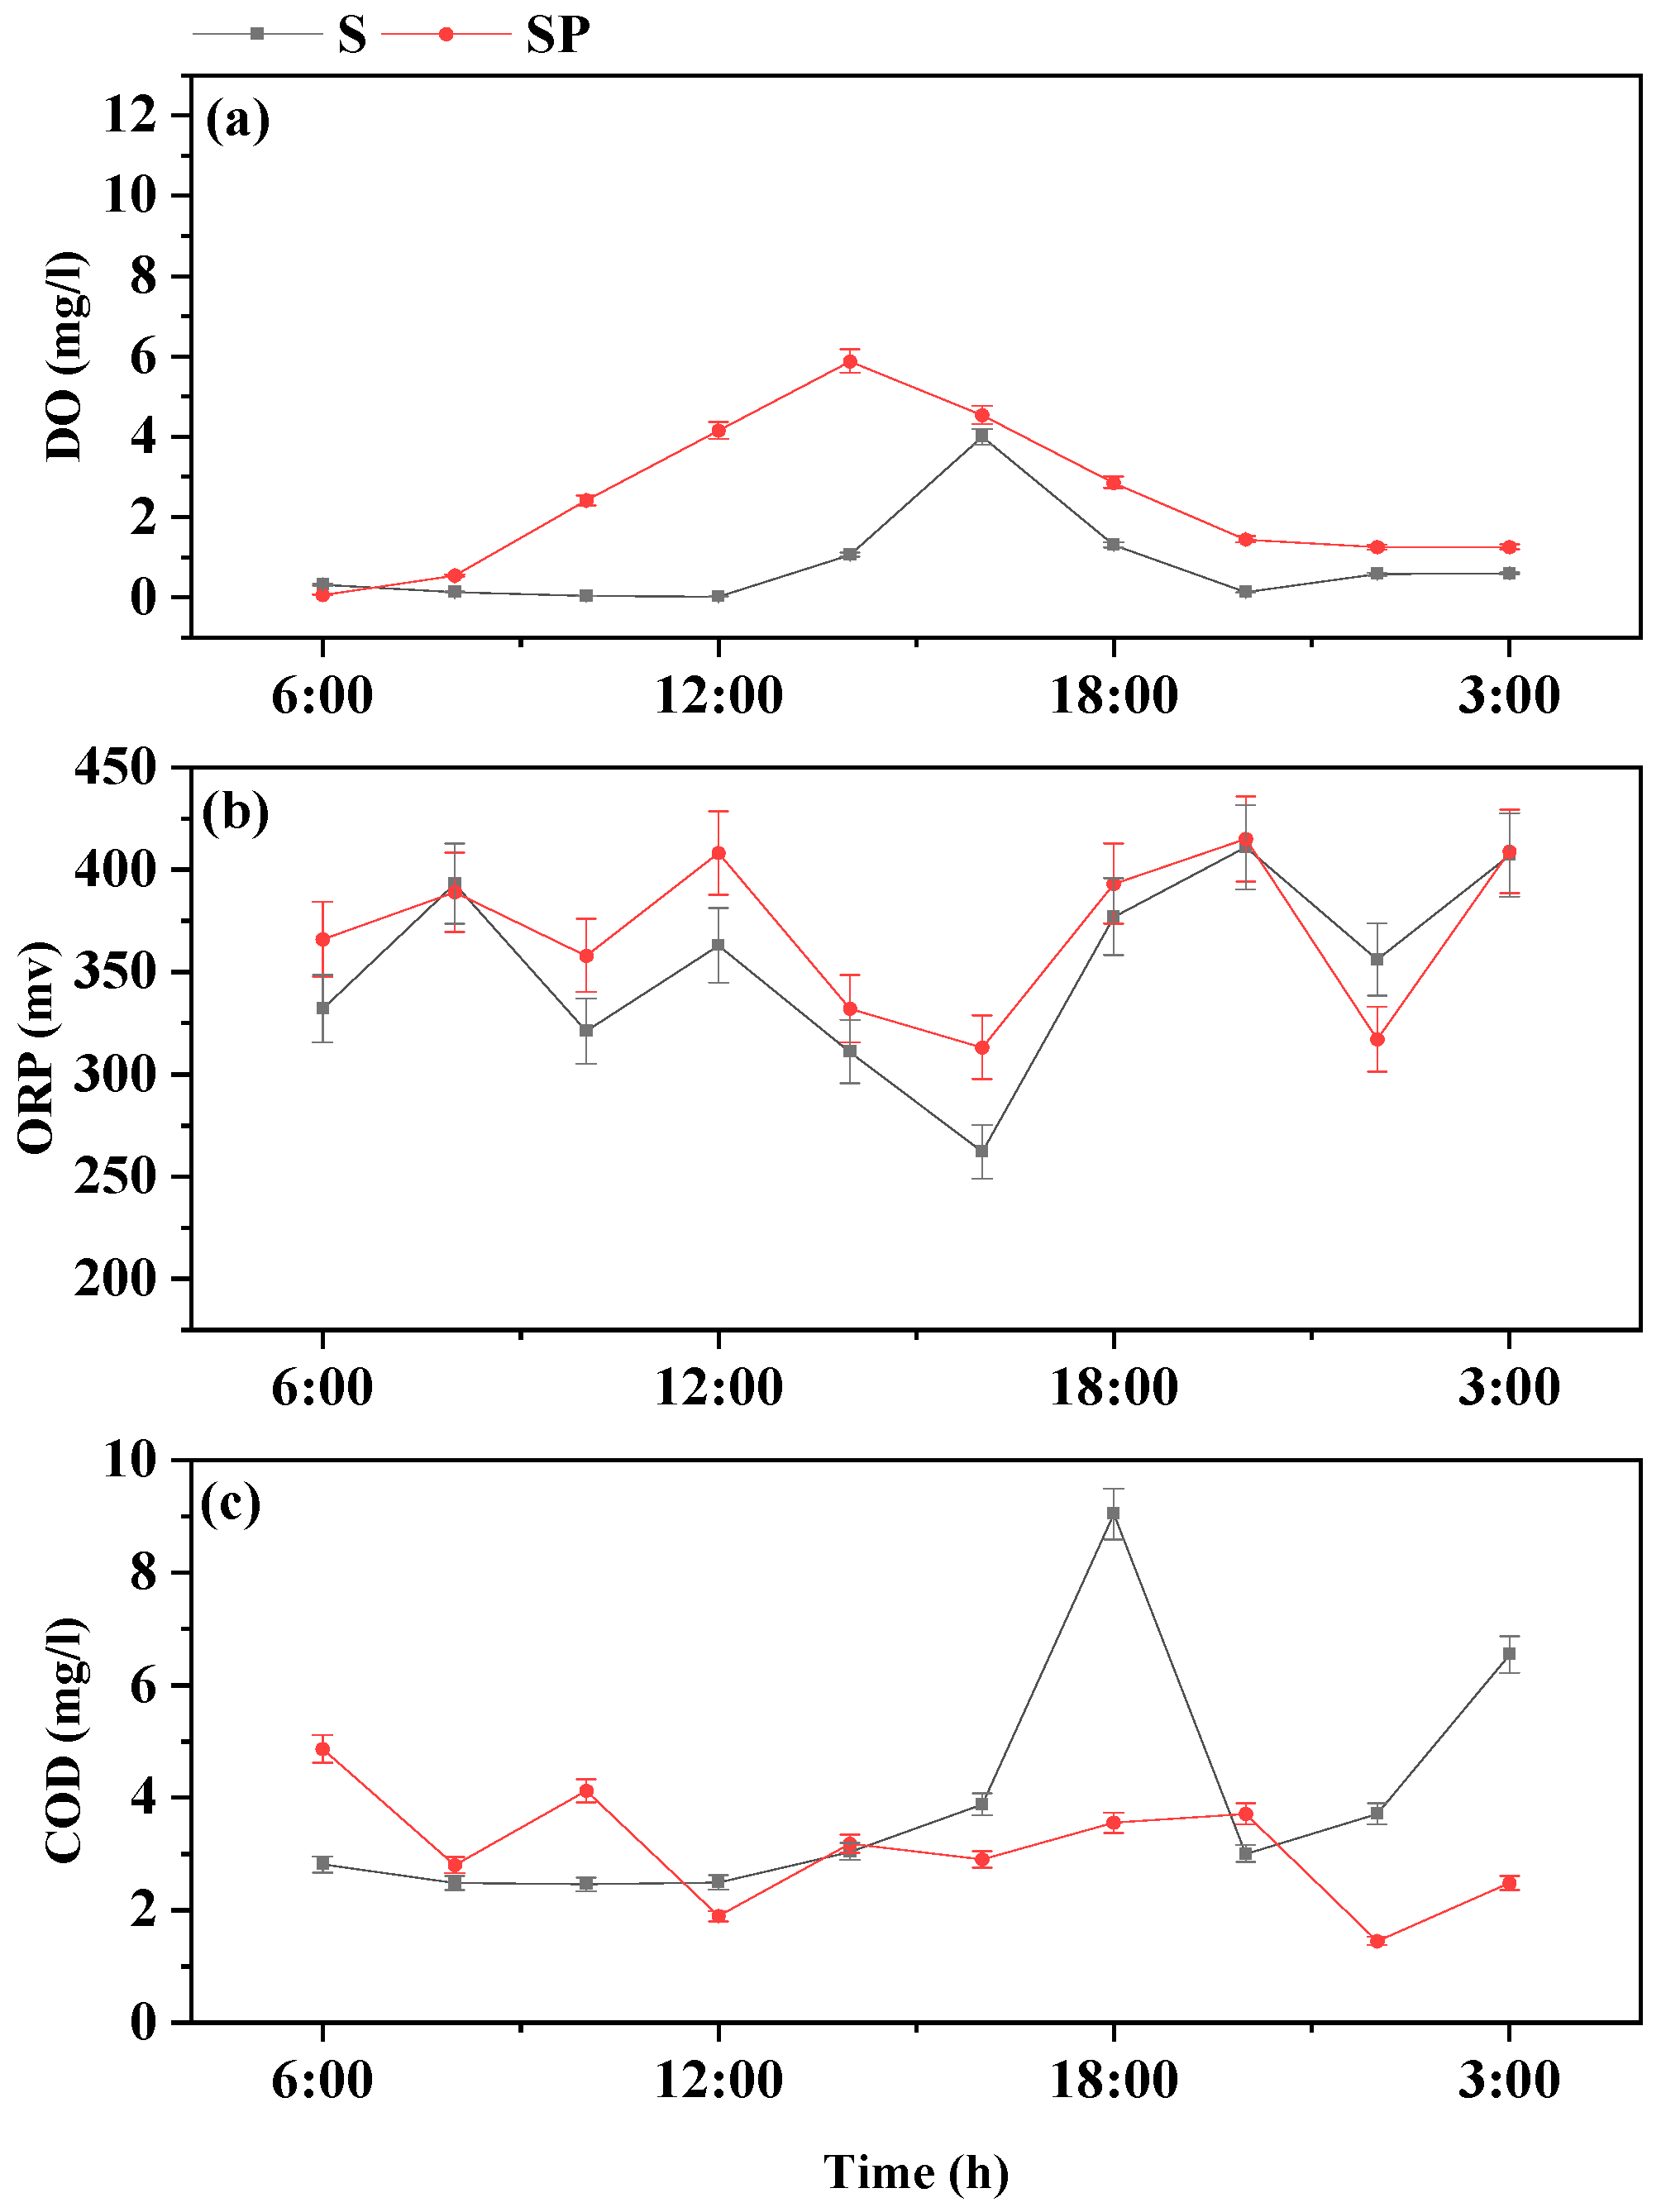
3.1. Diurnal Variation of Nitrate/Ammonia Nitrogen and Related Indexes in the Studied Agricultural Drainage Ditch

As shown in Figure 2a, the ammonium concentrations of the S and SP treatments showed little difference, at 0.65 and 0.61 mg/L, respectively, and the concentrations were lower when the temperature was high at noon and in the afternoon. This is because the temperature in the afternoon is high and the dissolved oxygen content in the water is also high, which is conducive to the oxidation of ammonium nitrogen. Therefore, the ammonium nitrogen content in the water is the lowest at this time [32]. The nitrate content of the S and SP treatments was 0.66 and 0.55 mg/L, respectively. In general, aeration reduces the content of nitrate nitrogen in the water and this reduction effect is particularly significant at night.
Figure 3 shows that the PH fluctuates between 7.0 and 7.7 within a day. It is not difficult to see that the water in the drainage ditch is generally weakly alkaline and the variation range of PH in the drainage ditch is small. The average PH of the S and SP treatments within 24 h is 7.27 and 7.32, respectively. It can be seen that aeration slightly increased the PH value of the water in the drainage ditch and the SP treatment reached a maximum of 7.67 at 12:00, showing a unimodal change trend. In addition, the water temperatures of the S and SP treatments are almost the same, at 31.29 °C and 31.41 °C, respectively, which can completely exclude the influence of temperature on the experimental results.
As shown by the analysis in Figure 4, the S and SP treatments of the agricultural drainage of the dissolved oxygen concentration were in the afternoon, and then the 16:00 peak occurred. This point in time and the processing temperature peak are consistent. The S and SP treatments showed a DO content with a bigger difference, although the temperature was consistent. The dissolved oxygen concentration in the water body was strongly influenced by the water temperature and aeration. The ORP of the SP treatment was slightly higher than that of the S treatment, with daily average values of 371.69 and 358.10 mv, respectively. However, the variation trend of ORP was not significantly related to temperature and DO. The daily average COD of the S and SP treatments is 4.09 and 3.07 mg/L, respectively. The COD of the SP treatment is lower than that of the S treatment.

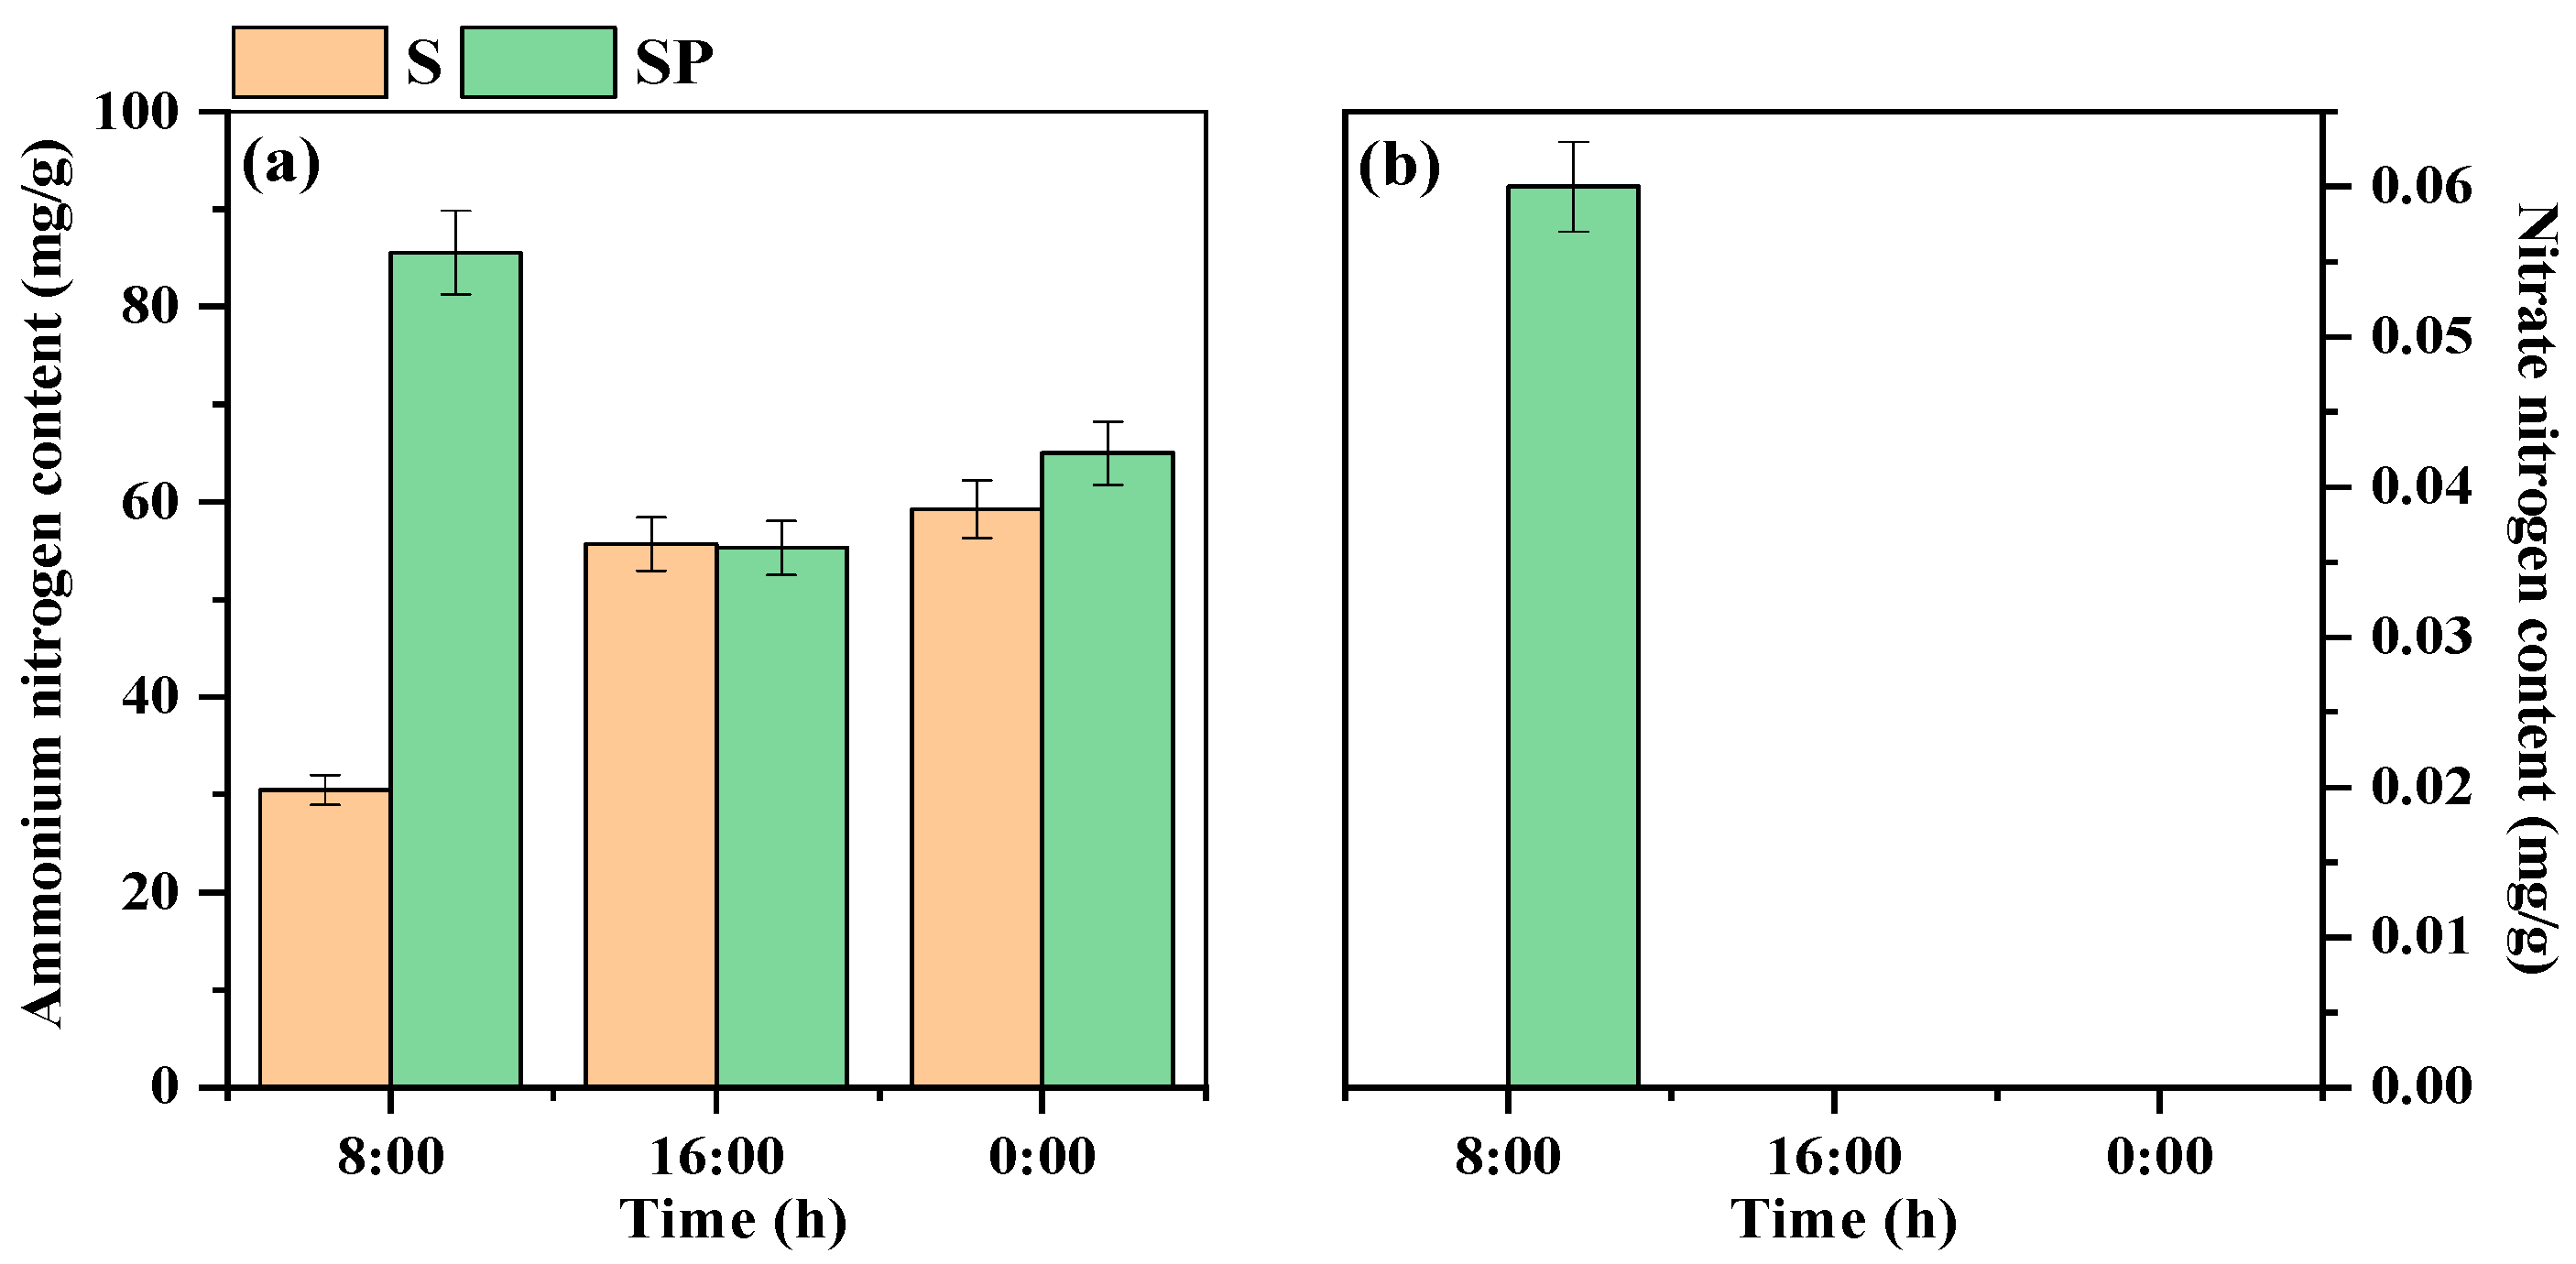
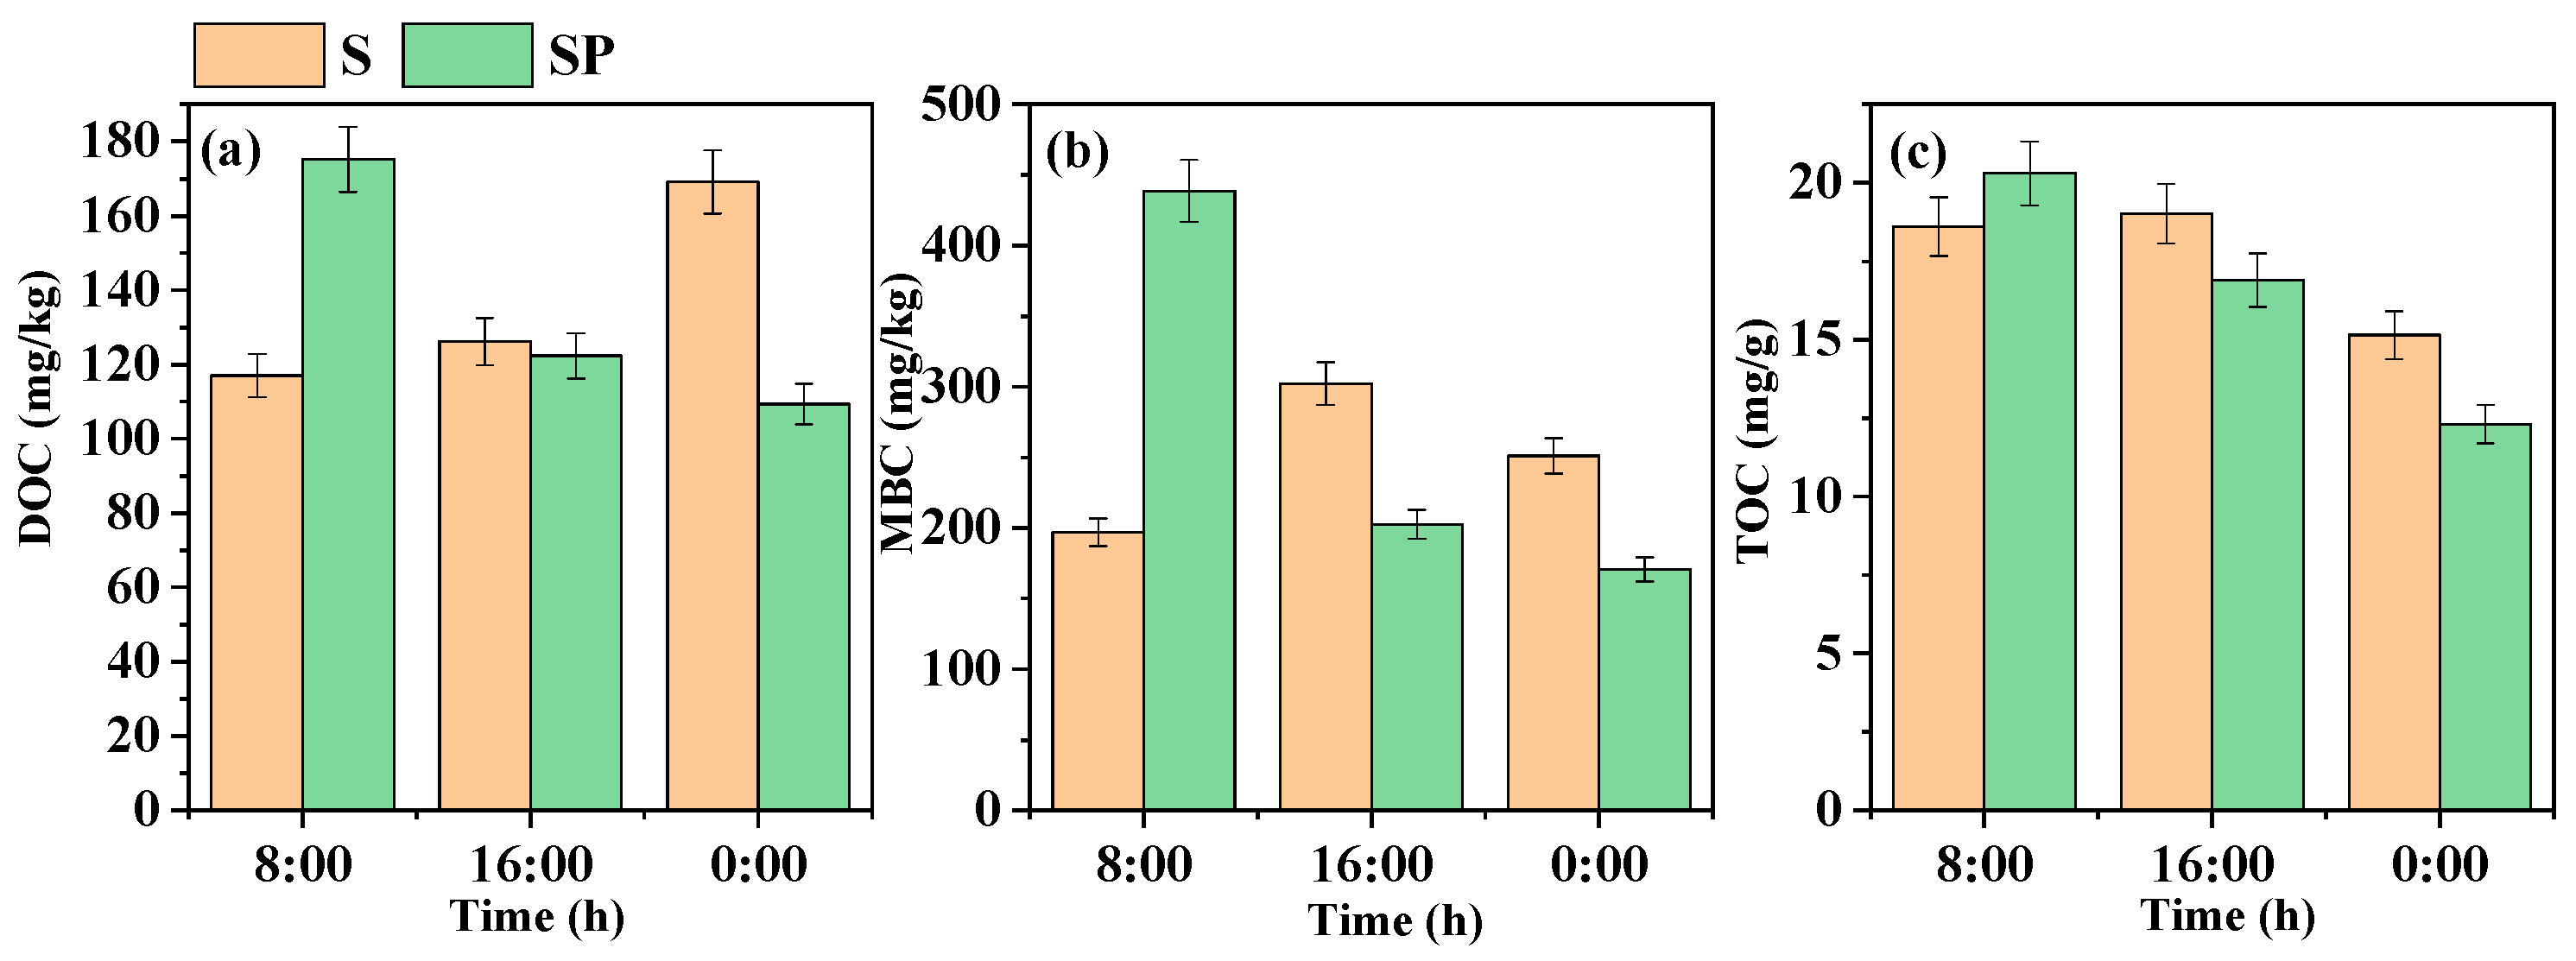
3.2. Diurnal Variation of Physical and Chemical Properties of the Agricultural Drainage Ditch Sediment

According to Figure 5, the nitrate content of the soil treated with S and SP was almost 0, while the ammonium content of soil treated with SP was relatively large. At the beginning, the ammonium content of soil treated with SP was higher than that of soil treated with S, but the ammonium content of the soil treated with SP was not significantly different from that of soil treated with S, which was close to 60 mg/g.
According to Figure 6, the total organic carbon content of the soil treated with S and SP had little relative change and both showed a downward trend within 24 h. Compared with the S treatment, the SP treatment initially increased the microbial carbon content in the soil, but this difference gradually decreased as time went by and the microbial carbon content in the soil under the S and SP treatments remained at about 200 mg/kg at 0:00. The soil DOC in the S treatment increased from 117.05 mg/kg at 8:00 to 169.08 mg/kg at 0:00. Under the SP treatment, the soil DOC decreased from 175.22 mg/kg at 8:00 to 109.398 mg/kg at 0:00.

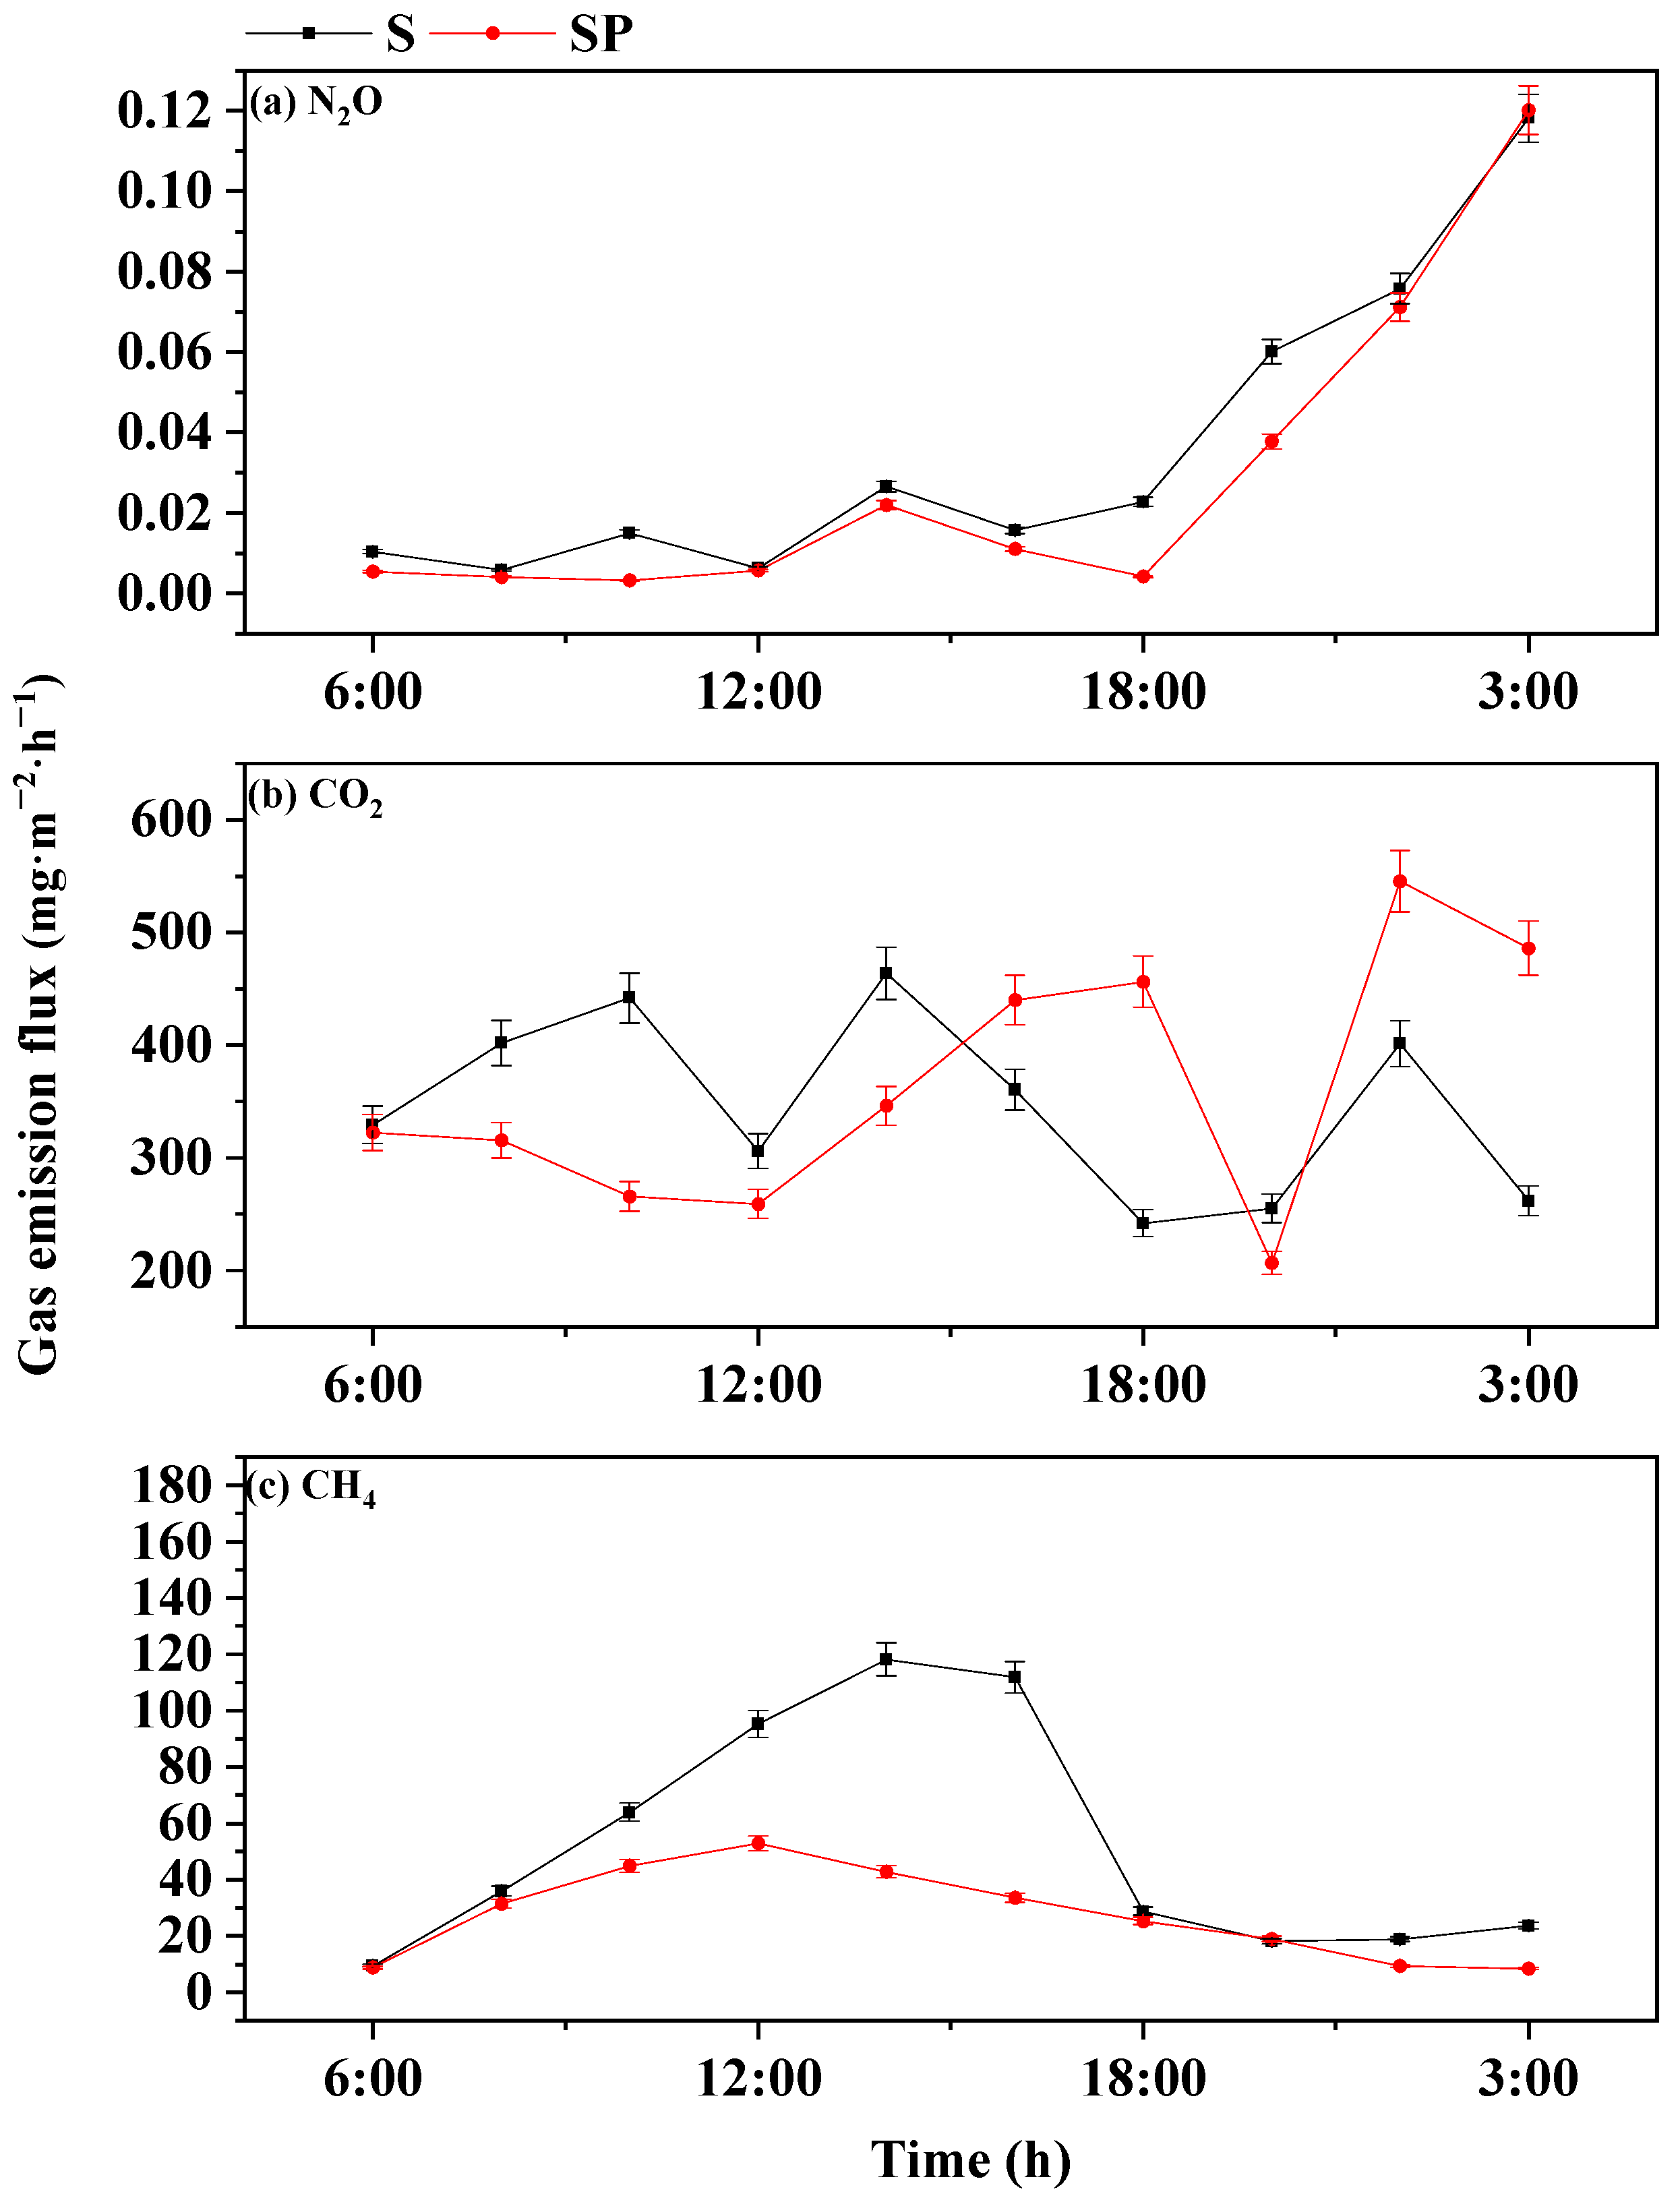
3.3. Diurnal Variation of Greenhouse Gas Emission Fluxes from the Agricultural Drains

Figure 7a shows that the N2O emission fluxes under the S and SP treatments are both at a low level. The N2O emission fluxes under the S treatment vary between 0.01 and 0.12 mg/m2·h and the N2O emission fluxes under the SP treatment vary between 0 and 0.12 mg/m2·h. Both the S treatment and SP treatment are at 3:00 when the discharge flux reaches its peak.
Figure 7b shows that the CO2 emission flux of the S treatment varies between 242.04 and 463.85 mg/m2·h. The CO2 emission flux of the SP treatment varied from 206.63 to 545.57 mg/m2·h. The S treatment peaked at 14:00 and the SP treatment peaked at 0:00.
In Figure 7c, the trend line of the CH4 emission flux of each treatment showed a unimodal pattern and the CH4 emission flux of the S treatment varied from 9.40 to 118.09 mg/m2·h. The emission flux of CH4 under the SP treatment varied from 8.41 to 52.81 mg/m2·h. The S treatment peaked at 14:00 and the SP treatment peaked at 12:00.
The total emission fluxes of the three greenhouse gases under the S and SP treatments within 24 h were calculated. Table 1 shows that, compared with the S treatment, the emission fluxes of the other greenhouse gases in the SP treatment all decreased, except for the CO2 emission flux, which increased by a small amount (9.66%). The decrease ratio of N2O was 23.19% and that of CH4 was 46.28%. In general, CH4 caused the highest greenhouse effect among the three greenhouse gases and most of the change in the GWP was also caused by CH4. Compared with the S treatment, the GWP of the SP treatment decreased by 33.66% and the specific results are shown in Table 1.

4. Discussion

4.1. Effect of Aeration on the Pollution Load of the Agricultural Drainage Ditch

Aeration increases the PH value of the water in the drain and reaches the maximum of 7.67 at 12:00, showing a unimodal change trend. This is because the process of aeration increases the dissolved oxygen in the water and fully oxidizes acidic reducing substances such as hydrogen sulfide [33]. In addition, aeration causes the air bubbles in the water to fully make contact with the water. The dissolved CO2 leaves the water body and enters the air, which decreases the carbonate concentration in the water body and increases the pH [34]. The ORP of the SP treatment is higher than that of the S treatment, but its diurnal variation is not obvious. This is because ORP is affected by many factors, including, but not limited to, DO, PH and temperature [35]. Aeration can also reduce water COD and purify water quality. This is because aeration promotes the growth and activity of aerobic microorganisms, thus accelerating the degradation rate of organic matter [36]. In the water treatment of SP, the nitrate nitrogen concentrations were slightly smaller than in the S processing. The change trend of the N2O emission flux is consistent. Visible aeration causes a slight drop in the nitrate nitrogen concentrations in water. The ammonium concentration in SP treatment water did not change significantly compared with S treatment, which indicates that the effect of aeration on the content of ammonium nitrogen in water is not obvious in this experiment.

4.2. Effect of Aeration on the Physical and Chemical Properties of the Drainage Ditch Sediment

The soil-soluble organic carbon in the SP treatment generally showed a downward trend, while that in the S treatment showed an increasing trend, because aeration could remove part of the soluble organic matter [37]. The soil microbial biomass carbon of the SP treatment generally showed a downward trend with a large decline, while that of the S treatment generally showed a small increase, which may be due to the fact that the aeration changed the redox environment in the soil, resulting in a large number of deaths of microorganisms that were suitable for survival under strong reducing conditions in a short period of time [38]. The overall trend of the total organic carbon content in the two treatments was consistent and both showed a downward trend. However, the rate and amplitude of the decline in the SP treatment were greater than those in the S treatment, which may be consistent with the reason of the decline in soluble organic carbon. In addition, the content of nitrate nitrogen in the sediment is almost zero; this is because nitrate nitrogen is mainly found in water bodies and, once it diffuses into the bottom mud, it will be consumed by microbial respiration, leading to denitrification, decomposition and mineralization [39]. Aeration initially increases the content of ammonium nitrogen in the sediment, but the final content of ammonium nitrogen is not different from that of the S treatment.

4.3. Influence of Aeration on the Greenhouse Gas Emission Process of the Agricultural Drainage Ditch

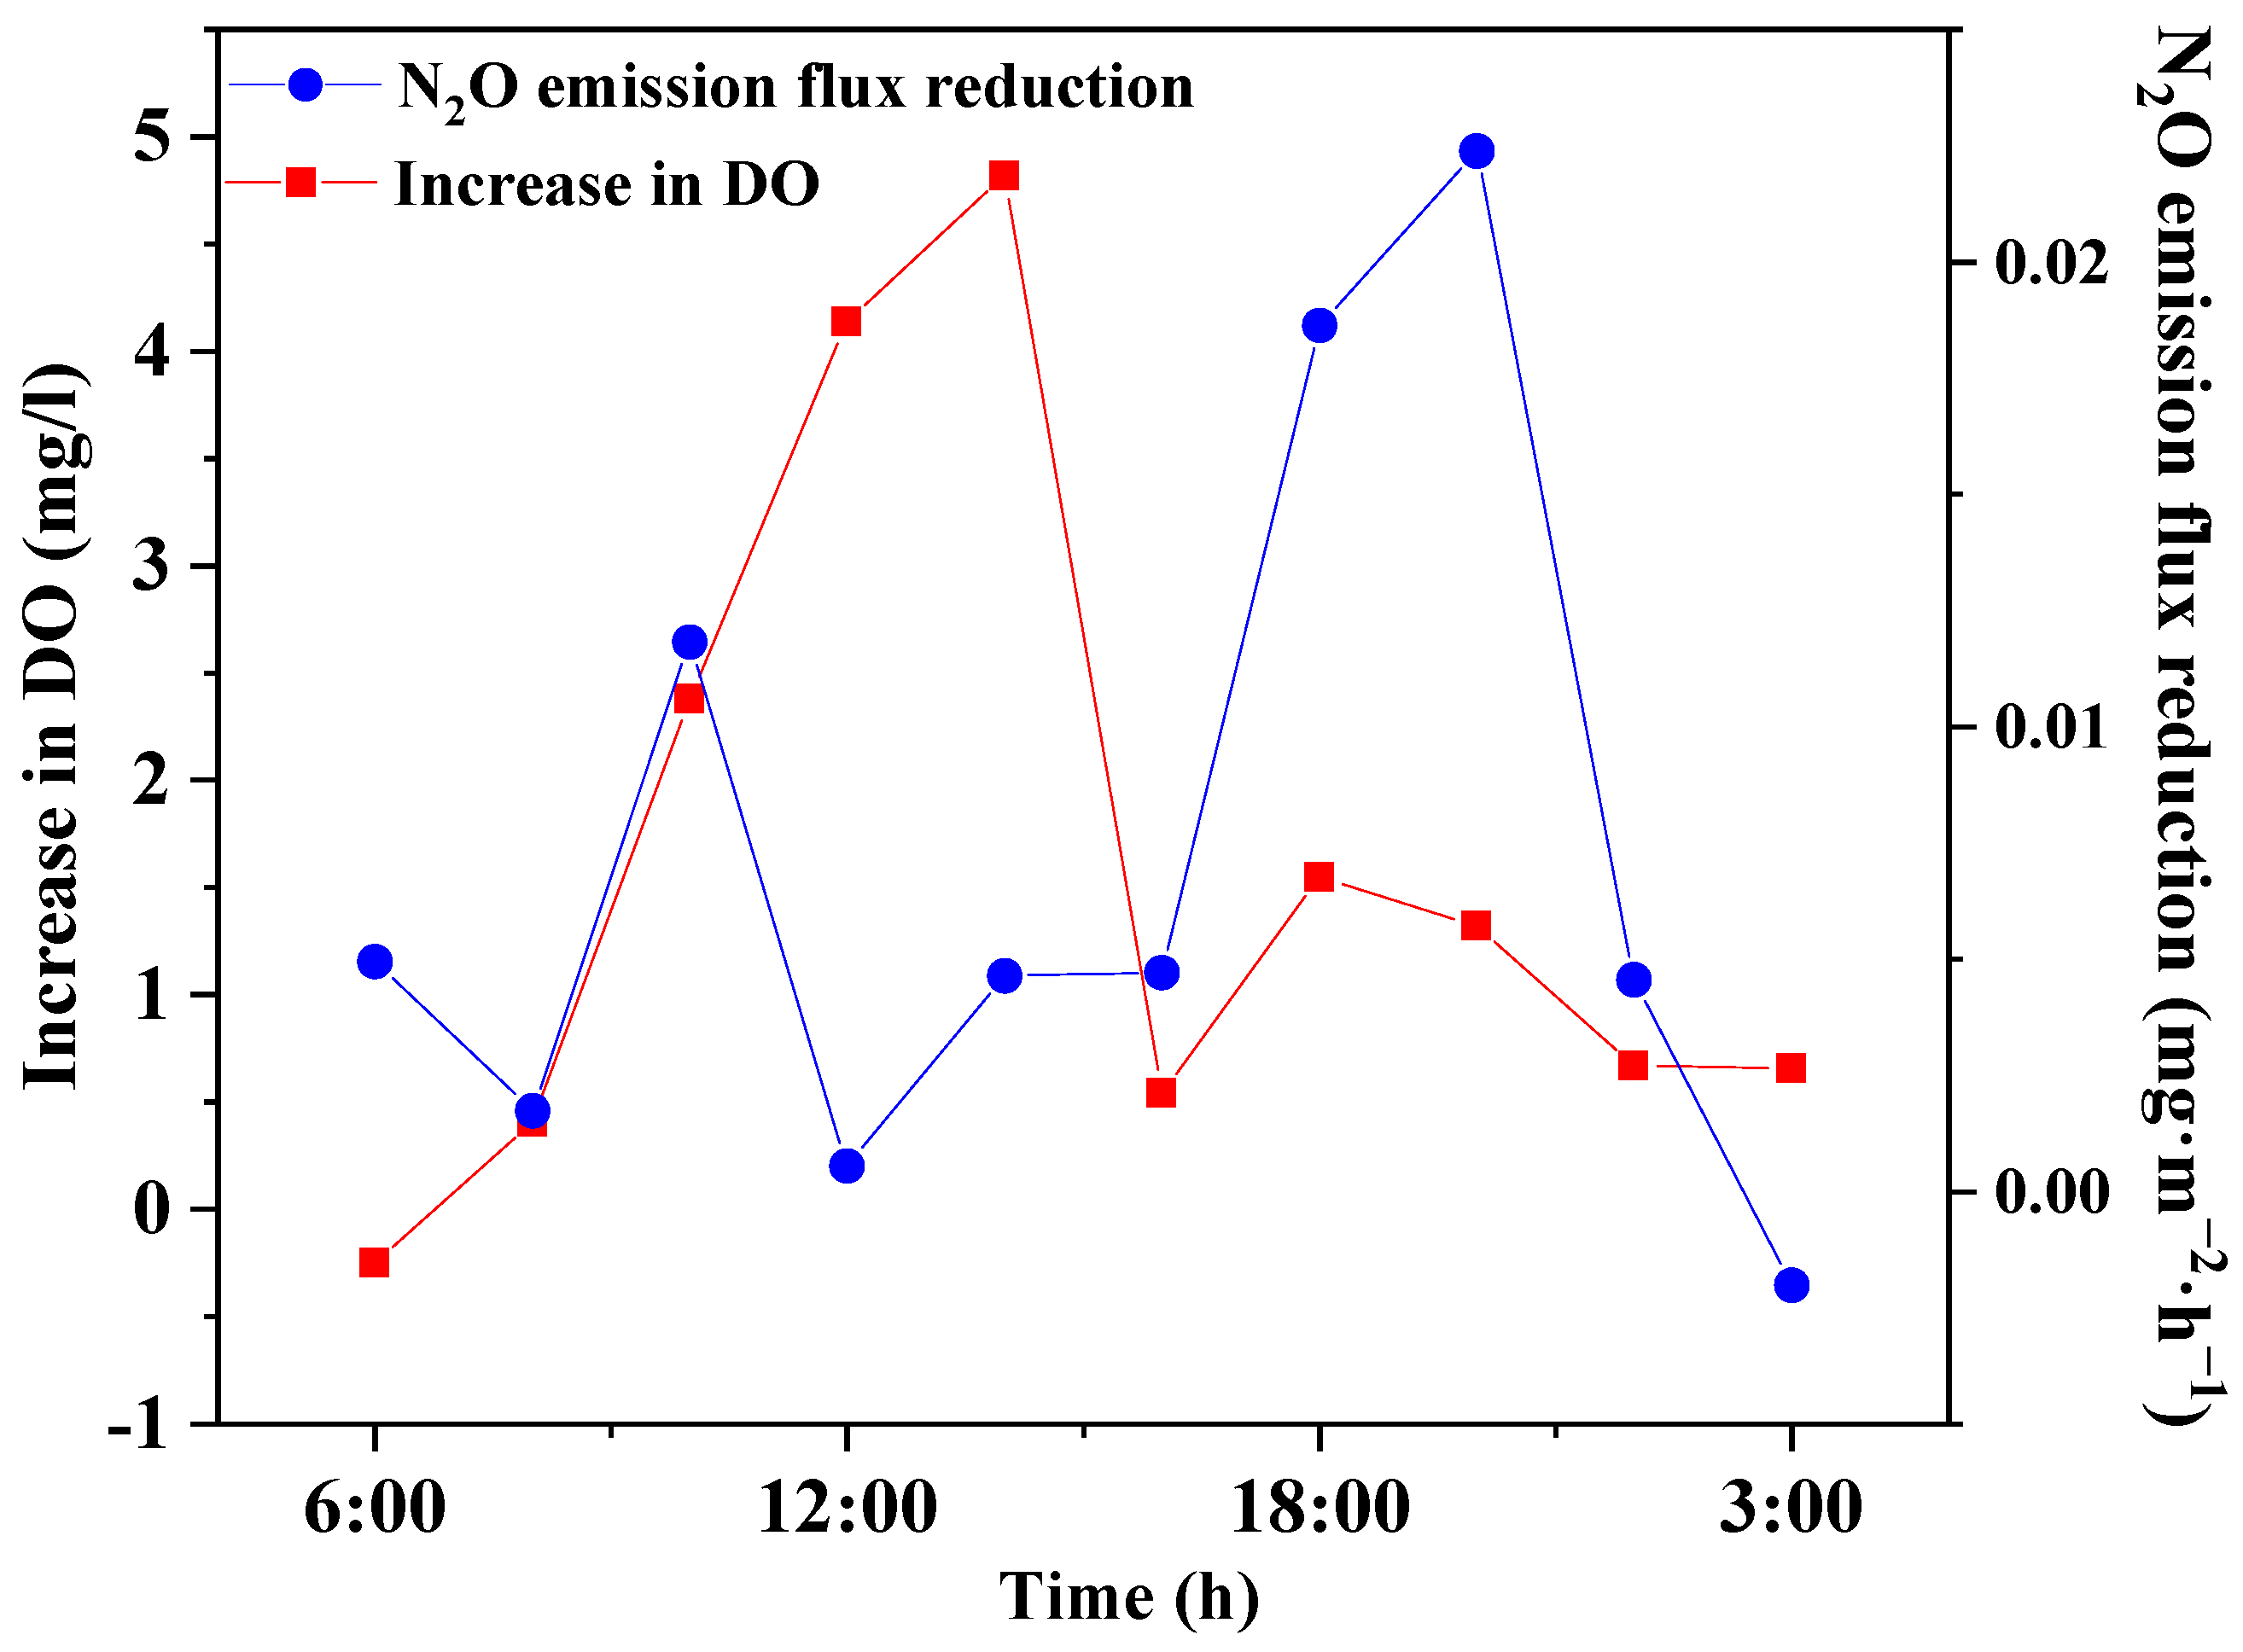
4.3.1. Influence of Aeration on the N2O Emission Process of the Agricultural Drainage Ditch

The N2O emission fluxes of S and SP are at a relatively low level, which is because the continuous flooding environment is conducive to the formation of the final product of denitrification, NO3, but not conducive to the formation of the intermediate product, N2O. The overall diurnal variation trend of the N2O emission fluxes of each treatment is consistent with the variation trend of the nitrate nitrogen content in water. This is because the increase in nitrate nitrogen in water promotes the denitrification activity of the soil and the emissions of N2O [40]. Compared with the S treatment, the SP treatment reduces the emission flux of N2O. Therefore, under a continuous flooding environment, N2O is mainly generated from denitrification in the soil, while aeration weakens the reducing environment in the soil. As a result, denitrification is weakened and N2O emission is reduced. In addition, aeration causes an increase in the water PH. Simek indicated that 6.6–8.3 is the optimal PH range for natural denitrification and within this range, a strong alkalinity is conducive to increasing the proportion of N2 in denitrification products [41]. Some scholars suggested that a decrease in ambient pH promotes N2O release. Although pH does not affect the expression of N2O reductase assist genes, the expression level of the enzyme at an acidic pH is lower than that at a weakly alkaline pH [42]. It has been suggested that a lower pH can inhibit the activity of N2O reductase, thereby increasing the proportion of N2O in denitrification products [43]. Therefore, the weak alkaline environment is conducive to the complete reduction of N2O to N2, which is consistent with the phenomenon that the N2O emission flux decreases after aeration.
Figure 8 shows that the peak occurrence time of the N2O emission flux reduction in aeration treatment lags behind the peak occurrence time of the DO increment by about 6 h. The peak occurrence time of the N2O emission flux reduction in the SP treatment and the nitrate nitrogen content in water under the S treatment are also gradually different. This is because the increase in DO inhibits the denitrification process and thus affects the emission flux of N2O.

4.3.2. Influence of Aeration on the CH4 Discharge Process in the Agricultural Drainage Ditch

When the temperature is high, there is a significant positive correlation between the methane emissions and temperature [44]. Sekiguchi and other scholars found that there are many types of methanogens under low temperatures. Methanosaetaceae, which can only use acetic acid to produce CH4, are the main species [45], while under high-temperature conditions, Methanococcus methanococcus, which can utilize both acetic acid and H2/CO2, was dominant [46]. The substrate utilization and CH4 production capacity of the latter were higher than those of the former. Therefore, the effect of temperature on the CH4 production was essentially to change the composition of methanogenic bacteria and the temperature increase was beneficial in improving the emission path of CH4. With the increase in temperature, the respiration and transpiration of plants are enhanced, which promotes the transport of CH4 through plants to the atmosphere. In addition, increasing the temperature can promote CH4 diffusion through the water layer, making it easier for CH4 gas to bubble out of the water.
The reduction of the CH4 emission flux under the SP treatment is due to the fact that aeration weakens the reducing environment in the soil and methane is mainly produced under strong reducing conditions [47]. However, aeration increases the content of dissolved oxygen in the water. The generated CH4 is oxidized during its transmission to the atmosphere [48].
Studies have shown that the transmission process of CH4 through plants takes about 2.5 h [49]. Considering the production process of methane, it must take more than 2 h from the beginning of methane production to the emission into the atmosphere and collection. As shown in Figure 9, the peak occurrence time of the CH4 emission flux reduction under the aeration treatment is only about 2 h behind the peak occurrence time of the DO increment, which is far too short to affect the activities of methanogens in soil. Therefore, it can be inferred that the SP treatment mainly reduces the methane emission flux by oxidizing the generated CH4 in the CH4 emission pathway.

4.3.3. Influence of Aeration on the CO2 Emission Process of the Agricultural Drainage Ditch

The CO2 emissions in drains mainly come from soil respiration, plant respiration, oxidation of CH4 and decomposition of organic matter by microorganisms. The variation trend of the CO2 emission flux in all treatments is relatively consistent, with peaks appearing during both day and night. The peak of the CO2 emission flux at night is because plants only breathe at night, while the peak of the CO2 emission flux during the day occurs from 12:00 to 18:00. Both the outside temperature and water temperature are high between, which occurs because the soil respiration intensity increases with the temperature increase [50]. During the short-term temperature increase of 20–30 °C, the respiration rate of the soil can increase by more than three times, on average [51]. At the same time, plant respiration intensity increases [52]. Some studies have shown that artificial aeration reduces the CO2 emission flux [26], while others have shown that CO2 emissions are not affected by artificial aeration [53]. However, plant species and quantities have a significant impact on CO2 emissions [54] and the presence of plants can provide more unstable carbon for microbial activities [55]. Therefore, the change in the CO2 emission flux cannot be simply attributed to the influence of aeration, which is closely related to the type and quantity of the plants. The increase in the CO2 emission flux under the SP treatment may be caused by the oxidation of part of CH4 to CO2. However, if the reduction of CH4 emission flux is all attributed to the oxidation of CH4 in the process of emission, the CO2 emission flux will only increase by 521.42 mg/m2, but the CO2 emission flux will increase by 785.3 mg/m2. It can be seen that the increase in the CO2 emission flux is not entirely due to the oxidation of CH4. Therefore, in terms of this experiment, aeration increased the CO2 emission flux, possibly because aeration enhanced the respiration of plants and microorganisms in the water.

5. Conclusions

This study took rice field drainage ditches as the research object to explore the influence of aeration on the pollution load of agricultural drainage ditches and the emission process of greenhouse gases. Through experimental and theoretical analysis, the following conclusions were drawn:
(1)
Aeration reduced the nitrate content in water, but had no significant effect on the ammonium content. Aeration increases the PH, DO and ORP of water, but reduces the COD of water by 24.9%, indicating that aeration has a certain purification effect on water quality.
(2)
At first, aeration greatly increased the content of ammonium nitrogen in the sediment, but as time went on there was no significant difference between ammonium nitrogen content and S treatment and, whether with S treatment or SP treatment, the content of nitrate nitrogen in the sediment was almost zero. The content of total organic carbon, microbial carbon and soluble carbon in sediments decreased with SP treatment and the final content was less than that of S treatment.
(3)
Aeration reduces the emission fluxes of N2O and CH4 and increases the emission fluxes of CO2 in the drainage ditch. However, it reduces the greenhouse effect generated by the drainage ditch by 33.66%, among which the emission fluxes of CH4 decrease the most (by 46.28%). The DO content and CH4 production in the water during the daytime were consistent with the trend of the temperature change. The higher the temperature, the greater the CH4 production, the higher the DO in water and the more CH4 oxidation.
This experiment explored the diurnal variation process of the pollution load and greenhouse gas emission in drainage ditches. It lacked long-term monitoring, as well as research on the effect of the aeration process and intensity, which should be explored in future research.

Author Contributions

The research article presented here was carried out in collaboration with several authors. C.G. and Q.L. conceived the article idea and designed this study. Q.Z. (Qisen Zhang) and Y.Z. performed the experiment. J.W. (Jingwei Wu) and Q.Z. (Qisen Zhang) analyzed the data and wrote the first draft of the manuscript. Y.H. and J.W. (Jingwei Wu) modified and improved the manuscript. J.W. (Jing Wang), Q.Z. (Qiang Zhao) and X.J. made significant suggestions for the methodology, data analysis and manuscript writing. All authors have read and agreed to the published version of the manuscript.

Funding

This research were funded by the National Natural Science Foundation of China (Grant No. 51790532 and 52209067), the Opening Foundation of Key Laboratory of Ecological Protection and Restoration of the Yellow River Basin in Henan Province (LYBEPR202205) and the Project funded by China Postdoctoral Science Foundation (2022M712467).

Data Availability Statement

All the data and codes used in this study can be requested by email to the corresponding author Chenyao Guo at [email protected].

Acknowledgments

Thank Zhang Jifeng for his support in samples testing.

Conflicts of Interest

The authors declare no conflict of interest.

References

  1. Lamers, M.; Anyusheva, M.; La, N.; Nguyen, V.V.; Streck, T. Pesticide Pollution in Surface- and Groundwater by Paddy Rice Cultivation: A Case Study from Northern Vietnam. Clean-Soil Air Water 2011, 39, 356–361. [Google Scholar] [CrossRef]
  2. Naz, A.; Chowdhury, A.; Mishra, B.K.; Gupta, S.K. Metal pollution in water environment and the associated human health risk from drinking water: A case study of Sukinda chromite mine, India. Hum. Ecol. Risk Assess. 2016, 22, 1433–1455. [Google Scholar] [CrossRef]
  3. Minamikawa, K.; Huynh, K.C.; Uno, K.; Tran, N.S.; Nguyen, C.H. Cattle biogas effluent application with multiple drainage mitigates methane and nitrous oxide emissions from a lowland rice paddy in the Mekong Delta, Vietnam. Agric. Ecosyst. Environ. 2021, 319, 107568. [Google Scholar] [CrossRef]
  4. Elder, C.D.; Xu, X.M.; Walker, J.; Schnell, J.L.; Hinkel, K.M.; Townsend-Small, A.; Arp, C.D.; Pohlman, J.W.; Gaglioti, B.V.; Czimczik, C.I. Greenhouse gas emissions from diverse Arctic Alaskan lakes are dominated by young carbon. Nat. Clim. Chang. 2018, 8, 166. [Google Scholar] [CrossRef]
  5. Maguire, T.J.; Spencer, C.; Grgicak-Mannion, A.; Drouillard, K.; Mayer, B.; Mundle, S.O.C. Distinguishing point and non-point sources of dissolved nutrients, metals, and legacy contaminants in the Detroit River. Sci. Total Environ. 2019, 681, 1–8. [Google Scholar] [CrossRef]
  6. Zheng, Y.J.; Wu, S.; Xiao, S.Q.; Yu, K.; Fang, X.T.; Xia, L.L.; Wang, J.Y.; Liu, S.W.; Freeman, C.; Zou, J.W. Global methane and nitrous oxide emissions from inland waters and estuaries. Glob. Chang. Biol. 2022, 28, 4713–4725. [Google Scholar] [CrossRef]
  7. Rissman, A.R.; Carpenter, S.R. Progress on Nonpoint Pollution: Barriers & Opportunities. Daedalus 2015, 144, 35–47. [Google Scholar] [CrossRef]
  8. Shou, C.G.; Du, H.S.; Liu, X.P. Research Progress of Source And Mechanism of Agricultural Non-Point Source Pollution in China. Appl. Ecol. Environ. Res. 2019, 17, 10611–10621. [Google Scholar] [CrossRef]
  9. Moloney, T.; Fenton, O.; Daly, K. Ranking connectivity risk for phosphorus loss along agricultural drainage ditches. Sci. Total Environ. 2020, 70, 134556. [Google Scholar] [CrossRef]
  10. Jin, B.B.; Liu, X.N.; Tan, J.Y.; Shao, X.H.; Cheng, J. Effect of Plant Buffer Zone-Antifouling Curtain Wall on Reducing Non-Point Source Pollution in Paddy Fields, China. Sustainability 2022, 14, 6044. [Google Scholar] [CrossRef]
  11. Rosset, T.; Gandois, L.; Le Roux, G.; Teisserenc, R.; Jimenez, P.D.; Camboulive, T.; Binet, S. Peatland Contribution to Stream Organic Carbon Exports from a Montane Watershed. J. Geophys. Res. Biogeosci. 2019, 124, 3448–3464. [Google Scholar] [CrossRef]
  12. Tian, H.Q.; Xu, X.F.; Lu, C.Q.; Liu, M.L.; Ren, W.; Chen, G.S.; Melillo, J.; Liu, J.Y. Net exchanges of CO2, CH4, and N2O between China’s terrestrial ecosystems and the atmosphere and their contributions to global climate warming. J. Geophys. Res. Biogeosci. 2011, 116, G02011. [Google Scholar] [CrossRef] [Green Version]
  13. Bastviken, D.; Tranvik, L.J.; Downing, J.A.; Crill, P.M.; Enrich-Prast, A. Freshwater Methane Emissions Offset the Continental Carbon Sink. Science 2011, 331, 50. [Google Scholar] [CrossRef] [PubMed] [Green Version]
  14. Mitsch, W.J.; Zhang, L.; Stefanik, K.C.; Nahlik, A.M.; Anderson, C.J.; Bernal, B.; Hernandez, M.; Song, K. Creating Wetlands: Primary Succession, Water Quality Changes, and Self-Design over 15 Years. Bioscience 2012, 62, 237–250. [Google Scholar] [CrossRef] [Green Version]
  15. Hu, B.B.; Wang, D.Q.; Zhou, J.; Meng, W.Q.; Li, C.W.; Sun, Z.B.; Guo, X.; Wang, Z.L. Greenhouse gases emission from the sewage draining rivers. Sci. Total Environ. 2018, 612, 1454–1462. [Google Scholar] [CrossRef]
  16. Cao, L.G.; Zhou, Z.C.; Xu, X.W.H.; Shi, F.X. Spatial and temporal variations of the greenhouse gas emissions in coastal saline wetlands in southeastern China. Environ. Sci. Pollut. Res. 2020, 27, 1118–1130. [Google Scholar] [CrossRef]
  17. Maucieri, C.; Barbera, A.C.; Vymazal, J.; Borin, M. A review on the main affecting factors of greenhouse gases emission in constructed wetlands. Agric. For. Meteorol. 2017, 236, 175–193. [Google Scholar] [CrossRef]
  18. Mander, U.; Dotro, G.; Ebie, Y.; Towprayoon, S.; Chiemchaisri, C.; Nogueira, S.F.; Jamsranjav, B.; Kasak, K.; Truu, J.; Tournebize, J.; et al. Greenhouse gas emission in constructed wetlands for wastewater treatment: A review. Ecol. Eng. 2014, 66, 19–35. [Google Scholar] [CrossRef] [Green Version]
  19. Wuzuo, J.T.; Dai, X.P.; Wu, H.; Pan, H.Z. Research Progress of Aeration Technology in the Treatment of Black and Smelly Water. People Pearl River 2022, 43, 121–127. Available online: https://kns.cnki.net/kcms/detail/44.1037.TV.20220401.1515.040.html (accessed on 8 October 2022).
  20. Wu, K.K.; Gong, P.; Bai, W.; Zhang, Z.; Wei, Z.B.; Yu, C.X.; Song, Y.C.; Xue, Y.; Zhang, L.L. Effect of mixed inhibitor application on N2O production pathways in paddy soil. J. Soils Sediments 2022, 22, 1913–1923. [Google Scholar] [CrossRef]
  21. Cottingham, P.D.; Davies, T.H.; Hart, B.T. Aeration to promote nitrification in constructed wetlands. Environ. Technol. 1999, 20, 69–75. [Google Scholar] [CrossRef]
  22. Wang, H.; An, X.Q.; Yang, Y.; Bo, G.Z.; Zhang, Y.Z. Analyzing the Removal Effect of Nitrogen before and after Enhanced Aeration in Constructed Wetlands. Pol. J. Environ. Stud. 2016, 25, 2161–2166. [Google Scholar] [CrossRef]
  23. Wang, X.O.; Tian, Y.M.; Zhao, X.H.; Peng, S.; Wu, Q.; Yan, L.J. Effects of aeration position on organics, nitrogen and phosphorus removal in combined oxidation pond-constructed wetland systems. Bioresour. Technol. 2015, 198, 7–15. [Google Scholar] [CrossRef]
  24. Liu, F.F.; Fan, J.L.; Du, J.H.; Shi, X.; Zhang, J.; Shen, Y.H. Intensified nitrogen transformation in intermittently aerated constructed wetlands: Removal pathways and microbial response mechanism. Sci. Total Environ. 2019, 650, 2880–2887. [Google Scholar] [CrossRef]
  25. Saeed, T.; Sun, G.Z. A review on nitrogen and organics removal mechanisms in subsurface flow constructed wetlands: Dependency on environmental parameters, operating conditions and supporting media. J. Environ. Manag. 2012, 112, 429–448. [Google Scholar] [CrossRef]
  26. Maltais-Landry, G.; Maranger, R.; Brisson, J.; Chazarenc, F. Greenhouse gas production and efficiency of planted and artificially aerated constructed wetlands. Environ. Pollut. 2009, 157, 748–754. [Google Scholar] [CrossRef]
  27. Sniders, A.; Laizans, A.; Lua. Computer aided modelling of wastewater aeration process. In Proceedings of the 3rd International Scientific Conference on Rural Development, Kaunas, Lithuania, 8–10 November 2007; pp. 227–231. [Google Scholar]
  28. Peacock, M.; Granath, G.; Wallin, M.B.; Hogbom, L.; Futter, M.N. Significant Emissions From Forest Drainage Ditches-An Unaccounted Term in Anthropogenic Greenhouse Gas Inventories? J. Geophys. Res. Biogeosci. 2021, 126, e2021JG006478. [Google Scholar] [CrossRef]
  29. Boateng, K.K.; Obeng, G.Y.; Mensah, E. Eco-Friendly Yield and Greenhouse Gas Emissions as Affected by Fertilization Type in a Tropical Smallholder Rice System, Ghana. Sustainability 2020, 12, 10239. [Google Scholar] [CrossRef]
  30. Haney, R.L.; Franzluebbers, A.J.; Hons, F.M.; Zuberer, D.A. Soil C extracted with water or K2SO4: pH effect on determination of microbial biomass. Can. J. Soil Sci. 1999, 79, 529–533. [Google Scholar] [CrossRef]
  31. Dedkov, Y.M.; Elizarova, O.V.; Kel’ina, S.Y. Dichromate method for the determination of chemical oxygen demand. J. Anal. Chem. 2000, 55, 777–781. [Google Scholar] [CrossRef]
  32. Tan, X.Z.; Shao, D.G.; Gu, W.Q. Effects of temperature and soil moisture on gross nitrification and denitrification rates of a Chinese lowland paddy field soil. Paddy Water Environ. 2018, 16, 687–698. [Google Scholar] [CrossRef]
  33. Mostefa, G.; Ahmed, K. Treatment of Water Supplies by the Technique of Dynamic Aeration. In Proceedings of the 1st International Seminar on Water, Energy and Environment (ISWEE), Algiers, Algeria, 1–3 March 2011; pp. 209–214. [Google Scholar]
  34. Cravotta, C.A.; Geroni, J.N. Effects of CO2 Degassing on pH and Fe(II) Oxidation Rates in Coal Mine Effluents. In Proceedings of the International Mine Water Association Annual Conference on Reliable Mine Water Technology, Golden, CO, USA, 6–9 August 2013; pp. 949–954. [Google Scholar]
  35. Ma, S.C.; Xu, F.; Xu, D.S.; Li, D.F.; Yu, Y.F. Factors Affecting Slurry Oxidation in a Wet Flue Gas Desulfurization Process. J. Environ. Eng. 2019, 145, 04019058. [Google Scholar] [CrossRef]
  36. Kong, B. Study on Pollutant Removal Effect and Mechanism of Micro-Aerated Constructed Wetland. Master’s Thesis, Chongqing University, Chongqing, China, 2018. Available online: https://kns.cnki.net/KCMS/detail/detail.aspx?dbname=CMFD201901&filename=1018854174.nh (accessed on 8 October 2022). (In Chinese).
  37. Boller, M. Removal of Organic-Matter by Physicochemical Mechanisms in Waste-Water Treatment Plants. Water Sci. Technol. 1993, 27, 167–183. [Google Scholar] [CrossRef]
  38. Li, S.; Li, D.; Zhang, S.R.; Zeng, H.P.; Yuan, Y.X.; Zhang, J. Effect of aeration modes on simultaneous nitrogen and phosphorus removal and microbial community in a continuous flow reactor with granules. Bioresour. Technol. 2019, 294, 122154. [Google Scholar] [CrossRef]
  39. Zhu, D.T.; Cheng, X.J.; Sample, D.J.; Yazdi, M.N. Effect of intermittent aeration mode on nitrogen concentration in the water column and sediment pore water of aquaculture ponds. J. Environ. Sci. 2020, 90, 331–342. [Google Scholar] [CrossRef] [PubMed]
  40. Wang, L.; Li, K.; Song, Y.Q.; Gong, Q.; Chen, H.B.; Li, Z.H. Potential effect of nitrate applied during flood period on N2O emissions during subsequent drainage in a paddy soil. Eur. J. Soil Biol. 2021, 103, 103293. [Google Scholar] [CrossRef]
  41. Simek, M.; Jisova, L.; Hopkins, D.W. What is the so-called optimum pH for denitrification in soil? Soil Biol. Biochem. 2002, 34, 1227–1234. [Google Scholar] [CrossRef]
  42. Carreira, C.; Nunes, R.F.; Mestre, O.; Moura, I.; Pauleta, S.R. The effect of pH on Marinobacter hydrocarbonoclasticus denitrification pathway and nitrous oxide reductase. J. Biol. Inorg. Chem. 2020, 25, 927–940. [Google Scholar] [CrossRef]
  43. Zhang, M.; Huang, S.B.; Xiao, X.N. Effects of C/N and pH on N2O production by aerobic denitrifiers at high temperature. J. Environ. Eng. 2012, 6, 275–279. [Google Scholar]
  44. Watanabe, A.; Yamada, H.; Kimura, M. Analysis of temperature effects on seasonal and interannual variation in CH4 emission from rice-planted pots. Agric. Ecosyst. Environ. 2005, 105, 439–443. [Google Scholar] [CrossRef]
  45. Sekiguchi, Y.; Kamagata, Y.; Syutsubo, K.; Ohashi, A.; Harada, H.; Nakamura, K. Phylogenetic diversity of mesophilic and thermophilic granular sludges determined by 16S rRNA gene analysis. Microbiology 1998, 144, 2655–2665. [Google Scholar] [CrossRef] [Green Version]
  46. Megraw, S.R.; Knowles, R. Methane production and consumption in a cultivated humisol. Biol. Fertil. Soils 1987, 5, 56–60. [Google Scholar] [CrossRef]
  47. Vongvichiankul, C.; Deebao, J.; Khongnakorn, W. Relationship between pH, Oxidation Reduction Potential (ORP) and Biogas Production in Mesophilic Screw Anaerobic Digester. In Proceedings of the International Conference on Alternative Energy in Developing Countries and Emerging Economies (AEDCEE), Bangkok, Thailand, 25–26 May 2017; pp. 877–882. [Google Scholar]
  48. Jiang, T.; Li, G.X.; Tang, Q.; Ma, X.G.; Wang, G.; Schuchardt, F. Effects of aeration method and aeration rate on greenhouse gas emissions during composting of pig feces in pilot scale. J. Environ. Sci. 2015, 31, 124–132. [Google Scholar] [CrossRef] [PubMed]
  49. van Bodegom, P.M.; Scholten, J.C.M. Microbial processes of CH4 production in a rice paddy soil: Model and experimental validation. Geochim. Cosmochim. Acta 2001, 65, 2055–2066. [Google Scholar] [CrossRef] [Green Version]
  50. Duan, L.M.; Liu, T.X.; Ma, L.Q.; Lei, H.M.; Singh, V.P. Analysis of soil respiration and influencing factors in a semiarid dune-meadow cascade ecosystem. Sci. Total Environ. 2021, 796, 148993. [Google Scholar] [CrossRef] [PubMed]
  51. Craine, J.M.; Fierer, N.; McLauchlan, K.K.; Elmore, A.J. Reduction of the temperature sensitivity of soil organic matter decomposition with sustained temperature increase. Biogeochemistry 2013, 113, 359–368. [Google Scholar] [CrossRef]
  52. Li, C.Y.; Yang, Y.W.; Li, X.L.; Chen, Q.; Zhou, H.K. Effects of Simulated Climate Warming and Grazing on Photosynthesis and Respiration of Permafrost Meadow Plant Community. Russ. J. Ecol. 2020, 51, 224–232. [Google Scholar] [CrossRef]
  53. Maltais-Landry, G.; Maranger, R.; Brisson, J. Effect of artificial aeration and macrophyte species on nitrogen cycling and gas flux in constructed wetlands. Ecol. Eng. 2009, 35, 221–229. [Google Scholar] [CrossRef]
  54. Hassan, W.; David, J.; Abbas, F. Effect of type and quality of two contrasting plant residues on CO2 emission potential of Ultisol soil: Implications for indirect influence of temperature and moisture. CATENA 2014, 114, 90–96. [Google Scholar] [CrossRef]
  55. Picek, T.; Cizkova, H.; Dusek, J. Greenhouse gas emissions from a constructed wetland—Plants as important sources of carbon. Ecol. Eng. 2007, 31, 98–106. [Google Scholar] [CrossRef]
Figure 1. Layout of the experiment. (a) static box layout diagram; (b) aeration position diagram.
Water 14 03783 g001
Figure 2. Diurnal variation of ammonium and nitrate contents in the agricultural drainage ditch water. (a) ammonium nitrogen content in water; (b) nitrate nitrogen content in water.
Water 14 03783 g002
Figure 3. Diurnal variation of the water PH and temperature in the agricultural drainage ditch. (a) the water temperature; (b) PH value of water.
Water 14 03783 g003
Figure 4. Diurnal variation of the water DO, ORP and COD in the agricultural drainage ditch. (a) dissolved oxygen content in water; (b) water ORP; (c) COD in water.
Water 14 03783 g004
Figure 5. Diurnal variation of ammonium nitrogen and nitrate nitrogen contents in the sediment of the agricultural drainage ditch. (a) content of ammonium nitrogen in sediment; (b) content of nitrate nitrogen in sediment.
Water 14 03783 g005
Figure 6. Diurnal variation of the TOC, DOC and MBC contents in the drainage ditch sediment. (a) DOC in sediment; (b) MBC in sediment; (c) TOC in sediment.
Water 14 03783 g006
Figure 7. Diurnal variation of GHG emission fluxes from the agricultural drains. (a) N2O emission flux; (b) CO2 emission flux; (c) CH4 emission flux.
Water 14 03783 g007
Figure 8. Relationship between the water DO increment and N2O emission flux reduction in the agricultural drainage ditch.
Water 14 03783 g008
Figure 9. Relationship between the DO increment and CH4 emission flux reduction.
Water 14 03783 g009
Table 1. 24-h emission flux and change proportion of GHG in each treatment.
Type of GasThe Emission Flux (mg/m2)GWPThe Decrease Ratio of GHG Emission Flux and Total GWP in SP Treatment Compared with S Treatment
SSPSSP
N2O1.040.8309.92238.423.19%
CO28129.148914.448129.148914.44−9.66%
CH41126.65605.2328,166.2515,130.7546.28%
The total 36,605.3124,283.5933.66%
Publisher’s Note: MDPI stays neutral with regard to jurisdictional claims in published maps and institutional affiliations.

