Article

Heavy Metals, Pesticide, Plasticizers Contamination and Risk Analysis of Drinking Water Quality in the Newly Developed Housing Societies of Gujranwala, Pakistan

1
Department of Environmental Sciences, The University of Lahore, Lahore 54590, Pakistan
2
Mountain Agricultural Research Centre (MARC), Gilgit Baltistan 15500, Pakistan
3
Department of Food Sciences, Government College University Faisalabad, Sahiwal Campus, Sahiwal 57000, Pakistan
4
Department of Business Administration, College of Business Administration, Princess Nourah bint Abdulrahman University, P.O. Box 84428, Riyadh 11671, Saudi Arabia
5
Department of Plant Sciences, Quaid-i-Azam University, Islamabad 45320, Pakistan
6
Department of Biology, College of Science, King Khalid University, Abha 61413, Saudi Arabia
7
Department of Botany & Microbiology, Faculty of Science, South Valley University, Qena 83523, Egypt
*
Authors to whom correspondence should be addressed.
Water 2022, 14(22), 3787; https://doi.org/10.3390/w14223787
Submission received: 21 October 2022 / Revised: 13 November 2022 / Accepted: 16 November 2022 / Published: 21 November 2022
(This article belongs to the Special Issue Groundwater Quality and Human Health Risk)

Abstract

:
The supply of clean drinking water is essential for a healthy life, but access to safe and healthy drinking water has become a key issue worldwide, especially in developing nations such as Pakistan. This research work focused on investigating the suitability of groundwater by measuring quality parameters, identification of pesticide pollutants, and health risk analysis in adults and children due to the consumption of groundwater in recently developed housing societies of the Gujranwala district, Punjab, Pakistan. Drinking water samples (n = 200) were collected from electric water pumps and analyzed by in situ testings following the Standard American Public Health Association (APHA) methods. Pesticides and plasticizers detection was carried out using gas chromatography-mass spectrometry (GC/MS). Results showed that the concentrations of dissolved Cr and Pb at more than 20% of sampling sites exceeded the allowable limit of the World Health Organization (WHO). However, the measured physico-chemical attributes and concentrations of Fe and Zn did not exceed their respective permissible limits. The most abundant pollutants detected were plasticizers (30); followed by herbicides (21); fungicides, acaricides, and insecticides (16); and various types of plant growth regulators (7). Differential patterns for the hazard quotient (HQ) and hazard indices (HI) were observed, of which were above the WHO limits. The decreasing order of the hazard quotient was Cl > Zn > Mg > Cr > Pb for both adults and children. In crux, the quality of water is poor for drinking purposes and the safety and well-being of residents in the recently developed housing societies of the study area may be at risk. Hence, it is important to implement a plan for water quality management, and the regular monitoring (periodic testing of qualitative and quantitative attributes) of the water quality to overcome health-related issues.

1. Introduction

The demand for clean water for various sectoral water uses is significantly rising as a result of an expanding global population [1]. These changes will challenge the sustainable management of ‘clean accessible water for all’, one of the UN Sustainable Development Goals (SDGs) for 2030 [2]. Globally, more than twenty-five thousand humans face death on a routine basis as a consequence of diseases related to water pollution [3]. It is projected that 50% of the world’s population may face water deficiency by 2025 [4,5]. With the ever-increasing economic growth in most countries, there is a significant change in the urban landscape and associated rapid expansion in the industrialization causing risks to the environment by pollution over time [6]. Deterioration of water quality due to pollutants from underground water reserves has attracted the worldwide attention of many investigators to determine the existing chemical state (quality) of underground aquifers [7]. By gaining the inspiration of preserving the quality of underground water reserves, regular testing and extensive monitoring of these groundwater reserves is needed [8,9].
In Pakistan, due to poor water quality and quantity, access to clean drinking water is a serious concern for human health [10]. Pakistan is included as one of the nations that experiences severe water pollution, water scarcity, poor air quality, global warming, and climate change in the recent global environment performance index (EPI) rating [11]. The state and officials are responsible for providing clean drinking water to the citizens, but unfortunately, in Pakistan, water scarcity and contamination resulting from inefficient water management by the government and responsible authorities are affecting human survival [12]. In the modern era of technology, emerging environmental pollutants may enter the food chain from both anthropogenic and natural sources [13,14]. Certain types of industrial manufacturing, such as synthetic materials, mining, and waste burning, result in potentially toxic waste production, posing risks to both abiotic elements (e.g., soil, water) and biotic components (e.g., plants, animals) [15]. Typically, these potential toxicants that could harm the environment include heavy metals and pesticides among others that may significantly degrade and destroy ecosystem integrity, function, structure, and natural resource capital [16]. In 2017, Pakistani farmers applied 206,730 metric tons of pesticides to agricultural land, almost tripling the 73,632 metric tons used in the year 2010 [17,18].
Experimental assessments of different significant physicochemical indicators related to the water chemistry of the specific zone are widely employed in studies. Such types of important physicochemical indicators often have a noteworthy role in the underground water reserve managing procedures [19]. Many water quality measuring guidelines that have been developed for measuring the underground water quality—of water that is either being used for drinking or irrigation purposes—are excellent methods, which are being brought into wide usage all over the world [20]. The deterioration of groundwater aquifers with heavy metals due to geologic and anthropogenic activities result in the health hazards for local population [21]. The continuously increasing reliance on underground aquifers as a potable water supply source has stimulated struggles to preserve and improve the quality of this precious resource [22]. Heavy metals and pesticides are the main toxic contaminants that adversely limit the beneficial use of water for households or industries [23]. Pollution due to agricultural processes poses the risk of toxic pesticide residues and heavy metal contents in both soil and underground water reserves of residential areas [24]. These types of guidelines are very fruitful in the provision of better underground water quality to the community and related establishments for water management systems [25].
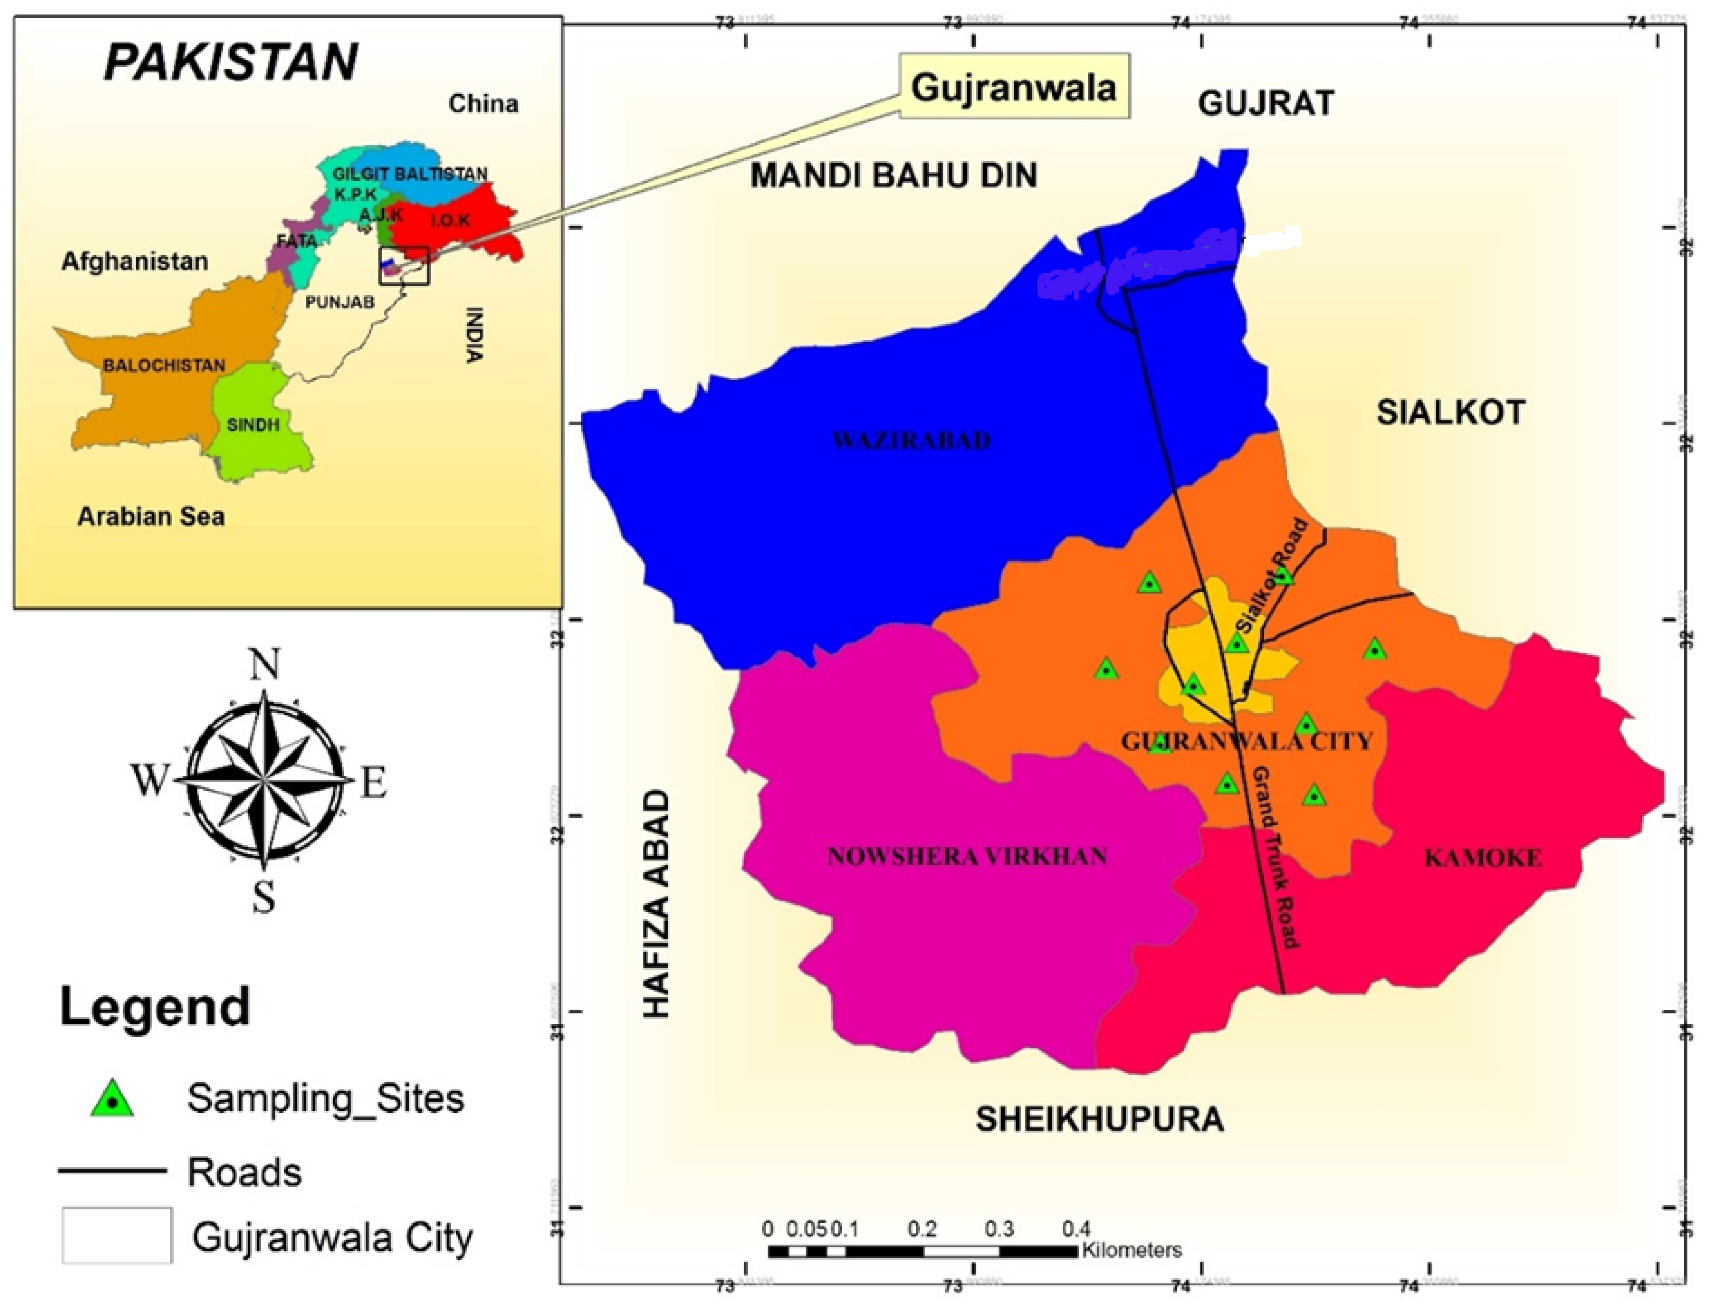
This research was conducted for the assessment of pesticide residues and trace element contaminations in underground water samples of newly established residential areas in the Gujranwala area through the unified methodology of water quality indicators and multi-variant statistical analytical practices. Sampling sites were selected on the basis of health issues such as intestinal and gastric health due to the poor quality of drinking water, as reported by Mazhar et al. [26]. Whilst various studies have been conducted by researchers on water pollution, very little is known about the effect of pesticide residues on groundwater reserves, especially in newly developed residential areas. The main objective of this investigation is to understand and quantify pollutant concentrations of cations, anions, heavy metals, and chemical substances such as pesticide residues and plasticizers in the drinking water and to determine the possible human health risks concerned with the use of potable water in the newly established residential areas.

2. Materials and Methods

2.1. Study Area

Gujranwala is located in Punjab (31°32′–32°33′ N and 73°11′–74°28′ E) and has a population of over three million people. Gujranwala hosts an economy that has a heavy usage of fertilizers and pesticides which are being used as part of agricultural activities to increase crop yield for a long time. People in the study area are mostly converting agricultural land into residential housing societies. Five of such recently developed residential areas (<5 years), i.e., Kotli Gondiawali, Green Town, Master City, Ajwa City, and Peoples Colony, are investigated in this study, as shown in Figure 1. Currently (>500) people are residing in each of these residential areas. The lack of implementation of environmental monitoring, regulation, and policies before the establishment of society has resulted in serious concerns about drinking water quality [26].

2.2. Water Sampling and Preparation

Drinking water samples (n = 200) were taken from the water extraction electric pumps, ranging in boring depth from 80 to 120 m, with twenty samples from each site of recently developed residential area. From each residential area, two sites were selected, namely S1 and S2. Before the sampling, water was allowed to flow for 5 to 6 min from the pumps to obtain fresh water. The drinking water sampling (each amount ~500 mL) was carried out in clean pre-sterilized plastic bottles. Each collected sample was acidified by adding 2–3 drops of nitric acid (HNO3) at the site for better stabilization and preservation. All samples were labeled, stored at cool temperature conditions, and transported to the laboratory for analytical analysis using the standards protocols of the American Public Health Association (APHA) 23rd Edition.

2.3. Physico-Chemical and Metal Attributes

Including the field quality parameters, all water samples were analyzed as per the Standard Methods described for the Examination of Water and Wastewater [27]. A multi-parameter instrument (HANNA HI2020) was employed to measure the electric conductivity (EC) using (APHA 2510) and pH values using (APHA 4500 H+) the standard protocols. Total hardness was measured by the titration method. The water samples were titrated with 0.01M EDTA and the calculation was carried out by following the standard protocols. In addition, the measurements of major cationic concentrations, Mg2+ and Ca2+, in the samples were determined by the titrimetric method using 3500-Ca (B) and 3500-Mg (B) as reference methods, respectively. For heavy metal concentrations (Fe, Pb, Cr, and Zn), the inductively coupled mass spectrometry (Agilent 720 ICP-MS) technique was used as per the standard analytical method (Method 6020) and instrument-operating manual. Moreover, to measure the concentration of Cl1 in water samples, the ion-exchange chromatography (IEC-1100) technique was employed. Standard protocols and procedural blanks were tested in each batch to ensure the accuracy of determinations as part of the quality assurance, as mentioned in Table 1.

2.4. Pesticide and Plasticizers Evaluation by GC-MSD

Pesticide identification in water samples was conducted using the GC/MS (Agilent technologies GC 6890, J&W Scientific, Santa Clara, CA, USA) single quadrupole by following the standard methods. As a carrier gas, He (Helium) gas at a purity level of 99.99% was utilized with a flow rate of about 2.1 mL/min. For the analyte sample injection, a 7890A GC multimode inlet was used carefully, and for its operation, the split less injection mode (1 μL to 3 μL) was used, which was equipped with an inlet liner stuffed with glass wool. The temperature settings of the GC injection port and the MS interface were fixed to 280 °C. For the running of mass spectrometer, an electron ionization mode was selected with an electron multiplier voltage value of 1058 V. The MS quad temperature and ion source temperature was 200 °C and 300 °C, respectively. The results from the spectrometric analysis were found to be in the atomic mass range from 45 to 550 amu. Various pesticidal and plasticizers chemicals were characterized by comparing mass spectra and the reference ions abundance ratio of the recognized analysis from the sample with one of the standards (RTL library and NIST-MS). Pesticides and other pollutants (plasticizers) were identified based on the respective peak areas (%).

2.5. Health Risk Assessment

Among the several pathways of heavy metal intake, ingestion remains a major risk [28,29]. The Chronic Daily Intake (CDI) of compounds and metals such as Cr, Zn, Pb, Cl, and Mg was determined by Equation (1). The model utilized for calculating oral exposure and health risk is given by Maigari et al. [30] and Waqas et al. [31], which is based on the Integrated Risk Information System of USEPA [32], as given below.
CDI = (Cw × Iw)/Wb
here, Cw stands for the heavy metal levels in water (µg L1), Iw (L day1) is for the average daily intake (assumed to be 2 L day1 of water for adults and 1 L day1 for children) [32], and Wb (kg) is for the average human body weight (assumed to be 72 kg for an adult and 32.7 kg for a child) [6,28,33,34,35].

Hazard Quotient (HQ) and Hazard Index (HI) Indices

The Hazard Quotient (HQ) describes the approach for the risk characterization of non-carcinogenic health risks from the specific toxicant. The HQ value was computed using the following Equation (2), as followed by [29]:
HQ = CDI/(RfD)
where RfD stands for the reference dose in mg/kg/day. The RfD values used in this research were acquired from the U.S. Environmental Protection Agency. The Human Health Risk assessment of toxicant chemicals was determined based on the reference values of both HQ and THI. The lower values (HQ or THI < 1) were interpreted as no risk; the higher the values (>1), the bigger the health risk from chemicals, thus, pointing to a long-term health hazard [36]. The health hazard index (HI) is the sum of all hazard quotients for multiple substances and/or exposure pathways of all HMs, as described by Škrbić et al. [37], and is determined by using Equation (3).
HI = HQ (Cr) + HQ (Zn) + HQ (Cl) + HQ (Pb) + HQ (Mg)

2.6. Statistical and Spatial Data Analysis

Detailed descriptive statistical analyses were carried out using Microsoft Excel 2016 and Statistics 8.01 software, and the spatial maps were developed using ArcGIS software.

3. Results

3.1. Physico-Chemical Attributes

Findings of the current investigation revealed that the pH, EC, and total hardness in the sampled waters varied significantly. The range of pH values (7.08–7.78), EC (297–1040 µS/cm) and total hardness (40–180 mg/L) were within the allowable limits developed by the Pakistan Environmental Protection Agency (Pak-EPA) [38] and World Health Organization (WHO) [39]. The maximum pH (7.78) was observed in the water sampled from site 1 (Peoples Colony), while the minimum value (7.08) was found in the samples collected from site 2 (Kotli Gondiawali). The highest EC (1040 µS/cm) was found in the sample collected at site 1 (Master City). Similarly, the total hardness values showed minor variations in the drinking water samples (Table 2).

3.2. Cations and Anions

The average levels of major anions and cations measured in the drinking water samples are shown in Table 3. The calcium concentrations were within the allowable limit (200 mg L−1) developed by the WHO [39] at most sampling locations. However, about 50% of the collected samples measuring Mg values, ranging from 18.30 to 70.00 mg L−1, were found to be above the permissible limit (50 mg L−1) set by Pak-EPA [38]. The highest concentration of Mg (70.00 mg/L) was measured at site 2 (Kotli Gondiawali). The Cl concentrations ranged from 26 to 84 mg L−1, and all the values were observed to be well below the allowable limit (250 mg L−1) proposed by Pak-EPA [38] (Table 3).

3.3. Heavy Metals

Table 4 shows a summary of the heavy metal levels in various sampling points of potable water in the sampling area. The measured levels of Pb in water samples varied from 0.01 to 0.06 mg L−1, and approximately 10% of these sampling sites exceeded the allowable limit (0.05 mg L−1) developed by Pak-EPA [38]. A minimum concentration of Pb (0.01 mg L−1) was found in the water sample collected from site 1 in the Peoples Colony location, while the maximum concentration (0.06 mg L−1) was found at site 2 in the Kotli Gondiawali area. Iron concentrations varied from 0.04 to 0.11 mg L−1. All the sampling sites showed values below the permissible limits. The concentration of Zn in water did not register a significant spatial variation in the study area. However, Cr concentrations ranged from 0.01 to 0.06 mg L−1 and approximately 20% of samples exceeded the permissible limit (Table 4).

3.4. Pesticides and Plasticizers Accumulation

Twenty-one different types of herbicides were detected, which showed a significant spatial variation in the study area. Comparative results showed that a maximum of fourteen types of herbicides were identified and characterized in water samples collected from Peoples Colony site 1 followed by Master City site 1 and site 2. The maximum (peak area %), ranging from 0.62 to 6.74, was detected in water samples collected from Peoples Colony, followed by Ajwa City (0.52–9.41), Master City (0.32–3.94), Kotli Gondiawali (0.14–3.46), and Green Town (0.48–3.38) sampling locations. The minimum herbicide was detected in the Peoples Colony and Ajwa City sampling locations (Table 5).
Sixteen fungicides and acaricides were detected which showed significant variations (area %). Comparative results showed that maximum fungicides and acaricides were detected in water samples collected from site 2 (Green Town and Kotli Gondiawali), followed by site 1 (Green Town). The maximum area percent ranging from 0.69 to 5.29 was detected in the water samples collected from Peoples Colony followed by Ajwa City (3.4–5.21), Green Town (0.27–3.06), Master City (0.22–1.25), and Kotli Gondiawali (0.16–0.55). The minimum fungicide and acaricide detections were registered in Peoples Colony and Ajwa City, respectively (Table 6).
The findings revealed that sixteen different types of insecticides are present in drinking water samples. The maximum insecticide levels were detected in water samples collected from site 1 in Master City, followed by site 1 in Green Town. The percent area ranging from 0.55 to 5.69 was detected in water samples collected from the Peoples Colony followed by Ajwa City (3.31–5.69), Green Town (0.36–4.07), Master City (0.40–0.99), and Kotli Gondiawali (0.18–0.92) (Table 7).
Many different types of plant growth regulators were detected from all the sampling sites. The maximum plant growth regulators were detected in water samples collected from site 1 in Kotli Gondiawali, followed by the Peoples Colony and Master City. The maximum percent area ranging from 0.62 to 0.77 was detected in water samples collected from the Peoples Colony, followed by Green Town (0.27–0.70), Kotli Gondiawali (0.13–0.68), and Master City (0.29–0.64) (Table 8).

3.5. Plasticizers Accumulation

Thirty different types of plasticizers and other contaminants were detected in drinking water samples. The highest different kinds of plasticizer and other contaminants were measured in water samples collected from site 2 in Kotli Gondiawali, followed by site 1 in Kotli Gondiawali. The percent area, ranging from 0.29 to 16.45, was detected in water samples collected from Master City, followed by Peoples Colony (0.65–14.6), Kotli Gondiawali (0.13–11.06), Ajwa City (2.97–10.21), and Green City (0.21–8.23) (Table 9).

3.6. Health Risk Assessment

Overall, the results of chronic daily intake indicated that out of the 10 selected sampling locations, both sites in Peoples Colony were at less risk from chronic diseases in humans’ oral exposure, whereas the S1 in Master City and S2 in Kotli Gondiawali were at a high risk to children. The HQ was in the order of Cl > Zn > Mg > Cr > Pb for adults and children. The measured HQ for adults was the highest at S2 in Kotli Gondiawali (23.33) for adults and 25.69 for children, and the lowest for Pb for adults and children. Similarly, the HI for adults was in the order of S2 in Kotli Gondiawali (48.39) > S2 in Master City (48.20) > S1 in Kotli Gondiawali (41.16) > S2 in Ajwa City (37.64) > S1 in Ajwa City (36.34) > S2 in Master City (36.15) > S1 in Green Town (25.77) > S2 in Green Town (25.9) > S2 in Peoples Colony (20.39) and S1 in Peoples Colony (15.57, and it followed the same pattern for children. Moreover, the results indicated that the heavy metals, i.e., Cr and Pb, were very high at one sampling point (Table 10).

4. Discussion

Studies conducted in the past have shown that surface and groundwater are polluted by various types of chemicals and potentially toxic heavy metals that pose a number of threats to human health [29,31]. The results of the data analysis showed that there are considerable variations in each physico-chemical attribute of the drinking water samples obtained from various Gujranwala societies. The bulk of the water samples was below the Pak-EPA proposed permissible limits for all physicochemical parameters [38].
All samples’ pH values were within the appropriate limits determined by the WHO [39]. The drinking water’s pH varied slightly depending on the local aquifer geology, residence time, and composition of its ionic elements, particularly the hydrogen and hydroxyl ions [40,41]. This finding is also in agreement with the observation of Farooq et al. [42], wherein the pH ranged from 7.02 to 7.30, and with Hashmi et al. [43], where the pH ranged from 7.03 to 7.73 in a residential area in Rawalpindi. The EC values in all the water samples varied from 297–1040 S cm−1. It is observed that none of the industries that discharge wastewater without sufficient treatment were close to the investigated sampling sites, hence, the likelihood of such a source of pollution is absent at present [44]. However, it has been found that various human activities (i.e., agriculture) somewhat increase the electrical conductivity of drinking water [45]. According to the measured values, water samples from Ajwa City had the highest total hardness (180 mg/L), while those samples from the Peoples Colony had the lowest total hardness (40 mg/L). Generally, higher levels of hardness are attributed to the higher concentrations of limestone and magnesium carbonate [46]. Due to the presence of carbonate aquifer minerals, the subsequent dissolution of materials, and industrialization in these areas, the problem of hardness may become acute [46]. The main cause of scaling on the surface of distribution pipelines may be due to the persistent flow of hard water in the distribution system [44]. A prior investigation by Sh [47] reported that various samples of water from the Rawalpindi region ranged in hardness from 150 to 540 mg/L. These findings of the current study are in line with those of Khan and Khan [48], who reported that potable water samples collected from the Rawalpindi and Islamabad areas had a normal level of chlorides.
When concentrations of potentially toxic metals in potable water exceed a particular level, negative effects on human health may result [49,50]. As a result, the type and concentrations of heavy metals in water are critical factors, and the majority of the research on the quality and safety of drinking water includes heavy metal research. The lead pipes used to distribute drinking water in residential areas may have contributed to the higher values [49]. Outside of the study sites, there are significant ambient lead levels near the main roadways. The contamination of drinking water sources is caused directly or indirectly by vehicular emissions containing lead compounds. That could be the cause of the elevated lead concentrations found in all water samples [44]. When soft groundwater or surface water is in contact with rocks or soil that naturally contain high Cd, dissolution and mobilization may occur in the water. Additionally, it could be introduced by the use of paints, pigments, plastic stabilizers, mining, and smelting processes, as well as other industrial operations such as electroplating, the use of fossil fuel, fertilizer (diammonium phosphate) input, and the dumping of sewage sludge [51,52]. This may also be the result of galvanized steel pipe’s corrosion, which is utilized to distribute water over large regions, mostly for agricultural purposes (intense fertilizer application) [49]. The galvanized steel pipes have a zinc coating, which typically contains 1% of Cd. In a similar vein, Cd can originate from metallic material fittings that are usually soldered with cadmium [53].
The iron and zinc contents in potable water samples collected from various sites of housing societies in the study area varied significantly. The second biggest cause of metal contamination in soil is determined to be metal mining [54]. Metals such as Zn, Cu, Pb, and Fe are among them. During the treatment procedure, the metals could enter the water system. Chemical reactions and the subsequent leaching of metals such as Cu, Cd, Sn, Zn, Pb, and Fe into the local water may be caused by the corrosion and dissolution of the distribution pipes [49]. Given that the results obtained in this study of the drinking water quality are well below the Pak-EPA maximum permissible limits, it points to the fact that the sampled water is safe to consume [38]. The comparison of the current study with the WHO [39] and Pak-EPA [38] is depicted in Table 11.
The potable water samples were taken from several societies in Gujranwala, and it was discovered that there were over 90 different types of pesticides present in the water. Similar observations have been made by Wang et al. [55] in Greek rivers and lakes where pesticide levels were high; they reported that atrazine, alachlor, metolachlor, simazine, and trifluralin were the types of chemicals most commonly found in water and, among others, included insecticides such as diazinon and parathion methyl. Recently, Shakerkhatibi et al. [56] reported that profenofos, malathion, and diazinon residues are occurring in drinking groundwater resources in Iran. These pesticides were substances that were commonly found in soil. The physico-chemical characteristics and soil-types affect pesticide solubility and absorption, which may lead to pesticide degradation, accumulation, migration, diffusion, and mobilization in drinking water [24]. It is evident that extensive pesticide pollution is currently harming water resources in terms of quality [57]. The permissible limits of certain commonly used pesticides by various organizations are represented in Table 12.
The natural soil processes and water movement that cause a significant amount of pesticide mobilization—of which was sprayed on crops—generally end up in the environment. These agrochemicals break down quickly in the environment (e.g., soil, sediment, water), but some are quite persistent and bio-accumulative, hence, harming water quality with substantial environmental repercussions [58]. A more thorough understanding of the impacts of pesticides on drinking water and human health and the ecosystem will be possible due to the work being carried out regarding effective real-time pesticide pollution monitoring [59,60]. In the search for legal pesticide usage and cutting-edge pest control techniques, the analytical determination of low amounts of pesticides is crucial [61]. These innovations will assist in both aquatic and agricultural ecosystems by reducing the toxicity of pesticide discharge into the environment [62].
The findings of the present study show that the CDI of chemicals is higher in all of the sampling sites and there may be potential negative health risks to humans. The HQ values of the studied samples are higher for all determined parameters as compared to the studies conducted in different parts of Pakistan including Sharqpur [29], Hattar Industrial Estate [63], Gujrat [64], and Haripur Basin [65]. The HI studies for health risks from heavy metals in northern areas of Pakistan indicated no human health risk concerned with the potable water quality [28]. Sarvestani and Aghasi [66] compared the cumulative cancerous risk of metal levels in tap water and bottled water and concluded that the health risk for both children and adult individuals is greater from tap water use as compared to bottled water. Similarly, the cancerous disease risk studied in Russia was found to be 3.9 × 10⁻³ [67]. The values of CDI, HQ, and HI for the ingestion of drinking water in both adults and children are high, indicating a higher risk of developing chronic diseases. In 2008, approximately 57 million deaths are caused by cancer alone, as reported by the WHO [28,31,39].
A recommendation by health and environmental agencies states that people should flush the taps before consumption for 2 to 3 min [68,69,70] as it will help lower the contaminant levels (particularly Pb); however, this will result in wasting about 2000 L of water yearly per household, which is not feasible as it goes against the country’s water policy for natural resource management. A suggestion reported in several studies is to avoid using taps made from a material elevated in potentially toxic metals (e.g., Pb, Cr), and instead use Pb-free stainless-steel taps that can prevent metal dissolution and availability in the water plumbing system [68,69,70,71]. However, a few studies documented the presence of metals in water samples, even in situations when Cr and Pb-free taps were used, which is possibly due to the brass material used in the plumbing system [72].

5. Conclusions

Housing societies developed on agricultural land are at risk due to water contamination. Hence, the use of agricultural land for housing purposes has to be regulated. In general, the measured water quality parameters and the concentration of pollutants (pH, EC, TH, Ca, Mg, Cl, and heavy metals contents) were below the EPA Pakistan permissible limits. However, ninety types of pesticides and other pollutants (plasticizers) were identified in water samples. The most abundant pollutants detected are plasticizers and various other unspecified organic contaminants, followed by herbicides, fungicides, acaricides, insecticides, and various types of plant growth regulators. Samples from Kotli Gondiawali and the Ajwa City locations were mostly contaminated with pesticide contents, and the residents of these areas are at risk of health-related problems. It is worth mentioning here that there are more pesticides and other pollutants (plasticizers) identified in this study than the typically published problematic pesticides by the WHO and USEPA. This is probably due to the lack of enforcement of environmental and water quality laws. At present, both corrective and preventive measures should be taken in the area to control groundwater contamination. The absence of proper legislation will certainly accelerate groundwater quality degradation, which would put the lives of our future generations at risk. This study highlights the importance of further detailed research work to investigate groundwater abstraction and the recharge rate, trace heavy metal levels, the quantification of pesticide and plasticizer concentrations, biological aspects concerning the boring depth, and daily water extraction.

Author Contributions

Conceptualization, Q.u.Z., M.M. and K.A.; Data curation, H.u.R., K.F. and K.A.; Methodology, H.u.R., M.M. and K.F.; Software, B.A. and S.S.; Writing—original draft, K.A., Q.u.Z. and M.M.; Writing—review and editing, Q.u.Z., F.A.A.-S. and A.M.A. All authors have read and agreed to the published version of the manuscript.

Funding

This research was supported by the Princess Nourah bint Abdulrahman University Researchers Supporting Project number (PNURSP2022R259), Princess Nourah bint Abdulrahman University, Riyadh, Saudi Arabia.

Institutional Review Board Statement

This article does not contain any experimental studies with human participants or animals performed by any of the authors.

Informed Consent Statement

Not applicable.

Data Availability Statement

Data are contained within the article.

Acknowledgments

The authors extend their appreciation to the Deanship of Scientific Research at the King Khalid University for funding this work through the Research Group Project under grant number (RGP. 2/92/43).

Conflicts of Interest

The authors declare no conflict of interest.

References

  1. Adeloju, S.B.; Khan, S.; Patti, A.F. Arsenic contamination of groundwater and its implications for drinking water quality and human health in under-developed countries and remote communities—A review. App. Sci. 2021, 11, 1926. [Google Scholar] [CrossRef]
  2. United Nations-Water (UN-Water). Climate Change and Water: UN-Water Policy Brief. UN-Water Expert Group on Water and Climate Change; United Nations-Water Technical Advisory Unit: Geneva, Switzerland, 2019; Available online: https://www.unwater.org/publications/un-water-policy-brief-on-climate-change-and-water/ (accessed on 21 September 2020).
  3. Sathre, R.; Antharam, S.M.; Catena, M. Water Security in South Asian Cities: A Review of Challenges and Opportunities. Civ. Eng. 2022, 3, 873–894. [Google Scholar] [CrossRef]
  4. Ochilova, N.R.; Muratova, G.S.; Karshieva, D.R. The Importance of Water Quality and Quantity in Strengthening the Health and Living Conditions of the Population. Cent. Asian J. Med. Nat. Sci. 2021, 2, 399–402. [Google Scholar]
  5. Bhunia, P. Environmental Toxicants and Hazardous Contaminants: Recent Advances in Technologies for Sustainable Development. J. Hazard. Toxic Radioact. Waste 2017, 21, 02017001. [Google Scholar] [CrossRef]
  6. Khan, K.; Lu, Y.; Khan, H.; Zakir, S.; Khan, S.; Khan, A.A.; Wang, T. Health risks associated with heavy metals in the drinking water of Swat, northern Pakistan. J. Environ. Sci. 2013, 25, 2003–2013. [Google Scholar] [CrossRef]
  7. Guzy, A.; Malinowska, A.A. State of the art and recent advancements in the modelling of land subsidence induced by groundwater withdrawal. Water 2020, 12, 2051. [Google Scholar] [CrossRef]
  8. Read, I. Chapter Five. Illness, Recovery, and Death. In The Hierarchies of Slavery in Santos, Brazil, 1822–1888; Stanford University Press: Stanford, CA, USA, 2020; pp. 125–153. [Google Scholar]
  9. Ali, H.; Khan, E.; Ilahi, I. Environmental chemistry and ecotoxicology of hazardous heavy metals: Environmental persistence, toxicity, and bioaccumulation. J. Chem. 2019, 2019, 6730305. [Google Scholar] [CrossRef] [Green Version]
  10. Zhang, D.; Sial, M.S.; Ahmad, N.; Filipe, A.J.; Thu, P.A.; Zia-Ud-Din, M.; Caleiro, A.B. Water scarcity and sustainability in an emerging economy: A management perspective for future. Sustainability 2020, 13, 144. [Google Scholar] [CrossRef]
  11. Bhandari, M.P. Environmental performance and vulnerability to climate change: A case study of India, Nepal, Bangladesh and Pakistan. In Climate Change and Disaster Risk Management; Leal, F.W., Ed.; Springer: Berlin/Heidelberg, Germany, 2019; pp. 149–167. [Google Scholar]
  12. Ebrahim, Z.T. Is Pakistan running dry? In Water Issues in Himalayan South Asia: Internal Challenges, Disputes and Transboundary Tensions; Ranjan, A., Ed.; Palgrave Macmillan: Singapore, 2020; pp. 153–181. [Google Scholar]
  13. Häder, D.P.; Banaszak, A.T.; Villafañe, V.E. Anthropogenic pollution of aquatic ecosystems: Emerging problems with global implications. Sci. Total Environ. 2020, 713, 136586. [Google Scholar] [CrossRef]
  14. Xiang, Y.; Jiang, L.; Zhou, Y. Microplastics and environmental pollutants: Key interaction and toxicology in aquatic and soil environments. J. Hazard. Mat. 2021, 422, 126843. [Google Scholar] [CrossRef]
  15. Mian, H.R.; Hu, G.; Hewage, K.; Rodriguez, M.J.; Sadiq, R. Drinking water quality assessment in distribution networks: A water footprint approach. Sci. Total Environ. 2021, 775, 145844. [Google Scholar] [CrossRef]
  16. Zhang, X.; Yan, L.; Liu, J. Removal of different kinds of heavy metals by novel PPG-nZVI beads and their application in simulated stormwater infiltration facility. Appl. Sci. 2019, 9, 4213. [Google Scholar] [CrossRef] [Green Version]
  17. Government of Pakistan (GoP). Agricultural Statistics of Pakistan, 2018–2019; Ministry of Food and Agriculture, Finance Division, Economic Advisor’s Wing: Islamabad, Pakistan, 2017. [Google Scholar]
  18. Mehmood, Y.; Arshad, M.; Mahmood, N.; Kächele, H.; Kong, R. Occupational hazards, health costs, and pesticide handling practices among vegetable growers in Pakistan. Environ. Res. 2021, 200, 111340. [Google Scholar] [CrossRef]
  19. Kattan, Z. Using hydrochemistry and environmental isotopes in the assessment of groundwater quality in the Euphrates alluvial aquifer, Syria. Environ. Earth Sci. 2018, 77, 45. [Google Scholar] [CrossRef]
  20. Jha, M.K.; Shekhar, A.; Jenifer, M.A. Assessing groundwater quality for drinking water supply using hybrid fuzzy-GIS-based water quality index. Water Res. 2020, 179, 115867. [Google Scholar] [CrossRef]
  21. Khalid, S.; Shahid, M.; Shah, A.H.; Saeed, F.; Ali, M.; Qaisrani, S.A.; Dumat, C. Heavy metal contamination and exposure risk assessment via drinking groundwater in Vehari, Pakistan. Environ. Sci. Poll. Res. 2020, 27, 39852–39864. [Google Scholar] [CrossRef]
  22. Kookana, R.S.; Drechsel, P.; Jamwal, P.; Vanderzalm, J. Urbanisation and emerging economies: Issues and potential solutions for water and food security. Sci. Total Environ. 2020, 732, 139057. [Google Scholar] [CrossRef]
  23. Sonone, S.S.; Jadhav, S.; Sankhla, M.S. Water contamination by heavy metals and their toxic effect on aquaculture and human health through food Chain. Lett. Appl. NanoBioSci. 2020, 10, 2148–2166. [Google Scholar]
  24. Tudi, M.; Daniel Ruan, H.; Wang, L.; Lyu, J.; Sadler, R.; Connell, D.; Phung, D.T. Agriculture development, pesticide application and its impact on the environment. Int. J. Environ. Res. Public Health 2021, 18, 1112. [Google Scholar] [CrossRef]
  25. Rana, R.; Ganguly, R.; Gupta, A.K. Indexing method for assessment of pollution potential of leachate from non-engineered landfill sites and its effect on ground water quality. Environ. Monit. Assess. 2018, 190, 46. [Google Scholar] [CrossRef]
  26. Mazhar, I.; Hamid, A.; Afzal, S. Groundwater quality assessment and human health risks in Gujranwala District, Pakistan. Environ. Earth Sci. 2019, 78, 634. [Google Scholar] [CrossRef]
  27. American Public Health Association (APHA). Standard Methods for Examination of Water and Wastewater, 20th ed.; APHA: Washington, DC, USA, 1998; pp. 5–16. ISBN 9780875532356. [Google Scholar]
  28. Wang, X.; Zhang, L.; Zhao, Z.; Cai, Y. Heavy metal pollution in reservoirs in the hilly area of southern China: Distribution, source apportionment and health risk assessment. Sci. Total Environ. 2018, 634, 158–169. [Google Scholar] [CrossRef] [PubMed]
  29. Ehsan, N.; Shan, A.; Riaz, S.; Zaman, Q.; Javied, S.; Jabeen, M. Health risk assessment due to exposure of arsenic contamination in drinking water of district Shiekhupura, Punjab, Pakistan. Hum. Ecol. Risk Assess Int. J. 2018, 26, 162–176. [Google Scholar] [CrossRef]
  30. Maigari, A.U.; Ekanem, E.O.; Garba, I.H.; Harami, A.; Akan, J.C. Health Risk Assessment for Exposure to Some Selected Heavy Metals via Drinking Water from Dadinkowa Dam and River Gombe Abba in Gombe State, Northeast Nigeria. World J. Analyt. Chem. 2016, 4, 1–5. [Google Scholar]
  31. Waqas, H.; Shan, A.; Khan, Y.G.; Nawaz, R.; Rizwan, M.; Rehman, M.S.U.; Jabeen, M. Human health risk assessment of arsenic in groundwater aquifers of Lahore, Pakistan. Hum. Ecol. Risk Assess Int. J. 2017, 23, 836–850. [Google Scholar] [CrossRef]
  32. USEPA. Guidelines for Carcinogen Risk Assessment; Risk Assessment Forum U.S. Environmental Protection Agency: Washington, DC, USA, 2005. [Google Scholar]
  33. USEPA. Guidelines for Exposure Assessment; EPA/600/Z-92/001; US Environmental Protection Agency, Risk Assessment Forum: Washington, DC, USA, 1992. [Google Scholar]
  34. Shams, M.; Tavakkoli Nezhad, N.; Dehghan, A.; Alidadi, H.; Paydar, M.; Mohammadi, A.A.; Zarei, A. Heavy metals exposure, carcinogenic and non-carcinogenic human health risks assessment of groundwater around mines in Joghatai, Iran. Int. J. Environ. Analyt. Chem. 2022, 102, 1884–1899. [Google Scholar] [CrossRef]
  35. Zhang, H.; Mao, Z.; Huang, K.; Wang, X.; Cheng, L.; Zeng, L.; Jing, T. Multiple exposure pathways and health risk assessment of heavy metal (loid) s for children living in fourth-tier cities in Hubei Province. Environ. Int. 2019, 129, 517–524. [Google Scholar] [CrossRef]
  36. Nta, S.A.; Ayotamuno, M.J.; Igoni, A.H.; Okparanma, R.N.; Udo, S.O. Application of hazard quotient for the assessment of potential health risk of groundwater users around Uyo main dumpsite. Asian J. Adv. Res. Rep. 2020, 6, 49–54. [Google Scholar] [CrossRef]
  37. Škrbić, B.D.; Kadokami, K.; Antić, I. Survey on the micro-pollutants presence in surface water system of northern Serbia and environmental and health risk assessment. Environ. Res. 2018, 166, 130–140. [Google Scholar] [CrossRef]
  38. Pak-EPA. Pakistan Environmental Protection Agency. National Environmental Quality Standards, Ministry of Environment, Pakistan. 2008. Available online: http://www.pakepa.org/neqs.html (accessed on 10 May 2021).
  39. World Health Organization. Guidelines for Drinking-Water Quality 3rd edition Incorporating the First and Second Addenda; WHO Press: Geneva, Switzerland, 2008.
  40. Mkwate, R.C.; Chidya, R.C.; Wanda, E.M. Assessment of drinking water quality and rural household water treatment in Balaka District, Malawi. Phys. Chem. Earth Parts A/B/C 2017, 100, 353–362. [Google Scholar] [CrossRef]
  41. Lukubye, B.; Andama, M. Physico-chemical quality of selected drinking water sources in Mbarara Municipality, Uganda. J. Water Res. Prot. 2017, 9, 707–722. [Google Scholar] [CrossRef] [Green Version]
  42. Farooq, S.; Hashmi, I.; Qazi, I.A.; Qaiser, S.; Rasheed, S. Monitoring of coliforms and chlorine residual in water distribution network of Rawalpindi, Pakistan. Environ. Monit. Assess. 2008, 140, 339–347. [Google Scholar] [CrossRef] [PubMed]
  43. Hashmi, I.; Farooq, S.; Qaiser, S. Chlorination and water quality monitoring within a public drinking water supply in Rawalpindi Cantt (Westridge and Tench) area, Pakistan. Environ. Monit. Assess. 2009, 158, 393–403. [Google Scholar] [CrossRef]
  44. Mehmood, S.; Ahmad, A.; Ahmed, A.; Khalid, N.; Javed, T. Drinking water quality in capital city of Pakistan. Sci. Rep. 2013, 2, 637. [Google Scholar]
  45. Leusch, F.D.; Neale, P.A.; Arnal, C.; Aneck-Hahn, N.H.; Balaguer, P.; Bruchet, A.; Hebert, A. Analysis of endocrine activity in drinking water, surface water and treated wastewater from six countries. Water Res. 2018, 139, 10–18. [Google Scholar] [CrossRef] [PubMed] [Green Version]
  46. Kozisek, F. Regulations for calcium, magnesium or hardness in drinking water in the European Union member states. Regul. Toxicol. Pharmacol. 2020, 112, 104589. [Google Scholar] [CrossRef]
  47. Sh, Z.; Aziz, M.; Sheikh, A.N. Evaluation of available drinking water quality for afghan refugees’ life style in north west balochistan. Pak. J. Sci. 2021, 73, 154. [Google Scholar]
  48. Khan, M.; Khan, W. Socioeconomic and recharge effect on spatial changes in the groundwater chemistry of Punjab, Pakistan: A multivariate statistical approach. SN App. Sci. 2020, 2, 1465. [Google Scholar] [CrossRef]
  49. Bamuwamye, M.; Ogwok, P.; Tumuhairwe, V.; Eragu, R.; Nakisozi, H.; Ogwang, P.E. Human health risk assessment of heavy metals in Kampala (Uganda) drinking water. J. Food Res. 2017, 6, 6–16. [Google Scholar] [CrossRef] [Green Version]
  50. Chika, O.C.; Prince, E.A. Comparative assessment of trace and heavy metals in available drinking water from different sources in the Centre of Lagos and off Town (Ikorodu LGA) of Lagos State, Nigeria. Advan. J. Chem. Sec. A 2020, 3, 94–104. [Google Scholar]
  51. Rahmanian, N.; Ali, S.H.B.; Homayoonfard, M.; Ali, N.J.; Rehan, M.; Sadef, Y.; Nizami, A.S. Analysis of physiochemical parameters to evaluate the drinking water quality in the state of Perak, Malaysia. J. Chem. 2015, 47, 777–780. [Google Scholar] [CrossRef] [Green Version]
  52. Kumari, P.; Kumar, G.; Prasher, S. Evaluation of uranium and other toxic heavy metals in drinking water of Chamba district, Himachal Pradesh, India for possible health hazards. Environ. Earth Sci. 2021, 80, 271. [Google Scholar] [CrossRef]
  53. Chinye-Ikejiunor, N.; Iloegbunam, G.O.; Chukwuka, A. Groundwater contamination and health risk assessment across an urban gradient: Case study of Onitcha metropolis, south-eastern Nigeria. Groundw. Sustain. Dev. 2021, 14, 100642. [Google Scholar] [CrossRef]
  54. Ashraf, A.; Ahmad, Z. Regional groundwater flow modelling of Upper Chaj Doab of Indus basin, Pakistan using finite element model (Feflow) and geo-informatics. Geophy. J. Int. 2008, 173, 17–24. [Google Scholar] [CrossRef] [Green Version]
  55. Wang, Y.; Liu, M.; Dai, Y. Health and ecotoxicological risk assessment for human and aquatic organism exposure to polycyclic aromatic hydrocarbons in the Baiyangdian Lake. Environ. Sci. Poll. Res. 2021, 28, 574–586. [Google Scholar] [CrossRef] [PubMed]
  56. Shakerkhatibi, M.; Mosaferi, M.; Jafarabadi, M.A.; Lotfi, E.; Belvasi, M. Pesticides residue in drinking groundwater resources of rural areas in the northwest of Iran. Health Prom. Perspect. 2014, 4, 195. [Google Scholar]
  57. Li, P.; Wu, J.; Qian, H. Assessment of groundwater quality for irrigation purposes and identification of hydrogeochemical evolution mechanisms in Pengyang County, China. Environ. Earth 2013, 69, 2211–2225. [Google Scholar] [CrossRef]
  58. Stavra, E.; Petrou, P.; Economou, A.; Misiakos, K.; Raptis, I.; Kakabakos, S. Fast, sensitive and selective determination of herbicide glyphosate in water samples with a White Light Reflectance Spectroscopy immunosensor. Talanta 2020, 214, 120854. [Google Scholar] [CrossRef]
  59. Dolan, T.; Howsam, P.; Parsons, D.J.; Whelan, M.J. Is the EU drinking water directive standard for pesticides in drinking water consistent with the precautionary principle? Environ. Sci. Technol. 2013, 47, 4999–5006. [Google Scholar] [CrossRef]
  60. Wang, D.D.; Zhao, Y.; Guo, H.M. Magnetic polydopamine modified with deep eutectic solvent for the magnetic solid-phase extraction of sulfonylurea herbicides in water samples. J. Chromat. 2019, 1601, 53–59. [Google Scholar] [CrossRef]
  61. Tyagi, R.; Jacob, J. Design and synthesis of water-soluble chelating polymeric materials for heavy metal ion sequestration from aqueous waste. React. Funct. Polym. 2020, 154, 104687. [Google Scholar] [CrossRef]
  62. Sun, Y.; Cao, M.; Wan, Y.; Wang, H.; Liu, J.; Pan, F.; He, Z. Spatial variation of 2, 4-D and MCPA in tap water and groundwater from China and their fate in source, treated, and tap water from Wuhan, Central China. Sci. Total Environ. 2020, 727, 138691. [Google Scholar] [CrossRef] [PubMed]
  63. Jehan, S.S.A.; Khattak, S.; Muhammad, L. Human health risks by potentially toxic metals in drinking water along the Hattar Industrial Estate, Pakistan. Environ. Sci. Poll. Res. 2019, 27, 2677–2690. [Google Scholar] [CrossRef] [PubMed]
  64. Masood, N.; Farooqi, A.; Zafar, M.I. Health risk assessment of arsenic and other potentially toxic elements in drinking water from an industrial zone of Gujrat, Pakistan: A case study. Environ. Monit. Assess. 2019, 191, 95. [Google Scholar] [CrossRef]
  65. Jabeen, S.; Shah, M.T.; Ahmed, I.; Khan, S.; Hayat, M.Q. Physico-chemical parameters of surface and ground water and their environmental impact assessment in the Haripur Basin, Pakistan. J. Geochem. Exp. 2014, 138, 1–7. [Google Scholar] [CrossRef]
  66. Sarvestani, R.A.M.; Aghasi, M. Health risk assessment of heavy metals exposure (lead, cadmium, and copper) through drinking water consumption in Kerman city, Iran. Environ. Earth Sci. 2019, 78, 714. [Google Scholar] [CrossRef]
  67. Momot, O.; Synzynys, B. Toxic aluminium and heavy metals in groundwater of middle Russia: Health risk assessment. Int. J. Environ. Res. Public Health 2005, 2, 214–218. [Google Scholar] [CrossRef]
  68. Harvey, P.J.; Handley, H.K.; Taylor, M.P. Widespread copper and lead contamination of household drinking water, New South Wales, Australia. Environ. Res. 2016, 151, 275–285. [Google Scholar] [CrossRef]
  69. Ng, D.Q.; Lin, Y.P. Evaluation of lead release in a simulated lead-free premise plumbing system using a sequential sampling approach. Int. J. Environ. Res. Public Health 2016, 13, 266. [Google Scholar] [CrossRef] [Green Version]
  70. Triantafyllidou, S.; Burkhardt, J.; Tully, J. Variability and sampling of lead (Pb) in drinking water: Assessing potential human exposure depends on the sampling protocol. Environ. Int. 2021, 146, 106259. [Google Scholar] [CrossRef]
  71. Lobo, G.P.; Kalyan, B.; Gadgil, A.J. Electrochemical deposition of amorphous aluminum oxides on lead pipes to prevent lead leaching into the drinking water. J. Hazard. Mat. 2021, 423, 127195. [Google Scholar] [CrossRef] [PubMed]
  72. Hu, G.; Mian, H.R.; Dyck, R.; Mohseni, M.; Jasim, S.; Hewage, K.; Sadiq, R. Drinking Water treatments for arsenic and manganese removal and health risk assessment in White Rock, Canada. Exp. Health 2020, 12, 793–807. [Google Scholar] [CrossRef]
Figure 1. Location map showing sampling sites in the study area.
Water 14 03787 g001
Table 1. Laboratory detection limits and relevant details for selected constituents.
ParameterReference MethodDetection Limit (mg/L)Measurement Uncertainty
CalciumAPHA, 23rd Edition2.0±2%
ChloridesAPHA, 23rd Edition2.0±2%
MagnesiumAPHA, 23rd Edition1.0±3%
Total hardnessAPHA, 23rd Edition--
Heavy metals APHA, 23rd Edition--
Table 2. Comparative analysis of the physico-chemical attributes of drinking water samples.
LocationSitespHEC (µS/cm)TH (mg/L)
Peoples ColonyS17.78 ± 0.34297 ± 1.2340 ± 1.23
S27.56 ± 0.23377 ± 2.4348 ± 1.45
Master CityS17.38 ± 0.121040 ± 3.21134 ± 0.90
S27.44 ± 0.09778 ± 2.31102 ± 0.76
Ajwa CityS17.27 ± 0.04759 ± 3.8998 ± 0.45
S27.12 ± 0.15942 ± 3.16180 ± 0.43
Green TownS17.47 ± 0.09602 ± 3.1978 ± 0.78
S27.33 ± 0.05523 ± 2.6770 ± 0.87
Kotli GondiawaliS17.08 ± 0.08871 ± 1.23116 ± 0.89
S27.09 ± 0.031020 ± 2.78138 ± 1.34
EC = electrical conductivity; TH = total hardness.
Table 3. Comparative analysis of the inorganic contents (mg/L) of drinking water samples.
LocationSitesCa ContentsMg ContentsCl Contents
Peoples ColonyS122 ± 1.2118 ± 0.9826 ± 1.34
S226 ± 0.9422 ± 0.8130 ± 1.21
Master CityS170 ± 0.7664 ± 0.5680 ± 1.78
S250 ± 0.4552 ± 1.2160 ± 0.67
Ajwa CityS146 ± 0.2152 ± 1.0964 ± 0.98
S266 ± 0.8564 ± 1.5672 ± 0.78
Green TownS140 ± 0.1238 ± 0.7846 ± 0.71
S236 ± 0.4834 ± 0.8140 ± 0.89
Kotli GondiawaliS160 ± 0.6556 ± 0.5678 ± 0.56
S268 ± 0.6170 ± 0.7884 ± 0.67
Table 4. Comparative analysis of metal contents (mg/L) of drinking water samples.
LocationSitesFe ContentsZn ContentsCr Contents Pb Contents
Peoples ColonyS10.06 ± 0.010.90 ± 0.090.01 ± 0.010.03 ± 0.02
S20.05 ± 0.021.31 ± 0.040.02 ± 0.010.02 ± 0.01
Master CityS10.09 ± 0.042.83 ± 0.120.05 ± 0.010.04 ± 0.02
S20.05 ± 0.012.11 ± 0.180.03 ± 0.010.04 ± 0.01
Ajwa CityS10.08 ± 0.012.07 ± 0.140.04 ± 0.010.05 ± 0.02
S20.07 ± 0.021.93 ± 0.030.03 ± 0.020.03 ± 0.01
Green TownS10.05 ± 0.011.41 ± 0.120.03 ± 0.010.04 ± 0.01
S20.04 ± 0.011.63 ± 0.080.02 ± 0.010.01 ± 0.01
Kotli GondiawaliS10.11 ± 0.032.11 ± 0.040.03 ± 0.010.03 ± 0.02
S20.05 ± 0.042.73 ± 0.060.06 ± 0.020.05 ± 0.02
Table 5. Summary of detected herbicide on the basis of peak area (%) using GC-MS in the drinking water samples.
S/NChemical NameSubstance GroupPeoples Colony Master City Ajwa CityGreen TownKotli Gondiawali
S1S2S1S2S1S2S1S2S1S2
12,4-DB methyl esterChlorophenoxyacid˗˗1.36˗˗˗˗˗˗˗
24-IsopropylanilineDinitroaniline0.97˗0.560.75-0.52˗˗0.180.14
3BeflubutamidAmide˗˗˗˗˗˗2.59˗˗˗
4BromobutideAmide0.95˗2.111.38˗˗1.921.49˗˗
5CarbetamideCarbamate0.95˗3.30.58˗˗1.921.490.910.16
6ChloranocrylAnilide3.74˗0.88˗˗˗˗1.260.20.28
7CycloateThiocarbamate0.62˗0.35˗˗˗˗˗˗˗
8Desbromo-bromobutideAmide˗˗3.3˗˗˗˗0.573.463.7
9DichlormidUnclassified˗˗˗1.2˗˗˗1.01˗˗
10DimepiperateThiocarbamate0.95˗3.30.58˗˗0.710.570.910.16
11Dinoseb acetateDinitrophenol˗6.743.031.666.742.522.362.062.25˗
12EPTCThiocarbamate0.65˗˗˗˗˗˗˗˗˗
13FlurtamonePyridazinone˗˗˗˗˗˗˗˗˗0.19
14IsocarbamideAmide0.77˗˗0.4˗˗0.54˗˗˗
15MCPB methylester Aryloxyalkanoic acid˗˗1.36˗˗˗1.44˗˗˗
16MethoprotryneTriazine0.89˗˗˗˗˗1.233.380.52˗
17MonalideAnilide0.8˗0.350.32˗˗0.480.710.680.35
18PebulateThiocarbamate0.65˗˗˗˗˗˗˗˗˗
19PropachlorChloroacetamide0.97˗0.560.75˗0.52˗˗0.180.14
20TebutamBenzamide0.995.073.941.539.416.890.711.790.912.26
21ThiazopyrPyridine1.32˗˗˗˗˗˗˗˗˗
Table 6. Summary of detected fungicides and acaricides on the basis of peak area (%) using GC-MS in the drinking water samples.
S/NChemical NameSubstance GroupPeoples Colony Master CityAjwa City Green TownKotli Gondiawali
S1S2S1S2S1S2S1S2S1S2
1BinapacrylDinitrophenol1˗0.220.47˗˗˗1.220.160.25
2Bitertanol 1Triazole˗˗˗˗˗˗˗0.270.420.41
3Bitertanol 2 Triazole˗˗˗˗˗˗˗˗0.42˗
4CaptanPhthalimide˗˗1.25˗˗˗˗˗˗˗
5CymoxanilCyanoacetamide oxime0.69˗˗˗˗˗0.54˗˗˗
6CyprofuramAnilide2.58˗˗˗˗˗1.280.610.430.48
7Dinocap 1Dinitrophenol2.58˗0.580.32˗˗0.450.930.550.47
8Dinocap 2 Dinitrophenol˗˗0.581˗5.211.240.350.210.22
9Dinocap 3 Dinitrophenol1.51˗0.290.39˗5.210.870.930.550.47
10Dinocap 4Dinitrophenol1.44˗0.220.39˗5.211.240.350.210.28
11IprobenfosOrganophosphate˗5.29˗˗˗3.42.763.06˗˗
12MepronilBenzanilide˗˗˗˗˗˗0.71˗˗˗
13o-PhenylphenolPhenol˗˗0.290.34˗˗˗0.27˗0.41
14OxadixylPhenylamide˗˗˗˗˗3.75˗˗˗˗
15PhthalideUnclassified˗˗˗˗˗˗˗˗0.440.3
16TriadimefonTriazole˗˗0.350.41˗˗0.580.63˗0.31
Table 7. Summary of detected insecticides on the basis of peak area (%) using GC-MS in the drinking water samples.
S/NChemical NameSubstance GroupPeoples Colony Master City Ajwa City Green TownKotli Gondiawali
S1S2S1S2S1S2S1S2S1S2
1Chlordene, trans-Organochlorine˗˗0.640.5˗˗0.70.36˗0.63
2Cyanofenphosphosphonothioate˗˗0.94˗˗˗˗0.550.830.92
3Cypermethrin IV Pyrethroid˗˗˗˗˗˗˗˗˗0.18
4DemephionOrganophosphate˗˗˗0.49˗˗0.890.41˗˗
5Demeton-SOrganophosphate˗˗˗0.71˗˗˗˗˗˗
6Demeton-S-methylOrganophosphate˗˗0.83˗˗˗1.23˗0.84˗
7Diethyl phthalateBenzoic acid esters˗˗˗˗˗3.31˗˗ ˗
8DisulfotonOrganophosphate˗˗0.831.1˗˗1.23˗0.84˗
9IsoxathionOrganophosphate˗5.69˗˗5.69˗˗˗˗˗
10MethomylCarbamate0.59˗0.840.995.053.751.30.170.640.2
11N,N-Diethyl-m-toluamideUnclassified˗˗0.760.58˗˗˗0.57˗0.72
12PropoxurCarbamate0.55˗0.40.38˗˗0.420.420.420.42
13ThiometonOrganophosphate˗˗0.830.71˗˗1.23˗0.84˗
14TrichlorfonOrganophosphate˗˗˗0.76˗˗˗˗˗˗
15TrifenmorphMorpholine derivative˗˗0.4˗˗˗˗˗0.440.3
16VamidothionOrganophosphate˗˗˗˗˗˗4.07˗˗˗
Table 8. Summary of detected plant growth regulators on the basis of peak area (%) using GC-MS in the drinking water samples.
S/NChemical NameSubstance GroupPeoples Colony Master City Ajwa City Green TownKotli Gondiawali
S1S2S1S2S1S2S1S2S1S2
12-(1-naphthyl) acetamideAuxin0.77˗0.290.4˗˗0.540.270.42˗
22-[3-Chlorophenoxy] propionamideChlorophenoxy acid or ester˗˗˗˗˗˗˗˗0.13˗
3AncymidolPyrimidinyl carbinol1.32˗˗˗˗˗˗˗˗˗
4CarvonePlant derived˗˗˗˗˗˗˗˗0.24˗
5DicyclopentadieneHydrocarbon˗˗0.640.5˗˗0.70.360.680.63
6Prohydrojasmon ISynthetic jasmonate˗˗˗˗˗˗˗˗0.21˗
7Prohydrojasmon II Synthetic jasmonate0.62˗0.35˗˗˗˗˗˗0.18
Table 9. Summary of detected plasticizers and other compounds based on peak area (%) using GC-MS in the drinking water samples.
S/NChemical NameSubstance GroupPeoples Colony Master City Ajwa City Green TownKotli Gondiawali
S1S2S1S2S1S2S1S2S1S2
11,2-Dibromo-3-chloropropaneHalogenated alkane˗˗˗0.8˗˗˗˗˗˗
22-(2-Butoxyethoxy) ethyl thiocyanCyclic aromatic1.40˗0.290.51˗2.97˗0.21˗0.22
32-ethyl-6-methylanilineUnclassified0.97˗0.560.75˗˗0.52˗0.180.14
43-IndolylacetonitrilePhytoalexins tend to fall into several classes including terpenoids, glycosteroids and alkaloids˗˗˗˗˗˗˗˗0.13˗
54,4′-OxydianilineEther derivative of Aniline˗˗˗˗˗˗˗˗0.83˗
64-Chloro-2-methylanilineUnclassified0.77˗˗˗˗˗˗˗˗0.41
74-Chloro-3-methylphenolphenol˗˗˗0.4˗˗0.54˗˗˗
8Benzo(a)anthraceneUnclassified1.32˗˗1.47˗˗1.141.360.6˗
9BenzophenoneAromatic Ketone1.8˗˗2.33˗˗˗2.512.69˗
10Bis(2-ethylhexyl) phthalateUnclassified˗˗˗1.36˗4.46˗2.71.391.22
11Cashmeranalicyclic ketone14.6˗16.57.493.9910.28.235.369.6711.06
12Chrysenearomatic hydrocarbon in coal tar˗˗˗1.47˗˗1.141.360.6˗
13Cyclopentadecanonesaturated alicyclic ketone˗˗˗˗˗˗˗0.470.380.18
14Diamyl phthalateUnclassified0.84˗˗3.11˗˗2.981.13.611.11
15Dicyclohexyl phthalateTransitional Phthalate Esters group˗˗˗1.36˗4.46˗˗1.391.22
16Diisobutyl phthalateUnclassified2.48˗0.543.11˗4.462.983.023.613.39
17Di-n-butylphthalateUnclassified0.84˗˗1.13˗˗0.971.13.611.11
18Di-n-hexyl phthalateUnclassified2.48˗2.681.13˗3.31˗˗˗1.11
19Di-n-octyl phthalatePhthalate ester˗˗˗˗˗˗˗1.1˗1.22
20Di-n-propyl phthalateUnclassified2.48˗˗˗˗˗2.983.02˗3.39
21EthylenethioureaThiourea˗˗˗1.47˗˗1.141.360.52˗
22Exaltolide [15-Pentadecanolide]a natural macrolide lactone and a synthetic musk˗˗˗˗˗˗˗0.480.350.18
23NaphthaleneAromatic hydrocarbon0.65˗˗˗˗˗˗˗˗˗
24N-Methyl-N-1-naphthyl acetamideUnclassified˗˗˗˗˗˗˗˗0.83˗
25PCB 30Unclassified˗˗˗˗˗˗˗˗0.52˗
26SpirodiclofenTetronic Acid˗˗˗˗˗˗˗˗˗0.35
27Tetrahydrophthalimide, Unclassified˗˗1.25˗˗˗˗˗˗˗
28TonalideTetralin˗˗0.4˗˗˗˗˗0.440.3
29Triethylphosphatephosphoric acid, triethyl ester˗˗˗˗˗˗˗˗0.13˗
30Tris(2-ethylhexyl) posphatePhosphoric Acid ester˗˗˗˗˗˗0.54˗˗˗
Table 10. Hazard quotient and hazard indices for adults and children.
Sampling PointsHazard Quotient (HQ)Hazard Indices (HI)
CrZnPbMgClAdultChild
AdultChildAdultChildAdultChildAdultChildAdultChild
Peoples ColonyS12.78 × 10−33.06 × 10−38.33 × 1001.83 × 10−15.56 × 10−56.12 × 10−51.29 × 10−23.93 × 10−27.22 × 1007.95 × 1001.56 × 10+18.18 × 100
S25.56 × 10−36.12 × 10−31.20 × 10+12.65 × 10−11.11 × 10−41.22 × 10−41.57 × 10−24.81 × 10−28.33 × 1009.17 × 10+12.04 × 10+19.49× 100
Master CityS11.39 × 10−21.53 × 10−22.59 × 10+15.71 × 10−12.50 × 10−42.75 × 10−44.57 × 10−21.40 × 10−12.22 × 10+12.45 × 10+14.82 × 10+12.52 × 10+1
S28.33 × 10−39.17 × 10−31.94 × 10+14.28 × 10−11.94 × 10−42.14 × 10−43.71 × 10−21.14 × 10−11.67 × 10+11.83 × 10+13.62 × 10+11.89 × 10+1
Ajwa CityS11.11 × 10−21.22 × 10−21.85 × 10+14.08 × 10−11.67 × 10−41.83 × 10−43.71 × 10−21.14 × 10−11.78 × 10+11.96 × 10+13.63 × 10+12.01 × 10+1
S28.33 × 10−39.17 × 10−31.76 × 10+13.87 × 10−12.22 × 10−42.45 × 10−44.57 × 10−21.40 × 10−12.00 × 10+12.20 × 10+13.76 × 10+12.26 × 10+1
Green TownS18.33 × 10−39.17 × 10−31.30 × 10+12.85 × 10−11.94 × 10−42.14 × 10−42.71 × 10−28.30 × 10−21.28 × 10+11.41 × 10+12.58 × 10+11.44 × 10+1
S25.56 × 10−36.12 × 10−31.48 × 10+13.26 × 10−11.39 × 10−41.53 × 10−42.43 × 10−27.43 × 10−21.11 × 10+11.22 × 10+12.60 × 10+11.26 × 10+1
Kotli GondiawaliS11.67 × 10−31.83 × 10−21.94 × 10+14.28 × 10−11.67 × 10−41.83 × 10−44.00 × 10−21.22 × 10−12.17 × 10+12.39 × 10+14.12 × 10+12.44 × 10+1
S28.33 × 10−39.17 × 10−32.50 × 10+15.50 × 10−13.06 × 10−43.36 × 10−45.00 × 10−21.53 × 10−12.33 × 10+12.57 × 10+14.84 × 10+12.64 × 10+1
Table 11. Comparison of studied variables with various permissible limits in drinking water.
VariablesCurrent StudyPak-EPA [30]WHO [31]
pH7.12–7.786.5–8.56.5–8.5
EC (µS/cm)297–10402500-
Total Hardness (mg/L)40–180500500
Ca Contents (mg/L)22–707575
Mg Contents (mg/L)18–7015050
Cl Contents (mg/L)26–84250200
Fe Contents (mg/L)0.05–0.118.001.50
Zn Contents (mg/L)0.90–2.833.005.00
Cr Contents (mg/L)0.01–0.060.050.05
Pb Contents (mg/L)0.01–0.060.01 0.05
Table 12. Permissible limits of pesticides in drinking water.
PesticidesWHO (mg/L)US-EPA (mg/L)ISI (µg/L)
DDT--42
Aldrin 0.0003-17
Dieldren 0.0003-17
Endrin-0.0021
Chlordane--3
Lindane--56
Heptachlor--18
Methoxychlor0.0200.04035
Heptachlor-epoxide--18
Organic-phosphate--100
Toxaphene--5
Carbamate--100
Methoxychlor 0.020--
Bentazon 0.30--
Chlorotoluron 0.03--
Pyradite 0.10--
1,2-dicholoropropane 0.04--
Polyaromatic hydrocarbons 0.01--
Atrazine -0.003-
Toluene -1000-
Xylenes (total) -10-
Ethyl-benzene -0.700-
Styrene -0.1000-
Chlorobenzene -0.1-
Benzene -Zero-
Oxamyl-0.200-
1,2 dichloropropane -Zero-
o-Dichlorobenzene -0.600-
p-Dichlorobenzene -0.075-
Ethylbenzene -0.700-
Vinyl chloride -0.002-
Chloride -250-
Glyphosate-0.700-
ISI = Indian Standard Institution.
Publisher’s Note: MDPI stays neutral with regard to jurisdictional claims in published maps and institutional affiliations.

