Article

Baseflow Persistence and Magnitude in Oil Palm, Logged and Primary Tropical Rainforest Catchments in Malaysian Borneo: Implications for Water Management under Climate Change

1
Faculty of Tropical Forestry, Universiti Malaysia Sabah, Jalan UMS, Kota Kinabalu 88450, Sabah, Malaysia
2
Department of Geography, Wallace Building, Swansea University, Singleton Park, Swansea SA2 8PP, UK
3
Faculty of Science and Natural Resources, Universiti Malaysia Sabah, Jalan UMS, Kota Kinabalu 88450, Sabah, Malaysia
4
The University of Tokyo Hokkaido Forest, The University of Tokyo Forests, Graduate School of Agricultural and Life Sciences, The University of Tokyo, 9-61 Yamabe Higashimachi, Furano 079-1563, Japan
5
Centre for Environmental Sustainability and Water Security (IPASA), Research Institute for Sustainable Environment (RISE), Block C07, Level 2, Universiti Teknologi Malaysia, Johor Bahru 81310, Johor, Malaysia
6
Georgina Mace Centre, Department of Life Sciences, Imperial College London, Ascot SL5 7PY, UK
7
Southeast Asia Rainforest Research Partnership (SEARRP), Danum Valley Field Centre, P.O. Box 60282, Lahad Datu 91112, Sabah, Malaysia
*
Authors to whom correspondence should be addressed.
Water 2022, 14(22), 3791; https://doi.org/10.3390/w14223791
Submission received: 4 October 2022 / Revised: 6 November 2022 / Accepted: 11 November 2022 / Published: 21 November 2022

Abstract

:
While timber harvesting has plateaued, repeat-logging and conversion into plantations (especially oil palm) are still active in the tropics. The associated hydrological impacts especially pertaining to enhanced runoff, flood, and erosion have been well-studied, but little attention has been given to water resource availability in the humid tropics. In the light of the increasing climate extremes, this paper compared baseflow values and baseflow recession constants (K) between headwater catchments of five differing land-uses in Sabah, Malaysian Borneo, namely primary forest (PF), old growth/virgin jungle reserve (VJR), twice-logged forest with 22 years regeneration (LF2), multiple-logged forest with 8 years regeneration (LF3), and oil palm plantation (OP). Hydrological and meteorological sensors and dataloggers were established in each catchment. Daily discharge was used for computing K via four estimation methods. Catchment ranks in terms of decreasing K were VJR (0.97841), LF3 (0.96692), LF2 (0.90347), PF (0.83886), and OP (0.86756). Catchment ranks in terms of decreasing annual baseflow were PF (1877 mm), LF3 (1265 mm), LF2 (812 mm), VJR (753 mm), and OP (367 mm), corresponding to 68%, 55%, 51%, 42%, and 38% of annual streamflow, respectively. Despite the low K, PF had the highest baseflow magnitude. OP had the fastest baseflow recession and lowest baseflow magnitude. Baseflow persistence decreased with increasing degree of disturbance. K showed strong association to catchment stem density instead of basal area. For dynamic catchments in this study, the Kb3 estimator is recommended based on its lowest combination of coefficient of variation (CoV) and root mean squared error (RMSE) of prediction. For wetter catchments with even shorter recession events, the Kb4 estimator may be considered. Regarding climate change, logging and oil palm agriculture should only be conducted after considering water resource availability. Forests (even degraded ones) should be conserved as much as possible in the headwaters for sustainable water resource.

1. Introduction and Brief Review

Evaluating and understanding the hydrological and water resource consequences of land-use and land management changes together with current and future predicted climatic change constitute major challenges. In the wet tropics these challenges are particularly difficult because of the scale, pace, and complexity of land-use change and management, and the uncertainties as to how key hydrological processes (especially transpiration, interception, and infiltration), and the different vegetational factors and climatic factors influencing them may respond to (or, in the case of climatic factors, be involved in) the climatic changes. The current study is focused on the impacts of land-use change on baseflow and baseflow recession in a wet tropical environment and the following review section provides a brief overview of previous studies and identifies some key research gaps tackled by the paper.
In the humid tropics, as in other parts of the world, it is well-established by paired small-catchment studies (including a forest control catchment) astride of disturbance that forest logging and forest conversion to other land-uses have major hydrological consequences for river flow and evapotranspiration (ET) [1,2,3,4,5,6]. Although, in general, total river flow and the stormflow component have increased and the evapotranspiration components and the baseflow component have decreased, the magnitudes of increases and decreases vary greatly, as do temporal patterns of change in terms of times for recovery (in cases of log-and-leave), and over growth life cycles (for replacement covers) (see detailed reviews of Douglas [5,6]). For logging, factors influencing the magnitude and duration of hydrological impact upon water balance components include logging type (clearfelling or selective logging), logging practices and management (including roads), and, in the case of selective logging, the intensity of logging. With forest conversion, additional factors are found by influencing hydrological response to include the type of replacement land-use and its land management practices, the nature of the land preparation, and planting phase, vegetation biomass, height and structure over the replacement land cover’s lifecycle, the density and nature of any roads and tracks, and, in the case of tree crops and tree plantations, the degrees of ground cover and soil compaction on slopes by labour and machinery, and the frequency and nature of replanting phases.
Recently, there have been major advances achieved by an upsurge in large catchment studies, notably in Amazonia [7,8,9,10] and Indonesia [11], assessing water budget responses to land-use and climate change using a combination of long-term river flow and rainfall records and spatiotemporal records of changes in land-use and forest character and extent derived from repeat remote sensing imagery [12]. In the case of the Xingu catchment, it was demonstrated that over the period 1976–2015 river flow remained unchanged, because large-scale conversion of rainforest to pasture and soybean (low vegetation types with low evapotranspiration) meant that a reduction in rainfall of 245 mm was offset by a large fall in evapotranspiration [9,11]. In Indonesia, the relative contributions of land-use change (mainly to oil palm) and rainfall decline to the water budget of the Bengawasan Solo River were able to be quantified [11]. Although most studies continue to consider evapotranspiration as a whole rather than considering transpiration and interception, the pioneer study by Fan et al. [13] has included separate consideration of interception in their modelling of evapotranspiration in catchments that are partly rainforest and partly oil palm in Indonesia. Other important recent studies have demonstrated the higher evapotranspiration of oil palm than rainforest (in contrast to the reductions recorded by most other replacement land-uses), with consequences of steeper falls in baseflow of streams in the 2015 ENSO event [14] and the changes in transpiration over the life-cycle of oil palm trees and hence also plantations [15]. Advances have also been made in incorporating heterogeneity of infiltration capacity into modelling of hydrological impacts of agricultural land-use change [16].
Most small catchment studies in the wet tropics, such as the Sungei Tekam paired catchment of forest conversion to oil palm and cocoa in Pahang, Malaysia [3,4], assessed impacts on the baseflow and stormflow components, total discharge, and (by subtraction of river flow from rainfall) evapotranspiration. There are some key limitations and research gaps that apply to most of these studies: (1) Impacts on baseflow recession curves have not been systematically explored, unlike in some studies outside the wet tropics [17,18,19]. This may be because of the ever-wet climate, which means that most dry periods and recessions are short, and low flows not viewed as a water resource problem; (2) Most studies are relatively short (<10 years) and do not cover the lifecycles of replacement tree crops, forest plantations, or of forest recovery from logging; (3) There is an absence of studies of catchments that have experienced multiple logging or multiple land-use change; (4) Evapotranspiration components, infiltration and runoff on slopes and from roads and tracks are rarely measured in parallel studies, hence the reasons for changes tend to be imprecise and inconclusive. Additionally, although there have been many studies of associated hydrological impacts of land-use changes covering hydrological pathways [20], aboveground hydrology [21,22], streamflow dynamics [1,23], erosion [2,24,25,26], and stream ecology [27,28], in various land-use changes, recovery phases, and hydrometeorological conditions [29,30,31,32,33,34], they have seldom been used in explaining changes in baseflow and the water budget. Most of these key limitations and research gaps (apart from length of studies) identified above relating to small catchment studies, also apply to the recent large catchment research, with baseflow persistence and dynamics receiving little attention.
The aims of the current study are to explore the differences in baseflow and, in particular, baseflow recession constant values for five catchments with contrasting histories of logging and conversion to oil palm in a very wet tropical area in the interior of Sabah, Malaysian Borneo. The paper addresses the first three of the research gaps identified in the short review, namely (1) the paucity of studies in the ever-wet tropics focusing directly on baseflow and baseflow recession, (2) the paucity of baseflow and water balance research focusing on catchments a long time after forest conversion, and (3) the lack of baseflow and water budget research for catchments that have undergone and are recovering from multiple phases of disturbance and/or conversion. The five catchments studied comprised two primary or near-primary forest catchments, a twice-selectively-logged catchment, a multiple-selectively-logged catchment and a ~20-year-old oil palm catchment. These land-use and logging histories were selected because repeat-logging and conversion to oil palm are spatially important not only within Sabah [29], but throughout ever-wet parts of SE Asia and the global tropics [35,36,37,38,39,40,41].
The objectives of the paper are (1) to apply and compare the performance of different estimators of the baseflow recession constant; (2) to assess, compare, and explain differences in values of baseflow recession constant for the five catchments; (3) using all available flow data over the period December 2011–August 2013, to derive, compare, and interpret values of baseflow magnitude per unit area and baseflow as a percentage of total discharge for the five catchments. The research reported here forms part of a larger experiment exploring hydrological, erosional, and sediment transport impacts of varying land-use change and recovery in the study area. Previous publications have focused on suspended sediment and storm discharge [1,2].

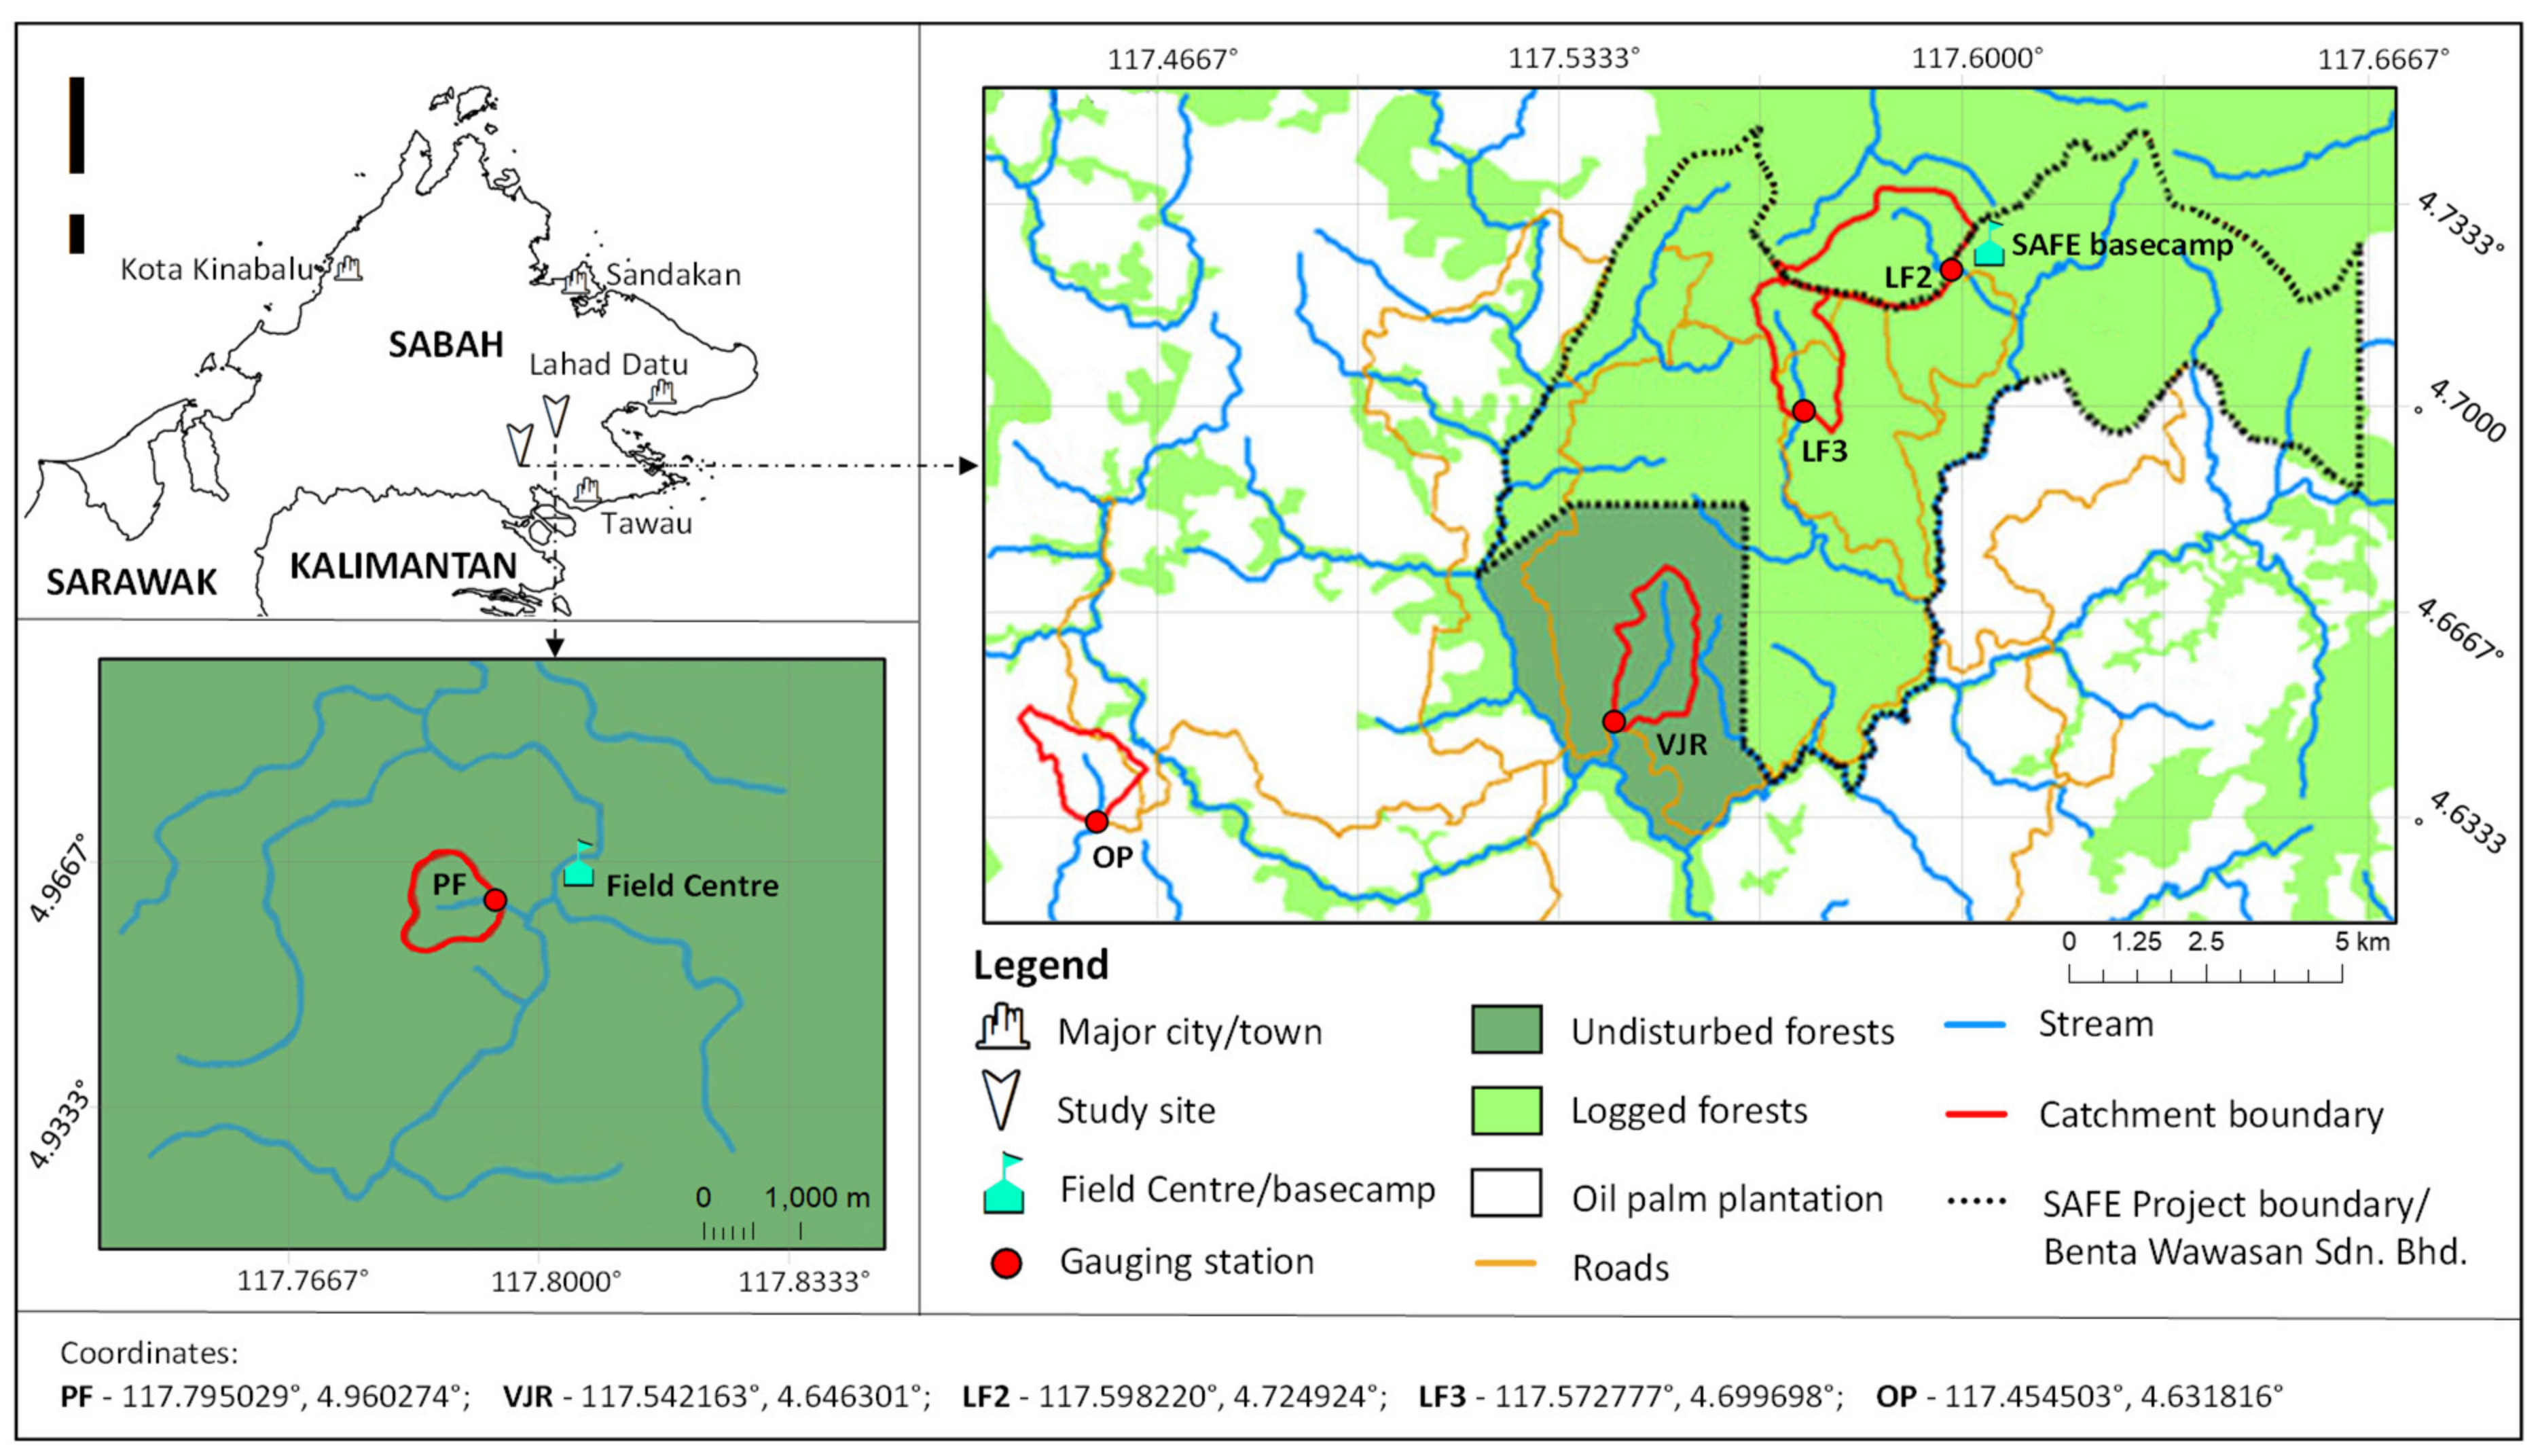
2. Experimental Design and Study Area

In Southeastern inland Sabah, five headwater catchments with differing degree of disturbance and recovery were monitored and compared (Figure 1). The different land-uses are primary forest (PF), virgin jungle reserve/old-growth forest (VJR), twice-logged and recovering forest (LF2), multiple-logged and recovering forest (LF3), and oil palm plantation (OP). All catchments were selected to be as close as possible in terms of catchment size (1.7–4.64 km2) and characteristics. The PF (1.7 km2) is an undisturbed primary forest catchment nested within the 438 km2 Danum Valley Conservation Area (DVCA). The VJR (3.08 km2) is largely undisturbed and resembles a primary forest, but minimal clearing was completed near the catchment boundary to build an access road. The LF2 (4.64 km2) was first logged in the 1970s, extracting an average of 113 m3 km−2, followed by a second round of logging in the 1990s extracting 37 m3 km−2. The LF3 (2.78 km2) was also first logged in the 1970s (113 m3 km−2 extraction), followed by three more rounds between 1990 and 2004 extracting 26, 22, and 18 m3 km−2, respectively. The LF2 and LF3 have been regenerating since cessation of logging and they are characterised by fast-growing pioneer species such as Macaranga. However, the LF2 has a higher count of taller trees and more extensive canopy cover due to fewer rounds of logging whereas the LF3 has more understorey and fewer canopy trees—evident in leaf area index (LAI), aboveground biomass (AGB), and tree density (Table 1). The OP (3.27 km2) is a mature (20 years old) oil palm plantation with bench-terracing and extensive dirt roads. All forested catchments are (or were originally) lowland-dipterocarp forest with the exception of VJR that has upland-ultramafic forests in the higher reaches. The OP catchment is planted with Elaeis guineensis. More information on vegetation is available in past investigations [42,43].
With regards to lithology, the PF, LF2, LF3, and OP are of Oligocene to Middle Miocene rocks of the Kuamut and Kalabakan formations, comprising a mélange of sedimentary and volcanic rocks, including slump breccia and interbedded mudstones, tuffs, tuffaceous sandstones, shale, conglomerate, chert, and limestones [44]. The VJR catchment is composed of Cretaceous to Early Tertiary igneous and metamorphic rocks (mainly gabbro, dolerite, serpentinite, peridotite, dunite, and pyroxenite) [45] All catchments are mountainous but the VJR has a higher proportion of steeper slopes (Table 1).
The climate is equatorial—hot and humid all year round without a distinct dry or wet season. Long-term averages for rainfall and temperature in the DVCA (near PF) is 2870.3 mm and 27 °C, respectively (1985–2016), whereas in the SAFE area (near VJR, LF2, LF3, and OP), they are 2,398.5 mm and 26 °C, respectively (2011–2016).

3. Methodology

3.1. Data Collection and Processing

In the stream of each catchment, a gauging station comprised a solar-powered “Campbell” datalogger (CR850), water depth (CS450), turbidity (OBS3+), conductivity, and temperature (CS547a) sensors and a 0.2 mm tipping-bucket raingauge (ARG100) recorded data at 5-min intervals. At the PF gauging station, a 120° v-notch sharp crested weir was available. The primary parameter analysed in this study, discharge, was converted from water level via weir equations for PF, and a combination of dilution gauging (low flows) and Manning’s equation (high flows) for VJR, LF2, LF3, and OP. Daily totals of rainfall and discharge were calculated. The same dataset as in Nainar et al. [1], spanning November 2011–August 2013, was used in this study.
To produce the baseflow recession dataset, periods of at least 6 days without appreciable rain (1 mm) were provisionally shortlisted. In each falling limb (consisting of stormflow and baseflow component), baseflow recession was isolated and extracted. Stormflow recession was defined as the steep part of the falling limb immediately after peak discharge until the inflexion point (Figure 2). The baseflow recession was defined as the gentle-sloping, second part of the falling limb that begins from the same inflexion point until just before the next rain event [17,46,47,48]. Theoretically, the inflexion point marks the switchover from stormflow runoff to baseflow—when a catchment is sufficiently drained, and the stream is primarily sustained by subsurface flow and/or groundwater. In total, 37 baseflow recession limbs (7 from PF, 6 from VJR, 10 from LF2, 8 from LF3, and 6 from OP) ranging from three to ten days in length were extracted—henceforth referred to as recession dataset. All baseflow recession limbs were individually inspected and three days was set as the minimum length. The number of samples was low and the recession lengths were short due to: (i) challenges in recording continuous rain-free days in the tropics; and (ii) we have employed a strict data-processing protocol in which any anomaly in one data point (5-min data) will result in the disqualification of whole day’s data. Emphasis was placed on confidence and quality, over quantity. These recession events were used to produce baseflow recession constants, K, which is the main metric assessed in this study.
In addition to K, total baseflow (absolute values and percentage of total discharge) were also presented and discussed. Baseflow throughout the full study period (November 2011 to August 2013; 22 months)—henceforth referred to as the full dataset—was produced by subtracting all quickflow from total discharge. Storm event- and quickflow-baseflow-separation were conducted via the Hewlett–Hibbert technique. Additional information on storm event separation and analyses is given in Nainar et al. [1].

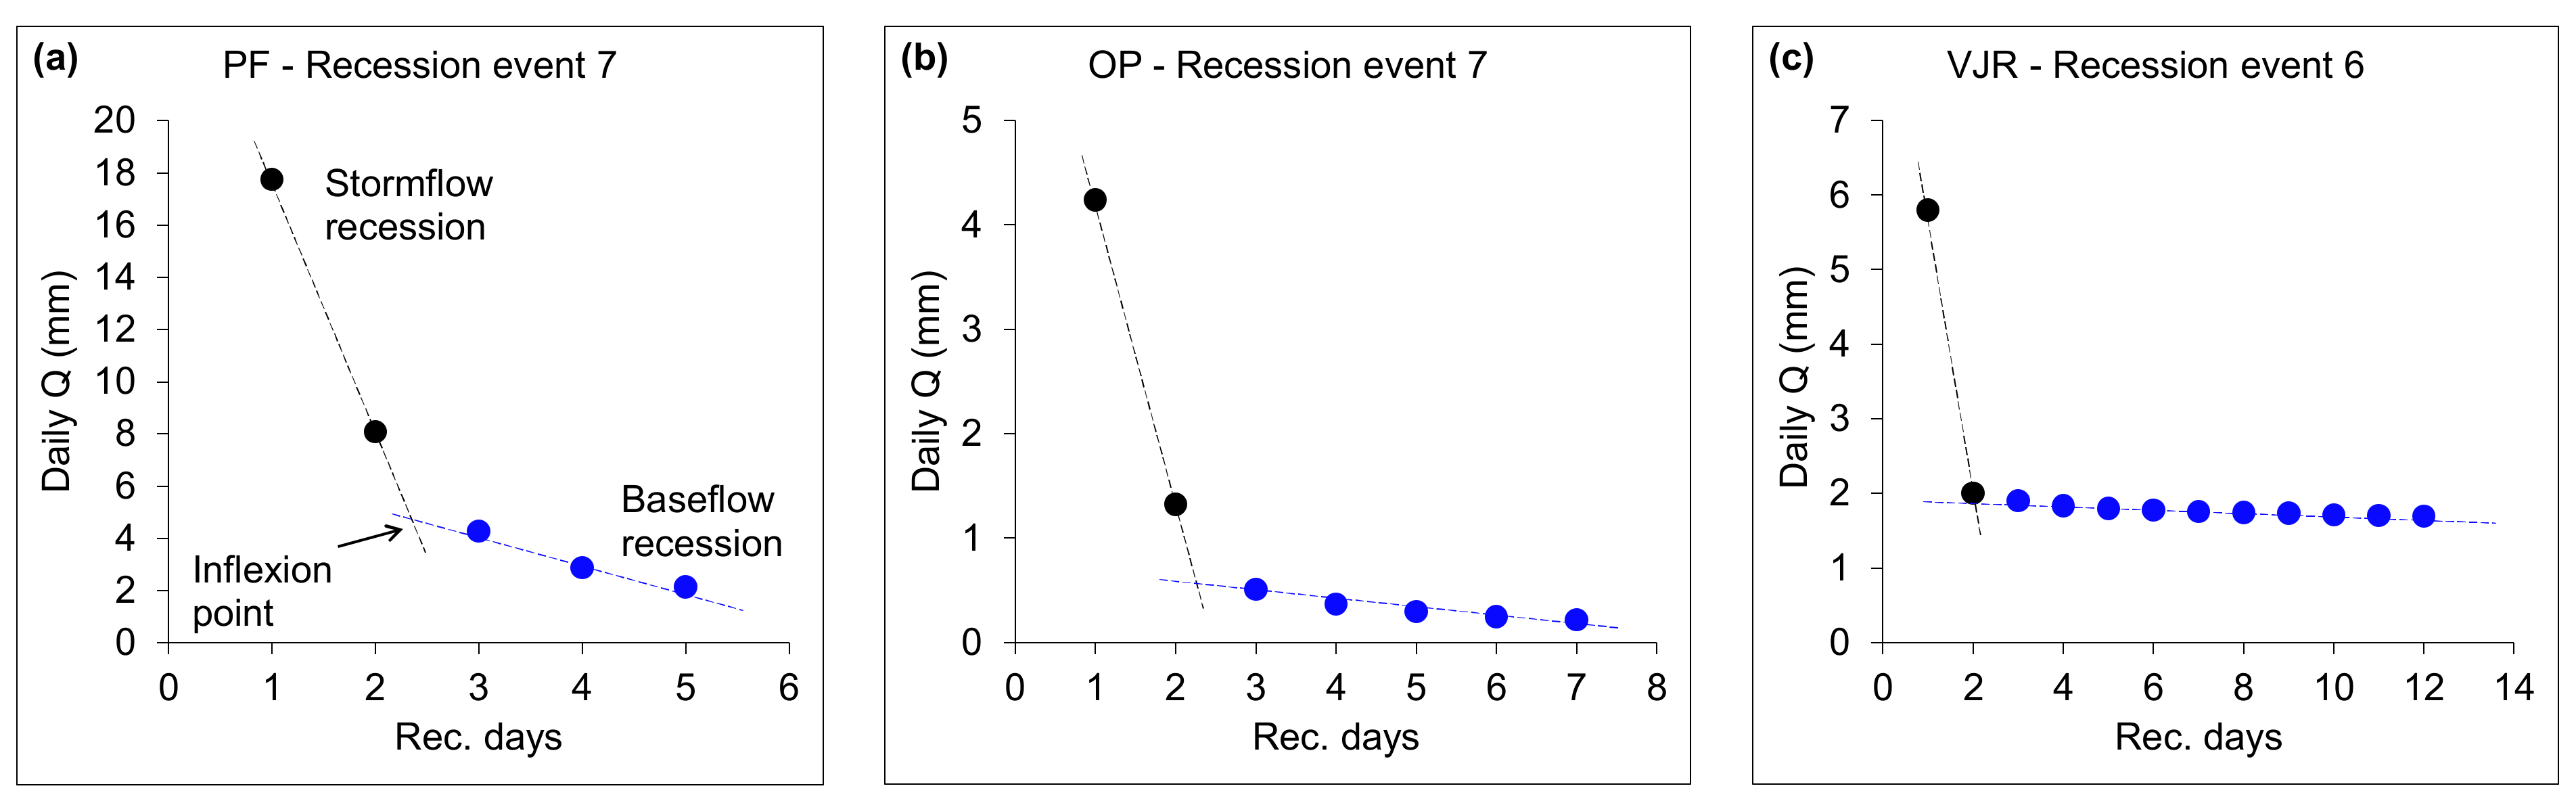
3.2. Baseflow Recession Constant

The baseflow recession constant (K) is a less-explored hydrological component/metric but, historically, has been used in calibrating rainfall-runoff models, modelling surface runoff, fitting stochastic streamflow models, and hydrograph separation [49,50,51,52]. In water-stressed areas with long dry periods, K is useful for forecasting low flows and water resource planning [18,51]. From past experiments in various land-uses, K in any given catchment was affected by moisture conditions, soil drainage properties, and evaporative and transpiration losses, which were ultimately governed by vegetation. Aside from environmental factors, different K estimation methods (linear reservoir, ordinary-least-squares regression, autoregressive, and moving average) resulted in slightly different K-values with varying baseflow-prediction capabilities [17,19,47]. Conceptually, the baseflow recession constant (K) in its simplest form can be expressed as:
B t + 1 = K b B t
where Bt is baseflow on day t and Kb is the baseflow recession constant (decay factor). Equation (1) assumes a linear reservoir theory and is a linear approximation to the unsteady non-linear flow from a large unconfined aquifer [46,53,54]. Adding an error term results in:
B t + 1 = K b B t + ε t + 1
where ԑt are independent normally [55]. Assuming errors in logarithmic scales, Equation (2) can be expressed as:
y t + 1 y t = ln K b + ε t + 1
where yt+1 = ln(Bt+1) and yt = ln(Bt).
Existing studies recommended using linear solutions, citing that they are the most practical approach and that non-linear approaches yielded only marginal benefits [17,55,56,57]. From the three basic equations (Equations (1)–(3)), various estimation procedures for K can be derived [51,55,58]. In this article, four different K estimators (Kb1, Kb2, Kb3, and Kb4) from Vogel and Kroll [55] were used. In brief, Kb1 is derived from Equation (1) by ordinary least squares regression estimation (AR1 model):
K b 1 = t = 1 n 1 B t + 1 B t t = 1 n 1 B t 2
where n is the total number of consecutive baseflow recession data.
Kb2 is derived from the integrated moving average, IMA(0,1,0) model in Equation (3), where in the form of an OLS regression results in:
K b 2 = exp 1 m i = 1 m y t + 1 y t
where yt+1 = ln(Bt+1), yt = ln(Bt), and m is the number of pairs of consecutive baseflow recession observations.
Treating a catchment as a linear reservoir with zero water input during low flows and assuming outflow is directly proportional to basin storage results in the Kb3 estimator. Using the approximations dB/dtBtBt−1 and B ≈ (Bt + Bt−1)/2, the OLS estimator is expressed as:
K b 3 = exp exp 1 m i = 1 m { ln B t 1 B t ln [ 1 2 B t + B t 1 ] }
where Bt is discharge at time t. Fundamentally, the Kb3 estimator regresses the decrease in discharge by mean discharge for all consecutive pairs of observation, then averages a value.
A steady state solution to Equation (3) is:
B t = B 0 K b 6 t e t = 1 n ε
By applying natural logarithms, the resulting traditional regression estimator (Kb4) is obtained:
ln ( B t ) = ln ( B 0 ) + ln ( K b 6 ) t + t = 1 n ε K b 4 = exp ln B t ln B 0 t

3.3. Statistical Analyses

In evaluating the performance of the different K estimators, the coefficient of variation (CoV) and root mean squared error (RMSE) were considered. For RMSE evaluation, computed baseflows were generated by applying catchment-specific average K values to Equation (1). The computed baseflow recessions were then compared with measured baseflow recessions to produce RMSE. After this scrutiny, K-values from the best estimator were compared via the Kruskal–Wallis H test.

4. Results and Analysis

4.1. Evaluation and Selection of K Estimation Methods

4.1.1. Precision (Coefficient of Variation)

The coefficient of variation (CoV) was calculated for all K estimation methods in each stream. LF3 had the lowest CoV, followed by VJR, OP, LF2, and PF (Table 2). Instead of vegetation factors, CoV appeared to show association to channel gradient and slope angle, whereby catchments with steeper slopes have lower CoV and vice-versa.
Between K estimators, Kb1 had the highest CoV; nevertheless, it was still considered low (Table 2). Kb4 produced the lowest CoV for most catchments (except OP). In general, a low CoV is preferred when deciding on the best K estimator for a given area; however, other factors, e.g., the root mean squared error (RMSE) of prediction, need to be considered as well.

4.1.2. Performance of Various K Estimators (Root Mean Squared Error)

Comparing land-uses, RMSE decreased in the order: PF, VJR, LF2, LF3, OP (Table 3). In addition to catchment land-use, RMSE showed an inverse relationship with baseflow recession length (Figure 3).
Among the different K estimators, Kb4 had the highest RMSE of prediction, which is unfavourable. At the same time, Kb4 had the lowest CoV. More emphasis is placed on low RMSE because one of the main uses of K is for forecasting baseflow. In this study, Kb3 is recommended as it is balanced in terms of low CoV and RMSE.

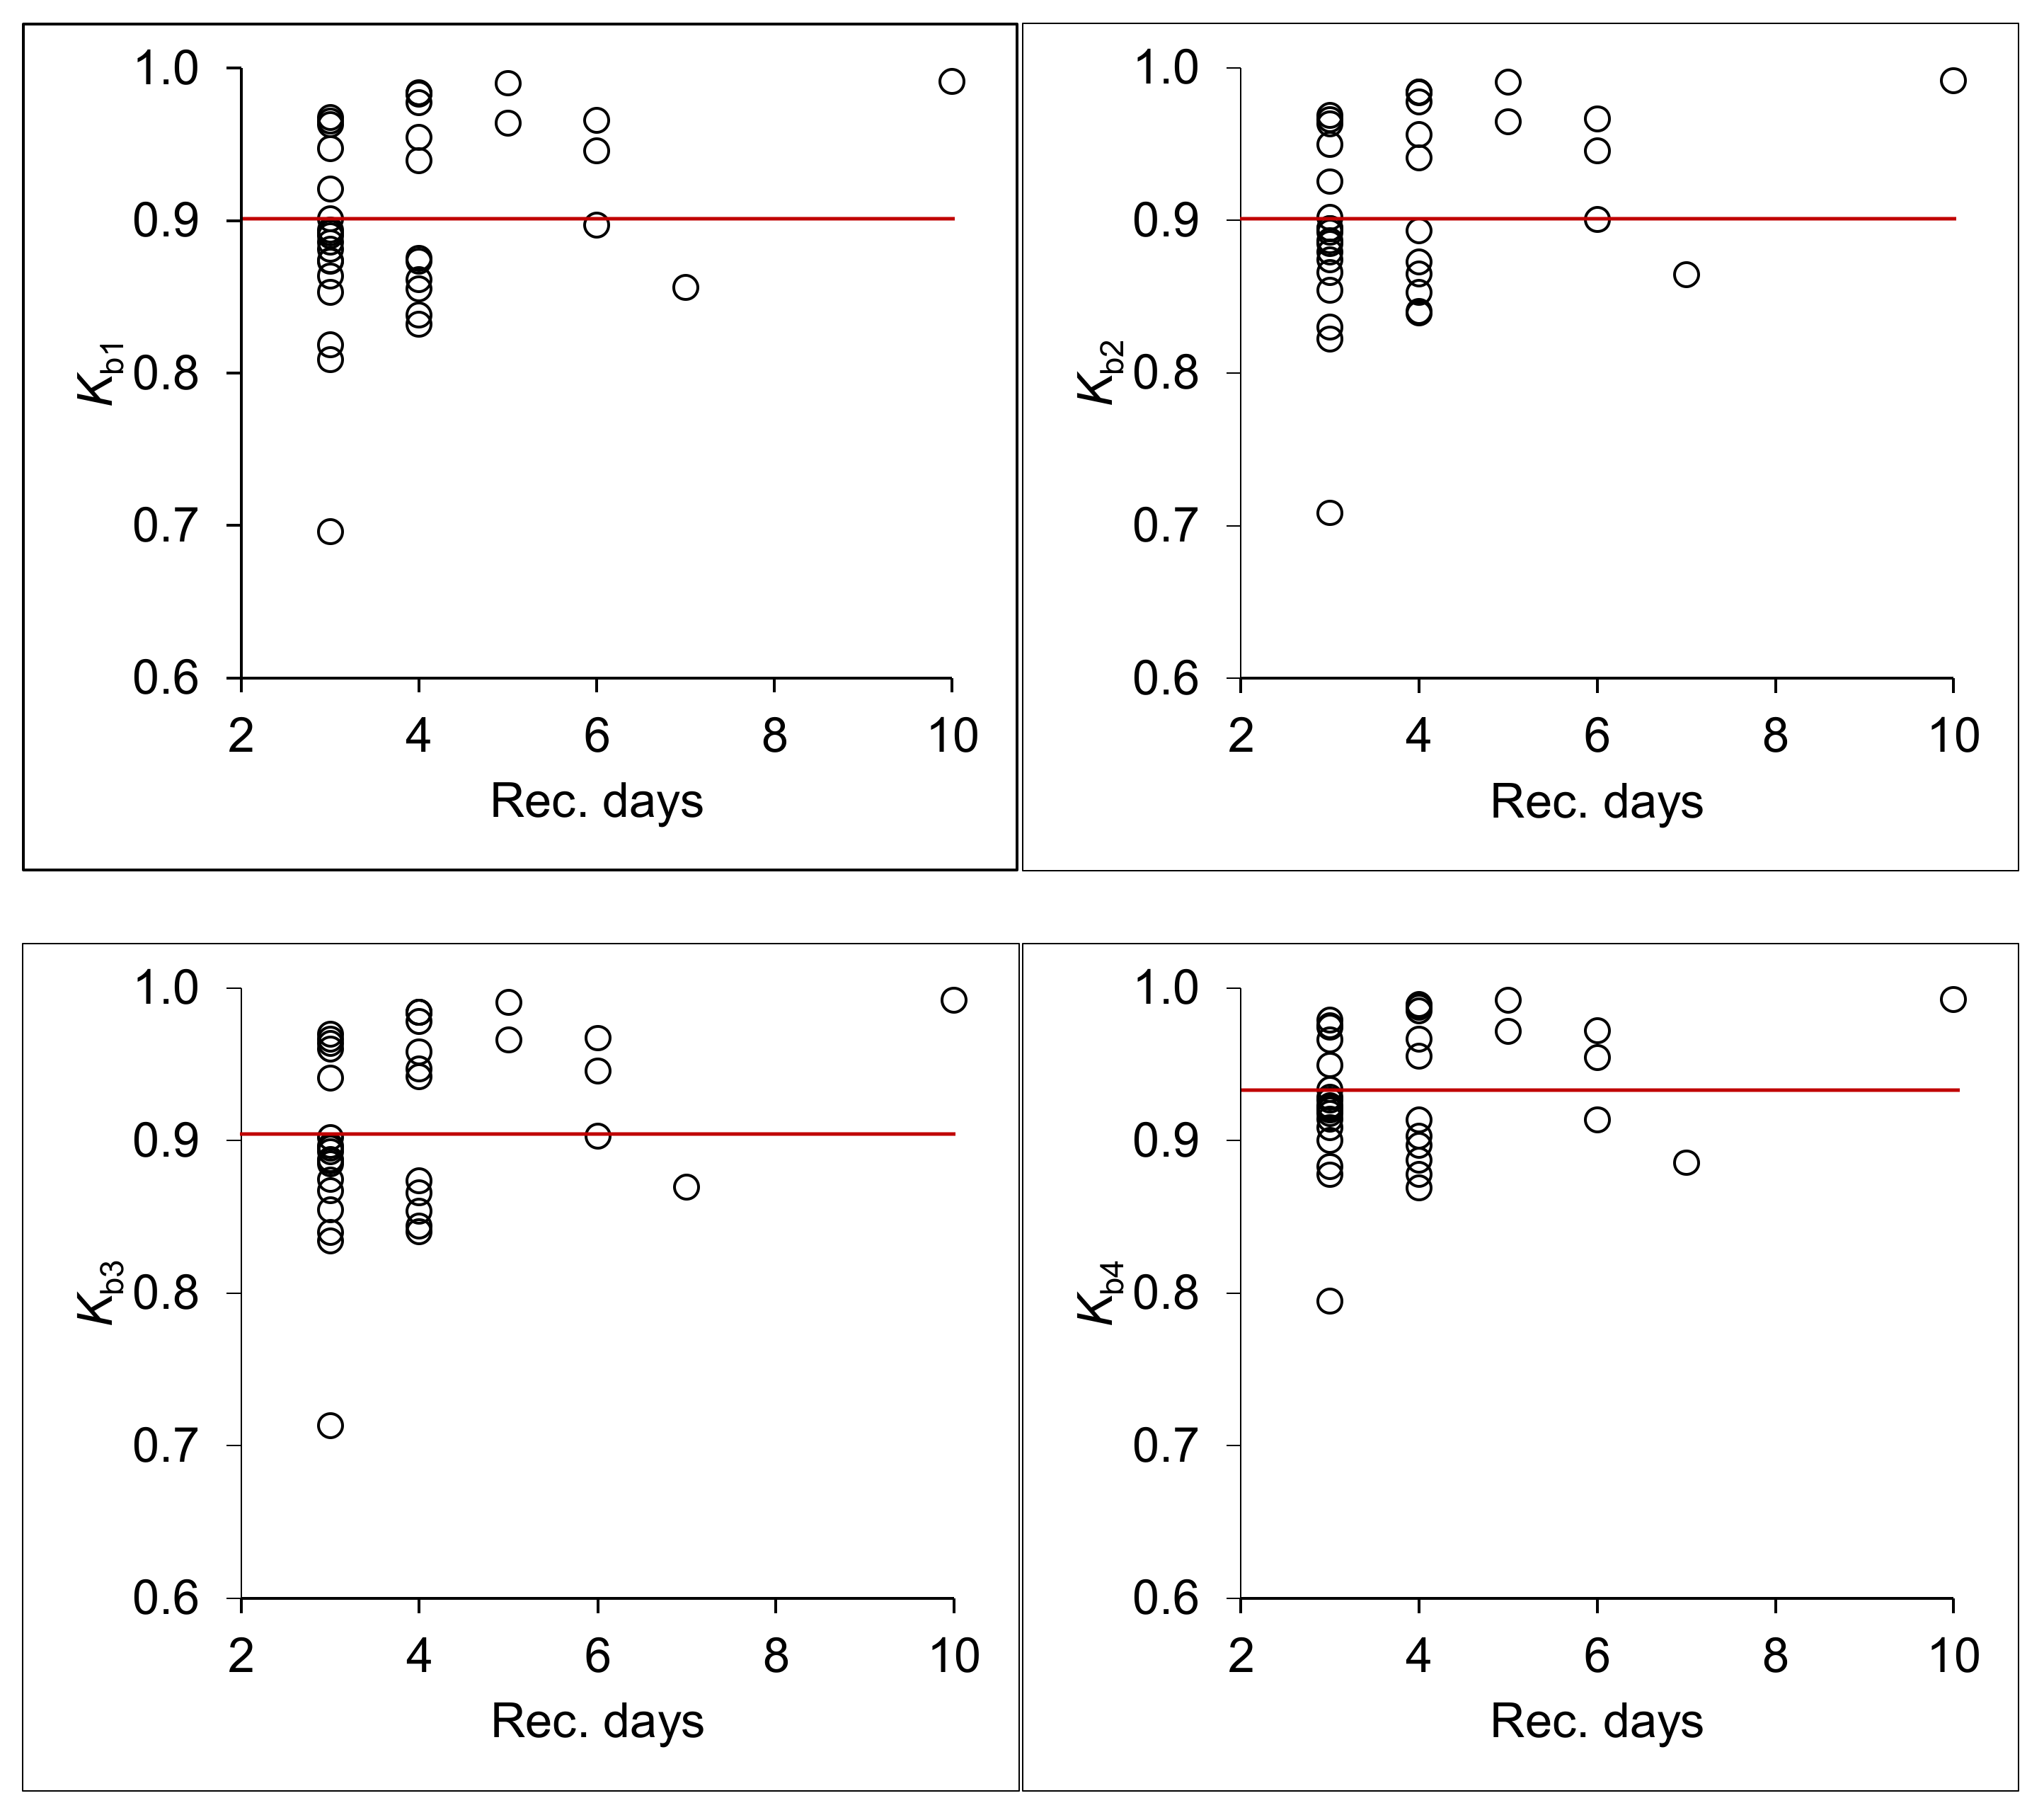
4.1.3. Effects of Baseflow Recession Length on K

K generated from shorter recession events tended to be lower (Figure 4). All K estimators showed similar patterns except Kb4, which was more resistant to low-K bias when baseflow recession lengths were short. Our recommendation of using Kb3 stands, but Kb4 should be considered if a study mostly comprises short recession events.

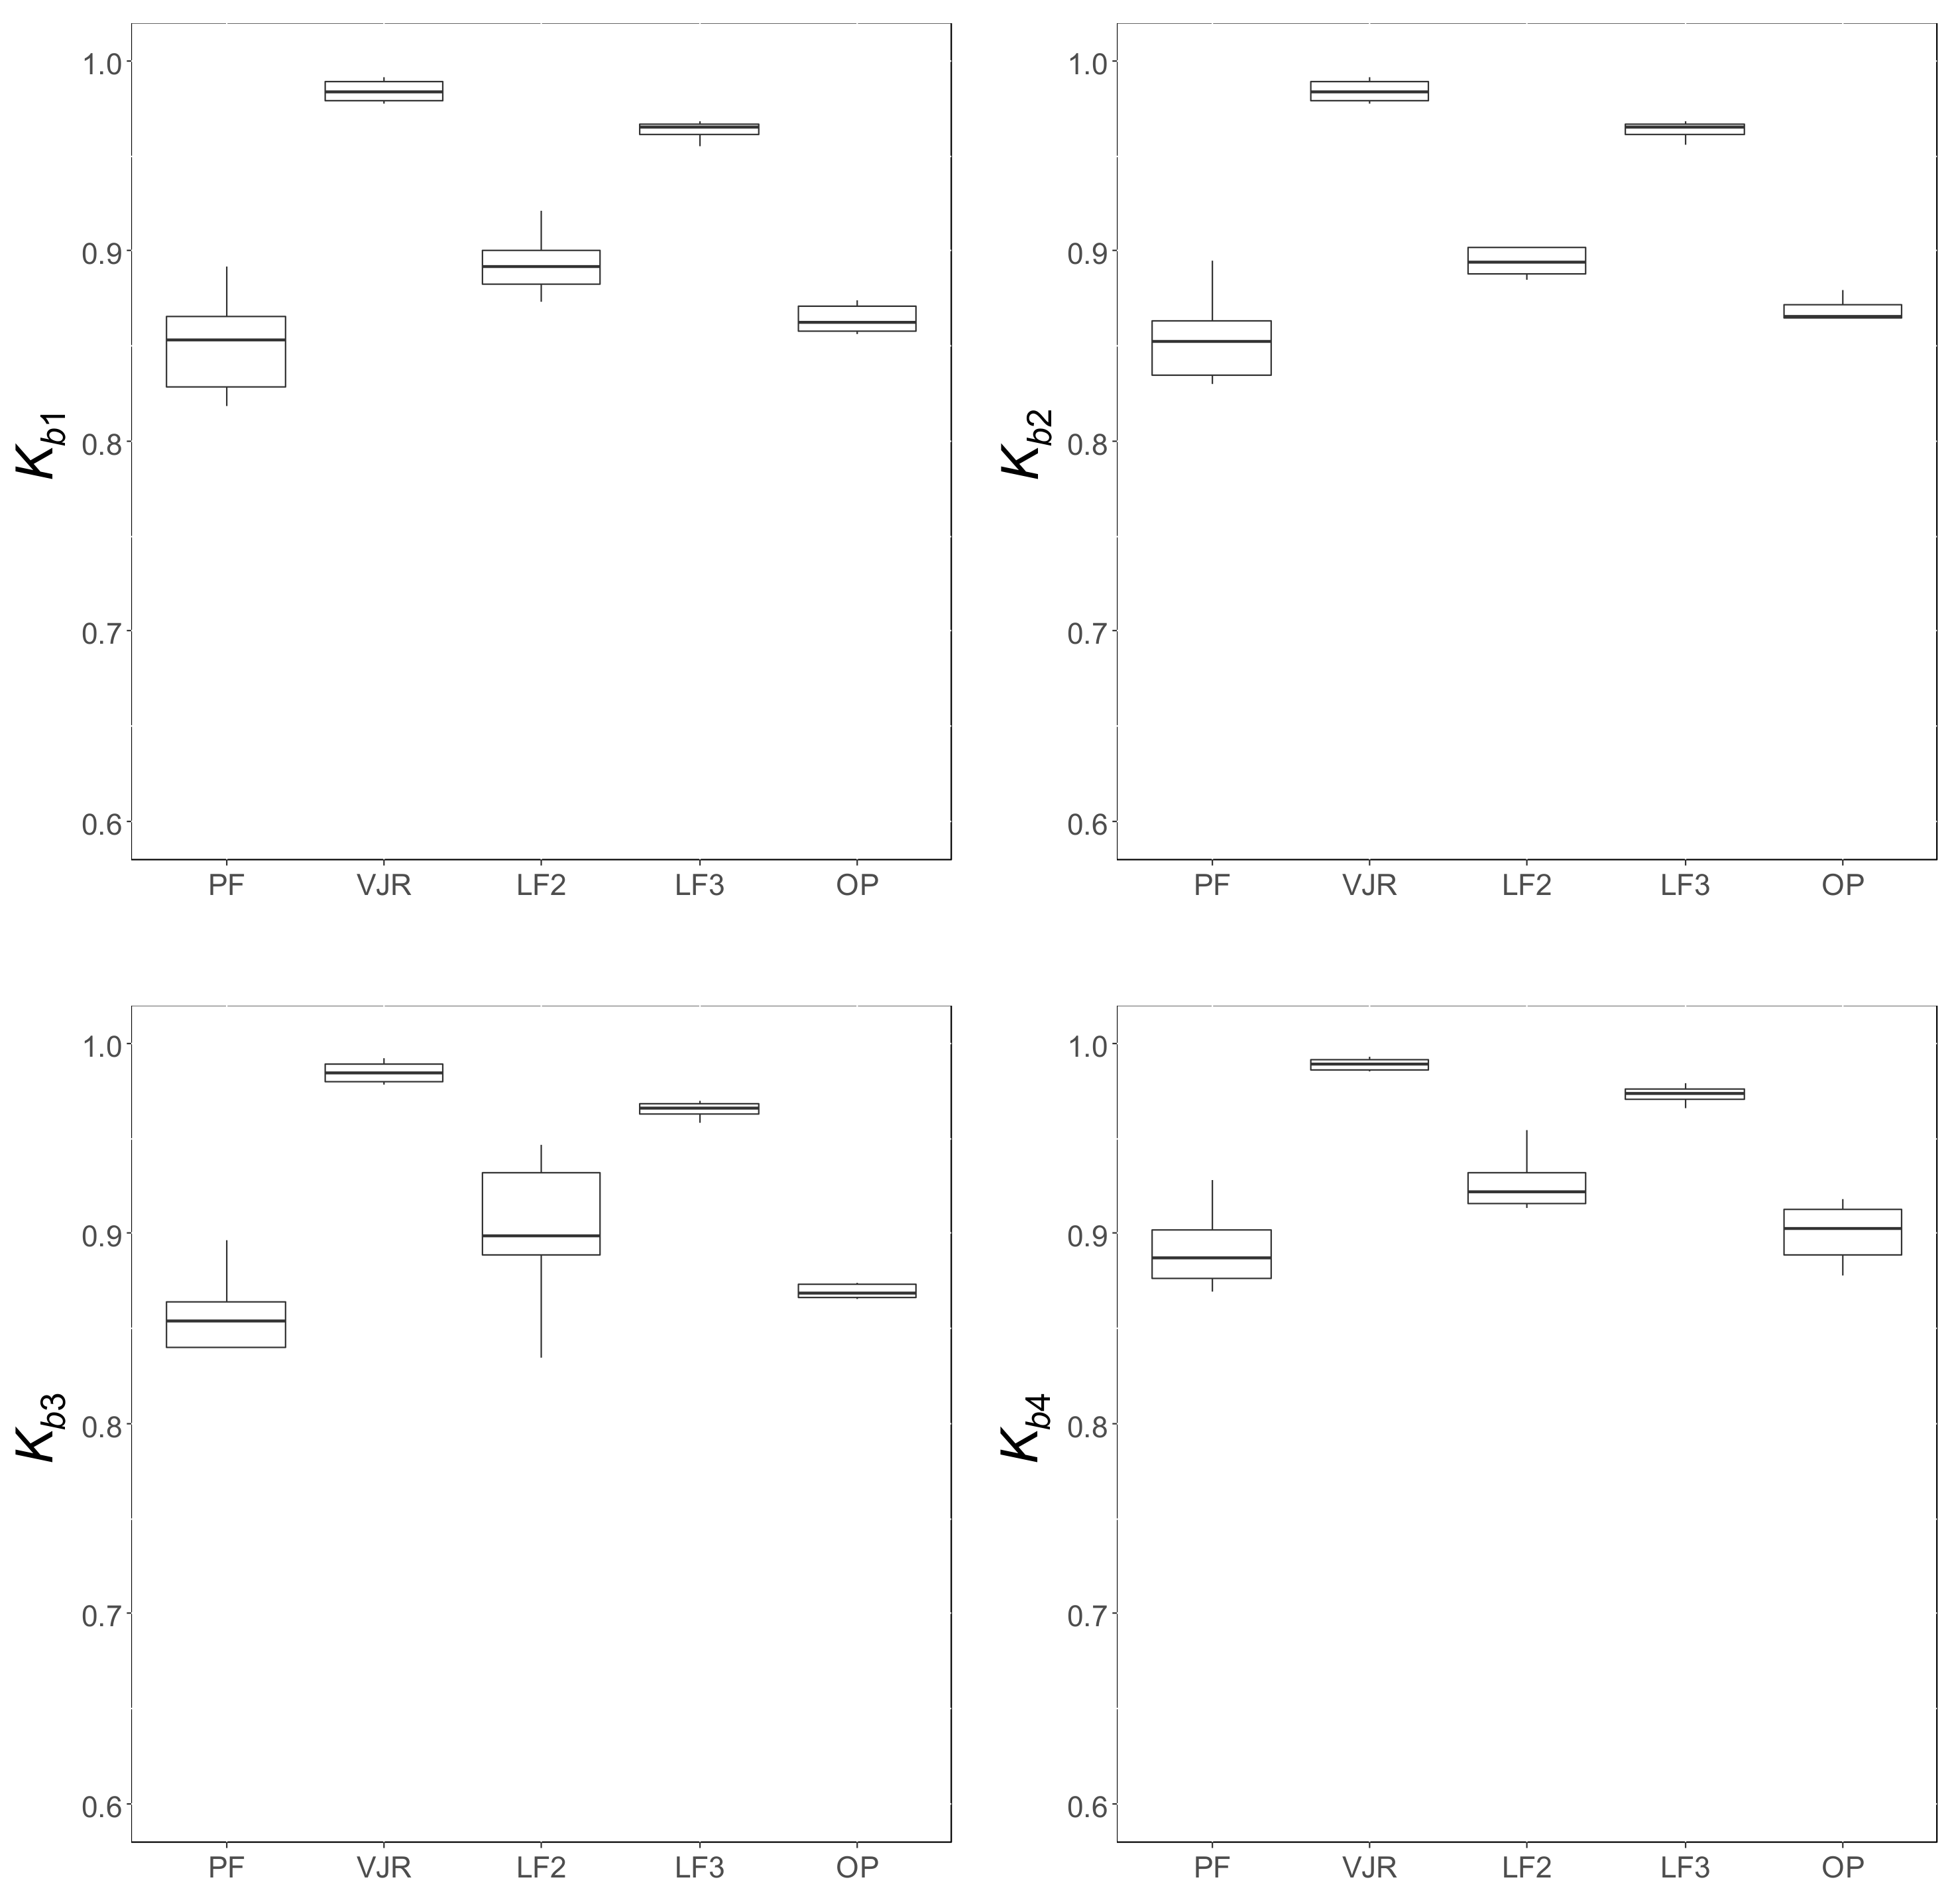
4.2. Baseflow and K in a Gradient of Land-Use Disturbances

The VJR had the highest K followed by LF3, LF2, OP, and PF. This pattern was consistent for K from all estimators (Kb1, Kb2, Kb3, and Kb4) (Table 4, Figure 5). The lowest K (fastest baseflow recession) was in PF and OP, and corresponds to the highest tree density in these catchments (Table 1), while the highest K was in VJR (slow baseflow recession) corresponds to the lowest tree density. Mean leaf area index (LAI), aboveground biomass (AGB), and other catchment characteristics, however, did not show any relationship with K. Full results can be found in Appendix A.
In an earlier analysis on the same dataset [1], baseflow rate showed the same pattern as K did between the different land-uses in this study with exception to PF (Table 5 and Table 6). The PF, however, showed discrepancies, whereby it has the fastest baseflow recession (lowest K), but baseflow remained highest among all land-uses (Table 4 and Table 5).

5. Discussion

5.1. Evaluation and Selection of K Estimation Methods

The more consistent recession characteristics in areas with steeper slopes (Table 2) could be afforded by gravity [1]. This, however, needs to be substantiated by more data in the future. RMSE (Table 3) could be affected by various factors (vegetation, aboveground, soil, etc.), but we were unable to detect association to any factors at this point. Yang et al. [17] have linked higher RMSE to larger catchment size. In a study comparing of a cypress plantation and a natural broadleaf catchment in Japan by Nainar et al. [19], lower RMSE was found in the well-managed cypress plantation which had consistent baseflow recession and low CoV of K. Naturally, shorter recession events produced lower K (faster recession) because of high hydrostatic pressure during times of high catchment moisture (Figure 4) [17,19].

5.2. Baseflow and K in a Gradient of Land-Use Disturbances

The association of low K to high vegetation stem count and vice versa (Table 1 and Table 4) may suggest that transpiration had a significant influence on baseflow recession [17,19] and that stand transpiration could be more strongly governed by stem count instead of basal area [59,60]. These findings differed from the recent convention [22,61,62], but it is substantiated by others [63] citing that an increase of basal area does not necessarily equate a proportional increase of sapwood area. Contrary to past studies where transpiration show strong relationships with basal area [64], the association of low K to high stem density in this study may reflect the higher growth rates, carbon fixation, and water uptake of young trees compared to mature trees which, despite their large size, have reached a plateau [63,65,66]. Although LF3 had a high stem count, it comprises sparsely distributed young understorey trees and shrubs that result in lower stand ET, which may explain its high K (Table 1 and Table 4). One of the likely mechanisms for the faster baseflow recession in the PF (Table 4) is the higher hydrostatic pressure as a result of high catchment moisture/subsurface flow that sustains baseflow [17,19].
In a previous article [1], similar arguments were presented for total baseflow, whereby the low total baseflow in OP was attributed to high water-uptake by oil palm trees whereas high baseflows in VJR and LF3 were associated with good soil properties and lower water-uptake. The highest baseflow in PF was linked to the highest annual rainfall, and where the rainwaters may have effectively infiltrated the soil due to good hydraulic conductivity—typical of an undisturbed tropical rainforest—and subsequently underutilised due to low transpiration by mature trees despite their large sizes [59,60,63,67,68]. With regards to water management of agricultural catchments, the effects of high water use in oil palm catchments were evident in the 2015 El-Nino Southern Oscillation (ENSO) event whereby water shortages were experienced by villages and towns downstream of the study area. Current trends in climate change in Sabah have shown that dry periods are getting hotter and longer, signalling a need for redesigned management strategies (both conservational and engineered).

6. Conclusions

Based on 22 months (November 2011–August 2013) of hydrological observation in the Sabah study area, baseflow dynamics (with emphasis on baseflow persistence) were compared and assessed among a gradient of land-use disturbances: primary forest (PF), old growth virgin jungle reserve (VJR), twice-logged forest with 22 years recovery (LF2), multiple-logged forest with 8 years recovery (LF3), and mature oil palm plantation (OP). The findings are:
  • Kb3 was found to be the most effective baseflow recession estimator in terms of resulting in the lowest combination of Coefficient of Variation and Root Mean Squared Error values. However, Kb4 should be considered in even wetter tropical areas than the study area where baseflow recessions are even shorter.
  • The VJR had the highest baseflow recession constant (slowest recession; K = 0.97841), followed by the LF3 (K = 0.96692), LF2 (K = 0.90347), OP (K = 0.86756), and PF (K = 0.83886).
  • Catchment baseflow values (absolute; % of streamflow) were found to be (in decreasing order): PF (1877 mm; 68%), LF3 (1265 mm; 55%), LF2 (812 mm; 51%), VJR (753 mm; 42%), and OP (367; 38%). Synthesizing K and baseflow data, the PF has the highest baseflow quantity and persistence despite having the fastest baseflow recession. This is followed by the VJR and LF3 (minimal differences in baseflow), the LF2, and the OP.
In today’s changing climate of the humid tropics, where dry periods are getting longer and more severe, it is crucial to understand how land-use changes and their longer-term impacts affect water resource availability. In preventing water stress, results from this study serve as an underlying basis for water management and is especially important in the tropics where logging (especially secondary forests) and oil palm agriculture are primary economic activities. Data from this study have demonstrated that forests (including multiple-logged) afford superior water resource availability compared to oil palm catchments—even mature, stabilized ones—and forests, regardless of quality, should therefore be conserved as much as possible especially in headwaters.

Author Contributions

Conceptualization, R.M.E., G.R., R.P.D.W., K.B. and A.N.; methodology, A.N., K.B. and R.P.D.W.; formal analysis, A.N., K.B., R.P.D.W., N.T. and U.L.; investigation, A.N., N.T. and R.P.D.W.; resources, R.M.E., G.R., R.P.D.W. and K.V.A.; data curation, A.N.; writing—original draft preparation, A.N.; writing—review and editing, A.N., N.T. and R.P.D.W.; visualization, A.N.; supervision, A.N., K.B. and R.P.D.W.; project administration, R.M.E. and G.R.; funding acquisition, R.M.E., G.R. and R.P.D.W. All authors have read and agreed to the published version of the manuscript.

Funding

This research project was primarily funded by the Sime Darby Foundation alongside other participating institutions: The Royal Society of London, Southeast Asia Rainforest Research Partnership (SEARRP), Imperial College London, the Sabah Foundation, Sabah Forestry Department, and Benta Wawasan Sdn. Bhd. Cost of publication was supported by the Research Management Centre, Universiti Malaysia Sabah.

Data Availability Statement

Available upon request.

Acknowledgments

The authors thank the field team, especially scientific coordinators Edgar Turner and Khoo Min Sheng, and project managers Johnny Larenus, Ryan Gray, and Mohd. Jamal Hanapi. Special mentions for research assistants Samsudi Mastor and Sisoon Maunut, who helped in field data collection.

Conflicts of Interest

The authors declare no conflict of interest. The funders had no role in the design of the study; in the collection, analyses, or interpretation of data; in the writing of the manuscript, or in the decision to publish the results.

Appendix A

Table A1. Baseflow recession constants produced via different estimation methods (Kb1, Kb2, Kb3, Kb4) and their respective root-mean-squared-error (RMSE) in catchments of differing land-uses.
Cat.EventKb1Kb2Kb3Kb4Rec. DaysRMSE
Kb1Kb2Kb3Kb4
PFPF10.853330.854080.854440.9001930.296760.252210.208660.41946
PFPF20.838220.839050.840370.8690240.030380.035230.045760.27295
PFPF30.855610.852510.853720.8872140.117250.103390.089980.12664
PFPF40.818600.829920.839830.8831330.334370.357160.381580.82407
PFPF50.892080.894530.896680.9283930.275890.261700.247800.06065
PFPF70.875650.872560.873660.9028140.124130.116060.108140.01972
PFPF90.695960.708310.713300.7946030.753110.770990.788531.03822
Mean 0.832780.835850.838860.880763.40.275980.270960.267210.39453
CoV 0.077900.071970.070170.04804 0.862620.910920.959511.00216
VJRVJR10.983910.983930.983980.9892640.012390.012020.011580.02902
VJRVJR20.983980.983960.984000.9879540.022720.021990.020660.00213
VJRVJR30.990280.990290.990410.9922250.048640.047850.046390.02572
VJRVJR40.939650.940710.941860.9551940.196200.197220.199100.22574
VJRVJR50.977680.977770.978100.9851340.037730.038530.040020.06168
VJRVJR60.991490.991550.992110.99260100.073870.072130.068960.03260
Mean 0.977830.978040.978410.983725.20.065260.064960.064450.06281
CoV 0.019800.019380.019010.01449 1.036071.048281.070131.30623
LF2LF110.873580.892980.946750.9134340.028050.025430.022650.02988
LF2LF120.894150.894580.895000.9198530.006240.003680.002730.01412
LF2LF130.808750.822220.834300.8776630.091720.096610.106090.12757
LF2LF140.945800.945480.945770.9543660.146470.135430.113800.06363
LF2LF150.881310.884550.887360.9214730.013710.017110.024470.04221
LF2LF160.885810.886410.886660.9227630.005980.011190.021610.04521
LF2LF170.890100.891800.892880.9265030.012180.016960.032370.07149
LF2LF180.920760.925290.941090.9495530.023850.021140.016740.01540
LF2LF190.897150.900220.902930.9138460.018630.021330.037300.08522
LF2LF1100.901350.901800.901980.9334130.012680.007480.003700.02618
Mean 0.889880.894530.903470.923283.70.035950.035640.038150.05209
CoV 0.039680.035410.037970.02298 1.285281.230311.032990.68329
LF3LF210.967940.968290.969820.9787530.008420.007880.007400.01628
LF3LF220.947520.949560.959990.9660830.045770.046860.050620.06305
LF3LF230.983210.983310.983960.9874640.035570.034340.030150.01681
LF3LF240.954800.955820.958270.9666840.083260.087220.101040.14695
LF3LF260.965990.966550.967190.9720560.014630.013800.017060.05022
LF3LF280.965440.965900.966740.9743130.042630.038390.024180.02566
LF3LF290.964210.964710.965670.9716750.019250.021040.031480.07676
LF3LF2110.963060.963290.963750.9753730.013870.015960.024550.05576
Mean 0.964020.964680.966920.974053.90.032920.033190.035810.05644
CoV 0.010720.010170.008140.00706 0.751440.772020.813810.75823
OPOP10.861440.864840.865830.8968140.009400.011730.014730.06450
OPOP30.863930.865970.866930.9085230.010700.010600.013020.06532
OPOP40.873280.874010.874310.9141430.014640.009510.006510.03227
OPOP50.874030.879120.884720.9177030.021790.019140.018170.04002
OPOP60.856440.864360.869540.8856170.055270.067070.074510.17263
OPOP90.832210.840480.844040.8778040.019780.022520.024200.04506
Mean 0.860220.864800.867560.900104.00.021930.023430.025190.06996
CoV 0.017830.015360.015470.01788 0.777210.938820.986710.74349

References

  1. Nainar, A.; Tanaka, N.; Bidin, K.; Annammala, K.V.; Ewers, R.M.; Reynolds, G.; Walsh, R.P.D. Hydrological dynamics of tropical streams on a gradient of land-use disturbance and recovery: A multi-catchment experiment. J. Hydrol. 2018, 566, 581–594. [Google Scholar] [CrossRef]
  2. Nainar, A.; Bidin, K.; Walsh, R.P.D.; Ewers, R.M.; Reynolds, G. Effects of different land-use on suspended sediment dynamics in Sabah (Malaysian Borneo)—A view at the event and annual timescales. Hydrol. Res. Lett. 2017, 11, 79–84. [Google Scholar] [CrossRef] [Green Version]
  3. Department of Irrigation and Drainage. Sungei Tekam Experimental Basin Calibration Report, July 1980 to June 1983; Bahagian Parit & Tali Air: Kuala Lumpur, Malaysia, 1982. [Google Scholar]
  4. Department of Irrigation and Drainage. Sungei Tekam Experimental Basin Transition Report, July 1980 to June 1983; Publication Unit: Kuala Lumpur, Malaysia, 1986. [Google Scholar]
  5. Douglas, I. Hydrological investigations of forest disturbance and land cover impacts in South-East Asia: A review. Philos. Trans. R. Soc. B 1999, 354, 1725–1738. [Google Scholar] [CrossRef] [PubMed] [Green Version]
  6. Douglas, I. Water and the Rainforest in Malaysian Borneo; Springer Nature: Cham, Switzerland, 2022. [Google Scholar]
  7. Vergopolan, N.; Fisher, J.B. The impact of deforestation on the hydrological cycle in Amazonia as observed from remote sensing. Int. J. Remote Sens. 2016, 37, 5412–5430. [Google Scholar] [CrossRef]
  8. Espinoza, J.C.; Sörensson, A.A.; Ronchail, J.; Molina-Carpio, J.; Segura, H.; Gutierrez-Cori, O.; Ruscica, R.; Condom, T.; Wongchuig-Correa, S. Regional hydro-climatic changes in the Southern Amazon Basin (Upper Madeira Basin) during the 1982–2017 period. J. Hydrol. Reg. Stud. 2019, 26, 100637. [Google Scholar] [CrossRef]
  9. Rizzo, R.; Garcia, A.S.; Vilela, V.M.d.F.N.; Ballester, M.V.R.; Neill, C.; Victoria, D.C.; da Rocha, H.R.; Coe, M.T. Land use changes in Southeastern Amazon and trends in rainfall and water yield of the Xingu River during 1976–2015. Clim. Chang. 2020, 162, 1419–1436. [Google Scholar] [CrossRef]
  10. De Oliveira, G.; Chen, J.M.; Mataveli, G.A.V.; Chaves, M.E.D.; Rao, J.; Sternberg, M.; Dos Santos, T.V.; Dos Santos, C.A.C. Evapotranspiration and Precipitation over Pasture and Soybean Areas in the Xingu River Basin, an Expanding Amazonian Agricultural Frontier. Agronomy 2020, 10, 1112. [Google Scholar] [CrossRef]
  11. Marhaento, H.; Booij, M.J.; Ahmed, N. Quantifying relative contribution of land use change and climate change to streamflow alteration in the Bengawan Solo River, Indonesia. Hydrol. Sci. J. 2021, 66, 1059–1068. [Google Scholar] [CrossRef]
  12. Stefanidis, S.; Alexandridis, V.; Mallinis, G. A cloud-based mapping approach for assessing spatiotemporal changes in erosion dynamics due to biotic and abiotic disturbances in a Mediterranean Peri-Urban forest. CATENA 2022, 218, 106564. [Google Scholar] [CrossRef]
  13. Fan, Y.; Meijide, A.; Lawrence, D.M.; Roupsard, O.; Carlson, K.M.; Chen, H.Y.; Röll, A.; Niu, F.; Knohl, A. Reconciling Canopy Interception Parameterization and Rainfall Forcing Frequency in the Community Land Model for Simulating Evapotranspiration of Rainforests and Oil Palm Plantations in Indonesia. J. Adv. Model. Earth Syst. 2019, 11, 732–751. [Google Scholar] [CrossRef]
  14. Meijide, A.; Badu, C.S.; Moyano, F.; Tiralla, N.; Gunawan, D.; Knohl, A. Impact of forest conversion to oil palm and rubber plantations on microclimate and the role of the 2015 ENSO event. Agric. For. Meteorol. 2018, 252, 208–219. [Google Scholar] [CrossRef]
  15. Röll, A.; Niu, F.; Meijide, A.; Hardanto, A.; Hendrayanto; Knohl, A.; Hölscher, D. Transpiration in an oil palm landscape: Effects of palm age. Biogeosciences 2015, 12, 5619–5633. [Google Scholar] [CrossRef] [Green Version]
  16. Srivastava, A.; Kumari, N.; Maza, M. Hydrological Response to Agricultural Land Use Heterogeneity Using Variable Infiltration Capacity Model. Water Resour. Manag. 2020, 34, 3779–3794. [Google Scholar] [CrossRef]
  17. Yang, H.; Choi, H.; Lim, H. Applicability Assessment of Estimation Methods for Baseflow Recession Constants in Small Forest Catchments. Water 2018, 10, 1074. [Google Scholar] [CrossRef] [Green Version]
  18. Kienzle, S.W. The Use of the Recession Index as an Indicator for Streamflow Recovery After a Multi-Year Drought. Water Resour. Manag. 2006, 20, 991–1006. [Google Scholar] [CrossRef]
  19. Nainar, A.; Tanaka, N.; Sato, T.; Kishimoto, K.; Kuraji, K. A comparison of the baseflow recession constant (K) between a Japanese cypress and mixed-broadleaf forest via six estimation methods. Sustain. Water Resour. Manag. 2021, 7, 6. [Google Scholar] [CrossRef]
  20. Sidle, R.C.; Sasaki, S.; Otsuki, M.; Noguchi, S.; Abdul Rahim, N. Sediment pathways in a tropical forest: Effects of logging roads and skid trails. Hydrol. Process. 2004, 18, 703–720. [Google Scholar] [CrossRef]
  21. Tani, M.; Nik, A.R.; Yasuda, Y.; Noguchi, S.; Shamsuddin, S.A.; Md Sahat, M.; Takanashi, S.; Rah Nik, A.I.; Yasuda, Y.; Shamsuddin, S.A.; et al. Long-Term Estimation of Evapotranspiration from a Tropical Rain Forest in Peninsular Malaysia; International Association of Hydrological Sciences: Wallingford, UK, 2003; pp. 267–274. [Google Scholar]
  22. Kume, T.; Tanaka, N.; Kuraji, K.; Komatsu, H.; Yoshifuji, N.; Saitoh, T.M.; Suzuki, M.; Kumagai, T. Ten-year evapotranspiration estimates in a Bornean tropical rainforest. Agric. For. Meteorol. 2011, 151, 1183–1192. [Google Scholar] [CrossRef]
  23. Douglas, I.; Spencer, T.; Greer, T.; Bidin, K.; Sinun, W.; Meng, W.W. The impact of selective commercial logging on stream hydrology, chemistry and sediment loads in the Ulu Segama rain forest, Sabah, Malaysia. Philos. Trans. R. Soc. B 1992, 335, 397–406. [Google Scholar]
  24. Mohammad, N.A.; Nainar, A.; Annammala, K.V.; Sugumaran, D.; Jamal, M.H.; Yusop, Z. Soil erosion in disturbed forests and agricultural plantations in tropical undulating terrain: In situ measurement using a laser erosion bridge method. J. Water Clim. Chang. 2020, 11, 1032–1041. [Google Scholar] [CrossRef]
  25. Sugumaran, D.; Nainar, A.; Mohd Yusoff, A.R.; Yusop, Z.; Mohammad, N.A.; Mazilamani, L.S.; Annammala, K.V. Tracing non-point source sediment using environmental forensic method: Case study in Kelantan river basin, Malaysia. J. Water Clim. Chang. 2019, in press. [Google Scholar]
  26. Walsh, R.P.D.; Bidin, K.; Blake, W.H.; Chappell, N.A.; Clarke, M.A.; Douglas, I.; Ghazali, R.; Sayer, A.M.; Suhaimi, J.; Tych, W.; et al. Long-term responses of rainforest erosional systems at different spatial scales to selective logging and climatic change. Philos. Trans. R. Soc. B 2011, 366, 3340–3353. [Google Scholar] [CrossRef] [PubMed]
  27. Luke, S.H.; Barclay, H.; Bidin, K.; Chey, V.K.; Ewers, R.M.; Foster, W.A.; Nainar, A.; Pfeifer, M.; Reynolds, G.; Turner, E.C.; et al. The effects of catchment and riparian forest quality on stream environmental conditions across a tropical rainforest and oil palm landscape in Malaysian Borneo. Ecohydrology 2017, 10, e1827. [Google Scholar] [CrossRef] [PubMed] [Green Version]
  28. Sulai, P.; Nurhidayu, S.; Aziz, N.; Zakaria, M.; Barclay, H.; Azhar, B. Effects of water quality in oil palm production landscapes on tropical waterbirds in Peninsular Malaysia. Ecol. Res. 2015, 30, 941–949. [Google Scholar] [CrossRef]
  29. Reynolds, G.; Payne, J.; Sinun, W.; Mosigil, G.; Walsh, R.P.D. Changes in forest land use and management in Sabah, Malaysian Borneo, 1990–2010, with a focus on the Danum Valley region. Philos. Trans. R. Soc. B 2011, 366, 3168–3176. [Google Scholar] [CrossRef]
  30. Bidin, K.; Chappell, N.A. Characteristics of rain events at an inland locality in northeastern Borneo, Malaysia. Hydrol. Process. 2006, 20, 3835–3850. [Google Scholar] [CrossRef] [Green Version]
  31. Chappell, N.A.; Bidin, K.; Tych, W. Modelling rainfall and canopy controls on net-precipitation beneath selectively-logged tropical forest. Plant Ecol. 2001, 153, 215–229. [Google Scholar] [CrossRef]
  32. Ewers, R.M.; Didham, R.K.; Fahrig, L.; Ferraz, G.; Hector, A.; Holt, R.D.; Kapos, V.; Reynolds, G.; Sinun, W.; Snaddon, J.L.; et al. A large-scale forest fragmentation experiment: The Stability of Altered Forest Ecosystems Project. Philos. Trans. R. Soc. B 2011, 366, 3292–3302. [Google Scholar] [CrossRef] [Green Version]
  33. Turner, E.C.; Zainal Abidin, Y.; Barlow, H.; Fayle, T.M.; Hattah, M.; Jaafar, H.J.; Vun Khen, C.; Larenus, J.; Nainar, A.; Reynolds, G.; et al. The Stability of Altered Forest Ecosystems Project: Investigating the Design of Human-Modified Landscapes for Productivity and Conservation. Plant 2012, 88, 453–468. [Google Scholar]
  34. Padfield, R.; Hansen, S.; Davies, Z.G.; Ehrensperger, A.; Slade, E.; Evers, S.; Papargyropoulou, E.; Bessou, C.; Abdullah, N.; Page, S.; et al. Co-producing a research agenda for sustainable palm oil. Front. For. Glob. Chang. 2019, 2, 1–17. [Google Scholar] [CrossRef] [Green Version]
  35. Rondhi, M.; Pratiwi, P.A.; Handini, V.T.; Sunartomo, A.F.; Budiman, S.A. Agricultural Land Conversion, Land Economic Value, and Sustainable Agriculture: A Case Study in East Java, Indonesia. Land 2018, 7, 148. [Google Scholar] [CrossRef] [Green Version]
  36. Fox, J.; Nghiem, T.; Kimkong, H.; Hurni, K.; Baird, I.G. Large-Scale Land Concessions, Migration, and Land Use: The Paradox of Industrial Estates in the Red River Delta of Vietnam and Rubber Plantations of Northeast Cambodia. Land 2018, 7, 77. [Google Scholar] [CrossRef] [Green Version]
  37. Fox, J.; Vogler, J.B.; Sen, O.L.; Giambelluca, T.W.; Ziegler, A.D. Simulating Land-Cover Change in Montane Mainland Southeast Asia. Environ. Manag. 2012, 49, 968–979. [Google Scholar] [CrossRef] [PubMed]
  38. Rathnayake, C.W.M.; Jones, S.; Soto-Berelov, M. Mapping Land Cover Change over a 25-Year Period (1993–2018) in Sri Lanka Using Landsat Time-Series. Land 2020, 9, 27. [Google Scholar] [CrossRef] [Green Version]
  39. Jepsen, M.R.; Palm, M.; Bruun, T.B. What Awaits Myanmar’s Uplands Farmers? Lessons Learned from Mainland Southeast Asia. Land 2019, 8, 29. [Google Scholar] [CrossRef] [Green Version]
  40. Camacho-Valdez Id, V.; Rodiles-Herná Ndez, R.; Navarrete-Gutié Rrez, D.A.; Valencia-Barrera, E. Tropical wetlands and land use changes: The case of oil palm in neotropical riverine floodplains. PLoS ONE 2022, 17, e0266677. [Google Scholar] [CrossRef]
  41. Lambin, E.F.; Geist, H.J.; Lepers, E. Dynamics of Land-Use and Land-Cover Change in Tropical Regions. Annu. Rev. Environ. Resour. 2003, 28, 205–241. [Google Scholar] [CrossRef] [Green Version]
  42. Singh, M.; Malhi, Y.; Bhagwat, S.A. Aboveground biomass and tree diversity of riparian zones in an oil palm-dominated mixed landscape in Borneo. J. Trop. For. Sci. 2015, 27, 227–239. [Google Scholar]
  43. Newbery, D.M.; Kennedy, D.N.; Petol, G.H.; Madani, L.; Ridsdale, C.E. Primary forest dynamics in lowland dipterocarp forest at Danum Valley, Sabah, Malaysia, and the role of the understorey. Philos. Trans. R. Soc. B 1999, 354, 1763–1782. [Google Scholar] [CrossRef]
  44. Leong, K.M. The Geology and Mineral Resources of the Upper Segama Valley and Darvel Bay Area, Sabah, Malaysia; Memoir 4 (Revised); U.S. Government Printing Office: Washington, DC, USA, 1974.
  45. Geological Survey of Malaysia. Geological Map of Sabah, 3rd ed.Geological Survey of Malaysia: Kuala Lumpur, Malaysia, 1985. [Google Scholar]
  46. Vogel, R.M.; Kroll, C.N. Regional geohydrologic-geomorphic relationships for the estimation of low-flow statistics. Water Resour. Res. 1992, 28, 2451–2458. [Google Scholar] [CrossRef]
  47. Thomas, B.F.; Vogel, R.M.; Kroll, C.N.; Famiglietti, J.S. Estimation of the base flow recession constant under human interference. Water Resour. Res. 2013, 49, 7366–7379. [Google Scholar] [CrossRef] [Green Version]
  48. Thomas, B.F.; Vogel, R.M.; Famiglietti, J.S. Objective hydrograph baseflow recession analysis. J. Hydrol. 2015, 525, 102–112. [Google Scholar] [CrossRef] [Green Version]
  49. Kelman, J. A stochastic model for daily streamflow. J. Hydrol. 1980, 47, 235–249. [Google Scholar] [CrossRef]
  50. Bates, B.C.; Davies, P.K. Effect of baseflow separation procedures on surface runoff models. J. Hydrol. 1988, 103, 309–322. [Google Scholar] [CrossRef]
  51. Tallaksen, L.M. A review of baseflow recession analysis. J. Hydrol. 1995, 165, 349–370. [Google Scholar] [CrossRef]
  52. Stagnitta, T.J.; Kroll, C.N.; Zhang, Z. A comparison of methods for low streamflow estimation from spot measurements. Hydrol. Process. 2018, 32, 480–492. [Google Scholar] [CrossRef]
  53. Boussinesq, J. Essai sur la théorie des eaux courantes. In Mémoires Présentés par Divers Savants à l’Academie des Sciences de l’Institut de France; Nabu Press: Charleston, SC, USA, 1877; Volume 23, p. 64. [Google Scholar]
  54. Brutsaert, W.; Nieber, J.L. Regionalized drought flow hydrographs from a mature glaciated plateau. Water Resour. Res. 1977, 13, 637–643. [Google Scholar] [CrossRef]
  55. Vogel, R.M.; Kroll, C.N. Estimation of baseflow recession constants. Water Resour. Manag. 1996, 10, 303–320. [Google Scholar] [CrossRef]
  56. Beck, H.E.; van Dijk, A.I.J.M.; Miralles, D.G.; de Jeu, R.A.M.; Bruijnzeel, L.A.; McVicar, T.R.; Schellekens, J. Global patterns in base flow index and recession based on streamflow observations from 3394 catchments. Water Resour. Res. 2013, 49, 7843–7863. [Google Scholar] [CrossRef] [Green Version]
  57. Van Dijk, A.I.J.M. Climate and terrain factors explaining streamflow response and recession in Australian catchments. Hydrol. Earth Syst. Sci. 2010, 14, 159–169. [Google Scholar] [CrossRef] [Green Version]
  58. Hall, F.R. Base-Flow Recessions-A Review. Water Resour. Res. 1968, 4, 973–983. [Google Scholar] [CrossRef]
  59. Renner, M.; Hassler, S.K.; Blume, T.; Weiler, M.; Hildebrandt, A.; Guderle, M.; Schymanski, S.J.; Kleidon, A. Dominant controls of transpiration along a hillslope transect inferred from ecohydrological measurements and thermodynamic limits. Hydrol. Earth Syst. Sci 2016, 20, 2063–2083. [Google Scholar] [CrossRef] [Green Version]
  60. Ghimire, C.P.; Bruijnzeel, L.A.; Lubczynski, M.W.; Zwartendijk, B.W.; Odongo, V.O.; Ravelona, M.; Van Meerveld, H.J.I. Transpiration and stomatal conductance in a young secondary tropical montane forest: Contrasts between native trees and invasive understorey shrubs. Tree Physiol. 2018, 38, 1053–1070. [Google Scholar] [CrossRef]
  61. Forrester, D.I. Transpiration and water-use efficiency in mixed-species forests versus monocultures: Effects of tree size, stand density and season. Tree Physiol. 2015, 35, 289–304. [Google Scholar] [CrossRef]
  62. Salas-Acosta, E.R.; Andrade, J.L.; Perera-Burgos, J.A.; Us-Santamaría, R.; Figueroa-Espinoza, B.; Uuh-Sonda, J.M.; Cejudo, E. Transpiration of a Tropical Dry Deciduous Forest in Yucatan, Mexico. Atmosphere 2022, 13, 271. [Google Scholar] [CrossRef]
  63. Kobayashi, N.; Kumagai, T.; Miyazawa, Y.; Matsumoto, K.; Tateishi, M.; Lim, T.K.; Mudd, R.G.; Ziegler, A.D.; Giambelluca, T.W.; Yin, S. Transpiration characteristics of a rubber plantation in central Cambodia. Tree Physiol. 2014, 34, 285–301. [Google Scholar] [CrossRef] [PubMed] [Green Version]
  64. Tanaka, N.; Levia, D.; Igarashi, Y.; Yoshifuji, N.; Tanaka, K.; Tantasirin, C.; Nanko, K.; Suzuki, M.; Kumagai, T. What factors are most influential in governing stemflow production from plantation-grown teak trees? J. Hydrol. 2017, 544, 10–20. [Google Scholar] [CrossRef] [Green Version]
  65. Delzon, S.; Loustau, D. Age-related decline in stand water use: Sap flow and transpiration in a pine forest chronosequence. Agric. For. Meteorol. 2005, 129, 105–119. [Google Scholar] [CrossRef]
  66. Ambrose, A.R.; Sillett, S.C.; Koch, G.W.; Van Pelt, R.; Antoine, M.E.; Dawson, T.E. Effects of height on treetop transpiration and stomatal conductance in coast redwood (Sequoia sempervirens). Tree Physiol. 2010, 30, 1260–1272. [Google Scholar] [CrossRef]
  67. Kuraji, K.; Gomyo, M.; Nainar, A. Thinning of cypress forest increases subsurface runoff but reduces peak storm-runoff: A lysimeter observation. Hydrol. Res. Lett. 2019, 13, 49–54. [Google Scholar] [CrossRef] [Green Version]
  68. Nainar, A.; Tanaka, N.; Sato, T.; Mizuuchi, Y.; Kuraji, K. A comparison of hydrological characteristics between a cypress and mixed-broadleaf forest: Implication on water resource and floods. J. Hydrol. 2021, 595, 125679. [Google Scholar] [CrossRef]
Figure 1. Study area. Reprinted/adapted with permission from Nainar et al. [1]. 2018, Elsevier.
Water 14 03791 g001
Figure 2. Stormflow recession, inflexion point, and baseflow recession on falling limbs. Examples of the shortest (3 days) baseflow recession event (a), the median length (5 days) baseflow recession event (b), and the longest (10 days) baseflow recession event (c).
Water 14 03791 g002
Figure 3. Root mean squared error (RMSE) versus recession days.
Water 14 03791 g003
Figure 4. K versus recession days. Red line is the mean.
Water 14 03791 g004
Figure 5. Kb1, Kb2, Kb3, and Kb4 in the different land-uses.
Water 14 03791 g005
Table 1. Catchment characteristics. Source: Nainar et al. [1].
CatchmentArea
(km2)
Runoff
ratio, C
μ Channel
⦛ (°)
μ Slope
⦛ (°)
Elevation
(m.a.s.l)
μ
LAI
μ AGB
(t ha−1)
Tree Density (ha−1)
<10 cm>10 cm
Primary Forest (PF)1.700.7898.949.41188–3094.7422.501706453
Virgin Jungle Reserve (VJR)3.080.61538.6450.4897–8594.159.3423348
Twice-logged Forest (LF2)4.640.88912.1026.11429–8643.825.39173456
Multiple-logged Forest (LF3)2.780.79632.8139.64277–9044.025.90400440
Oil Palm Plantation (OP)3.270.35717.3926.48199–5172.402.07455601
Table 2. Coefficient of Variation (CoV) of K produced by the various K estimators.
CatchmentCoV of K
Kb1Kb2Kb3Kb4
PF0.077900.071970.070170.04804
VJR0.019800.019380.019010.01449
LF20.039680.035410.037970.02298
LF30.010720.010170.008140.00706
OP0.017830.015360.015470.01788
Note: Red and blue indicate lowest and highest values, respectively.
Table 3. Root mean squared error (RMSE) of prediction in the different land-uses.
CatchmentRMSE
Kb1Kb2Kb3Kb4
PF0.275980.270960.267210.39453
VJR0.065260.064960.064450.06281
LF20.035950.035640.038150.05209
LF30.032920.033190.035810.05644
OP0.021930.023430.025190.06996
Note: Red and blue indicate lowest and highest values, respectively.
Table 4. Mean baseflow recession constants produced by various estimators (Kb1, Kb2, Kb3, and Kb4) in the different land-uses.
CatchmentKb1Kb2Kb3Kb4
PF0.832780.835850.838860.88076
VJR0.977830.978040.978410.98372
LF20.889880.894530.903470.92328
LF30.964020.964680.966920.97405
OP0.860220.864800.867560.90010
Note: Red and blue indicate lowest and highest values, respectively. Baseflow recession constant produced by the estimator Kb3 (highlighted grey) is preferred in this study.
Table 5. Values of discharge parameters for the catchments of differing land-use. All parameters were derived from the full dataset (22 months) except for Kb3 which was derived from the recession dataset (37 recession events).
Discharge ParameterPFVJRLF2LF3OP
Annual streamflow (mm)2764178515971907956
Annual stormflow (mm)88710327851049589
Annual baseflow (mm)18777538121265367
Annual baseflow (%)67.9242.1850.8455.0238.43
CoVQ1.2311.5272.0251.4862.062
Kb30.838860.978410.903470.966920.86756
Table 6. Rank order of land-uses for various key catchment hydrological parameters. The runoff ratio and % baseflow were based on the full dataset (22 months); K was based on the recession dataset (37 recession events).
Hydro.
Component
Catchment Rank
Lowest−−−−−−−−−−−−−−−−−−−−−−−−−−−−−−−→Highest
Runoff ratioOPVJRLF2PFLF3
% baseflowOPVJRLF2LF3PF
KPFOPLF2LF3VJR
Publisher’s Note: MDPI stays neutral with regard to jurisdictional claims in published maps and institutional affiliations.

