Article

Detection of SARS-CoV-2 and Variants in Hospital Wastewater in a Developing Country

by
Vichapon Tiacharoen
1,
Thammanitchpol Denpetkul
2,
Nathamon Kosoltanapiwat
1,
Pannamas Maneekan
3,
Narin Thippornchai
1,
Anon Saeoueng
1,
Akanitt Jittmittraphap
1,
Jetsumon Sattabongkot
4 and
Pornsawan Leaungwutiwong
1,*
1
Department of Microbiology and Immunology, Faculty of Tropical Medicine, Mahidol University, Bangkok 10400, Thailand
2
Department of Social and Environmental Medicine, Faculty of Tropical Medicine, Mahidol University, Bangkok 10400, Thailand
3
Department of Tropical Hygiene, Faculty of Tropical Medicine, Mahidol University, Bangkok 10400, Thailand
4
Mahidol Vivax Research Unit, Faculty of Tropical Medicine, Mahidol University, Bangkok 10400, Thailand
*
Author to whom correspondence should be addressed.
Water 2022, 14(23), 3798; https://doi.org/10.3390/w14233798
Submission received: 2 October 2022 / Revised: 14 November 2022 / Accepted: 17 November 2022 / Published: 22 November 2022
(This article belongs to the Special Issue COVID-19 and Surface Water Quality)

Abstract

:
Wastewater-based epidemiology (WBE) is a beneficial tool for comprehensive health information on communities, especially during the COVID-19 pandemic. In developing countries, including Thailand, the application of WBE is limited. Few SARS-CoV-2 detections and variants have been monitored in wastewater in these countries. This is because of the time-consuming, low recovery of viruses in the concentration techniques and difficulties in finding the proper primers and amplification kits. Therefore, this study aimed to quantify SARS-CoV-2 RNA concentration using a commercial clinical kit. We identified the SARS-CoV-2 variants and estimated the detection costs in the wastewater samples. One hundred and fifty hospital wastewater samples were filtered with commercial ultrafiltration (UF) and then detected for the SARS-CoV-2 concentration using a Sansure Biotech SARS-CoV-2 kit. The recovery of the virus concentration technique in UF was studied using a surrogate (porcine epidemic diarrhea virus). The virus detection in wastewater was quantified by RT-qPCR. In addition, the mutation sites in the partial spike glycoprotein (S) gene of SARS-CoV-2 were verified using short nested RT-PCR. The results showed a high recovery of the commercial UF (80.53%), and 24.6% of hospital wastewater contained SARS-CoV-2. The detection of SARS-CoV-2 in wastewater cost USD 35.43 per sample. The virus variants revealed V70del, H69del, and V144del mutations in the partial S gene of SARS-CoV-2 in B.1.1.7 (SARS-CoV-2 Alpha variant), and T95I and G142D mutations in B.1.617.2 (Delta variant).

1. Introduction

Severe acute respiratory syndrome coronavirus 2 (SARS-CoV-2) is an enveloped positive-sense single-stranded RNA virus that belongs to the family Coronaviridae, genus β-Coronavirus. The virus is the causative agent of the disease called Coronavirus disease 2019 (COVID-19). SARS-CoV-2 can be transmitted through respiratory droplets and direct contact with contaminated surfaces [1]. The clinical manifestations of COVID-19 include fever, sore throat, fatigue, cough, headache, pneumonia, and gastrointestinal symptoms [2,3]. Since December 2019, COVID-19 has spread in Hubei province, China. Several confirmed cases and deaths have been reported worldwide. Reverse transcription-quantitative polymerase chain reaction (RT-qPCR) is the standard method for detecting SARS-CoV-2 genetic materials not only in clinical samples, but also in wastewater samples. Several commercial kits are currently available for SARS-CoV-2 detection. For instance, the 2019-nCoV Nucleic Acid Diagnostic Kit (Sansure Biotech) is a multiplex RT-qPCR used for the detection of the ORF1ab and N genes of SARS-CoV-2. The advantages of commercial kits include being easy-to-use, budget-saving, and time-saving. In addition, commercial kits have been used for the detection of SARS-CoV-2 in wastewater samples. For example, the detection of SARS-CoV-2 in drains, canals, and main sewer systems was carried out using a commercial kit (i.e., Sansure RT-PCR kit) in Bangladesh [4]. Additionally, a study in Pakistan also used commercial kits, including the Sansure Biotech SARS-CoV-2 detection kit [5]. Furthermore, the 2019-nCoV Nucleic Acid Diagnostic Kit (Sansure Biotech) was proven to have high clinical performance and sensitivity [6]. Therefore, the kit is reliable for the detection of SARS-CoV-2 in wastewater samples. Moreover, SARS-CoV-2 genetic materials were also reported to circulate in both municipal and hospital wastewater in many countries [7,8,9,10]. Additionally, several SARS-CoV-2 RNA concentrations are related to COVID-19 cases, making wastewater-based epidemiology (WBE) a crucial approach to predicting the next COVID-19 outbreak [9].
In Thailand, the third wave of the COVID-19 outbreak began in the middle of 2021. The number of confirmed COVID-19 cases had increased, and patients with severe or mild symptoms were treated in hospitals [11]. From April to September 2021, the total number of COVID-19 cases reported ranged from 714,684 to 1,249,140, and the total number of deaths increased from 5854 to 12,374. In Thailand, a total of 21,379 and 19,851 new COVID-19 cases were reported on 6 and 20 August 2021, respectively (9186 and 8087 cases were reported in Bangkok and surrounding areas, respectively). In addition, a total of 14,653 and 12,563 new COVID-19 cases were recorded on 3 and 13 September 2021, respectively (6231 and 5064 cases were recorded in Bangkok and surrounding areas, respectively) [12]. Additionally, the Alpha and Delta variants of SARS-CoV-2 were presented as predominant between March and June 2021 [13].
Hospital wastewater is a source of pathogenic microorganisms and toxic substances, which are sources of infection transmission. Several reports have indicated that effluent hospital wastewater has 2–3 times more chemical and biological pollutants than urban wastewater [14]. Some reports have indicated that some viruses can be formed as droplets during the wastewater treatment process and transported to the effluent system [14,15]. In several Asian countries, hospital wastewater may not be properly treated and separately disinfected; consequently, SARS-CoV-2-contaminated wastewater is often discharged into the common municipal sewerage system or directly bypassed into receiving water bodies [16]. Although evidence is scarce, this may increase the risk of infection for individuals who come in contact with the water. Apart from the aforementioned problems, little is known about the SARS-CoV-2 concentrations and the cost-effectiveness of wastewater epidemiology in developing countries. Although the copy numbers of SARS-CoV-2 might be diluted in wastewater, the virus concentration method is a crucial process to concentrate the viral copy numbers. Some studies detected SARS-CoV-2 in domestic and hospital wastewater samples using the ultrafiltration method [8,17]. Therefore, this study used the ultrafiltration method to increase the concentration of SARS-CoV-2 RNA in wastewater because previous studies were conducted using this method as a virus concentration process [18,19,20,21].
Although the risk of COVID-19 has been decreasing due to vaccines and drugs, studying WBE as an early warning technique and minimizing the cost of COVID-19 detection is still important because the public health systems in developing countries are not good enough. Therefore, virus monitoring, especially for SARS-CoV-2 in wastewater, can still be an alternative way to detect and identify the next wave of SARS-CoV-2. Additionally, SARS-CoV-2 genomes have many mutations, which might increase their infectivity and severity [22,23]. To contribute to the WBE concept for the early warning of SARS-CoV-2 spread in developing countries, this study aimed to quantify the RNA concentration of SARS-CoV-2 (concentrations and mutation sites) in wastewater, and to estimate the cost analysis for SARS-CoV-2 detection in wastewater using a commercial kit.

2. Materials and Methods

2.1. Sample Collection, Handling, and Storage of Wastewater Samples

We obtained a total of 150 wastewater samples collected from 147 hospitals and 3 alternative hospitals in Bangkok and surrounding areas. The wastewater samples were sent by the Department of Health, Ministry of Public Health. These hospital wastewater samples were collected from 59 and 91 samples of influent and effluent, respectively, in several hospitals on 6 and 20 August and 3 and 13 September 2021 (Data S1). The locations of wastewater collected from hospitals consisted of ponds, chlorination pools, and wastewater treatment plants, including sequencing batch reactor (SBR) and activated sludge (AS). To monitor SARS-CoV-2 RNA concentrations in hospital wastewater before and after the treatment process for reducing the risk of environmental contamination, personnel wore personal protective equipment (PPE) for hospital wastewater sampling, such as safety glasses, gloves, and face shields. The samples were collected in 1 L sterilized plastic bottles [24]. The hospital wastewater samples were kept on ice and transported on the same day to a biosafety level 2 enhanced laboratory at the Tropical Medicine Hospital building, where they were stored at −80 °C until laboratory analysis within 8–28 days [25]. The samples were used for virus concentration, extraction, SARS-CoV-2 detection, and DNA sequencing.

2.2. Sample Preparation, Concentration, and RNA Extraction

We centrifuged hospital wastewater samples at 4500 g for 20 min and collected the supernatants. Subsequently, the virus concentration process in wastewater samples was performed using the ultrafiltration method using Amicon® Ultra Centrifugal Filters 15 with 10 kDa pore size (Merck Millipore, Darmstadt, Germany). Briefly, 150 mL wastewater samples were centrifuged with 15 mL Amicon® Ultra Centrifugal Filters at 4000 g for 20 min, 10 times [8]. Next, the supernatants remaining on the filters were collected into new tubes and nucleic acids were extracted using the Nucleic Acid Extraction Kit (Zybio, Shenzhen, China) following the manufacturer’s instructions. The recovery rate of this extraction kit is ≥90%. Briefly, 15 µL of proteinase K and 200 µL of supernatant were added to sample wells, and the process was performed using an automatic nucleic acid extractor for 9 min. The volume of extracted RNA was 50 μL, and nuclease-free water was used as a negative control to demonstrate contamination in the extraction process. The RNA quality (A260/A280 ratio) of the extracted samples was measured using Nanodrop (Thermo Scientific™, Waltham, MA, USA).

2.3. Recovery Efficiency of the Ultrafiltration Method

Porcine epidemic diarrhea virus (PEDV) was obtained from the Virology Laboratory of the Department of Microbiology and Immunology, Faculty of Tropical Medicine, Mahidol University. Genome copies (GCs) were measured to evaluate the recovery rate of the ultrafiltration method. PEDV was diluted to 104 GC/µL and spiked into 1 L of SARS-CoV-2-negative wastewater samples. Subsequently, the wastewater samples were randomly aliquoted into 150 mL tubes. Thereafter, the samples underwent the virus concentration process using the ultrafiltration method, as previously mentioned in Section 2.2. Then, 1 mL of the supernatant remaining on the filter was collected into a new tube. The RT-qPCR assay was performed using Luna® Universal one-step RT-qPCR (Biolabs, New England). The primer pair is shown in Table 1. For the amplification of the PEDV M gene, the PEDV standard curve was measured using an RT-qPCR assay (Figure 1) with a synthesized plasmid containing the M gene (GeneArt®, Invitrogen, Thermo Fisher Scientific, Waltham, MA, USA) (Figure S1). This method was performed in triplicate to calculate the recovery efficiency using Formula (1).
Recovery   efficiency   ( % ) = PEDV   concentration   recovered PEDV   concentration   seeded × 100

2.4. Detection, Verification, and Confirmation of SARS-CoV-2 in Hospital Wastewater Samples

SARS-CoV-2 was detected on the extracted samples using the RT-qPCR protocol (Applied Biosystems™ 7500) using the Novel Coronavirus (2019-nCoV) Nucleic Acid Diagnostic Kit (Sansure Biotech, Hunan, China (PCR-Fluorescence Probing)) following the manufacturer’s instructions. The detection kit covers 45 cycles, which amplifies two different SARS-CoV-2 target genes and one human gene, including FAM, ROX, and Cy5 for ORF1ab, N gene, and human RNase P gene, respectively. Positive (2019-nCoV positive) and negative control samples available from the kit were run to validate RT-qPCR testing.
Thereafter, SARS-CoV-2 was detected using the RT-qPCR assay with a commercial kit. SARS-CoV-2-positive wastewater samples were evaluated in a short nested RT-PCR assay with two pairs of primers that amplify the S gene of SARS-CoV-2 to confirm the amplification of the virus by RT-qPCR and verify the mutation sites in the wastewater samples. The first and second rounds of nested PCR had a total of 972 and 973 primers, respectively. The primer sequences are shown in Table 1. These primers can amplify SARS-CoV-2 in wastewater samples using a short nested RT-PCR procedure [18]. Short nested RT-PCR procedures were modified, wherein the Superscript III One-Step RT-PCR System with Platinum Taq DNA Polymerase (Invitrogen, CA, USA) was used to amplify the target region in the first round of RT-PCR. Additionally, Taq DNA Polymerase, Recombinant (Invitrogen, CA, USA) was used for the nested PCR process. PCR products were run on electrophoresis in 1.5% agarose gel and DNA purification; thereafter, the PCR products were confirmed by sequencing.

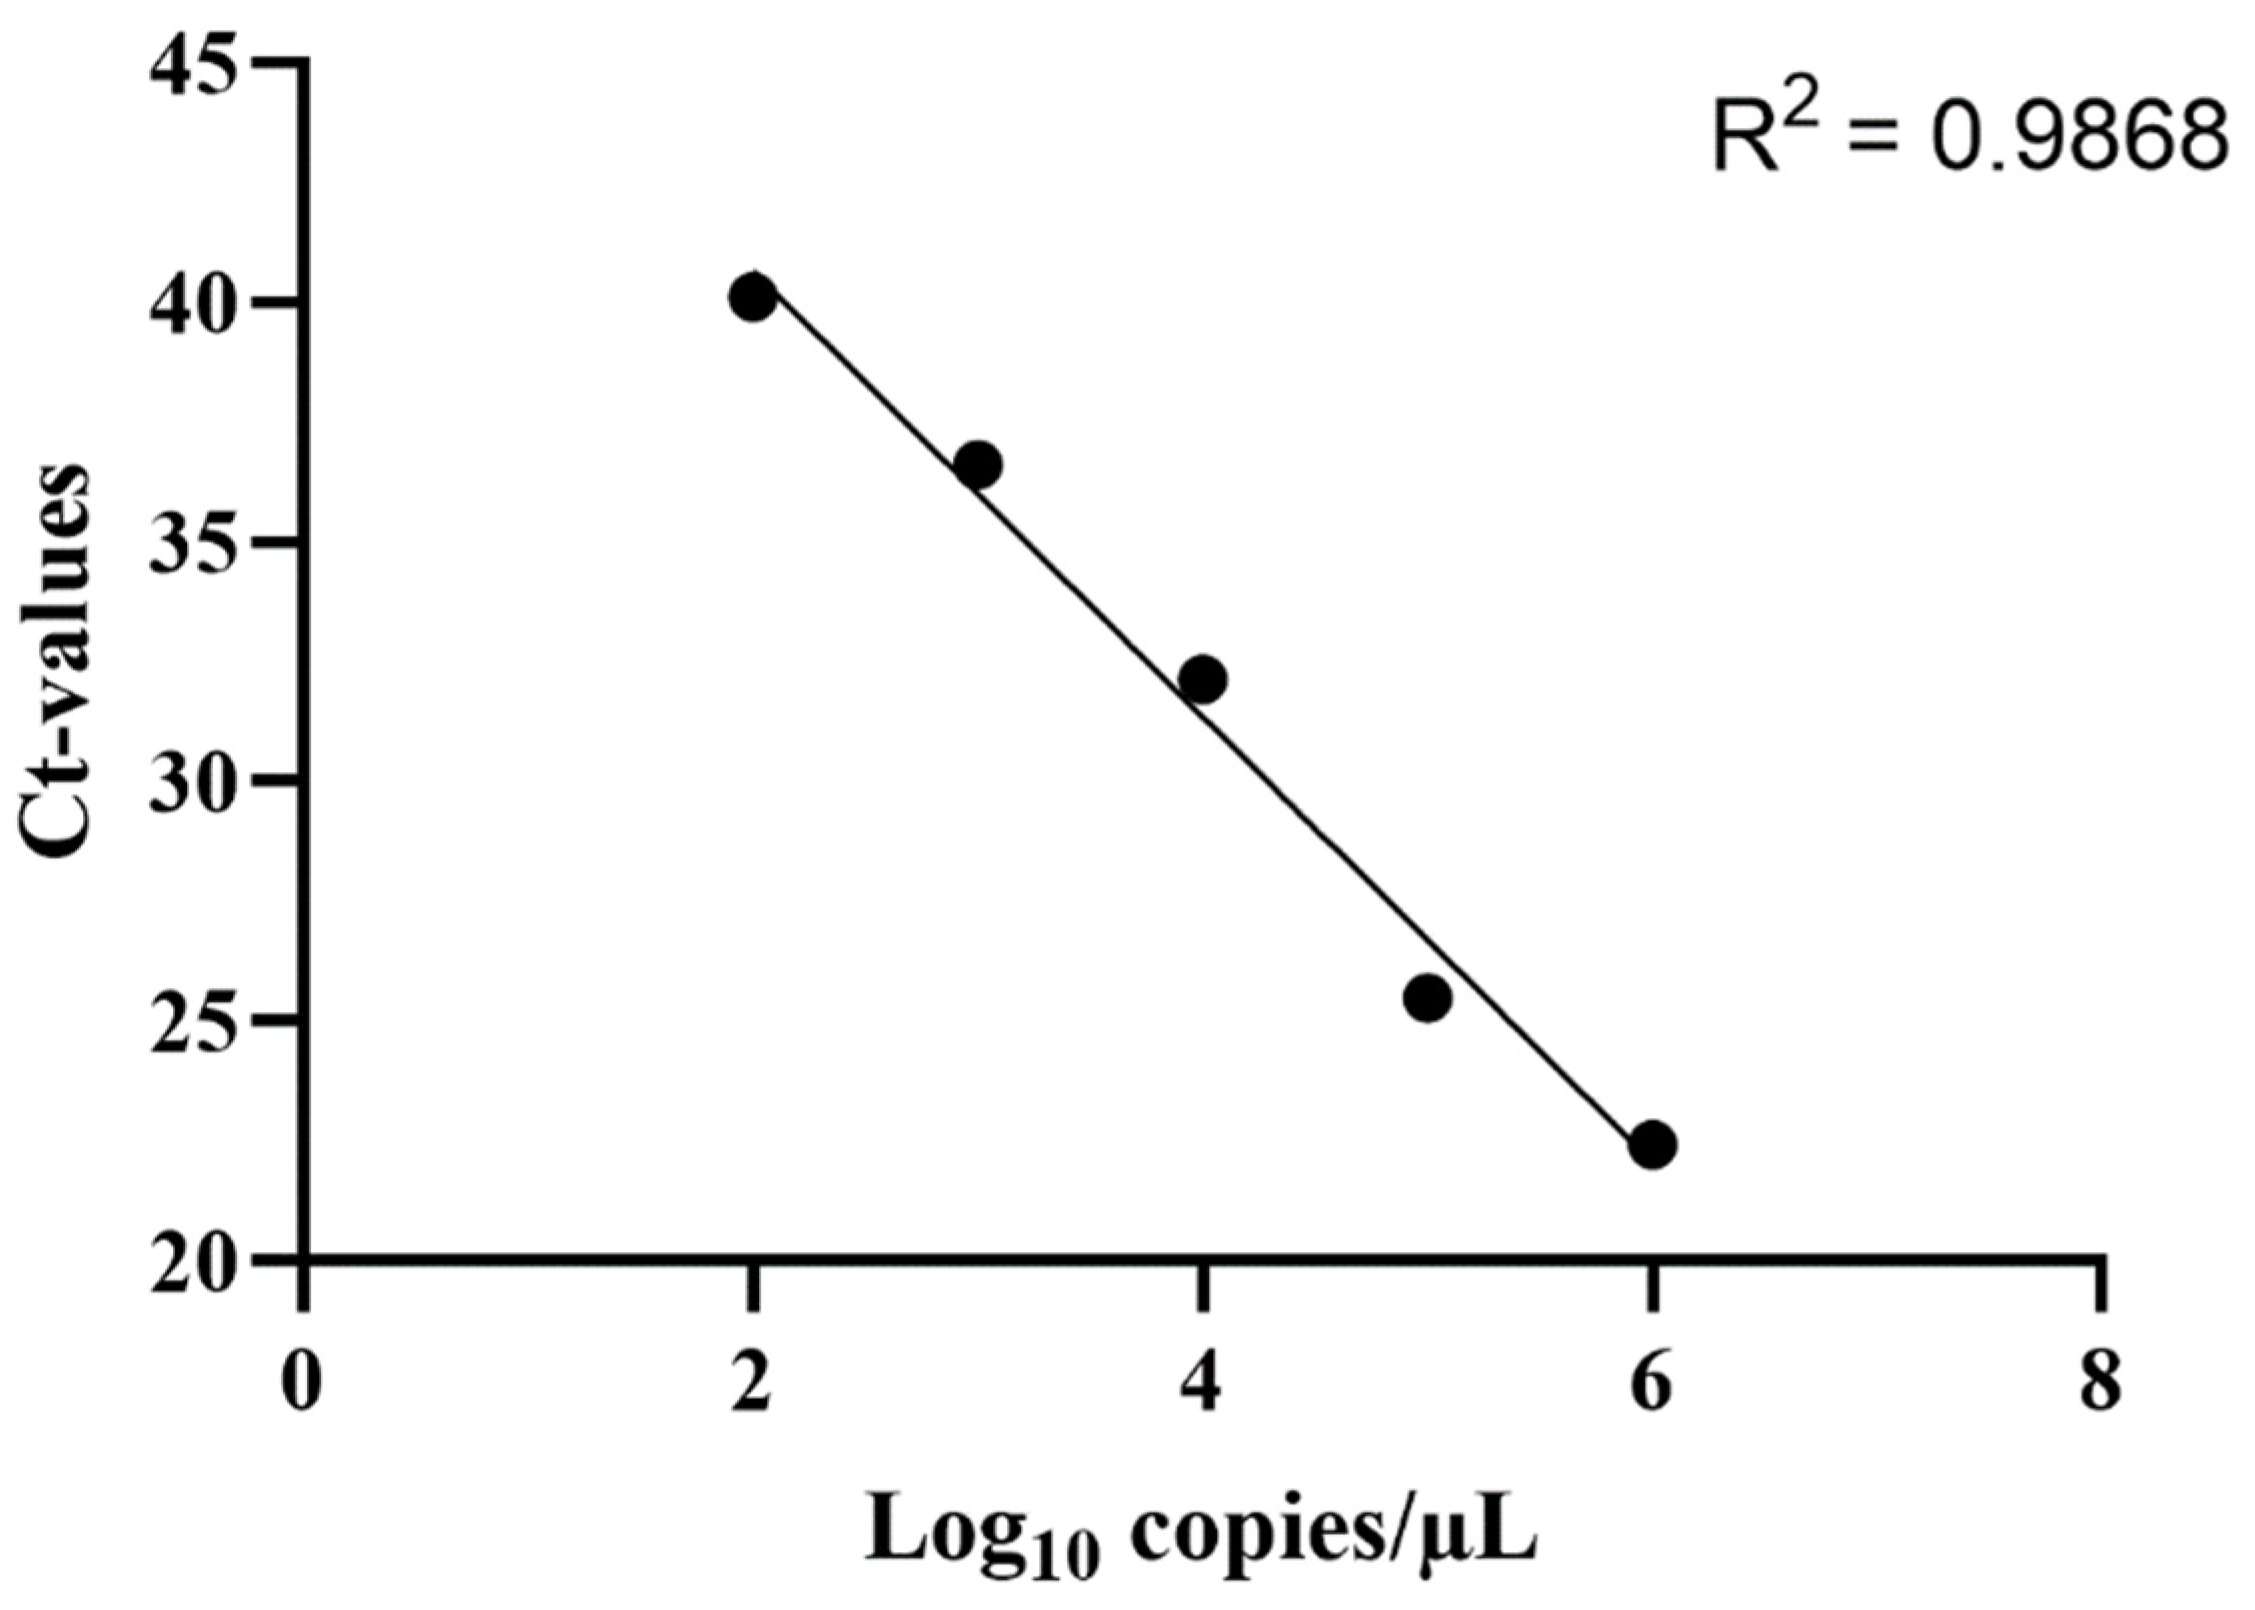
2.5. Quantification of the SARS-CoV-2 RNA Concentration in Hospital Wastewater Samples

The RNA concentration of SARS-CoV-2 in wastewater samples was calculated by comparison with the standard curve using RT-qPCR with 2019-nCoV RUO plasmid control (Integrated DNA Technologies, Iowa, USA (200,000 copies/µL)). The synthesized plasmid was purchased from Ward medic Co., Ltd. The position of the N gene covered Sansure Biotech SARS-CoV-2 detection kit primers, which were used for SARS-CoV-2 quantification in wastewater. The copy numbers of the plasmid were diluted from 101 to 105 copies/reaction. A standard curve was acquired by plotting the cycle threshold (CT) value for each dilution against the log10 copy numbers of the N gene (Figure 2).

2.6. Data Analysis and Cost-Efficiency Analysis

Descriptive analysis was used for the evaluation of the SARS-CoV-2 RNA concentration average between the pre- and post-treatment processes of wastewater samples. In addition, the recovery efficiency of the ultrafiltration method was presented as means ± standard deviations. We analyzed the cost of SARS-CoV-2 detection in wastewater per sample, calculated using the formula below (2). The DNA sequencing process and the presence of SARS-CoV-2 in hospital wastewater samples were confirmed using the SARS-CoV-2 sequence in the NCBI database. Moreover, the mutation analysis of the SARS-CoV-2 partial S gene in the positive samples was performed using CoVsurver.
Cost   estimation   per   sample = Cost   of   SARS - CoV - 2   detection   reagents Detected   wastewater   samples

3. Results

3.1. Calculation of Recovery Efficiency of the Ultrafiltration Method

In this study, we used PEDV as a surrogate to evaluate the recovery efficiency of the ultrafiltration method using Amicon® Ultra Centrifugal Filters. The result showed that the recovery efficiency of the ultrafiltration method was 80.53% ± 23.53%. The result was calculated by comparing the CT value with the standard curve of the synthesized plasmid containing the M gene using an RT-qPCR assay. The R2 of the standard curve was 0.9868 (Figure 1). The centrifugal filter tubes could achieve PEDV concentrations in the range of 3.51–6.23 × 10³ copies/µL from the seeded virus concentration (the seeded virus concentration was 1 × 10⁴ copies/µL) (Table 2).

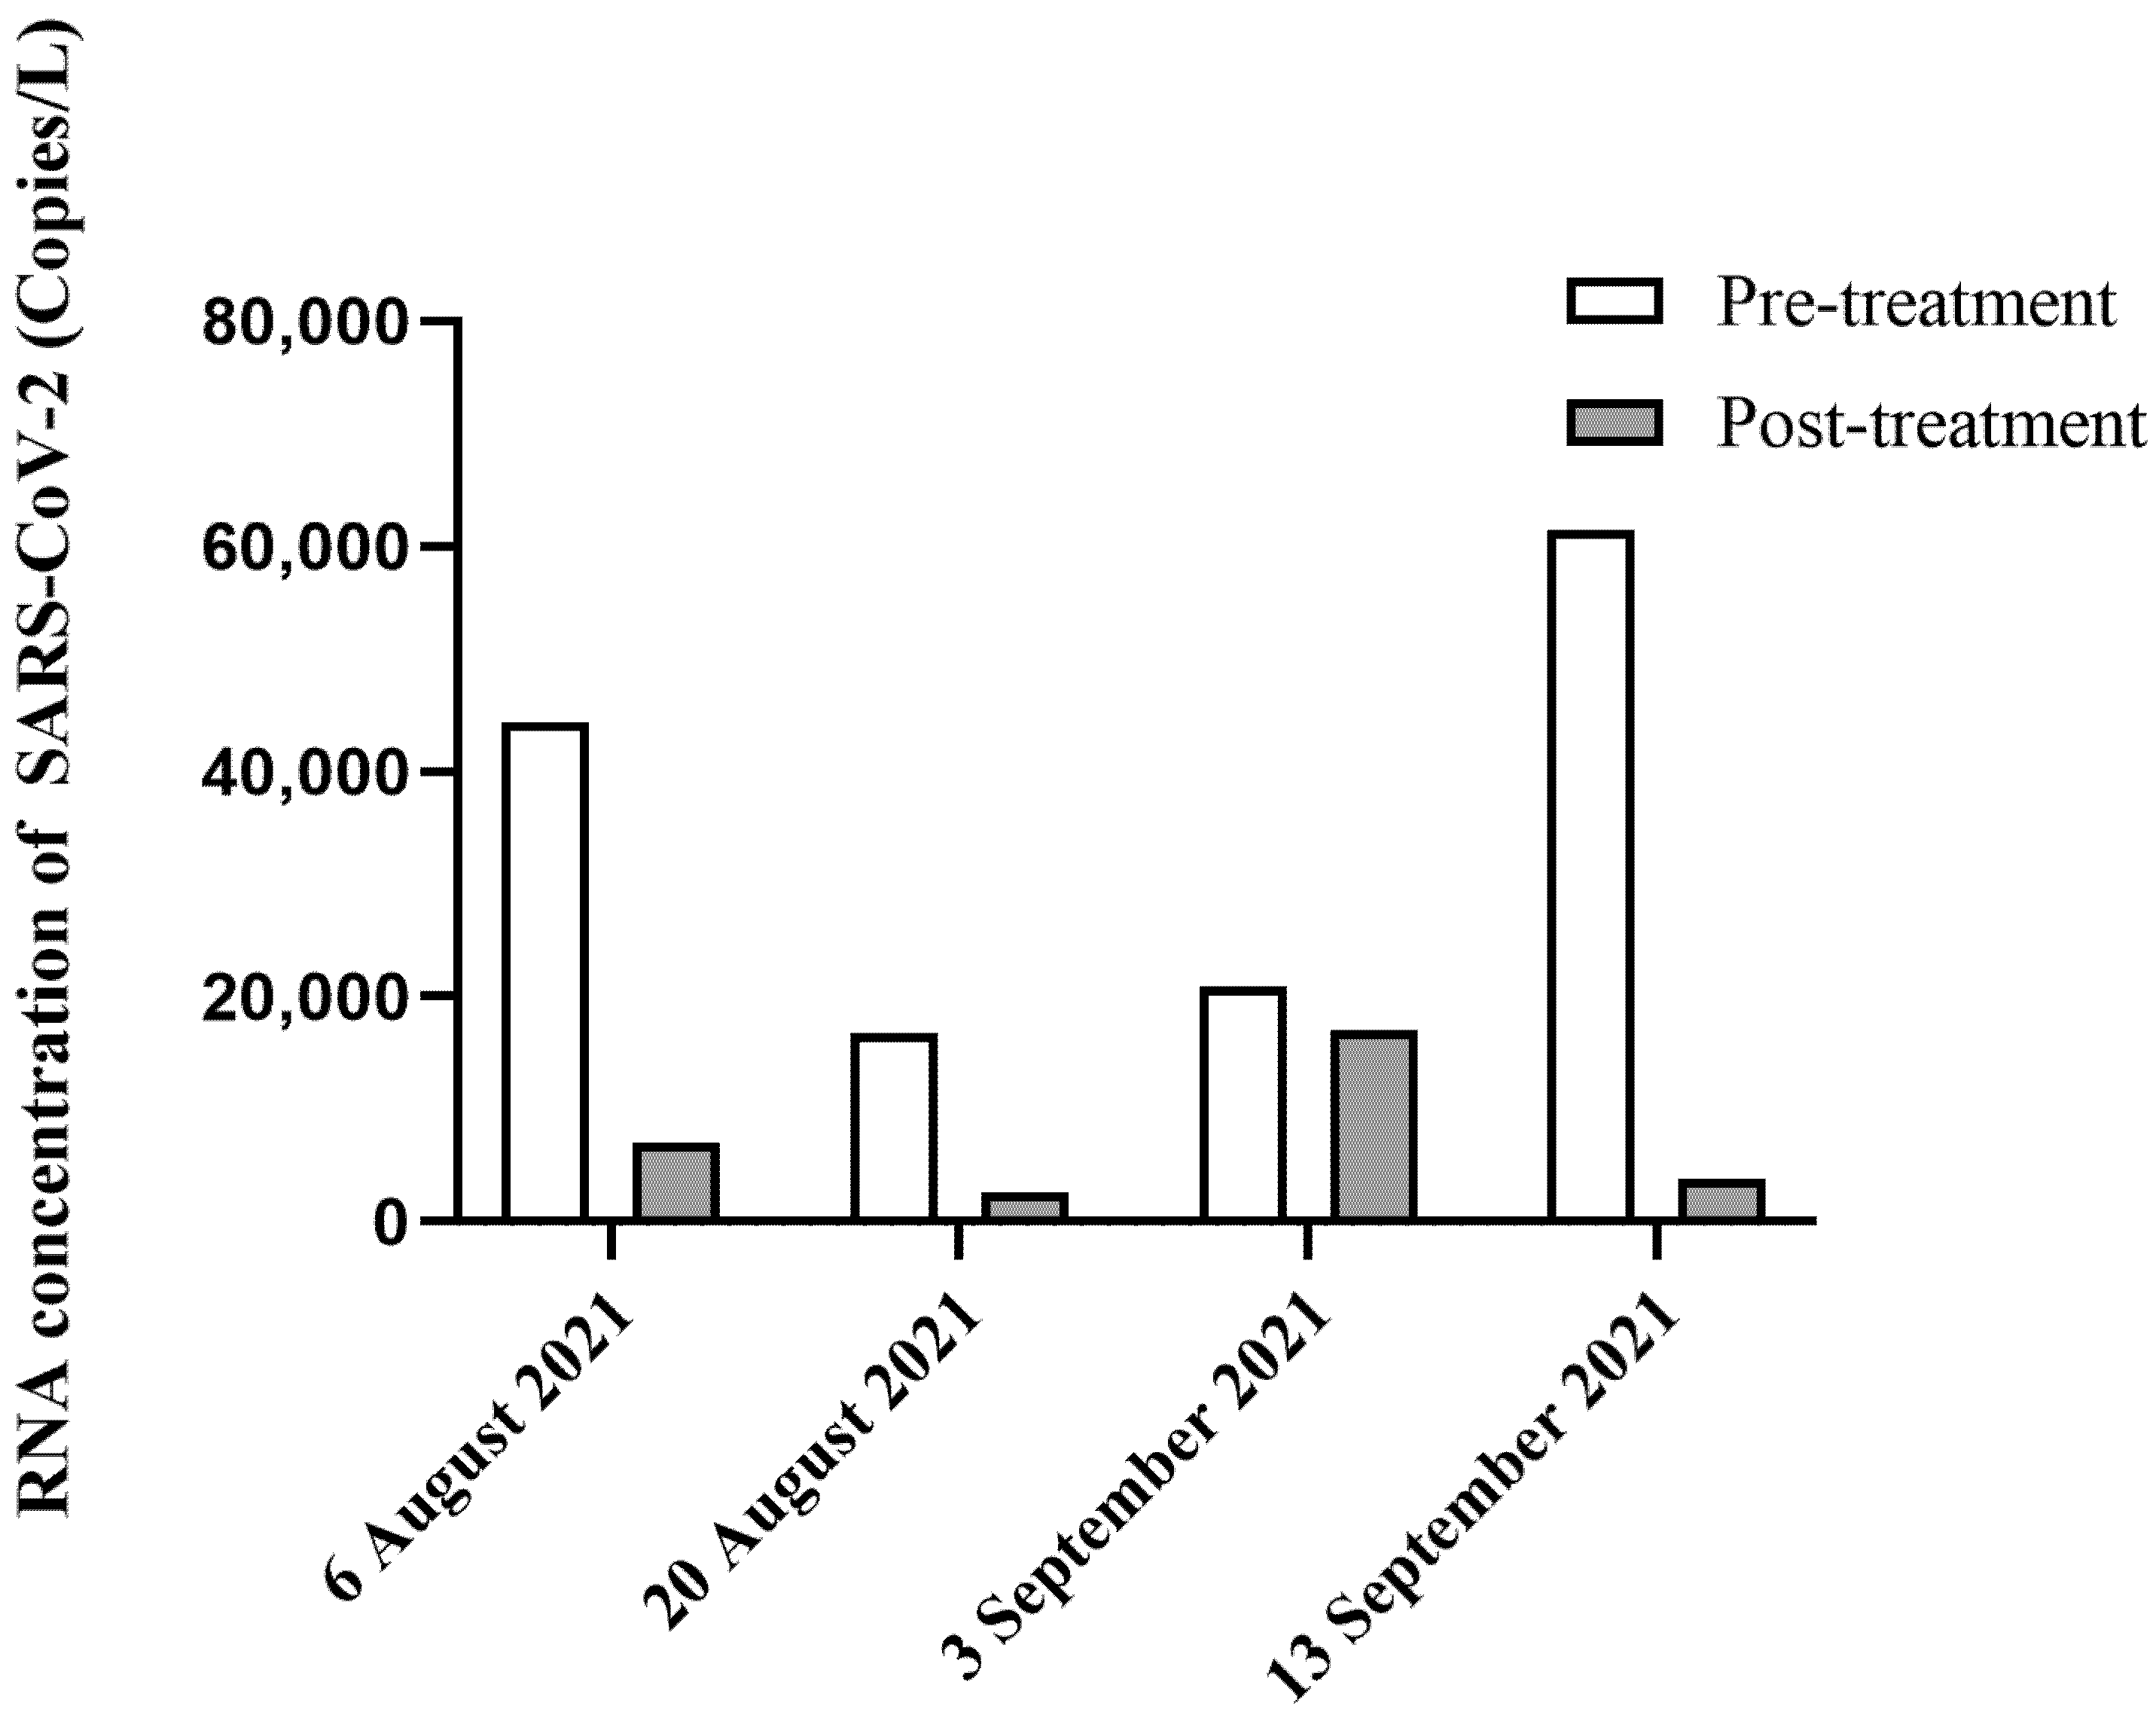
3.2. Detection and Quantification of SARS-CoV-2 RNA in Hospital Wastewater Samples

The RNA quality of all wastewater samples was validated after the RNA extraction process using Nanodrop (Thermo Scientific™, Waltham, MA, USA). The A260/A280 ratio of the wastewater samples ranged from 2.01 to 3.51 (average, 2.59). Of the 150 wastewater samples, 62 (41.3%) were detected with at least one gene, including 39, 45, and 30 of ORF1ab, N gene, and human RNase P gene, respectively. Additionally, of the 150 wastewater samples, SARS-CoV-2 was detected in 37 (24.67%) hospital wastewater samples (Data S2), separated into 25/59 (42.37%) and 12/91 (13.19%) of pre- and post-treatment process samples, respectively. The samples were detected with at least two genes, including ORF1ab and N gene, and interpreted as SARS-CoV-2 positive. The CT values of ORF1ab, N gene, and RNase P gene of hospital wastewater samples ranged between 33 and 40. The SARS-CoV-2-positive wastewater samples numbered 17 and 20 in August and September 2021, respectively. The CT values between the ORF1ab and N genes in some samples were slightly different. Conversely, the RNase P gene was detected in only 30 samples. In addition, the average CT values of the ORF1ab and N genes were 37.8 and 36.71 for the pre-treatment process (25 SARS-CoV-2-positive samples). Moreover, the CT values of the ORF1ab and N genes were 38.75 and 38.74 for the post-treatment process, respectively (12 SARS-CoV-2-positive samples). The highest RNA concentration of SARS-CoV-2 in hospital wastewater was 1.07 × 10⁵ copies/L, which was found in the pre-treatment process of the hospital wastewater. Conversely, the lowest SARS-CoV-2 RNA concentration was 2.25 × 10³ copies/L (Data S3). Furthermore, the average SARS-CoV-2 RNA concentration in the post-treatment process was lower than that in the pre-treatment process (Figure 3). The RNA concentration of SARS-CoV-2 in the hospital wastewater samples was evaluated by comparison with the standard curve (R2 = 0.9931) (Figure 2).

3.3. Cost-Efficiency Analysis for the Detection of SARS-CoV-2 in Wastewater

WBE is a cost-effective approach to detect infected individuals in sampled areas. In this study, we calculated the cost of SARS-CoV-2 detection in hospital wastewater per sample as well as the throughput of the ultrafiltration method. The cost for SARS-CoV-2 detection in wastewater samples, including the virus concentration method, the RNA extraction process, and SARS-CoV-2 detection using RT-qPCR with the Sansure Biotech SARS-CoV-2 detection kit, was USD 35.43. The ultrafiltration method to increase the virus concentration in wastewater samples cost USD 14.96, the RNA extraction process using Zybio cost USD 4.09, and the detection of SARS-CoV-2 using RT-qPCR with a Sansure Biotech SARS-CoV-2 detection kit cost USD 16.38. In addition, we could perform SARS-CoV-2 detection in 48 samples within 1 day (Table 3).

3.4. Mutation Sites of the SARS-CoV-2 Partial S Gene in Hospital Wastewater

In this study, we observed the mutation sites of the SARS-CoV-2 partial S gene in hospital wastewater by short nested RT-PCR. Of the 37 samples, in 19 (51.35%) SARS-CoV-2-positive wastewater samples it was possible to amplify the partial S gene using short nested RT-PCR. The results showed that 11 samples had mutation sites in the partial S gene, including V70del, H69del, V144del (amino acid deletion), T95I, and G142D (amino acid change); all samples were 100% identical to SARS-CoV-2 in the NCBI database (Table 4). In this study, we performed the first and second rounds of short nested RT-PCR with 972 and 973 primers, respectively, which were validated to amplify the SARS-CoV-2 in wastewater samples. This assay could reduce the cost and time required to verify the mutation sites in the partial S gene of SARS-CoV-2. V70del, H69del, and V144del were found in B.1.1.7 (SARS-CoV-2 Alpha variant). Moreover, T95I and G142D were found in B.1.526 (Iota variant), B.1.617.1 (Kappa variant), and B.1.617.2 (Delta variant).

4. Discussion

The recovery efficiency of the ultrafiltration method was calculated for the Amicon® Ultra Centrifugal Filters examination. According to Ahmed et al. 2020 [28], the ultrafiltration method was performed for virus concentration using murine hepatitis virus; the method had a high performance for the recovery of virus in wastewater. In our study, the recovery efficiency of the ultrafiltration method was 80.53 ± 23.526, which is higher than what was obtained in a previous study. However, the recovery rate cannot be compared due to the difference in virus size and strain, including the different properties of the wastewater samples. Nevertheless, the method was used to concentrate SARS-CoV-2 in hospital wastewater in Slovenia [8]. The results showed that the recovery rate obtained using 10 kDa Amicon® Ultra-15 filters was higher than that with 30 kDa filters. In this study, because PEDV is an enveloped RNA virus, it was used as a SARS-CoV-2 surrogate. It is a member of the Coronaviridae family, with a size of approximately 95–190 nm, which is similar to that of SARS-CoV-2 (80–160 nm) [29,30]. This study showed that the recovery rate of the ultrafiltration method was relatively high, owing to the pore size of the filter being approximately 1 nm. The size of the filter could trap the virus particle; however, the particle was easily clotted on the filter.
For the detection and quantification of SARS-CoV-2 in hospital wastewater samples, the CT value of the pre-treatment process was lower than that for the post-treatment process because there were no degradations of SARS-CoV-2 genetic material from the wastewater treatment process, including the number of SARS-CoV-2-positive samples. Additionally, some samples did not show Cy5 for the detection of the RNase P gene because the RNase P gene degrades more easily than SARS-CoV-2 viral genes [4]. Moreover, decreasing SARS-CoV-2 RNA concentration in the hospital wastewater post-treatment process indicated that the treatment process is crucial for SARS-CoV-2 particle elimination, including genetic material. However, the number of hospital wastewater samples was inadequate to calculate the correlation between SARS-CoV-2 RNA concentration and new COVID-19 cases. In developing countries, the budget for the detection of viruses in wastewater is an important factor to consider. Therefore, this study calculated the cost of the detection and quantification of SARS-CoV-2 in hospital wastewater per sample.
Amino acid mutations in SARS-CoV-2 were utilized for monitoring the new variants. Despite the recommendation of SARS-CoV-2 whole-genome sequencing from WHO, the short nested RT-PCR used in this study could represent an alternative choice due to its cost-effectiveness. Additionally, these amino acid mutations were found in hospital wastewater samples and were involved in the increasing pathogenicity of SARS-CoV-2 and decreasing vaccine protection efficiency [31,32]. However, some samples could not be amplified by these primers, which were not associated with the CT value that may be involved in the incomplete SARS-CoV-2 genome in hospital wastewater. Therefore, the results showed that these primers can amplify other variants of clinical interest. Nonetheless, the results of SARS-CoV-2 partial S gene amino acid mutations in hospital wastewater samples were related to the SARS-CoV-2 variants that were clinically detected in Thailand in 2021 [13]. The wastewater samples had a different geographic distribution from that of the previous study, indicating that the primers could be used for screening SARS-CoV-2 partial S gene mutation in wastewater [27].
This study has some limitations. The hospital wastewater samples, including those from the pre-treatment and post-treatment processes, were randomly collected from different locations. Consequently, the quality of hospital wastewater treatment could not be evaluated. In addition, the inhibition of viral detection in wastewater samples in this study was not considered. Hence, we verified the RNA quality of wastewater samples after RNA extraction, indicating that RNA remained in the samples. In addition, SARS-CoV-2-negative wastewater samples were used to test recovery efficiency by spiking PEDV, and plasmid containing the PEDV M gene with a known copy number. The results did not indicate any inhibition in the RT-qPCR reaction. Moreover, the SARS-CoV-2 RNA concentration had no significant correlation with new confirmed COVID-19 cases on each wastewater collection date because there were too few SARS-CoV-2-positive samples. Furthermore, in the early stages of a COVID-19 outbreak, wastewater samples should be continually collected in order to monitor the rise in SARS-CoV-2 RNA concentrations in risk areas.

5. Conclusions

In this study on the detection of SARS-CoV-2 in hospital wastewater in Bangkok and surrounding areas, we found that 37 of 150 (24.67%) wastewater samples had at least two genes, ORF1ab and N genes, using the Sansure Biotech SARS-CoV-2 detection kit. The number of SARS-CoV-2 RNA concentrations in hospital wastewater in the post-treatment process was lower than that in the pre-treatment process. Moreover, deletions and substitutions of amino acids (V70del, H69del, V144del, T95I, and G142D) were found in hospital wastewater samples. Therefore, the primers used in this study revealed that SARS-CoV-2 genetic diversity could be found in hospital wastewater. Therefore, these primers can also be used as an alternative method for SARS-CoV-2 mutation analysis. All these results indicate that wastewater treatment is important to reduce the risk of SARS-CoV-2 contamination in wastewater. Moreover, the Sansure Biotech SARS-CoV-2 detection kit can be used as an alternative way to detect SARS-CoV-2 in hospital wastewater. The advantages of the kit include its convenience, decent cost-effectiveness, and high efficiency in detecting SARS-CoV-2 in hospital wastewater.

Supplementary Materials

The following supporting information can be downloaded at: https://www.mdpi.com/article/10.3390/w14233798/s1, Supplementary Data S1: The number of hospital wastewater samples on each collection date, including pre-treatment and post-treatment processes. Supplementary Data S2: Ct-values of ORF1ab and N genes of positive SARS-CoV-2 in hospital wastewater samples, including the detection rate. Supplementary Data S3: Quantification of the SARS-CoV-2 RNA concentration in hospital wastewater samples. Supplementary Figure S1: Structure of a plasmid containing the PEDV M gene.

Author Contributions

Conceptualization, T.D. and P.L.; Data curation, V.T.; Formal analysis, V.T., T.D., N.K., N.T. and P.L.; Funding acquisition, J.S. and P.L.; Investigation, T.D. and P.L.; Methodology, V.T., P.M., N.T., A.S. and A.J.; Project administration, P.L.; Resources, A.J.; Software, V.T.; Supervision, T.D., N.K., P.M., A.J., J.S. and P.L.; Validation, A.S.; Visualization, T.D., N.K., P.M. and P.L.; Writing—original draft, V.T.; Writing—review and editing, T.D. and P.L. All authors have read and agreed to the published version of the manuscript.

Funding

This research project was supported by the Faculty of Tropical Medicine, Mahidol University, Thailand.

Institutional Review Board Statement

The Ethics Committee of the Faculty of Tropical Medicine, Mahidol University, Thailand waived the need for ethics approval for this non-human study.

Data Availability Statement

Not applicable.

Acknowledgments

The wastewater collection was done by the Department of Health, Ministry of Public Health, Thailand. The facilities in this study were supported by the laboratory staff in the Virology Laboratory, Faculty of Tropical Medicine, Mahidol University, Thailand.

Conflicts of Interest

The authors have no relevant financial or non-financial interests to disclose.

References

  1. Harrison, A.G.; Lin, T.; Wang, P. Mechanisms of SARS-CoV-2 Transmission and Pathogenesis. Trends Immunol. 2020, 41, 1100–1115. [Google Scholar] [CrossRef] [PubMed]
  2. Cevik, M.; Kuppalli, K.; Kindrachuk, J.; Peiris, M. Virology, transmission, and pathogenesis of SARS-CoV-2. BMJ 2020, 371, m3862. [Google Scholar] [CrossRef] [PubMed]
  3. Kutsuna, S. Clinical Manifestations of Coronavirus Disease 2019. JMA J. 2021, 4, 76–80. [Google Scholar] [CrossRef] [PubMed]
  4. Ahmed, F.; Islam, M.A.; Kumar, M.; Hossain, M.; Bhattacharya, P.; Islam, M.T.; Hossen, F.; Hossain, M.S.; Islam, M.S.; Uddin, M.M.; et al. First detection of SARS-CoV-2 genetic material in the vicinity of COVID-19 isolation Centre in Bangladesh: Variation along the sewer network. Sci. Total Environ. 2021, 776, 145724. [Google Scholar] [CrossRef]
  5. Sharif, S.; Ikram, A.; Khurshid, A.; Salman, M.; Mehmood, N.; Arshad, Y.; Ahmed, J.; Safdar, R.M.; Rehman, L.; Mujtaba, G.; et al. Detection of SARs-CoV-2 in wastewater using the existing environmental surveillance network: A potential supplementary system for monitoring COVID-19 transmission. PLoS ONE 2021, 16, e0249568. [Google Scholar] [CrossRef]
  6. Freire-Paspuel, B.; Garcia-Bereguiain, M.A. Clinical Performance and Analytical Sensitivity of Three SARS-CoV-2 Nucleic Acid Diagnostic Tests. Am. J. Trop. Med. Hyg. 2021, 104, 1516–1518. [Google Scholar] [CrossRef]
  7. Ahmed, W.; Angel, N.; Edson, J.; Bibby, K.; Bivins, A.; O’Brien, J.W.; Choi, P.M.; Kitajima, M.; Simpson, S.L.; Li, J.; et al. First confirmed detection of SARS-CoV-2 in untreated wastewater in Australia: A proof of concept for the wastewater surveillance of COVID-19 in the community. Sci. Total Environ. 2020, 728, 138764. [Google Scholar] [CrossRef]
  8. Goncalves, J.; Koritnik, T.; Mioc, V.; Trkov, M.; Boljesic, M.; Berginc, N.; Prosenc, K.; Kotar, T.; Paragi, M. Detection of SARS-CoV-2 RNA in hospital wastewater from a low COVID-19 disease prevalence area. Sci. Total Environ. 2021, 755, 143226. [Google Scholar] [CrossRef]
  9. Hata, A.; Hara-Yamamura, H.; Meuchi, Y.; Imai, S.; Honda, R. Detection of SARS-CoV-2 in wastewater in Japan during a COVID-19 outbreak. Sci. Total Environ. 2021, 758, 143578. [Google Scholar] [CrossRef]
  10. Hasan, S.W.; Ibrahim, Y.; Daou, M.; Kannout, H.; Jan, N.; Lopes, A.; Alsafar, H.; Yousef, A.F. Detection and quantification of SARS-CoV-2 RNA in wastewater and treated effluents: Surveillance of COVID-19 epidemic in the United Arab Emirates. Sci. Total Environ. 2021, 764, 142929. [Google Scholar] [CrossRef]
  11. DDC. COVID-19 Situation in Thailand. Available online: https://ddc.moph.go.th/viralpneumonia/ (accessed on 22 December 2021).
  12. DDC. COVID-19 Situation in Thailand between April and September. Available online: https://ddc.moph.go.th/viralpneumonia/ (accessed on 22 December 2021).
  13. Chookajorn, T.; Kochakarn, T.; Wilasang, C.; Kotanan, N.; Modchang, C. Southeast Asia is an emerging hotspot for COVID-19. Nat. Med. 2021, 27, 1495–1496. [Google Scholar] [CrossRef] [PubMed]
  14. Achak, M.; Alaoui Bakri, S.; Chhiti, Y.; M’Hamdi Alaoui, F.E.; Barka, N.; Boumya, W. SARS-CoV-2 in hospital wastewater during outbreak of COVID-19: A review on detection, survival and disinfection technologies. Sci. Total Environ. 2021, 761, 143192. [Google Scholar] [CrossRef] [PubMed]
  15. Casanova, L.; Rutala, W.A.; Weber, D.J.; Sobsey, M.D. Survival of surrogate coronaviruses in water. Water Res. 2009, 43, 1893–1898. [Google Scholar] [CrossRef] [PubMed]
  16. Pham Ngoc Bao, V.D.C. Environmental Resilience and Transformation in Times of COVID-19; Elsevier: Amsterdam, The Netherlands, 2021. [Google Scholar]
  17. Navarro, A.; Gomez, L.; Sanseverino, I.; Niegowska, M.; Roka, E.; Pedraccini, R.; Vargha, M.; Lettieri, T. SARS-CoV-2 detection in wastewater using multiplex quantitative PCR. Sci. Total Environ. 2021, 797, 148890. [Google Scholar] [CrossRef] [PubMed]
  18. Anderson-Coughlin, B.L.; Shearer, A.E.H.; Omar, A.N.; Wommack, K.E.; Kniel, K.E. Recovery of SARS-CoV-2 from Wastewater Using Centrifugal Ultrafiltration. Methods Protoc. 2021, 4, 32. [Google Scholar] [CrossRef]
  19. Fores, E.; Bofill-Mas, S.; Itarte, M.; Martinez-Puchol, S.; Hundesa, A.; Calvo, M.; Borrego, C.M.; Corominas, L.L.; Girones, R.; Rusinol, M. Evaluation of two rapid ultrafiltration-based methods for SARS-CoV-2 concentration from wastewater. Sci. Total Environ. 2021, 768, 144786. [Google Scholar] [CrossRef]
  20. Fonseca, M.S.; Machado, B.A.S.; Rolo, C.d.A.; Hodel, K.V.S.; Almeida, E.d.S.; de Andrade, J.B. Evaluation of SARS-CoV-2 concentrations in wastewater and river water samples. Case Stud. Chem. Environ. Eng. 2022, 6, 100214. [Google Scholar] [CrossRef]
  21. Lee, W.L.; Imakaev, M.; Armas, F.; McElroy, K.A.; Gu, X.; Duvallet, C.; Chandra, F.; Chen, H.; Leifels, M.; Mendola, S.; et al. Quantitative SARS-CoV-2 Alpha Variant B.1.1.7 Tracking in Wastewater by Allele-Specific RT-qPCR. Environ. Sci. Technol. Lett. 2021, 8, 675–682. [Google Scholar] [CrossRef]
  22. Dao, T.L.; Hoang, V.T.; Colson, P.; Lagier, J.C.; Million, M.; Raoult, D.; Levasseur, A.; Gautret, P. SARS-CoV-2 Infectivity and Severity of COVID-19 According to SARS-CoV-2 Variants: Current Evidence. J. Clin. Med. 2021, 10, 2635. [Google Scholar] [CrossRef]
  23. Li, Q.; Wu, J.; Nie, J.; Zhang, L.; Hao, H.; Liu, S.; Zhao, C.; Zhang, Q.; Liu, H.; Nie, L.; et al. The Impact of Mutations in SARS-CoV-2 Spike on Viral Infectivity and Antigenicity. Cell 2020, 182, 1284–1294.e9. [Google Scholar] [CrossRef]
  24. Hillary, L.S.; Farkas, K.; Maher, K.H.; Lucaci, A.; Thorpe, J.; Distaso, M.A.; Gaze, W.H.; Paterson, S.; Burke, T.; Connor, T.R.; et al. Monitoring SARS-CoV-2 in municipal wastewater to evaluate the success of lockdown measures for controlling COVID-19 in the UK. Water Res. 2021, 200, 117214. [Google Scholar] [CrossRef] [PubMed]
  25. Ahmed, W.; Bertsch, P.M.; Bibby, K.; Haramoto, E.; Hewitt, J.; Huygens, F.; Gyawali, P.; Korajkic, A.; Riddell, S.; Sherchan, S.P.; et al. Decay of SARS-CoV-2 and surrogate murine hepatitis virus RNA in untreated wastewater to inform application in wastewater-based epidemiology. Environ. Res. 2020, 191, 110092. [Google Scholar] [CrossRef] [PubMed]
  26. Wongthida, P.; Liwnaree, B.; Wanasen, N.; Narkpuk, J.; Jongkaewwattana, A. The role of ORF3 accessory protein in replication of cell-adapted porcine epidemic diarrhea virus (PEDV). Arch. Virol. 2017, 162, 2553–2563. [Google Scholar] [CrossRef] [PubMed]
  27. La Rosa, G.; Mancini, P.; Bonanno Ferraro, G.; Veneri, C.; Iaconelli, M.; Lucentini, L.; Bonadonna, L.; Brusaferro, S.; Brandtner, D.; Fasanella, A.; et al. Rapid screening for SARS-CoV-2 variants of concern in clinical and environmental samples using nested RT-PCR assays targeting key mutations of the spike protein. Water Res. 2021, 197, 117104. [Google Scholar] [CrossRef]
  28. Ahmed, W.; Bertsch, P.M.; Bivins, A.; Bibby, K.; Farkas, K.; Gathercole, A.; Haramoto, E.; Gyawali, P.; Korajkic, A.; McMinn, B.R.; et al. Comparison of virus concentration methods for the RT-qPCR-based recovery of murine hepatitis virus, a surrogate for SARS-CoV-2 from untreated wastewater. Sci. Total Environ. 2020, 739, 139960. [Google Scholar] [CrossRef]
  29. Cuevas-Ferrando, E.; Perez-Cataluna, A.; Allende, A.; Guix, S.; Randazzo, W.; Sanchez, G. Recovering coronavirus from large volumes of water. Sci. Total Environ. 2021, 762, 143101. [Google Scholar] [CrossRef]
  30. Yang, Y.; Xiao, Z.; Ye, K.; He, X.; Sun, B.; Qin, Z.; Yu, J.; Yao, J.; Wu, Q.; Bao, Z.; et al. SARS-CoV-2: Characteristics and current advances in research. Virol. J. 2020, 17, 117. [Google Scholar] [CrossRef]
  31. Muttineni, R.; Binitha, R.N.; Putty, K.; Marapakala, K.; Sandra, K.P..; Panyam, J.; Vemula, A.; Singh, S.M.; Balachandran, S.; Viroji Rao, S.T.; et al. SARS-CoV-2 variants and spike mutations involved in second wave of COVID-19 pandemic in India. Transbound. Emerg. Dis. 2022, 69, e1721–e1733. [Google Scholar] [CrossRef]
  32. Jhun, H.; Park, H.Y.; Hisham, Y.; Song, C.S.; Kim, S. SARS-CoV-2 Delta (B.1.617.2) Variant: A Unique T478K Mutation in Receptor Binding Motif (RBM) of Spike Gene. Immune Netw. 2021, 21, e32. [Google Scholar] [CrossRef]
Figure 1. Standard curve of a plasmid containing the PEDV M gene.
Water 14 03798 g001
Figure 2. Standard curve of the SARS-CoV-2 N gene obtained using the Sansure Biotech SARS-CoV-2 detection kit.
Water 14 03798 g002
Figure 3. Average SARS-CoV-2 RNA concentration between the pre- and post-treatment processes.
Water 14 03798 g003
Table 1. Primers for the amplification of the PEDV M gene by using an RT-qPCR assay and primers for short nested RT-PCR to amplify the SARS-CoV-2 S partial gene in wastewater.
PCR IDTarget GeneSequence (5′→3′)UsageSize, bpRef
PEDV_MM gene5′ TGTCTACGGACGTGTTGGTC 3′
5′ AGCTGAGTAGTCGCCGTGTT 3′
RT-qPCR91[26]
972S5′ ACCCTGACAAAGTTTTCAGATCCT 3′
5′ GCTGAGAGACATATTCAAAAGTGCA 3′
1st cycle399–408[27]
973S5′ TTCAACTCAGGACTTGTTCTTACC 3′
5′ TCTGAACTCACTTTCCATCCAA 3′
Nested319–327
Table 2. Recovery efficiency of the ultrafiltration method using PEDV as a surrogate.
ReplicatesPEDV Concentration (log10 Copies of PEDV Recovered)PEDV Copy Numbers per Reaction (5 µL Samples Were Added into Reactions)% Recovery of PEDV% Recovery of PEDV
(Mean ± SD)
13.5453.51 × 10353.480.53 ± 23.526
23.7946.23 × 10394.8
33.7886.14 × 10393.4
Table 3. Cost analysis for the detection of SARS-CoV-2 in hospital wastewater using an RT-qPCR assay.
ProceduresCostCost per SampleThroughput per Day
Virus concentrationUSD 358.98USD 14.9648
RNA extractionUSD 131.03USD 4.09
Detection of SARS-CoV-2USD 393.10USD 16.38
Total costUSD 35.43 per sample
Table 4. Mutation analysis of SARS-CoV-2 S partial gene by using CoVsurver and the identification of SARS-CoV-2 by comparing with reference sequence on the NCBI database.
Tracking IDMutation SitesNCBI Blast
(Accession Number)
HW 8719H69del, V70del, Y144delOP022966.1
HW 8723G142DOX243730.1
HW 8765G142DOX243730.1
HW 8778-OX196900.1
HW 8916T95ION998987.1
HW 8603H69del, V70del, Y144delON909458.1
HW 9234-OX243720.1
HW 9407-OX243686.1
HW 9473-OX243715.1
HW 9574G142DOX243678.1
HW 9733-ON800253.1
HW 9735-OX243720.1
HW 8602H69del, V70delOX243731.1
HW 8769G142DOX243730.1
HW 8597T95IOP022971.1
HW 9021T95I, G142DOP012924.1
HW 9375-OX243696.1
HW 8777-OX243730.1
HW 8587H69del, V70delOX243731.1
Publisher’s Note: MDPI stays neutral with regard to jurisdictional claims in published maps and institutional affiliations.

