Article

Extreme Rainfall Indices in Southern Levant and Related Large-Scale Atmospheric Circulation Patterns: A Spatial and Temporal Analysis

by
Ala A. M. Salameh
*,
Matilde García-Valdecasas Ojeda
,
María Jesús Esteban-Parra
,
Yolanda Castro-Díez
and
Sonia R. Gámiz-Fortis
Departamento de Física Aplicada, Universidad de Granada, E18071 Granada, Spain
*
Author to whom correspondence should be addressed.
Water 2022, 14(23), 3799; https://doi.org/10.3390/w14233799
Submission received: 27 October 2022 / Revised: 18 November 2022 / Accepted: 20 November 2022 / Published: 22 November 2022
(This article belongs to the Special Issue Impacts of Climate Change on Hydrology and Water Resources)

Abstract

:
This study aims to provide a comprehensive spatio-temporal analysis of the annual and seasonal extreme rainfall indices over the southern Levant from 1970 to 2020. For this, temporal and spatial trends of 15 climate extreme indices based on daily precipitation at 66 stations distributed across Israel and Palestine territories were annually and seasonally analyzed through the nonparametric Mann–Kendall test and the Sen’s slope estimator. The annual averages for frequency-based extreme indices exhibited decreasing trends, significantly for the Consecutive Dry Days. In contrast, the percentiles- and intensity-based extreme indices showed increasing trends, significant for extremely wet days, Max 1- and 3-day precipitation amount indices. The study area had expanding periods of extreme dry spells for spring and correspondingly shortening extreme wet spells for spring, winter and the combined winter–spring. Moreover, most of spring indices showed negative trends. Conversely, most winter indices displayed positive trends. Regarding the influence of large-scale circulation patterns, the North Sea Caspian pattern, the Western Mediterranean Oscillation, and ENSO were the primary regulators of the winter, spring, and autumn extreme indices, respectively. These findings contribute to a better understanding of extreme rainfall variability in the Levant region and could be utilized in the management of water resources, drought monitoring, and flood control.

1. Introduction

Changes in extreme rainfall events must be assessed since they have extensive implications for human and environmental systems such as society, ecosystem, agriculture, water resources, and economic development [1,2,3,4]. Global warming has the potential to increase the frequency and intensity of extreme rainfall, where a warmer atmosphere with more water vapor creates a more active hydrological cycle [5,6,7,8]. Furthermore, small changes in mean precipitation due to global warming can cause significant changes in extreme precipitation [9,10]. On global and regional scales, many studies predict that under global warming, a greater increase is expected in extreme rainfall events as compared to the mean values [11,12,13,14]. In this context, numerous studies have reported increasing trends in extreme rainfall events in Saudi Arabia [15], Greece [16], India [17], the Mediterranean basin [18,19], and globally [20,21,22]. On the other hand, decreasing trends in extreme rainfall events were documented in many regions such as Turkey [23], Western Australia [24], northeast Bangladesh [25], Mongolia [26], and Ghana [27].
In the second half of the twentieth century, the Mediterranean region experienced a decrease in precipitation [28]. This trend is expected to continue, with total annual precipitation decreasing by up to 20% by 2050 [29]. In Turkey, Cyprus, Lebanon and Israel, the number of rainy days may decrease by 5–15 days at the mid-century and by 10–20 days per year at the end-of-century [30]. Additionally, in the framework of several paleo-hydrological and longer-term millennial-scale studies suggested a drying of regional climate that coincides with the decline of the Roman and Byzantine Empires in the Levant region [31,32,33]. The east Mediterranean area, including the Levant region, is considered one of the most vulnerable regions to climate change [11,34,35,36]. Climate variability in the Levant is accompanied by several environmental and developmental stresses such as frequent droughts, water shortages, population growth, political conflicts, weak infrastructure, and low adaptation capacity [37,38,39,40].
A literature review for the Levant indicates most climate studies have focused on long- and mid-term averages, with the majority of studies implemented in small geographical domains with a limited number of stations [41,42,43,44,45]. There have not been many studies on extreme temperature or precipitation indices, mostly because there are not much accessible daily data for the area. However, [46] examined the annual changes in extreme temperature and precipitation indices over Israel during 1950–2017. The authors observed a decline in the total amount of precipitation as well as a rise in the intensity of rainy days. They displayed a spatial coherence despite the fact that none of the regional patterns in the precipitation indices were statistically significant. [47,48] analyzed the changes of several extreme indices in the Middle East and Arab regions, but their studies included less than ten stations from the Levant region. The findings indicated that trends in precipitation indices, including the number of days with precipitation, the average precipitation intensity, and maximum daily precipitation events, are weak in general and do not show spatial coherence. Extreme temperature indices over Israel and Palestine, at annual and seasonal scales, using data of 28 stations from 1987–2017 were examined by [49]. They also examined their relationships with the large-scale atmospheric circulation patterns, but the study did not analyze any extreme rainfall indices.
Investigating the influence of the large-scale atmospheric circulation patterns on the extreme rainfall indices is vital to establish the basis for understanding the causes of rainfall variability and the causal mechanisms of these indices. For the Levant, most studies analyzed the influence of the large-scale circulation patterns on the mean precipitation values in Israel [50,51,52,53]. However, [54] looked at teleconnections regarding different rainfall daily intensities, including heavy precipitation.
Due to the fact that extreme indices have been found to be highly correlated with meteorological and hydrological disasters such as droughts, floods, and landslides [55,56], the necessity to investigate the variability of extreme rainfall indices in a region like the Levant is imperative. Until now, the extreme precipitation indices have not been analyzed at a seasonal scale in the southern Levant, where the study of precipitation changes using only the annual time scale may mask some considerable variations between seasons [57]. Moreover, the impact of the large-scale atmospheric circulation patterns on the extreme rainfall has not been investigated in southern Levant. Therefore, understanding the spatio-temporal variability of extreme precipitation and its related large-scale climate teleconnections mechanism in such a vulnerable region is essential to comprehend the extreme events response to global warming and finding better procedures to deal with water resources management.
The main objectives of this study are: (1) to provide a comprehensive spatio-temporal variability and trends analysis for the annual and seasonal extreme rainfall indices over the whole area of Israel and Palestine during the period 1970–2020; and (2) to investigate the relationships between the extreme rainfall indices in the southern Levant and the main large-scale atmospheric circulation patterns in the Northern Atlantic and Mediterranean Basin.

2. Materials and Methods

2.1. Study Area

The study area covers Israel and Palestine, which are located on the eastern edge of the Mediterranean Sea, roughly between 34°15′ E and 35°40′ E and 29°30′ N and 33°15′ N (Figure 1). It also conforms the western section of the southern Levant, with an area of about 27,000 km2, and an elevation ranging from 392 m below sea level to 1208 m above sea level. According to the Köppen climate classification, the northern and central parts of the region have a Mediterranean climate (type Csa), while the southern and southeastern parts have semiarid (type BSh) and arid (type BWh) climates. The rainy season lasts from September to May, with 67% of annual precipitation falling in winter (December–February), 16% in spring (March–May), and 17% in autumn (September–November).

2.2. Data and Quality Control

Observed daily precipitation data of an initial set of 75 stations distributed over Israel and Palestine were obtained from the Israel and Palestine Meteorological Departments (https://ims.data.gov.il, accessed on 1 May 2021 and http://www.pmd.ps/, accessed on 1 May 2021), respectively. Each station with a minimum record duration of 51 years (1970–2020), except for the Elqana and Karmel stations from the West Bank (Table S1), covered the period 1982–2020. Time series were subjected to a rigorous data quality control process to identify systematic errors (e.g., negative values or typing errors), missing data, and outliers [47,58].
A total of 66 stations with very few missing data (<0.42%) were considered in the analyses (Figure 1, Table S2). These missing days were handled using the spatial interpolation method based on nearby stations (distance < 8 km and correlation > 0.90) [49,59]. The software package RClimDex V1.3 allows for the detection of outliers on a daily timescale, with a range of thresholds for flagging unreliable data. The outliers were visually evaluated and compared with other nearby stations. In addition, the homogeneity for the selected daily time series was tested to avoid any false trends caused by any anthropogenic effects. The R-based ‘RHtests_dlyPrcp,V4′ software, based on the transPMFred algorithm [60], was used to detect multiple change points in the series, and adjust them using the ‘quantile-matching’ algorithm [61]. This technique is commonly used to detect change points in daily rainfall time series [62,63,64]. Finally, a total of 15 break points were detected in 15 out of 66 stations used in this study (Table S1 in Supplementary Material). Additional information about stations, including names, coordinates, and the period of record, as well as the missing values, is listed in the supplementary materials (Table S2 in Supplementary Material).

2.3. Methods

2.3.1. Indices of Extreme Precipitation

A total of 15 extreme precipitation indices were chosen based on 27 temperature and precipitation indices established by the Expert Team on Climate Change Detection Monitoring and Indices (ETCCDI) [12,65] and recommended by the World Meteorological Organization-Commission for Climatology (WMO-CCI). Table 1 contains a brief description of these indices, along with their acronyms. These indices were selected based on previous studies in the study area and Arab region [46,47,48,66], in order to evaluate the characteristics of extreme precipitation events, such as intensity, duration, and frequency. Following [20], a classification of extreme precipitation indices into five categories was used, with threshold indices (e.g., R1mm, R10mm, R20mm, and R50mm), absolute indices (e.g., Rx1day, Rx3day, and Rx5day), extreme percentiles (e.g., R95P and R99P), duration indices (CDD and CWD), and other indices (PRCPTOT, SDII, R95Ptot, and R99Ptot).
The software package RClimDex v1.0 [67] developed by the Climate Research Branch of the Meteorological Service of Canada was used to calculate the extreme indices. The software and documentation are available at http://etccdi.pacificclimate.org, accessed on 1 August 2021. Such software performs the calculations using daily data and provides monthly and annual data for the indices. All indices were computed at annual time scale and at seasonal scale for PRCPTOT, R1mm, R10mm, R20mm, RX1day, RX3day, RX5day, and SDII indices. Additional index calculations such as consecutive dry days (CDD) and consecutive wet days (CWD) were performed for the wet months (e.g., CDD/CWD-DJF, CDD/CWD-MAM, and CDD/CWD-DJFMAM). Days from December to the end of February (DJF) were considered for winter, March to May (MAM) for spring and from September to November (SON) for autumn.

2.3.2. Trend Detection

The annual and seasonal trends of the various indices for each station were calculated for the period 1970–2020. The analysis was performed using the robust nonparametric Mann–Kendall test [68,69] with Sen’s slope estimator [70], since it is a distribution-free test and less sensitive to outliers [71]. The Man–Kendall test has been widely used to assess the monotonic trend in extreme precipitation events and climatological time series globally and regionally [20,72,73,74]. All the time series were pre-whitened in order to correct the Mann–Kendall test for serial autocorrelation [71,75]. The statistical significance of the trends was assessed at 0.01 and 0.05 levels. This trend analysis was conducted using the R package “modifiedmk” [76].

2.3.3. Teleconnection Indices

Additionally, the monthly values of seven teleconnection indices, the North Atlantic Oscillation (NAO), the East Atlantic (EA) pattern, the EA/Western Russia (EA/WR) pattern, the Mediterranean Oscillation (MO), the Western Mediterranean Oscillation (WEMO), the North Sea-Caspian (NCP) pattern and El Niño-Southern Oscillation (ENSO), for the period 1970–2020 were collected from the Climate Prediction Center of the National Oceanic and Atmospheric Administration (http://www.cpc.ncep.noaa.gov/data/teledoc/telecontents.shtml, accessed on 1 September 2021), from the Climatic Research Unit of the University of Norwich (https://crudata.uea.ac.uk/cru/data/moi/, accessed on 1 September 2021) for MO and NCP, and from the Group of climatology of the University of Barcelona (http://www.ub.edu/gc/en/2016/06/08/wemo/, accessed on 1 September 2021) for WEMO. These monthly values were averaged to obtain seasonal and annual values. Afterward, their influence on the extreme precipitation indices was examined by using the Pearson correlation, as in other studies [77,78] based on detrended series for each station. The statistical significance of the correlations was assessed at the 5% level.

3. Results

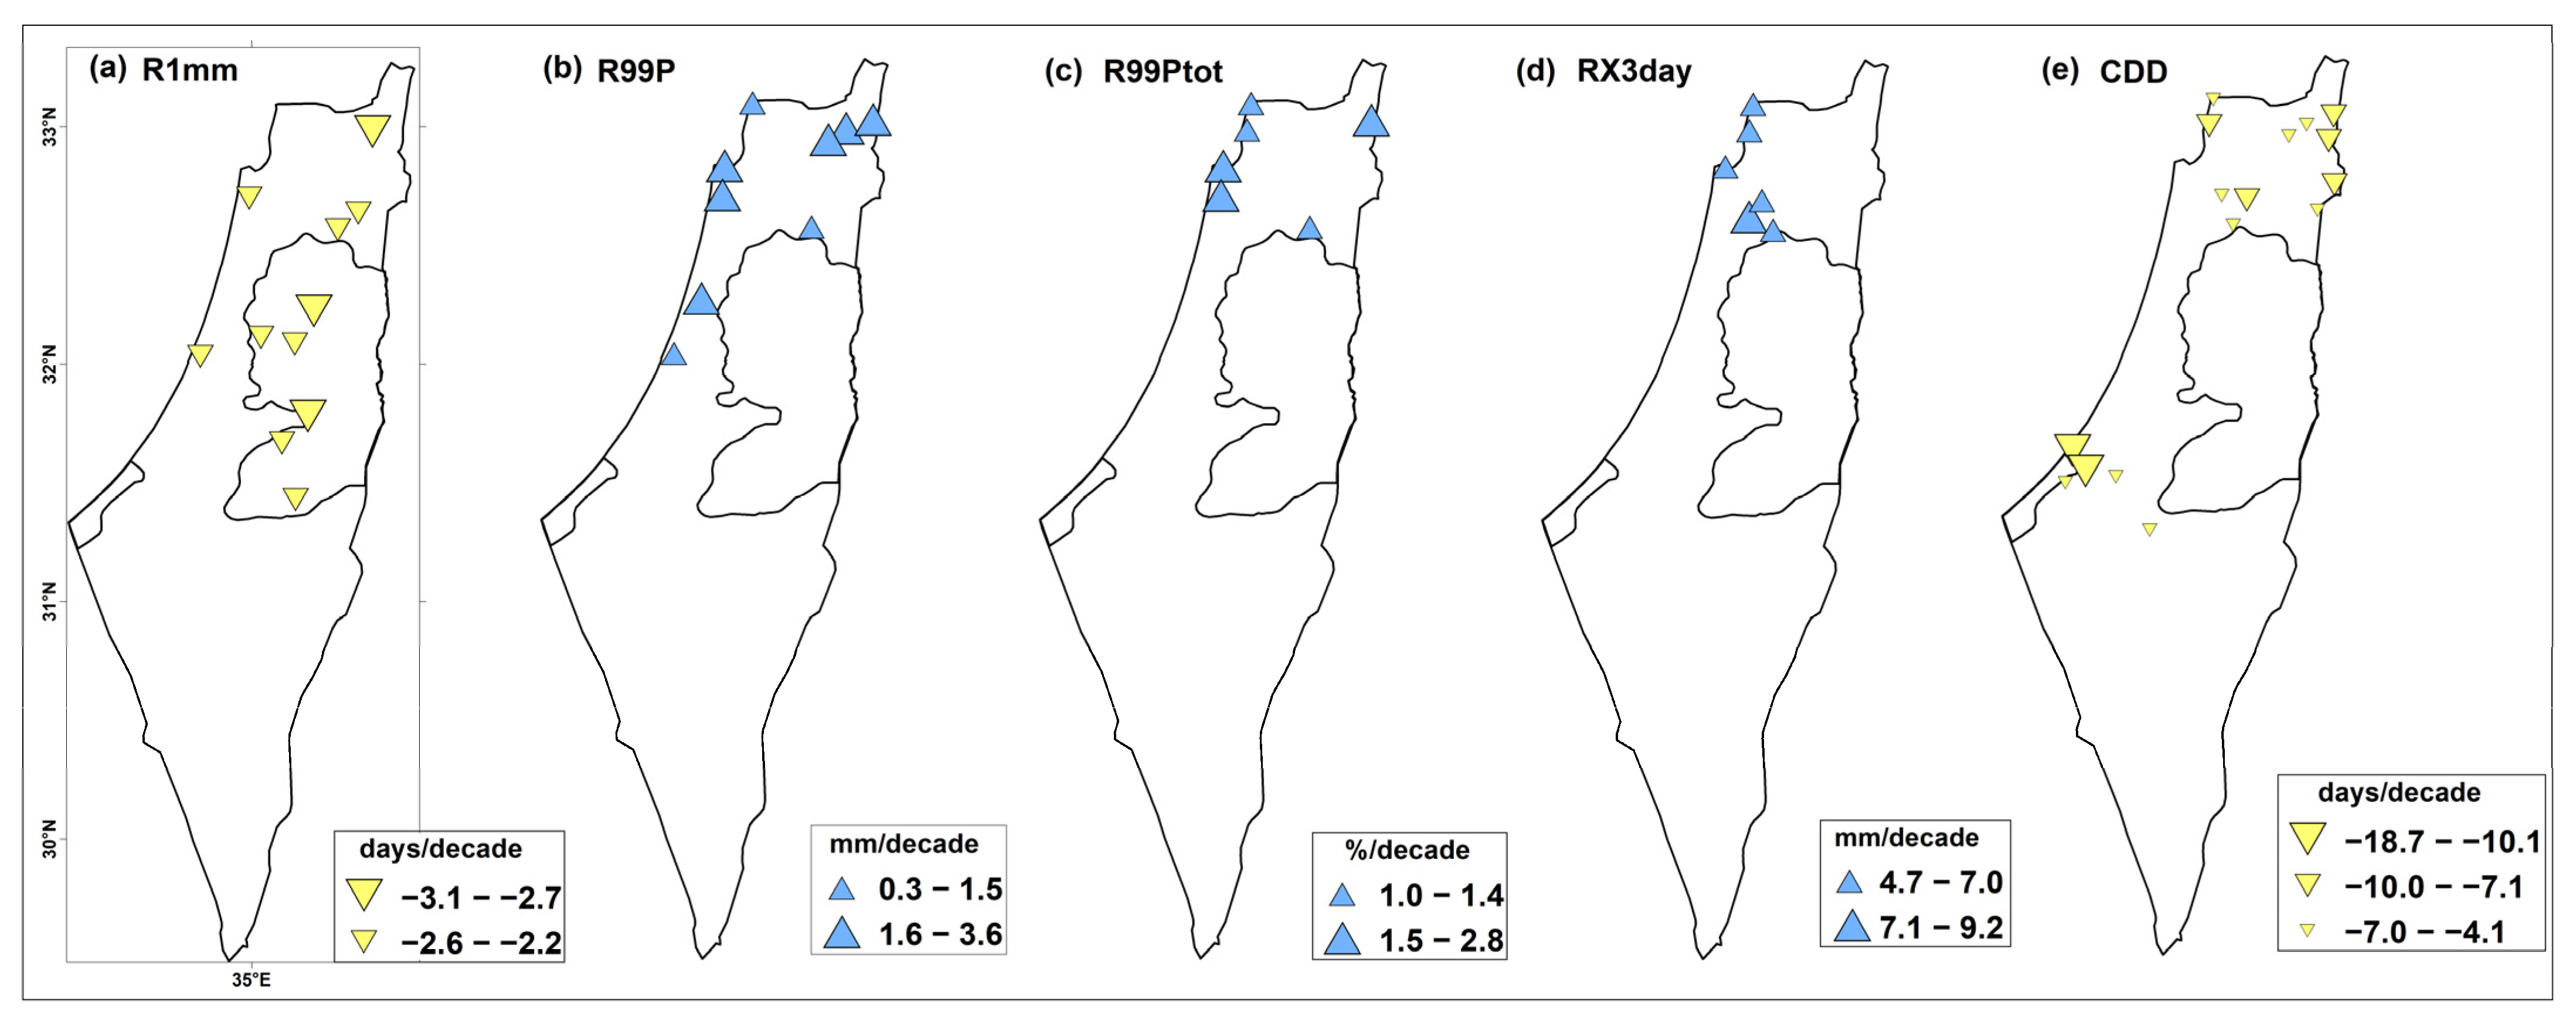
3.1. Annual Trends of Extreme Precipitation Indices

Table 2 shows an overall view of the annual trend analysis through the total number of stations with increasing or decreasing trends, as well as the trends of the averaged time series over the study area from 1970 to 2020. The temporal behavior of some indices that exhibited significant increasing or decreasing trends is shown in Figure S1 in the Supplementary Material. More than 62% of the stations showed decreasing trends in the PRCPTOT, R1mm, R10mm, and CDD indices (Table 2). In contrast, the R95P, R95Ptot, RX1day, RX3day, RX5day, SDII, and CWD indices increased in more than 72% of the stations. For all extreme indices, the frequency of significant decreasing or increasing trends was less 16 stations, and between 38–86% of the stations did not exhibit trends in the R20mm, R50mm, R99P, and R99Ptot indices. The results showed significant increasing trends in the R99P (4.4 mm/decade), R99Ptot (0.78%/decade), RX1day (1.7 mm/decade), and RX3day (2.1 mm/decade) indices (Table 2, Figure S1a–d). On the other hand, a significant decreasing trend was observed for the CDD index (−2.7 day/decade) (Table 2, Figure S1c).
Regarding the spatial distribution of the annual trends (Figure 2), the significant decreasing trends cover the west bank (with an average of −2.3 days/decade) and some northeastern locations of the study area for the R1mm index (Figure 2a). Significant increasing trends are observed in the northern regions for some intensity extreme indices, R99p, R99Ptot, and RX3day by averages of 2.1 mm/decade, 1.9%/decade, and 6.5 mm/decade, respectively (Figure 2b–d). For the CDD index (Figure 2e), a regional significant decreasing trend is grouped in the northern sites of the study area (with an average value around −6.5 days/decade) and the southern coastal locations (with value of −9.2 days/decade in average).

3.2. Seasonal Trends of the Extreme Precipitation Indices

In this section, the seasonal trends for the PRCPTOT, R1mm, R10mm, R20mm, RX1day, RX3day, RX5day, SDII, CWD and CDD indices were calculated for each station and for the entire study area on the basis of the averaged time series (Table 3). Figure 3, Figure 4 and Figure 5 show the spatial distribution of the trends of some winter, spring, and autumn indices.

3.2.1. Winter Trends

Significant trends in the averaged time series were not found for all extreme indices, except for the RX1day index with an averaged value of 2.2 mm/decade (Table 3). The spatial distribution of some winter indices trends is shown in Figure 3. Overall, the extreme winter indices do not seem to change very quickly locally, as very few significant trends were observed (<11 stations) for all indices (Table 3).
The highest increasing trends for the PRCPTOT index were observed in the northern and northwestern locations by an average of 19.1 mm/decade, although they were not-significant (not shown). A percent of 91% of stations exhibited decreasing trends for the number of wet days index (Table 3), with significant values between −1.5 and −2.1 days/decade for some stations (Figure 3a). Additionally, these large declining trends in R1mm along with the increasing trends in the PRCPTOT index are reflected in the rising trends for the SDII index, as is mainly observed in the northern regions of the study area (Figure 3b). In this regard, eleven northern locations showed significant rising trends in the SDII index with an averaged value of 0.71 mm/decade.
Figure 3. Spatial distribution of winter trends for some indices that exhibited notably significant decreasing (yellow triangles) or increasing (blue triangles) trends. Legend for RX1day and RX3day indices is common.
Water 14 03799 g003
According to Figure 3c,d regarding the RX1day and RX3day indices, the central and northern regions vastly showed increasing trends, but only significant values were obtained for some northern locations with an averaged values around 4.7 and 8.1 mm/decade, respectively.

3.2.2. Spring Trends

Compared with other seasons, all spring extreme indices showed very rapid changes (Table 3, Figure 4). The results indicate that, in average for the whole area, the trends for the indices RX1day, RX3day, and SDII decreased significantly by −2.1, −3.6, and −0.52 mm/decade, respectively (Table 3). On the contrary, the CDD-MAM and CDD-DJFMAM indices showed significantly increasing trends of 1.5 and 1.7 days/decade, respectively (Table 3).
For the PRCPTOT index, a percentage of 97% of the stations (64 stations) showed a decreasing trend, with 28% (18 stations) showing a significant trend at the level of 0.05 (Table 3). Locally, a coherent and intense pattern of significantly decreasing trends can be seen (Figure 4a). The northern stations, Jerusalem Governorate, and the central region of the coastal areas had the highest values (around −8.9 mm/decade).
Figure 4. Spatial distribution of spring trends for some indices that exhibited notably decreasing (yellow triangles) or increasing (blue triangles) trends. Legends for RX1day, RX3day and RX5day, and for CDD-MAM and CDD-DJFMAM, are common, respectively.
Water 14 03799 g004
For the R1mm index, 89% of the stations (Table 3) showed decreasing trends, and 14% (8 stations) of them reported significant trends. The R1mm index had a lower trend than the PRCPTOT for the most studied stations. It is also worth noting that the significant trends affected stations in the West Bank with an average of −0.89 days/decade. With respect to the SDII (Figure 4c), 91% of the stations showed decreasing trends, and 32% (19 stations) of them showed significant trends (Table 3). Although the R1mm index decreased at most sites, the SDII index also decreased due to the large decreases in the PRCPTOT index. Most stations that had a significant decreasing trend in the PRCPTOT index also showed a significant decreasing trend in the SDII index. The highest significant decreasing trends (with value from −0.9 to −1.1 mm/decade) were observed at ten locations in the northern regions.
For RX1day, RX3day, and RX5day indices, more than 94% (>62 stations) of the total stations showed decreasing trends, with significant trends for 33%, 31%, and 23% of the stations, respectively (Table 3, Figure 4e,g). The significant declining trends for these indices are concentrated in northern locations, the Jerusalem governorate, and east to the Gaza strip with an average value of −5.2 mm/decade for the RX3day and RX5day indices, and −2.9 mm/decade for the RX1day.
The CDD index in spring showed rising trends in 89% (59 stations) of the total stations, with significant trends in 36% (21 stations) of them (Figure 4g and Table 3). Very similar results were obtained for the CCD index for the combined winter and spring seasons, which also showed increasing trends in 88% (58 stations) of the stations, with significant trends in 20% (20 stations) of them (Figure 4h and Table 3). The significant increasing trends for CDD-MAM and CDD-DJFMAM (Figure 4g,h) covered many stations in the north of the study area and around the Gaza strip, with relatively higher values for the CDD-DJFMAM index (2.5 day/decade) than the CDD-MAM (2.1 day/decade).
The broad increasing trends for CDD-MAM index have led to the broad decreasing trends in CWD-MAM index (Table 3, Figure 4i). For this latter, 80% of stations had declining trends, with significant trends in 30% of stations (Table 3). These significant decreasing trends covered the central locations in the study area and many locations in the southern part of the coastal area, reaching an average value of −1.5 day/decade.

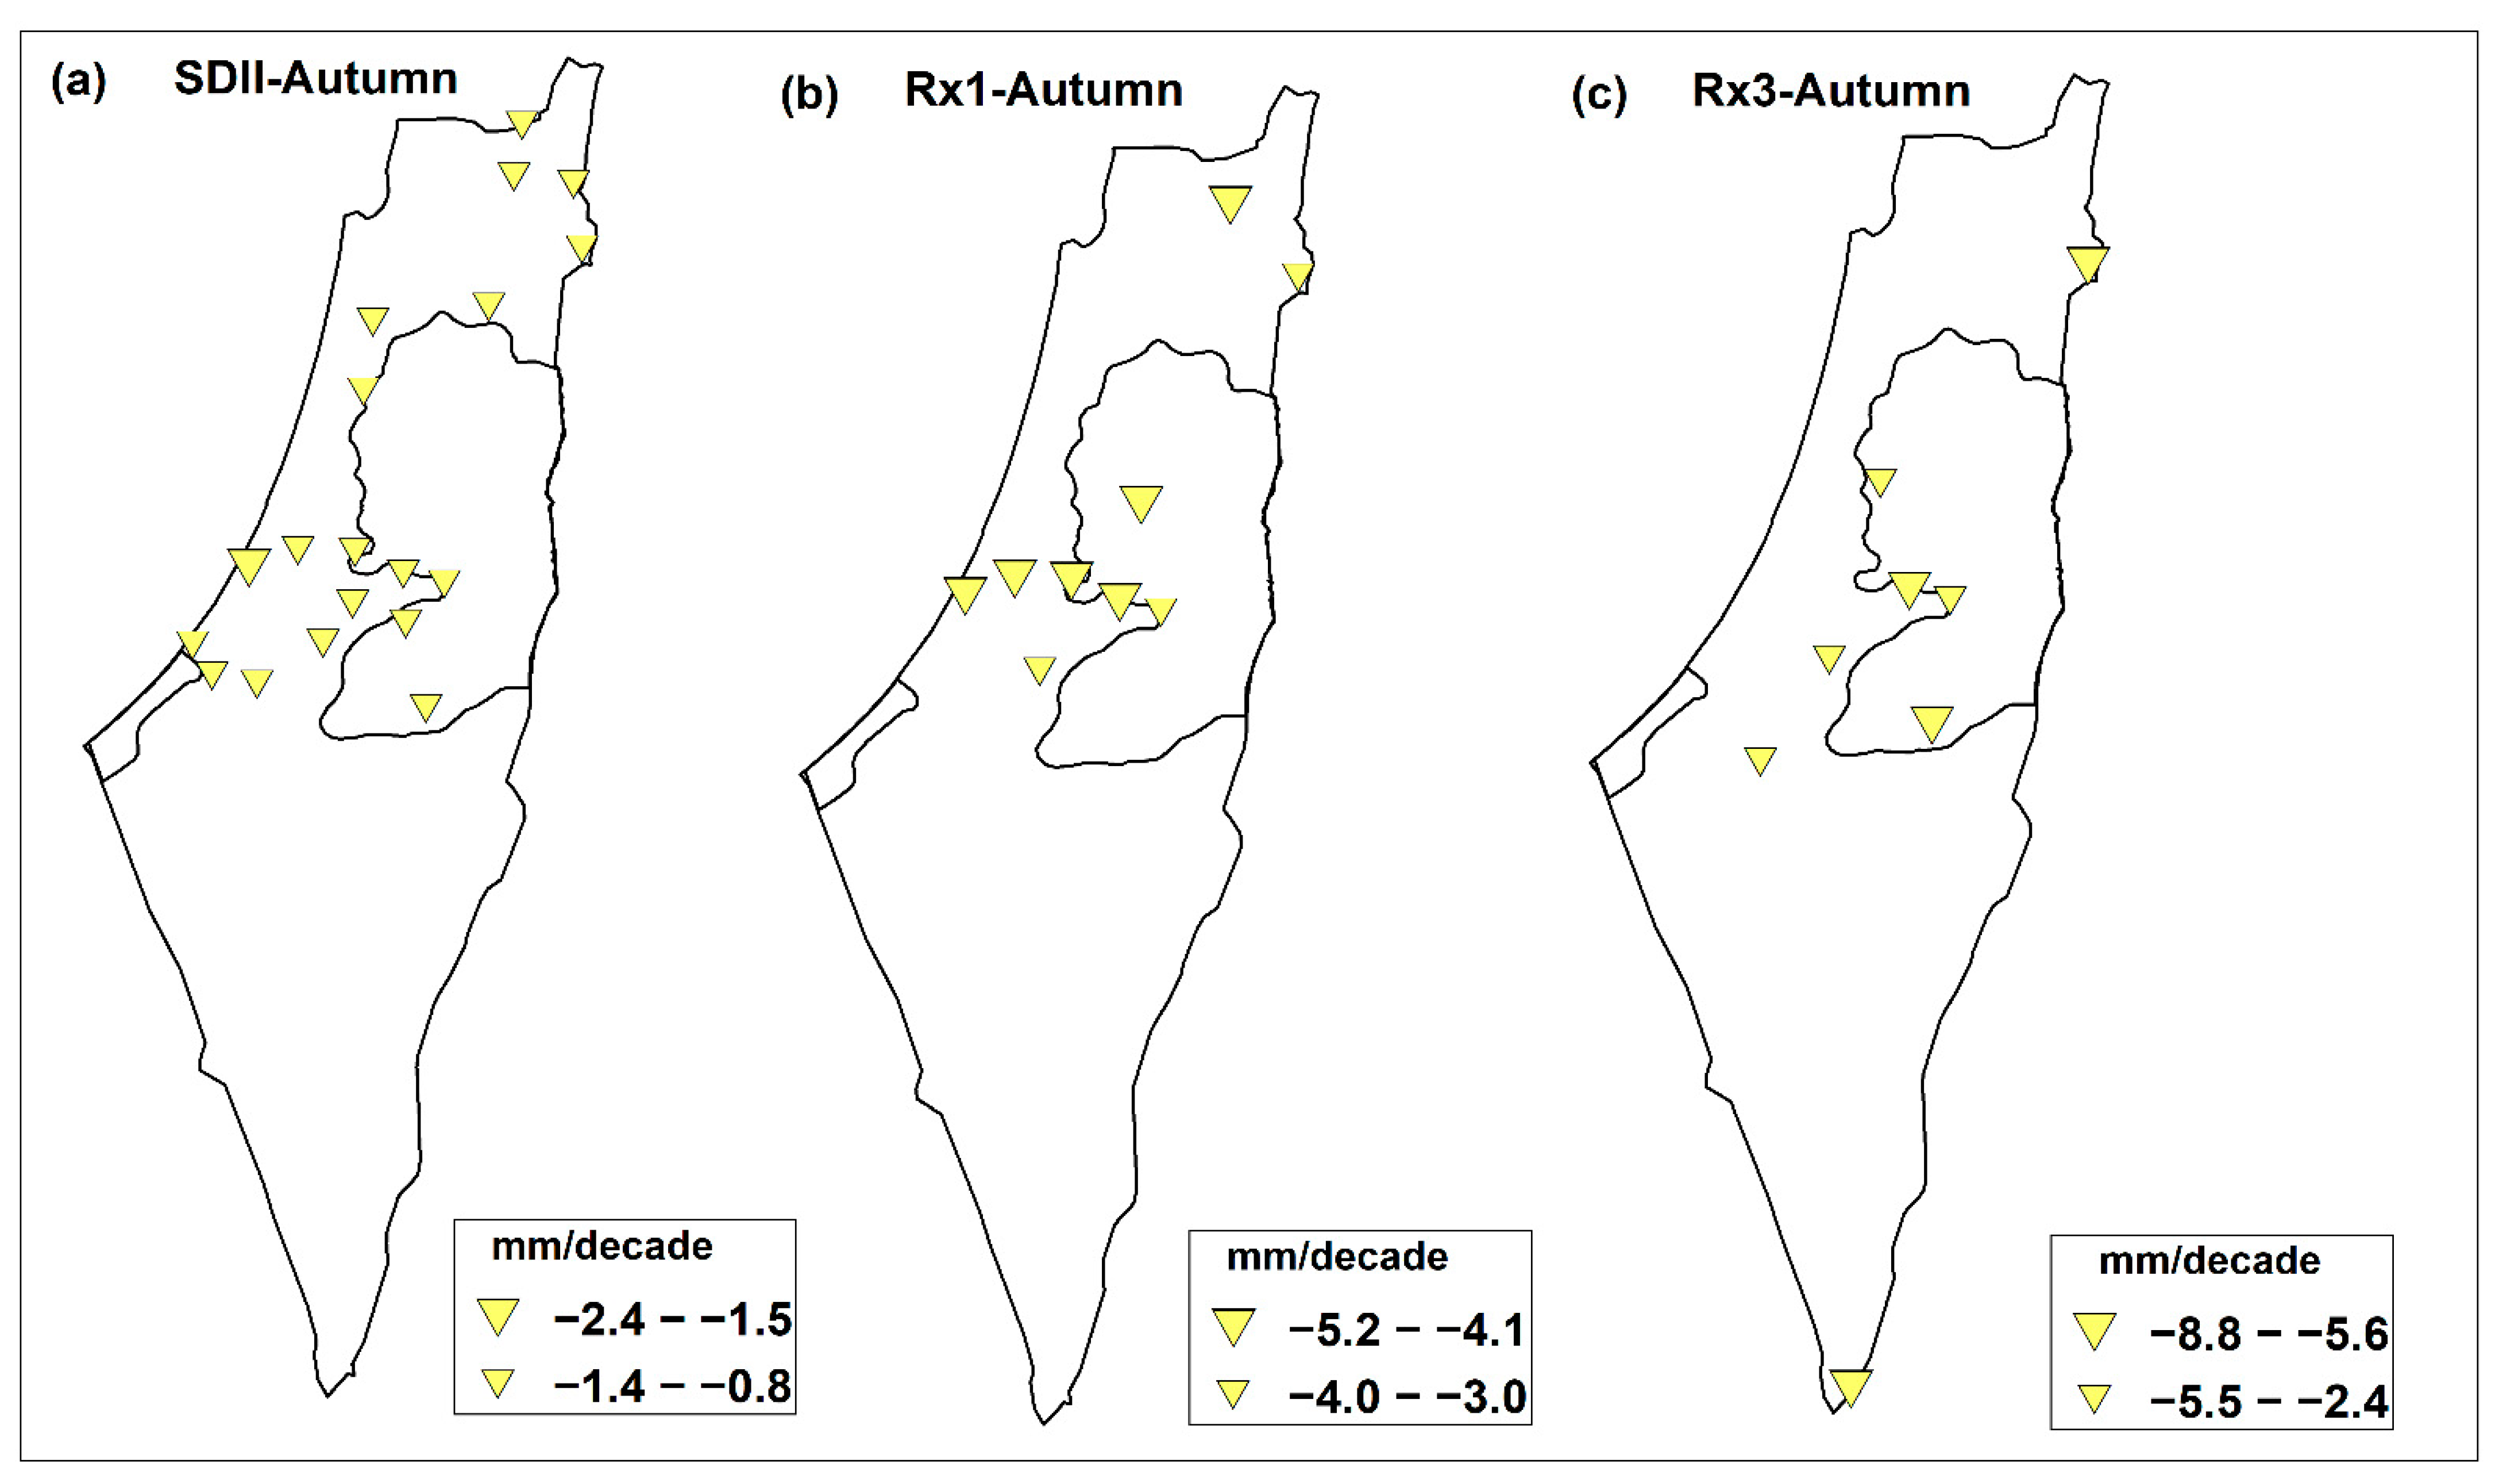
3.2.3. Autumn Trends

The results for the autumn trends indicated no significant decreasing or increasing trends observed for any of the indices, except for the SDII index, which had a significant decreasing trend of −0.75 mm/decade (Table 3). Furthermore, the frequency-based indices (R1mm, R10mm, and R20mm) did not reflect any remarkable changes in the area under investigation in 1970–2020. However, the PRCPTOT, RX1day, RX3day, and RX5day indices showed declining trends of −1.9, −1.8, −2.5, and −2.4 mm/decade, respectively. In terms of stations, 82%, 56%, 42%, and 38% of the stations showed declining trends in the PRCPTOT, R1mm, R10mm, and R20mm indices, respectively, with no notably significant trends. On the other hand, the intensity extreme indices RX1day, RX3day, RX5day, and SDII showed decreasing trends for more than 83% of the total stations, with 9, 8, 3, and 19 stations, respectively, showing significant decreasing trends.
The spatial distribution of trends for some indices is shown in Figure 5. Significant declining trends were found for the SDII index (Figure 5a) in the central area extended from 31.5° N to 32° N latitudes and in the northeastern locations of the study area with average values of −1.2 and −1 mm/decade, respectively. Spatial distributions of RX1day and RX3day indices can be observed in Figure 5b,c, with significant decreasing trends for many sites around the Jerusalem district with an average of −4.0 mm/decade.
Figure 5. Spatial distribution of autumn trends for some indices that exhibited notably significant decreasing (yellow triangles) or increasing (blue triangles) trends.
Water 14 03799 g005

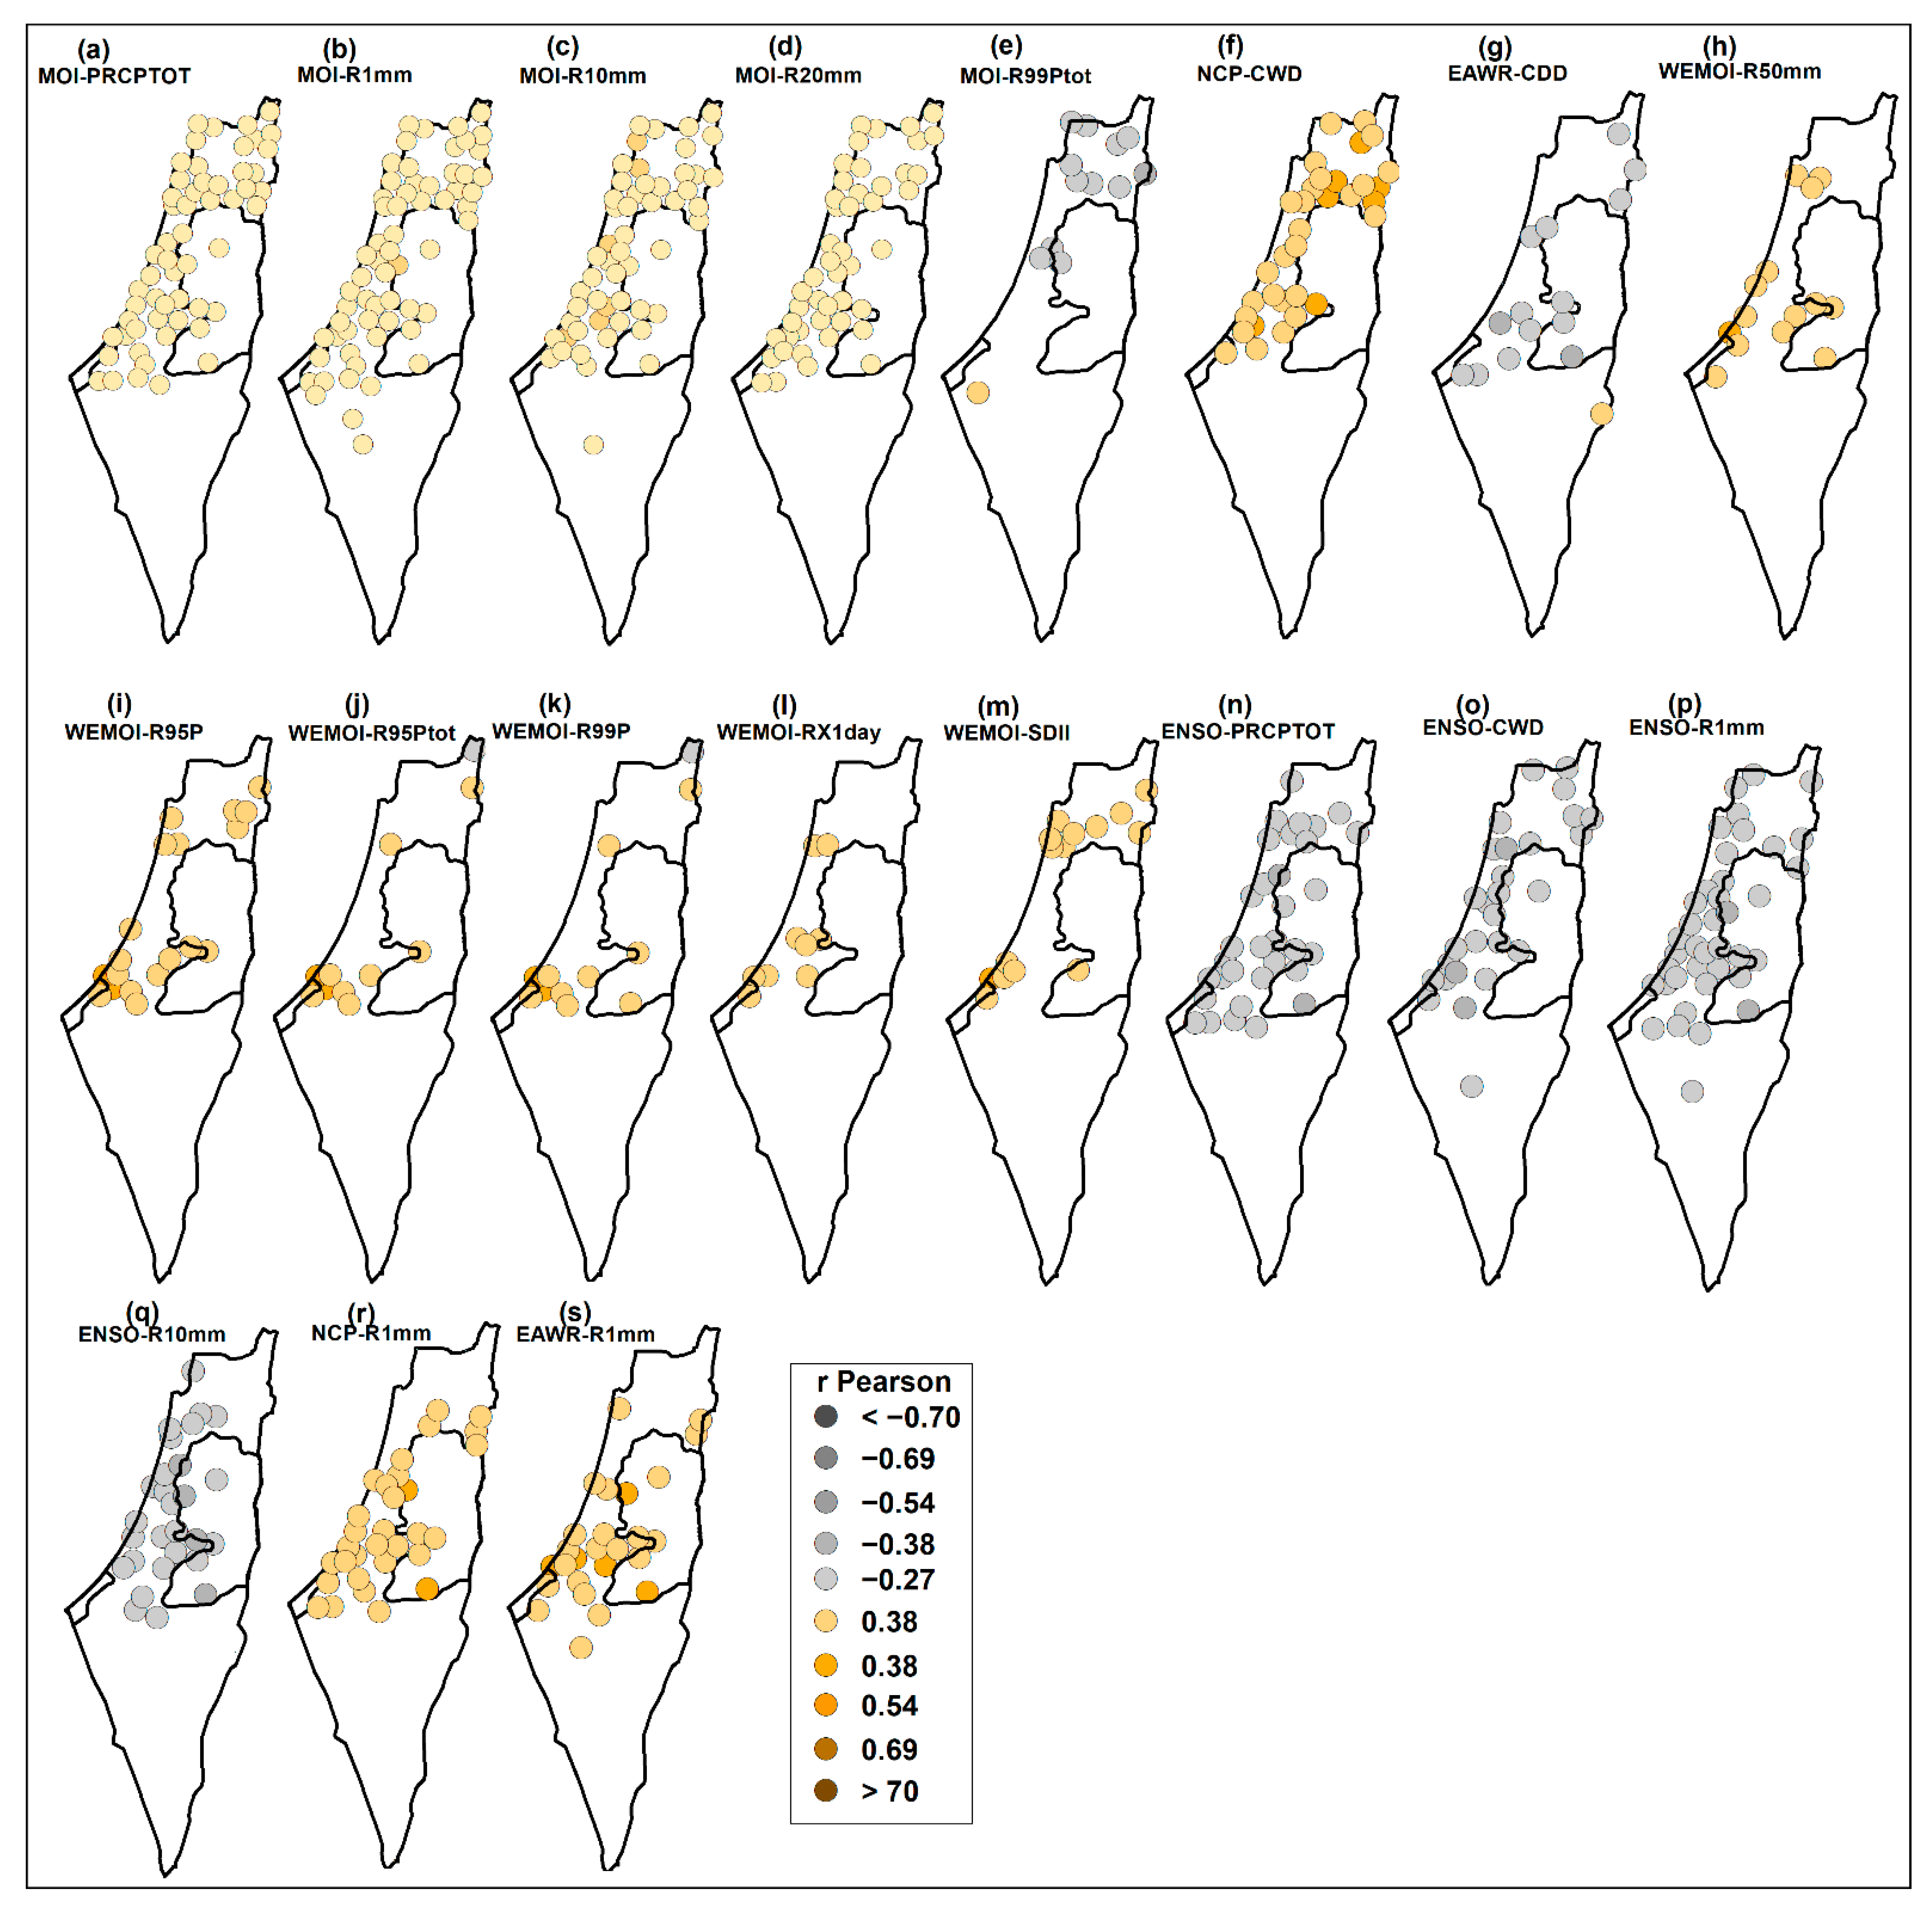
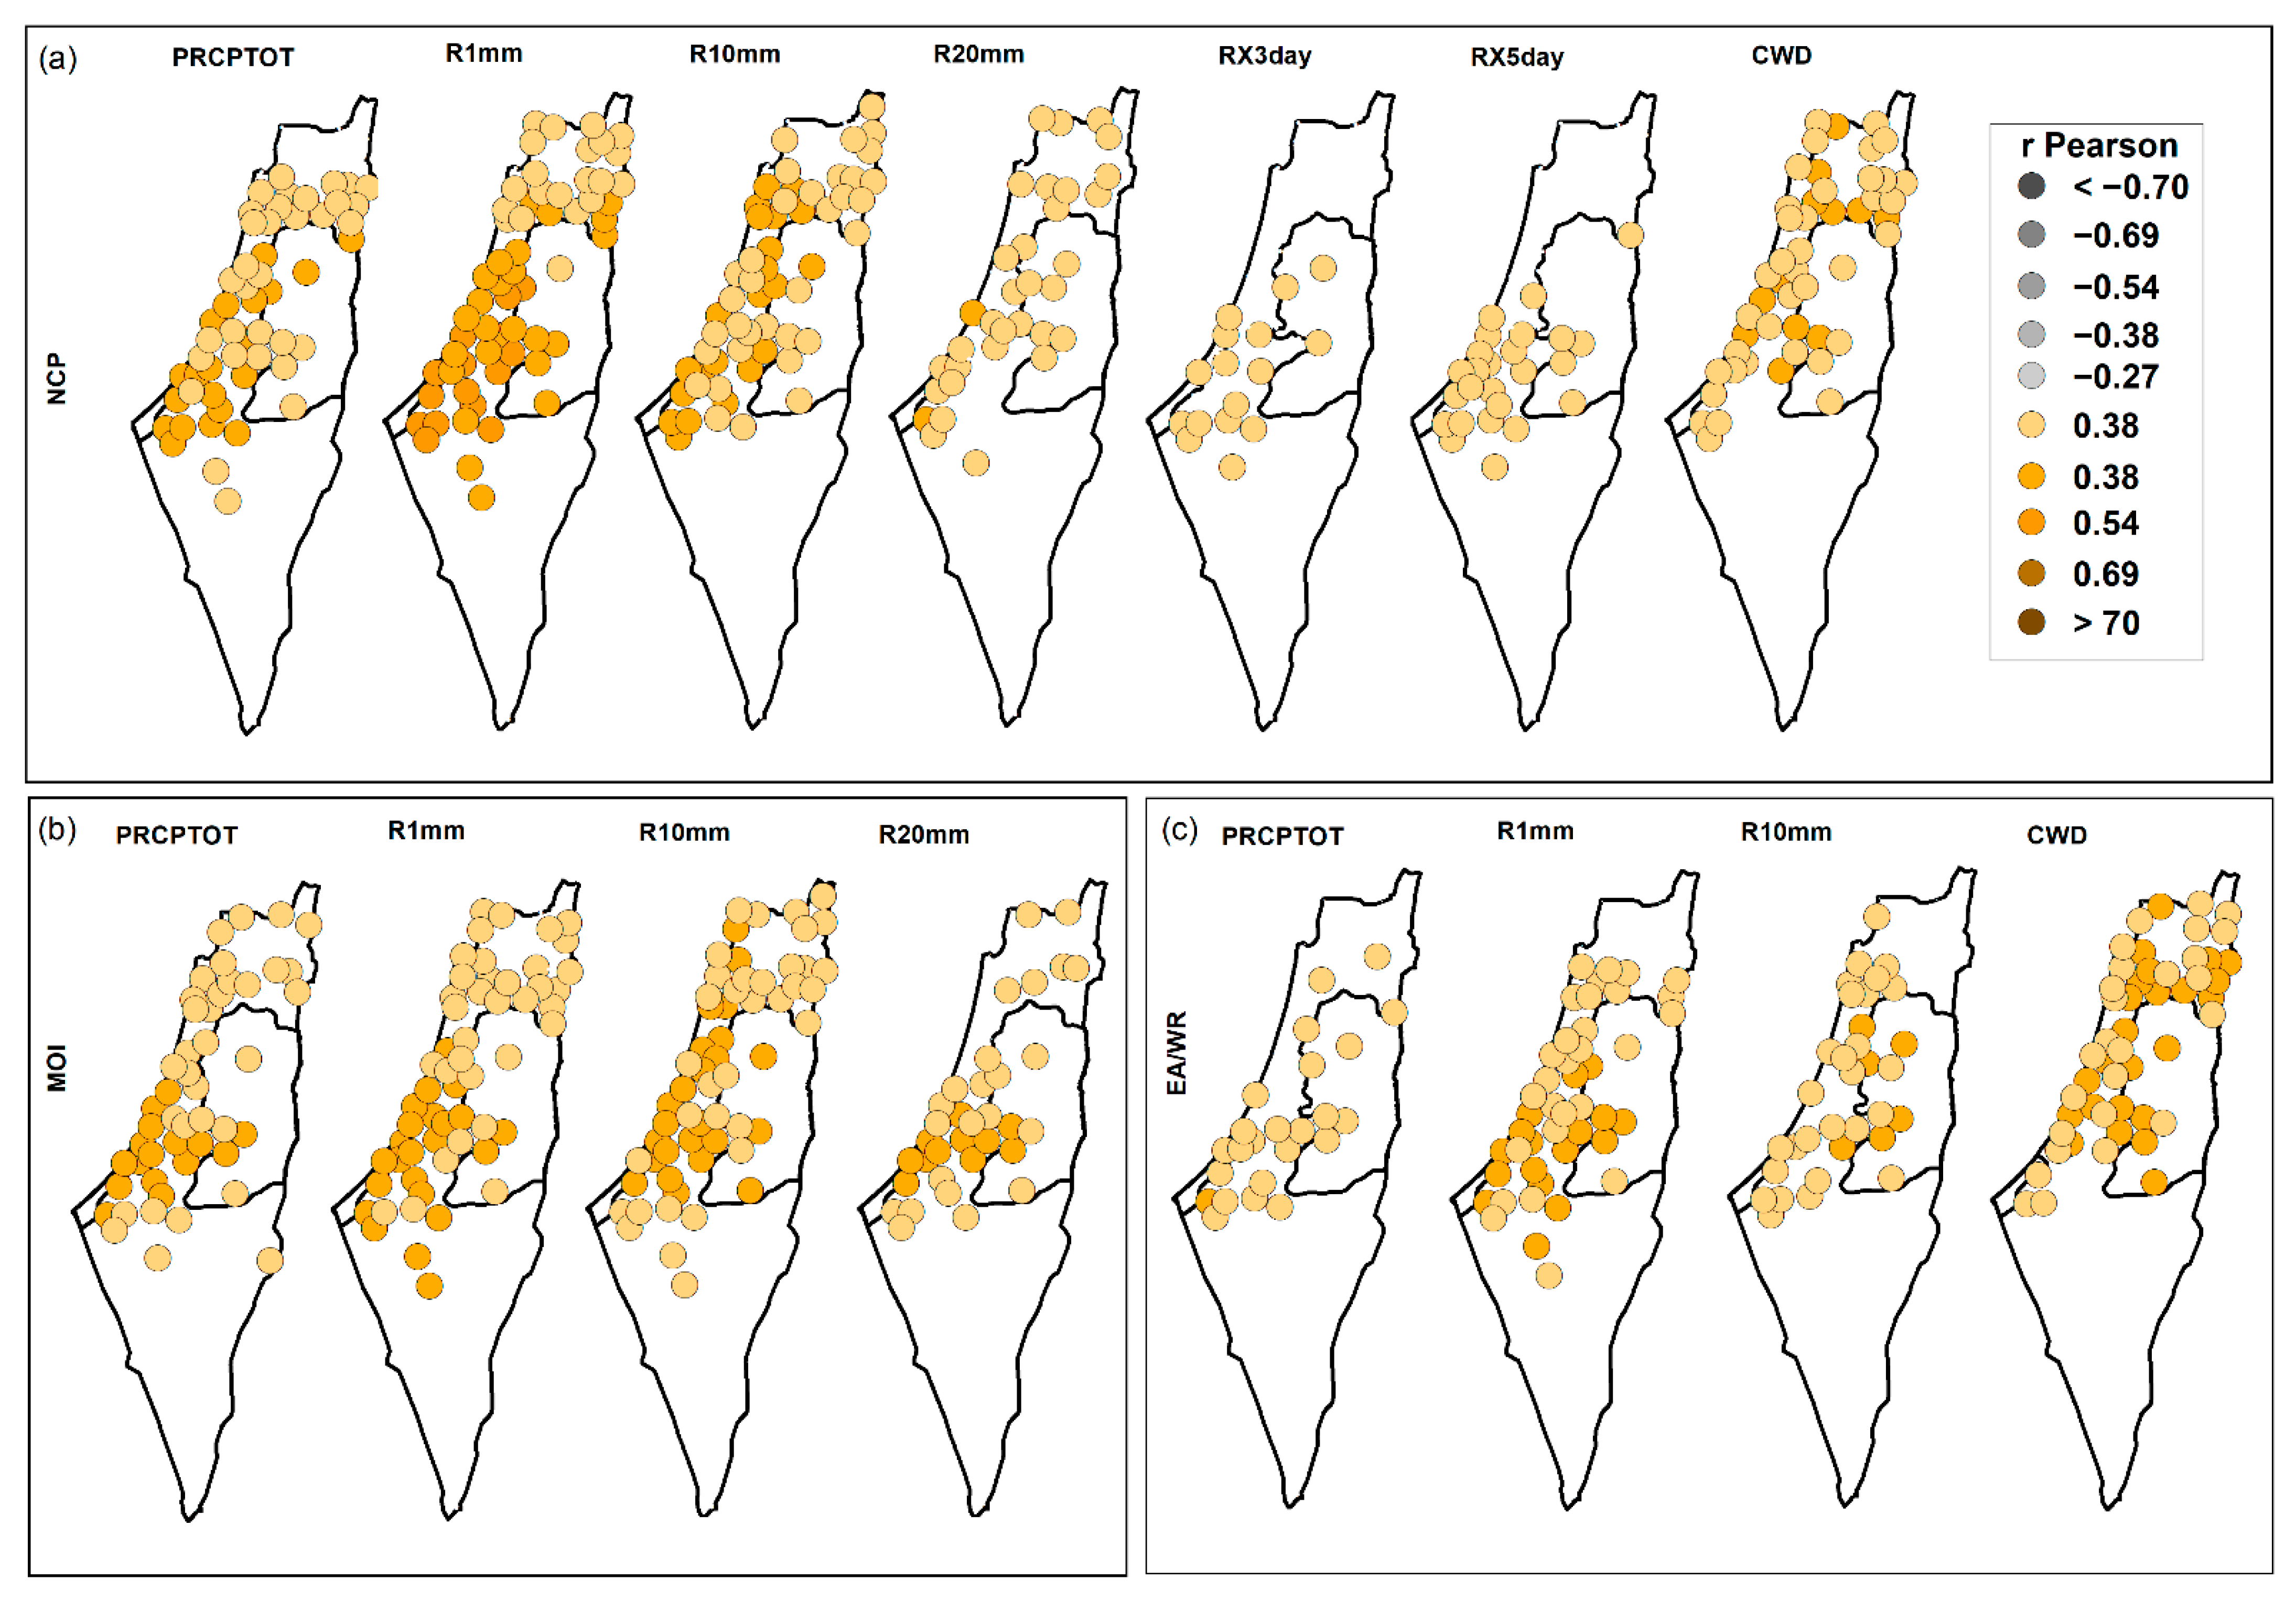
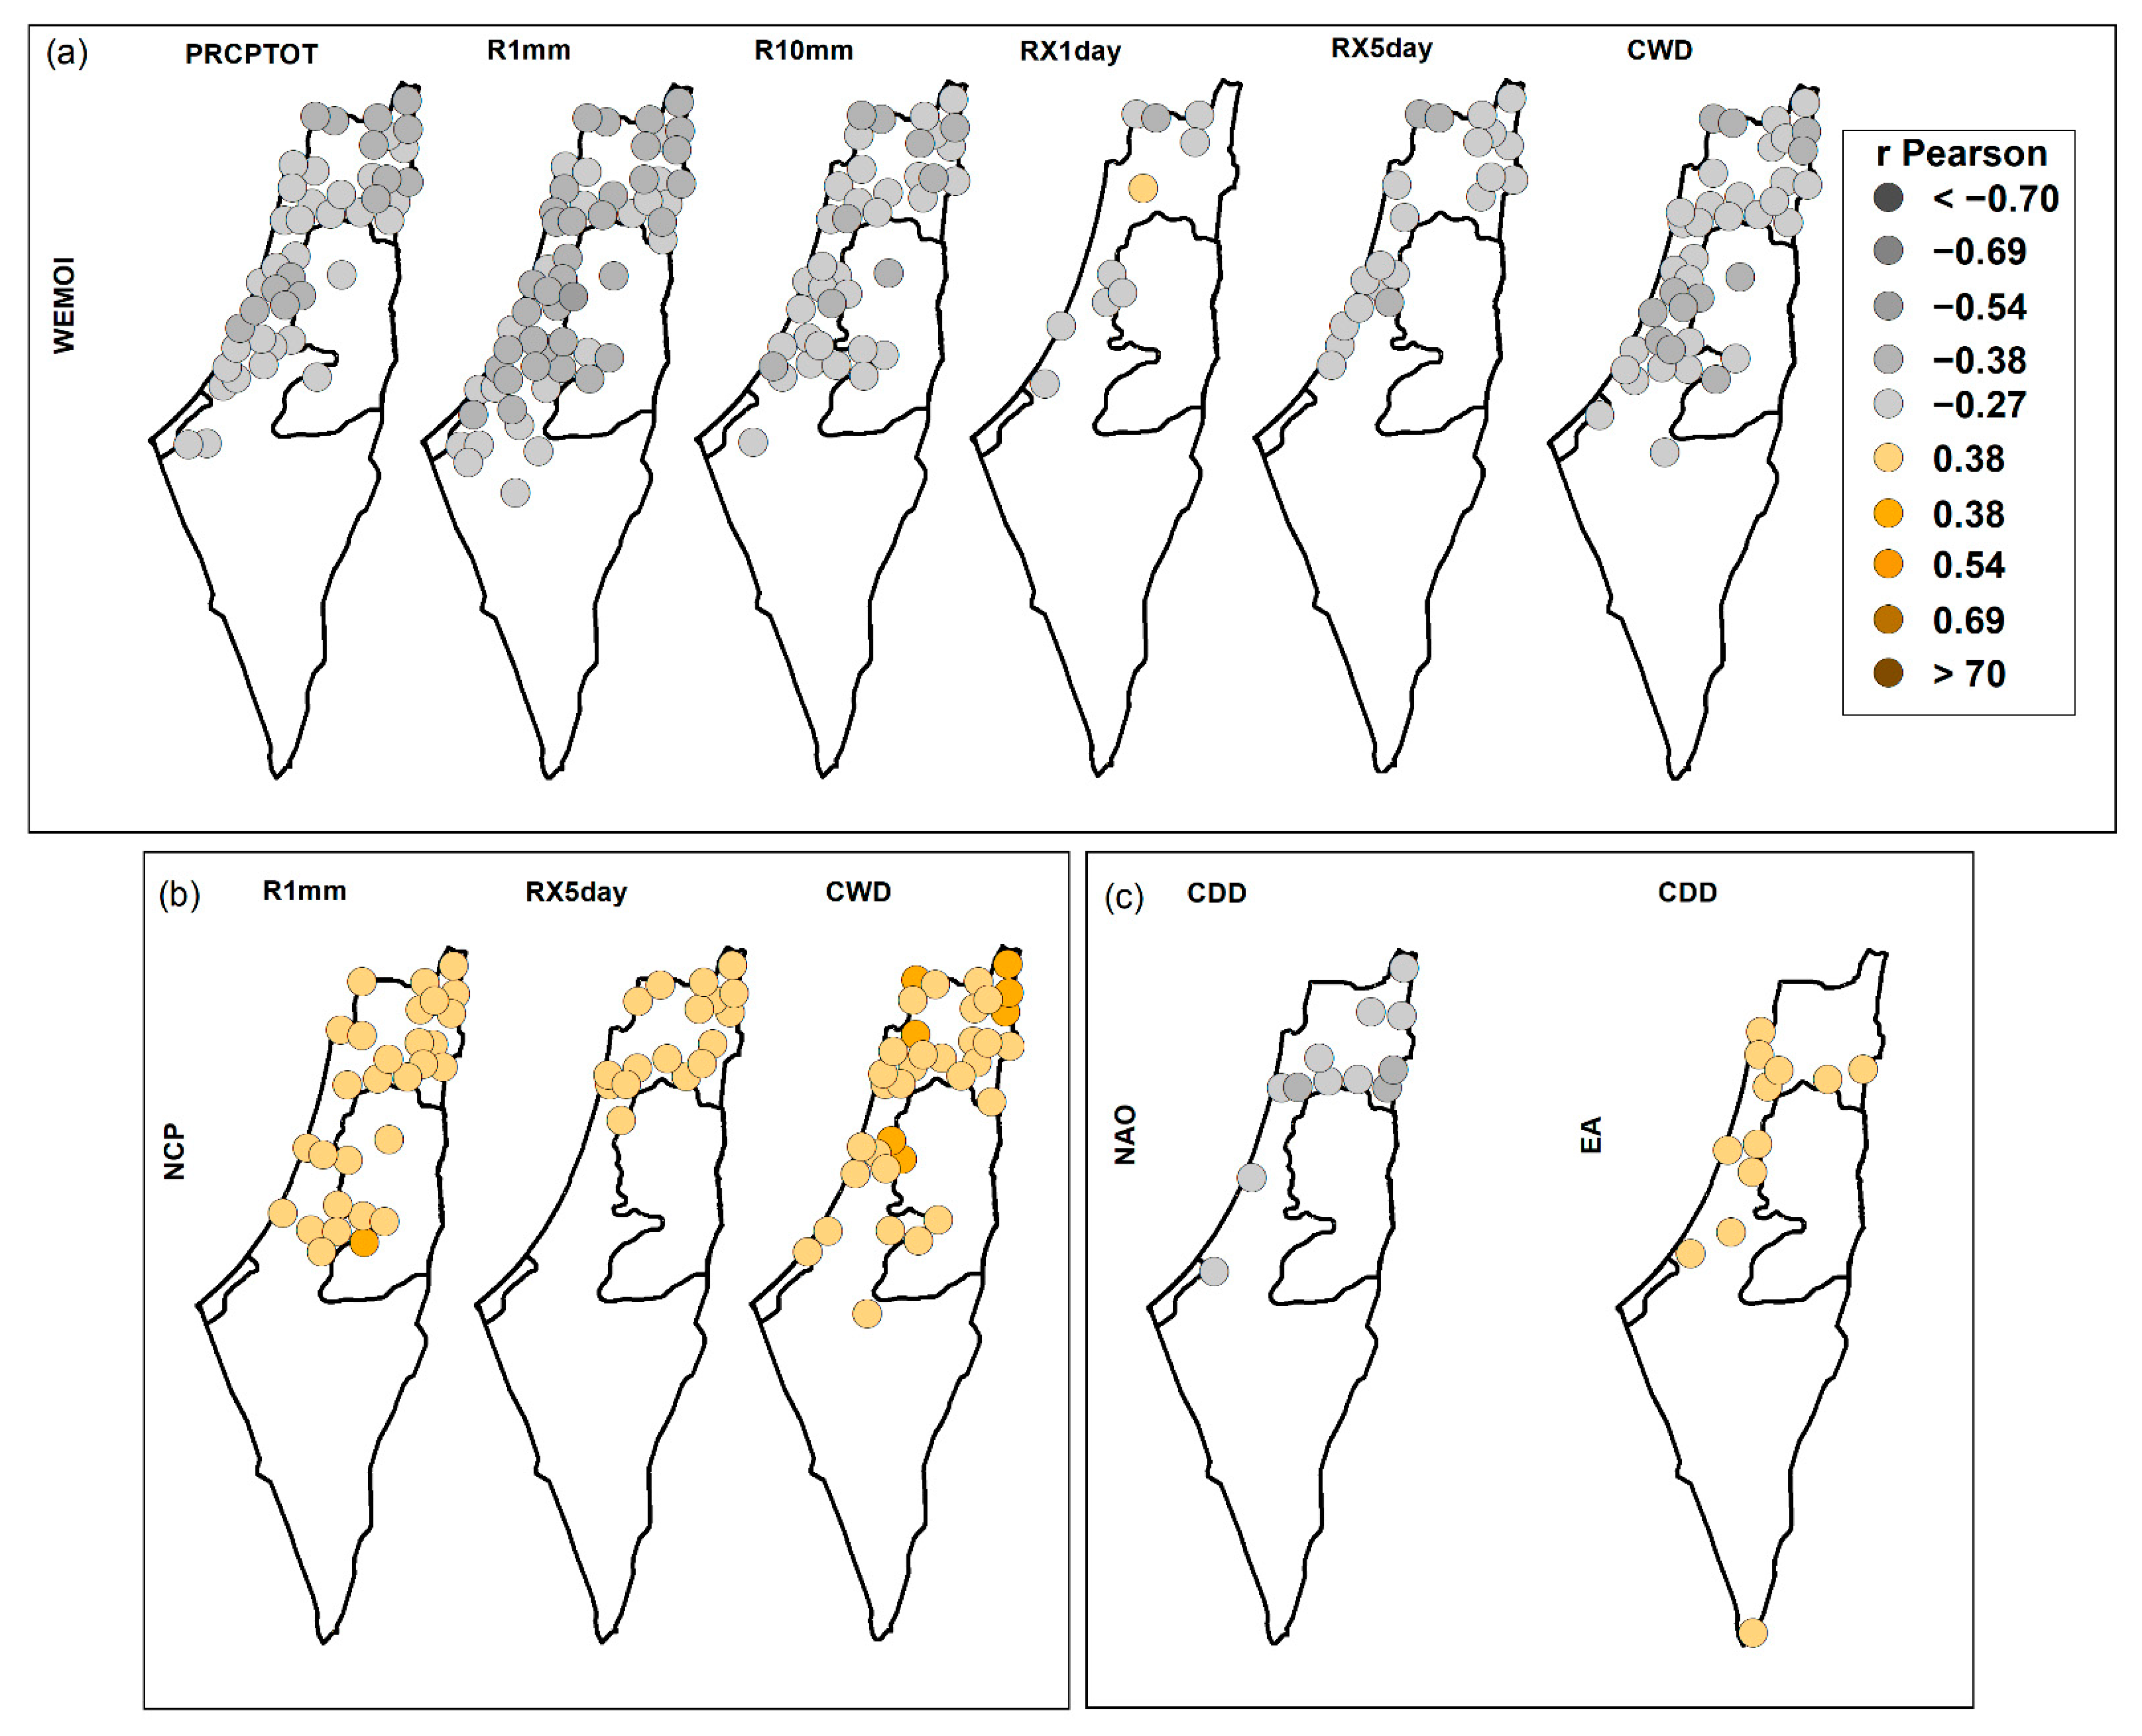
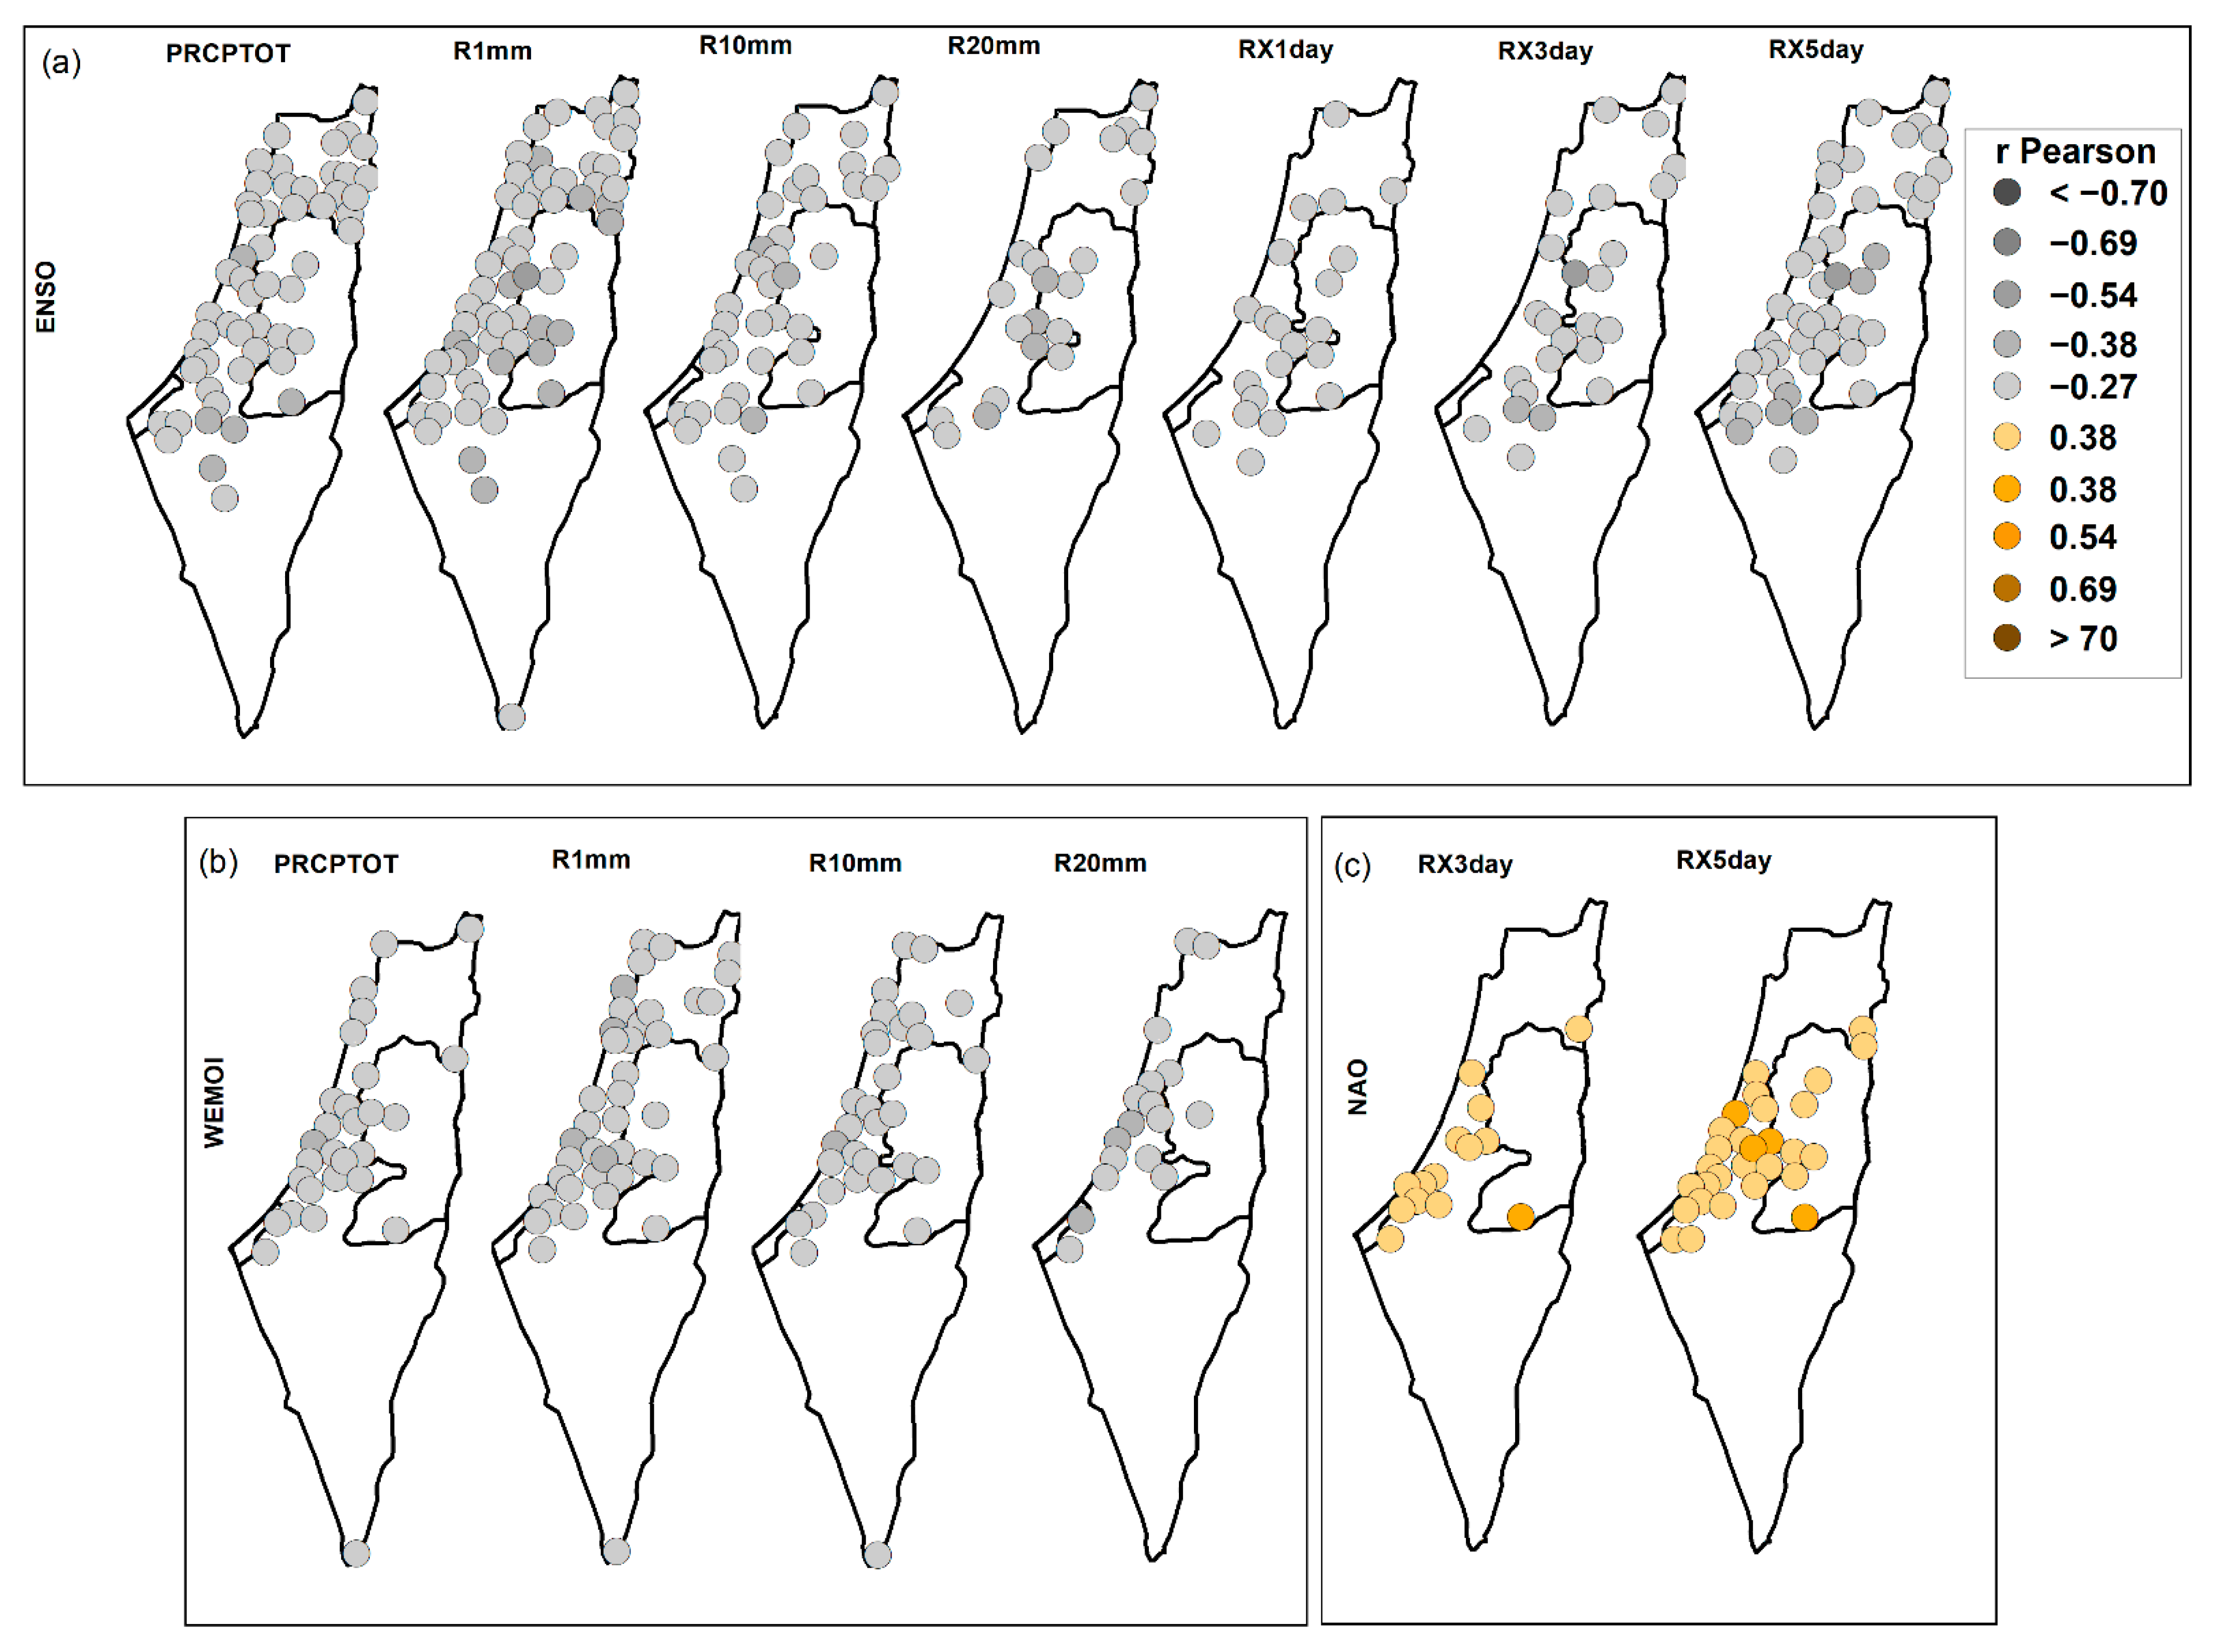
3.3. Extreme Rainfall Indices and Teleconnection Patterns

In this section, the relationships between 15 extreme rainfall indices and seven large-scale circulation patterns (WEMO, EA/WR, NAO, EA, MO, NCP, and ENSO) were investigated to determine whether a particular circulation pattern could have some influence on the occurrence of precipitation extremes over the study area. Table 4 and Table 5 summarize the number of stations with significant correlations between the extreme precipitation indices and the teleconnection indices at annual and seasonal time scales. Figure 6 shows the spatial distribution of the correlation coefficients for the most important relationships found between the circulation patterns and the extreme rainfall indices at an annual scale, while Figure 7, Figure 8 and Figure 9 are for a seasonal scale.

3.3.1. Annual Scale

According to Table 4, large-scale circulation patterns had a more significant impact on the frequency-based indices than the intensity- and percentiles-based indices. For the intensity- and percentile-based indices, some influence was obtained for less than 30% of the stations and mainly related to the WEMO index. The results also revealed the MO index was the main driver for the R1mm, R10mm, R20mm, PRCPTOT, and R99Ptot indices. At the 95% confidence level, the threshold |r| > 0.27 for the Pearson correlation between extreme indices and teleconnection patterns results are significant.
Table 4. Number of stations with significant positive or negative correlations between extreme precipitation and teleconnection indices at an annual scale. Only significant results at the 95% confidence level are shown.
IndexWEMOEAWRNAOEAMONCPENSO
+++++++
PRCPTOT30021000039030033
R1mm002608000430310039
R10mm3050602040060028
R20mm1505080102802008
R50mm140202300304008
R95P190101011302001
R95Ptot101000821222000
R99P111000821202000
R99Ptot205008001125000
RX1day90100221322003
RX3day65206510020001
RX5day20202210210000
SDII150001310100000
CDD001141690308005
CWD2080003050310028
In detail, the index MO showed the highest frequency of significant correlation for the indices PRCPTOT, R1mm, R10mm, and R20mm with 59%, 65%, 61%, and 42% of the stations, respectively (Table 4). Its effect is concentrated between 31.4° N and 33.2° N, with correlation coefficients ranging from 0.27 to 0.38 for the indices PRCPTOT, R1mm, and R20mm (Figure 6a,b,d), and from 0.27 to 0.53 for the index R10mm (Figure 6c). The MO pattern was also the main driver for the R99Ptot index (Table 4, Figure 6e) with 20% of the stations correlating negatively with it (values between −0.27 and −0.38) and spatially covering some northern sites.
Figure 6. Spatial distribution of significant Pearson correlation coefficients between the teleconnection indices (MOI, NCP, EAWR, WEMOI, and ENSO) and the extreme precipitation indices (PRCPTOT, R1mm, R10mm, R20mm, R99Ptot, CWD, CDD, R95P, R95Ptot, R99P, RX1 day, and SDII), at annual scale.
Water 14 03799 g006
In addition, the ENSO pattern was the second most important pattern affecting the PRCPTOT, CWD, R1mm, and R10mm indices (Table 4). A percentage of 50%, 42%, 59%, and 42% of the stations showed significant negative correlations, with values from −0.27 to −0.54, spatially speaking (Figure 6n–q).
For the CWD index, the NCP index was the main controller, showing a significant positive correlation with 47% of the stations (Table 4). Its effect extended over all stations at the northern boundaries of the West Bank (with correlation coefficients between 0.27 and 0.54), the northernmost locations, and the central and southern locations of the coastal area (Figure 6f). In addition, 47% of the stations showed remarkable positive significant correlations with the NCP for the R1mm index (Figure 6r). The EAWR pattern had a significant effect at 23% and 39% of the stations, respectively, with negative and positive significant correlations on the CDD and R1mm indices (Table 4). Spatially (Figure 6g,s), the EAWR effect mainly covered some central locations.
The WEMO index had a dominant significant influence on six extreme indices (R50mm, R95P, R95Ptot, R99P, RX1day, and SDII), with 21%, 29%, 17%, 18%, 14% and 23% of the stations showing a significant positive correlation with it (Table 4). The geographical domain of the WEMO effect was primarily concentrated at some locations in the Jerusalem district and north-eastern locations in the Gaza Strip for all six indices (Figure 6h–m). Finally, the EA and NAO indices are poorly correlated with the annual extreme precipitation indices.

3.3.2. Seasonal Scale

Table 5 summarizes the number of stations with significant correlations between the extreme precipitation indices and the teleconnection patterns at a seasonal scale. Figure 7, Figure 8 and Figure 9 show the spatial distribution of significant Pearson correlation coefficients between the teleconnection indices and the extreme precipitation indices for winter, spring, and autumn, respectively. Based on the frequency of significant correlations, the results indicated no single dominant pattern on the seasonal precipitation extremes, as different patterns generally influence different seasons. In this context, the NCP pattern appeared as the dominant pattern on winter extreme precipitation indices, with the MO and EA/WR indices also showing a considerable frequency of significant correlations. On the other hand, the ENSO and WEMO indices showed high frequencies of significant correlations in autumn and spring, respectively.
Table 5. Number of stations with significant positive or negative correlations between extreme precipitation and teleconnection indices, at a seasonal scale. Only significant results at the 95% confidence level are shown.
IndexSeasonWEMOEA/WRNAOEAMONCPENSO
+++++++
PRCPTOTWinter00200000043051002
Spring037000100508001
Autumn0204090002000048
R1mmWinter07410000053058001
Spring0570030023027005
Autumn03570140006000056
R10mmWinter00300101058055005
Spring037110100919101
Autumn0265060104000033
R20mmWinter0060200032030006
Spring04040010402024
Autumn0153020102000020
RX1dayWinter12311210214005
Spring19110121200022
Autumn084031011000015
RX3dayWinter037009206015007
Spring08000001403002
Autumn0900130000010019
RX5dayWinter027035109020003
Spring0160000001016001
Autumn0500280000010038
SDIIWinter00000130101004
Spring00011030201011
Autumn02100002100005
CDDWinter01020321001401501
Spring7013012120100913
CWDWinter01500001010480125
Spring03700200104033002
As shown in Table 5, the NCP index had a greater impact on seven winter extreme rainfall indices (PRCPTOT, R1mm, R10mm, R20mm, RX3day, RX5day, and CWD). It significantly correlated with them at 77, 88, 83, 45, 23, 30, and 73% of the stations, respectively. Figure 7a shows the spatial distribution of these significant correlation coefficients in winter, with the highest correlations (values between 0.54–0.69) for the R1mm index in the southern parts of the coastal area and around the Gaza Strip. Its effect was extensive for the PRCPTOT, R1mm, R10mm, R20mm, and CWD indices.
Figure 7. Spatial distribution of significant Pearson correlation coefficients between the teleconnection indices (NCP, MOI and EAWR) and the extreme precipitation indices (PRCPTOT, R1mm, R10mm, R20mm, RX3 day, RX5 day, and CWD), in winter.
Water 14 03799 g007
The results also showed that the MO and EA/WR indices had remarkable effects on four winter extreme precipitation indices (Figure 7b,c). The winter indices PRCPTOT, R1mm, R10mm, and R20mm are positively correlated with the MO index at 65, 80, 88, and 48% of the total stations, respectively. For the R20mm index, MO covered more sites in the southern coastal region with a high band of significant correlations (values between 0.38–0.54) than the NCP index (Figure 7b). The EA/WR index (Figure 7c) showed a lower frequency of significant correlations for the PRCPTOT, R1mm, and R10mm indices, with 30, 62, and 45% of the stations affected, respectively, compared to the NCP and MO indices. In contrast, it showed a very high frequency of significant correlations with the CWD index for 76% of the total stations, with a spatial pattern similar to NCP.
The WEMO index was found to be the most influential pattern on six spring extreme precipitation indices (PRCPTOT, R1mm, R10mm, RX1day, RX5day, and CWD) with 56, 86, 56, 14, 24, and 56% of the total stations (Table 5), respectively, affected. The highest significant correlations (with values between −0.38 to −0.54) were with the R1mm index for most stations and with the PRCPTOT index at some central and northeast locations (Figure 8a). The WEMO-RX5day significant correlations are, however, concentrated in the coastal and northeastern locations. In addition to the WEMO index’s effect, the NCP index exerted a certain positive influence on the R1mm, RX5day, and CWD indices, but with a lower frequency and magnitude (Figure 8b). As shown in Figure 8c, the effect of the EA index on the CDD index occurred only in spring at 13% of the stations, with significant correlations in the range of 0.27 to 0.38. The NAO pattern also had some negative impact on 13% of stations for the CDD index and was spatially distributed in the northern locations (Figure 8c).
Figure 8. Spatial distribution of significant Pearson correlation coefficients between the teleconnection indices (WEMOI, NCP, NAO, and EA) and the extreme precipitation indices (PRCPTOT, R1mm, R10mm, RX1 day, RX5 day, CWD, and CDD), in spring.
Water 14 03799 g008
For autumn, the results listed in Table 5 show that the ENSO pattern is the main regulator for seven extreme precipitation indices (PRCPTOT, R1mm, R10mm, R20mm, RX1day, RX3day, and RX5day). For these indices, 73, 58, 50, 30, 23, 29, and 58% of the total stations showed significant negative correlations. In addition, the indices PRCPTOT, R1mm, R10mm, and R20mm correlated negatively with the WEMO for 30, 53, 39, and 23% of the stations, respectively. The NAO pattern also showed some positive effects on the RX3day and RX5day indices at 20 and 42% of the stations, respectively, located in the central regions (Figure 9c). Figure 9 show the spatial distribution of the correlation values between these three circulation patterns and extreme precipitation indices. Most stations in the northern, coastal, and West Bank areas were significantly affected by the ENSO pattern, especially for the PRPTOT, R1mm, R10mm, and RX5day indices (Figure 9a). Other indices (R20mm, RX1day, and RX3day) showed spatially, almost isolated, patterns for the significant correlations, except for stations in the Jerusalem Governorate. The ENSO pattern affected more stations in all regions than the WEMO index.
Figure 9. Spatial distribution of significant Pearson correlation coefficients between the teleconnection indices (ENSO, WEMOI, and NAO) and the extreme precipitation indices (PRCPTOT, R1mm, R10mm, R20mm, RX1 day, RX3 day, and RX5 day), in autumn.
Water 14 03799 g009

4. Discussion

Results from this study show that the study area may be subjected to drought episodes in the future due to the vast decreasing trends in annual, spring, and autumn indices, mainly for the PRCPTOT, R1mm, R10mm, and R20mm indices, with more than 62% of the stations showing decreasing trends. This result is in agreement with other studies showing that the Eastern Mediterranean and the Middle East region are likely to be impacted by frequent and intense drought events [30,79,80,81]. A decreasing precipitation trend and a reduction in the annual number of precipitation days for the Mediterranean and Middle East regions have been also documented [16,18,45,82,83,84].
The trend analysis at annual scale showed that the study area tends to have more intense rainy days, where the R1mm index had a notably decreasing trend and the PRCPTOT did not change much. This is also demonstrated by the increasing trends in all the heavy precipitation indices, with significant increases for R99p, R95ptot, RX1Day, and RX3Day. In [46], the authors showed the frequency-based extreme indices were affected by decreasing trends, whereas the percentiles- and intensity-based extreme indices were generally affected by increasing trends in Israel. However, they found a decreasing trend in the RX5Day during 1950–2017 while our study showed an increasing trend, which can be attributed to the different base periods, especially since they also found a positive trend in the RX5Day during 1988–2017. In [85], the authors found that extreme rainfall had been more intense, but less frequent over Jeddah, Saudi Arabia during 1979–2018.
The increase in the intensity of extreme rainfall events is a major impact of global warming [86,87]. In addition, the increase in heavy rainfall in spite of the decrease in the totals is associated with fewer rainy days and the increase in the frequency and persistence of sub-tropical anticyclones, particularly over the Mediterranean [18]. Decreasing trends in rainfall in the study area may be regarded as a manifestation of the increased influence of the subtropical high over the Mediterranean Basin. Such an evolution is implied by an expansion of the Hadley cell, attributed to the global warming [45,88].
At a global scale, [21] found the SDII, RX5day, R10mm, R20mm, and CDD indices are decreasing. However, SDII and RX5day indices are increasing over the study area. Similarly, CWD increases globally and in the study area [21]. The cause of the significant decreasing annual CDD may be connected to summer rainy days or rainy days during September/October when afterwards the dry season continues, sometimes until the end of November. Regarding spatial trends, the West Bank stations exhibited significant decreasing trends for the R1mm index, as well as the northern locations and several southern coastal locations for the CDD index.
Seasonally, the winter PRCPTOT, RX1day, RX3day, RX5day, and SDII indices showed increasing trends, significant for the northwestern locations in the SDII index due to the PRCPTOT increasing and the R1mm decreasing. It is also significant for several northern locations in the RX1day and RX3day indices. These increasing trends indicate the possibility of flooding in these areas; in particular, they affect many sites with an annual precipitation maximum of more than 1000 mm.
Most extreme indices showed decreasing trends in spring and autumn (more than 80% of the total stations); with central and northern locations, showing significant decreases in the spring RX1day, RX3day, and SDII indices. In addition, the central locations of the study area show significant decreasing trends in the autumn SDII, RX1day, and RX3day indices. Spring and autumn, according to these findings, are the seasons that contribute the most in those locations where annual declines in the PRCPTOT, RX1day, RX3day, RX5day, R1mm, R10mm, R20mm, and CDD indices are found; while winter is the season that contributes the most to annual increases in these indices in other sites. The authors of [45,89] also found that the declining trend in annual precipitation in Israel and the Mediterranean region is mainly due to the spring season.
The study area had longer periods of extreme dry spells (CDD) in spring and correspondingly shorter extreme wet spells (CWD) for winter, spring, and the combined winter–spring. The significant increase in the CDD for the winter–spring was caused by the spring and not by the winter, when most of the total precipitation occurred. In addition, this study found a negative non-significant trend for CDD index during winter, which means that there were no prolonged dry periods in the winter (DJF). The Mediterranean region has also witnessed significant increasing trends in the CDD spring index [89,90,91], that could affect crop growth and availability of water for irrigation in these areas. This trend was also documented in the southern Levant during the rainy season [45,92].
Regarding the influence of large-scale circulation patterns on extreme precipitations, the NCP, WEMO, and ENSO patterns seem to be the main regulators for the extreme rainfall indices in winter, spring, and autumn, respectively. The MO and EA/WR indices had a remarkable impact on four winter extreme rainfall indices, with the highest correlation values on the R10mm for the MO index, and on the R1mm for EA/WR. In this regard, no works in the literature establishes a direct link between the extreme precipitation indices and large-scale circulation patterns in Israel and Palestine. Most studies analyzed the influence of the large-scale circulation pattern on the mean values. However, it is important to note that some of these studies confirm some of the results obtained in this study.
Many studies have found that the NCP, MO, and EA/WR indices have a positive effect on winter precipitation in Israel, East Mediterranean and Europe [50,93,94,95,96,97]. The negative phase of the NCP refers to an increased counterclockwise anomaly around the western center of the NCP, i.e., the north of the Caspian Sea, and an increased clockwise anomaly circulation around the eastern pole. These anomalies imply increased westerly anomaly circulation towards central Europe and an increased easterly anomaly circulation towards Georgia, and eastern Turkey, which leads to an increase in southwesterly anomaly circulation towered the Balkans, western Turkey, and the Middle East, causing above normal temperatures and below normal rainfall in these regions. The opposite occurs in the positive phase of the NCP index [49]. The authors of [92] found that precipitation in Israel during the positive phase of the NCP is far greater than precipitation during the negative phase of the NCP, and that the influence of the NCP on the precipitation regime in Israel increases from the northern parts of the country to the south. The authors of [94] analyzed the relationship between the MO index and winter precipitation in southern Levant (Israel and Palestine) for the period 1960–1993, finding that winter precipitation is significantly associated with positive MO phases.
For the WEMO index, the positive phase corresponds to an anticyclone over the Azores enclosing the southwestern Iberian quadrant and low pressures in the Liguria Gulf, while its negative phase coincides with the Central European anticyclone located north of the Italian peninsula and a low-pressure center in the framework of the Iberian southwest [98]. The Levant rainfall in the negative phase is favored by maritime surface flow where the negative phase is associated with flows from the Mediterranean [98]. The relationship between the WEMO index and the rain regime in the Levant had never been detected before and more investigation is needed. On the other hand, Ref. [99] found that El Niño is associated with an increased rainfall over the north of Israel after 1970s due to the changes in the jet stream position, because if the jet stream shifts equatorward (during El Niño events) or poleward (during La Niña events) by a few degrees, significant changes in precipitation amounts can occur.
Note that the study of driving mechanism of extreme precipitation is highly complex due to many factors affecting regional precipitation variability such as regional environment characteristics or human activities must be taken into account [100]. However, although the analysis of the relationships between the atmospheric circulation patterns and the extreme rainfall indices presents limitations, it constitutes the starting point for the search of more complex relationships of a non-linear nature. In this sense, further research could involve a comprehensive physical mechanism analysis following the methodology applied for other regions [101,102] that consider the application of more sophisticated statistical techniques capable of analyzing the joint variability, using variables such as the sea surface temperature (SST) or the sea level pressure (SLP) in addition to extreme rainfall indices, could help in the search of potential predictors for the precipitation in this region.

5. Conclusions

This study presents a comprehensive annual and seasonal analysis of trends and variability for a set of 15 extreme precipitation indices using homogeneous and quality-controlled daily records for 66 stations distributed in Israel and Palestine, for the period 1970–2020. In addition, the relationships between these extreme indices and some large-scale circulation patterns covering the Atlantic Ocean and the Mediterranean Sea were examined at the annual and seasonal scales.
The main findings of this work can be summarized as follows:
-
Substantial decreasing trends were found for extreme rainfall indices at an annual scale, and for spring and autumn seasons, mainly for the PRCPTOT, R1mm, R10mm, and R20mm indices.
-
At an annual scale, southern Levant tends to have more intense rainy days, showing increased trends for all the heavy precipitation indices.
-
Seasonally, winter PRCPTOT, RX1day, RX3day, RX5day, and SDII indices showed increasing trends, significant for SDII index in the northwestern locations in the area, related with the PRCPTOT increasing and the R1mm decreasing.
-
In spring and autumn, most extreme indices showed decreasing trends, these being the seasons mostly contributing to the annual declines in the PRCPTOT, RX1day, RX3day, RX5day, R1mm, R10mm, R20mm, and CDD indices.
-
Southern Levant had experienced longer periods of extreme dry spells (CDD) in spring and consistently shorter extreme wet spells (CWD) for winter, spring, and the combined winter–spring season.
-
The NCP, WEMO, and ENSO atmospheric circulation patterns are the main regulators for the extreme rainfall indices in winter, spring, and autumn, respectively.
Overall, the results obtained from this study serve as a strong warning in the southern Levant because the trends detected toward drier conditions and more intense rainy days, will increases the risk of flooding, food security, emigration, life loss, and property damages in a region, which is already suffering from several developmental stresses such as poor infrastructure, rapid population growth, and scarcity of water resources. In this sense, the findings obtained in this work are very important and constitutes the baseline for decision makers on the findings of potential solutions and for implementing efficient mitigation and adaptation strategies in the Levant.

Supplementary Materials

The following supporting information can be downloaded at: https://www.mdpi.com/article/10.3390/w14233799/s1, Table S1. List of stations where change points in daily rainfall were detected. Table S2. The final list of the meteorological stations used in this study. Figure S1. Temporal evolution for some averaged extreme rainfall indices over all stations, period 1970–2020. Red line is indicating a LOWESS smoothing.

Author Contributions

Conceptualization, M.J.E.-P., S.R.G.-F., A.A.M.S. and Y.C.-D.; methodology, M.J.E.-P., A.A.M.S. and S.R.G.-F.; software, A.A.M.S.; validation, A.A.M.S., M.J.E.-P. and S.R.G.-F.; formal analysis, A.A.M.S.; investigation, A.A.M.S. and S.R.G.-F.; resources, M.J.E.-P., S.R.G.-F. and Y.C.-D.; data curation, A.A.M.S., M.J.E.-P., S.R.G.-F. and Y.C.-D.; writing—original draft preparation, A.A.M.S.; writing—review and editing, M.J.E.-P., S.R.G.-F., A.A.M.S., M.G.-V.O. and Y.C.-D.; visualization, A.A.M.S. and M.J.E.-P.; supervision, M.J.E.-P., S.R.G.-F. and Y.C.-D.; project administration, M.J.E.-P. and S.R.G.-F.; funding acquisition, M.J.E.-P. and S.R.G.-F. All authors have read and agreed to the published version of the manuscript.

Funding

This research has been carried out in the framework of the projects P20_00035 funded by FEDER/Junta de Andalucía-Consejería de Transformación Económica, Industria, Conocimiento y Universidades, and LifeWatch-2019-10-UGR-01 co-funded by the Ministry of Science and Innovation through the FEDER funds from the Spanish Pluriregional Operational Program 2014–2020 (POPE), LifeWatch-ERIC action line.

Data Availability Statement

The data presented in this study are available on request from the first author.

Conflicts of Interest

The authors declare no conflict of interest.

References

  1. Najafi, M.R.; Moradkhani, H. A Hierarchical Bayesian Approach for the Analysis of Climate Change Impact on Runoff Extremes. Hydrol. Process. 2014, 28, 6292–6308. [Google Scholar] [CrossRef]
  2. Abiodun, B.J.; Mogebisa, T.O.; Petja, B.; Abatan, A.A.; Roland, T.R. Potential Impacts of Specific Global Warming Levels on Extreme Rainfall Events over Southern Africa in CORDEX and NEX-GDDP Ensembles. Int. J. Climatol. 2020, 40, 3118–3141. [Google Scholar] [CrossRef]
  3. Ellwanger, J.H.; Kulmann-Leal, B.; Kaminski, V.L.; Valverde-Villegas, J.M.; da VEIGA, A.B.G.; Spilki, F.R.; Fearnside, P.M.; Caesar, L.; Giatti, L.L.; Wallau, G.L.; et al. Beyond Diversity Loss and Climate Change: Impacts of Amazon Deforestation on Infectious Diseases and Public Health. An Acad Bras Cienc. 2020, 92, e20191375. [Google Scholar] [CrossRef] [PubMed]
  4. Lima, A.O.; Lyra, G.B.; Abreu, M.C.; Oliveira-Júnior, J.F.; Zeri, M.; Cunha-Zeri, G. Extreme Rainfall Events over Rio de Janeiro State, Brazil: Characterization Using Probability Distribution Functions and Clustering Analysis. Atmos. Res. 2021, 247, 105221. [Google Scholar] [CrossRef]
  5. Easterling, D.R.; Evans, J.L.; Groisman, P.Y.; Karl, T.R.; Kunkel, K.E.; Ambenje, P. Observed Variability and Trends in Extreme Climate Events: A Brief Review. Bull. Am. Meteorol. Soc. 2000, 81, 417–425. [Google Scholar] [CrossRef]
  6. Trenberth, K.E. Changes in Precipitation with Climate Change. Clim. Res. 2011, 47, 123–138. [Google Scholar] [CrossRef] [Green Version]
  7. Zhu, Q.; Yang, X.; Ji, F.; Liu, D.L.; Yu, Q. Extreme Rainfall, Rainfall Erosivity, and Hillslope Erosion in Australian Alpine Region and Their Future Changes. Int. J. Climatol. 2020, 40, 1213–1227. [Google Scholar] [CrossRef]
  8. Towfiqul Islam, A.R.M.; Rahman, M.S.; Khatun, R.; Hu, Z. Spatiotemporal Trends in the Frequency of Daily Rainfall in Bangladesh during 1975–2017. Theor. Appl. Climatol. 2020, 141, 869–887. [Google Scholar] [CrossRef]
  9. Katz, R.W.; Brown, B.G. Extreme Events in a Changing Climate: Variability Is More Important than Averages. Clim. Change 1992, 21, 289–302. [Google Scholar] [CrossRef]
  10. de Lima, M.I.P.; Santo, F.E.; Ramos, A.M.; de Lima, J.L.M.P. Recent Changes in Daily Precipitation and Surface Air Temperature Extremes in Mainland Portugal, in the Period 1941-2007. Atmos. Res. 2013, 127, 195–209. [Google Scholar] [CrossRef]
  11. Solomon, S.D.; Qin, M.; Manning, Z.; Chen, M.; Marquis, K.B.; Averyt, M.T.; Miller, H.L.; Solomon, S.; Qin, D.; Manning, M.; et al. Summary for Policymakers. In Climate Change 2007: The Physical Science Basis. Contribution of Working Group I to the Fourth Assessment Report of the Intergovernmental Panel on Climate Change; Qin, D., Manning, M., Chen, Z., Marquis, M., Averyt, K., Tignor, M., Miller, H.L., Eds.; Cambridge University Press: New York, NY, USA; Geneva, Switzerland, 2007. [Google Scholar] [CrossRef]
  12. Zhang, X.; Alexander, L.; Hegerl, G.C.; Jones, P.; Tank, A.K.; Peterson, T.C.; Trewin, B.; Zwiers, F.W. Indices for Monitoring Changes in Extremes Based on Daily Temperature and Precipitation Data. Wiley Interdiscip. Rev. Clim. Chang. 2011, 2, 851–870. [Google Scholar] [CrossRef]
  13. Şensoy, S.; Türkoğlu, N.; Akçakaya, A.; Ekici, M.; Demircan, M.; Ulupınar, Y.; Atay, H.; Tüvan, A.; Demirbaş, H. Trends in Turkey Climate Indices from 1960 To 2010. Meteoroloji. Gov. Tr. 2013. Available online: https://www.researchgate.net/publication/289520845_Trends_in_Turkey_Climate_Indices_from_1960_to_2010 (accessed on 26 October 2022).
  14. Yilmaz, A.G. The Effects of Climate Change on Historical and Future Extreme Rainfall in Antalya, Turkey. Hydrol. Sci. J. 2015, 60, 2148–2162. [Google Scholar] [CrossRef] [Green Version]
  15. Almazroui, M. Rainfall Trends and Extremes in Saudi Arabia in Recent Decades. Atmosphere 2020, 11, 964. [Google Scholar] [CrossRef]
  16. Nastos, P.T.; Zerefos, C.S. On Extreme Daily Precipitation Totals at Athens, Greece. Adv. Geosci. 2007, 10, 59–66. [Google Scholar] [CrossRef] [Green Version]
  17. Deshpande, N.R.; Kulkarni, A.; Krishna Kumar, K. Characteristic Features of Hourly Rainfall in India. Int. J. Climatol. 2012, 32, 1730–1744. [Google Scholar] [CrossRef]
  18. Alpert, P.; Ben-Gai, T.; Baharad, A.; Benjamini, Y.; Yekutieli, D.; Colacino, M.; Diodato, L.; Ramis, C.; Homar, V.; Romero, R.; et al. The Paradoxical Increase of Mediterranean Extreme Daily Rainfall in Spite of Decrease in Total Values. Geophys. Res. Lett. 2002, 29, 31-1–31-4. [Google Scholar] [CrossRef] [Green Version]
  19. Goodess, C.M.; Jones, P.D. Links between Circulation and Changes in the Characteristics of Iberian Rainfall. Int. J. Climatol. 2002, 22, 1593–1615. [Google Scholar] [CrossRef]
  20. Alexander, L.v.; Zhang, X.; Peterson, T.C.; Caesar, J.; Gleason, B.; Klein Tank, A.M.G.; Haylock, M.; Collins, D.; Trewin, B.; Rahimzadeh, F.; et al. Global Observed Changes in Daily Climate Extremes of Temperature and Precipitation. J. Geophys. Res. Atmos. 2006, 111, 1042–1063. [Google Scholar] [CrossRef] [Green Version]
  21. Donat, M.G.; Alexander, L.V.; Yang, H.; Durre, I.; Vose, R.; Caesar, J. Global Land-Based Datasets for Monitoring Climatic Extremes. Bull. Am. Meteorol. Soc. 2013, 94, 997–1006. [Google Scholar] [CrossRef]
  22. Westra, S.; Alexander, L.V.; Zwiers, F.W. Global Increasing Trends in Annual Maximum Daily Precipitation. J. Clim. 2013, 26, 3904–3918. [Google Scholar] [CrossRef] [Green Version]
  23. Acar, Z.; Gönençgil, B. Investigation of Extreme Precipitation Indices in Turkey. Theor. Appl. Climatol. 2022, 148, 679–691. [Google Scholar] [CrossRef]
  24. Haylock, M.; Nicholls, N. Trends in Extreme Rainfall Indices for an Updated High Quality Data Set for Australia, 1910–1998. Int. J. Climatol. 2000, 20, 1533–1541. [Google Scholar] [CrossRef]
  25. Basher, M.A.; Stiller-Reeve, M.A.; Saiful Islam, A.K.M.; Bremer, S. Assessing Climatic Trends of Extreme Rainfall Indices over Northeast Bangladesh. Theor. Appl. Climatol. 2018, 134, 441–452. [Google Scholar] [CrossRef]
  26. Tong, S.; Li, X.; Zhang, J.; Bao, Y.; Bao, Y.; Na, L.; Si, A. Spatial and temporal variability in extreme temperature and precipitation events in Inner Mongolia (China) during 1960–2017. Sci. Total. Environ. 2019, 649, 75–89. [Google Scholar] [CrossRef] [PubMed]
  27. Larbi, I.; Hountondji, F.C.C.; Annor, T.; Agyare, W.A.; Gathenya, J.M.; Amuzu, J. Spatio-Temporal Trend Analysis of Rainfall and Temperature Extremes in the Vea Catchment, Ghana. Climate 2018, 6, 87. [Google Scholar] [CrossRef] [Green Version]
  28. Xoplaki Climate Variability over the Mediterranean; University of Bern: Bern, Switzerland, 2002.
  29. Black, E. The impact of climate change on daily precipitation statistics in Jordan and Israel. Atmospheric Sci. Lett. 2009, 10, 192–200. [Google Scholar] [CrossRef]
  30. Lelieveld, J.; Hadjinicolaou, P.; Kostopoulou, E.; Chenoweth, J.; El Maayar, M.; Giannakopoulos, C.; Hannides, C.; Lange, M.A.; Tanarhte, M.; Tyrlis, E.; et al. Climate change and impacts in the Eastern Mediterranean and the Middle East. Clim. Change 2012, 114, 667–687. [Google Scholar] [CrossRef] [Green Version]
  31. Mayewski, P.A.; Rohling, E.; Stager, J.C.; Karlén, W.; Maasch, K.A.; Meeker, L.D.; Meyerson, E.A.; Gasse, F.; Van Kreveld, S.; Holmgren, K.; et al. Holocene climate variability. Quat. Res. 2004, 62, 243–255. [Google Scholar] [CrossRef]
  32. Orland, I.J.; Bar-Matthews, M.; Kita, N.T.; Ayalon, A.; Matthews, A.; Valley, J.W. Climate deterioration in the Eastern Mediterranean as revealed by ion microprobe analysis of a speleothem that grew from 2.2 to 0.9 ka in Soreq Cave, Israel. Quat. Res. 2009, 71, 27–35. [Google Scholar] [CrossRef]
  33. Frumkin, A.; Magaritz, M.; Carmi, I.; Zak, I. The Holocene climatic record of the salt caves of Mount Sedom Israel. Holocene 1991, 1, 191–200. [Google Scholar] [CrossRef]
  34. Giorgi, F. Climate Change Hot-Spots. Geophys. Res. Lett. 2006, 33, 101029. [Google Scholar] [CrossRef]
  35. Lu, J.; Vecchi, G.A.; Reichler, T. Expansion of the Hadley cell under global warming. Geophys. Res. Lett. 2007, 34. [Google Scholar] [CrossRef] [Green Version]
  36. Zittis, G.; Almazroui, M.; Alpert, P.; Ciais, P.; Cramer, W.; Dahdal, Y.; Fnais, M.; Francis, D.; Hadjinicolaou, P.; Howari, F.; et al. Climate Change and Weather Extremes in the Eastern Mediterranean and Middle East. Rev. Geophys. 2022, 60, e2021RG000762. [Google Scholar] [CrossRef]
  37. Al-Qinna, M.I.; Hammouri, N.A.; Obeidat, M.M.; Ahmad, F.Y. Drought analysis in Jordan under current and future climates. Clim. Chang. 2011, 106, 421–440. [Google Scholar] [CrossRef]
  38. Shadeed, S. Spatio-temporal Drought Analysis in Arid and Semi-arid Regions: A Case Study from Palestine. Arab. J. Sci. Eng. 2013, 38, 2303–2313. [Google Scholar] [CrossRef]
  39. Mathbout, S.; Lopez-Bustins, J.A.; Martin-Vide, J.; Bech, J.; Rodrigo, F.S. Spatial and temporal analysis of drought variability at several time scales in Syria during 1961–2012. Atmospheric Res. 2018, 200, 153–168. [Google Scholar] [CrossRef]
  40. Lange, M.A. Impacts of Climate Change on the Eastern Mediterranean and the Middle East and North Africa Region and the Water–Energy Nexus. Atmosphere 2019, 10, 455. [Google Scholar] [CrossRef] [Green Version]
  41. Ben-Gai, T.; Bitan, A.; Manes, A.; Alpert, P. Long-term changes in annual rainfall patterns in southern Israel. Theor. Appl. Clim. 1994, 49, 59–67. [Google Scholar] [CrossRef]
  42. Ben-Gai, T.; Bitan, A.; Manes, A.; Alpert, P.; Rubin, S. Spatial and Temporal Changes in Rainfall Frequency Distribution Patterns in Israel. Arch. Meteorol. Geophys. Bioclimatol. Ser. B 1998, 61, 177–190. [Google Scholar] [CrossRef]
  43. Freiwan, M.; Kadioglu, M. Spatial and temporal analysis of climatological data in Jordan. Int. J. Clim. 2008, 28, 521–535. [Google Scholar] [CrossRef]
  44. Ghanem, A.A. Climatology of the areal precipitation in Amman/Jordan. Int. J. Clim. 2011, 31, 1328–1333. [Google Scholar] [CrossRef]
  45. Ziv, B.; Saaroni, H.; Pargament, R.; Harpaz, T.; Alpert, P. Trends in rainfall regime over Israel, 1975–2010, and their relationship to large-scale variability. Reg. Environ. Chang. 2014, 14, 1751–1764. [Google Scholar] [CrossRef]
  46. Yosef, Y.; Aguilar, E.; Alpert, P. Changes in extreme temperature and precipitation indices: Using an innovative daily homogenized database in Israel. Int. J. Clim. 2019, 39, 5022–5045. [Google Scholar] [CrossRef]
  47. Zhang, X.; Aguilar, E.; Sensoy, S.; Melkonyan, H.; Tagiyeva, U.; Ahmed, N.; Kutaladze, N.; Rahimzadeh, F.; Taghipour, A.; Hantosh, T.H.; et al. Trends in Middle East climate extreme indices from 1950 to 2003. J. Geophys. Res. Earth Surf. 2005, 110. [Google Scholar] [CrossRef]
  48. Donat, M.G.; Peterson, T.C.; Brunet, M.; King, A.D.; Almazroui, M.; Kolli, R.K.; Boucherf, D.; Al-Mulla, A.Y.; Nour, A.Y.; Aly, A.A.; et al. Changes in extreme temperature and precipitation in the Arab region: Long-term trends and variability related to ENSO and NAO. Int. J. Climatol. 2014, 34, 581–592. [Google Scholar] [CrossRef]
  49. Salameh, A.A.M.; Gámiz-Fortis, S.R.; Castro-Díez, Y.; Abu Hammad, A.; Esteban-Parra, M.J. Spatio-temporal analysis for extreme temperature indices over the Levant region. Int. J. Clim. 2019, 39, 5556–5582. [Google Scholar] [CrossRef]
  50. Kutiel, H.; Benaroch, Y. North Sea-Caspian Pattern (NCP)—An upper level atmospheric teleconnection affecting the Eastern Mediterranean: Identification and definition. Theor. Appl. Clim. 2002, 71, 17–28. [Google Scholar] [CrossRef]
  51. Price, C.; Stone, L.; Huppert, A.; Rajagopalan, B.; Alpert, P. A possible link between El Niño and precipitation in Israel. Geophys. Res. Lett. 1998, 25, 3963–3966. [Google Scholar] [CrossRef]
  52. Kelley, C.; Ting, M.; Seager, R.; Kushnir, Y. Mediterranean precipitation climatology, seasonal cycle, and trend as simulated by CMIP5. Geophys. Res. Lett. 2012, 39. [Google Scholar] [CrossRef]
  53. Ziv, B.; Dayan, U.; Kushnir, Y.; Roth, C.; Enzel, Y. Regional and global atmospheric patterns governing rainfall in the southern Levant. Int. J. Clim. 2006, 26, 55–73. [Google Scholar] [CrossRef]
  54. Yosef, Y.; Saaroni, H.; Alpert, P. Trends in Daily Rainfall Intensity Over Israel 1950/1-2003/4. Open Atmos. Sci. J. 2009, 3, 196–203. [Google Scholar] [CrossRef] [Green Version]
  55. Ávila, A.; Justino, F.; Wilson, A.; Bromwich, D.; Amorim, M. Recent precipitation trends, flash floods and landslides in southern Brazil. Environ. Res. Lett. 2016, 11, 114029. [Google Scholar] [CrossRef]
  56. Spinoni, J.; Barbosa, P.; Bucchignani, E.; Cassano, J.; Cavazos, T.; Christensen, J.H.; Christensen, O.B.; Coppola, E.; Evans, J.; Geyer, B.; et al. Future Global Meteorological Drought Hot Spots: A Study Based on CORDEX Data. J. Clim. 2020, 33, 3635–3661. [Google Scholar] [CrossRef]
  57. Garnaut, R. The Garnaut Climate Change Review: Final Report; Cambridge University Press: Cambridge, UK, 2008. [Google Scholar]
  58. Trewin, B. A daily homogenized temperature data set for Australia. Int. J. Clim. 2013, 33, 1510–1529. [Google Scholar] [CrossRef]
  59. Sibson, R. A Brief Description of Natural Neighbour Interpolation. In Interpreting Multivariate Data; John Wiley & Sons: New York, NY, USA, 1981. [Google Scholar]
  60. Wang, X.L.; Feng, Y. RHtestsV4 User Manual; Climate Research Division, Atmospheric Science and Technology Directorate, Science and Technology Branch, Environment Canada: Toronto, ON, Canada, 2013. [Google Scholar]
  61. Wang, X.L.; Chen, H.; Wu, Y.; Feng, Y.; Pu, Q. New Techniques for the Detection and Adjustment of Shifts in Daily Precipitation Data Series. J. Appl. Meteorol. Clim. 2010, 49, 2416–2436. [Google Scholar] [CrossRef]
  62. Villafuerte, M.Q.; Matsumoto, J.; Kubota, H. Changes in extreme rainfall in the Philippines (1911-2010) linked to global mean temperature and ENSO. Int. J. Clim. 2015, 35, 2033–2044. [Google Scholar] [CrossRef]
  63. Wang, S.; Jiang, F.; Ding, Y. Spatial coherence of variations in seasonal extreme precipitation events over Northwest Arid Region, China. Int. J. Clim. 2015, 35, 4642–4654. [Google Scholar] [CrossRef]
  64. Wu, C.; Huang, G. Projection of climate extremes in the Zhujiang River basin using a regional climate model. Int. J. Clim. 2016, 36, 1184–1196. [Google Scholar] [CrossRef] [Green Version]
  65. Klein Tank, A.B.G.; Zwiers, F.W. Guidelines on Analysis of Extremes in a Changing Climate in Support of Informed Decisions for Adaptation; World Meteorological Organization (WMO): Geneva, Switzerland, 2009. [Google Scholar]
  66. Ajjur, S.B.; Riffi, M.I. Analysis of the observed trends in daily extreme precipitation indices in Gaza Strip during 1974–2016. Int. J. Clim. 2020, 40, 6189–6200. [Google Scholar] [CrossRef]
  67. Zhang, X.B.F.Y. R ClimDex 1.0 User Mannual; Climate research branch environment Canada: Downsview, ON, Canada, 2004. [Google Scholar]
  68. Mann, H.B. Non-Parametric Test Against Trend. Econometrica 1945, 13, 245–259. [Google Scholar] [CrossRef]
  69. Kendall, M.G. Rank Correlation Methods. Biometrika 1957, 44, 298. [Google Scholar] [CrossRef]
  70. Sen, P.K. Estimates of the regression coefficient based on Kendall’s Tau. J. Am. Stat. Assoc. 1968, 63, 1379–1389. [Google Scholar] [CrossRef]
  71. Zhang, X.; Vincent, L.A.; Hogg, W.D.; Niitsoo, A. Temperature and precipitation trends in Canada during the 20th century. Atmos.-Ocean 2000, 38, 395–429. [Google Scholar] [CrossRef]
  72. New, M.; Hewitson, B.; Stephenson, D.B.; Tsiga, A.; Kruger, A.; Manhique, A.; Gomez, B.; Coelho, C.A.S.; Masisi, D.N.; Kululanga, E.; et al. Evidence of trends in daily climate extremes over southern and west Africa. J. Geophys. Res. Atmos. 2006, 111, D14102. [Google Scholar] [CrossRef]
  73. Demir, V.; Keskin, A. Water level change of lakes and sinkholes in Central Turkey under anthropogenic effects. Arch. Meteorol. Geophys. Bioclimatol. Ser. B 2020, 142, 929–943. [Google Scholar] [CrossRef]
  74. Citakoglu, H.; Minarecioglu, N. Trend analysis and change point determination for hydro-meteorological and groundwater data of Kizilirmak basin. Arch. Meteorol. Geophys. Bioclimatol. Ser. B 2021, 145, 1275–1292. [Google Scholar] [CrossRef]
  75. Wang, X.L.; Swail, V.R. Changes of Extreme Wave Heights in Northern Hemisphere Oceans and Related Atmospheric Cir-culation Regimes. J. Clim. 2001, 14. [Google Scholar] [CrossRef]
  76. Patakamuri, S.K.; O’Brien, N. Package ‘Modifiedmk’ (Version 1.4.0): Modified Versions of Mann Kendall and Spearman’s Rho Trend Tests. CRAN 2021. Available online: https://cran.r-project.org/web/packages/modifiedmk/modifiedmk.pdf (accessed on 1 September 2021).
  77. Efthymiadis, D.; Goodess, C.; Jones, P. Trends in Mediterranean gridded temperature extremes and large-scale circulation influences. Nat. Hazards Earth Syst. Sci. 2011, 11, 2199–2214. [Google Scholar] [CrossRef]
  78. Popov, T.; Gnjato, S.; Trbić, G.; Ivanišević, M. Recent Trends in Extreme Temperature Indices in Bosnia and Herzegovina. Carpathian J. Earth Environ. Sci. 2018, 13, 211–224. [Google Scholar] [CrossRef]
  79. Yenigun, K.; Ibrahim, W.A. Investigation of drought in the northern Iraq region. Meteorol. Appl. 2019, 26, 490–499. [Google Scholar] [CrossRef] [Green Version]
  80. Nouri, M.; Homaee, M. Drought trend, frequency and extremity across a wide range of climates over Iran. Meteorol. Appl. 2020, 27, e1899. [Google Scholar] [CrossRef]
  81. Hameed, M.; Ahmadalipour, A.; Moradkhani, H. Drought and food security in the middle east: An analytical framework. Agric. For. Meteorol. 2020, 281, 107816. [Google Scholar] [CrossRef]
  82. AlSarmi, S.; Washington, R. Recent observed climate change over the Arabian Peninsula. J. Geophys. Res. Earth Surf. 2011, 116. [Google Scholar] [CrossRef]
  83. Shohami, D.; Dayan, U.; Morin, E. Warming and drying of the eastern Mediterranean: Additional evidence from trend analysis. J. Geophys. Res. Earth Surf. 2011, 116. [Google Scholar] [CrossRef]
  84. Hochman, A.; Mercogliano, P.; Alpert, P.; Saaroni, H.; Bucchignani, E. High-resolution projection of climate change and extremity over Israel using COSMO-CLM. Int. J. Clim. 2018, 38, 5095–5106. [Google Scholar] [CrossRef]
  85. Luong, T.M.; Dasari, H.P.; Hoteit, I. Extreme precipitation events are becoming less frequent but more intense over Jeddah, Saudi Arabia. Are shifting weather regimes the cause? Atmos. Sci. Lett. 2020, 21, e981. [Google Scholar] [CrossRef]
  86. Cheng, C.S.; Auld, H.; Li, Q.; Li, G. Possible impacts of climate change on extreme weather events at local scale in south–central Canada. Clim. Change 2012, 112, 963–979. [Google Scholar] [CrossRef] [Green Version]
  87. Papalexiou, S.M.; Montanari, A. Global and Regional Increase of Precipitation Extremes Under Global Warming. Water Resour. Res. 2019, 55, 4901–4914. [Google Scholar] [CrossRef]
  88. Seidel, D.J.; Fu, Q.; Randel, W.J.; Reichler, T.J. Widening of the tropical belt in a changing climate. Nat. Geosci. 2008, 1, 21–24. [Google Scholar] [CrossRef]
  89. Hertig, E.; Seubert, S.; Paxian, A.; Vogt, G.; Paeth, H.; Jacobeit, J. Changes of total versus extreme precipitation and dry periods until the end of the twenty-first century: Statistical assessments for the Mediterranean area. Arch. Meteorol. Geophys. Bioclimatol. Ser. B 2013, 111, 1–20. [Google Scholar] [CrossRef]
  90. Sillmann, J.; Roeckner, E. Indices for extreme events in projections of anthropogenic climate change. Clim. Change 2008, 86, 83–104. [Google Scholar] [CrossRef] [Green Version]
  91. Tebaldi, C.; Hayhoe, K.; Arblaster, J.M.; Meehl, G.A. Going to the Extremes: An Intercomparison of Model-Simulated Historical and Future Changes in Extreme Events. Clim. Change 2006, 79, 185–211. [Google Scholar] [CrossRef]
  92. Saaroni, H.; Ziv, B.; Lempert, J.; Gazit, Y.; Morin, E. Prolonged dry spells in the Levant region: Climatologic-synoptic analysis. Int. J. Clim. 2015, 35, 2223–2236. [Google Scholar] [CrossRef]
  93. Kutiel, H.; Paz, S. Sea Level Pressure Departures in the Mediterranean and their Relationship with Monthly Rainfall Conditions in Israel. Arch. Meteorol. Geophys. Bioclimatol. Ser. B 1998, 60, 93–109. [Google Scholar] [CrossRef]
  94. Törnros, T. On the relationship between the Mediterranean Oscillation and winter precipitation in the Southern Levant. Atmos. Sci. Lett. 2013, 14, 287–293. [Google Scholar] [CrossRef]
  95. Baltacı, H.; Akkoyunlu, B.O.; Tayanç, M. Relationships between teleconnection patterns and Turkish climatic extremes. Arch. Meteorol. Geophys. Bioclimatol. Ser. B 2018, 134, 1365–1386. [Google Scholar] [CrossRef]
  96. Redolat, D.; Monjo, R.; Lopez-Bustins, J.A.; Martin-Vide, J. Upper-Level Mediterranean Oscillation index and seasonal variability of rainfall and temperature. Theor. Appl. Clim. 2019, 135, 1059–1077. [Google Scholar] [CrossRef]
  97. Müller-Plath, G.; Lüdecke, H.-J.; Lüning, S. Long-distance air pressure differences correlate with European rain. Sci. Rep. 2022, 12, 10191. [Google Scholar] [CrossRef]
  98. Martin-Vide, J.; Lopez-Bustins, J.-A. The Western Mediterranean Oscillation and rainfall in the Iberian Peninsula. Int. J. Clim. 2006, 26, 1455–1475. [Google Scholar] [CrossRef]
  99. Krichak, S.O.; Alpert, P. Decadal trends in the east Atlantic-west Russia pattern and Mediterranean precipitation. Int. J. Clim. 2005, 25, 183–192. [Google Scholar] [CrossRef]
  100. Zhang, X.; Chen, Y.; Fang, G.; Li, Y.; Li, Z.; Wang, F.; Xia, Z. Observed changes in extreme precipitation over the Tienshan Mountains and associated large-scale climate teleconnections. J. Hydrol. 2022, 606, 127457. [Google Scholar] [CrossRef]
  101. Zhu, J.; Zhou, H.; Xiao, H.; Wang, X. Singular value decomposition (SVD) based correlation analysis of climatic factors and extreme precipitation in Hunan Province, China, during 1960–2009. J. Water Clim. Change 2021, 12, 3602–3616. [Google Scholar] [CrossRef]
  102. Quishpe-Vásquez, C.; Gámiz-Fortis, S.R.; García-Valdecasas-Ojeda, M.; Castro-Díez, Y.; Esteban-Parra, M.J. Tropical Pacific sea surface temperature influence on seasonal streamflow variability in Ecuador. Int. J. Clim. 2019, 39, 3895–3914. [Google Scholar] [CrossRef]
Figure 1. Study area location and the spatial distribution of the stations used in this study. Names of stations are mentioned in Table S2 (Supplementary Material).
Water 14 03799 g001
Figure 2. Spatial distribution of trends for the number of wet days (R1mm in days/decade), extremely wet days (R99P in mm/decade), contribution from extremely wet days (R99Ptot in %/decade), max 3-day precipitation amount (RX3day in mm/decade), and consecutive dry days (CDD in days/decade) indices exhibiting notably significant decreasing (yellow triangles) or increasing (blue triangles) trends at the 95% confidence level.
Water 14 03799 g002
Table 1. Description of extreme precipitation indices used in this study.
No.IndexIndicator NameDefinitionUnit
1PRCPTOTAnnual total wet day precipitationAnnual total precipitation from days ≥1 mmmm
2R1mmNumber of wet daysAnnual count of days when precipitation ≥1 mmDays
3R10mmNumber of heavy precipitation daysAnnual count of days when precipitation ≥10 mmDays
4R20mmNumber of very heavy precipitation daysAnnual count of days when precipitation ≥20 mmDays
5R50mmNumber of days above 50 mmAnnual count of days when precipitation ≥50 mmDays
6R95PVery wet daysAnnual total precipitation when daily precipitation amount >95th percentilemm
7R99PExtremely wet daysAnnual total precipitation when daily precipitation amount >99th percentilemm
8R95PtotContribution from very wet days100*R95P/PRCPTOT%
9R99PtotContribution from extremely wet days100*R99P/PRCPTOT%
10RX1dayMax 1-day precipitation amountMonthly maximum 1-day precipitationmm
11RX3dayMax 3-day precipitation amountMonthly maximum consecutive 3-day precipitationmm
12RX5dayMax 5-day precipitation amountMonthly maximum consecutive 5-day precipitationmm
13SDIISimple daily intensity indexAnnual total precipitation divided by the number of wet days (defined as precipitation ≥1 mm) in the yearmm/day
14CWDConsecutive wet daysMaximum number of consecutive days when precipitation ≥1 mmDays
15CWD-DJFConsecutive wet days in winterMaximum number of consecutive days when precipitation ≥1 mm, between December to FebruaryDays
16CWD-MAMConsecutive wet days in springMaximum number of consecutive days when precipitation ≥1 mm, between March to MayDays
17CWD-DJFMAMConsecutive wet days in winter and springMaximum number of consecutive days when precipitation ≥1 mm between December to MarchDays
18CDDConsecutive dry daysMaximum number of consecutive days when precipitation <1 mmDays
19CDD-DJFConsecutive dry days in winterMaximum number of consecutive days when precipitation <1 mm, between December to FebruaryDays
20CDD-MAMConsecutive dry days in springMaximum number of consecutive days when precipitation <1 mm, between March to MayDays
21CDD-DJFMAMConsecutive dry days in winter and springMaximum number of consecutive days when precipitation <1 mm between December to MarchDays
Table 2. Number of stations that showed increasing or decreasing trend along with the trend values for the annual extreme indices averaged over the study area, during the period 1970–2020. The number in brackets represents the counts of stations with statistically significant trends at the 95% confidence level. Asterisks indicate significance level: ** = (p < 0.05).
No.IndexTotal (+) Trends (Sig.)Total (−) Trends (Sig.)No Trend Trend for Averaged Time Series
1PRCPTOT25 (0)41 (1)0−2.9 (mm/decade)
2R1mm3 (0)63 (11)0−1.1 (days/decade)
3R10mm15 (0)51 (3)2−0.2 (days/decade)
4R20mm5 (0)27 (2)270.0 (days/decade)
5R50mm17 (0)3 (0)460.07 (days/decade)
6R95P48 (4)14 (0)45.3 (mm/decade)
7R99P9 (9)0 (0)574.4 ** (mm/decade)
8R95Ptot52 (2)10 (0)40.8 (%/decade)
9R99Ptot9 (6)0 (0)570.78 ** (%/decade)
10RX1day51 (3)15 (0)01.7 ** (mm/decade)
11RX3day48 (6)18 (0)02.1 ** (mm/decade)
12RX5day48 (1)18 (0)01.2 (mm/decade)
13SDII50 (4)16 (0)00.19 (mm/decade)
14CWD48 (0)18 (0)250.04 (days/decade)
15CDD9 (0)57 (16)0−2.7 ** (days/decade)
Table 3. Number of stations that showed increasing or decreasing trends along with the trend values for the averaged time series, 1970–2020. The number in brackets represents the counts of stations with statistically significant trends at the 95% confidence level. Asterisks indicate significance level: * = (p < 0.1), ** = (p < 0.05).
IndexSeasonTot. (+) Trends (Sig.)Tot. (−) Trends (Sig.)No TrendTrend for Averaged Time Series
PRCPTOTWinter48 (0)18 (0)08.8 mm/decade
Spring2 (0)64 (18)0−5.8 mm/decade
Autumn12 (0)54 (0)0−1.9 mm/decade
R1mmWinter6 (0)60 (3)0−0.6 days/decade
Spring7 (0)59 (8)0−0.3 days/decade
Autumn20 (0)37 (0)9−0.08 days/decade
R10mmWinter27 (0)33 (0)6−0.05 days/decade
Spring4 (0)62 (7)0−0.02 days/decade
Autumn12 (0)28 (0)260
R20mmWinter46 (0)9 (0)110.1 days/decade
Spring0 (0)22 (5)44−0.09 days/decade
Autumn3 (0)25 (4)380.04 days/decade
RX1dayWinter53 (6)13 (0)02.2 * mm/decade
Spring2 (0)64 (21)0−2.1 * mm/decade
Autumn6 (0)60 (9)0−1.8 mm/decade
RX3dayWinter52 (7)14 (0)03.3 mm/decade
Spring1 (0)65 (20)0−3.6 * mm/decade
Autumn7 (0)59 (8)0−2.5 mm/decade
RX5dayWinter46 (2)20 (0)01.7 mm/decade
Spring2 (0)64 (15)0−3.7 mm/decade
Autumn11 (0)55 (3)0−2.4 mm/decade
SDIIWinter55 (11)11 (0)00.25 mm/decade
Spring6 (0)60 (19)0−0.52 * mm/decade
Autumn3 (0)63 (19)0−0.75 * mm/decade
CDDWinter22 (0)44 (0)0−0.03 days/decade
Spring59 (21)5 (0)01.5 ** days/decade
Winter-spring59 (20)7 (0)01.7 * days/decade
CWDWinter15 (0)25 (0)26−0.05 days/decade
Spring3 (0)53 (16)10−0.2 days/decade
Winter-spring22 (0)21 (0)23−0.01 days/decade
Publisher’s Note: MDPI stays neutral with regard to jurisdictional claims in published maps and institutional affiliations.

