
Multicriteria Decision Analysis of Sites with Increased Nutrient Contents in Water
1
Faculty of Technology, University of Niš, Bulevar Oslobođenja 124, 16000 Leskovac, Serbia
2
Department of Engineering Management, Technical Faculty, University of Belgrade, Vojske Jugoslavije 12, 19210 Bor, Serbia
3
Inspection Department, City Administration of Leskovac, 16000 Leskovac, Serbia
*
Author to whom correspondence should be addressed.
Water 2022, 14(23), 3810; https://doi.org/10.3390/w14233810
Submission received: 24 October 2022
/
Revised: 18 November 2022
/
Accepted: 19 November 2022
/
Published: 23 November 2022
(This article belongs to the Special Issue Decision-Making Theory and Methodology for Water, Energy and Food Security)
Abstract
:Nutrient pollution represents an ongoing problem and a great challenge to water resources management around the world. Therefore, the aim of this paper is to contribute to the efforts of the water resources management in considering a problem of the nutrient pollution of water from a multicriteria decision-making point of view. The combined PROMETHEE and GAIA analysis in this paper included indicators of nutrients in the water (total nitrogen, nitrite, nitrate, ammonium ion, total phosphorus, and orthophosphates) to rank and evaluate significant sites along the Danube River flow through Serbia. Furthermore, the ecological quality status of the water was determined which places the Danube River into the category of “good” to “moderate” water quality. The results represent a detailed evaluation of the sites with increased nutrient content, associated with the most dominant parameters of nutrient indicators affecting water pollution at each site. The main sources of nonpoint pollution are of anthropogenic origin reflected in agricultural applications of pesticides and fertilizers, together with natural contamination of ground and water sources, while pollution from point sources arises from industrial waste waters as well as from domestic activities. Minimizing the application of fertilizers and pesticides is a way to control pollution from agricultural activities while, at the same time, a proper wastewater treatment is needed to reduce point sources, although financial aspects and lack of funds are limiting factors of this control in Serbia. Therefore, the findings in this paper could serve environmental scientists and water resources managers as a starting point in identifying key sources of nutrient pollution in water, as well as industry experts and national authorities in expanding strategies and taking long-term measures to reduce the input of nutrients into the valuable Danube River.
1. Introduction
In accordance with the Danube River Basin Management Plan [1], one of the four major problems related to the quality of water and its chemical and ecological conditions along the Danube basin is nutrient pollution. The three other problems are related to organic pollution, pollution with dangerous substances, and hydro-morphological changes in rivers.
Nutrients are compounds of nitrogen and phosphorus that are normally found in water, but whose increased content in water leads to a pollution, as a result of which the water then becomes an unhealthy environment due to the flora and fauna in it, and becomes unsuitable for drinking purposes [2]. Namely, these compounds potentiate the faster growth of algae and contribute to the process of eutrophication, which jeopardizes the supply of some of the substantial water purposes [3,4].
Soil erosion and leaching of the arable land increases the content of nitrogen and phosphate compounds in water and leads to nutrient pollution of water [5]. Moreover, the concentration of nutrients in water is affected by various detergents from households or industry, excess herbicides, insecticides, oils, fats, and numerous toxic chemicals from the urban environment, as well as salt deposition during irrigation, acids from abandoned mines or sediments from construction sites, crops and forest land. Nevertheless, changes in climate conditions affect the amount of precipitation leading to floods, which then enhance soil washing and erosion and therefore increase the risk of nutrient pollution [6].
Recent published data of the Republic of Serbia and the Green Network of Vojvodina estimate that Serbia releases 7200 tons of nitrogen and 7000 tons of phosphorus annually, which represents 13% of the total nitrogen pollution of the Danube and 14% of its total phosphorus pollution. It places Serbia in the third place in regard to the amount of nitrogen, and in second place in terms of the amount of phosphorus flowing into the waters of the Danube from all the countries within the basin. Nevertheless, the problem of the increased content of nutrients in the water is not specific only to the Danube basin, but related to many other water bodies, as well [7]. In its official annual Report on Water Quality and Pollution Indicators in Ireland, the EPA (Environmental Protection Agency) suggests that the main problem in the damaging of waters in Ireland is in fact the presence of excessive nutrient contents, primarily phosphorus and nitrogen, arising from agriculture and waste waters [8].
In general, sources of water pollution can be divided into concentrated (point) and scattered (nonpoint) sources. Point sources of pollution are commonly associated with urban areas and industry. Among the industries, the chemical and petrochemical industry, paper industry, food industry, metallurgy, and textile industry are among the biggest consumers of water. Pollution from agriculture can be of a concentrated (point) nature, if it is collected and released in one place, but more significant are scattered (nonpoint) pollutions that come from the use of fertilizers and chemical agents, which dissolve and flow into watercourses and other water ecosystems via surface or underground water [9]. Number of researchers in the field refers to the nonpoint sources of water pollution as a “wicked” ongoing problem that needs to be addressed thoroughly [10,11,12,13]. The circulation of substances in nature causes other forms of nonpoint pollution to appear, especially those originating from exhaust gases from traffic, emissions from industrial plants, landfills, etc. Uncontrolled and increased concentrations of nutrients in water bodies may cause a significant deterioration of water, which reflects back on both humans and all aquatic life, leading to increased health risks, water treatment costs, and ecological damage [14].
According to The International Commission for the Protection of the Danube River (ICPDR) and recent calculations, nonpoint sources of pollution dominate nitrogen emissions in the entire basin with approximately 80% of the total load. The remaining 20% of the total load is related to emissions from point sources, such as wastewater treatment plants and industrial discharges. The total nitrogen emissions in the Danube River Basin are estimated to be about 600,000 tons per year [15]. Although wastewater discharges and combined sewer overflows are significant source areas, some recent investigations suggest that the main emission sources are agricultural fields representing 40% of the total load [16].
Based on all the above, it is certain that excessive nutrient pollution represents a great source of concern to water resources management around the world. However, there are still a few up-to-date papers that deal with this issue, especially in regard to the Danube Basin. Therefore, the aim of this work is to carry out the analysis on the content of nutrients in the water of the Danube in Serbia. Given that the problem of water pollution with nutrients is a demanding and multicriteria problem, a multicriteria decision making analysis (MCDA) was used in this work to reveal more information about the mutual dependence between certain parameters of the nutrient indicators and the exact locations where nutrient content is exceeded.
The application of MCDA methods in water resources management has to date provided significant results [17,18,19,20,21,22]. Although there are many different MCDA methods applicable to water allocation issues, it is acknowledged in the literature that no single approach is superior [23]. In fact, the selection of a specific method depends on the type of information that is provided within the problem, the preferences of a decision-maker, as well as the preferred final outcome of the decision process [24]. Some require ranking of different alternatives, others search for a single optimal alternative, while some focus on discrepancy between acceptable alternatives.
The use of PROMETHEE (Preference Ranking Organization METHod for Enrichment Evaluation) and GAIA (Geometric Analysis for Interactive Assistance) methods in water quality analysis makes it possible to rank locations on the Danube to the desired criteria, as well as to determine consent or conflict between the individual criteria [25,26,27]. Therefore, a better and more comprehensive insight into a water quality parameters’ correlation leading to a more thorough evaluation on the actual state of the water quality of the Danube can be obtained [26]. Indicators of nutrients in the water (total nitrogen, nitrite, nitrate, ammonium ion, total phosphorus, and orthophosphates) were used as ranking criteria to investigate selected sites along the river flow through Serbia. Nutrient content values were therein compared with the limit values of the water quality classes, prescribed by the Regulation on limit values of pollutants [28] and the deviations are discussed.
To the best of our knowledge, none of the previous researches has dealt with nutrient pollution of the Danube River from a multicriteria analysis point of view providing the interdependences of locations and specific sources of pollution while, at the same time, exploring deviations from the prescribed limit values to determine the ecological quality status of water. The opinions of experts involved in water resources management were used as a guideline in defining the weights of criteria. Therefore, this paper can serve as a valuable contribution in providing an in-depth approach to the case of the matter. Furthermore, it can contribute to future investigations on improving the Danube River water quality, not only in Serbia, but also in the entire basin.
2. Materials and Methods
2.1. Research Area
The Danube is formed by joining of the smaller rivers Brega and Brigach in the Black Forest Mountain in Germany. It passes through 10 countries until it flows into the Black Sea on the territory of Romania. With a total length of 2850 km, it is the second largest river in Europe and a part of the Rhine-Main-Danube waterway. The Danube’s course through Serbia is 588 km long. However, one of the most beautiful rivers in the world has a major problem with pollution, which it constantly struggles with. Therefore, many are trying to find new ways to fight the pollution and reduce it to the greatest extent possible.
The investigation of the nutrient pollution of the Danube water in this paper includes attentively selected measuring sites located at a certain distance from the mouth of the river, namely: Bezdan (1425.59 km), Novi Sad (1254.98 km), Zemun (1174 km), Smederevo (1116 km), and Radujevac (852 km) (Figure 1).
The sites were chosen specifically due to the potential point or nonpoint sources of nutrient pollution in the water. The sites of Bezdan and Radujevac represent the entry and the exit points of the Danube River, respectively, which can provide valuable information about the state of the river’s watercourse after its exit from Hungary, as well as about the conditions of the watercourse as it leaves Serbia and enters Romania. Novi Sad is the center of industrial development in the northern Autonomous Province of Vojvodina and may be the source of point pollution of the Danube water arising from the industry. According to some press reports, Novi Sad discharges around 100,000 cubic meters of untreated wastewater per day. In this city, a new main pump station is being built, with the commissioning of which Novi Sad will join the other not quite numerous sites that treat wastewater in Vojvodina. Zemun is the center of road, river, and air traffic; therefore, with its banks of the Danube, it is ranked among the priority points of tourism development in Belgrade, the capitol of Serbia. Significant representatives of the pharmaceutical, chemical, food, electronic, wood, textile, construction, and IT sectors also operate in it. Nevertheless, there are about 11,000 ha of agricultural land that stretches on and around the Zemun area plain. Nearly 1000 agricultural holdings are mainly engaged in animal husbandry and farming. The site of Smederevo is important due to a large iron factory located there and its possible influence on the water pollution of the Danube River.
2.2. Data Collection
The Official National Agency for Environmental Protection [29] monitors changes in water quality parameters and records all the measurements on a monthly basis during the year in its database. The monitored parameters are grouped to present different indicators of water quality, according to the Regulation [28] into the following: General parameters and indicators of the oxygen regime, indicators of nutrient content, indicators of salinity, indicators of metal content, indicators of the presence of organic substances, microbiological parameters, and priority and harmful substances. Due to the research objectives, data for indicators of the nutrient content in the water were collected for 1 year. Therefore, the analysis included total nitrogen (N), nitrite (NO2-N), nitrate (NO3-N), orthophosphates (PO4-P), total phosphorus (P), and ammonium ion (NH4-N) monitored every month during 2017, thus covering warm and cold periods throughout all four seasons (spring, summer, autumn, and winter).
At the site of sampling, nitrites and nitrates are examined according to SRPS ISO 5663 standard; total N is determined according to DIN EN ISO 11905-2 standard and using UP 1.27/PC 12, ammonium ion (NH4-N) by SRPS ISO 7150-1 standard, orthophosphates (PO4-P) using UP 1.102/PC 12, while total P is determined by standard analytical method APHA AWWA WEF 4500-P(E).
2.3. Data Processing
For the purposes of data processing, the PROMETHEE and GAIA methods were used to conduct the analysis of nutrient pollution and enrich it with thorough understanding of the interrelations between the multiple attributes of the variables used. PROMETHEE method was originally introduced in 1984 by Brans et al. [30]. It represents an outranking multicriteria method that is based on a pairwise comparison of actions and variables. PROMETHEE method provides the placement of a number of actions in terms of weight and preferences previously chosen by the decision maker to be applied to the variable (i.e., nutrient parameters). It facilitates evaluation and enables ranking of possible actions according to multiple criteria [31], while GAIA method helps in visually representing the evaluation problem to reveal the interrelationships under the usually conflicting criteria [32].
As briefly explained by the Marttunen et al. [33], most of the studies dealing with MCDA application related to water management issues commonly use a custom methodology algorithm that consists of several successive steps: (a) Problem structuring based on the identification of the objectives, criteria, and their measures, as well as the selection of alternatives, (b) evaluation of the impacts of the alternatives and criteria, (c) collecting the opinions and preferences of the experts regarding the importance of the goal and assigning weights to the criteria accordingly, (d) calculating the overall priority for alternatives, and finally (e) analyzing the results, including sensitivity analysis and recommendations. The final outcome of the method is the ranking of alternatives through the performance scores of the alternatives, reflecting their convenience to the problem solving [33,34]. One of the advantages of using MCDA is its ability to support processes that involve multiple opinions and assessments, while also bringing subjective viewpoints into the evaluation. There are established procedures for eliciting different opinions and preferences in a structured way on an individual basis or in a cooperative way [35]. As a result, the combined weights that reflect on different preferences of the experts are determined through group discussion, which can strengthen the final decision on defining the weights [36].
In managing water resources problems, decision-making usually involves looking at a number of criteria, which are often conflicting, thus they require multi-criteria decision-making as an option [37]. The convenient MCDA method is the PROMETHEE method [38,39] and its visual interactive module for graphic interpretation GAIA [40]. The PROMETHEE method provides arrangement of a number of actions in accordance with the needs and preferences previously selected by the decision-maker and applied to the variables (for example, the concentration of nutrients in the water). Its algorithms are based on the principal component analysis (PCA) method, which determines the dominance of parameters [41], and enables the most dominant ones to be recognized. On the basis of PCA analysis, it is possible to form a GAIA plane which shows complex relations between dominant variables and actions, thus providing a better insight into significant connections within the given criteria [40]. GAIA analysis discovers conflicts among criteria, identifies potential compromises, and helps in fixing priorities.
3. Results
3.1. MCDA Results
Based on the official data [29] and the monthly recorded measurements, the average annual value for each nutrient indicator was calculated and presented in Table 1, along with their minimal and maximal monthly values. Then, an appropriate scenario for the application of the PROMETHEE and GAIA methods was formed to evaluate the sites in accordance with the nutrient content in the water.
In the defined scenario, the values need to be minimized for all the indicators observed. Linear function was chosen as preference function for all of the criteria since it is perfectly adequate for the quantitative nature of the parameters. The adopted thresholds of preference (P) and indifference (Q) were set to match the permitted zones [43]. To strengthen the results of the analysis, the opinions and judgments of experts were used as a guideline in defining the weights of criteria. According to the stability intervals which are quite wide (shown in Table 1), it can be confirmed that the weights were well assigned. Thereafter, PROMETHEE performed a complete ranking of selected sites based on the obtained preference flows (Table 2). The results showed that the Bezdan site is the most polluted one (ranked as the fifth with the lowest Phi net value of −0.1658) according to the content of nutrients in water, while the best one is the Smederevo site with the highest Phi net value of 0.2272.
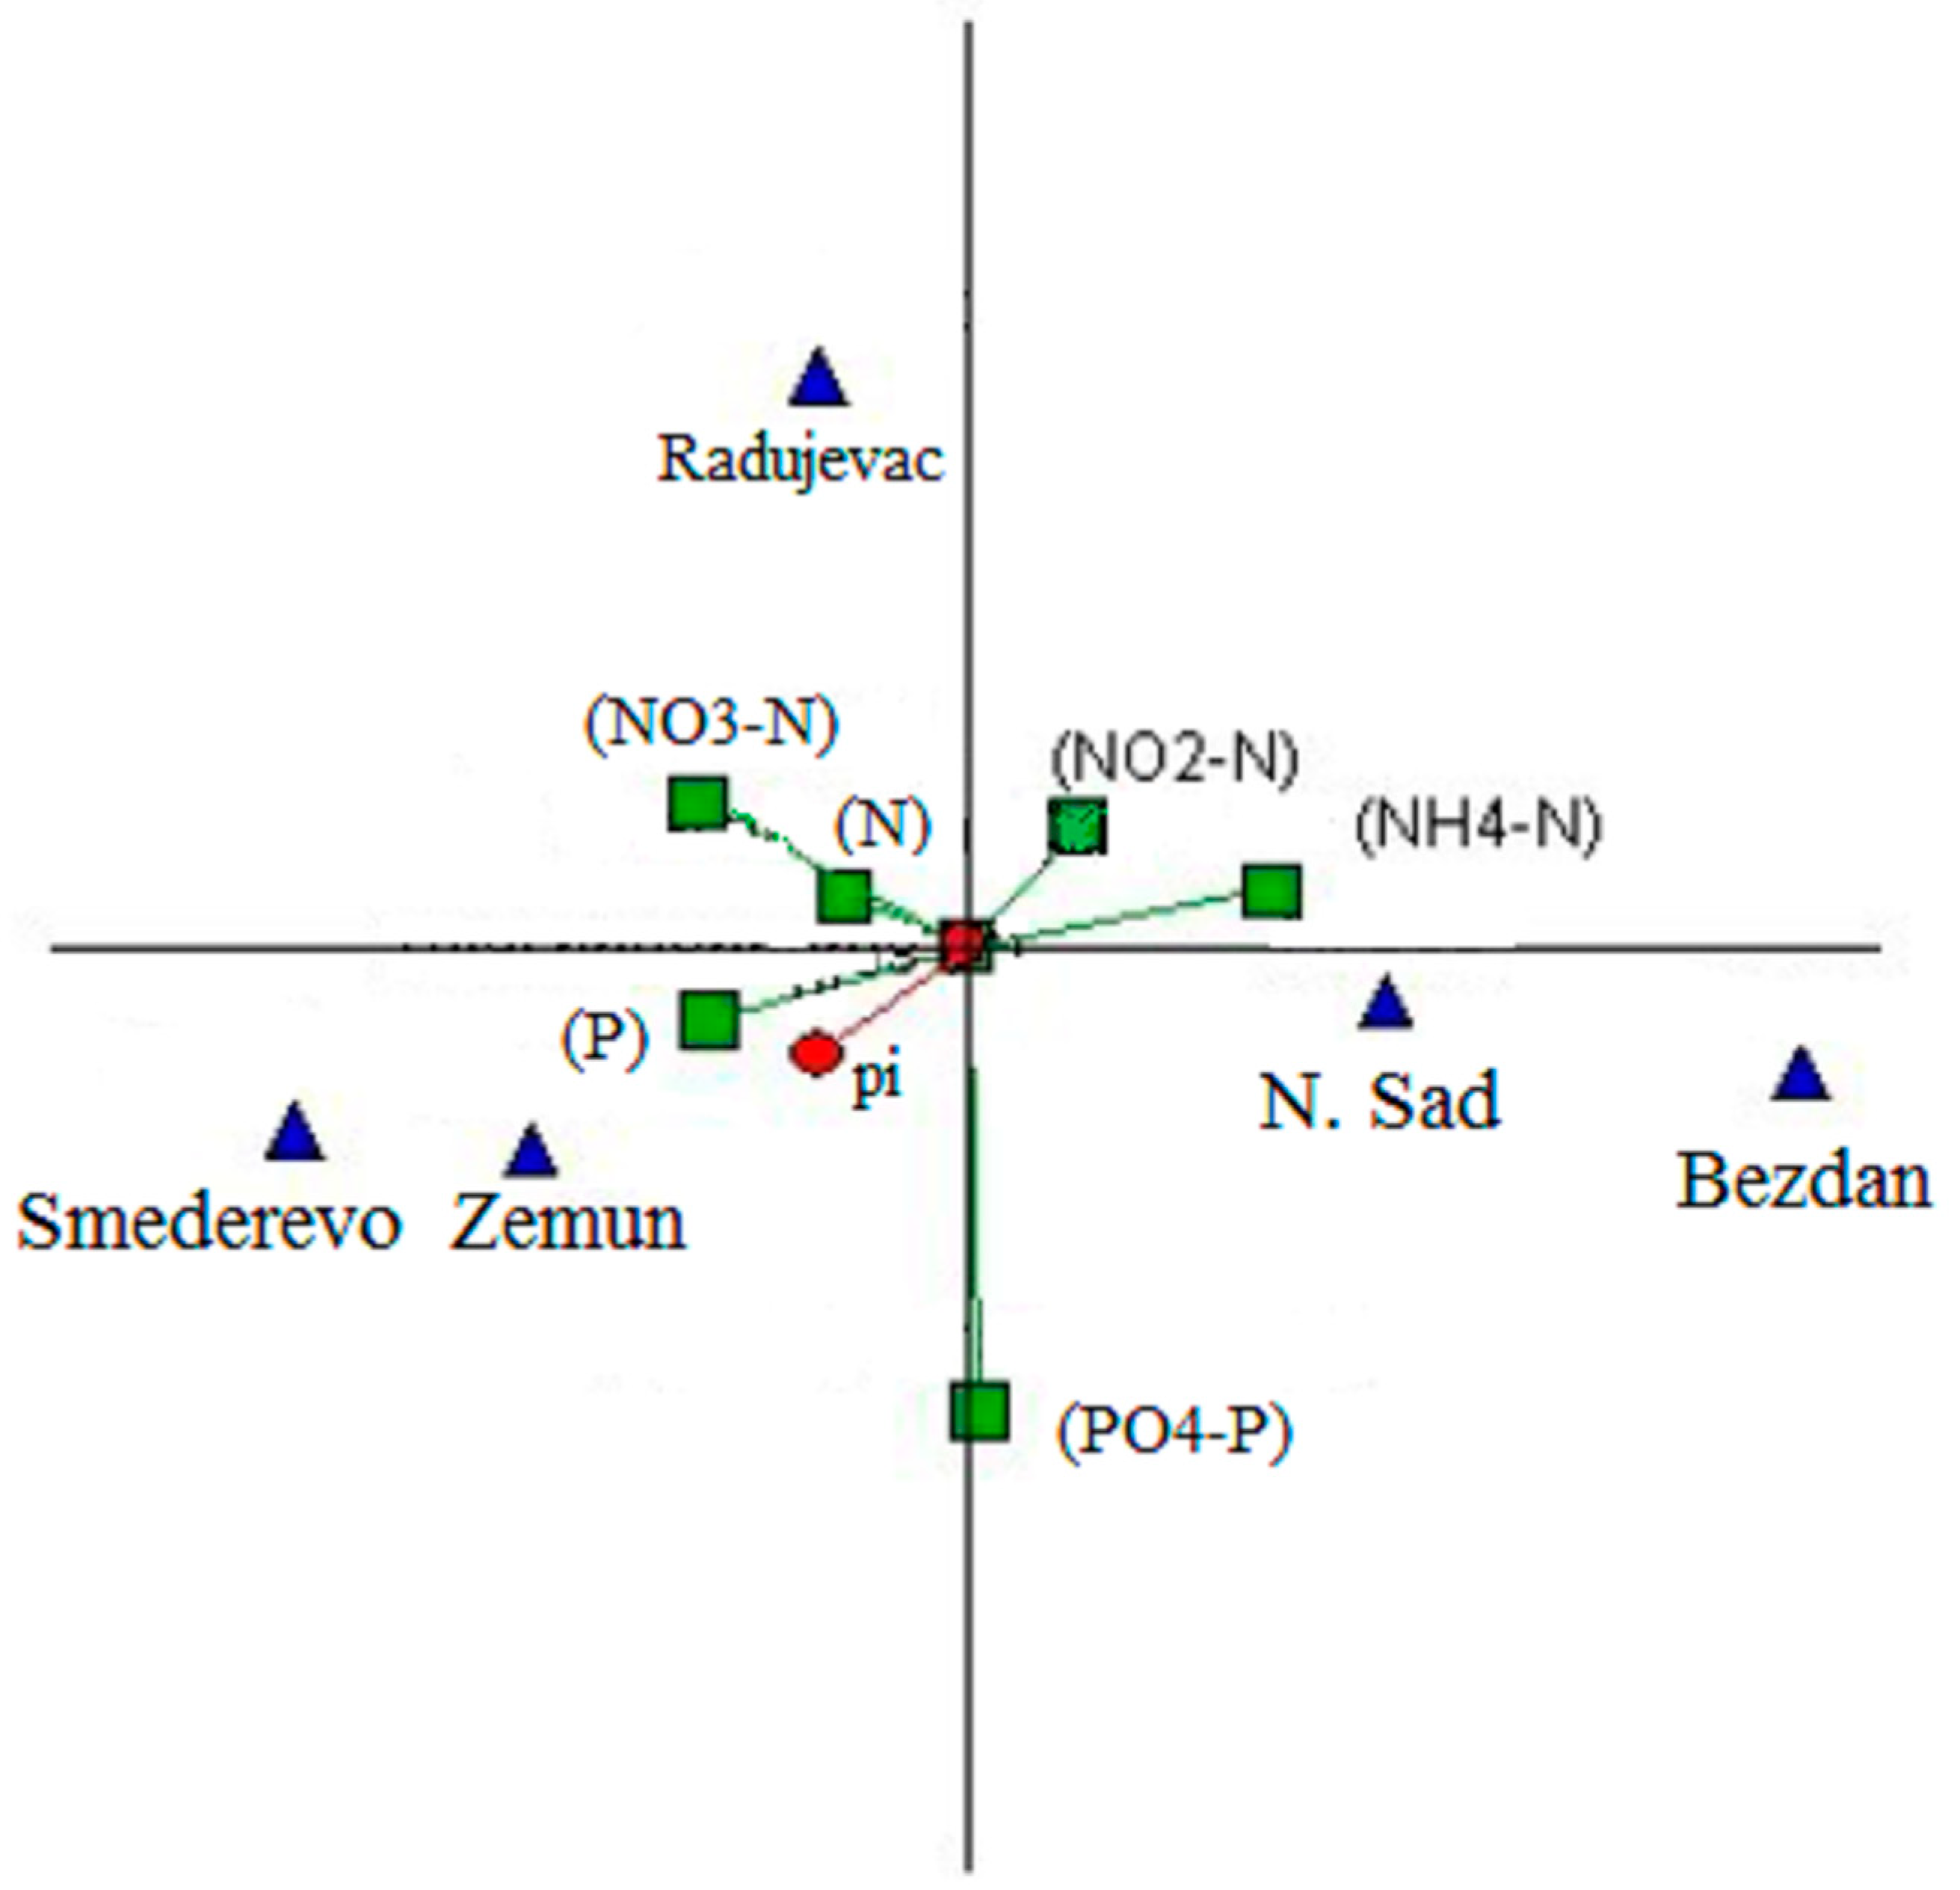
To get a better insight into the ranking results, a visual descriptive analysis using GAIA plot (Figure 2) is performed to support the analysis with better understanding of conflicting criteria and indicate the possible compromising solution. Validity of using this graphic tool in further work is justified by the fact that the quantity of information preserved in the defined model (Δ) is more than satisfactory (Δ = 93.55%) where, in practice, the value of Δ is usually in the range of 60% to 80% [31,43].
By observing the position of the alternatives (represented by triangles), the strength or weakness of the alternative in relation to the criteria (represented by squares) can be determined, indicating that if an alternative is closer to the direction of the axis of a particular criterion, the better it will be according to that criterion. At the Smederevo site, the Danube water is least polluted with total phosphorus (P), total N, and NO3-N, although the concentration of ammonium ion (NH4-N) is still elevated at this location. Comparing Bezdan and Radujevac locations, as entry and exit points of the flow, respectively (see Figure 1), a higher level of nitrates (NO3-N) can be found at the Bezdan location than at the location of Radujevac. Despite the fact that it is ranked as the worst, the Bezdan location shows lower concentrations of nitrite (NO2-N) and orthophosphates (PO4-P) in the water, while retaining the highest levels of total nitrogen (N), nitrate (NO3-N), and total phosphorus (P). Both Zemun and Novi Sad locations show weakness toward the criteria of total N and NO3-N, indicating their elevated concentrations in water.
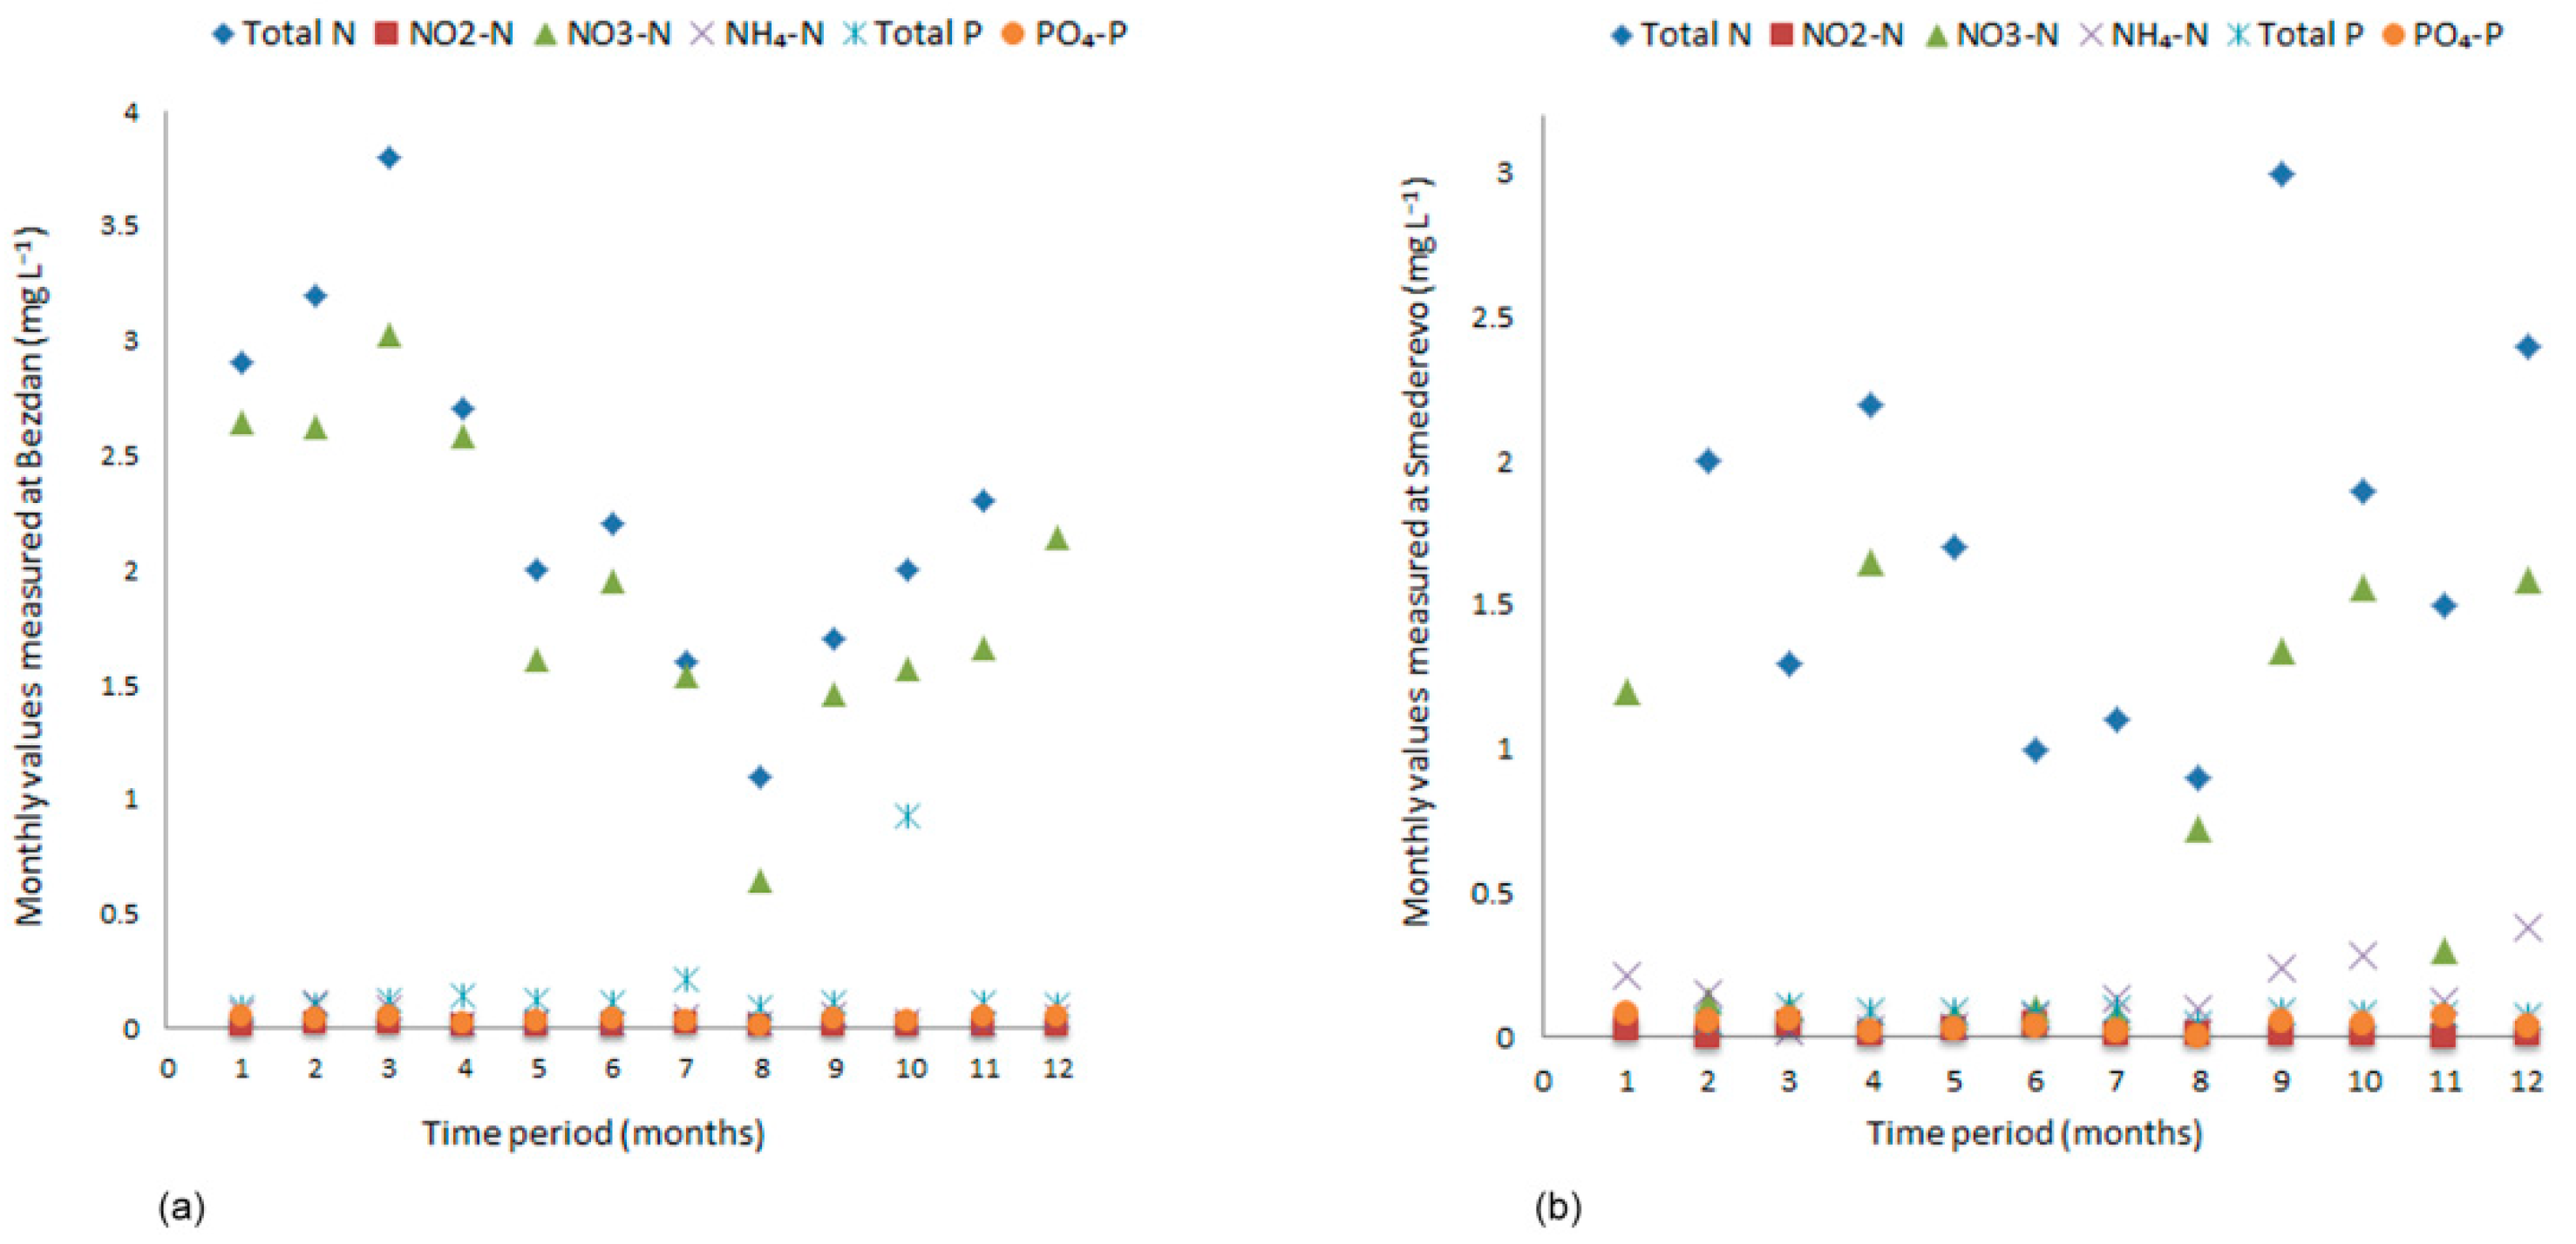
Given that the PROMETHEE ranking and the GAIA analysis singled out Bezdan as the worst according to the content of nutrients in the water, the monthly variations of the parameters at the Bezdan site were additionally observed (Figure 3a). Moreover, in order to make a comparison, the Smederevo site which the PROMETHEE analysis identified as the best, was also observed (Figure 3b).
The evident peaks found in Figure 3a (at Bezdan location) indicate elevated values of the total N indicator during the month of March (beginning of the spring), which slowly decreases during the summer months, only to increase again in the fall. The NO3-N indicator closely follows the trend of Total N. Unexpected peak in total P values breaks the continuity and reaches its maximum during the month of October. The reason for this unusual peak could be sought in variations of the river flow due to precipitation and stormy weather, which cause soil erosion and lead to the enrichment of water with phosphorus. Nevertheless, irrigation-induced erosion and repeated use of water could also be the reason for the increased phosphorus level at this site.
Significant increase in values of total N, NO3-N, NO2-N, and PO4-P in Figure 3b (Smederevo location) is observed in the autumn months and at the beginning of the winter season, especially in September and December, which can be explained by animal manure and excessive fertilizers applied to crops and fields. Moreover, variations in NH4-N values are visible, while Total P values are stable, without any significant increase.
3.2. Deviations from the Prescribed Limit Values
The calculated annual values of the parameters were compared with the limit values (Table 1) prescribed by the Regulation on the limit values of pollutants in surface and underground waters and sediment and deadlines for their achievement [28] in order to determine ecological status and quality of the water. Namely, the description of class I corresponds to excellent ecological status according to the classification given in the Rulebook that prescribes the parameters of ecological and chemical status for surface waters [44]. Surface waters under this class provide good functioning of the entire ecosystem and can be used for the supply of drinking water (with prior treatment by filtration and disinfection), swimming and recreation, irrigation and industrial use. The description of class II corresponds to good ecological status that ensures the use of water for the same purposes and under the same conditions as surface waters belonging to class I. Class III corresponds to a moderate ecological status according to the classification and ensures conditions for the life and protection of cyprinids, swimming, and recreation, irrigation and industrial use while enabling supply of drinking water with prior treatment by coagulation, flocculation, filtration, and disinfection. Class IV corresponds to a weak ecological status of water that can be used for the supply of drinking water by applying combination of previously mentioned treatments with improved treatment methods, as well as for irrigation and industrial use. Finally, the description of class V corresponds to poor ecological status where surface waters belonging to this class cannot be used for any purpose.
Based on the calculated annual value of total N (Table 1) and comparing it with the prescribed limit values, it can be concluded that the content of this nutrient indicator corresponds to class II at the sites of Smederevo (1.7 mg L−1) and Radujevac (1.9 mg L−1), while at all other sites it exceeds the limit value of 2 mg L−1 and classifies the Danube water into class III. Although this indicator recorded lower values (min values) in certain months of the year that are within the limits of class I at Bezdan (0.9 mg L−1) and Novi Sad (1.0 mg L−1), water quality is classified in a lower class level (i.e., class III), due to individual monthly values that in several measurements exceed the prescribed limit value of 2 mg L−1.
Average annual values of nitrates (NO3-N) exceed the limit value for class I/II (1 mg L−1) at locations of Bezdan and Novi Sad, and at all other sites according to the monthly oscillations of this indicator.
Average annual values of nitrites (NO2-N) exceed the limit value for class I (0.01 mg L−1) at all observed locations, and in accordance with monthly oscillations at the measuring sites of Novi Sad, Zemun and Smederevo even the limit values for class II (0.03 mg L−1), which places the quality of the water into lower class III.
The average annual value of ammonium ion (NH4-N) is below the limit value for class I/II (0.10 mg L−1) at the sites of Bezdan (0.05 mg L−1) and Novi Sad (0.06 mg L−1), which is also evident on a monthly basis (Figure 3a). However, at the site of Radujevac, monthly oscillations in the recorded NH4-N values show deviations from the prescribed limit values in the second, fourth, sixth, and twelfth month, which places the water quality at this location in a lower class (class III), although the average annual value is within the limits of class I/II (0.10 mg L−1).
The calculated annual value of total phosphorus (P) exceeds the limit value for class I/II (0.05 mg L−1), coincides with the monthly oscillations in value at all sites (except Bezdan site), and places the water of the Danube into class III, according to the Regulation. At Bezdan site, the maximum value of 0.931 mg L−1 is reached on a monthly basis, which exceeded the permitted limit value for class III.
Furthermore, the average annual values for orthophosphates (PO4-P) at all observed locations exceed the limit values for class II (0.02 mg L−1) in accordance with the Regulation and classify the water quality of the Danube into the lower class III.
The imbalance between nitrogen (N) and phosphorus (P) is an important ecological indicator of eutrophication. Considering that the average annual concentrations of total N are above the limit values, as well as the average annual concentrations of total P (Table 1), there is a potential risk of eutrophication occurrence if other relevant factors, such as temperature, oxygen saturation, water turbidity, etc., coincide.
Based on the above, the quality of the Danube River in terms of nutrient content falls into the category of “good” to “moderate” appreciation, which is in compliance with the previously conducted studies on the nutrient pollution of the Danube River in both Serbia [45] and other parts of the basin [46]. The results also align with the historical data trend.
4. Discussion
Results of the PROMETHEE analysis identified the Bezdan site as the most polluted and the Smederevo site as the least polluted. GAIA analysis further revealed interrelations between dominant parameters and sites. Therefore, the main observations from the analysis related to each site are:
- The water is least polluted with total phosphorus (P), total N, and NO3-N at Smederevo site, while the concentration of ammonium ion (NH4-N) is still elevated at this location;
- The Bezdan site shows lower concentrations of nitrite (NO2-N) and orthophosphates (PO4-P) while retaining the highest levels of total nitrogen (N), nitrate (NO3-N), and total phosphorus (P);
- Comparing Bezdan and Radujevac locations, as entry and exit points of the river flow, respectively, lower level of nitrates (NO3-N) can be found at the Radujevac location than at the location of Bezdan;
- Both Zemun and Novi Sad locations show elevated concentrations of total N and NO3-N in the water.
The results of the nutrient contents analysis indicate that the high variability of indicators occurs due to the actual ecological status of the Danube River, as a consequence of the environmental conditions and seasonal variations during the year. Similar results were obtained from the neighboring territory, in the Lower Danube area in Romania [47]. It was found that loading of nutrients in the Danube River is higher in spring and early summer mainly due to the variations in the river flow due to snowmelt, etc.
The results of monthly variations of total N and NO3-N during the spring time at Bezdan site (Figure 3a) following the sudden increase in value of total P suggest that irrigation-induced erosion and repeated use of water could also be the source of nonpoint pollution of water. On the other hand, increase in the values of total N, NO3-N, NO2-N, and PO4-P at Smederevo site (Figure 3b) is observed in the autumn months and at the beginning of the winter season, which can be explained by animal manure and agricultural applications of pesticides and fertilizers to crops and fields.
In comparison to other research conducted in the previous time period [46], it is noticeable that the level of nutrient contents in Danube is somewhat better but still represents a challenge in obtaining good water quality of the Danube in Serbia, and therefore an ongoing problem that needs to be addressed properly.
Recently, an important hydrological system Danube-Tisa-Danube (DTD) that connects the Danube with the Tisa River and a number of other smaller water courses forming a valuable canal network is investigated for spatiotemporal variability in nutrient concentrations [48]. It was revealed that the highest concentrations of total N are found in winter and early spring, i.e., in the non-vegetation season, while the highest concentrations of total P are found in the middle of the year (vegetation season). In addition, at Bezdan site, the average monthly concentrations of total N exceeded the eutrophic status threshold during all 12 months, which is in agreement with findings in this work.
Findings in this paper indicate that the main sources of nonpoint pollution are of anthropogenic origin reflected in agricultural applications of pesticides and fertilizers, or of geochemical origin reflected in natural contamination of ground and water sources. Minimizing the application of fertilizers and pesticides is a way to control pollution from agricultural activities.
Pollution from point sources arises from industrial waste waters as well as from domestic activities. It can be somewhat controlled by proper wastewater treatment and recycling of waste materials, but financial aspects and lack of funds are limiting factors of this control in Serbia. In regard to domestic activities, wider and better awareness of global environmental protection is continuously needed.
One way to further reduce nitrogen pollution is for waste water treatment plants to be upgraded with nitrogen-removal technology [15]. Nevertheless, given that nonpoint sources of pollution represent a large part of total nitrogen emission measures, introducing best practices in agriculture are particularly needed. It is necessary to respect a principal set of best agricultural practices which are in accordance with the provisions of the EU Directives. Complementary to legally binding measures, economic stimulus to husbandmen can enable greater efficiency in the practical implementation of measures, as suggested by the ICPDR.
Further efforts to reduce nitrogen inputs into surface and ground waters in the Danube River Basin are still needed. The Danube is both a Serbian and an international river. There is a responsibility for the way in which it is endangered, not only for Serbia but also for all other countries in the basin. A need to have a healthy environment including purified Danube is imperative. Among other benefits, it also signifies economic potential for all countries involved. The Black Sea could further benefit by potentially reducing loads by 40%, which would require decreasing both the point and nonpoint emissions generated in the Danube Basin, as acknowledged in the ICPDR reports [15].
To preserve the water of the Danube, which is under constant pressure of exposure to nonpoint sources of pollution, it is substantial to clearly point out the problems and continuously explore ways in which it is possible to add value to the river conservation efforts. This is particularly emphasized by the fact that not only the Danube, but waters in Europe in general are under the influence of excessive nutrient contents [8] and dealing with this issue cannot be postponed, for the benefit of both current and future generations. The involvement of all interested parties, from industry experts, through agriculture and environmental protection departments, to consumer associations and national and local authorities is necessary in order to achieve these goals, as water is the basis of well-being of the entire planet.
5. Conclusions
The findings in this paper confirm that PROMETHEE and GAIA methods provide significant results within the analysis. By applying PROMETHEE method, the sites with increased nutrient contents are ranked according to the level of nutrients found in the water, identifying the Bezdan site as the most polluted and the Smederevo site as the least polluted. GAIA analysis further identified the most dominant parameters of nutrient indicators that affect the water pollution at each location. Thereafter, the results of monthly variations in the values of total N, NO3-N, and total P at Bezdan site indicated seasonal (early spring) variations, but suggested that elevated values of the observed parameters can also be a sign of irrigation-induced erosion and repeated use of water. On the other hand, increase in values of total N, NO3-N, NO2-N, and PO4-P at Smederevo site can be indicative of animal manure and agricultural applications of pesticides and fertilizers, altogether leading to nonpoint sources of pollution as the main cause. Additionally, the determined ecological quality status of the water places the Danube River into the category of “good” to “moderate” water quality, showing that the permissible limit values of the indicators have been exceeded and that protective measures should be taken.
The obtained results indicate that nonpoint sources of pollution (originating mainly from agriculture and the use of pesticides, fertilizers, and chemical agents) are the probable cause of nutrient pollution of the Danube, while the pollution arising from municipal and industrial wastewater also represents a factor of concern. However, further investigations are still needed.
Based on the presented data analysis results, suggestions for the local water resources managers are to (1) reduce the application of fertilizers and pesticides in order to control nonpoint pollution from agricultural activities, following a principal set of best agricultural practices; and (2) implement a proper wastewater treatment strategy to reduce point sources of pollution arising from both industrial and domestic activities. Although significant efforts are already made in regard to implementation of modern wastewater treatment plants, lack of financial funds represents a challenging and delaying factor of this control in Serbia.
This paper represents a significant contribution to those interested in considering the problem of both point and nonpoint nutrient pollution of water from a multicriteria decision-making point of view. It could support the efforts in preserving good ecological quality status of the Danube in the entire basin and serve as a solid basis in further reduction in nutrient pollution, in accordance with the suggestions described.
Overall, it can be concluded that the water is most polluted at the entry point of the river flow in Serbia, which points to further research in the surrounding region and neighboring countries. Moreover, it can contribute to future investigations on the state of the Danube River water quality and specifically, to keep track of the changes in the nutrient pollution of this valuable international water resource, in order that the appropriate measures could be implemented in timely manner.
Nevertheless, indicators of nutrient content in water represent only one aspect of the river water quality assessment and an example of how it is possible to examine other indicators of water quality, such as indicators of metal content, salinity indicators, microbiological parameters, etc., which can be the subject of some future research.
Author Contributions
Conceptualization, I.M.-R. and L.T.; methodology, I.M.-R., M.V. and V.S.; software, V.S.; validation, I.M.-R., M.V. and L.T.; formal analysis, M.V.; investigation, I.M.-R. and L.T.; resources, M.V.; data curation, V.S.; writing—original draft preparation, I.M.-R.; writing—review and editing, V.S. and M.V.; visualization, I.M.-R.; supervision, M.V. and L.T.; project administration, V.S.; funding acquisition, I.M.-R. All authors have read and agreed to the published version of the manuscript.
Funding
This research was funded by the Ministry of Education, Science and Technological Development of the Republic of Serbia, Program for financing scientific research, number 451-03-68/2022-14/200133.
Data Availability Statement
The authors declare that the data supporting the findings of this study are available within the article.
Conflicts of Interest
The authors declare no conflict of interest.
References
- European Union Strategy for the Danube Region-Action Plan. European Commission: Brussels SEC (2010) 1489/3. Available online: https://www.danubecommission.org (accessed on 20 August 2022).
- Khatri, N.; Tyagi, S. Influences of natural and anthropogenic factors on surface and groundwater quality in rural and urban areas. Front. Life Sci. 2015, 8, 23–39. [Google Scholar] [CrossRef]
- Wurtsbaugh, W.A.; Paerl, H.W.; Dodds, W.K. Nutrients, Eutrophication and Harmful Algal Blooms along the Freshwater to Marine Continuum. WIREs Water 2019, 6, e1373. [Google Scholar] [CrossRef]
- Culhane, F.; Teixeira, H.; Nogueira, A.J.; Borgwardt, F.; Trauner, D.; Lillebø, A.; Piet, G.; Kuemmerlen, M.; McDonald, H.; O’higgins, T.; et al. Risk to the supply of ecosystem services across aquatic ecosystems. Sci. Total Environ. 2019, 660, 611–621. [Google Scholar] [CrossRef] [PubMed]
- Graversgaard, M.; Hedelin, B.; Smith, L.; Gertz, F.; Højberg, A.L.; Langford, J.; Martinez, G.; Mostert, E.; Ptak, E.; Peterson, H.; et al. Opportunities and Barriers for Water Co-Governance—A Critical Analysis of Seven Cases of Diffuse Water Pollution from Agriculture in Europe, Australia and North America. Sustainability 2018, 10, 1634. [Google Scholar] [CrossRef] [Green Version]
- Bisselink, B.; Bernhard, J.; Gelati, E.; Adamovic, M.; Guenther, S.; Mentaschi, L.; de Roo, A. Impact of a changing climate, land use, and water usage on Europe’s water resources. In A Model Simulation Study; Joint Research Centre (JRC), Publications Office of the European Union: Luxembourg, 2018. [Google Scholar]
- Salas, E.A.L.; Subburayalu, S.K. Analysis of Phosphorus and Nitrogen Concentrations in the Great Miami and Little Miami Basins in Ohio, USA from 2015 to 2017. River Res. Appl. 2020, 36, 1345–1352. [Google Scholar] [CrossRef]
- Trodd, W.; O’Boyle, S. Water Quality in 2019: An Indicators Report; EPA: Murntown, Ireland, 2020. [Google Scholar]
- OECD. Diffuse Pollution, Degraded Waters: Emerging Policy Solutions—Policy Highlights; OECD Publishing: Paris, France, 2017. [Google Scholar]
- Patterson, J.J.; Smith, C.; Bellamy, J. Enabling and Enacting ‘Practical Action’ in Catchments: Responding to the ‘Wicked Problem’ of Nonpoint Source Pollution in Coastal Subtropical Australia. Environ. Manag. 2015, 55, 479–495. [Google Scholar] [CrossRef]
- Thornton, J.A.; Harding, W.R.; Dent, M.; Hart, R.C.; Lin, H.; Rast, C.L.; Rast, W.; Ryding, S.O.; Slawski, T.M. Eutrophication as a “wicked” problem. Lakes Reserv. Sci. Policy Manag. Sustain. Use 2013, 18, 298–316. [Google Scholar] [CrossRef]
- Kristensen, P.; Whalley, C.; Klancnik, K. European Waters: Assessment of Status and Pressures 2018; European Environment Agency: Copenhagen, Denmark, 2018. [Google Scholar]
- Craig, R.K.; Roberts, A. When Will Governments Regulate Nonpoint Source Pollution? A Comparative Perspective. Boston Coll. Environ. Aff. Law Rev. 2015, 42, 1. [Google Scholar]
- Wiering, M.; Boezeman, D.; Crabbé, A. The Water Framework Directive and Agricultural Diffuse Pollution: Fighting a Running Battle? Water 2020, 12, 1447. [Google Scholar] [CrossRef]
- ICPDR. Nitrogen Pollution in the Danube Basin; Danube Watch 3-4/2015; International Commission for the Protection of the Danube River (ICPDR): Austria, Vienna, 2015; Available online: https://www.icpdr.org (accessed on 18 May 2022).
- Gavrilescu, M. Water, Soil, and Plants Interactions in a Threatened Environment. Water 2021, 13, 2746. [Google Scholar] [CrossRef]
- Wijenayake, W.M.H.K.; Amarasinghe, U.S.; De Silva, S.S. Application of a multiple-criteria decision making approach for selecting non-perennial reservoirs for culture-based fishery development: Case study from Sri Lanka. Aquaculture 2016, 459, 26–35. [Google Scholar] [CrossRef]
- Geng, G.; Wardlaw, R. Application of Multi-Criterion Decision Making Analysis to Integrated Water Resources Management. Water Resour. Manag. 2013, 27, 3191–3207. [Google Scholar] [CrossRef]
- Alamanos, A.; Mylopoulos, N.; Loukas, A.; Gaitanaros, D. An Integrated Multicriteria Analysis Tool for Evaluating Water Resource Management Strategies. Water 2018, 10, 1795. [Google Scholar] [CrossRef] [Green Version]
- Crnković, D.M.; Antanasijević, D.Z.; Pocajt, V.V.; Perić-Grujić, A.A.; Antonović, D.; Ristić, M.Ð. Unsupervised classification and multi-criteria decision analysis as chemometric tools for the assessment of sediment quality: A case study of the Danube and Sava River. Catena 2016, 144, 11–22. [Google Scholar] [CrossRef]
- Wang, X.-K.; Wang, Y.-T.; Wang, J.-Q.; Cheng, P.-F.; Li, L. A TODIM-PROMETHEE II Based Multi-Criteria Group Decision Making Method for Risk Evaluation of Water Resource Carrying Capacity under Probabilistic Linguistic Z-Number Circumstances. Mathematics 2020, 8, 1190. [Google Scholar] [CrossRef]
- Salehi, S.; Ghazizadeh, J.M.; Tabesh, M. A comprehensive criteria-based multi-attribute decision-making model for rehabilitation of water distribution systems. Struct. Infrastruct. Eng. 2017, 14, 743–765. [Google Scholar] [CrossRef]
- Gebre, S.L.; Cattrysse, D.; Van Orshoven, J. Multi-Criteria Decision-Making Methods to Address Water Allocation Problems: A Systematic Review. Water 2021, 13, 125. [Google Scholar] [CrossRef]
- Odu, G.; Charles-Owaba, O. Review of multi-criteria optimization methods-theory and applications. IOSR J. Eng. 2013, 3, 1–14. [Google Scholar] [CrossRef]
- Mladenović-Ranisavljević, I. Multi-Criteria Analysis of the Danube Water Quality in Serbia. Ph.D. Thesis, University of Belgrade, Bor, Serbia, 2012. [Google Scholar]
- Mladenović-Ranisavljević, I.; Takić, L.; Nikolić, Ð. Water Quality Assessment Based on Combined Multi-Criteria Descision Making Method with Index Method. Water Resour. Manag. 2018, 32, 2261–2276. [Google Scholar] [CrossRef]
- Walker, D.; Jakovljević, D.; Savić, D.; Radovanović, M. Multi-criterion water quality analysis of the Danube River in Serbia: A visualisation approach. Water Res. 2015, 79, 158–172. [Google Scholar] [CrossRef]
- FAO. Regulation on Limit Values of Pollutants in Surface and Ground Water and Sediments with Deadlines for Their Achievement; “Official Gazette of RS” No. 50/2012; FAO: Rome, Italy, 2012. [Google Scholar]
- Ministry of Environmental Protection—Serbian Environmental Protection Agency. Results on Testing the Quality of Surface and Groundwater for 2017; Ministry of Environmental Protection—Serbian Environmental Protection Agency: Belgrade, Serbia, 2018. Available online: http://www.sepa.gov.rs/download/KvalitetVoda2017.pdf (accessed on 6 September 2021).
- Brans, J.P.; Mareschal, B.; Vincke, P.H. PROMETHEE: A new family of outranking methods in multi-criteria analysis. In Operational Research’84; Brans, J.P., Ed.; North-Holland: Amsterdam, The Netherlands, 1984; pp. 477–490. [Google Scholar]
- Brans, J.P.; Mareschal, B. Promethee methods. In Multiple Criteria Decision Analysis: State of the Art Surveys; Figueira, J., Greco, S., Eds.; Springer Science + Business Media, Inc.: New York, NY, USA, 2005; pp. 163–195. [Google Scholar]
- Brans, J.P.; Mareschal, B. The PROMCALC & GAIA decision support system for multicriteria decision aid. Decis. Support Syst. 1994, 12, 297–310. [Google Scholar]
- Marttunen, M.; Mustajoki, J.; Lehtoranta, V.; Saarikoski, H. Complementary use of the Ecosystem Service Concept and Multi-criteria Decision Analysis in Water Management. Environ. Manag. 2022, 69, 719–734. [Google Scholar] [CrossRef] [PubMed]
- Schuwirth, N.; Honti, M.; Logar, I.; Stamm, C. Multi-criteria decision analysis for integrated water quality assessment and management support. Water Res. X 2018, 1, 1100010. [Google Scholar] [CrossRef] [PubMed]
- Belton, V.; Stewart, T. Multiple Criteria Decision Analysis: An Integrated Approach; Kluwer: Boston, MA, USA, 2002. [Google Scholar]
- Scholten, L.; Schuwirth, N.; Reichert, P.; Lienert, J. Tackling uncertainty in multi-criteria decision analysis—An application to water supply infrastructure planning. Eur. J. Oper. Res. 2015, 242, 243–260. [Google Scholar] [CrossRef] [Green Version]
- Raju, K.S.; Duckstein, L.; Arondel, C. Multicriterion Analysis for Sustainable Water Resources planning: A case study in Spain. Water Resour. Manag. 2000, 14, 435–456. [Google Scholar] [CrossRef]
- Yu, X.; Li, C.; Chen, H.; Ji, Z. Evaluate Air Pollution by Promethee Ranking in Yangtze River Delta of China. Int. J. Environ. Res. Public Health 2020, 17, 587. [Google Scholar] [CrossRef] [Green Version]
- Mutikanga, H.E.; Sharma, S.K.; Vairavamoorthy, K. Multi-criteria decision analysis: A strategic planning tool for water loss management. Water Resour. Manag. 2011, 25, 3947–3969. [Google Scholar] [CrossRef]
- Nemery, P.; Ishizaka, A.; Camargo, M.; Morel, L. Enriching descriptive information in ranking and sorting problems with visualizations techniques. J. Model. Manag. 2012, 7, 130–147. [Google Scholar] [CrossRef]
- Ishizaka, A.; Nemery, P. Multi-Criteria Decision Analysis: Methods and Software; Wiley: New Delhi, India, 2013. [Google Scholar]
- Mareschal, B.; Brans, J.P. Geometrical representations for MCDA. The GAIA module. Eur. J. Oper. Res. 1988, 34, 69–77. [Google Scholar] [CrossRef]
- Nikolić, Ð.; Milošević, N.; Mihajlović, I.; Živković, Ž.; Tasić, V.; Kovačević, R.; Petrović, N. Multi-criteria analysis of air pollution with SO2 and PM10 in urban area around the copper smelter in Bor, Serbia. Water Air Soil Pollut. 2010, 206, 369–383. [Google Scholar] [CrossRef] [Green Version]
- Rulebook on the National List of Environmental Indicators; “Official Gazette of RS” No. 37/2011; Ministry of Environment, Mining and Spatial Planning: Belgrade, Serbia, 2011; Available online: http://www.pravno-informacioni-sistem.rs/SlGlasnikPortal/eli/rep/sgrs/ministarstva/pravilnik/2011/37/3/reg (accessed on 24 February 2014).
- Mladenović-Ranisavljević, I.; Takić, L.; Vuković, M. Nitrogen and phosphorus as indicators of changes in the Danube ecosystem in Serbia. Adv. Technol. 2017, 6, 51–55. [Google Scholar] [CrossRef]
- Radu, V.M.; Diacu, E.; Ionescu, P. Characterization of the eutrophication potential for the lower part of the Danube River. UPB Sci. Bull. Ser. B 2014, 76, 137–146. [Google Scholar]
- Radu, V.M.; Diacu, E.; Ionescu, P.; György, D. Spatio-Temporal Characterization of Nutrient Pollution in Lower Danube Area. Rev. Chim. 2015, 66, 601–606. [Google Scholar]
- Savic, R.; Stajic, M.; Blagojevic, B.; Bezdan, A.; Vranesevic, M.; Nikolic Jokanovic, V.; Baumgertel, A.; Bubalo Kovačić, M.; Horvatinec, J.; Ondrasek, G. Nitrogen and Phosphorus Concentrations and Their Ratios as Indicators of Water Quality and Eutrophication of the Hydro-System Danube–Tisza–Danube. Agriculture 2022, 12, 935. [Google Scholar] [CrossRef]
Figure 1.
Observed sites of the Danube River flow in Serbia.

Figure 2.
GAIA plot supporting the analysis (∆ = 93.55%).

Figure 3.
(a) Monthly variations in the level of nutrient content during the year at the site of Bezdan; (b) monthly variations in the level of nutrient content during the year at the site of Smederevo.
Figure 3.
(a) Monthly variations in the level of nutrient content during the year at the site of Bezdan; (b) monthly variations in the level of nutrient content during the year at the site of Smederevo.


Table 1.
Values of nutrient content indicators together with the evaluation scenario.
| Indicator | Total N | NO2-N | NO3-N | PO4-P | Total P | NH4-N | |
|---|---|---|---|---|---|---|---|
| Unit | mg L−1 | mg L−1 | mg L−1 | mg L−1 | mg L−1 | mg L−1 | |
| Pref. Fn | Linear | Linear | Linear | Linear | Linear | Linear | |
| P (%) | 30 | 30 | 30 | 30 | 30 | 30 | |
| Q (%) | 5 | 5 | 5 | 5 | 5 | 5 | |
| Weights (%) | 17 | 13 | 20 | 20 | 17 | 13 | |
| Stability intervals of weights | |||||||
| min | 8.91 | 0.00 | 18.12 | 9.16 | 9.85 | 0.00 | |
| max | 45.55 | 27.47 | 98.83 | 22.16 | 100 | 16.26 | |
| Sites | |||||||
| annual | 2.3 | 0.015 | 1.95 | 0.039 | 0.188 | 0.05 | |
| Bezdan | min | 1.1 | 0.008 | 1.46 | 0.010 | 0.089 | 0.02 |
| max | 3.8 | 0.026 | 3.03 | 0.056 | 0.931 | 0.11 | |
| annual | 2.1 | 0.017 | 1.74 | 0.046 | 0.108 | 0.06 | |
| N. Sad | min | 1.0 | 0.010 | 0.61 | 0.014 | 0.081 | 0.03 |
| max | 3.5 | 0.049 | 2.99 | 0.083 | 0.142 | 0.13 | |
| annual | 2.1 | 0.019 | 0.73 | 0.039 | 0.090 | 0.13 | |
| Zemun | min | 1.2 | 0.002 | 0.02 | 0.004 | 0.056 | 0.01 |
| max | 3.1 | 0.046 | 2.28 | 0.080 | 0.140 | 0.28 | |
| annual | 1.7 | 0.019 | 0.74 | 0.041 | 0.080 | 0.15 | |
| Smederevo | min | 0.9 | 0.002 | 0.07 | 0.005 | 0.048 | 0.02 |
| max | 3.0 | 0.045 | 1.65 | 0.080 | 0.110 | 0.38 | |
| annual | 1.9 | 0.016 | 0.77 | 0.074 | 0.107 | 0.10 | |
| Radujevac | min | 1.1 | 0.008 | 0.20 | 0.038 | 0.063 | 0.05 |
| max | 3.5 | 0.026 | 1.60 | 0.108 | 0.223 | 0.19 | |
| Prescribed limit values [28] | |||||||
| Class | I | 1 | 0.01 | 1 | 0.02 | 0.05 | 0.10 |
| II | 2 | 0.03 | 1 | 0.02 | 0.05 | 0.10 | |
| III | 8 | 0.12 | 6 | 0.2 | 0.4 | 0.6 | |
| IV | 15 | 0.3 | 15 | 0.5 | 1 | 1.5 | |
| V | >15 | >0.3 | >15 | >0.5 | >1 | >1.5 | |
Table 2.
Ranking of the sites based on the preference flows.
| Sites Table Header | Phi Plus | Phi Minus | Phi Net | Ranking |
|---|---|---|---|---|
| Bezdan | 0.2353 | 0.4010 | −0.1658 | 5 |
| Zemun | 0.2688 | 0.1725 | 0.0962 | 2 |
| Radujevac | 0.2641 | 0.3293 | −0.0652 | 3 |
| Smederevo | 0.3776 | 0.1504 | 0.2272 | 1 |
| N. Sad | 0.2222 | 0.3147 | −0.0925 | 4 |
Publisher’s Note: MDPI stays neutral with regard to jurisdictional claims in published maps and institutional affiliations. |
© 2022 by the authors. Licensee MDPI, Basel, Switzerland. This article is an open access article distributed under the terms and conditions of the Creative Commons Attribution (CC BY) license (https://creativecommons.org/licenses/by/4.0/).
Share and Cite
MDPI and ACS Style
Mladenović-Ranisavljević, I.; Vuković, M.; Stefanović, V.; Takić, L. Multicriteria Decision Analysis of Sites with Increased Nutrient Contents in Water. Water 2022, 14, 3810. https://doi.org/10.3390/w14233810
AMA Style
Mladenović-Ranisavljević I, Vuković M, Stefanović V, Takić L. Multicriteria Decision Analysis of Sites with Increased Nutrient Contents in Water. Water. 2022; 14(23):3810. https://doi.org/10.3390/w14233810
Chicago/Turabian StyleMladenović-Ranisavljević, Ivana, Milovan Vuković, Violeta Stefanović, and Ljiljana Takić. 2022. "Multicriteria Decision Analysis of Sites with Increased Nutrient Contents in Water" Water 14, no. 23: 3810. https://doi.org/10.3390/w14233810
Note that from the first issue of 2016, this journal uses article numbers instead of page numbers. See further details here.