3.1. Effects of Biochar Application before and after Freeze-Thaw on Soil Water Storage and Soil Temperature
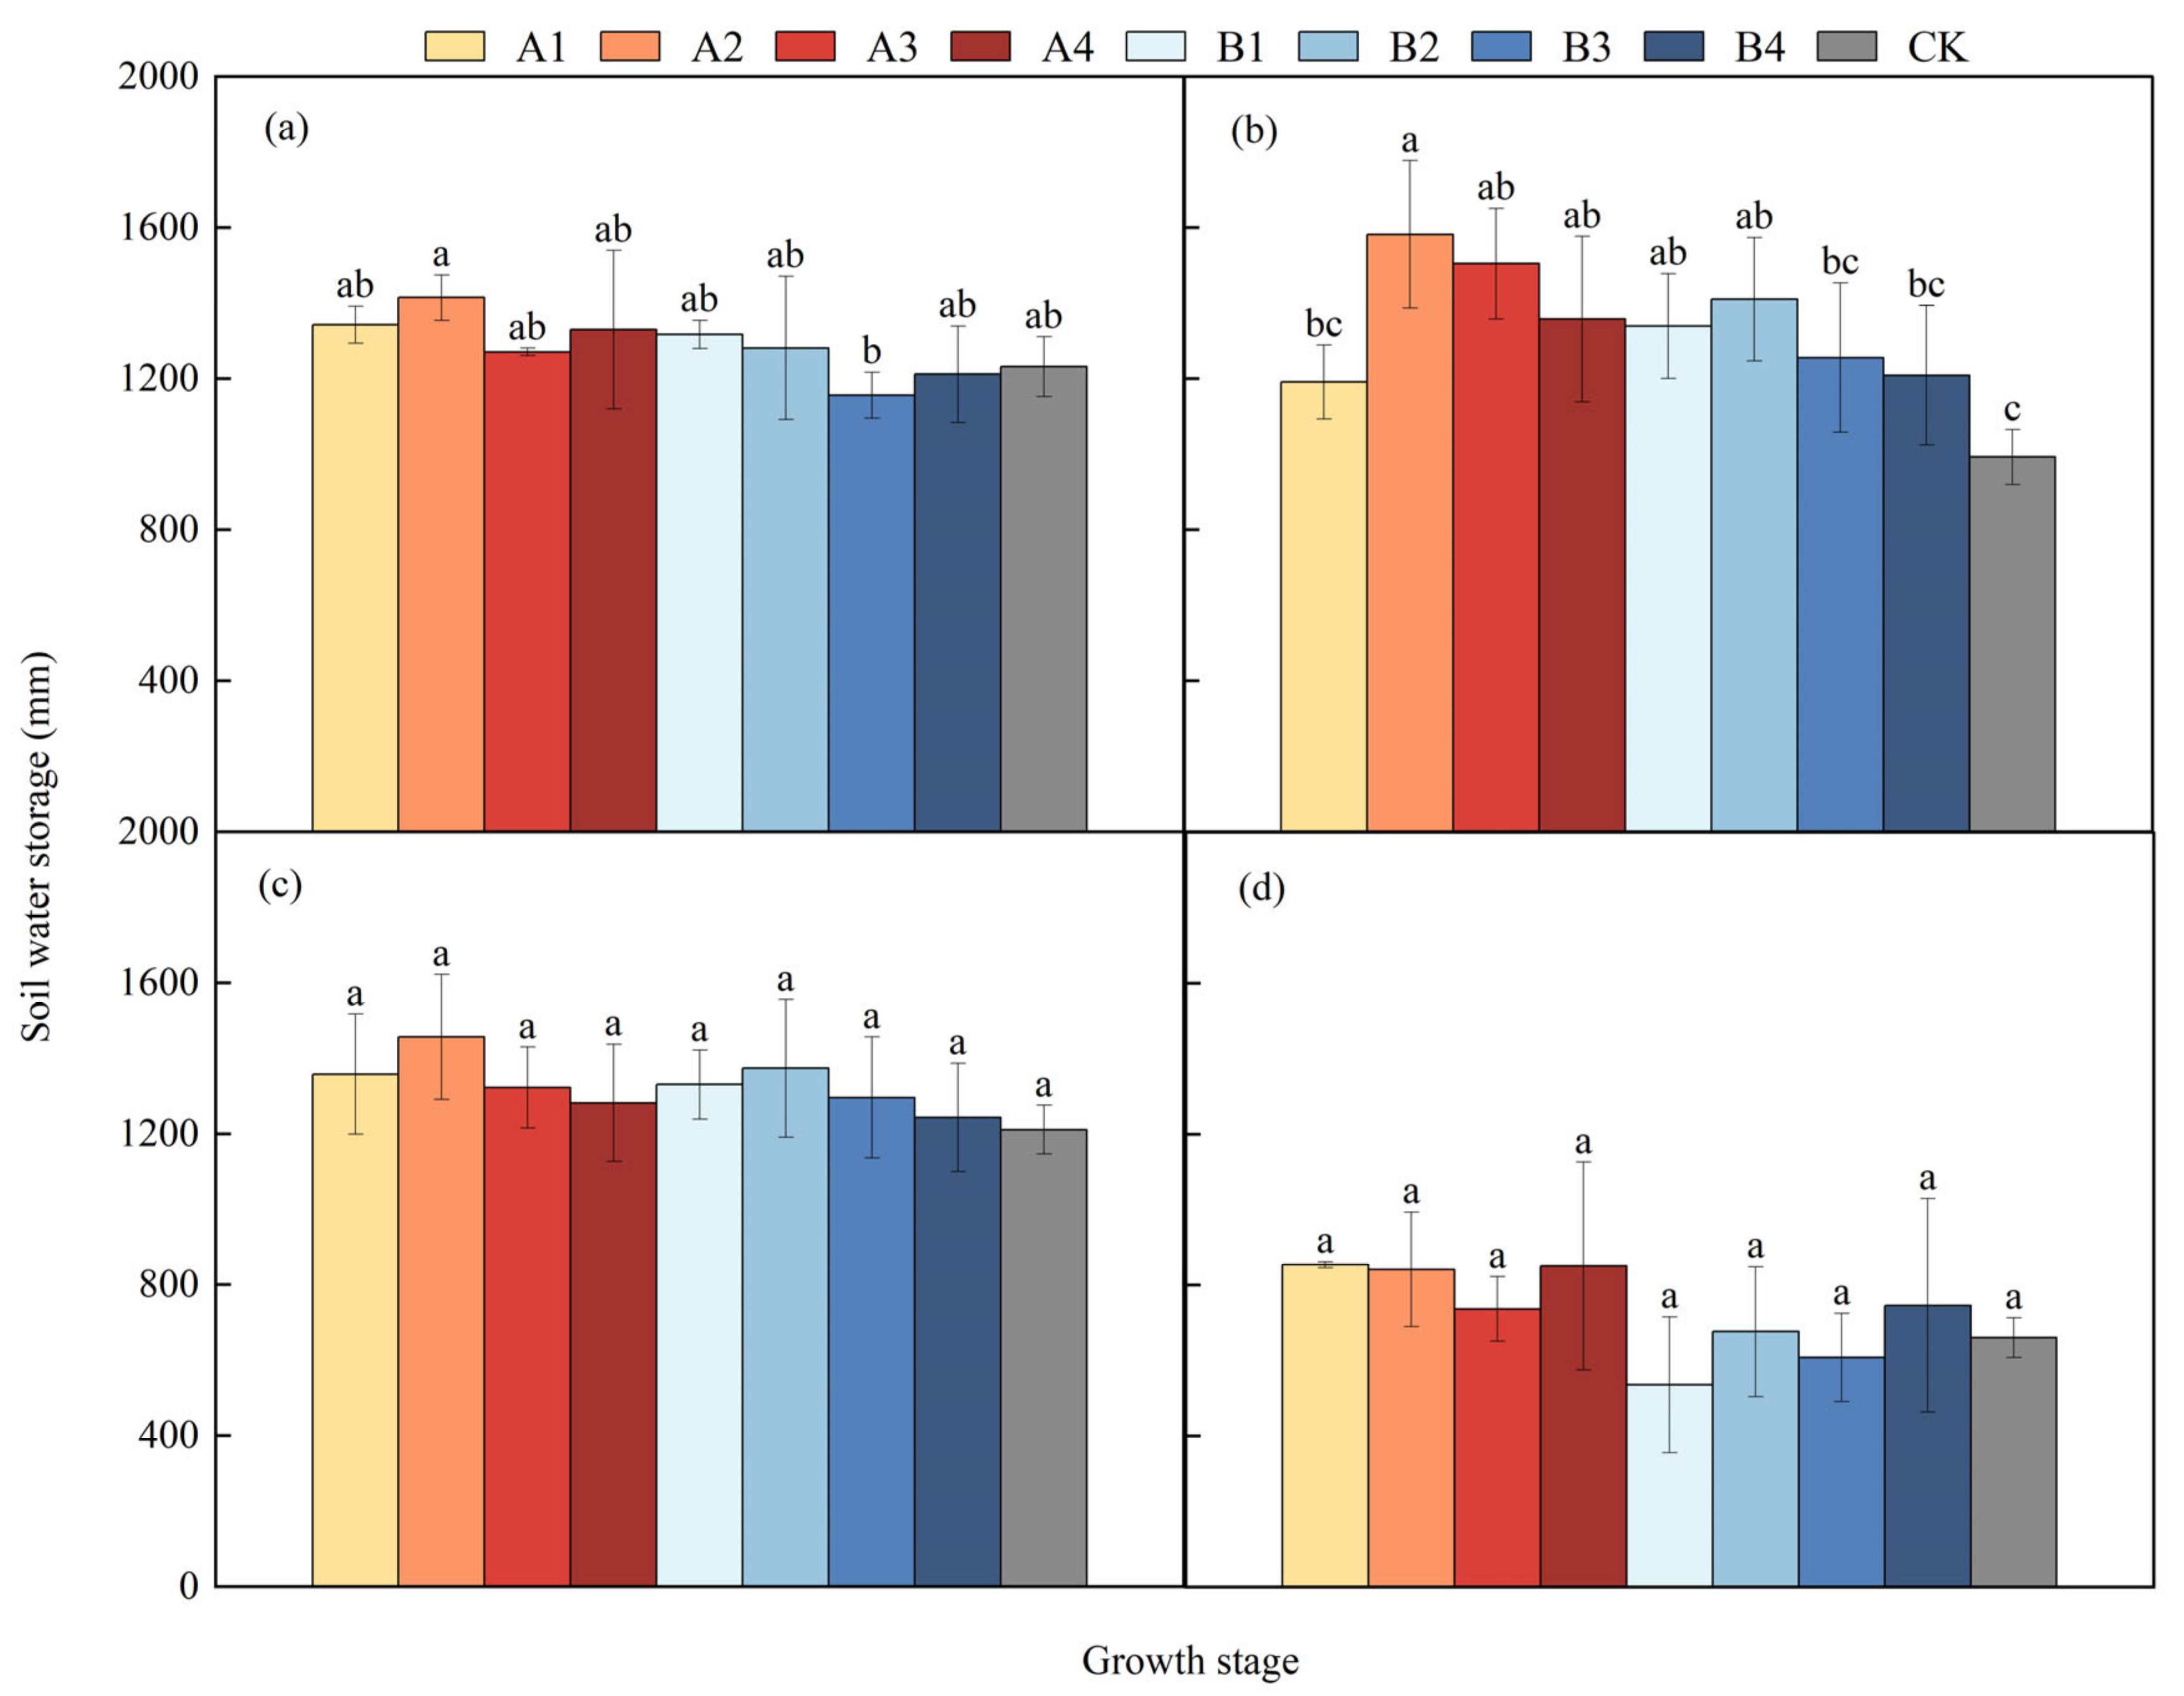
The SWS in 0–60 cm depth at the cotton growth period is shown in
Figure 3. Generally, the SWS of biochar application treatment in each growth period was higher than that of CK treatment. The SWS of the A2 treatment was relatively higher in each treatment, which was 14.88%, 59.5%, 20.27%, and 27.3% higher than that of the CK treatment in the four growth stages of cotton. At the seedling stage, the SWS of the treatments with biochar application after freezing was 1.91%, 10.41%, 9.90%, and 9.71% higher than that of the corresponding treatments with biochar application before freezing under the same biochar application amount. With the increase in biochar application rate, the SWS showed a trend of increasing first and then decreasing. The treatments with different biochar application times reached the maximum when the biochar application rate was 0.66% of the soil mass fraction. At the bud stage, with the progress of irrigation, the difference in the SWS among the biochar application treatments under the same amount of biochar application was further expanded, which also reflected the difference in the SWS capacity of each treatment. At the flower-bolling stage, the water storage of the A2 treatment was higher than other treatments, 20.27% higher than that of the CK treatment. This phenomenon showed that the SWS of A2 treatment was better after biochar application, but the difference in the SWS among all treatments wasn’t insignificant (
p < 0.05). At the end of the boll-opening period, there was no significant difference in the SWS among the treatments due to the stop of irrigation (
p < 0.05).
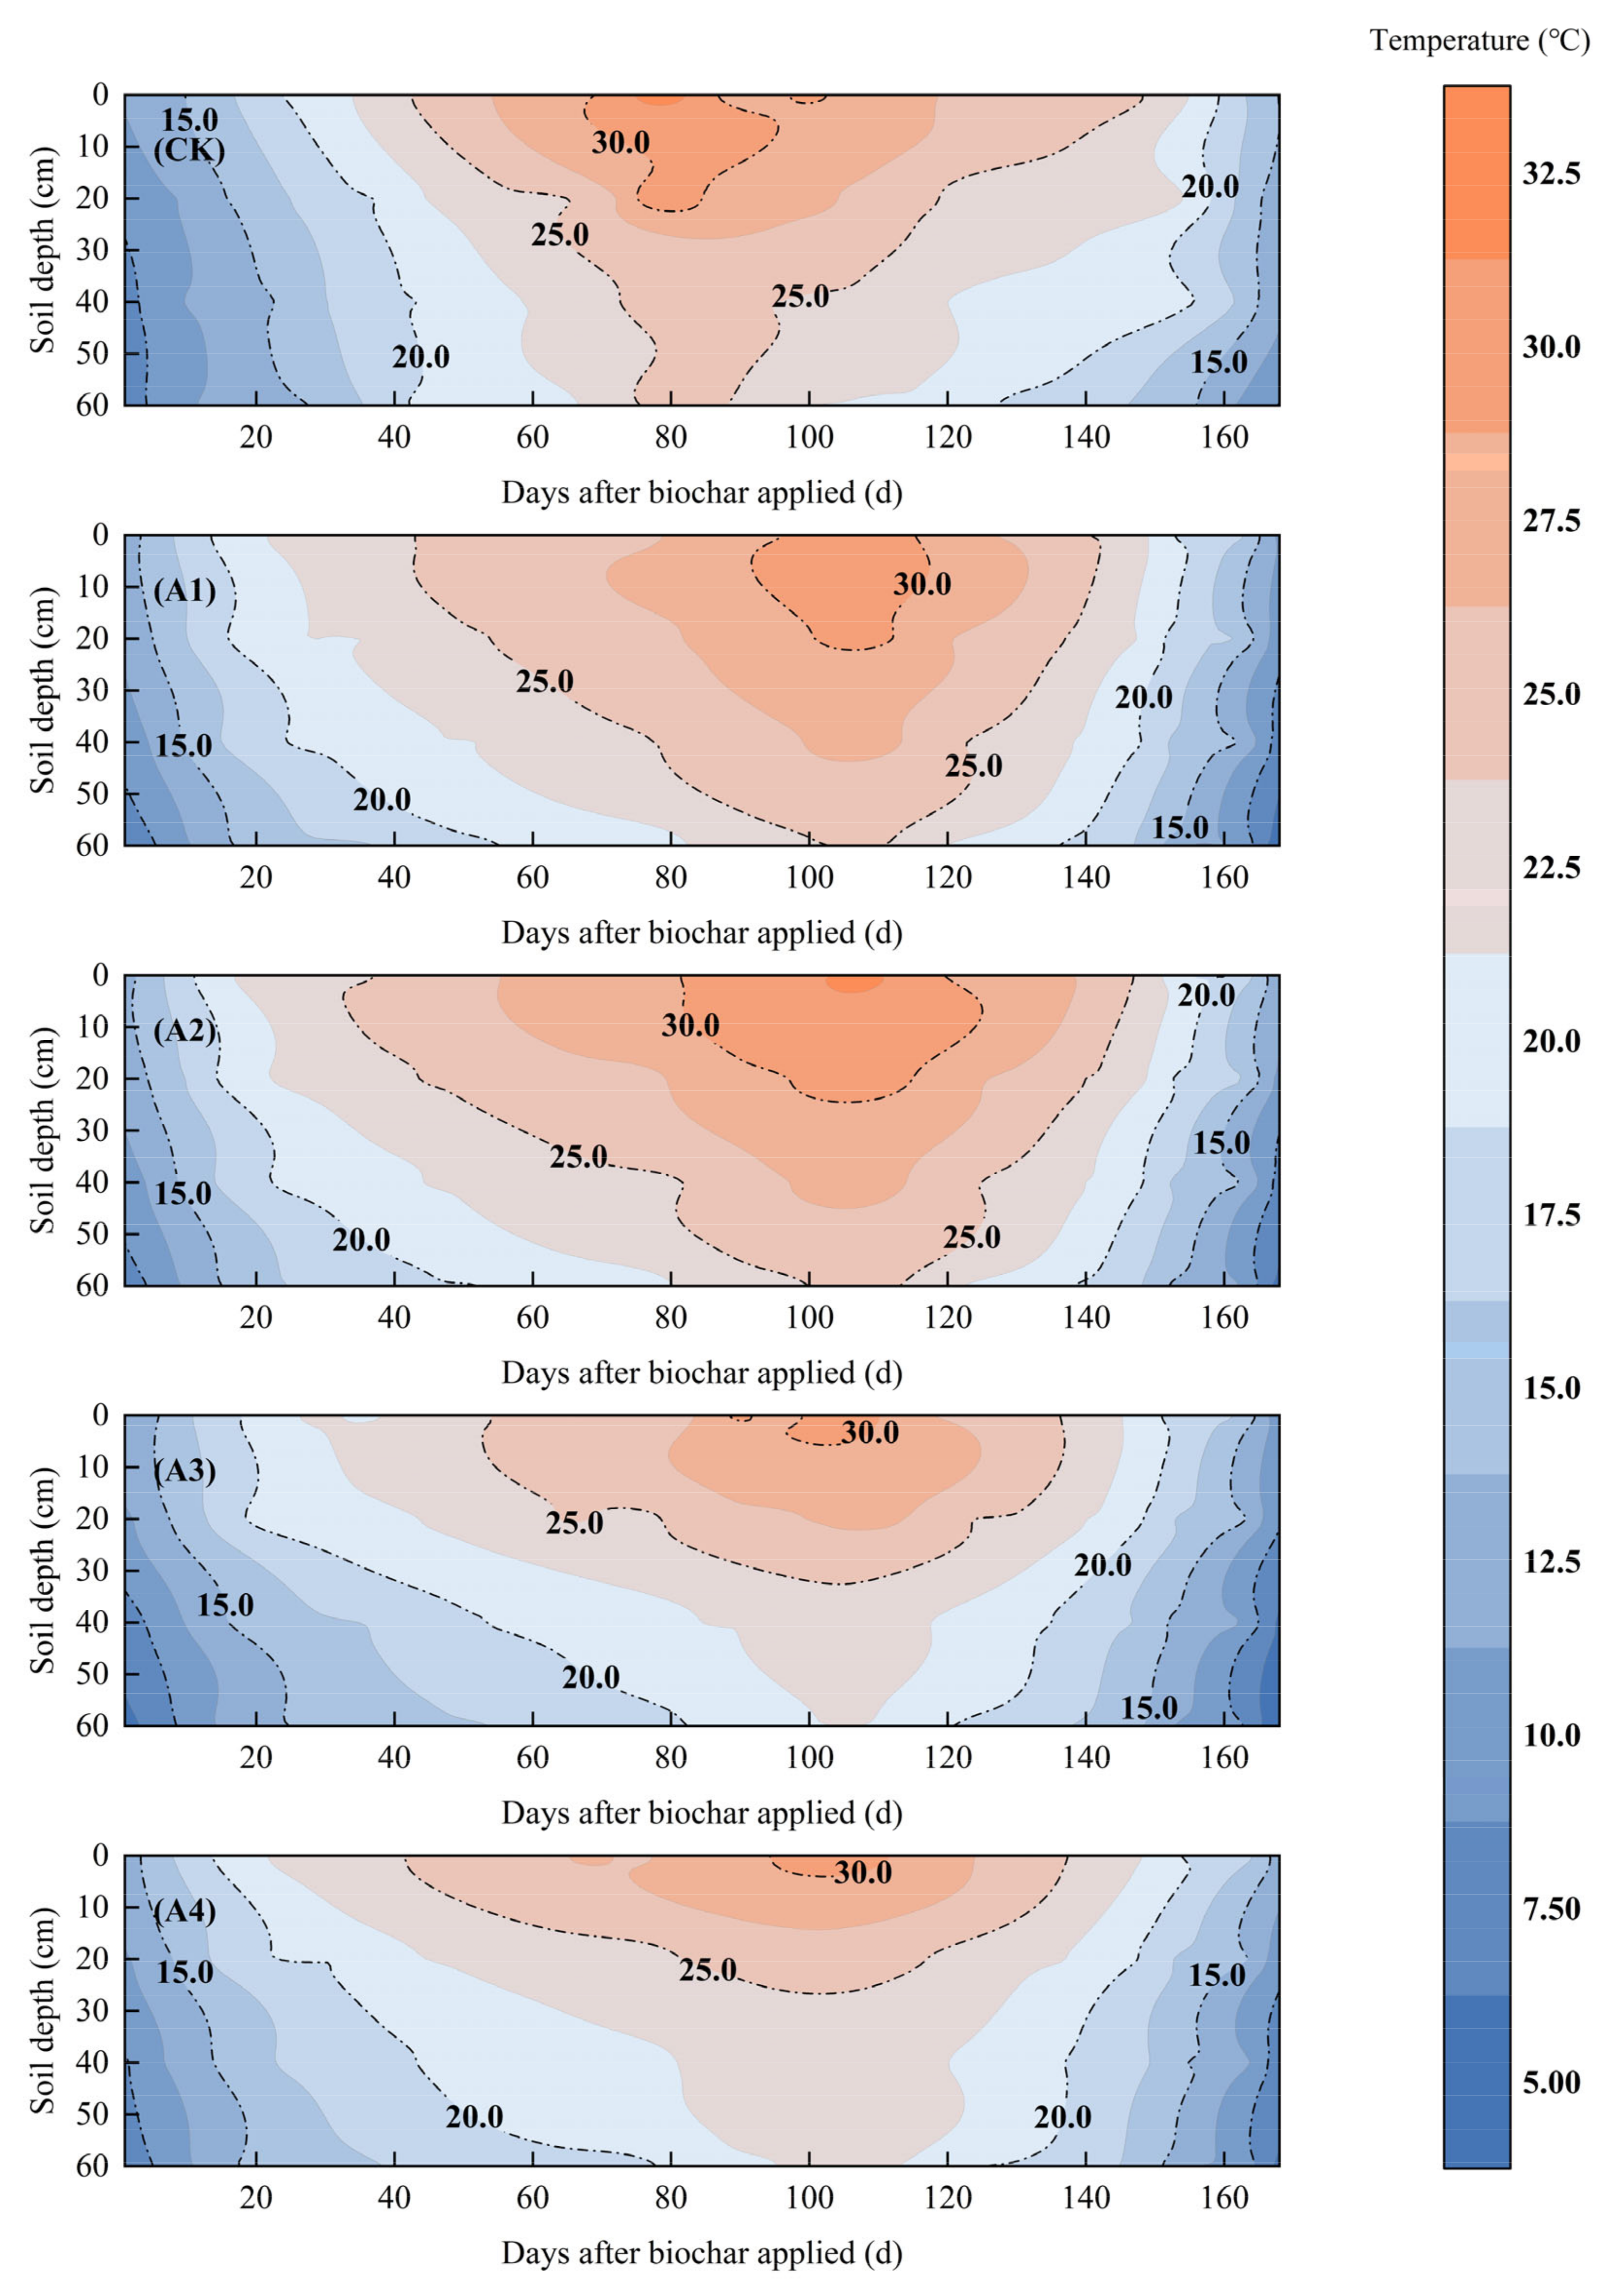
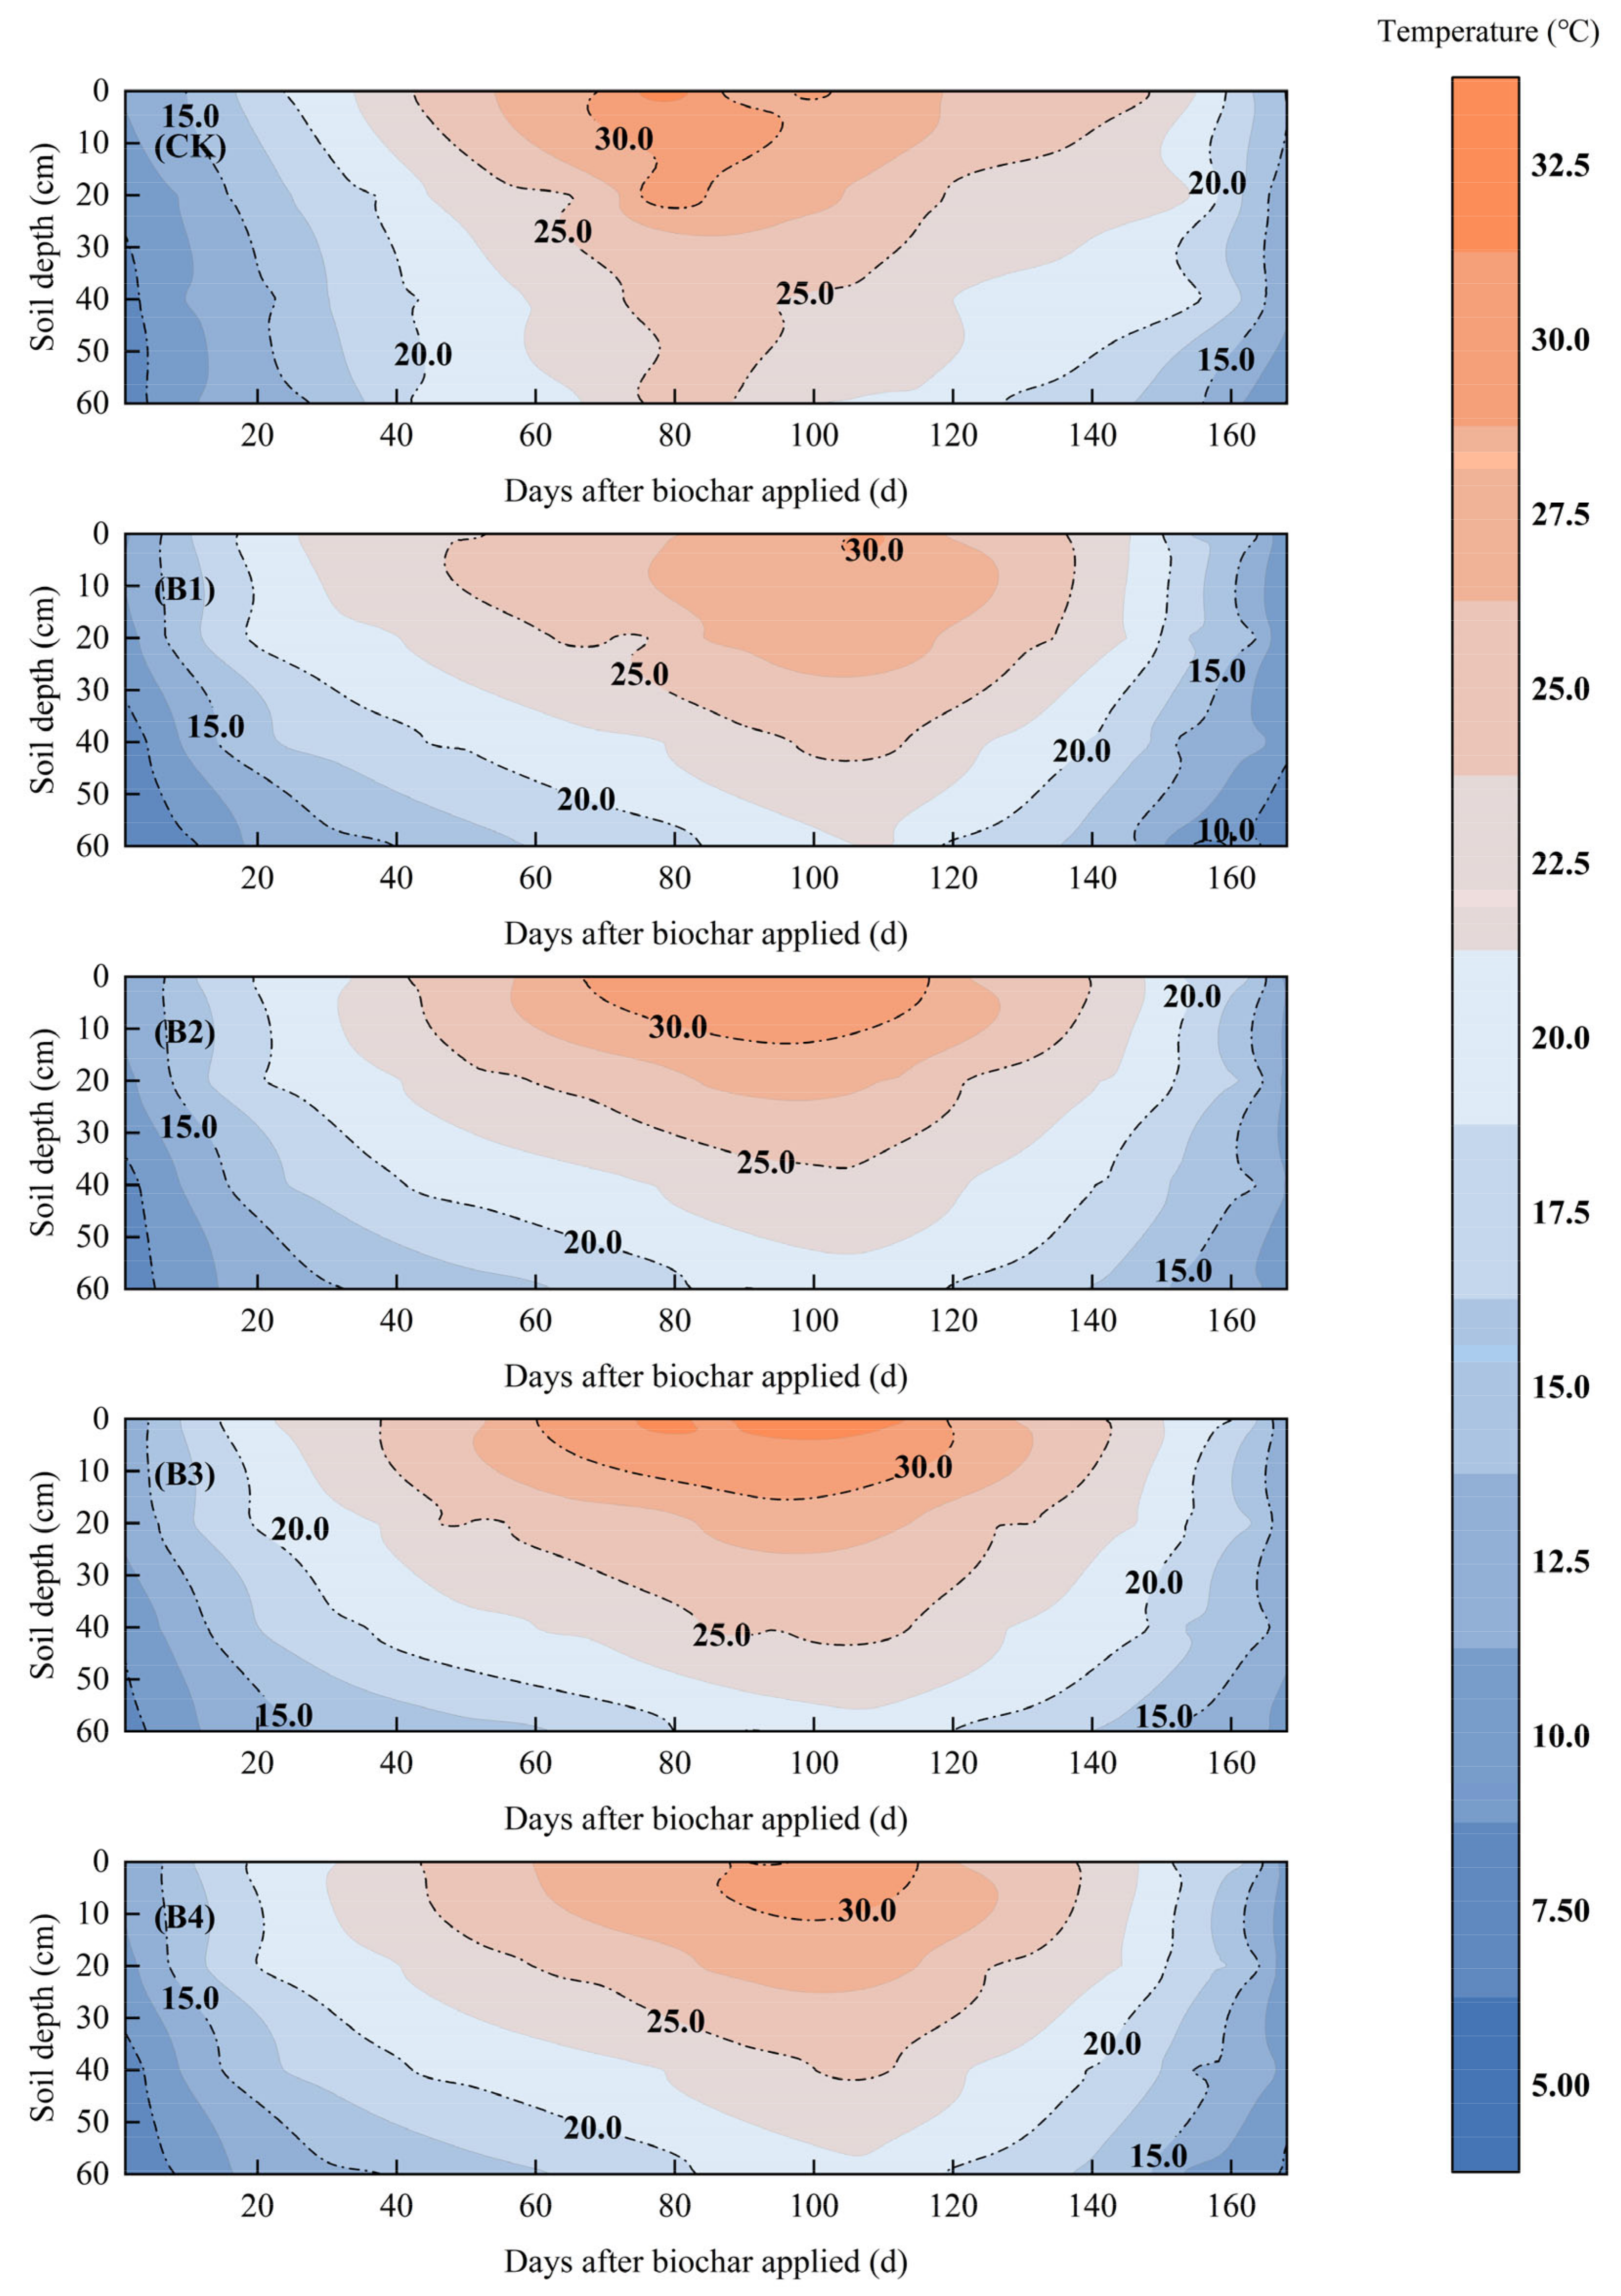
Figure 4 and
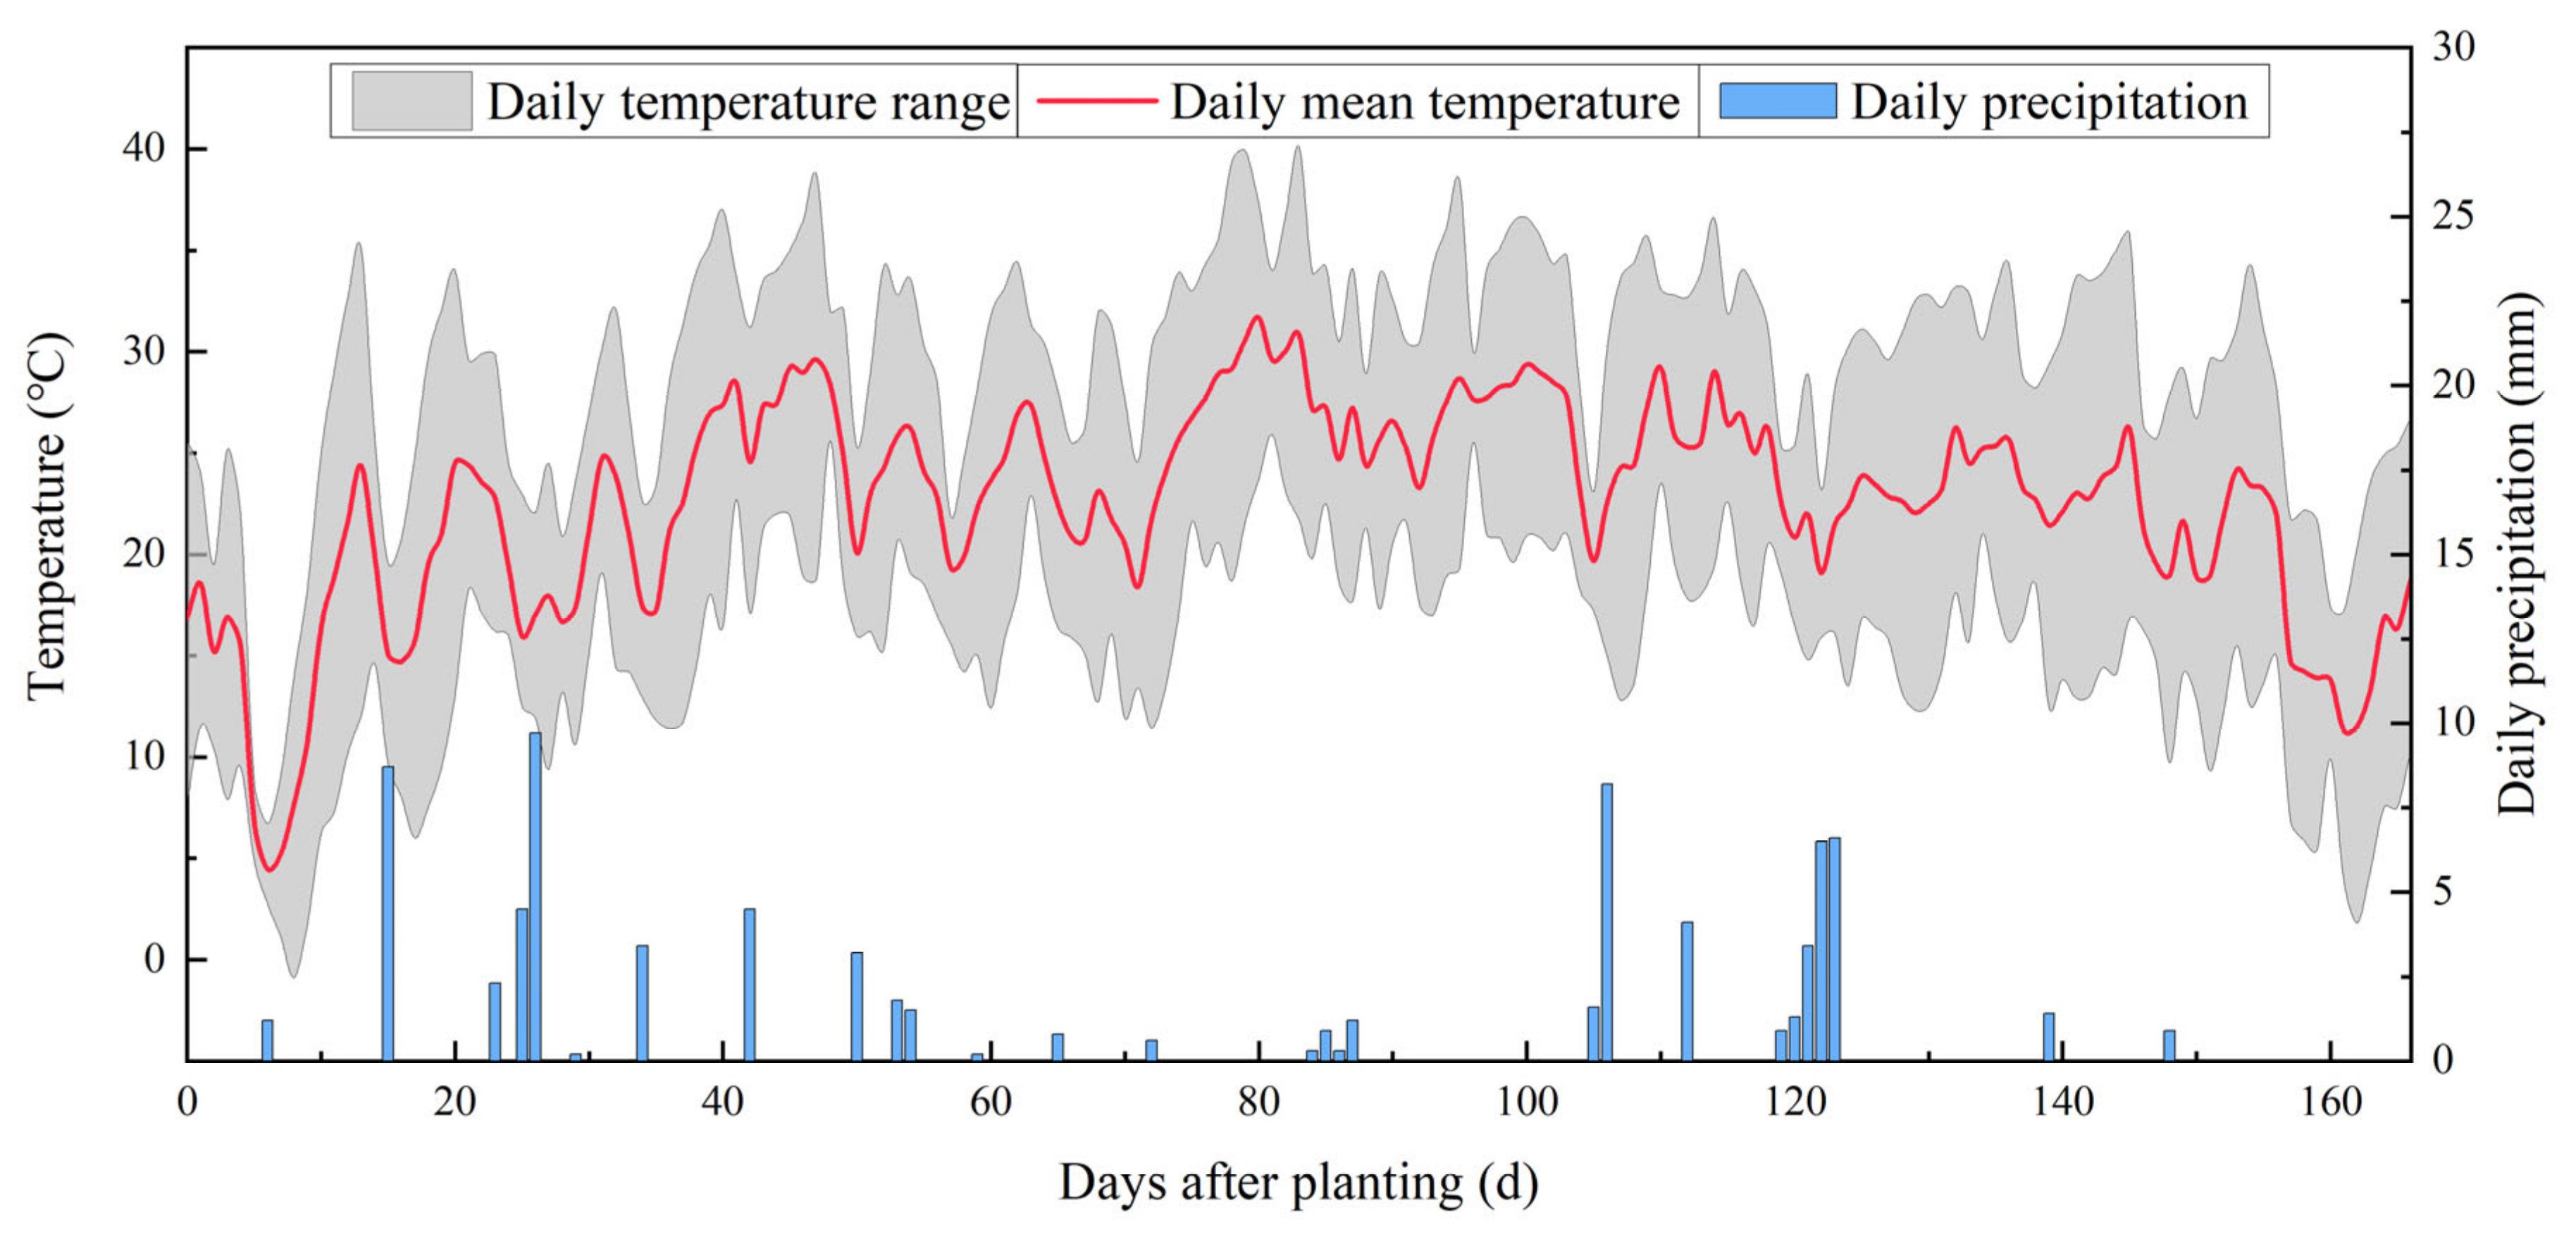
Figure 5 shows the soil temperature during the growth period of cotton plants in 0–60 cm soil layers of cotton fields. In the CK treatment, the temperature contour gradually changed from dense to sparse. It then became dense again over time, indicating that the change rate of soil temperature during the growth period showed a trend of decreasing first and then increasing. The temperature increased gradually after sowing and reached the maximum value of 34.34 °C 79 DAP. Then the surface temperature gradually decreases with the decrease in ambient temperature. At the end of the crop growth period, the surface soil is rapidly reduced under environmental temperature. The soil temperature decreases layer by layer with the increase in soil depth.
Compared with CK, biochar application increased the surface temperature in treatments A. In the figure, the soil temperature isolines of each treatment become more sparse in 0~60 DAP compared with CK, indicating that biochar slows down the change rate of soil temperature. The density of soil temperature isolines in different biochar treatments was similar, and the soil temperature change rates in this stage were 0.21, 0.23, 0.16, and 0.21 °C per day, which were lower than 0.25 °C per day in CK. The soil surface temperature reached the maximum value in 60~120 days, which was 32.00 °C, 33.25 °C, 31.98 °C, and 32.20 °C respectively. Compared with CK, the maximum soil surface temperature decreased by 1.09~2.34 °C, which reflected the hysteresis effect of biochar application on temperature rise. The soil temperature gradually began to decline in 120~168 DAP, and the temperature changed quickly at first and then slowly with the increase of biochar application.
In the vertical direction of treatments A, the soil temperature of each treatment decreased with the increase in depth. In A3 and A4, the effect of soil temperature increase below 40 cm is worse than that in A1 and A2. With the increase of depth, the change rate of soil temperature gradually decreased, showing a similar trend in each treatment.
In treatments B, biochar application also brought a significant warming effect. The soil temperature isolines of each treatment became sparser compared with CK in 0~60 DAP, and the density was similar to treatments A’s. In this stage, the soil temperature change rates were 0.23, 0.27, 0.32, and 0.26 °C per day, which were higher than CK except for B1. In 60~120 days, the soil surface temperature reached the maximum value, which was 31.38 °C, 33.05 °C, 34.50 °C, and 31.93 °C respectively. Compared with CK, the maximum change of soil surface temperature was −2.96~0.16 °C. Apart from B3, biochar application showed a hysteresis effect on temperature rise. In 120–168 DAP, the soil temperature gradually began to decline, and the density of the temperature contour changed little with the increase in biochar application. After a freeze-thaw period, treatment B’s degree of biochar soil combination is deeper than treatments A’s, showing a similar trend of temperature contour in the figure. The change in biochar application only affected the soil temperature but did not significantly change the trend of soil temperature.
In the vertical direction, the soil temperature of each treatment decreased with the increase in depth. Treatments B experienced two times of tillage before and after freeze-thaw, and the biochar soil mixture and distribution were more uniform. This mixture led to the best warming effect of treatment B’s soil temperature under film mulching, slightly better than treatments A’s, although it required more biochar.
3.2. Effects of Biochar Application before and after Freeze-Thaw on Cotton LAI, Cotton Plant Biomass and Seed Cotton Yield
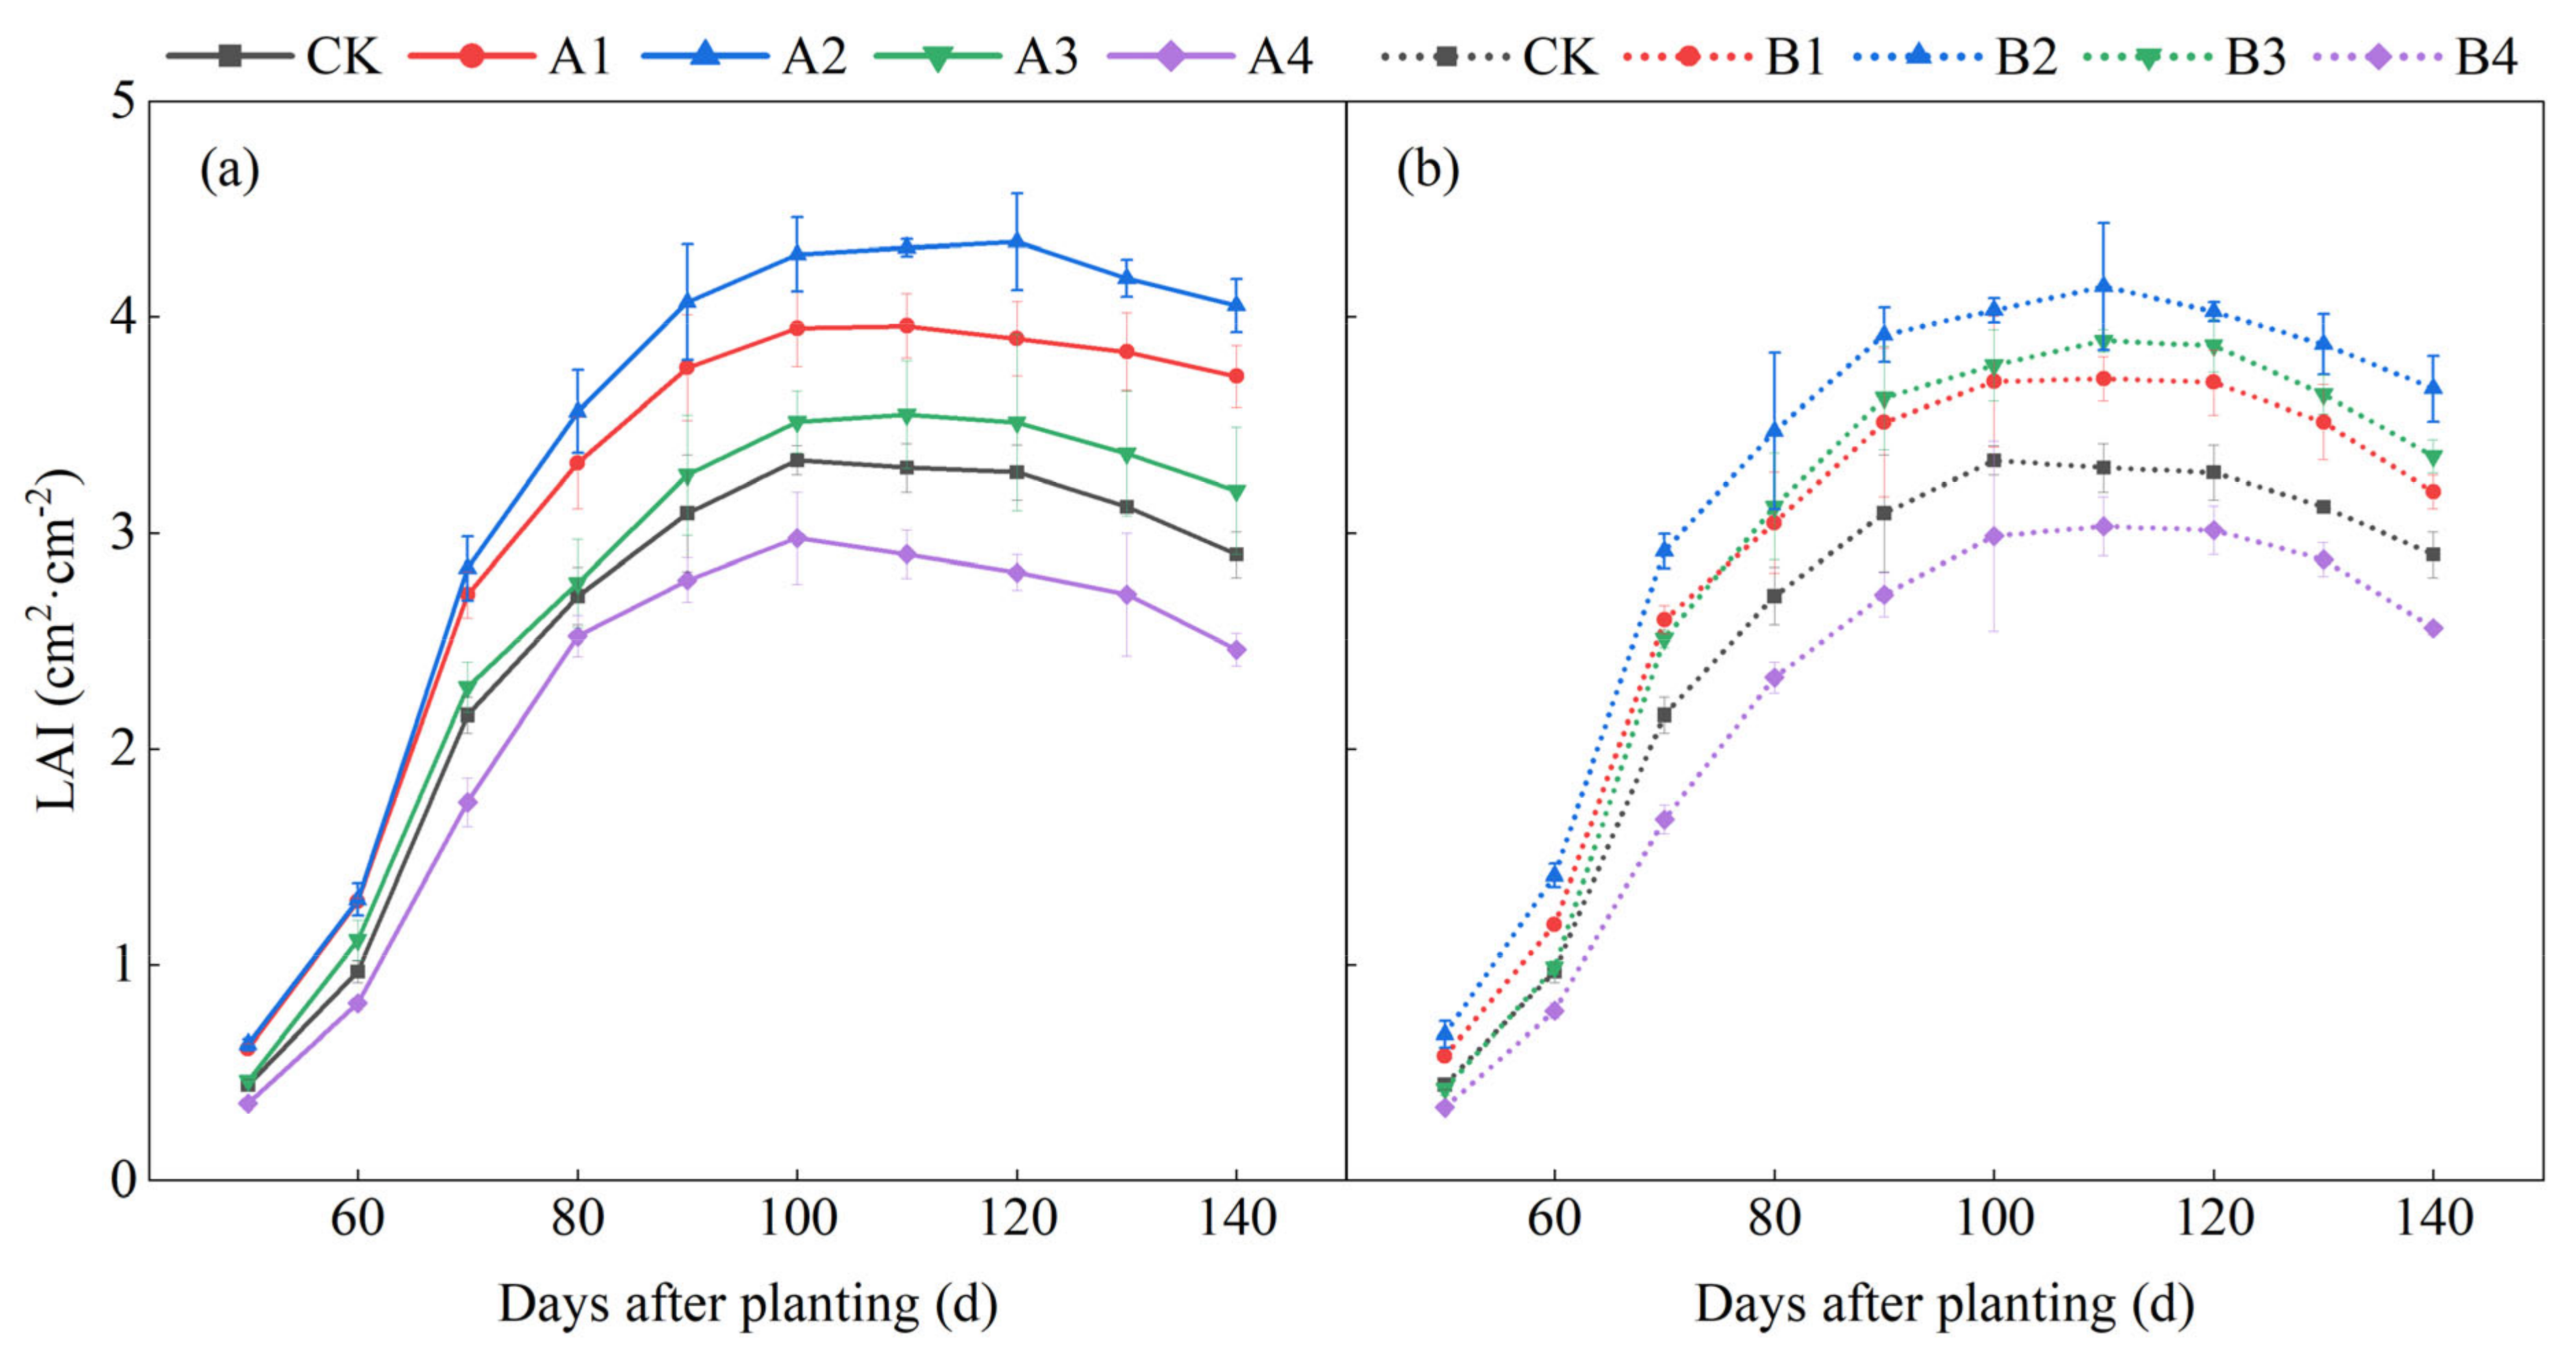
The cotton leaf area index (LAI) in each treatment was shown in
Figure 6. Generally, the LAI trends in all treatments were similar. The LAI increased and then decreased during the cotton growth period. The gap between all treatments became significant from 70 days after planting (DAP), but the gap in treatments A was more significant. In treatments A, the LAI in A2, A1, and A3 were successively higher than CK, but the LAI in A4 was lower than CK. The LAI in A2 reached the maximum 120 DAP and was 32.52% higher than CK. The maximum LAI in A4 was 10.82% lower than CK 100 DAP. In B treatments, the LAI in B2, B3, and B1 were successively higher than CK, but the LAI in B4 was lower than CK. The LAI in B2 reached the maximum 110 DAP and was 25.44% higher than CK. The maximum LAI in B4 was 8.21% lower than CK 110 DAP. The tendency showed a conspicuous improvement of biochar to the LAI of cotton plants, but excessive biochar also influenced the LAI. Applying biochar after freeze-thaw with 0.66% of soil mass fraction had the most significant effect on improving the LAI.
The dry matter accumulation and seed cotton yield in each treatment are shown in
Table 4.
The cotton biomass dry weight and seed cotton yield were shown in
Table 4, different letters in the same column indicate significant differences between different treatments (
p < 0.05). In general, cotton dry matter accumulation and seed cotton yield were higher in the treatment with biochar applied than in the treatment without biochar. The increase in dry matter accumulation and seed cotton yield in treatments A was higher than in the B treatments. For the cotton root, the highest amount of dry matter was accumulated in the A2 treatments Among the treatments with biochar application after freeze-thaw, which was 60.13% more than that in the CK treatment. The most significant amount of dry matter was accumulated in the B2 treatments Among B treatments, which was 38.73% more than in the CK treatment. For the cotton stem, the dry matter weight of the A1 treatment reached the maximum among treatments A, which was 44.50% higher than that of the CK treatment. The dry matter accumulation of cotton stem in B2 was the largest among B treatments, which was 34.98% more than that of CK. For the dry matter accumulation of cotton leaves and cotton bolls, there was no significant difference among the treatments in
p < 0.05. The maximum value reached in A2 treatments Among A treatments was 41.44% and 19.40% higher than CK treatment, respectively. The maximum value reached in B1 treatments Among B treatments was 25.25% and 14.19% higher than in CK treatment, respectively. The seed cotton yield of each biochar applied treatment was higher than that of CK treatment. The seed cotton yield in post-freeze-thaw biochar application treatments was higher than in the pre-freeze-thaw biochar application treatments. The seed cotton yield in the A2 treatment reached the highest value among all treatments, and it was 21.95% higher than the seed cotton yield in the CK treatment. When the biochar application was higher than 0.66% of soil mass fraction, the dry matter accumulation and seed cotton yield were reduced. The opposite condition indicated the inhibitory effect of excessive biochar application on cotton growth by changing soil hydrothermal conditions. The higher dry matter accumulation and seed cotton yield in the post-freeze-thaw biochar application compared to the biochar application before freeze-thaw indicated that the biochar application after freeze-thaw provided a better soil environment for crop growth and increased the seed cotton yield as well.
3.3. Comprehensive Evaluation of the Quality of Cotton Fiber Traits
The cotton fiber quality traits were shown in
Table 5, different letters in the same column indicate significant differences between different treatments (
p < 0.05). As shown in
Table 5, each biochar applied treatment’s fiber length and elongation were higher than the CK’s. The fiber length and elongation of A treatments were higher than those of B treatments at the same biochar application amount. In treatments A, cotton fiber length and elongation showed a trend of increasing and then decreasing with the increase of biochar application. The fiber length and elongation reached the maximum in the A3 treatment, which was 13.18% and 18.52% higher than those in the CK treatment, respectively. In B treatments, there was no apparent trend of change in cotton fiber length and elongation with the increase of biochar application. The fiber length and elongation achieved the maximum value in B1 and B3 treatments, which were 9.27% and 12.96% higher than in the CK treatment.
There was no significant difference between the specific strengths of the treatments at the p < 0.05 level. The specific strength of all biochar-applied treatments was higher than that of CK treatment, and the specific strength of A treatments with biochar applied after freeze-thaw was higher than B treatments with biochar applied before freeze-thaw except for the level of 1.33%. In treatments A, the fiber-specific strength showed a trend of increasing and then decreasing with the increase of biochar application and achieved the maximum value in treatments A2, which was 10.96% higher than that in treatment CK. In the treatments with biochar application before freeze-thaw, the fiber-specific strength increased continuously with the increase of biochar application. It achieved the maximum value in treatment B4, which was 5.32% higher than in treatment CK.
The reflectivity of each treatment was not significantly different at p < 0.05. The fiber reflectivity of all biochar-applied treatments was higher than that of the CK treatment. When the amount of biochar applied exceeded 0.66% of soil mass fraction, the fiber reflectivity of B treatments was higher than that of A treatments. When the amount of biochar application was not higher than 0.66% of soil mass fraction, the fiber reflectivity of B treatments was higher than that of A treatments. Among the treatments at the same biochar application time, the fiber reflectivity showed a trend of increasing and then decreasing with the increase of biochar application amount and reached a maximum value at a biochar application rate of 1.00% of soil mass fraction, which was 2.25% and 3.25% higher than the CK treatment, respectively. As for the micronaire value, the cotton fiber of the A2 treatment reached grade A, the quality of the CK treatment reached grade C, and the rest were in grade B.
We selected five cotton fiber quality traits for principal component analysis to evaluate the effect of different amounts of biochar on cotton quality in drip irrigation cotton fields before and after freeze-thaw. The fiber length (X1) represents the length of the cotton fiber, and the reflectivity (X2) shows the smoothness of the appearance of the cotton fiber. Before analysis, the micronaire value was corrected by the linear interpolation method according to the quality level, and the cotton fiber grade was reflected by the corrected value (X3). We defined the correction value as 1 when the grade is C, the correction value as 2 when the grade is a, and between 1 and 2 when the grade is B. Elongation (X4) refers to the elongation of cotton fiber. Specific strength (X5) refers to the tensile strength of the cotton fiber.

 ,
, 


