
Nitrogen Mitigates Salt Stress and Promotes Wheat Growth in the Yellow River Delta, China
by
 and
and
Yunpeng Sun
1,
Xiaobing Chen
2,*,
Jingjing Shan
2,
Jingtian Xian
2,
Dan Cao
2,
Yongming Luo
1,
Rongjiang Yao
1 and
Xin Zhang
1,* 1
State Key Laboratory of Soil and Sustainable Agriculture, Institute of Soil Science, Chinese Academy of Sciences, Nanjing 210008, China
2
Yantai Institute of Coastal Zone Research, Chinese Academy of Sciences, Yantai 264003, China
*
Authors to whom correspondence should be addressed.
Water 2022, 14(23), 3819; https://doi.org/10.3390/w14233819
Submission received: 22 October 2022
/
Revised: 14 November 2022
/
Accepted: 16 November 2022
/
Published: 23 November 2022
(This article belongs to the Special Issue Monitoring, Reclamation and Management of Salt-Affected Lands)
Abstract
:Highlights
What are the main findings?
- Nitrogen fertilizer (urea) application ameliorated salt damage and promoted the growth of wheat;
- 270 kg/ha nitrogen was the optimal dosage for wheat cultivation in soils of typical agricultural areas of the Yellow River delta.
What is the implication of the main finding?
- The finding is useful for rational utilization of nitrogen fertilizer and coastal saline agriculture development.
Abstract
Salt-affected soils is an important soil resource. Understanding fertilizer and salinity interaction are of great economic importance for improving crop yield and fertilizer use efficiency. A pot experiment was carried out to study the application of nitrogen (N) for ameliorating salt stress in wheat grown in the coastal saline soil of the Yellow River delta. Several controlling levels of salinity and nitrogen (0.7, 1.7, 2.7 g/kg, and 135, 270, and 405 kg/ha) were designed in a pot experiment in a stable water content state to investigate the N and salt interaction on soil properties and winter wheat growth characteristics. The results showed that the dry weight of winter wheat was promoted by salinity in the early growth stage (20 days), then it was gradually inhibited by nitrogen fertilizer. When winter wheat was grown by 54 days, the N and salinity had significant effects on the biomass of winter wheat. The nitrogen content of wheat shoot and root was mainly affected by N addition usage, and the largest value was obtained in 270 kg/ha N dosage treatments. The higher the salt content existed in the soil, the lower the growth rate shown in wheat cultivation. Under saline conditions, the N fertilizer application amount should be controlled to no more than 270 kg/ha, so that it could greatly promote wheat growth. Reasonable fertilizer usage could significantly contribute to crop yield and food quality of the saline agriculture in the Yellow River delta.
1. Introduction
With global climate change, soil salinization caused more and more attention [1]. At present, more than 20% of the arable land in the world has been affected by salt, which threatens global agriculture’s sustainable development [2]. The utilization of saline lands for agricultural development has become a national strategy for ensuring food security in China [3]. The high salinity of groundwater and the shallow water table in the Yellow River Delta has caused soil salinization continued for a long time [4]. The toxic salt could inhibit the germination of seed [5] and the absorption of nutrients while hindering photosynthesis and reducing the metabolic rate [6]. Otherwise, soil salinity also causes crop yield to decrease and soil quality to decline [7]. The planting acreage of the winter wheat in the Yellow River Delta area was reduced year after year for the salt existence [8]. The answer to this question is going to need further study [9]. A great deal has been done to solve the current difficult problem of soil salinity. Various physical, chemical, and biological measures have been conducted to improve saline soil production [10]. For example, gypsum and other chemical modifiers were also used to improve saline-alkali soil [11]. The development of salt-tolerant varieties, such as biological and ecological measures, were also the means of soil salinization improvement, such as salt tolerant plants [12] and microorganisms. The interaction of water and salt makes it easier to regulate soil through water management [13]. However, the absorption of fertilizer mainly depends on the water, and the salt movement is also dependent on the water. So, it is possible to optimize the regulation of water and salt with the addition of fertilizer [14,15].
Nitrogen fertilizer, particularly urea, has been used to improve soil fertility for thirty years in China. Although the application of fertilizer is beneficial to the growth of crops, the use of much fertilizer also results in decreasing in quality and a series of serious environmental problems [16]. Reasonable control of fertilizer application can not only reduce resource waste but also increase crop yield and improve fertilizer use efficiency [17]. Nitrogen is the primary factor limiting crop growth and yield. It is an important component of many organic compounds in crops. The addition of exogenous nitrogen is often achieved by applying nitrogen fertilizer. Adding nitrogen fertilizer could not only increase the content of chlorophyll and then affect photosynthesis [18] but also improve crop productivity [19] and grain quality [20]. Some studies have reported that nitrogen application affected the accumulation and translocation of nitrogen content and biomass [21] and increased the yield of the crop [22]. Salt could reduce fertilizer recovery and agronomic efficiency [23], so taking reasonable steps to control salinity obstacles is necessary. Nitrogen fertilizer application increases soil acidification [24], but it can be used for ameliorating saline-alkaline soils.
Therefore, a pot experiment was conducted with three levels of soil salinity and four levels of N addition content in saline soil of the coastal area of China. The purpose of this study was to determine the variation of soil physicochemical properties and nitrogen adsorption of winter wheat affected by salinity and nitrogen. Thereby providing the optimal nitrogen fertilizer application amount for wheat production in saline soils. This study could contribute to the goal of reducing the application rate of chemical fertilizer and improving the fertilizer efficiency of agriculture in the Yellow River delta.
2. Materials and Methods
2.1. Sampling Site
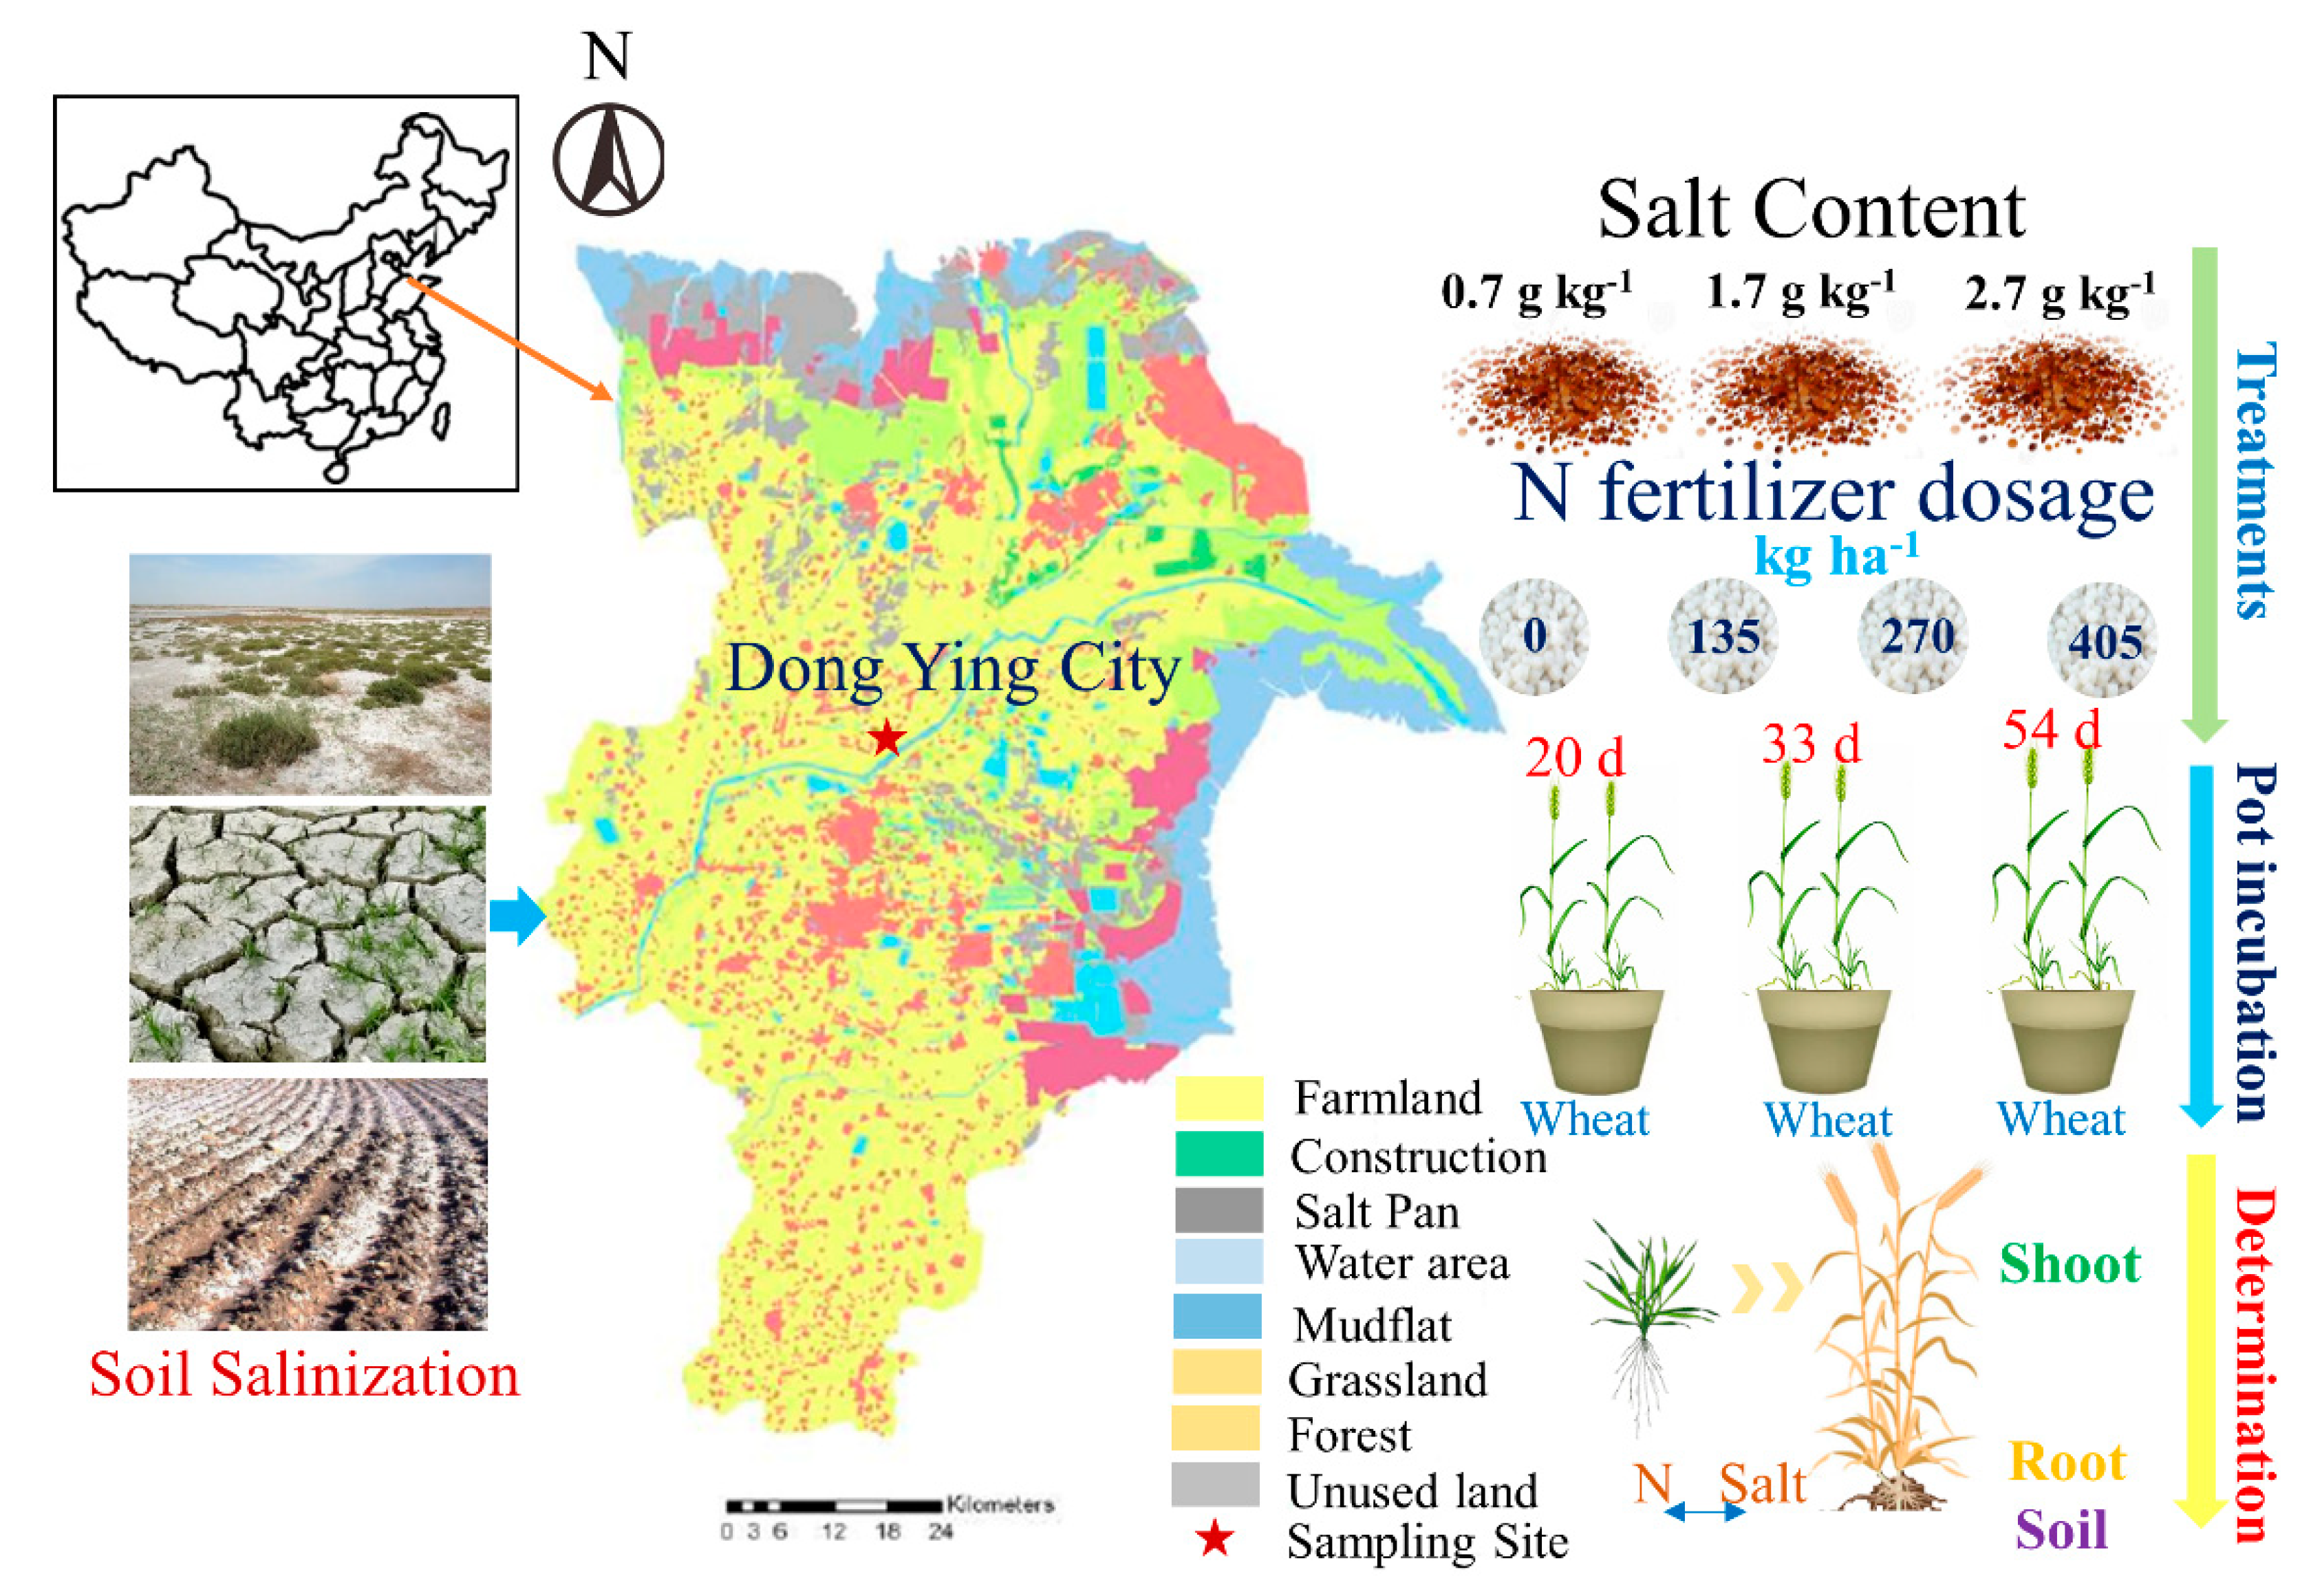
The experimental soil was sandy loam collected at Bohai Farm in Lijin County, Shandong province, China (37°41′ N, 118°36′ E). The sampling site is shown in Figure 1. The sampling site is about 3.5 km from the Yellow River valley and 35 km from the Bohai sea. The climate of the experimental area is warm temperate continental monsoon. The average annual temperature, precipitation, and evaporation were 12.8 °C, 556 mm, and 1755 mm, respectively. The frostless period was 206 d, and the average annual sunshine hours was 2702 h. The main characteristics of the soil are summarized in Table 1.
2.2. Experiment Design
The experiment was conducted in the laboratory incubator of the Yantai Coastal Zone Research Institute of the Chinese Academy of Sciences, and two control factors for soil salinity and nitrogen application were set up (Figure 1). The sampling soil was air-dried, removed the pebbles were, and then sieved to pass through a 2 mm mesh for the pot experiment. The cultivar of winter wheat is Shannong 24. The experiment was conducted in a plant growth chamber (Zhonglang RZH 500, Chengdu, China), with the control condition of the temperature of 20/18 °C at day/night, the sunlight/dark time was 16 h/8 h, and the humidity was 60% ± 5%. The nitrogen fertilizer is urea with a nitrogen content of 46%, and the P2O5 in phosphate fertilizer is 15%. The pot for the wheat growth was a 5 cm radius at the bottom and 11 cm height. Three levels of salt (0.7, 1.7, and 2.7 g/kg, referred to as S1, S2, and S3, respectively) were regulated in the soil using NaCl solution. While four levels of N application rates consisted of 0 (N0), 135 (N1), 270 (N2), and 405 (N3) kg /ha, respectively. The additional amount of phosphate fertilizer was 105 kg (P2O5)/ha. The total treatments were 12 with a randomized block design, and each treatment was repeated 9 times (Table 2).
Each pot was filled with 850 g soil and covered the bottom hole with orchid stones. The hole supplied air exchange and prevented anoxia of the soil. The different salt solutions and fertilizers of all treatments were added to the soil and combined uniformly. The wheat seeds were soaked in 100 mL/L NaClO solution for 10–15 min. After washing with deionized water until the bleach’s smell disappeared, the seeds were placed in Petri dishes to germinate for 20 min in the dark conditions at the temperature was 26 ± 1 °C. The 10 seedlings were transplanted at a depth of 2 cm in every pot. In order to maintain the soil salinity at stable levels, the soil water holding capacity in each pot was maintained at 65% ± 5% by adjusting the whole weight with deionized water throughout the experiment. Plants were grown in a glasshouse with the illumination setting parameters of 16 h/8 h (Light/Dark) and the air humidity maintained at 55–65%. The temperature was set at 20 °C by day and 18 °C by night). Plant samples and soil samples were taken at 20, 33, and 54 days during the cultivation, respectively.
2.3. Data Collection
Basic parameters of the soil: The soil particle size composition was determined by a laser particle analyzer (Mastersizer 2000, Malvern, UK). The soil pH was measured in 1:5 soil-water suspension using a pH meter (Leici PHSJ-4F, Shanghai City, China) after 1 h shaking at 25 °C in an incubator shaker. The total salt was measured by the oven-drying method. The bulk density was tested by cutting the ring. The soil organic matter was determined by a total organic carbon analyzer (Thermo Fisher LH-SOC350, New York, NY, USA).
Plant sampling: The whole winter wheat plant was removed from the pot at each sampling time. Shoots were cut off then roots were washed with distilled water 3 times.
Chlorophyll content: In each pot, three leaves were cut and soaked in Anhydrous ethanol, then determined the Chlorophyll by spectrophotometry (Puxi T6, Beijing, China).
Stem height, stem, and root weight: Pseudo stem height of winter wheat seedlings was measured by a ruler. The fresh samples of the stem and root were baked in a dryer (DHZ-9140A electrothermal constant temperature blast drying box, Shenxian, Tianjin, China) at the temperature of 85 °C for 15 min. Then the samples were baked for 12 h at 70 °C. Finally, they were weighed with High Precision Electronic Balances (with a precision of 0.1μg) (Mettler Toledo XPR2U, Greifensee, Switzerland).
Total nitrogen of plant and soil: The dried samples were digested with the H2SO4-H2O2 method (SH220 graphite digestion apparatus), then determined the N content was by the Kjeldahl method (Huawei KDY-9840 Kjeldahl apparatus, Wuhan, China).
Soil inorganic nitrogen: The fresh soils were extracted with 2 mol/L KCl solution, and the leaching solutions were measured by a continuous flow analyzer (German Seal Company AutoAnalyzer III, Hamburg, Germany) for NO3−. In addition, a part of the soil samples was dried in the oven for water content measurement.
2.4. Statistical Analysis
All data were analyzed using SPSS (Statistical Product and Service Solutions) 19.0 (IBM Company, New York, NY, USA) for Windows software. Significant differences for all data were tested with two-way ANOVA analysis followed by least significant differences (LSD) at p < 0.05.
3. Results
3.1. Soil pH
The N addition contents, and soil salt had significant effects on the soil pH1:5 (Table 3). At the early growth stage of winter wheat (20 days), increased nitrogen fertilizer addition content significantly reduced soil pH1:5, and the difference between N2 and N3 levels was not significant. The higher the soil salinity, the lower the pH1:5. The sequence of pH value in treatments was S1 > S2, S3. On the 33rd day of winter wheat growth, the soil pH1:5 decreased significantly with the increased addition of nitrogen and salinity. The sequence was N0 > N1 > N2 > N3 and S1 > S2 > S3. When winter wheat grew after 54 days, N and salinity addition significantly decreased soil pH1:5, and pH in treatments that included N3 were significantly lower than other N addition levels (N0, N1, and N2). The order of soil pH1:5 in different soil salinity was S1 > S2 > S3. The contribution rates of nitrogen and salt to soil pH1:5 was various in different periods. The contribution rate of nitrogen fertilizer was stronger than that of salt at 20 and 33 days, and the contribution rate of salt was stronger than that of nitrogen fertilizer at 54 days. Although the application of N significantly reduced soil pH1:5, the soil pH1:5 showed an overall increase during the growth of winter wheat. The soil pH1:5 of N0S1 increased by 0.14, while the soil pH1:5 of N0S3 increased by 0.14. In addition, the soil pH1:5 of N1S3 increased by 0.19, while the soil pH1:5 of N3S3 increased by 0.11. Therefore, the amount of nitrogen and salt affected soil pH1:5. They significantly decreased soil pH1:5. In the early stage of winter wheat growth (33 days), nitrogen fertilizer was key influencing factor on soil pH. When the winter wheat grew to 54 days, the nitrogen fertilizer affected little soil pH1:5, and it was mainly affected by soil salinity. The lowest pH in the three levels of salinity was obtained in N3 treatments, and there was no significant difference between N2 and N3 treatments.
3.2. Soil Total N and NO3−
As shown in Table 4, the salt had no significant effect on soil total N during the 54 days of cultivation of winter wheat, while the N addition rate had a significant effect on soil total N before 33 days of growth and the interaction of them had a significant effect on soil total N. The more N addition, the higher NO3− in the soil. With the experiment going on, the NO3− decreased significantly until there was no difference between all treatments after 54 days of cultivation. Soil salinity increased soil NO3− at 33 days but showed no significant effects at 20 days and 54 days. Nitrogen and salt showed obvious interaction on soil N content. There was no significant difference between N2 and N3 treatments in the three levels of soil salinity after 54 days of cultivation.
3.3. Wheat Chlorophyll Content
The chlorophyll content of winter wheat was significantly affected by salinity and N application rate in different growth stages (Table 5). When winter wheat was grown for 20 days, the chlorophyll content of winter wheat was significantly affected by salinity and N application rate. The application of N increased the chlorophyll content, but there was no significant difference between all levels of N application. The increase in soil salinity simulated the generation of chlorophyll in winter wheat (S3, S2 > S1). There was a significant interaction between the salinity and N application rate, and the contribution rate of this interaction was greater than the main effect of soil salinity and nitrogen fertilizer. At 54 days, salinity and N rate had a significant effect on the chlorophyll of winter wheat, while the interaction between the salinity and N rate was not significant. What’s more, chlorophyll content was increased by 58.89% in N3S1 treated posts at 54 days. The application of nitrogen fertilizer promoted the formation of chlorophyll, but there was no significant effect between the various nitrogen application treatments. The chlorophyll content was promoted by salinity (S3> S2 > S1). Therefore, the chlorophyll content of winter wheat was affected by soil salinity and N rate, and both of them showed significantly promoted effects. The contribution rate of salinity was less than that of nitrogen fertilizer. When the salinity was higher than 1.7 g/kg, the salt hardly increased chlorophyll, and there was no significant correlation between nitrogen usage and chlorophyll during the whole cultivation period. N treatments increased Chlorophyll content compared to N0, and there was no significant difference between all N treatments after 54 days of planting.
3.4. N Concentration of Winter Wheat
As shown in Table 6, the N dosage had significant effects on the total N content of the shoot of wheat at different growth stages (within 54 days). When wheat was grown after 20 days, the N application significantly increased the total N in the shoot, but there was no significant difference between the different N treatments. When winter wheat grew to 33 days, the N levels showed significant differences, which showed N1 > N2, N3 > N0. However, when winter wheat grew until 54 days, the N addition levels showed significant differences among the treatments, showing a tendency of N2, N3 > N1 > N0. The amount of N fertilizer merely had significant effects on the total N of the root when the winter wheat grew up to 54 days (Table 6), with the sequence of N content N2, N3 > N1 > N0. A similar variation tendency was found in N application on the total N of the shoot (54 days). During the cultivation period, soil salinity had no significantly improved effect on the total N of shoot and root. At 54 days, the total N of the shoot was increased by 103.18% in N3S1 treatment, and the total N of the root was increased by 122.06% in N2S1 treated pots. After 54 days of cultivation, the highest total N in the shoot and root was obtained in the N2 treatment.
3.5. Plant Height of Wheat
The additional amount of N and salt had significant effects on the pseudo stem height (PSH) of winter wheat, which showed different characteristics at different times (Table 7). At the early growth stage of winter wheat (20 and 33 days), salt had a significant effect on the pseudo stem height. While N application played its role in the growth of winter wheat at 54 days, the PSH increased by 17.14% in N3S1 treatment. However, there were obviously interactive effects between N rate and soil salinity. Salt inhibited the growth of winter wheat in the early growth stage, and the inhibitory effect decreased as the plant grew. On the 20-day, salt effects on PSH showed S1 > S2 > S3, while the values in the order of PSH on the 33−day were S1, S2 > S3. The effect of adding N on the PSH in winter wheat was later than that of salinity. The inhibitory effect of salt on wheat growth was mainly shown at the beginning stage of the plant growth (33 days), and the N application on the PSH was mainly presented after 54 days of growth. The interaction between salinity and N application on winter wheat growth was mainly shown on the 54 days. N2 treatments showed a higher PSH value than N3 treatment, which reflected the lower N addition with the higher productivity.
3.6. Wheat Weight
The results showed that salt and N application rate significantly affected shoot and dry root weight in different growth periods (Table 8). While the salt and N addition rate had no significant effect on the shoot dry weight, the salinity had a significant effect on the root dry weight at 20 days. With the increase in soil salt, the dry weight of winter wheat increased, and the root dry weight in S2 and S3 treatments was significantly higher than in S1. At 33 days after wheat sawing, the salinity had a significant effect on shoot dry weight (S1 < S2 < S3), while the N addition rate had no significant effect on the dry weight of winter wheat. The interaction of N rate and salinity had a significant effect during this period. The dry shoot weight of N2S1 was the highest, and the dry shoot weight of N2S3 was the lowest. When winter wheat grew up to 54 days, the amount of N and salinity had significant effects on the shoot and root dry weight of winter wheat. The shoot dry weight increased by 44.96% in the N2S1 treatment, and the root dry weight increased by 10.42% in the N2S1 treatment after the 54 days plant. The addition of N increased the shoot and root dry weight, but the dry weight decreased as the dosage improved. The effect of salt on the shoot and root dry weight was significant, and the root dry weight of S3 was significantly lower than that of S1 and S2. Therefore, the dry weight of different parts of the winter wheat was significantly affected by salinity and nitrogen fertilizer. However, the nitrogen fertilizer exerted its influence after the salt effects. The different wheat parts’ weight was mainly affected by different factors, and the dry shoot weight of winter wheat was affected by salt, which was stronger than the amount of nitrogen. The root dry weight was principally impacted by the N dosage than the salt content. N2 treatments obtained the highest shoot and root weight, and it was more than the higher N addition N3 treatment.
4. Discussion
Soil salinity adversely affects crop productivity and agricultural sustainability, and plant growth can be inhibited by high salt concentrations through nutritional imbalance, osmotic stress, and specific ion toxicity [25]. Understanding N-Salt relationships is of great economic and social importance [26]. Many studies have been conducted to investigate N and other nutrient application effects on saline soil [16,27,28,29]. The effects of salinity and/or nitrogen on soil properties and plant growth have been recognized in many crops; however, their interaction effect, especially in different addition levels of N and various soil salinity levels, is still not fully understood. Our study has added a new perspective on the common perception of the N rate, salt content or their interactions affected saline soil properties and plant growth.
4.1. Effects of N Addition on Saline Soil Properties
Soil fertility is the capacity to support and coordinate plant growth. Long-term fertilization might change the nutrient status of the soil, and soil N is essential for plant growth. In saline soil, salinity has a negative effect on plant−the nutrient−salinity relationship. In China, fertilizer application has been commonly used for improving crop production and soil fertility in the last three decades [30]. Reports showed that overuse of nitrogen fertilizer is poisoning the country’s air, soil, and water and that farmers could reduce its use without compromising crop yields [31]. Otherwise, applying the N fertilizer could cause soil pH to decrease and accelerate soil acidification [32]. The result of the study showed that soil pH decreased with increasing N addition. Similar results have been reported in many studies [33,34]. Although soil pH increased in the seedling stage, salinity and N addition slowed down its rising trend. Effects of N addition are greater than salinity on soil pH in 33 days, but salinity affected more when wheat grew to 54 days. The soil water content was contained at 65% ± 5% in the experiment, and that reduced experimental error to ensure the accuracy of the results. Soil total N is usually used to measure the basal fertility of the soil. Proper N addition rate improved total N increasing, but greater soil salinity caused marked inhibition of the early step of nitrification [35]. The increased soil salinity could affect the nitrification process adversely, and nitrification of NH4+ to NO3- was reduced by salinity treatments [36]. In our study, when N addition is lower than 270 kg/ha, soil total N increases with increasing N addition. N application rate had no effect until 54 days. This may be caused by the fact that the soil total N was close to the background value (0.957 g/kg) in all treatments. The lower content of NO3- in soil was mainly affected by salinity, and there should be greater NH4+ accumulation in the soil at the greatest salinity level. The more nitrogen added, the more NO3- in the soil during the experimental cultivation (Table 4). The findings agree with those observed by Izsaki [37] and Lu [38], who demonstrated that increasing the application of N fertilizer could increase NO3− content. So nitrogen application could change saline soil pH and then accelerate the N fertilizer nitrification process in soil [39]. The moderate N application rate N2 treatment not only decreased fertilizer consumption but also ameliorated the soil situation, which was beneficial to improve resource utilization.
4.2. Effects of N on Wheat Growth and Plant Nutrition in Saline Soil
The pseudo stem height in the seedling stage is the distance between the plant’s basal part and the top part of the expanded leaf sheath. It is one of the most basic indexes in plant morphology [40]. Photosynthesis is an important basis for the synthesis of organic compounds, and chlorophyll plays an important role in the absorption, transmission, and transformation of light energy [41]. N application rate, nitrogen time, and N form all affect plant growth. N exists in protein and chlorophyll in wheat, and the distribution of nitrogen in plants is affected by N application rate and nitrogen time. The yield of crops that grow in saline soil is significantly lower than that in Non-saline soil, so salinity is harmful to crop growth. Winter wheat is a kind of plant which excludes salt while it can adjust biomass distribution to adapt to salt stress [42]. Plant height, biomass, and Morphological characteristics are affected by salinity [43]. Chlorophyll, Photosynthetic rate, and root activity are limited by salinity [44,45,46]. The study showed that the addition of N and salinity had a significant effect on the shoot and root dry weight, and the effects of salinity accrued earlier than the N addition treatments. The influence of salinity on dry shoot weight was more significant than N addition. While the effect of root dry weight is the opposite. Salinity is the major factor limiting winter wheat growth in the seedling stage (33 d). Similar results were reported by Ray [47], Ghafoor [48], and Liu [49]. The soil water content also affects the yield, but the water maintained a constant content during the experiment, so nitrogen and salinity were the main influence factors. The effect of the N application rate played a key role in pseudo stem height after 54 days of cultivation. So, the effect of salinity on pseudo stem height was earlier than the effect of the addition of N, and the interaction between salinity and the addition of N was significant. Salinity and N rate had a positive effect on chlorophyll improvement, and the chlorophyll content was higher in N addition treatments, the same as that reported in [14,50]. When the soil salinity was 1.7 g/kg, salinity decreased wheat leaf chlorophyll contents. N application rate had no significant effect on chlorophyll content. N concentration in wheat increased with N addition, but an excessive supplement of N might not improve N concentration in wheat. Salinity had no significant negative effects on the total N of each part of the wheat (Table 8). The lower N addition treatment N2 showed a better plant growth promotion effect than the N3 treatment, so the proper utilization of fertilizer in saline soil planting is essential.
5. Conclusions
During the first 20 days of the wheat cultivation, root dry weight was promoted by salinity, and the total N of the shoot was improved by the addition of N. After 33 days of planting, the dry shoot weight of wheat was limited by salinity, and the total N of the shoot was promoted by the addition of N. On the 54 days, shoot dry weight, total N of shoot and root, and chlorophyll content were promoted by the addition of N, while shoot and root dry weight and chlorophyll content were inhibited by different levels of salinity.
The shoot dry weight was increased by 44.96% in the N2S1 treatment, and the root dry weight increased by 10.41% in the N2S1 treatment after 54 days of growth. The addition of N was not only beneficial for reducing the harmful effects of soil salt but also for decreasing soil pH. Soil total N increased gradually with the increase in N application rate when the N rate was less than 270 kg/ha. During the experimental time (within 54 days), the interaction between salinity and N application rates significantly increased shoot dry weight, and the total N of the root lasted for 33 days. During the wheat seedling growth stage, 270 kg N/ha application was the optimal measurement for crop growth and soil regulation when the salt content is less than 1.7 g/kg.
Consequently, it is necessary that how to apply fertilizer rationally and improve the utilization ratio of fertilizer for the sustainable development of saline agriculture in the Yellow River delta.
Author Contributions
Conceptualization, Y.S. and X.C.; methodology, Y.S., J.S. and R.Y.; software, Y.S.; validation, X.Z.; formal analysis, Y.S.; investigation, Y.S., J.S., D.C. and J.X.; resources, X.Z.; data curation, X.C. and J.S.; writing—original draft preparation, Y.S.; writing—review and editing, Y.S.; visualization, X.C. and Y.L.; supervision, X.Z. and Y.L.; project administration, X.C.; funding acquisition, X.Z. All authors have read and agreed to the published version of the manuscript.
Funding
This research was funded by the Natural Science Foundation of China, grant number U1806215; the National Key Research & Development Program of China, grant number 2019YFD1002702; and the National Natural Science Foundation of China (General Program), grant number 41977015.
Acknowledgments
The authors would like to acknowledge the Yellow River Delta coastal wetland Ecological Station for supplying sampling instruments for our experiment.
Conflicts of Interest
The authors declare no conflict of interest.
References
- Yang, L.; Bian, X.G.; Yang, R.P.; Zhou, C.L.; Tang, B.P. Assessment of organic amendments for improving coastal saline soil. Land Degrad. Dev. 2018, 29, 3204–3211. [Google Scholar] [CrossRef]
- Chele, K.H.; Tinte, M.M.; Piater, L.A.; Dubery, I.A.; Tugizimana, F. Soil Salinity, a Serious Environmental Issue and Plant Responses: A Metabolomics Perspective. Metabolites 2021, 11, 724. [Google Scholar] [CrossRef] [PubMed]
- Xie, X.F.; Pu, L.J.; Zhu, M.; Wu, T.; Xu, Y.; Wang, X.H. Effect of long-term reclamation on soil quality in agricultural reclaimed coastal saline soil, Eastern China. J. Soil Sediments 2020, 20, 3909–3920. [Google Scholar] [CrossRef]
- Cui, Q.; Xia, J.B.; Yang, H.J.; Liu, J.T.; Shao, P.S. Biochar and effective microorganisms promote Sesbania cannabina growth and soil quality in the coastal saline-alkali soil of the Yellow River Delta, China. Sci. Total Environ. 2021, 756, 143801. [Google Scholar] [CrossRef] [PubMed]
- Zhao, X.; Wang, L.Q.; Zhou, C.J.; Shang, H.B. Sodium uptake and carbon/nitrogen metabolism by different w inter wheat genotypes during germination under salt. Chin. J. Eco-Agric. 2007, 15, 89–93. [Google Scholar]
- Li, J.; Pu, L.; Zhu, M.; Zhang, R. The Present Situation and Hot Issues in the Salt-affected Soil Research. Acta Geogr. Sin. 2012, 67, 1233–1245. [Google Scholar] [CrossRef]
- Xu, Z.K.; Shao, T.Y.; Lv, Z.X.; Yue, Y.; Liu, A.H.; Long, X.H.; Zhou, Z.S.; Gao, X.M.; Rengel, Z. The mechanisms of improving coastal saline soils by planting rice. Sci. Total Environ. 2020, 703, 135529. [Google Scholar] [CrossRef]
- Yang, J.; Ji, M.C.; Yang, P.; Zhang, Q.; Liu, X. The Empirical Analysis on the Current Situation of Wheat Production in Shandong Province. J. Agric. 2014, 4, 7–11. [Google Scholar] [CrossRef]
- Francois, L.E.; Maas, E.V.; Donovan, T.J.; Youngs, V.L. Effect of salinity on grain-yield and quality, vegetative growth, and germination of semidwarf and durum-wheat. Agron. J. 1986, 78, 1053–1058. [Google Scholar] [CrossRef]
- Zhang, T.; Wang, T.; Liu, K.S.; Wang, L.X.; Wang, K.; Zhou, Y. Effects of different amendments for the reclamation of coastal saline soil on soil nutrient dynamics and electrical conductivity responses. Agric. Water Manag. 2015, 159, 115–122. [Google Scholar] [CrossRef]
- Tao, J.; Wu, L.H.; Liu, X.J.; Zhang, H.; Xu, Y.J.; Gu, W.; Li, Y. Effect of Brackish Ice on Salt and Nutrient Contents of Saline Soil in Flue-Gas Desulfurization Gypsum Amended, Raised Bed Agroecosystem. Soil Sci. Soc. Am. J. 2014, 78, 1734–1740. [Google Scholar] [CrossRef]
- Wang, X.G.; Sun, R.B.; Tian, Y.P.; Guo, K.; Sun, H.Y.; Liu, X.J.; Chu, H.Y.; Liu, B.B. Long-Term Phytoremediation of Coastal Saline Soil Reveals Plant Species-Specific Patterns of Microbial Community Recruitment. mSystems 2020, 5, e00741-19. [Google Scholar] [CrossRef] [PubMed] [Green Version]
- Zhu, W.; Yang, J.S.; Yao, R.J.; Xie, W.P.; Wang, X.P.; Liu, Y.Q. Soil water-salt control and yield improvement under the effect of compound control in saline soil of the Yellow River Delta, China. Agric. Water Manag. 2022, 263, 107455. [Google Scholar] [CrossRef]
- Cevheri, C.I.; Sakin, E.; Ramazanoglu, E. Effects of different fertilizers on some soil enzymes activity and chlorophyll contents of two cotton (G. hirsutum L.) varieties grown in a saline and non-saline soil. J. Plant Nutr. 2022, 45, 95–106. [Google Scholar] [CrossRef]
- Zhu, G.L.; Xu, Z.R.; Xu, Y.M.; Lu, H.T.; Ji, Z.Y.; Zhou, G.S. Different Types of Fertilizers Enhanced Salt Resistance of Oat and Associated Physiological Mechanisms in Saline Soils. Agronomy 2022, 12, 317. [Google Scholar] [CrossRef]
- Zhu, G.L.; Wang, Y.; Shi, X.X.; Lu, H.T.; Ren, Z.; Shi, Y.; Jiao, X.R.; Ibrahim, M.E.H.; Irshad, A.; Zhu, W.B.; et al. Optimum nitrogen management enhances growth, antioxidant ability and yield performance of rice in saline soil of coastal area of China. Chil. J. Agric. Res. 2020, 80, 629–639. [Google Scholar] [CrossRef]
- Tenelli, S.; Otto, R.; Bordonal, R.O.; Carvalho, J.L.N. How do nitrogen fertilization and cover crop influence soil C-N stocks and subsequent yields of sugarcane? Soil Tillage Res. 2021, 211, 104999. [Google Scholar] [CrossRef]
- Yan, F.; Wang, K.; Luo, Q.; Luo, C. Effects of NH4(+)-N/NO3(-)-N ratio in applied supplementary fertilizer on nitrogen metabolism, photosynthesis and growth of Isatis indigotica. China J. Chin. Mater. Med. 2009, 34, 2039–2042. [Google Scholar] [CrossRef]
- Jiang, H.Z.; Yan, B.J.; Tan, F.Q.; Zhang, H.Q.; Ren, Z.L. Effect of Different Nitrogen Fertilizer Amount and Application Period on Wheat Quality. J. Triticeae Crops 2009, 29, 658–662. [Google Scholar] [CrossRef]
- Zhang, A.; Yang, S.; Yang, S.; Li, Y.; Liu, R.; Yang, Z. Effect of N Rates on Yield of Spring Wheat, Fertilizer N Recovery and N Balance. Chin. Agric. Sci. Bull. 2009, 25, 137–142. [Google Scholar]
- Zou, F.; Wang, Y.; Zhao, W.; Chen, B.; Meng, Y.; Zhou, Z. Effect of N Application Rate on Growth, Yield and Fiber Quality of Cotton Grown in Saline Coastal Land. Cotton Sci. 2015, 27, 232–240. [Google Scholar] [CrossRef]
- Deng, L.Q.; Liu, Z.P.; Cheng, A.W.; Shen, Q.R.; Chen, M.D. Influence of N and P fertilizers on sunflower grown in different saline soil on coast. Chin. J. Oil Crop Sci. 2002, 24, 61–64. [Google Scholar] [CrossRef]
- Guo, S.x.; Gong, Y.s. Effect of Different Salinity and Nitrogen on Water and Nitrogen Use Efficiency of Spinach. Chin. J. Soil Sci. 2011, 42, 906–910. [Google Scholar]
- Zhang, W.; Cao, G.; Li, X.; Zhang, H.; Wang, C.; Liu, Q.; Chen, X.; Cui, Z.; Shen, J.; Jiang, R.; et al. Closing yield gaps in China by empowering smallholder farmers. Nature 2016, 537, 671–674. [Google Scholar] [CrossRef]
- Chen, W.P.; Hou, Z.A.; Wu, L.S.; Liang, Y.C.; Wei, C.Z. Effects of salinity and nitrogen on cotton growth in arid environment. Plant Soil 2010, 326, 61–73. [Google Scholar] [CrossRef] [Green Version]
- Olsen, Y.S.; Dausse, A.; Garbutt, A.; Ford, H.; Thomas, D.N.; Jones, D.L. Cattle grazing drives nitrogen and carbon cycling in a temperate salt marsh. Soil Biol. Biochem. 2011, 43, 531–541. [Google Scholar] [CrossRef]
- Apte, S.K.; Thomas, J. Possible amelioration of coastal soil salinity using halotolerant nitrogen-fixing cyanobacteria. Plant Soil 1997, 189, 205–211. [Google Scholar] [CrossRef]
- Che, Z.; Wang, J.; Li, J.S. Determination of threshold soil salinity with consideration of salinity stress alleviation by applying nitrogen in the arid region. Irrig. Sci. 2022, 40, 283–296. [Google Scholar] [CrossRef]
- Zhang, D.M.; Li, W.J.; Xin, C.S.; Tang, W.; Eneji, A.E.; Dong, H.Z. Lint yield and nitrogen use efficiency of field-grown cotton vary with soil salinity and nitrogen application rate. Field Crops Res. 2012, 138, 63–70. [Google Scholar] [CrossRef]
- Daba, N.A.; Li, D.C.; Huang, J.; Han, T.F.; Zhang, L.; Ali, S.; Khan, M.N.; Du, J.X.; Liu, S.J.; Legesse, T.G.; et al. Long-Term Fertilization and Lime-Induced Soil pH Changes Affect Nitrogen Use Efficiency and Grain Yields in Acidic Soil under Wheat-Maize Rotation. Agronomy 2021, 11, 2069. [Google Scholar] [CrossRef]
- Liu, X.J.; Zhang, Y.; Han, W.X.; Tang, A.H.; Shen, J.L.; Cui, Z.L.; Vitousek, P.; Erisman, J.W.; Goulding, K.; Christie, P.; et al. Enhanced nitrogen deposition over China. Nature 2013, 494, 459–462. [Google Scholar] [CrossRef] [PubMed]
- Yang, X.D.; Ni, K.; Shi, Y.Z.; Yi, X.Y.; Zhang, Q.F.; Fang, L.; Ma, L.F.; Ruan, J.Y. Effects of long-term nitrogen application on soil acidification and solution chemistry of a tea plantation in China. Agric. Ecosyst. Environ. 2018, 252, 74–82. [Google Scholar] [CrossRef]
- Lu, X.F.; Gilliam, F.S.; Guo, J.Y.; Hou, E.Q.; Kuang, Y.W. Decrease in soil pH has greater effects than increase in above-ground carbon inputs on soil organic carbon in terrestrial ecosystems of China under nitrogen enrichment. J. Appl. Ecol. 2022, 59, 768–778. [Google Scholar] [CrossRef]
- Peryea, F.J.; Burrows, R.L. Soil acidification caused by four commercial nitrogen fertilizer solutions and subsequent soil pH rebound. Commun. Soil Sci. Plant Anal. 1999, 30, 525–533. [Google Scholar] [CrossRef]
- Akhtar, M.; Hussain, F.; Ashraf, M.Y.; Qureshi, T.M.; Akhter, J.; Awan, A.R. Influence of Salinity on Nitrogen Transformations in Soil. Commun. Soil Sci. Plant Anal. 2012, 43, 1674–1683. [Google Scholar] [CrossRef]
- Irshad, M.; Honna, T.; Yamamoto, S.; Eneji, A.E.; Yamasaki, N. Nitrogen mineralization under saline conditions. Commun. Soil Sci. Plant Anal. 2005, 36, 1681–1689. [Google Scholar] [CrossRef]
- Izsaki, Z.; Ivanyi, I. Effect of N fertiliser on the nitrogen balance of the soil and on NO3-N leaching in a long-term mineral fertilisation experiment. Novenytermeles 2002, 51, 115–124. [Google Scholar] [CrossRef]
- Lu, C.Y.; Ma, J.A.; Chen, X.; Zhang, X.D.; Shi, Y.; Huang, B. Effect of Nitrogen Fertilizer and Maize Straw Incorporation on Nh4+-N-15 and No3--N-15 Accumulation in Black Soil of Northeast China among Three Consecutive Cropping Cycles. J. Soil Sci. Plant Nutr. 2010, 10, 443–453. [Google Scholar] [CrossRef] [Green Version]
- Omar, S.A.; Ismail, M.A. Microbial populations, ammonification and nitrification in soil treated with urea and inorganic salts. Folia Microbiol. 1999, 44, 205–212. [Google Scholar] [CrossRef]
- Zhang, H.; Li, Y.; Meng, Y.L.; Cao, N.; Li, D.S.; Zhou, Z.G.; Chen, B.L.; Dou, F.G. The effects of soil moisture and salinity as functions of groundwater depth on wheat growth and yield in coastal saline soils. J. Integr. Agric. 2019, 18, 2472–2482. [Google Scholar] [CrossRef]
- Ali, A.Y.A.; Ibrahim, M.E.H.; Zhou, G.S.; Zhu, G.L.; Elsiddig, A.M.I.; Suliman, M.S.E.; Elradi, S.B.M.; Salah, E.G.I. Interactive Impacts of Soil Salinity and Jasmonic Acid and Humic Acid on Growth Parameters, Forage Yield and Photosynthesis Parameters of Sorghum Plants. S. Afr. J. Bot. 2022, 146, 293–303. [Google Scholar] [CrossRef]
- Li, F.; Xie, Y.H.; Qin, Y.Y. Adaptive strategies of wetland plants in salt stress environment. Chin. J. Ecol. 2009, 28, 314–321. [Google Scholar]
- Shang, X.f. Effect of Salt Stress on Physiological Mechanism of Maize with Different Genotypes. Ph.D. Thesis, ShanDong Agriculture University, Tai’an, China, 2007. [Google Scholar]
- Zheng, S.y.; Shang, X.f.; Wang, L.y.; Zhang, X.l. Changes of physiological characteristics and yield of different salt-sensitive maize under salt stress. Agric. Res. Arid. Areas 2010, 28, 109–112. [Google Scholar] [CrossRef]
- Wei, J.M.; Jiang, Y.; Fu, M.M.; Zhang, Y.G.; Xu, Z.W. Effects of water addition and fertilization on soil nutrient contents and pH value of typical grassland in Inner Mongolia. Chin. J. Ecol. 2011, 30, 1642–1646. [Google Scholar] [CrossRef]
- Zhang, H.Y.; Zhao, Y.M. Effects of NaCl Stress on Seed Germination and Seedling Growth of Waxy Corn. Plant Physiol. Commun. 2010, 46, 291–293. [Google Scholar] [CrossRef]
- Ray, N.; Khaddar, V.K. A Study on the Effects of Soil-Salinity, Sodicity and Their Combinations on Early Seedling Growth in Wheat. J. Environ. Biol. 1995, 16, 193–199. [Google Scholar]
- Ghafoor, A.; Murtaza, G.; Rehman, M.Z.; Saifullah; Sabir, M. Reclamation and salt leaching efficiency for tile drained saline-sodic soil using marginal quality water for irrigating rice and wheat crops. Land Degrad. Dev. 2012, 23, 1–9. [Google Scholar] [CrossRef]
- Liu, Q.; Liu, B.J.; Zhang, Y.H.; Lin, Z.B.; Zhu, T.B.; Sun, R.B.; Wang, X.J.; Ma, J.; Bei, Q.C.; Liu, G.; et al. Can biochar alleviate soil compaction stress on wheat growth and mitigate soil N2O emissions? Soil Biol. Biochem. 2017, 104, 8–17. [Google Scholar] [CrossRef]
- Marosz, A. Effect of fulvic and humic organic acids and calcium on growth and chlorophyll content of tree species grown under salt stress. Dendrobiology 2009, 62, 47–53. [Google Scholar] [CrossRef]
Figure 1.
The sampling site and experimental design.


Table 1.
Characteristics of the soil.
| Parameter | Value |
|---|---|
| Sand | 67% |
| Silt | 27% |
| Clay | 6% |
| pH1:5 | 8.65 |
| Total salt | 0.7 g/kg |
| Bulk density | 1.3 g/cm3 |
| Organic matter | 10.35 g/kg |
| Total N | 0.957 g/kg |
| Available P | 11.8 mg/kg |
| Available K | 20 mg/kg |
Table 2.
The abbreviations of all treatments.
| Number | 1 | 2 | 3 | 4 | 5 | 6 | 7 | 8 | 9 | 10 | 11 | 12 |
|---|---|---|---|---|---|---|---|---|---|---|---|---|
| Treatment | N0S1 | N0S2 | N0S3 | N1S1 | N1S2 | N1S3 | N2S1 | N2S2 | N2S3 | N3S1 | N3S2 | N3S3 |
Note(s): S1, S2, and S3 represent 0.7, 1.7, and 2.7 g/kg soil salt content, respectively; N0, N1, N2, and N3 represent 0, 135, 270, and 405 kg/ha N (urea 46%) addition content, respectively.
Table 3.
Effects of nitrogen application on soil pH1:5 at different growth stages of winter wheat in various salinity level soils.
Table 3.
Effects of nitrogen application on soil pH1:5 at different growth stages of winter wheat in various salinity level soils.
| pH/Time | N Rate | 20 Days | 33 Days | 54 Days | ||||||
|---|---|---|---|---|---|---|---|---|---|---|
| S1 | S2 | S3 | S1 | S2 | S3 | S1 | S2 | S3 | ||
| Soil pH | N0 | 8.45 a | 8.407 ab | 8.40 ab | 8.60 a | 8.46 bc | 8.37 e | 8.59 def | 8.52 ef | 8.43 f |
| N1 | 8.40 ab | 8.33 bc | 8.24 cd | 8.48 d | 8.42 cd | 8.37 e | 8.65 cdef | 8.51 def | 8.43 ab | |
| N2 | 8.34 b | 8.23 cd | 8.18 d | 8.40 de | 8.36 e | 8.29 f | 8.64 ab | 8.47 ab | 8.41 cd | |
| N3 | 8.32 bc | 8.24 cd | 8.22 d | 8.37 e | 8.30 f | 8.28 f | 8.56 bc | 8.39 ab | 8.33 cde | |
| N rate | 0.000 | 0.000 | 0.001 | |||||||
| Salinity | 0.000 | 0.000 | 0.000 | |||||||
| N rate × salinity | 0.556 | 0.003 | 0.601 | |||||||
Note(s): N0, N1, N2, and N3 represent nitrogen fertilizer amounts of 0, 135, 270, 405 kg (N)/ha, S1, S2, and S3 represent soil salt content of 0.7, 1.7, 2.7 g/kg. Different letters in the same column indicate significant differences (p < 0.05) between the treatments.
Table 4.
Effects of nitrogen application rates on soil total N and soil NO3- in different growth stages of winter wheat in various salinity level soils.
Table 4.
Effects of nitrogen application rates on soil total N and soil NO3- in different growth stages of winter wheat in various salinity level soils.
| Soil N | N Rate | 20 Days | 33 Days | 54 Days | ||||||
|---|---|---|---|---|---|---|---|---|---|---|
| S1 | S2 | S3 | S1 | S2 | S3 | S1 | S2 | S3 | ||
| Total N (g/kg) | N0 | 0.92 cde | 0.904 e | 0.912 de | 0.933 c | 0.937 c | 0.926 c | 0.643 e | 0.617 e | 0.663 e |
| N1 | 0.94 c | 0.930 cd | 0.929 cd | 0.941 bc | 0.941 bc | 0.972 ab | 0.844 d | 0.847 d | 0.809 c | |
| N2 | 1.00 b | 1.04 a | 1.02 ab | 0.974 a | 0.972 ab | 0.974 a | 0.659 c | 0.844 b | 0.861 b | |
| N3 | 1.03 ab | 1.03 a | 1.02 ab | 0.989 a | 1.00 a | 0.997 a | 1.07 a | 1.075 a | 1.06 a | |
| N rate | 0.000 | 0.000 | 0.001 | |||||||
| Salinity | 0.000 | 0.595 | 0.033 | |||||||
| N rate × salinity | 0.556 | 0.520 | 0.005 | |||||||
| NO3− (mg/kg) | N0 | 13.6 d | 11.5 d | 12.4 d | 1.99 e | 2.68 e | 3.89 d | 1.25 a | 1.91 a | 1.95 a |
| N1 | 28.5 c | 31.7 c | 30.7 c | 14.8 c | 17.4 c | 17.4 c | 8.95 a | 8.96 a | 7.96 a | |
| N2 | 54.53 ab | 50.2 b | 48.3 b | 24.0 b | 29.8 b | 36.7 a | 19.0 a | 16.9 a | 19.0 a | |
| N3 | 66.8 a | 70.8 a | 60.5 ab | 44.5 a | 43.5 a | 45.1 a | 31.0 a | 31.0 a | 28.9 a | |
| N rate | 0.000 | 0.000 | 0.598 | |||||||
| Salinity | 0.642 | 0.001 | 0.775 | |||||||
| N rate × salinity | 0.771 | 0.132 | 0.998 | |||||||
Note(s): N0, N1, N2, and N3 represent nitrogen fertilizer amounts of 0, 135, 270, 405 kg/ha (N), S1, S2, and S3 represent soil salt content of 0.7, 1.7, 2.7 g/kg. Different letters in the same column indicate significant differences (p < 0.05) between the treatments.
Table 5.
Effects of nitrogen application rates with different soil salinity levels on chlorophyll content in different growth stages of winter wheat.
Table 5.
Effects of nitrogen application rates with different soil salinity levels on chlorophyll content in different growth stages of winter wheat.
| Parameter | N Rate | 20 Days | 33 Days | 54 Days | ||||||
|---|---|---|---|---|---|---|---|---|---|---|
| S1 | S2 | S3 | S1 | S2 | S3 | S1 | S2 | S3 | ||
| Chlorophyll content (mg/g) | N0 | 0.033 c | 0.097 b | 0.097 a | 0.299 a | 0.266 a | 0.232 a | 0.169 f | 0.216 e | 0.253 cd |
| N1 | 0.097 a | 0.097 a | 0.097 a | 0.242 a | 0.277 a | 0.276 a | 0.249 de | 0.292 abc | 0.329 a | |
| N2 | 0.096 a | 0.096 a | 0.097 a | 0.249 a | 0.239 a | 0.222 a | 0.250 de | 0.303 ab | 0.305 ab | |
| N3 | 0.097 a | 0.096 a | 0.096 a | 0.2263 a | 0.224 a | 0.242 a | 0.269 bcd | 0.326 a | 0.317 a | |
| N rate | 0.000 | 0.303 | 0.000 | |||||||
| Salinity | 0.000 | 0.844 | 0.000 | |||||||
| N rate × salinity | 0.000 | 0.659 | 0.255 | |||||||
Note(s): N0, N1, N2, and N3 show nitrogen fertilizer amounts of 0, 135, 270, 405 kg (N)/ha, S1, S2, and S3 show soil salt content of 0.7, 1.7, 2.7 g/kg. Different letters in the same column indicate significant differences (p < 0.05) between the treatments.
Table 6.
Total N of shoot and root in different growth stages of winter wheat.
| Total N (g/pot) | N Rate | 20 Days | 33 Days | 54 Days | ||||||
|---|---|---|---|---|---|---|---|---|---|---|
| S1 | S2 | S3 | S1 | S2 | S3 | S1 | S2 | S3 | ||
| Shoot | N0 | 0.034 d | 0.038 cd | 0.038 cd | 0.036 d | 0.038 cd | 0.040 bcd | 0.016 e | 0.018 de | 0.020 cde |
| N1 | 0.042 abc | 0.042 abc | 0.040 bcd | 0.050 abc | 0.045 abc | 0.043 bcd | 0.025 abcd | 0.027 abc | 0.028 ab | |
| N2 | 0.049 a | 0.043 abc | 0.044 abc | 0.044 a | 0.042 abc | 0.041 abc | 0.030 a | 0.031 a | 0.032 a | |
| N3 | 0.046 ab | 0.041 bcd | 0.039 bcd | 0.043 ab | 0.043 bcd | 0.040 bcd | 0.032 a | 0.032 a | 0.022 bcde | |
| N rate | 0.679 | 0.622 | 0.000 | |||||||
| Salinity | 0.684 | 0.267 | 0.922 | |||||||
| N rate × salinity | 0.356 | 0.030 | 0.147 | |||||||
| Root | N0 | 0.018 a | 0.019 a | 0.020 a | 0.010 c | 0.012 abc | 0.011 bc | 0.007 d | 0.007 d | 0.007 d |
| N1 | 0.019 a | 0.020 a | 0.018 a | 0.011 bc | 0.012 abc | 0.012 abc | 0.011 c | 0.012 bc | 0.014 ab | |
| N2 | 0.020 a | 0.016 a | 0.017 a | 0.0140 a | 0.011 bc | 0.011 bc | 0.016 a | 0.015 a | 0.015 a | |
| N3 | 0.019 a | 0.016 a | 0.020 a | 0.013 ab | 0.011 bc | 0.010 c | 0.015 a | 0.014 ab | 0.014 ab | |
| N rate | 0.679 | 0.622 | 0.000 | |||||||
| Salinity | 0.684 | 0.267 | 0.922 | |||||||
| N rate × salinity | 0.356 | 0.030 | 0.147 | |||||||
Note(s): N0, N1, N2, and N3 represent nitrogen fertilizer amounts of 0, 135, 270, 405 kg (N)/ha, S1, S2, and S3 represent soil salt content of 0.7, 1.7, 2.7 g/kg. Different letters in the same column indicate significant differences (p < 0.05) between the treatments.
Table 7.
Effects of nitrogen application rates with different soil salinity levels on Pseudo stem height (PSH) in different growth stages of winter wheat.
Table 7.
Effects of nitrogen application rates with different soil salinity levels on Pseudo stem height (PSH) in different growth stages of winter wheat.
| Parameter | N Rate | 20 Days | 33 Days | 54 Days | ||||||
|---|---|---|---|---|---|---|---|---|---|---|
| S1 | S2 | S3 | S1 | S2 | S3 | S1 | S2 | S3 | ||
| PSH (cm) | N0 | 5.74 abc | 5.08 cde | 5.08 de | 7.55 abcd | 7.26 abc | 7.02 abcd | 7.12 def | 6.99 ef | 6.92 f |
| N1 | 6.13 a | 5.51 abcd | 4.728 e | 7.24 abc | 7.22 abc | 6.85 bc | 7.18 cdef | 7.99 def | 8.07 ab | |
| N2 | 5.89 ab | 5.34 bce | 4.75 e | 7.26 abc | 7.18 abcd | 6.58 d | 8.09 ab | 7.51 ab | 7.63 cd | |
| N3 | 5.67 abcd | 5.43 cd | 4.79 e | 7.41 ab | 7.07 abcd | 6.71 cd | 8.34 bc | 7.46 ab | 7.25 cde | |
| N rate | 0.85 | 0.43 | 0.000 | |||||||
| Salinity | 0.000 | 0.002 | 0.16 | |||||||
| N rate × salinity | 0.55 | 0.95 | 0.00 | |||||||
Note(s): N0, N1, N2, and N3 represent nitrogen fertilizer amounts of 0, 135, 270, 405 kg (N)/ha, S1, S2, and S3 represent soil salt content of 0.7, 1.7, 2.7 g/kg. Different letters in the same column indicate significant differences (p < 0.05) between the treatments.
Table 8.
The dry weight of shoot in different growth stages of Winter Wheat under different salinity and N application rates.
Table 8.
The dry weight of shoot in different growth stages of Winter Wheat under different salinity and N application rates.
| Dry Weight (g/pot) | N Rate | 20 Days | 33 Days | 54 Days | ||||||
|---|---|---|---|---|---|---|---|---|---|---|
| S1 | S2 | S3 | S1 | S2 | S3 | S1 | S2 | S3 | ||
| Shoot | N0 | 0.023 ab | 0.020 bc | 0.022 abc | 0.079 abc | 0.066 cde | 0.076 abcd | 0.176 de | 0.195 bcde | 0.179 cde |
| N1 | 0.023 ab | 0.028 a | 0.021 bc | 0.080 abc | 0.083 ab | 0.067 cde | 0.234 abc | 0.225 abcd | 0.176 cde | |
| N2 | 0.026 ab | 0.025 ab | 0.021 abc | 0.090 a | 0.078 abcd | 0.059 e | 0.255 a | 0.247 ab | 0.204 abcd | |
| N3 | 0.022 abc | 0.021 bc | 0.017 c | 0.088 ab | 0.074 bcd | 0.064 de | 0.226 abcd | 0.213 abcd | 0.136 c | |
| N rate | 0.069 | 0.918 | 0.019 | |||||||
| Salinity | 0.074 | 0 | 0.003 | |||||||
| N rate × salinity | 0.519 | 0.041 | 0.457 | |||||||
| Root | N0 | 0.010 cd | 0.012 abcd | 0.009 d | 0.041 a | 0.031 a | 0.035 a | 0.097 abc | 0.103 ab | 0.106 a |
| N1 | 0.010 cd | 0.013 abcd | 0.013 abc | 0.035 a | 0.033 a | 0.032 a | 0.105 a | 0.087 abcde | 0.058 ef | |
| N2 | 0.009 d | 0.013 abc | 0.014 ab | 0.037 a | 0.040 a | 0.033 a | 0.108 a | 0.091 abcd | 0.062 def | |
| N3 | 0.010 bcd | 0.0120 bcd | 0.014 a | 0.042 a | 0.038 a | 0.036 a | 0.074 bcdef | 0.070 cdef | 0.045 f | |
| N rate | 0.175 | 0.501 | 0.001 | |||||||
| Salinity | 0.007 | 0.341 | 0.002 | |||||||
| N rate × salinity | 0.35 | 0.851 | 0.193 | |||||||
Note(s): N0, N1, N2, and N3 represent nitrogen fertilizer amounts of 0, 135, 270, 405 kg (N)/ha, S1, S2, and S3 represent soil salt content of 0.7, 1.7, 2.7 g/kg. Different letters in the same column indicate significant differences (p < 0.05) between the treatments.
Publisher’s Note: MDPI stays neutral with regard to jurisdictional claims in published maps and institutional affiliations. |
© 2022 by the authors. Licensee MDPI, Basel, Switzerland. This article is an open access article distributed under the terms and conditions of the Creative Commons Attribution (CC BY) license (https://creativecommons.org/licenses/by/4.0/).
Share and Cite
MDPI and ACS Style
Sun, Y.; Chen, X.; Shan, J.; Xian, J.; Cao, D.; Luo, Y.; Yao, R.; Zhang, X. Nitrogen Mitigates Salt Stress and Promotes Wheat Growth in the Yellow River Delta, China. Water 2022, 14, 3819. https://doi.org/10.3390/w14233819
AMA Style
Sun Y, Chen X, Shan J, Xian J, Cao D, Luo Y, Yao R, Zhang X. Nitrogen Mitigates Salt Stress and Promotes Wheat Growth in the Yellow River Delta, China. Water. 2022; 14(23):3819. https://doi.org/10.3390/w14233819
Chicago/Turabian StyleSun, Yunpeng, Xiaobing Chen, Jingjing Shan, Jingtian Xian, Dan Cao, Yongming Luo, Rongjiang Yao, and Xin Zhang. 2022. "Nitrogen Mitigates Salt Stress and Promotes Wheat Growth in the Yellow River Delta, China" Water 14, no. 23: 3819. https://doi.org/10.3390/w14233819
Note that from the first issue of 2016, this journal uses article numbers instead of page numbers. See further details here.