
Evaluation of Adaptive Utilization Capacity of Water Resources and Analysis of Driving Element: A Case Study of Tarim River Basin

Abstract
:1. Introduction
2. Theoretical System of AUWR
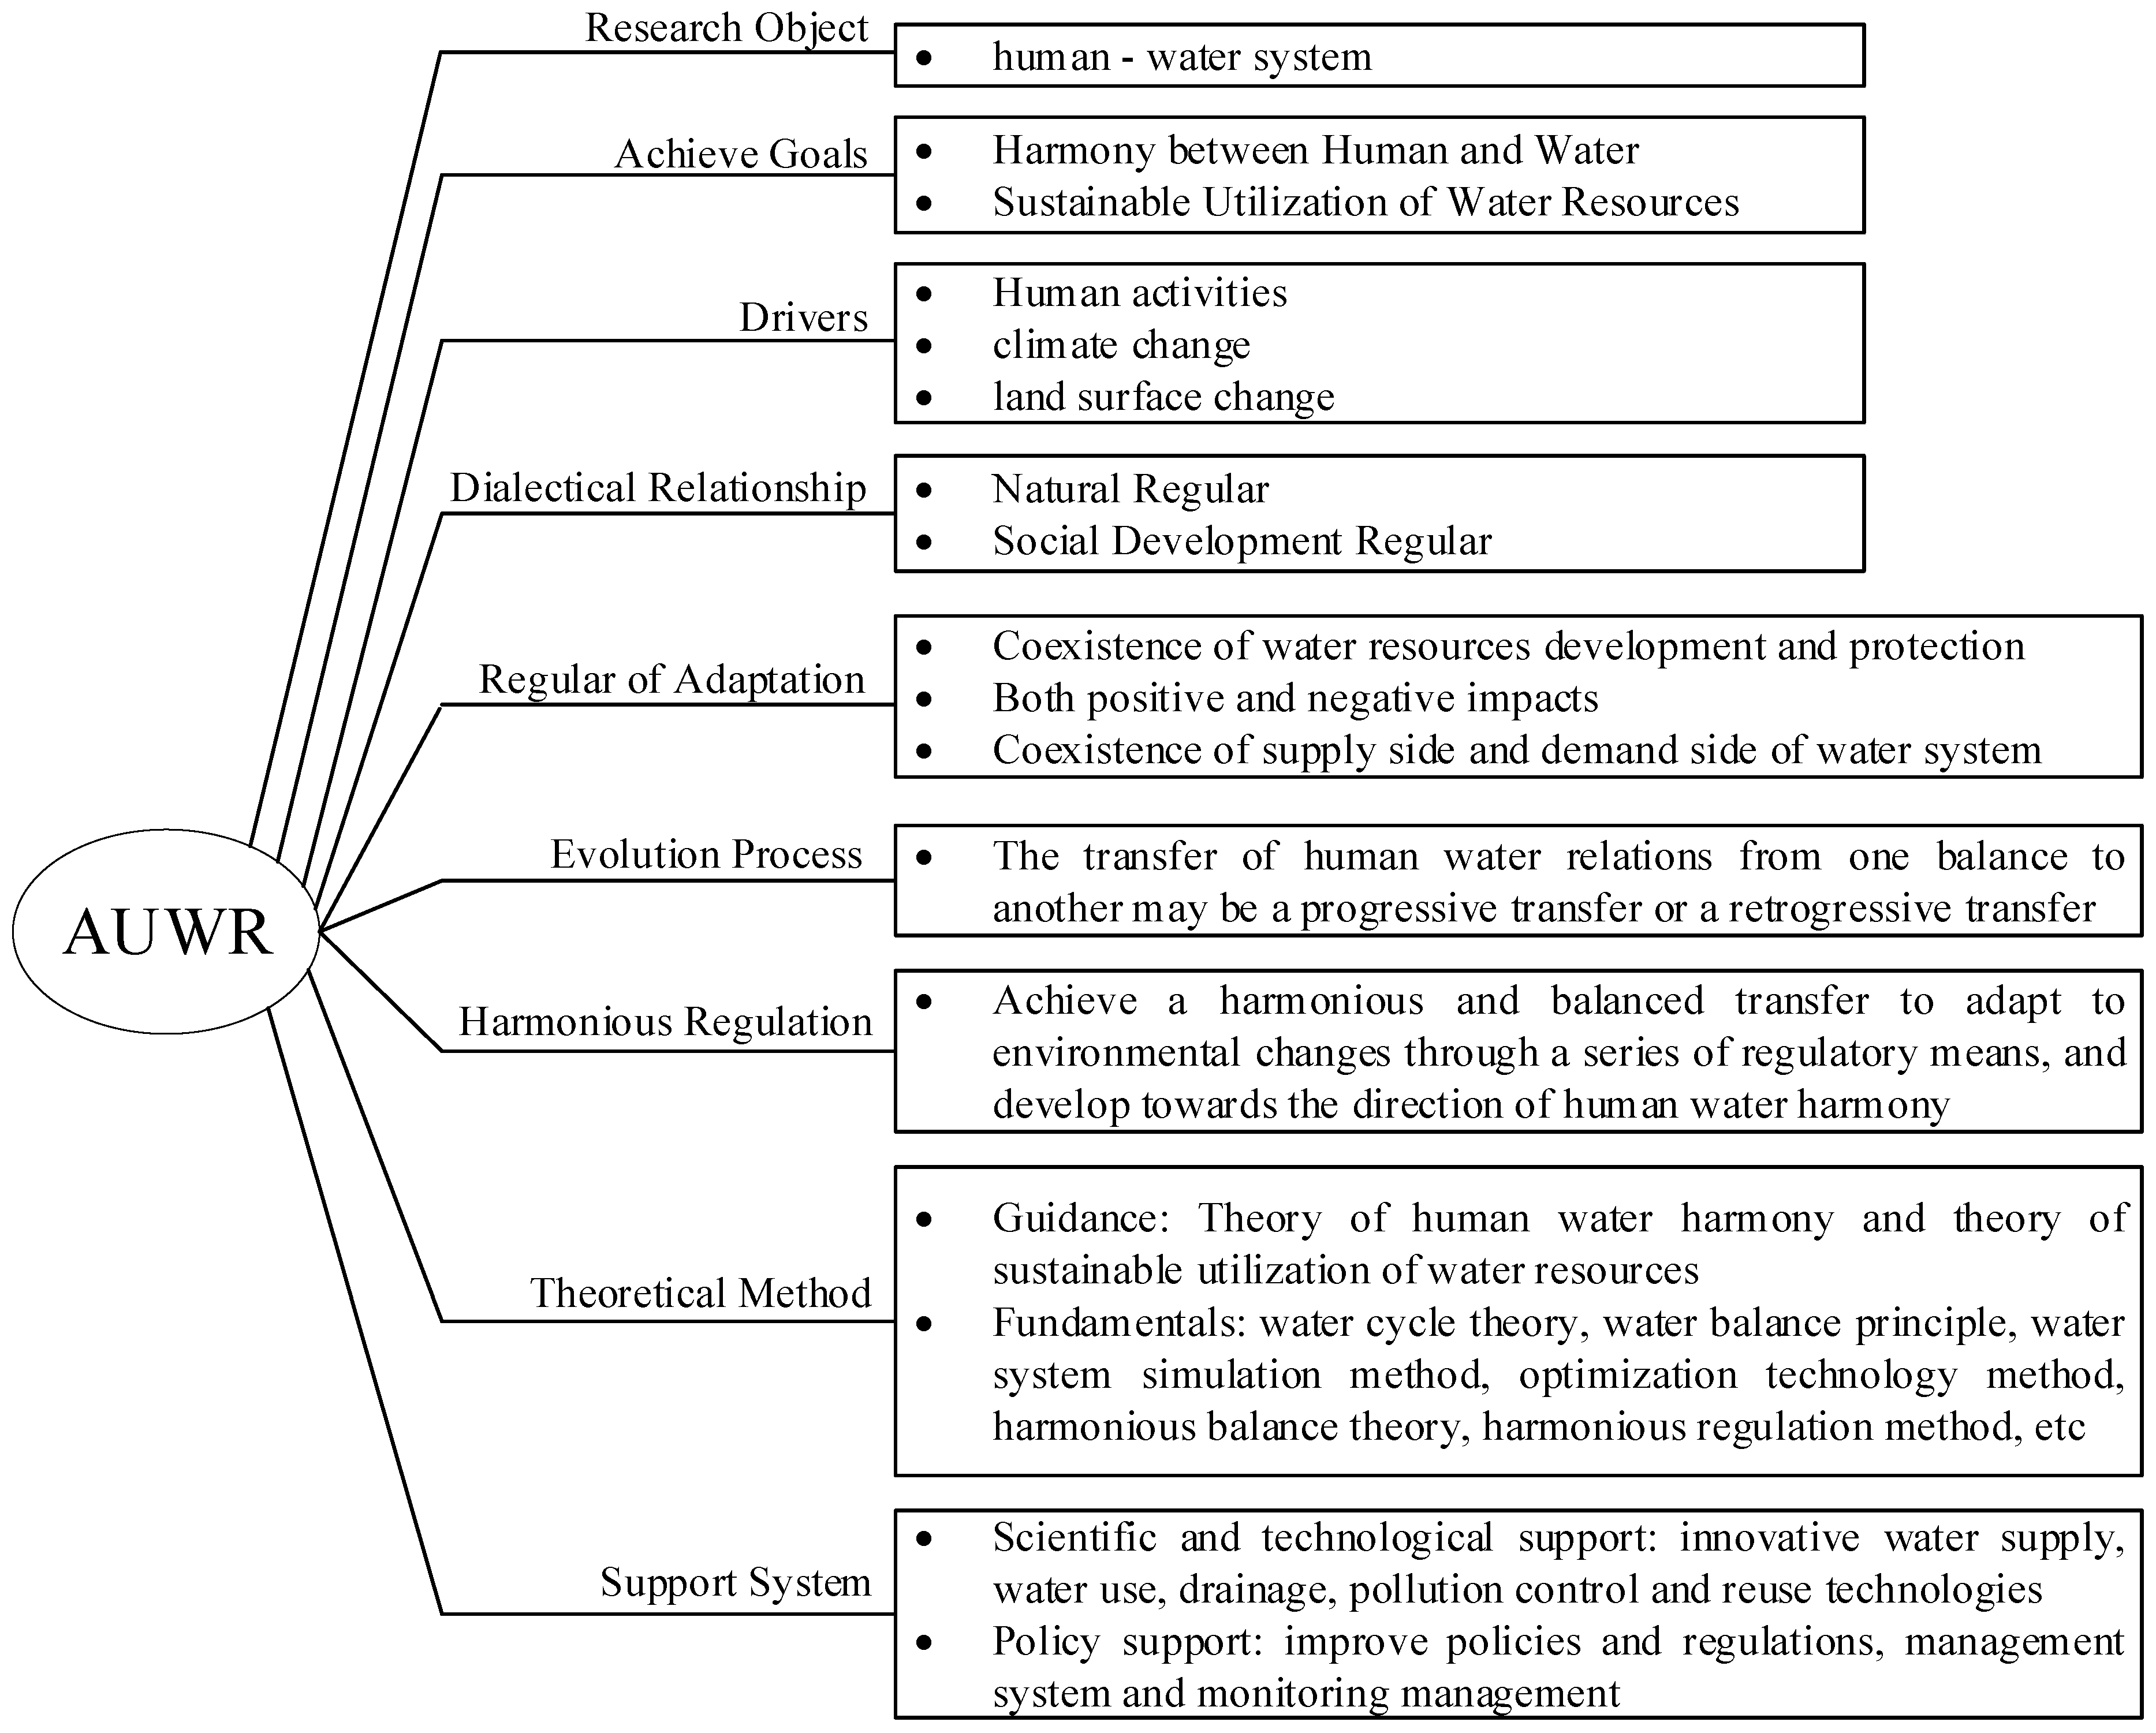
2.1. Theoretical of AUWR
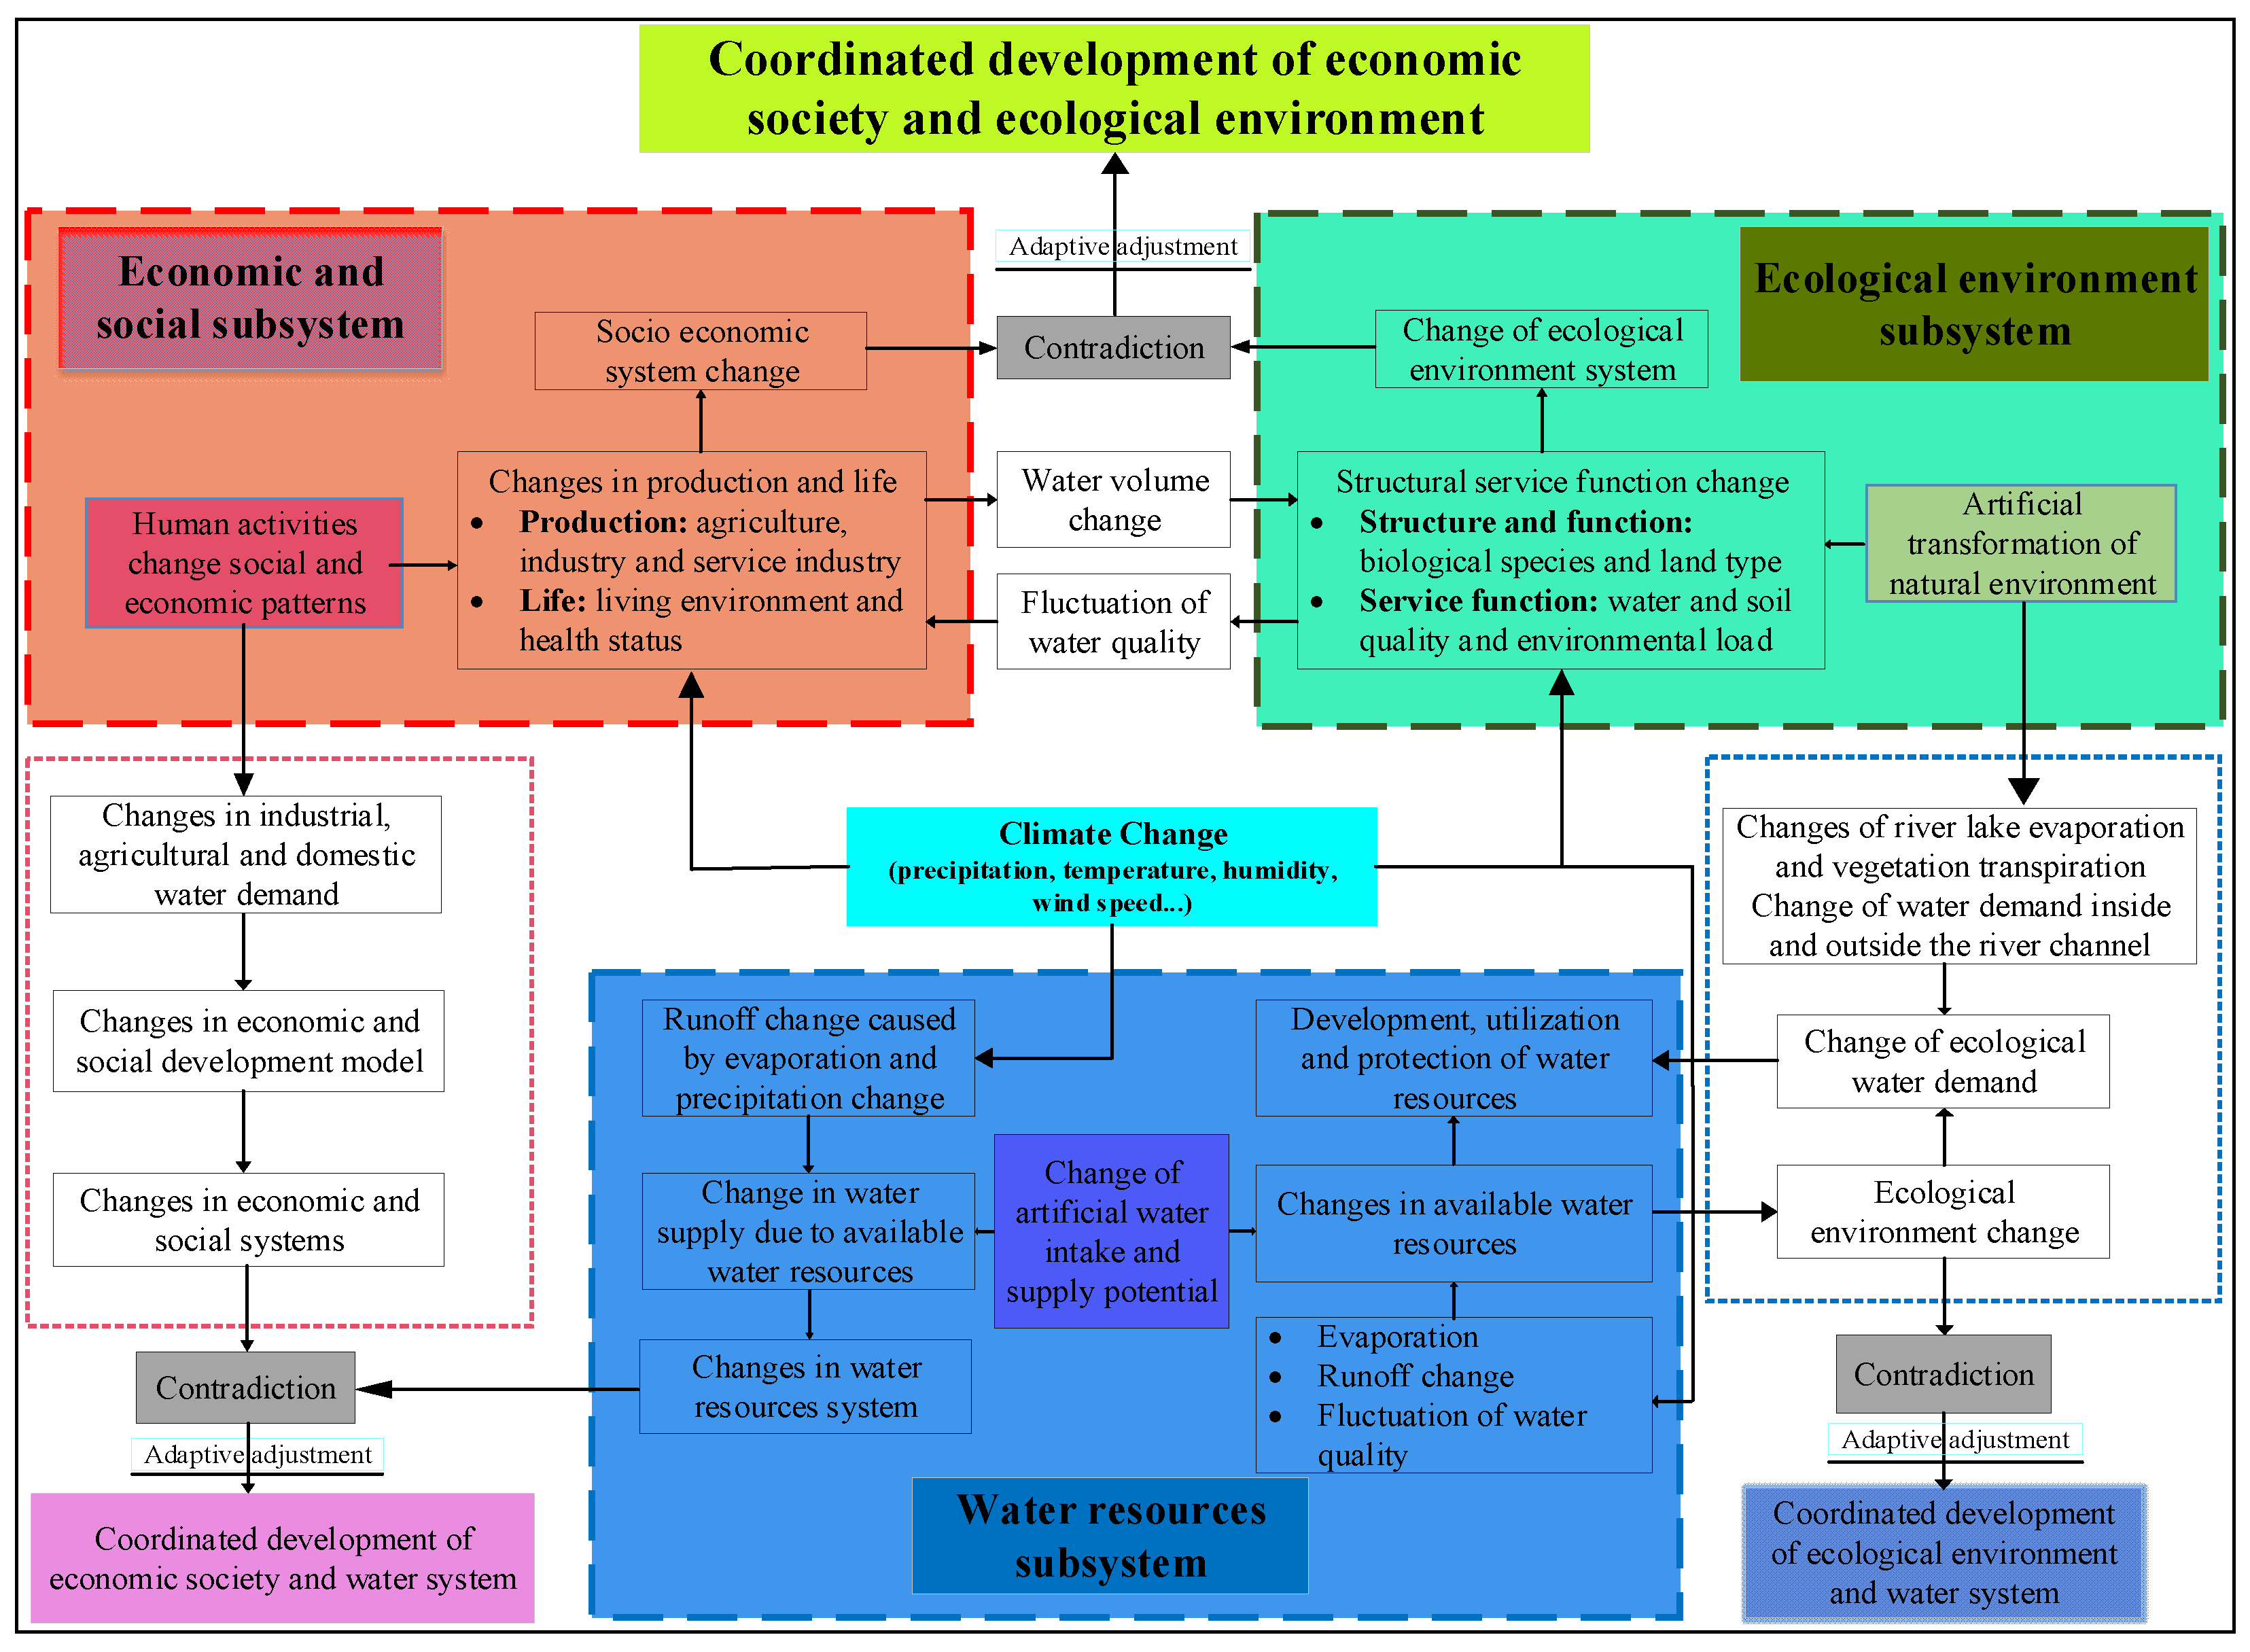
2.2. Mechanism of AUWR
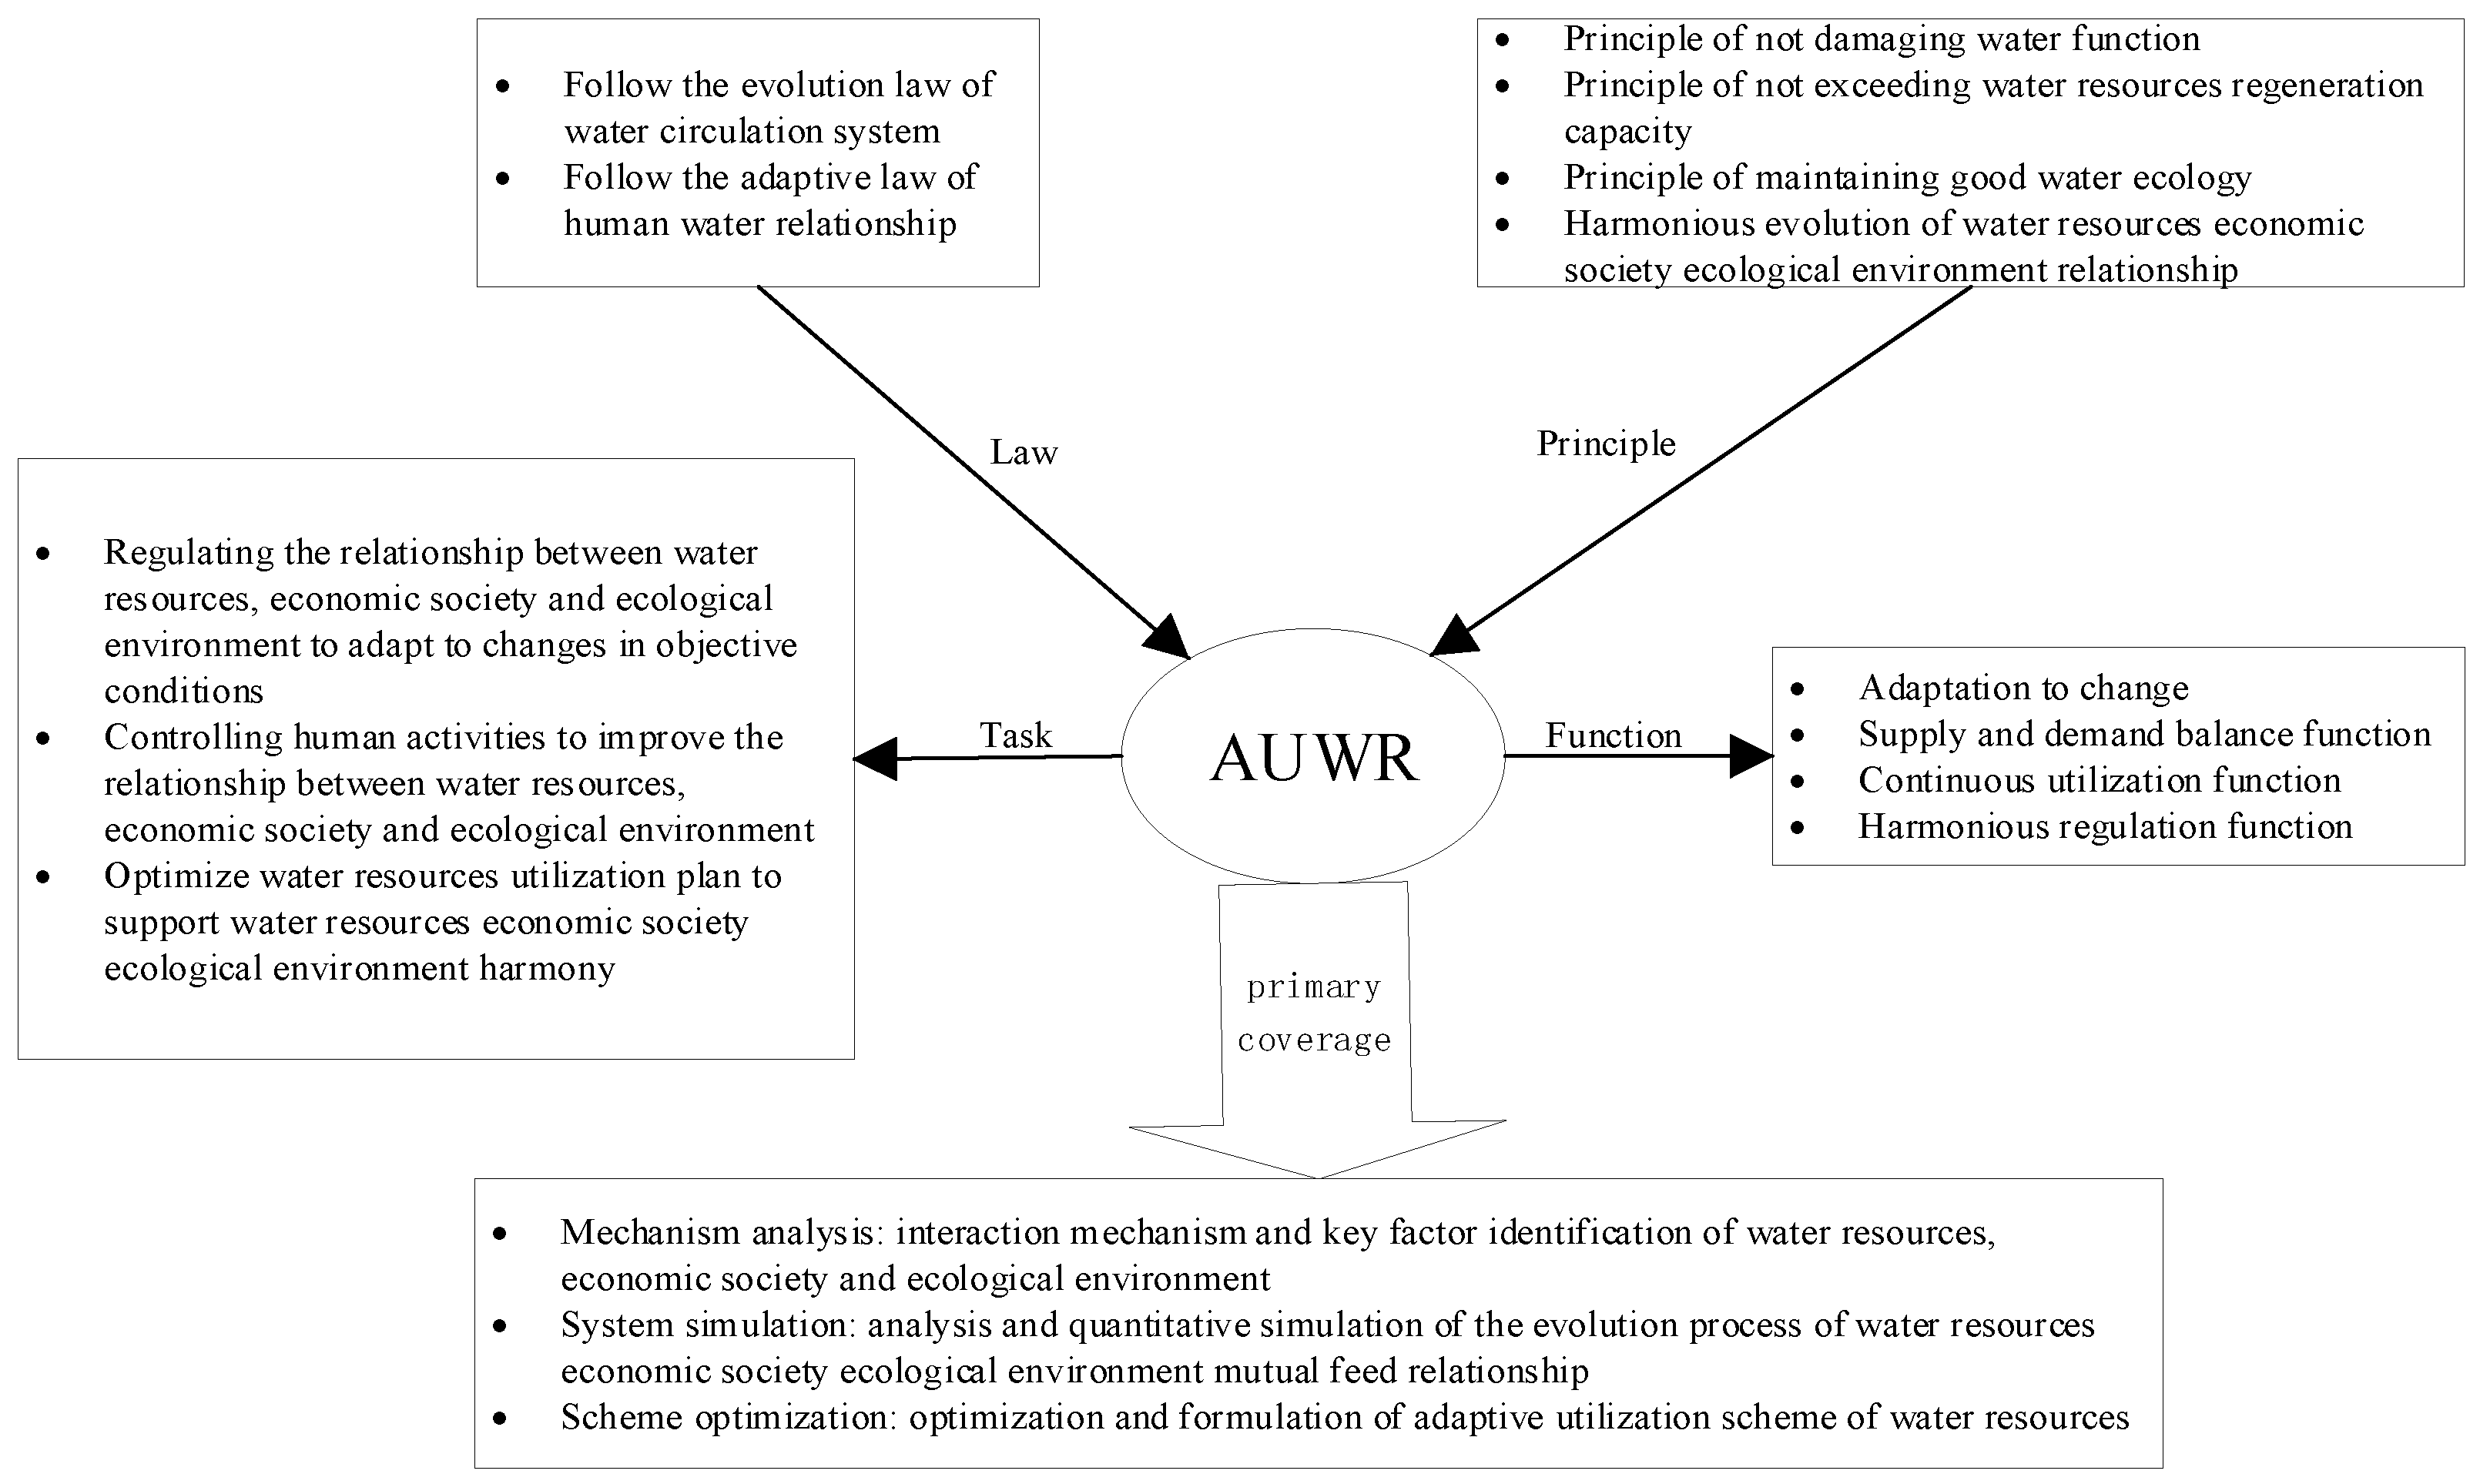
2.3. Framework of Application Rules for AUWR
3. Materials and Methods
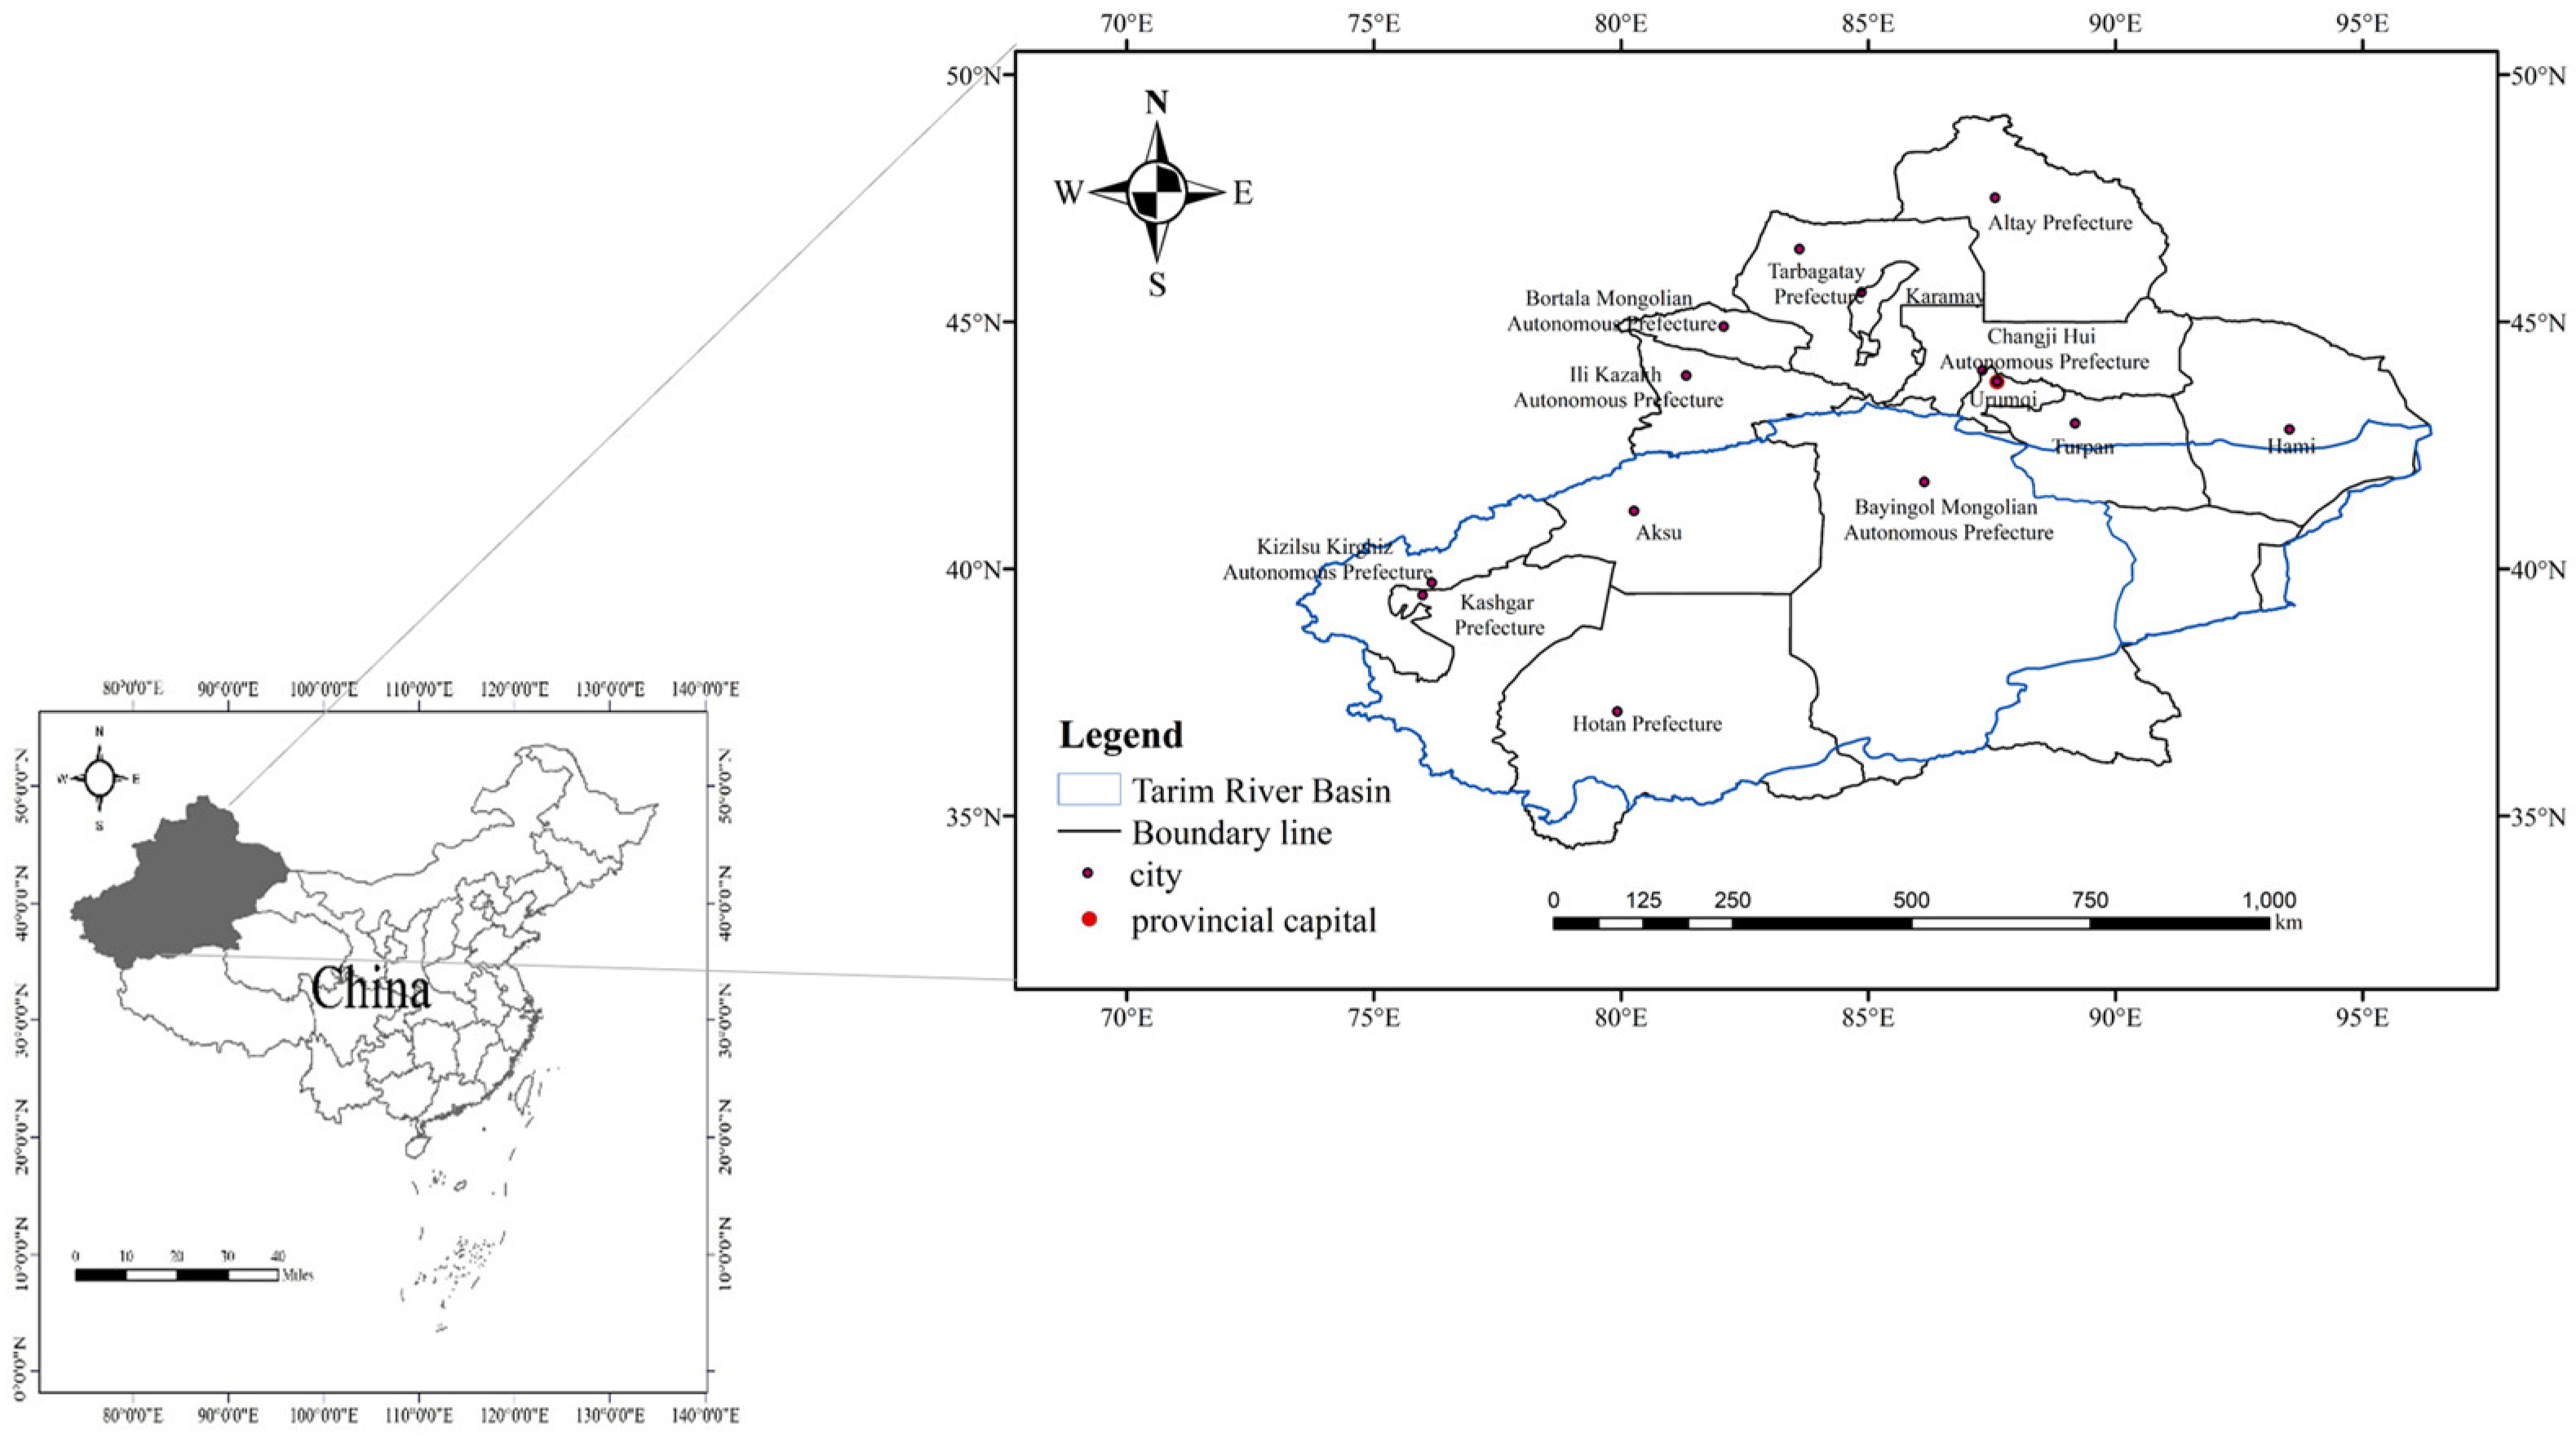
3.1. Study Area
3.2. Constructing the Framework of the Element System
3.3. Methods
3.3.1. Calculate Element Weights
- 1.
- The data are standardized and normalized.
- 2.
- Seek the information entropy of indicators
- 3.
- Determine the weight:
3.3.2. Harmony Methods
- 1.
- Single-indicator quantification: It includes quantitative and qualitative indicators, and each indicator has a harmonious degree (called SHD) with the value range of [0, 1]. In order to facilitate calculation and comparative analysis, the quantitative description of single indicator harmony can be quantified by using segmented linear affiliation function quantification method for positive indicators, negative indicators, and bidirectional indicators respectively, and mapping each indicator to [0, 1] uniformly. Among them, the harmony degree of positive and negative indicators is calculated as follows [42].
- 2.
- Multi-indicator synthesis: it can be calculated by multi-indicator weighting method, according to the single indicator affiliation weighted by the weight.
- 3.
- Multi-criteria integration: It can be calculated using a weighted average or index weighting method.
3.3.3. Comprehensive Co-Evolution Model Methods
- 1.
- Division of criterion layers and determination of weights
- 2.
- Calculation of absolute adaptability of factors
- 3.
- Calculation of the relative fitness of factors
- 4.
- Factor adaptation calculation
- 5.
- Calculation of AUCWR
3.3.4. Obstacle Degree Model Methods
3.4. Data Sources
4. Results
4.1. Element Thresholds and Weights
4.1.1. Element Thresholds
4.1.2. Element Weights
4.2. Evaluation of AUCWR
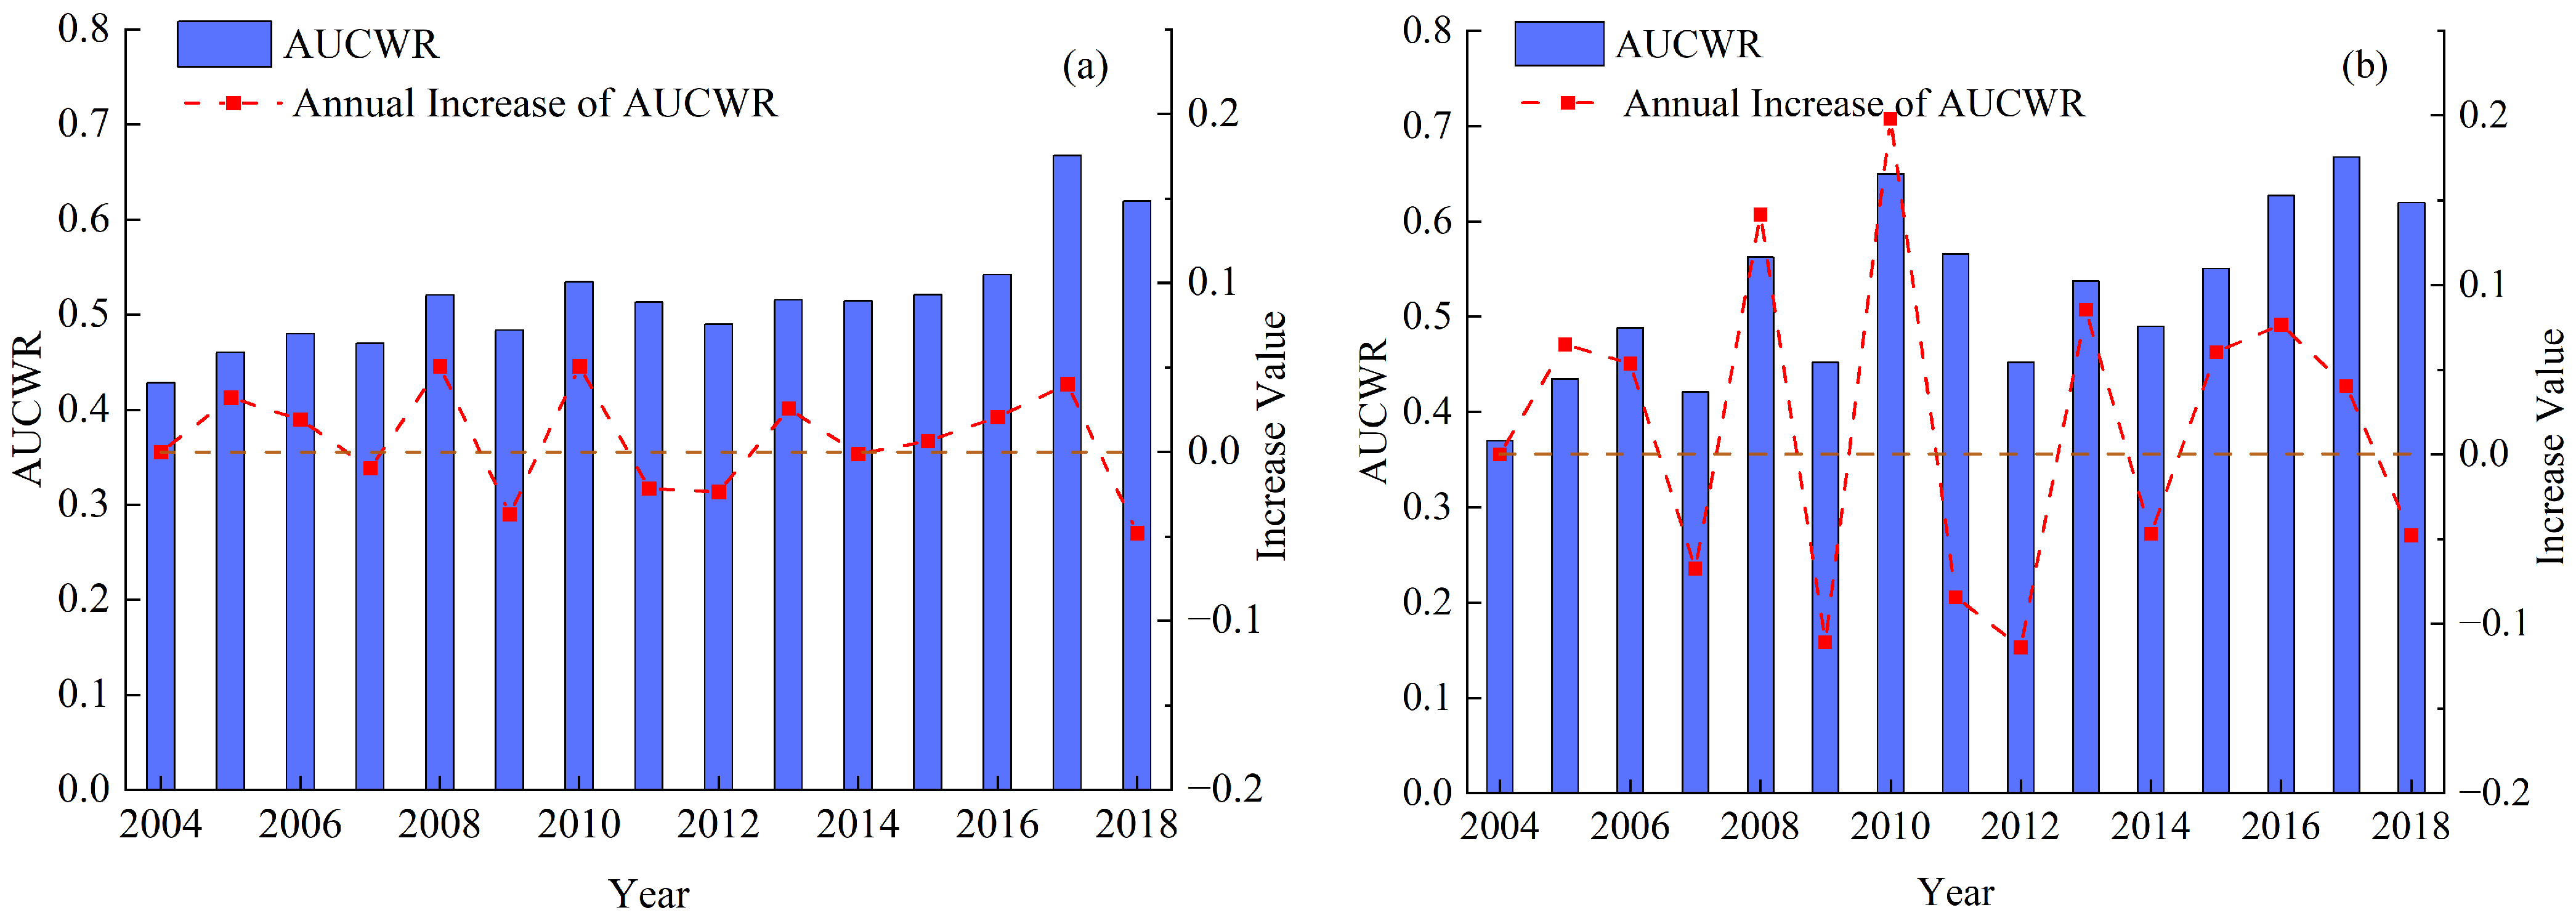
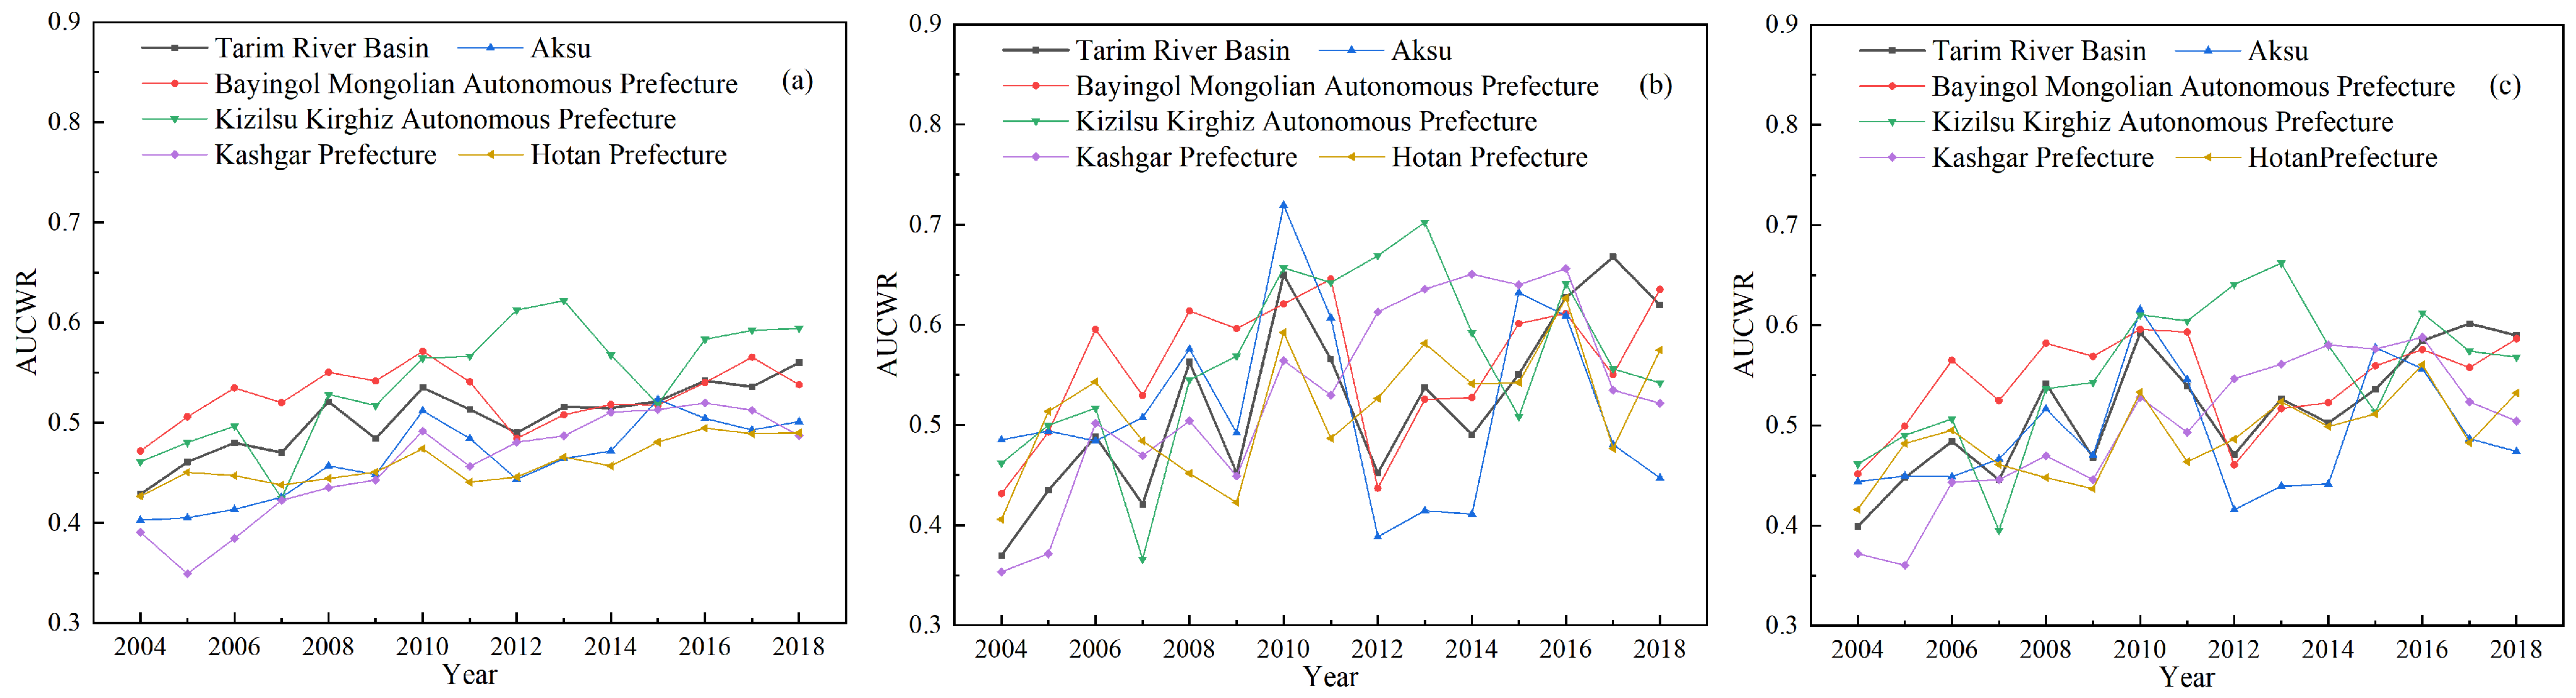
4.2.1. Temporal and Spatial Variation Characteristics of AUCWR in TRB
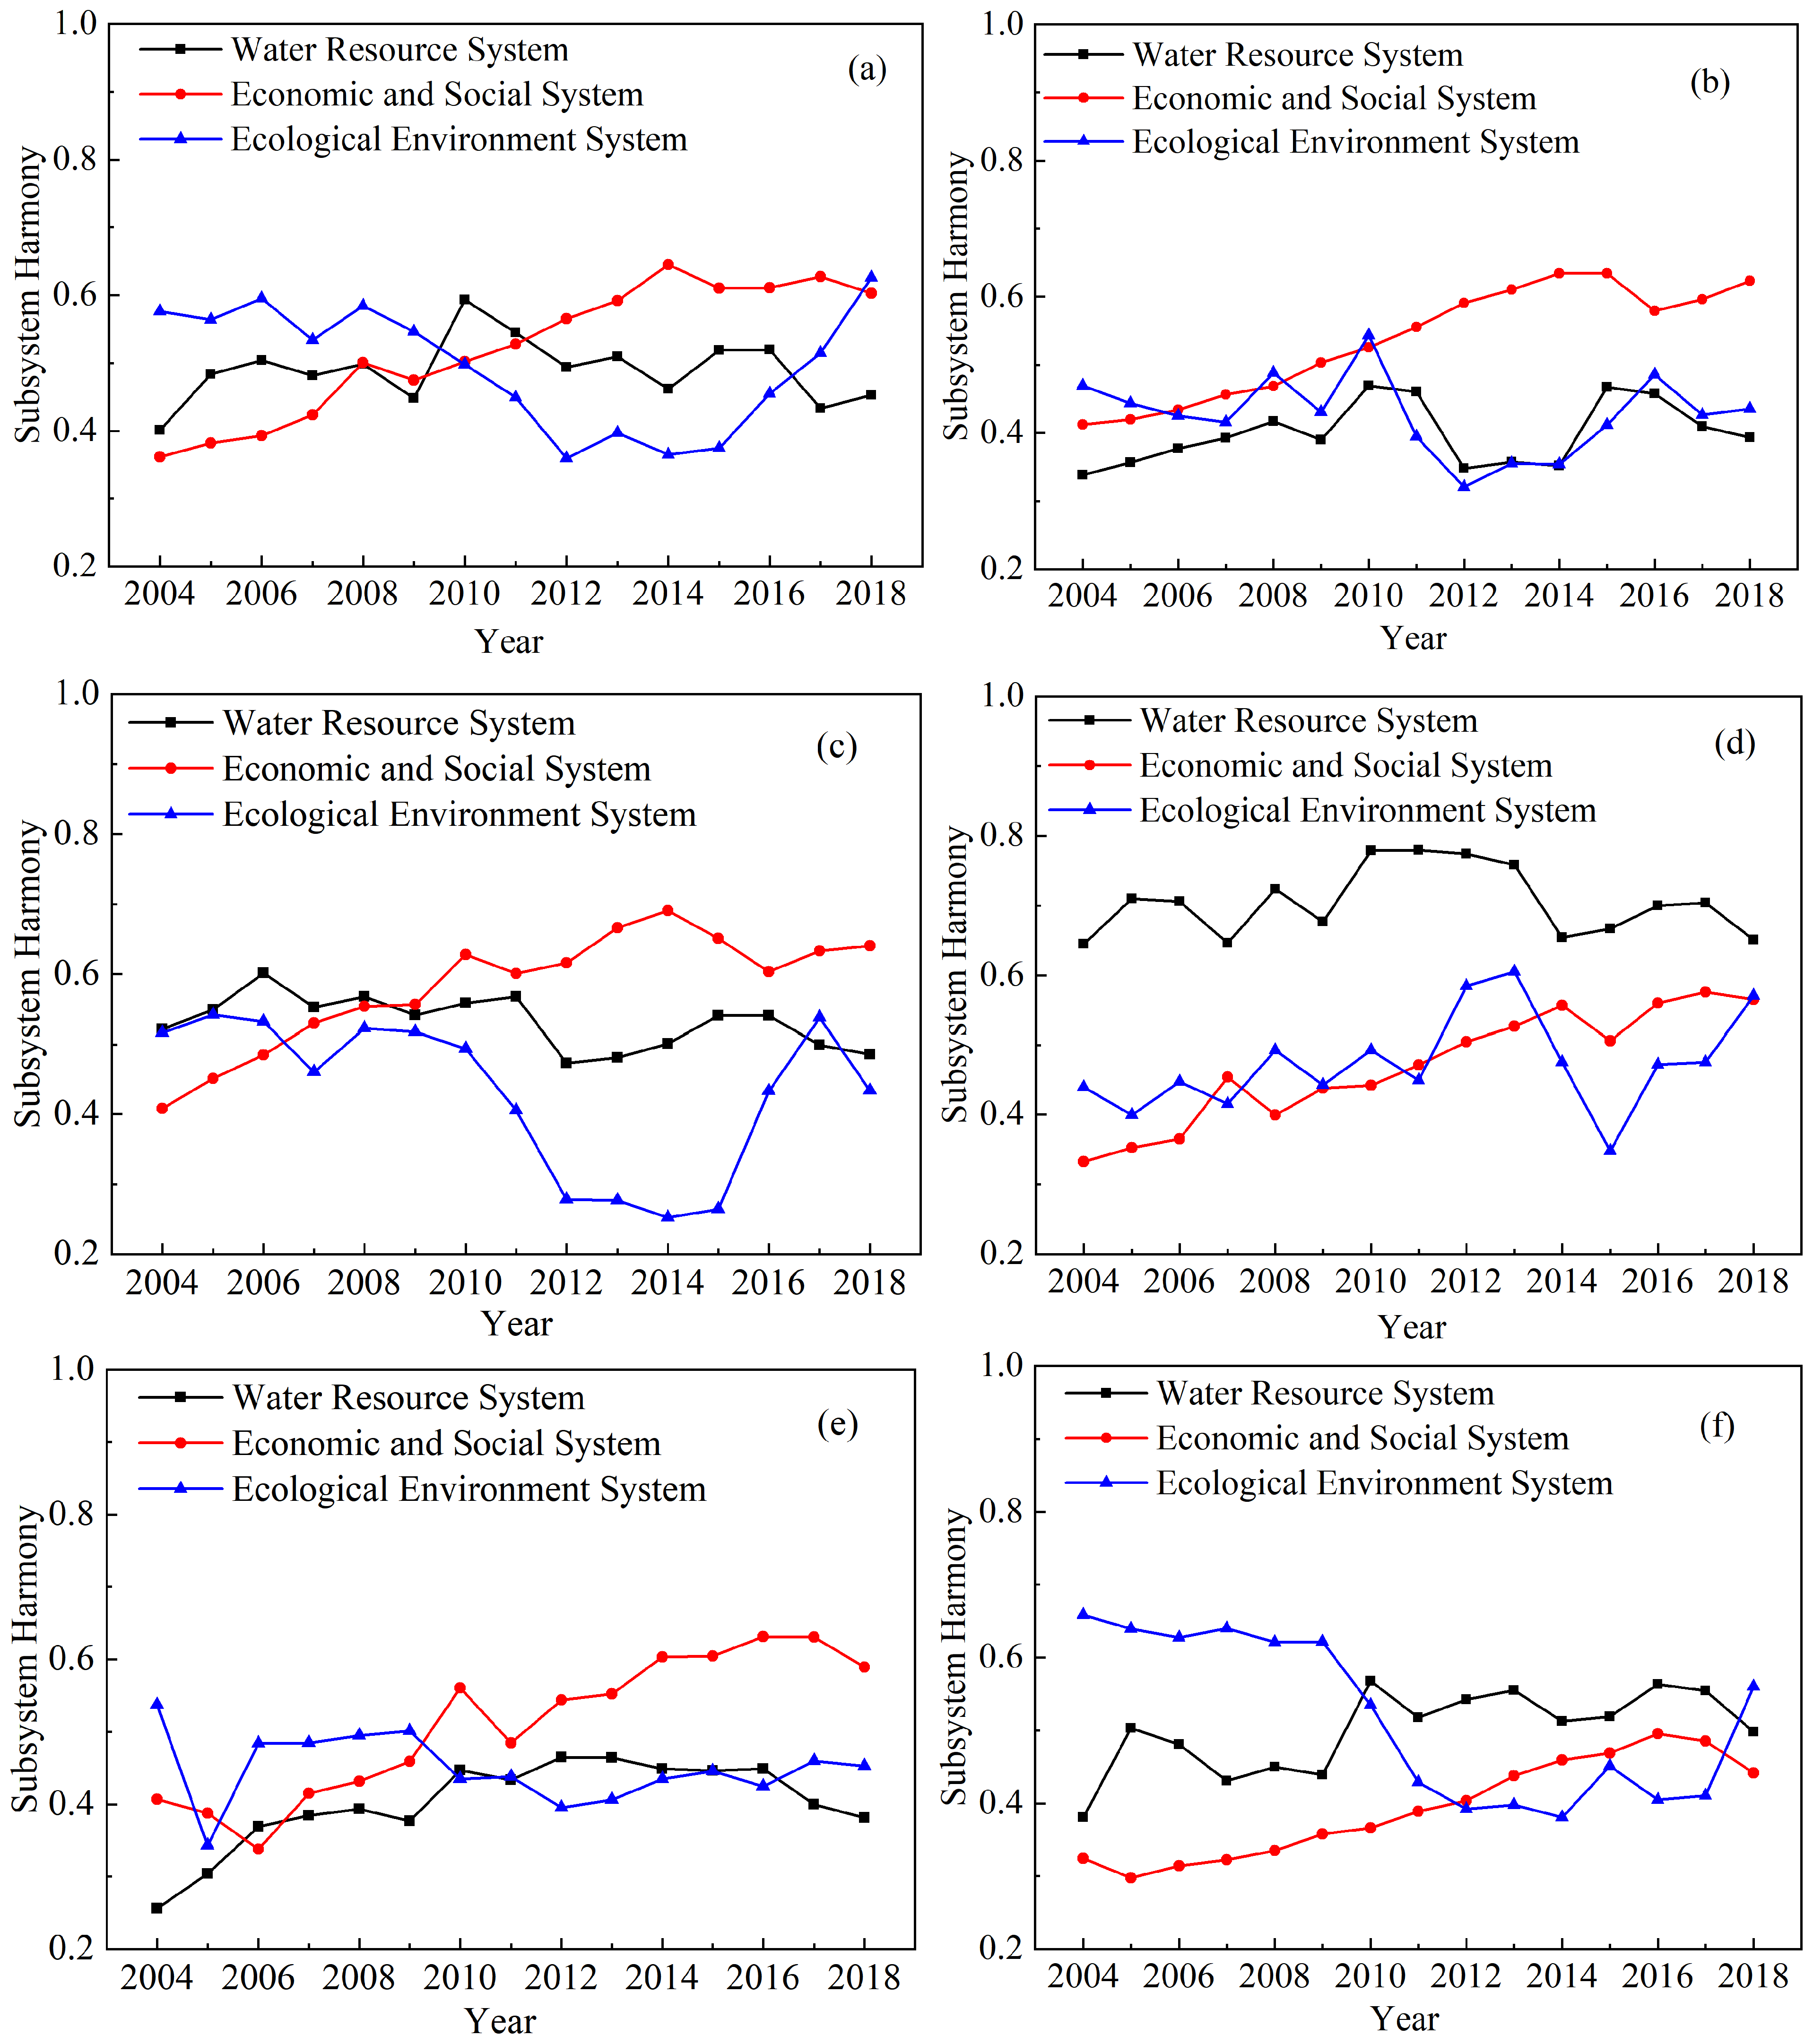
4.2.2. Temporal and Spatial Variation Characteristics of System Adaptability in TRB
4.3. Element Analysis
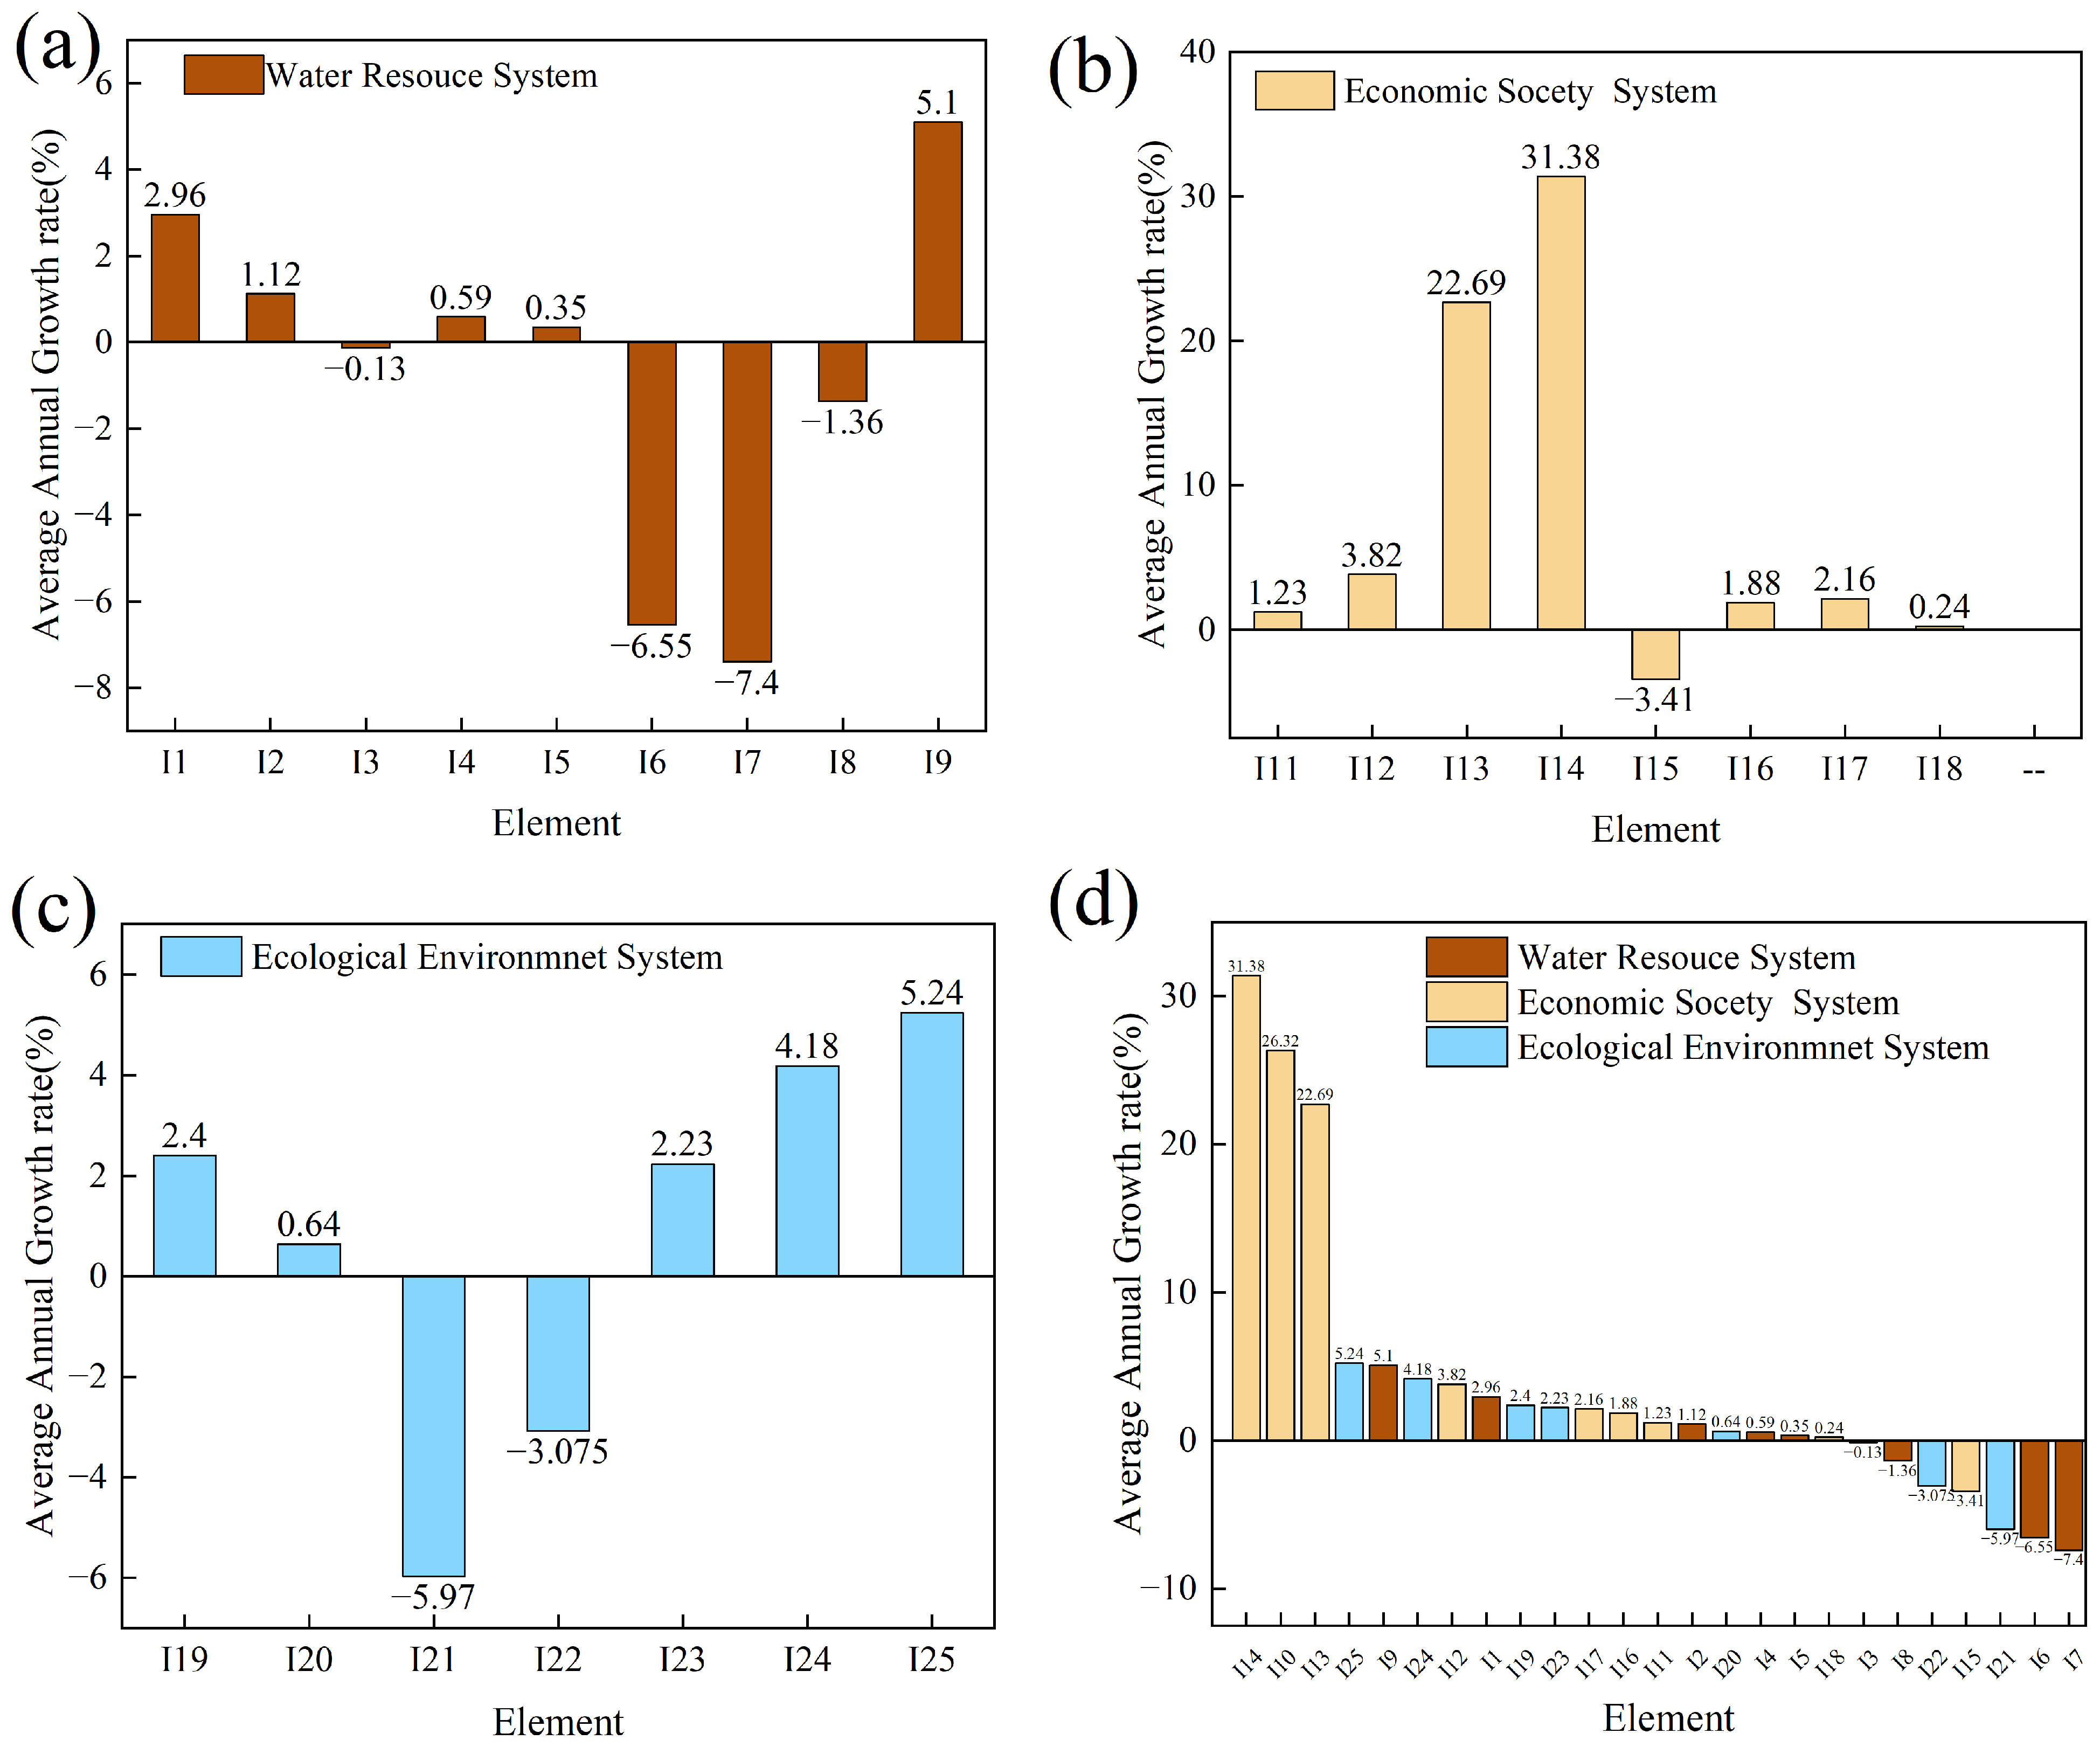
4.3.1. Analysis of Element Change Characteristics
4.3.2. Element Sensitivity Analysis
5. Discussion
6. Conclusions
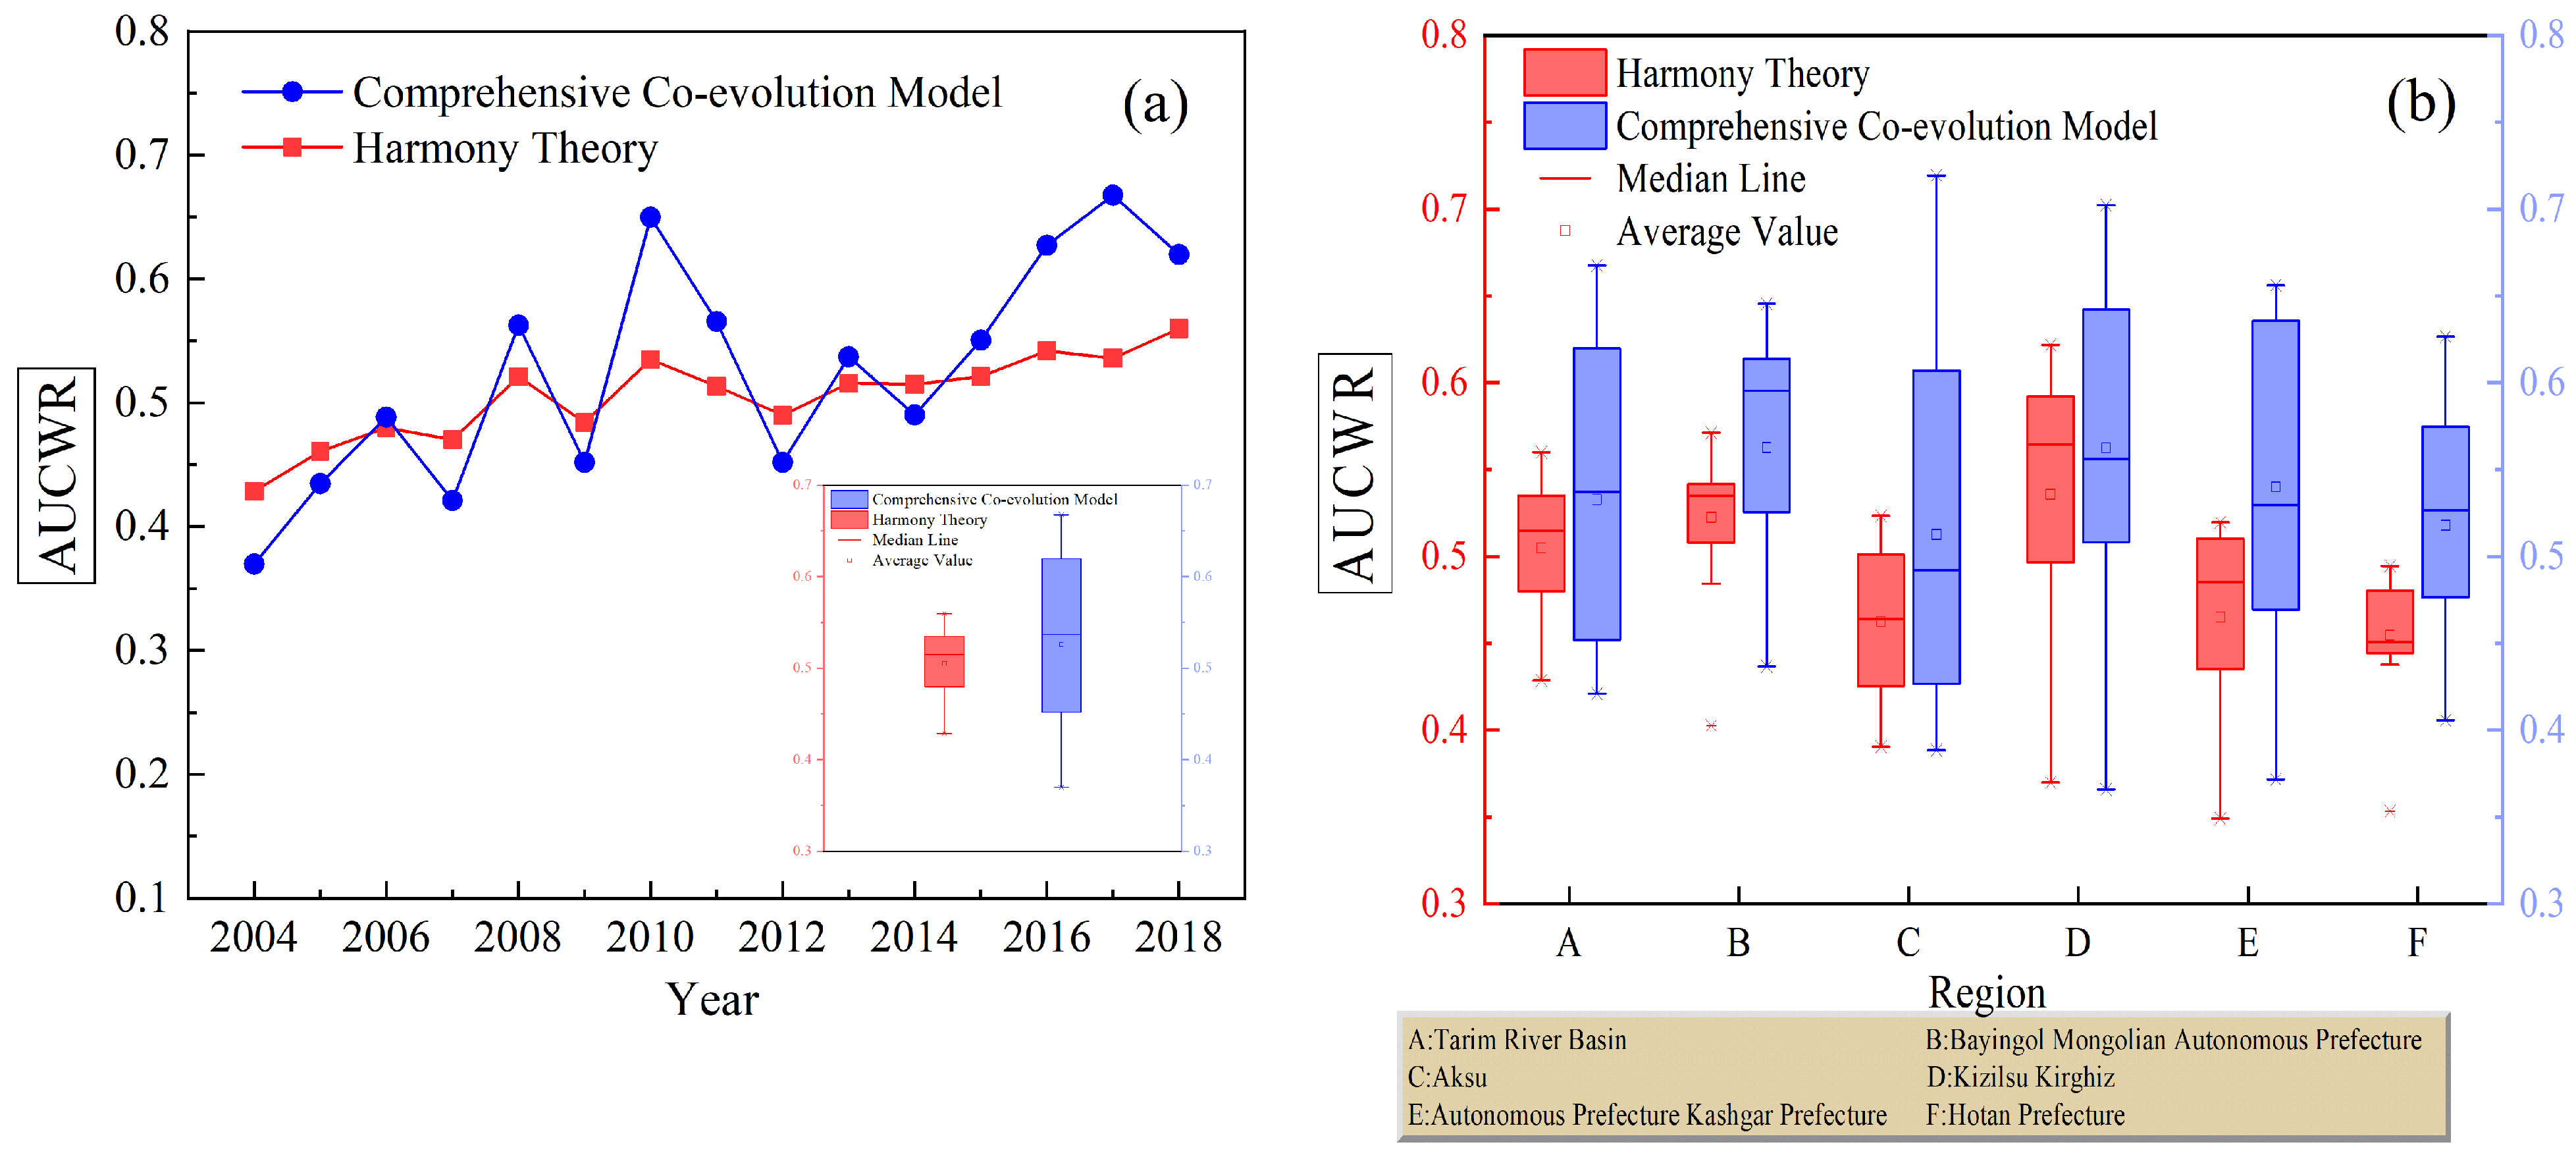
- (1)
- The AUCWR in the TRB demonstrates a fluctuating upward trend from 2004 to 2018 (the harmony theory method assessment results: from 0.43 in 2004 to 0.56 in 2018, with a growth rate of 30.23%; the comprehensive co-evolutionary model method assessment results: from 0.37 in 2004 to 0.62 in 2018, with a significant increase of 67.57%). The development trend is good, but the current level of AUCWR in the TRB is still not high, and there is a lot of room for improvement.
- (2)
- There are differences in the adaptability of subsystems in the TRB, mainly in that the adaptability of the water resources subsystem changes less, the economic and social subsystem increases significantly, and the ecological environment subsystem indicates a decreasing and then increasing trend. The trend of subsystem adaptations in BMAP, Aksu, KP, and HP is consistent with that of TRB, the adaptations of water resources and economic and social subsystems are increasing, while the adaptations of ecological environment subsystems are decreasing. While the adaptations of water resources, economic and social subsystems, and ecological environment subsystems in KP are increasing.
- (3)
- By analyzing the factors, the change characteristics of each factor and the degree of influence on the AUCWR are obtained. Among them, the indicators with large changes from 2004 to 2018 are mainly: water consumption per 10,000 yuan of industrial added value (I7), per capita domestic water consumption (I9), water consumption of 10,000 yuan of GDP (I6), per capita net income of rural residents (I14), per capita GDP (I10), per capita disposable income of urban residents (I13), ecological environment water consumption rate (I21), and fertilizer application intensity (I25). While the analysis of the barrier degree model obtained that the economic and social subsystem had the largest barrier degree with a mean value of 51.45% at subsystem level. From the perspective of indicators, indicators such as per capita GDP (I10), the proportion of non-agricultural output value in GDP (I11), per capita net income of rural residents (I14), population density (I16), and water popularization rate of urban population (I18).
Author Contributions
Funding
Institutional Review Board Statement
Informed Consent Statement
Data Availability Statement
Acknowledgments
Conflicts of Interest
References
- Wang, W.; Tang, D.; Pilgrim, M.; Liu, J. Water Resources Compound Systems: A Macro Approach to Analysing Water Resource Issues under Changing Situations. Water 2016, 8, 2. [Google Scholar] [CrossRef] [Green Version]
- Rezaee, A.; Bozorg-Haddad, O.; Chu, X. Reallocation of water resources according to social, economic, and environmental parameters. Sci. Rep. 2021, 11, 17514. [Google Scholar] [CrossRef]
- Honkonen, T. Water Security and Climate Change: The Need for Adaptive Governance. Potchefstroom Electron. Law J. 2017, 20, 1–26. [Google Scholar] [CrossRef] [Green Version]
- Liu, L. Assessment of water resource security in karst area of Guizhou Province, China. Sci. Rep. 2021, 11, 7641. [Google Scholar] [CrossRef]
- Li, D.; Zuo, Q.; Wu, Q.; Li, Q.; Ma, J. Achieving the tradeoffs between pollutant discharge and economic benefit of the Henan section of the South-to-North Water Diversion Project through water resources-environment system management under uncertainty. J. Clean. Prod. 2021, 321, 128857. [Google Scholar] [CrossRef]
- Li, D.; Zuo, Q.; Zhang, Z. A new assessment method of sustainable water resources utilization considering fairness-efficiency-security: A case study of 31 provinces and cities in China. Sustain. Cities Soc. 2022, 81, 103839. [Google Scholar] [CrossRef]
- Zeng, X.T.; Huang, G.H.; Yang, X.L.; Wang, X.; Fu, H.; Li, Y.P.; Li, Z. A developed fuzzy-stochastic optimization for coordinating human activity and eco-environmental protection in a regional wetland ecosystem under uncertainties. Ecol. Eng. 2016, 97, 207–230. [Google Scholar] [CrossRef]
- Zeng, X.; Xiang, H.; Liu, J.; Xue, Y.; Zhu, J.; Xu, Y. Identification of Policies Based on Assessment-Optimization Model to Confront Vulnerable Resources System with Large Population Scale in a Big City. Int. J. Environ. Res. Public Health 2021, 18, 13097. [Google Scholar] [CrossRef]
- Kundzewicz, Z.W. Water resources for sustainable development. Hydrol. Sci. J. 1997, 42, 467–480. [Google Scholar] [CrossRef]
- Wang, J.; Xiao, W.; Wang, H.; Chai, Z.; Niu, C.; Li, W. Integrated simulation and assessment of water quantity and quality for a river under changing environmental conditions. Chin. Sci. Bull. 2013, 58, 3340–3347. [Google Scholar] [CrossRef]
- He, Y.; Yang, J.; Chen, X.; Lin, K.; Zheng, Y.; Wang, Z. A Two-stage Approach to Basin-scale Water Demand Prediction. Water Resour. Manag. 2018, 32, 401–416. [Google Scholar] [CrossRef]
- Wheater, H.S.; Gober, P. Water security and the science agenda. Water Resour. Res. 2015, 51, 5406–5424. [Google Scholar] [CrossRef]
- Montanari, A.; Young, G.; Savenije, H.H.G.; Hughes, D.; Wagener, T.; Ren, L.L.; Koutsoyiannis, D.; Cudennec, C.; Toth, E.; Grimaldi, S.; et al. “Panta Rhei—Everything Flows”: Change in hydrology and society—The IAHS Scientific Decade 2013–2022. Hydrol. Sci. J. 2013, 58, 1256–1275. [Google Scholar] [CrossRef]
- Ha, T.P.; Dieperink, C.; Dang Tri, V.P.; Otter, H.S.; Hoekstra, P. Governance conditions for adaptive freshwater management in the Vietnamese Mekong Delta. J. Hydrol. 2018, 557, 116–127. [Google Scholar] [CrossRef]
- Kummu, M.; Guillaume, J.H.A.; de Moel, H.; Eisner, S.; Flörke, M.; Porkka, M.; Siebert, S.; Veldkamp, T.I.E.; Ward, P.J. The world’s road to water scarcity: Shortage and stress in the 20th century and pathways towards sustainability. Sci. Rep. 2016, 6, 38495. [Google Scholar] [CrossRef] [Green Version]
- Cheng, K.; Fu, Q.; Chen, X.; Li, T.; Jiang, Q.; Ma, X.; Zhao, K. Adaptive Allocation Modeling for a Complex System of Regional Water and Land Resources Based on Information Entropy and its Application. Water Resour. Manag. 2015, 29, 4977–4993. [Google Scholar] [CrossRef]
- Herrera-Pantoja, M.; Hiscock, K.M. Projected impacts of climate change on water availability indicators in a semi-arid region of central Mexico. Environ. Sci. Policy 2015, 54, 81–89. [Google Scholar] [CrossRef]
- Ren, C.; Guo, P.; Li, M.; Li, R. An innovative method for water resources carrying capacity research—Metabolic theory of regional water resources. J. Environ. Manag. 2016, 167, 139–146. [Google Scholar] [CrossRef]
- Sauchyn, D.J.; St-Jacques, J.-M.; Barrow, E.; Nemeth, M.W.; MacDonald, R.J.; Sheer, A.M.S.; Sheer, D.P. Adaptive Water Resource Planning in the South Saskatchewan River Basin: Use of Scenarios of Hydroclimatic Variability and Extremes. JAWRA J. Am. Water Resour. Assoc. 2016, 52, 222–240. [Google Scholar] [CrossRef]
- Zhou, Y.; Guo, S.; Xu, C.-Y.; Liu, D.; Chen, L.; Wang, D. Integrated optimal allocation model for complex adaptive system of water resources management (II): Case study. J. Hydrol. 2015, 531, 977–991. [Google Scholar] [CrossRef]
- Zhou, Y.; Guo, S.; Xu, C.-Y.; Liu, D.; Chen, L.; Ye, Y. Integrated optimal allocation model for complex adaptive system of water resources management (I): Methodologies. J. Hydrol. 2015, 531, 964–976. [Google Scholar] [CrossRef]
- Herrfahrdt-Pähle, E. Integrated and adaptive governance of water resources: The case of South Africa. Reg. Environ. Chang. 2013, 13, 551–561. [Google Scholar] [CrossRef]
- Xia, J.; Qiu, B.; Li, Y. Water resources vulnerability and adaptive management in the Huang, Huai and Hai river basins of China. Water Int. 2012, 37, 523–536. [Google Scholar] [CrossRef]
- Zuo, Q. Application rules and key issues in theory of adaptive utilization of water resources. Arid. Land Geogr. 2017, 40, 925–932. [Google Scholar]
- Zuo, Q. Theory of adaptive utilization of water resources and its application prospect in water management practices. South-North Water Transf. Water Sci. Technol. 2017, 15, 18–24. [Google Scholar]
- Zuo, Q.; Han, S.; Han, C.; Luo, Z. Research frame of adaptive utilization allocation-regulation model of water resources in Xinjiang region based on RS. Water Resour. Hydropower Eng. 2019, 50, 52–57. [Google Scholar]
- Zhang, J.; Li, L.W.; Zhang, Y.N.; Liu, Y.F.; Ma, W.L.; Zhang, Z.M. Using a fuzzy approach to assess adaptive capacity for urban water resources. Int. J. Environ. Sci. Technol. 2019, 16, 1571–1580. [Google Scholar] [CrossRef]
- Yao, J.; Ren, Y.; Wei, S.; Pei, W. Assessing the complex adaptability of regional water security systems based on a unified co-evolutionary model. J. Hydroinform. 2017, 20, 34–48. [Google Scholar] [CrossRef] [Green Version]
- Yao, J.; Wang, G.; Xue, W.; Yao, Z.; Xue, B. Assessing the Adaptability of Water Resources System in Shandong Province, China, Using a Novel Comprehensive Co-evolution Model. Water Resour. Manag. 2019, 33, 657–675. [Google Scholar] [CrossRef]
- Fu, A.; Li, W.; Chen, Y.; Wang, Y.; Hao, H.; Li, Y.; Sun, F.; Zhou, H.; Zhu, C.; Hao, X. The effects of ecological rehabilitation projects on the resilience of an extremely drought-prone desert riparian forest ecosystem in the Tarim River Basin, Xinjiang, China. Sci. Rep. 2021, 11, 18485. [Google Scholar] [CrossRef]
- Zhao, R.; Chen, Y.; Shi, P.; Zhang, L.; Pan, J.; Zhao, H. Land use and land cover change and driving mechanism in the arid inland river basin: A case study of Tarim River, Xinjiang, China. Environ. Earth Sci. 2013, 68, 591–604. [Google Scholar] [CrossRef]
- van Vliet, M.T.H.; van Beek, L.P.H.; Eisner, S.; Flörke, M.; Wada, Y.; Bierkens, M.F.P. Multi-model assessment of global hydropower and cooling water discharge potential under climate change. Glob. Environ. Chang. 2016, 40, 156–170. [Google Scholar] [CrossRef]
- Han, S. Research on Action Mechanism and Quantitative Method of Adaptive Utilization of Water Resources. Master’s Thesis, Zhengzhou University, Zhengzhou, China, 2020. [Google Scholar]
- Zuo, Q.; Zhao, H.; Mao, C.; Ma, J.; Cui, G. Quantitative Analysis of Human-Water Relationships and Harmony-Based Regulation in the Tarim River Basin. J. Hydrol. Eng. 2015, 20, 1–11. [Google Scholar] [CrossRef]
- Fang, G.; Yang, J.; Chen, Y.; Li, Z.; Ji, H.; De Maeyer, P. How Hydrologic Processes Differ Spatially in a Large Basin: Multisite and Multiobjective Modeling in the Tarim River Basin. J. Geophys. Res. Atmos. 2018, 123, 7098–7113. [Google Scholar] [CrossRef]
- Xu, Z.; Chen, Y.; Li, J. Impact of Climate Change on Water Resources in the Tarim River Basin. Water Resour. Manag. 2004, 18, 439–458. [Google Scholar] [CrossRef]
- Yaning, C.; Changchun, X.; Xingming, H.; Weihong, L.; Yapeng, C.; Chenggang, Z.; Zhaoxia, Y. Fifty-year climate change and its effect on annual runoff in the Tarim River Basin, China. Quat. Int. 2009, 208, 53–61. [Google Scholar] [CrossRef]
- Wang, F.; Chen, Y.; Li, Z.; Fang, G.; Li, Y.; Xia, Z. Assessment of the Irrigation Water Requirement and Water Supply Risk in the Tarim River Basin, Northwest China. Sustainability 2019, 11, 4941. [Google Scholar] [CrossRef] [Green Version]
- Gao, P.; Wang, X.; Wang, H.; Cheng, C. Viewpoint: A correction to the entropy weight coefficient method by Shen et al. for accessing urban sustainability [Cities 42 (2015) 186–194]. Cities 2020, 103, 102742. [Google Scholar] [CrossRef]
- Cheng, W.; Xi, H.; Sindikubwabo, C.; Si, J.; Zhao, C.; Yu, T.; Li, A.; Wu, T. Ecosystem health assessment of desert nature reserve with entropy weight and fuzzy mathematics methods: A case study of Badain Jaran Desert. Ecol. Indic. 2020, 119, 106843. [Google Scholar] [CrossRef]
- Luo, Z.; Zuo, Q.; Shao, Q. A new framework for assessing river ecosystem health with consideration of human service demand. Sci. Total Environ. 2018, 640–641, 442–453. [Google Scholar] [CrossRef]
- Zuo, Q.; Zhang, Y.; Lin, P. Index system and quantification method for human-water harmony. J. Hydraul. Eng. 2008, 39, 440–447. [Google Scholar]
- Sun, G.; Guan, X.; Yi, X.; Zhou, Z. Grey relational analysis between hesitant fuzzy sets with applications to pattern recognition. Expert Syst. Appl. 2018, 92, 521–532. [Google Scholar] [CrossRef]
- Wang, D.; Li, Y.; Yang, X.; Zhang, Z.; Gao, S.; Zhou, Q.; Zhuo, Y.; Wen, X.; Guo, Z. Evaluating urban ecological civilization and its obstacle factors based on integrated model of PSR-EVW-TOPSIS: A case study of 13 cities in Jiangsu Province, China. Ecol. Indic. 2021, 133, 108431. [Google Scholar] [CrossRef]
- Yang, Y.; Hu, N. The spatial and temporal evolution of coordinated ecological and socioeconomic development in the provinces along the Silk Road Economic Belt in China. Sustain. Cities Soc. 2019, 47, 101466. [Google Scholar] [CrossRef]
- Xue, L.; Wang, J.; Zhang, L.; Wei, G.; Zhu, B. Spatiotemporal analysis of ecological vulnerability and management in the Tarim River Basin, China. Sci. Total Environ. 2019, 649, 876–888. [Google Scholar] [CrossRef]
- Ling, H.; Xu, H.; Fu, J. Changes in intra-annual runoff and its response to climate change and human activities in the headstream areas of the Tarim River Basin, China. Quat. Int. 2014, 336, 158–170. [Google Scholar] [CrossRef]
- Wu, G.; Li, L.; Ahmad, S.; Chen, X.; Pan, X. A Dynamic Model for Vulnerability Assessment of Regional Water Resources in Arid Areas: A Case Study of Bayingolin, China. Water Resour. Manag. 2013, 27, 3085–3101. [Google Scholar] [CrossRef]
- Huang, S.; Wortmann, M.; Duethmann, D.; Menz, C.; Shi, F.; Zhao, C.; Su, B.; Krysanova, V. Adaptation strategies of agriculture and water management to climate change in the Upper Tarim River basin, NW China. Agric. Water Manag. 2018, 203, 207–224. [Google Scholar] [CrossRef]
- Ehrlich, P.R.; Raven, P.H. Butterflies and plants: A study in coevolution. Evolution 1964, 18, 586–608. [Google Scholar] [CrossRef]


| Target | Sub-Problem Domain | Element | Unit |
|---|---|---|---|
| Adaptive utilization capacity of water resources (AUCWR) | Water Resource | Precipitation depth (I1) (+) | mm |
| Water yielding modulus (I2) (+) | 104 m3/km2 | ||
| Average per capita water resources (I3) (+) | m3/person | ||
| Exploitation rate of water resources (I4) (−) | / | ||
| Per capita water consumption (I5) (−) | m3/person | ||
| Water consumption per 10,000 yuan of GDP (I6) (−) | m3/104 CNY | ||
| Water consumption per 10,000 yuan of industrial added value (I7) (−) | m3/104 CNY | ||
| Average irrigation water consumption per unit area of farmland (I8) (−) | m3/hm2 | ||
| Per capita domestic water consumption (I9) (−) | L/person | ||
| Economic Society | Per capita GDP (I10) (+) | 104 CNY/person | |
| Proportion of non−agricultural output value in GDP (I11) (+) | / | ||
| Grain production per cubic meter of water (I12) (+) | kg/m3 | ||
| Per capita disposable income of urban residents (I13) (+) | CNY/person | ||
| Per capita net income of rural residents (I14) (+) | CNY/person | ||
| Urbanization rate (I15) (+) | / | ||
| Population density (I16) (+) | person/km2 | ||
| Natural population growth rate (I17) (+) | / | ||
| Water popularization rate of urban population (I18) (+) | / | ||
| Ecological Environment | Forest coverage rate (I19) (+) | / | |
| Green coverage rate of built-up area (I20) (+) | / | ||
| Ecological environment water consumption rate (I21) (+) | / | ||
| COD emission per capita (I22) (−) | t/104 person | ||
| Ammonia nitrogen emissions per capita (I23) (−) | t/104 person | ||
| Per capita discharge of sewage and wastewater (I24) (−) | m3/person | ||
| Fertilizer application intensity (I25) (−) | kg/hm2 |
| Element | Threshold Division | Element | Threshold Division | ||||||||
|---|---|---|---|---|---|---|---|---|---|---|---|
| Worst | Poor | Moderate | Better | Best | Worst | Poor | Moderate | Better | Best | ||
| I1 | 39 | 150 | 400 | 600 | 850 | I14 | 1000 | 4000 | 7000 | 10,000 | 13,000 |
| I2 | 3 | 6 | 9 | 12 | 15 | I15 | 0.2 | 0.4 | 0.6 | 0.8 | 1 |
| I3 | 1000 | 6000 | 12,500 | 19,000 | 25,000 | I16 | 5 | 11 | 17 | 24 | 30 |
| I4 | 1 | 0.8 | 0.6 | 0.4 | 0.2 | I17 | 3 | 6.5 | 10 | 20 | 30 |
| I5 | 7000 | 5500 | 3500 | 2000 | 500 | I18 | 0.2 | 0.4 | 0.6 | 0.8 | 1 |
| I6 | 10,000 | 7500 | 5000 | 3000 | 1000 | I19 | 0.005 | 0.02 | 0.04 | 0.1 | 0.16 |
| I7 | 1000 | 700 | 400 | 200 | 50 | I20 | 0.2 | 0.4 | 0.6 | 0.8 | 1 |
| I8 | 1200 | 950 | 700 | 450 | 200 | I21 | 0.005 | 0.01 | 0.02 | 0.035 | 0.05 |
| I9 | 150 | 125 | 100 | 75 | 50 | I22 | 200 | 150 | 100 | 75 | 50 |
| I10 | 0.5 | 1.75 | 3 | 5 | 7 | I23 | 20 | 15 | 10 | 6 | 2 |
| I11 | 0.2 | 0.4 | 0.6 | 0.8 | 1 | I24 | 100 | 65 | 30 | 17.5 | 5 |
| I12 | 0.1 | 0.2 | 0.3 | 0.4 | 0.5 | I25 | 100,000 | 75,000 | 50,000 | 30,000 | 10,000 |
| I13 | 5000 | 12,500 | 20,000 | 30,000 | 40,000 | ||||||
| System | Element Weight | ||||||||||
|---|---|---|---|---|---|---|---|---|---|---|---|
| Water Resources subsystem | Element | I1 | I2 | I3 | I4 | I5 | I6 | I7 | I8 | I9 | Total |
| Weight | 0.043 | 0.038 | 0.049 | 0.036 | 0.032 | 0.035 | 0.027 | 0.037 | 0.028 | 0.325 | |
| Economic and Social subsystem | Element | I10 | I11 | I12 | I13 | I14 | I15 | I16 | I17 | I18 | Total |
| Weight | 0.075 | 0.055 | 0.042 | 0.028 | 0.050 | 0.043 | 0.045 | 0.041 | 0.045 | 0.424 | |
| Ecological Environment subsystem | Element | I19 | I20 | I21 | I22 | I23 | I24 | I25 | Total | ||
| Weight | 0.039 | 0.044 | 0.056 | 0.027 | 0.026 | 0.027 | 0.032 | 0.251 | |||
| Year | Water Resources | Economic and Social | Ecological Environment | Year | Water Resources | Economic and Social | Ecological Environment |
|---|---|---|---|---|---|---|---|
| 2004 | 29.51 | 52.30 | 18.19 | 2012 | 30.53 | 51.24 | 18.23 |
| 2005 | 29.74 | 52.32 | 17.94 | 2013 | 30.60 | 51.14 | 18.25 |
| 2006 | 29.95 | 52.18 | 17.88 | 2014 | 30.86 | 50.79 | 18.35 |
| 2007 | 30.08 | 51.84 | 18.08 | 2015 | 30.70 | 51.00 | 18.30 |
| 2008 | 30.32 | 51.51 | 18.17 | 2016 | 30.57 | 50.98 | 18.45 |
| 2009 | 30.36 | 51.51 | 18.13 | 2017 | 30.60 | 50.94 | 18.46 |
| 2010 | 30.31 | 51.46 | 18.23 | 2018 | 30.98 | 51.17 | 17.86 |
| 2011 | 30.51 | 51.31 | 18.18 |
| Element | Obstacle | Element | Obstacle | Element | Obstacle | Element | Obstacle | Element | Obstacle |
|---|---|---|---|---|---|---|---|---|---|
| I1 | 4.04 | I6 | 3.42 | I11 | 6.72 | I16 | 5.53 | I21 | 3.69 |
| I2 | 3.65 | I7 | 2.68 | I12 | 5.06 | I17 | 5.19 | I22 | 1.97 |
| I3 | 4.69 | I8 | 3.53 | I13 | 3.28 | I18 | 5.46 | I23 | 1.91 |
| I4 | 3.40 | I9 | 2.51 | I14 | 5.80 | I19 | 2.80 | I24 | 1.98 |
| I5 | 3.04 | I10 | 8.76 | I15 | 5.36 | I20 | 3.24 | I25 | 2.26 |
Publisher’s Note: MDPI stays neutral with regard to jurisdictional claims in published maps and institutional affiliations. |
© 2022 by the authors. Licensee MDPI, Basel, Switzerland. This article is an open access article distributed under the terms and conditions of the Creative Commons Attribution (CC BY) license (https://creativecommons.org/licenses/by/4.0/).
Share and Cite
Li, X.; Zuo, Q.; Zhai, J.; Zhao, Y.; Wang, Y.; Han, S. Evaluation of Adaptive Utilization Capacity of Water Resources and Analysis of Driving Element: A Case Study of Tarim River Basin. Water 2022, 14, 3820. https://doi.org/10.3390/w14233820
Li X, Zuo Q, Zhai J, Zhao Y, Wang Y, Han S. Evaluation of Adaptive Utilization Capacity of Water Resources and Analysis of Driving Element: A Case Study of Tarim River Basin. Water. 2022; 14(23):3820. https://doi.org/10.3390/w14233820
Chicago/Turabian StyleLi, Xing, Qiting Zuo, Jiaqi Zhai, Yong Zhao, Yong Wang, and Shuying Han. 2022. "Evaluation of Adaptive Utilization Capacity of Water Resources and Analysis of Driving Element: A Case Study of Tarim River Basin" Water 14, no. 23: 3820. https://doi.org/10.3390/w14233820