
Drought Induced Dynamic Traits of Soil Water and Inorganic Carbon in Different Karst Habitats


1
State Key Laboratory of Environmental Geochemistry, Institute of Geochemistry, Chinese Academy of Sciences, Guiyang 550081, China
2
Institute of Geochemistry, University of Chinese Academy of Sciences, Beijing 100049, China
3
Department of Agricultural Engineering, Guizhou Vocational College of Agriculture, Qingzhen 551400, China
4
Key Laboratory of Modern Agricultural Equipment and Technology, Ministry of Education, College of Agricultural Engineering, Jiangsu University, Zhenjiang 212013, China
*
Authors to whom correspondence should be addressed.
Water 2022, 14(23), 3837; https://doi.org/10.3390/w14233837
Submission received: 6 November 2022
/
Revised: 19 November 2022
/
Accepted: 22 November 2022
/
Published: 25 November 2022
(This article belongs to the Special Issue Effects of Drought on Agriculture Water Resources and Crop Productivity)
Abstract
:Understanding the temporal variability of soil water and carbon is an important prerequisite for restoring the vegetation in fragile karst ecosystems. A systematic study of soil moisture and carbon storage capacity under drought conditions in different karst habitats is critical for cultivating suitable crops in karst regions. The hydrological characteristics of soil and changes in soil HCO3−, pH, and EC values under drought conditions were measured on simulated rock outcrops and non-outcrops in an indoor pot experiment. The results showed that the rock outcrops had less evaporation and significantly greater water retention capacity than the non-outcrops, which gave the retained water in the rock outcrops sufficient reaction time to dissolve atmospheric CO2, as well as to promote dissolution at the rock–soil interface. Therefore, the carbon sequestration capacity of the rock outcrops was higher than that of the non-outcrops. Due to the rock–soil–water interaction in the early stage of drought, the soil HCO3− concentration in the rock outcrops fluctuated with soil water content, but the soil HCO3− concentration tended to be stable in the whole drought period, showing a phenomenon of zero-carbon sink. No obvious change was observed in the soil HCO3− concentration in non-outcrops during the drought period, which indicated that the carbon sequestration of rock outcrops was mainly attributed to the dissolution of rocks. Therefore, rock outcrops were more effective for water and carbon storage, compared with non-outcrops, under drought, and could provide more available water and carbon resources for supporting the photosynthesis of plants in karst regions.
1. Introduction
Karst ecosystems, in which exposed rocks and shallow soils form a mosaical pattern, change the distribution and transport of the surrounding soil water directly or indirectly, resulting in a high degree of spatial and temporal heterogeneity in the water distribution in karst regions [1]. The emergence of rock outcrops is very common in terrestrial ecosystems. Compared with the continuous and flat soils in non-outcrop habitats, the appearance of rock outcrops destroys the continuity of soil layers in karst areas, blocks the interconnection between soil patches, and causes the soil properties in this area to show a high degree of spatial variation [2]. At present, most studies focus on the dynamic changes in soil water and nutrients, and plant growth in outcrop habitats. Zhao et al. [3] found that surface outcrops altered rainfall runoff processes, intercepting and collecting large proportions of rainwater delivered to nearby soil patches, which significantly altered the permeability and water flow behavior of karst soils. This phenomenon is known as the “funnel effect” of exposed stones [4]. Rock outcrops play an important role in hydrology and ecology in drought areas. Certini et al. and Poesen et al. discovered that the rock fragments not only altered soil erosion processes and runoff generation, but also affected soil hydrological processes by modifying soil physical and chemical properties [5,6]. Furthermore, Li et al. discovered that the more advanced the karstification process was, the greater its water catchment capacity [7]. The presence of rock outcrops modifies the microenvironment. Shen et al. [8] discovered that, in a soil and rock outcrop combination of different karst ecosystems, soil in rock outcrops obtains water, TOC, N, P, and K through rock surface runoff. Outcrops redistribute the water and nutrients received from the rocks to nearby soil patches, creating a specific rock outcrop–soil patch system [8,9], and releasing Ca2+, Mg2+, and HCO3−, causing a heterogeneous distribution of environmental factors such as soil water, inorganic carbon, and mineral nutrients in karst areas. Rock outcrops not only affect the redistribution of resources involving light, temperature, and water, but also influence the local climate and vegetation [10], causing spatial and temporal heterogeneity in the soil’s hydrological characteristics and creating a range of diverse plant ecological niches [11]. The vegetation community composition is strongly influenced by the water content of soils. Furthermore, the heterogeneous distribution of inorganic carbon in karst areas is also influenced by soil water, which affects the local soil physicochemical properties and even vegetation growth. The semi-arid and semi-humid environmental conditions in karst areas hinder the progress of vegetation and ecosystem restoration. Therefore, understanding the water holding capacity of soils around rock outcrops under continuous drought conditions is necessary.
Water in the soil is highly efficient in the corrosion of carbonate rocks; when the partial pressure of CO2 and water in the soil solution increases, the dissolution of carbonate rock can be promoted and the karst carbon sink effect can be strengthened [12]. On the other hand, low water contents mobilize and precipitate low amounts of calcium carbonate [13]. One mole of CO2 is returned to the atmosphere for each dissolved mole of atmospheric CO2 in carbonate, which is then precipitated as loam-forming carbonate [14]. During karstification, carbonate rocks have an effect on the atmospheric CO2 source–sink relationship, both as a sink (carbonate dissolution) and as a source (CO2 degassing in carbonate deposition) [15,16]. The specific process is as follows [17]:
In the above-mentioned equation, the carbonic acid solution formed by the combination of soil CO2 and water is rapidly decomposed into H+ and HCO3− [18]. Calcium carbonate (CaCO3) is influenced by soil CO2, soil pH, soil water content, and soil calcium concentration [19]. The pH of the soil solution is influenced by the partial pressure of CO2 originating from ecosystem respiration which, in turn, is controlled by the temperature and water availability [20]. Meanwhile, carbonates are alkaline salts which release a mass of HCO3− to the soil and increase the pH of the soil solution. As a result, the increasing pH creates an adverse effect for plants that adapt to acidic environments, but suitable conditions for plants that adapt to basic soil conditions [21]. High concentrations of HCO3− in soil solutions can affect plant growth [22] and inhibit plant photosynthesis [23], while low concentrations of HCO3− can induce plant stomatal closure [24]. Consequently, monitoring the concentration of soil HCO3− in different habitats can serve as a reference for cultivating adapted crops.
The dissolution processes of carbonate rocks is closely related to water and is easily affected by drought [25]. Some studies have shown that climate affects the partial pressure of CO2 within karst systems. In the case of calcite, near equilibrium carbonate groundwater under warmer climatic conditions shows higher pCO2 than that under cooler climatic conditions [26,27].Droughts are currently an important stressor for the carbon sink function of terrestrial ecosystems, which can significantly reduce the intensity of terrestrial ecosystem carbon sinks and even turn them into carbon sources [28]. It has been found that semi-arid ecosystems can become a large carbon sink in a wet year [29], fluctuating with changes in the external environmental conditions, and this fluctuation is closely related to changes in the environmental conditions such as climate [30]. During the dissolution of carbonate rocks, carbonates might not capture any additional CO2; instead, they will be reactivated from one pool to another and balanced with the atmosphere over time [31,32,33]. Cao et al. [34] found that inorganic carbon dissolved by carbonate rock outcrops was equal to 18% of the net carbon sink of terrestrial vegetation and 38% of the soil carbon sink. However, soil water and nutrient elements around rock outcrops in karst areas have been widely studied, but the role of soil water and carbon sinks around rock outcrops under continuous drought is still unknown. Therefore, this study illustrates the positive effects of rock outcrops on ecosystem water–carbon sinks and water–carbon coupling based on the rock–soil–water relationship.
To this end, this study simulated rock outcrops (RO) and non-outcrops (NRO) with different degrees of drought through indoor pot experiments, and the heterogeneous distribution characteristics of soil moisture and HCO3− concentrations under drought in the two habitats were investigated. We aimed to evaluate the water retention capacity and the storage capacity of inorganic carbon in the two habitats and explore the relationship between soil water and HCO3−. The results will help to reveal the temporal variability patterns of soil water and inorganic carbon under drought conditions, provide a reference for the matching of heterogeneous habitats with suitable plants and, finally, improve the ecological restoration efficiency in karst areas.
2. Materials and Methods
2.1. Test Materials and Design
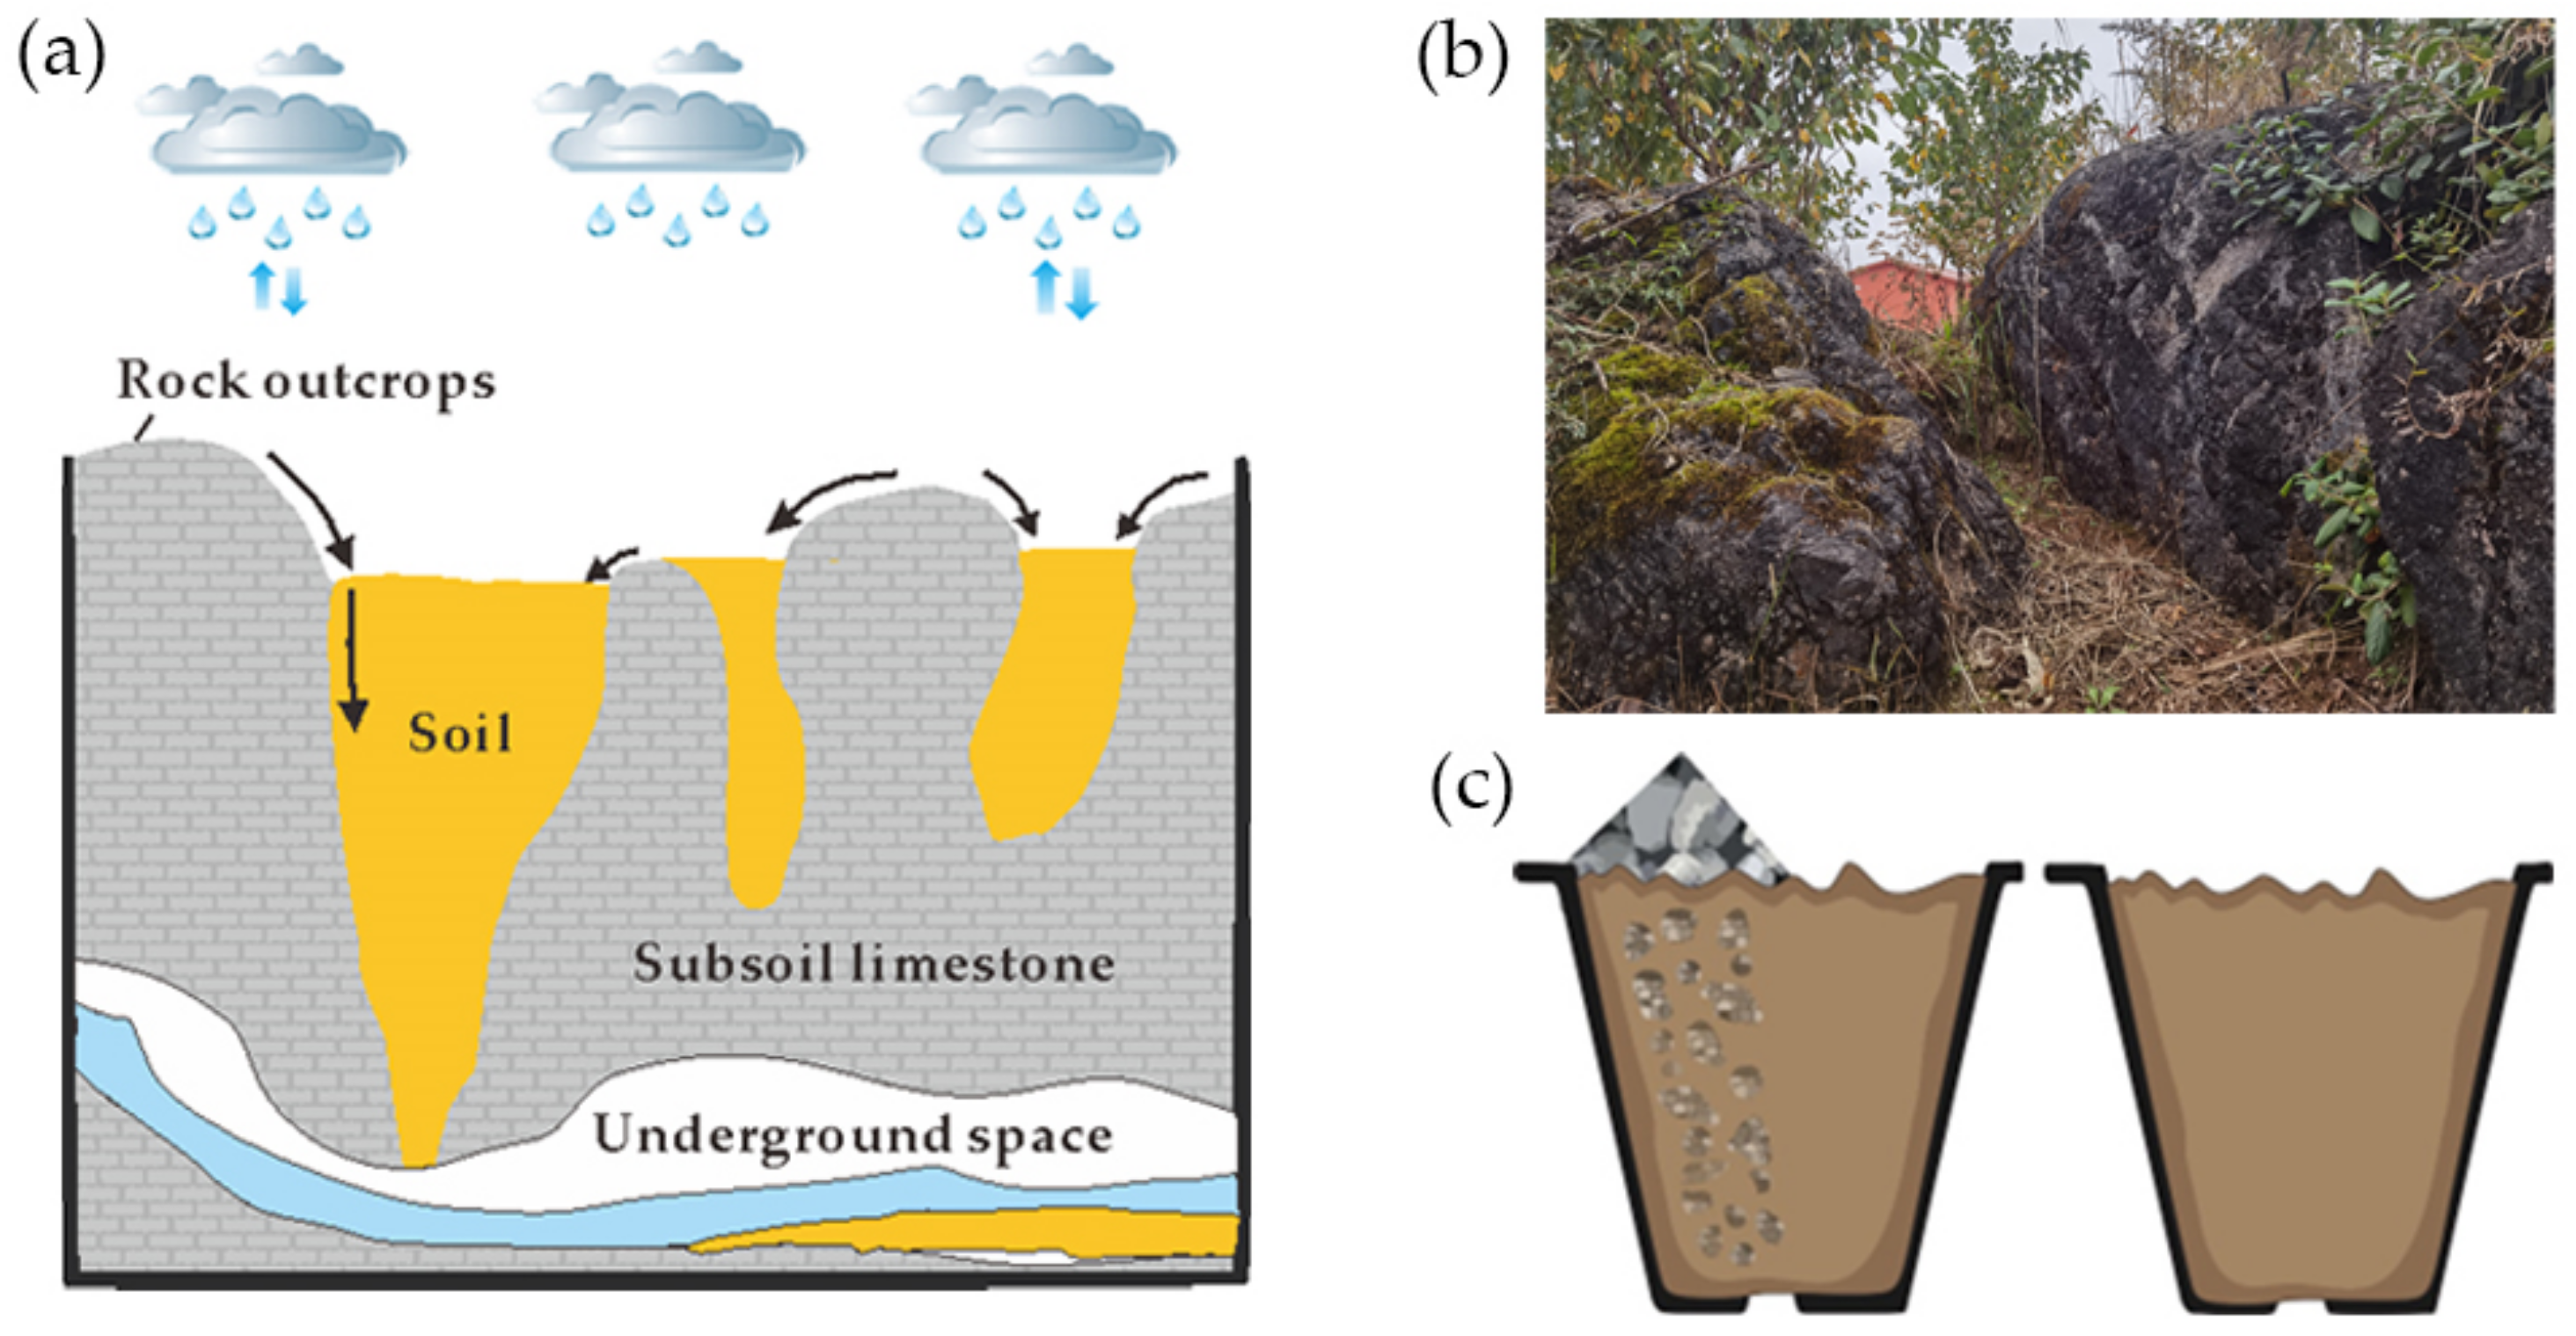
This experiment was carried out in a greenhouse of Guizhou Agricultural Vocational College, Guizhou province, China (26°34′ N, 106°25′ E). A constant light intensity of 500 ± 50 μmol·m−2·s−2 for 12 h per day was maintained by using LED lamps of type T5, with a day/night temperature of 25 °C/18 °C and relative air humidity of 55 ± 5%. The loamy soil was collected from the 0–20 cm cultivated layer of calcareous arable land with typical carbonate rock development in Qing Zhen City. The basic physicochemical properties are shown in Table 1. To simulate rock outcrops, containers measuring 50 cm, 21 cm, and 18 cm in length, width, and height were selected, with small holes at the bottom for gravity water to flow away. The soil was air-dried and milled until the particles were small and uniform, and the same mass (10 kg) of soil was weighed and poured into the containers.
In contrast to non-karst areas, karst areas are characterized by the double space structure of the surface and underground (Figure 1a) [35,36]. At the same time, according to the field survey shown in Figure 1b, the bedrock of the outcrop habitat is exposed and has a low land use availability. Therefore, this study placed 1 kg of small limestone clasts at the bottom of the container to simulate the karst underground structure while, following the characteristics of the karst surface outcrops, some limestone was placed on one side of the container to simulate rock outcrops, and the pots were saturated with water, as shown in Figure 1c. In order to restore the disturbed soil to its original state, the container was placed outside for five months, and then a simulated rainfall experiment was conducted.
In line with the rainfall intensity standards from the literature and those adopted by China’s meteorological data department, combined with the results of intense rainfall in the short calendar period of the past 30 years in southwest China [37], the simulated rainfall treatment was set up to be a high rainfall intensity of 70 mm/h. The soil hydrological characteristics in the two habitats and the diurnal and day-to-day variations in HCO3− were observed under drought conditions. The diurnal variation was collected at the beginning and every 2 h after the simulated rainfall, recorded as 0, 2, 4, 6, 8, 10, and 12 (H), respectively, as well as every 2 d after simulated rainfall, recorded as 0, 2, 4, 6, 8, 10, 12, 14, and 16 (D).
2.2. Measurement of Soil Water Content, Water Potential, and Electrical Conductivity
TEROS 11/12 (θ/EC) and TEROS 21 () sensors connected with a ZL6 water potential meter (METER, Decagon, USA) were installed in two habitats to collect the dynamic soil water content (SWC), and water potential () at a frequency of 10 min. The electrical conductivity (EC) was synchronously recorded.
2.3. Measurement of the Soil Surface Evaporation and Soil Infiltration
Evaporation from the soil surface (Ess) was determined by a continuous weighing method. The change in the soil water content in different habitats during the treatment period was calculated. The containers were weighed at 09:00 each day using an electronic scale. The difference in the evaporation container’s weight, measured daily, was used as soil surface evaporation (Ems). Ems (kg/day) was converted to soil surface evaporation Ess (mm/day), which was calculated as follows [38]:
where A is the soil surface area (cm2).
Soil infiltration was determined by using a graduated cylinder, water was collected every 10 min during the simulated rainfall (09:00–10:00) and every 2 h after the simulated rainfall (10:00–22:00).
2.4. Measurement of Soil Water Characteristic Curve
The soil water characteristic curve, an important indicator of the basic hydraulic properties of soil, describes the relationship between soil water content and soil water potential. It is usually used to estimate the soil water retention function and provides an accurate estimation method for soil hydrology [39]. By comparing various models, it has been found that the soil water characteristic curve fitted by the Gibbs free energy equation was more accurate [40], so this model was used in this study to fit the water characteristic curve; this model can be expressed as:
where is the soil water potential (MPa), P is the soil water content (%), and and k are model parameters. When P = 0, = , represents the value of the soil water potential when the soil water content is 0, which reflects the adsorption capacity of soil to water.
2.5. Measurement of Soil Bicarbonate Concentration
Determination of soil HCO3− concentration [41,42] was performed as follows: Firstly, a fresh soil sample was taken out of refrigeration, and 50 g soil matrix was accurately weighed and placed in a 500 mL beaker. According to a water–soil ratio of 2:1, 100 g deionized water was added into the beaker, and CO2 in the water was removed after boiling and cooling. The sample was stirred and well mixed, then left to stand for 30 min before centrifuging (5000× g, 30 min). The supernatant was transferred to a suction filtration bottle and passed through a 0.45 μm aqueous filter membrane, and the filtrate was used to determine the HCO3− concentration (using an Alkalinity Determination Kit, Merck KGaA, Darmstadt, Germany). The pH was determined using the remaining filtrate in the beaker.
2.6. Statistical Analysis
The soil water characteristics and HCO3− concentrations at different drought times in the two habitats were statistically analyzed. Differences between values for each treatment were analyzed with Duncan’s multiple range tests combined with one-way ANOVA using SPSS software (SPSS 25.0, IBM, Armonk, New York, NY, USA). Drawings were made using Origin software (2021, Northampton, MA, USA). All experimental data are shown as means ± standard error, n = 3.
3. Results
3.1. Diurnal Variation in Soil Infiltration and Evaporation of the Two Habitats under Drought
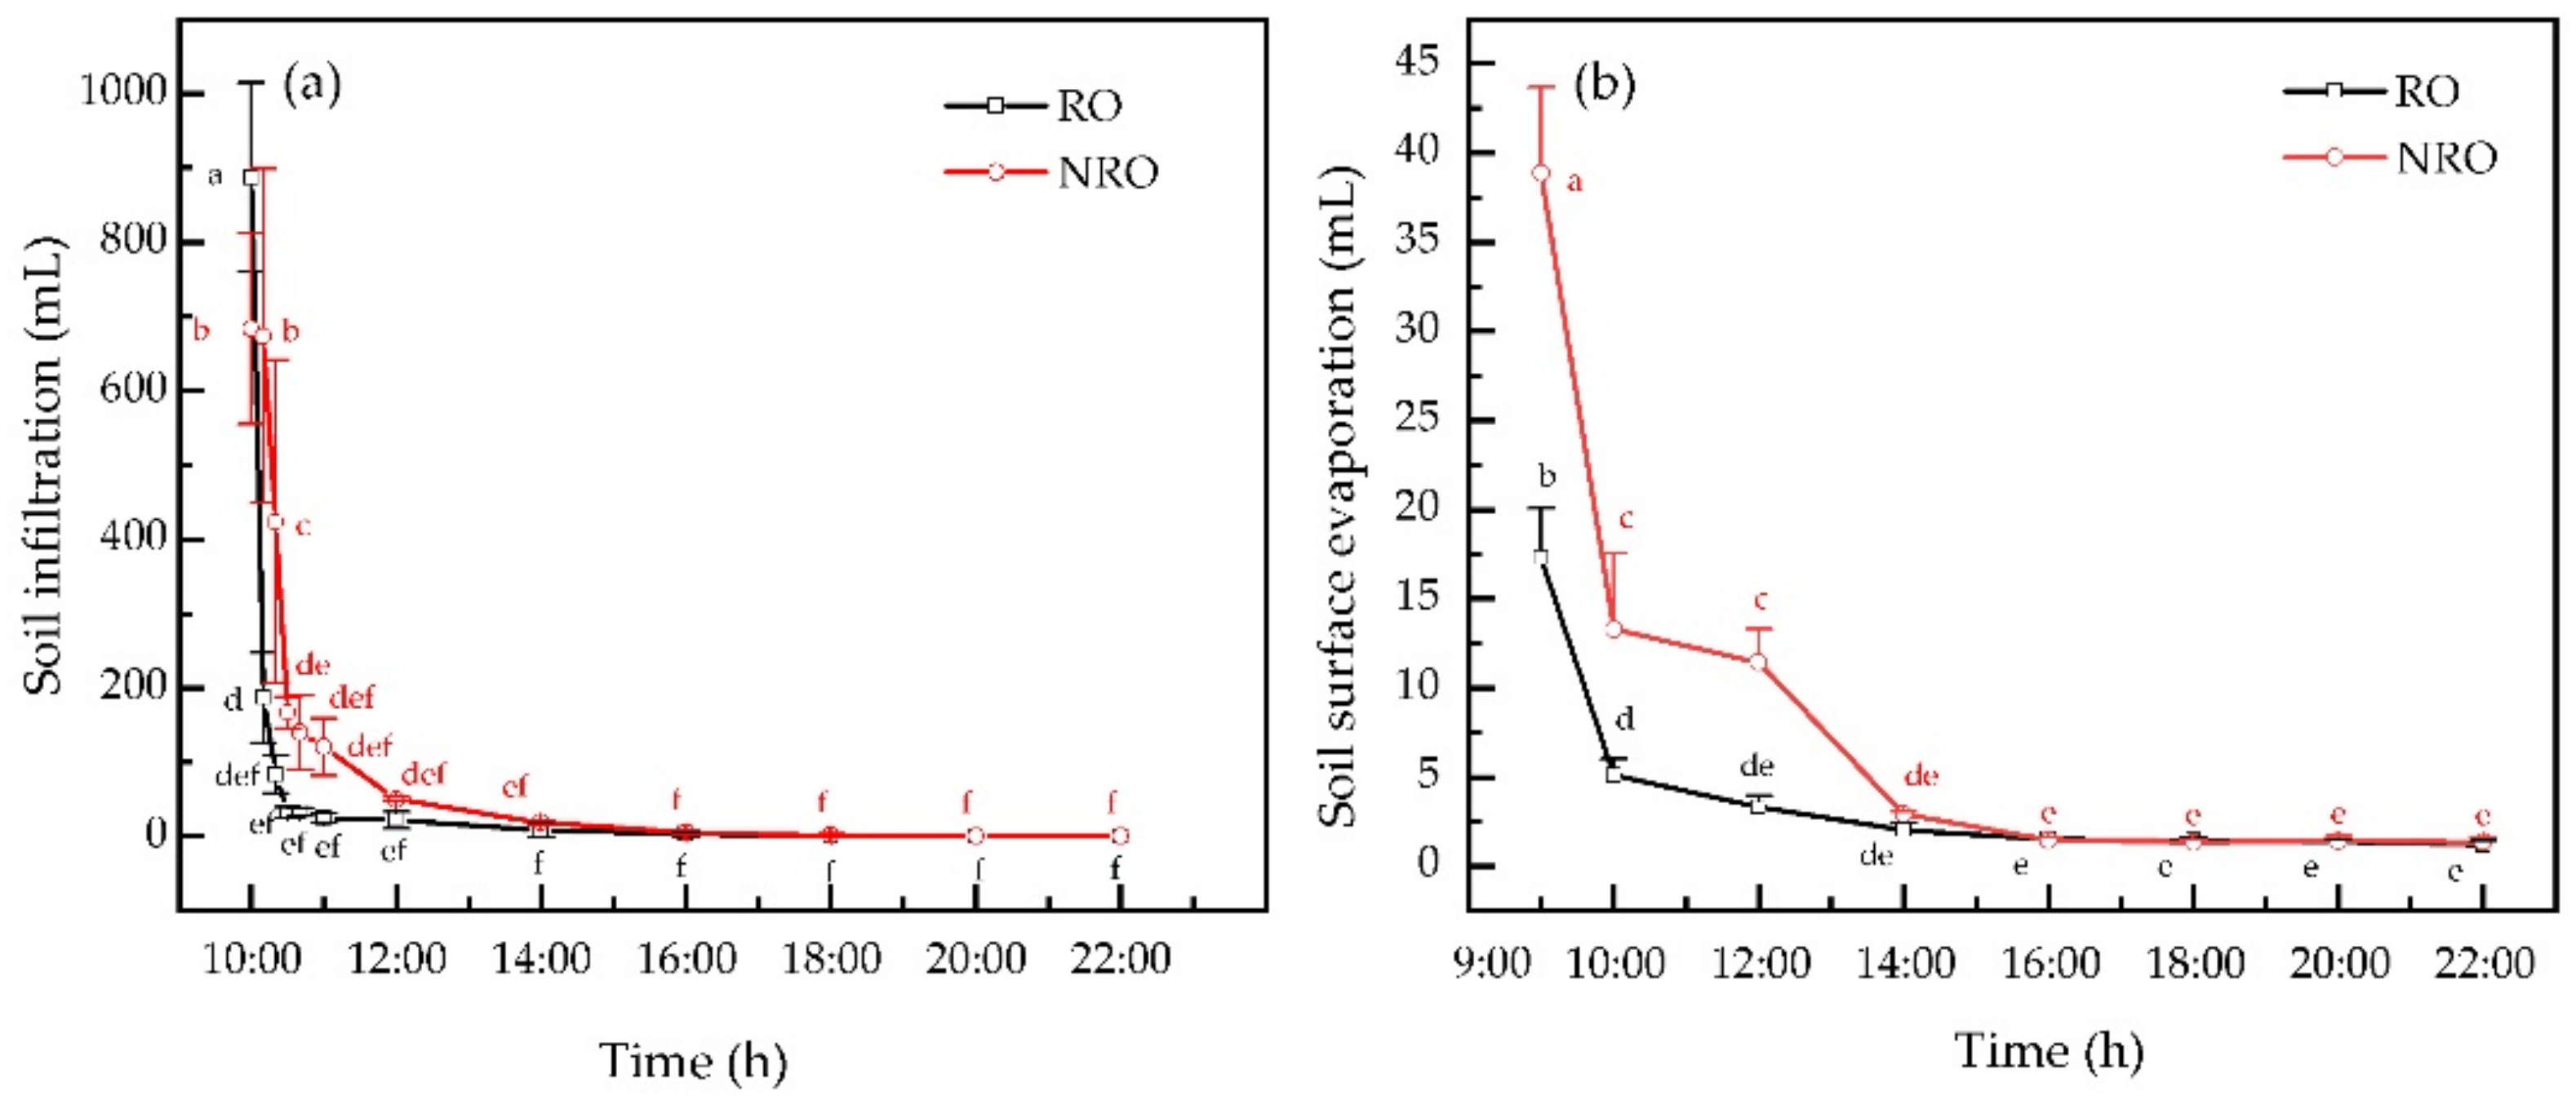
Diurnal variations in soil evaporation and infiltration can be used to quantify the soil and water conservation effect of different habitats. Clear changes of the soil surface evaporation (Ess) and soil infiltration (SI) in the two habitats were observed, which were attributed to the continuous loss of surface soil water caused by rainwater infiltration and evaporation (Figure 2). Infiltrations in the two habitats showed similar changes after simulated rainfall (Figure 2a). However, infiltration in the non-outcrops was slightly higher than that in the rock outcrops at 11:00, and both infiltrations became stable and gradually fell to zero after 14:00. Figure 2b depicts the relationship between soil evaporation and time. The average evaporation of rock outcrops (4.15 mm/h) was significantly lower than that of non-outcrops (8.99 mm/h). Evaporation from the non-outcrops was the highest at 09:00 with a maximum evaporation of 38.87 mm/h, and the minimum was 1.24 mm/h, while the maximum evaporation from the rock outcrops was 17.30 mm/h and the minimum was 1.18 mm/h. Under drought conditions, soil evaporation in the non-outcrops had a greater fluctuation than that in rock outcrops, and both trends were first faster, then slower. Thus, soil infiltration in non-outcrops was significantly higher than that in rock outcrops, while soil evaporation in rock outcrops was much less than that in non-outcrops, and the magnitude of soil evaporation in rock outcrops decreased as time increased.
3.2. Diurnal and Day-to-Day Variations Soil Water Content and Water Potential in the Two Habitats under Drought
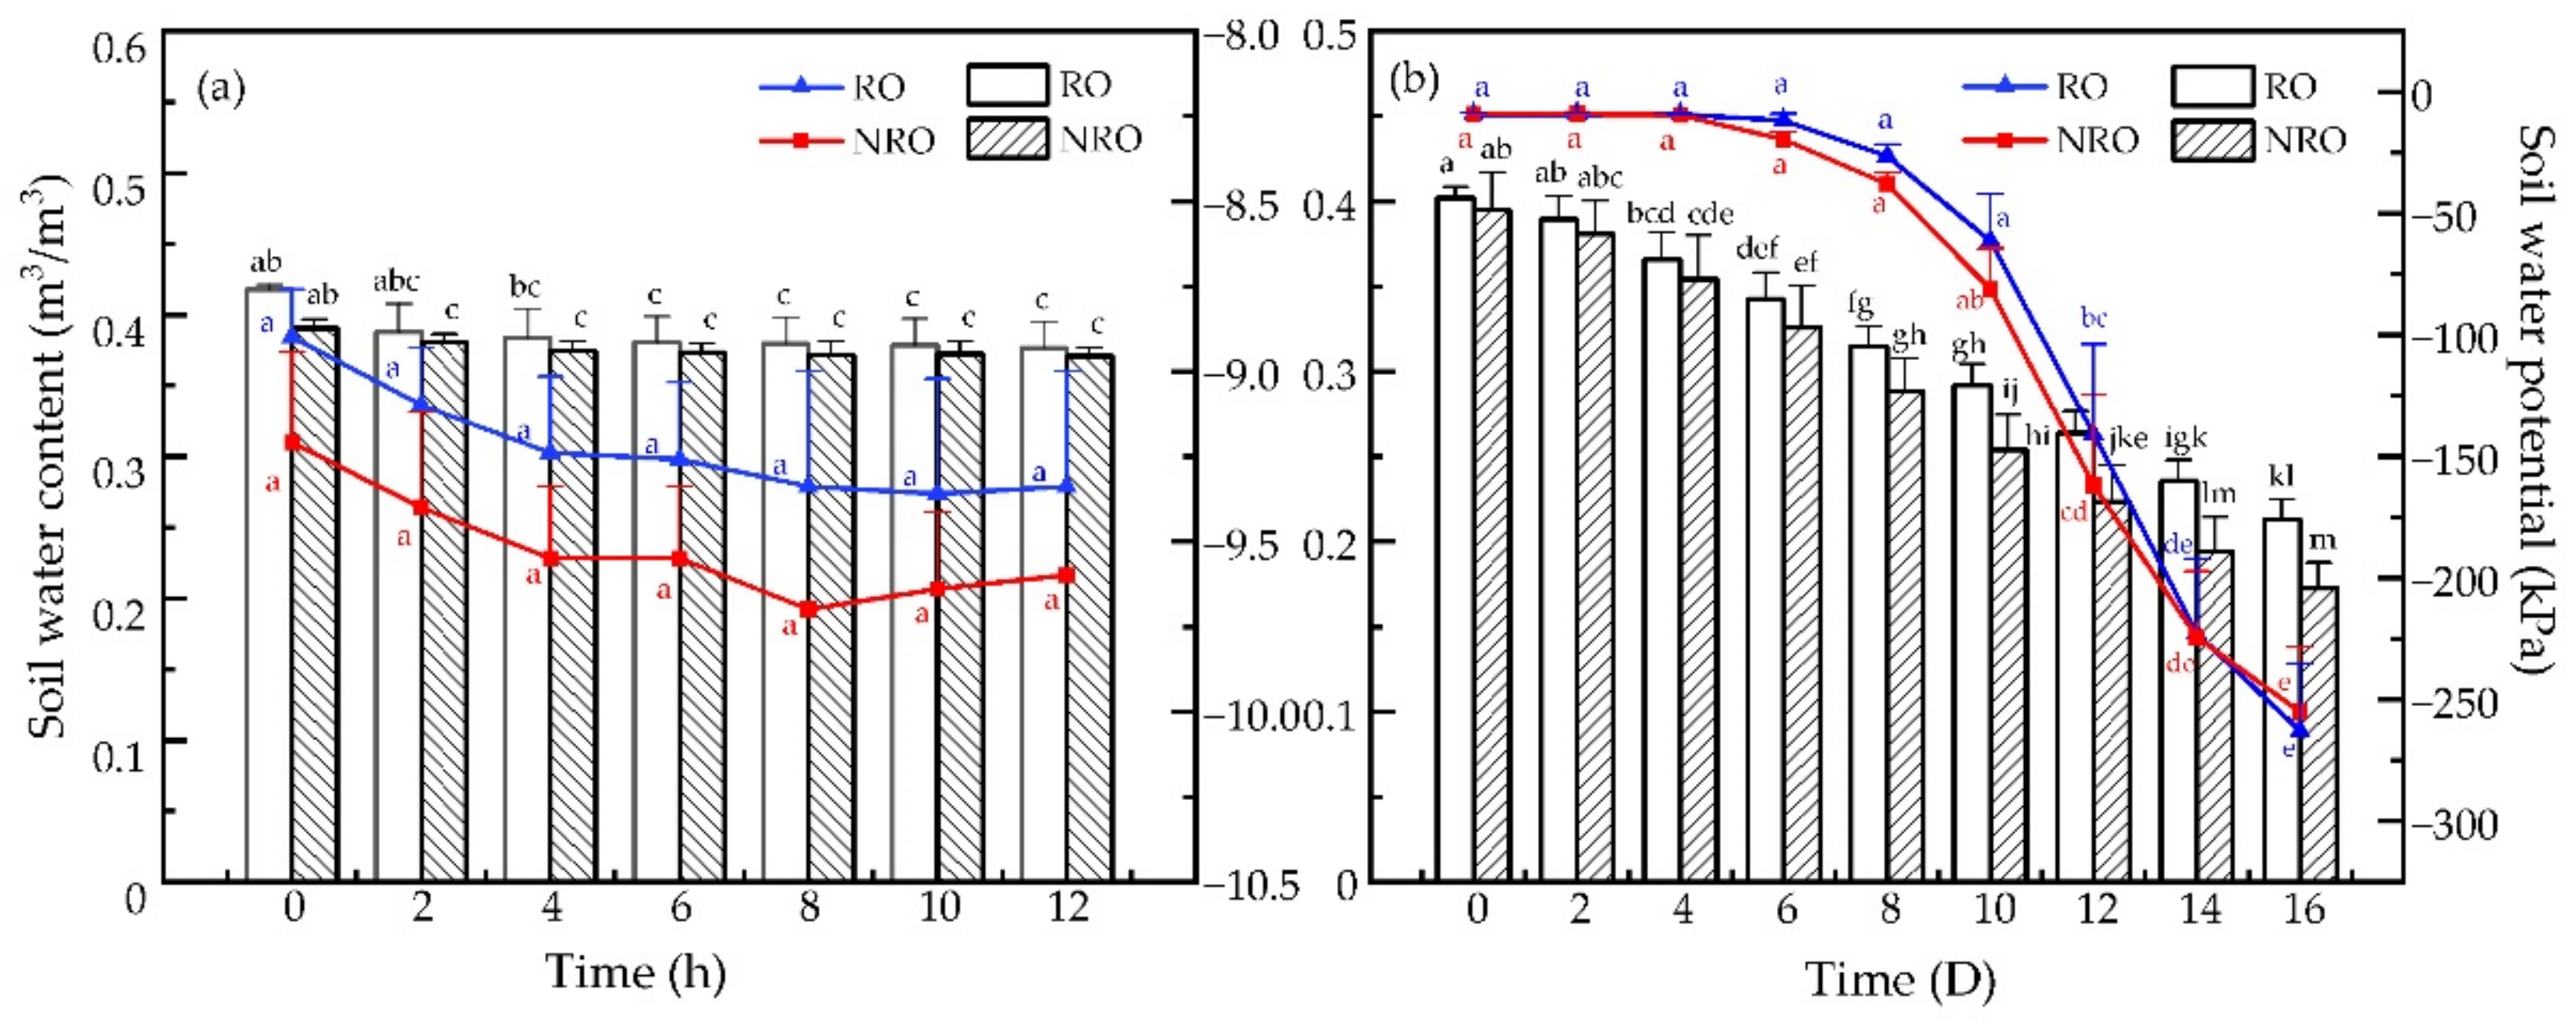
The trends of soil water content and water potential in the two habitats were basically the same (Figure 3). At the stage of diurnal variation (Figure 3a), the soil water content of rock outcrops was slightly higher than that of non-outcrops within 2 h after simulated rainfall, but there was no clear difference (p > 0.05) in the soil water content between the two habitats after 2 h (Figure 3a), and the mean values of the residual water content in rock outcrops and non-outcrops were 0.376 m3/m3 and 0.371 m3/m3, respectively. There was also no significant difference (p > 0.05) in the soil water potential of the habitats under the same soil water content conditions. Under diurnal variation, when the soil water potential in both habitats became stable, the water potential values ranged from −8.933 to −9.132 kPa in the rock outcrops and −9.399 to −9.598 kPa in the non-outcrops, respectively. In the first 10 consecutive days of drought, soil water content was slightly higher in the rock outcrops than in the non-outcrops, but the difference was not significant. After 10 days, soil water content was higher in the rock outcrops than that in the non-outcrops (Figure 3b). Furthermore, the water potential in both habitats showed gradual decreases with continuous drought, and a significant difference between 10 and 12 days was observed. Overall, the results indicated that soil water uptake was higher in non-outcrops than that in rock outcrops under severe water deficit, and the soil in non-outcrops was drier than that in rock outcrops. Under diurnal variation, the soil water content and water potential in both habitats were clearly influenced by the duration of drought.
3.3. Diurnal and Day-to-Day Variations in the Water Characteristic Curves of the Two Habitats under Drought
Soil water potential and water content were linearly fitted by the Gibbs free energy equation to investigate the soil water characteristic curves in both habitats (Table 2). This study found that the correlation coefficients between soil water potential and water content under each drought level were all above 0.97, showing a significant positive correlation. The parameter y0 and K values in the water characteristic curve equation represent the water sorption capacity of soil and the water retention function of soil, respectively [40], while the y0 value also characterizes the decrease speed of soil water content with decreasing soil water potential [43]. The K value in the diurnal variation was significantly greater in the rock outcrops (0.0245) than in the non-outcrops (0.0134), while the y0 value in the non-outcrops (−0.0127) was greater than in the rock outcrops (−0.0159). Therefore, the soil water-holding capacity of the rock outcrops was significantly higher than that of the non-outcrops, and the rate of change of soil water content and water potential in the rock outcrops was lower than that of the non-outcrops. There was also a similar trend in the day-to-day variation: the K value of the rock outcrops (5.0316) was significantly greater than that of the non-outcrops (3.3624), and the y0 value of the non-outcrops (−0.6819) was greater than that of the rocky habitat (−1.0396). In summary, the water sorption capacity of rock outcrops was higher than that of non-outcrops under both diurnal and day-to-day variations, and the soil water content of non-outcrops decreased more rapidly with decreasing soil water potential than that of rock outcrops. Therefore, the overall soil water holding capacity of rock outcrops was higher than that of non-outcrops.
3.4. Diurnal and Day-to-Day Variations in Soil Conductivity, HCO3−, and pH in Two Habitats under Drought
3.4.1. Dynamic Change in Soil Conductivity with Increasing Drought Time
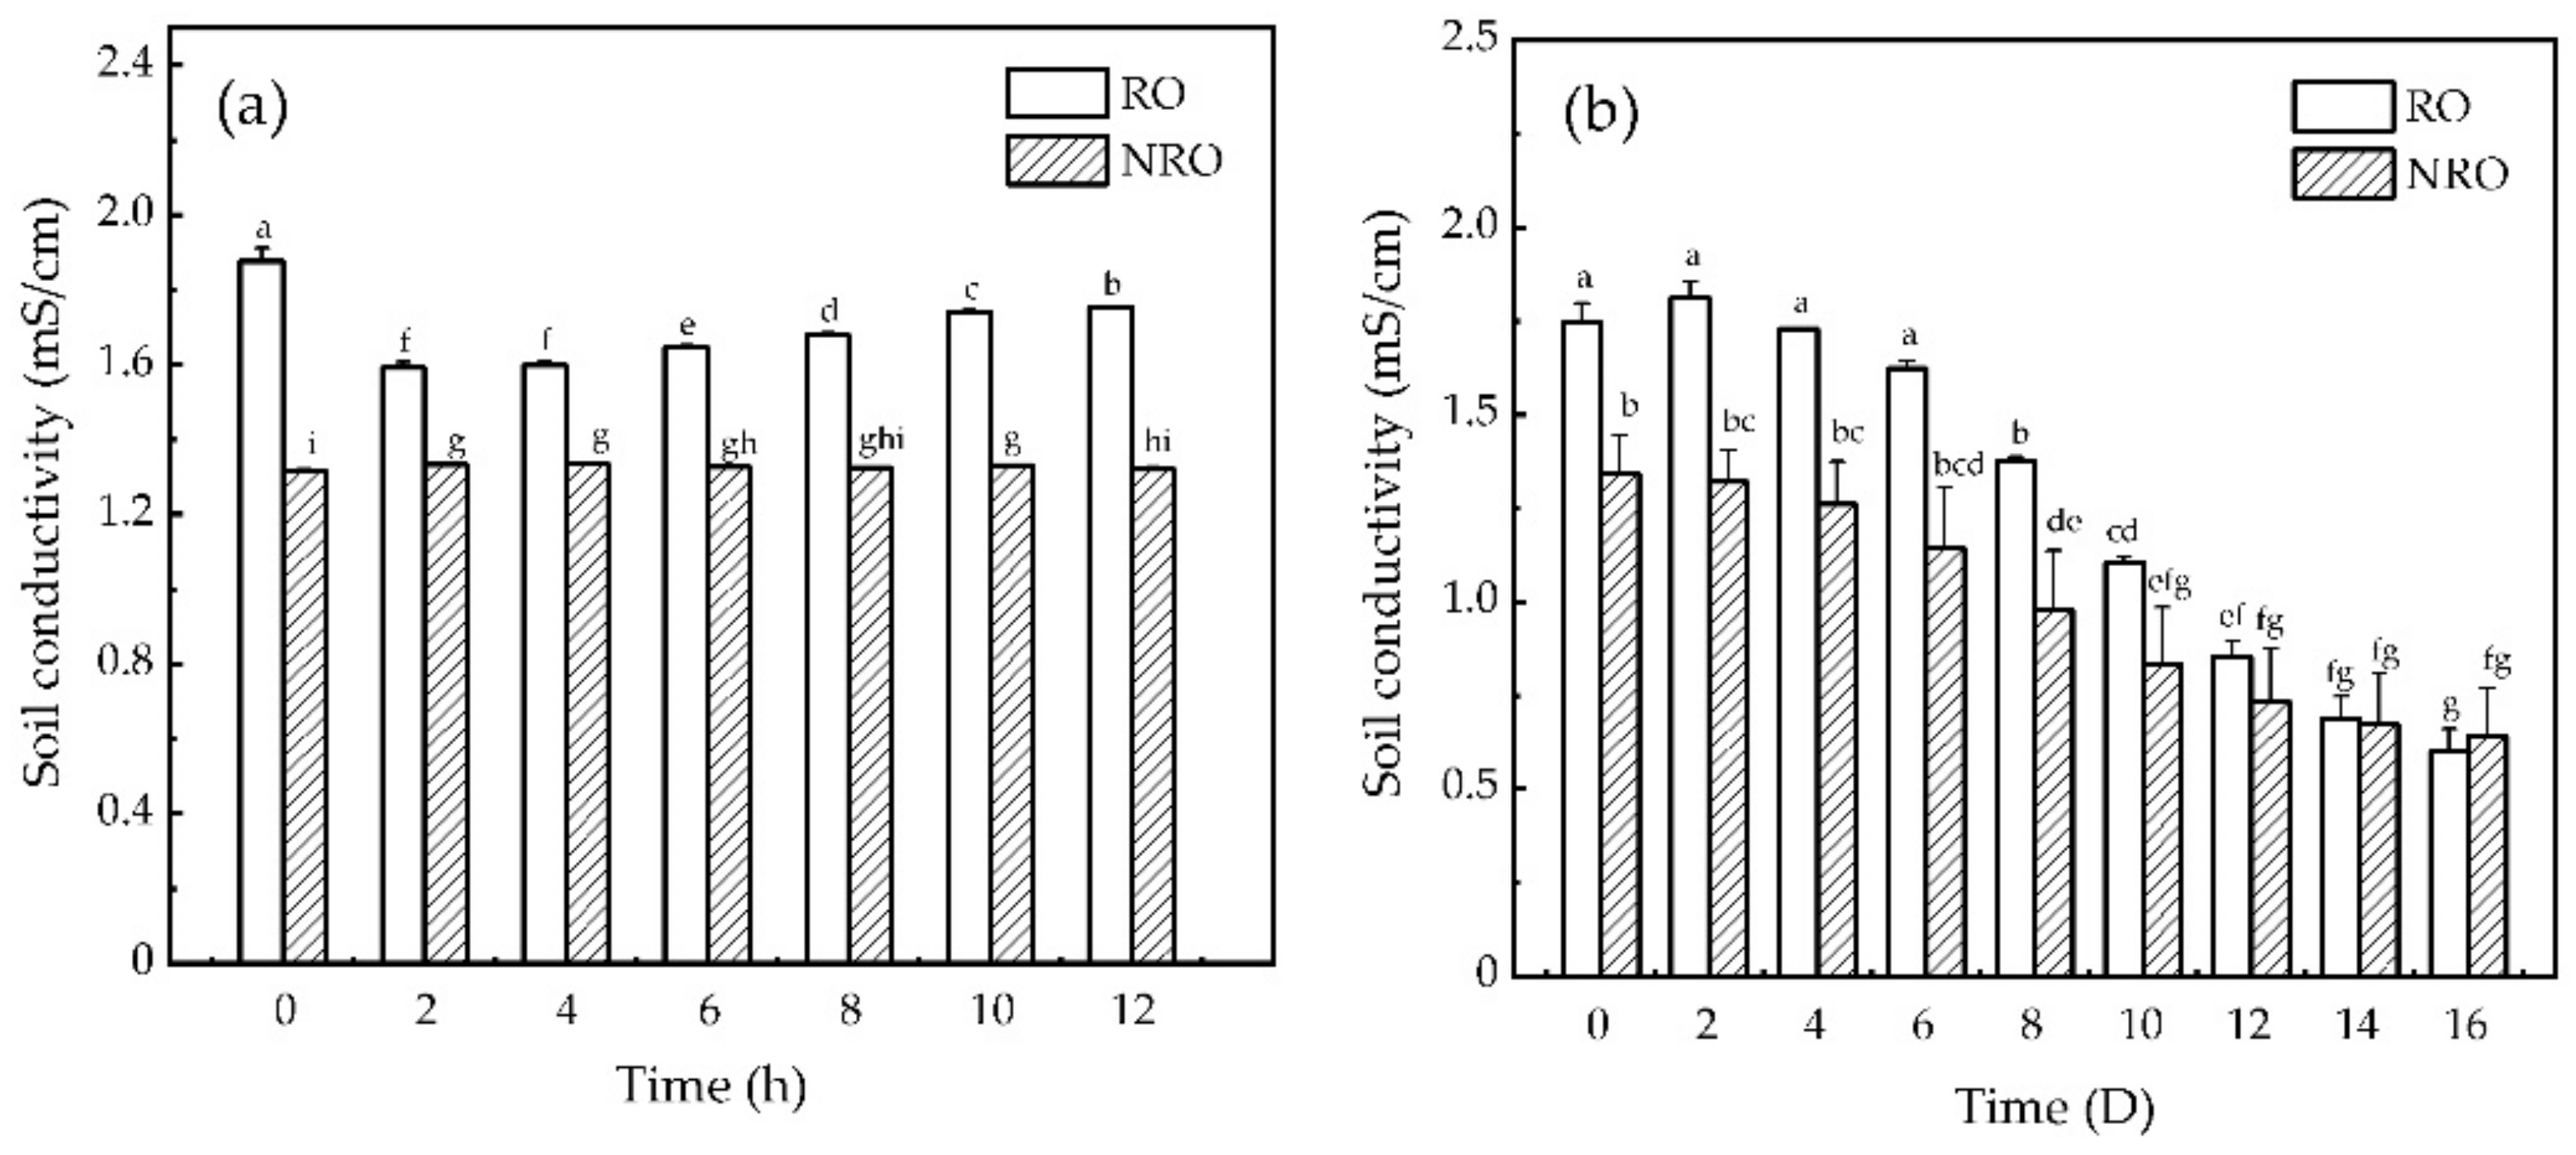
Figure 4 shows the variation patterns of soil conductivity with increasing drought time in the two habitats. According to the standards of soil salinization grade classification [44], the two habitats belong to non-salinization soil. The soil conductivity under diurnal variation in the rock outcrops was at a maximum at 0 h from the onset of the simulated rainfall, and then decreased to its lowest at 2 h, and gradually increased over time from 4–12 h. The variation in soil conductivity in the non-outcrops was not significant (Figure 4a). Under day-to-day drought conditions, soil conductivity increased sharply at the beginning of the rainfall and then gradually decreased (Figure 4b). There was a significant difference in soil conductivity between the two habitats (p < 0.05), the soil conductivity of rock outcrops was significantly higher than that of non-outcrops, and the difference between the two habitats gradually decreased with the continuing drought. Soil conductivity in the rock outcrops did not change significantly from 0 to 6 d, and it decreased continuously with increasing drought time after 6 d, while the non-outcrops showed a slow decreasing trend with drought.
3.4.2. Dynamic Changes in Soil pH and HCO3− with Drought Time
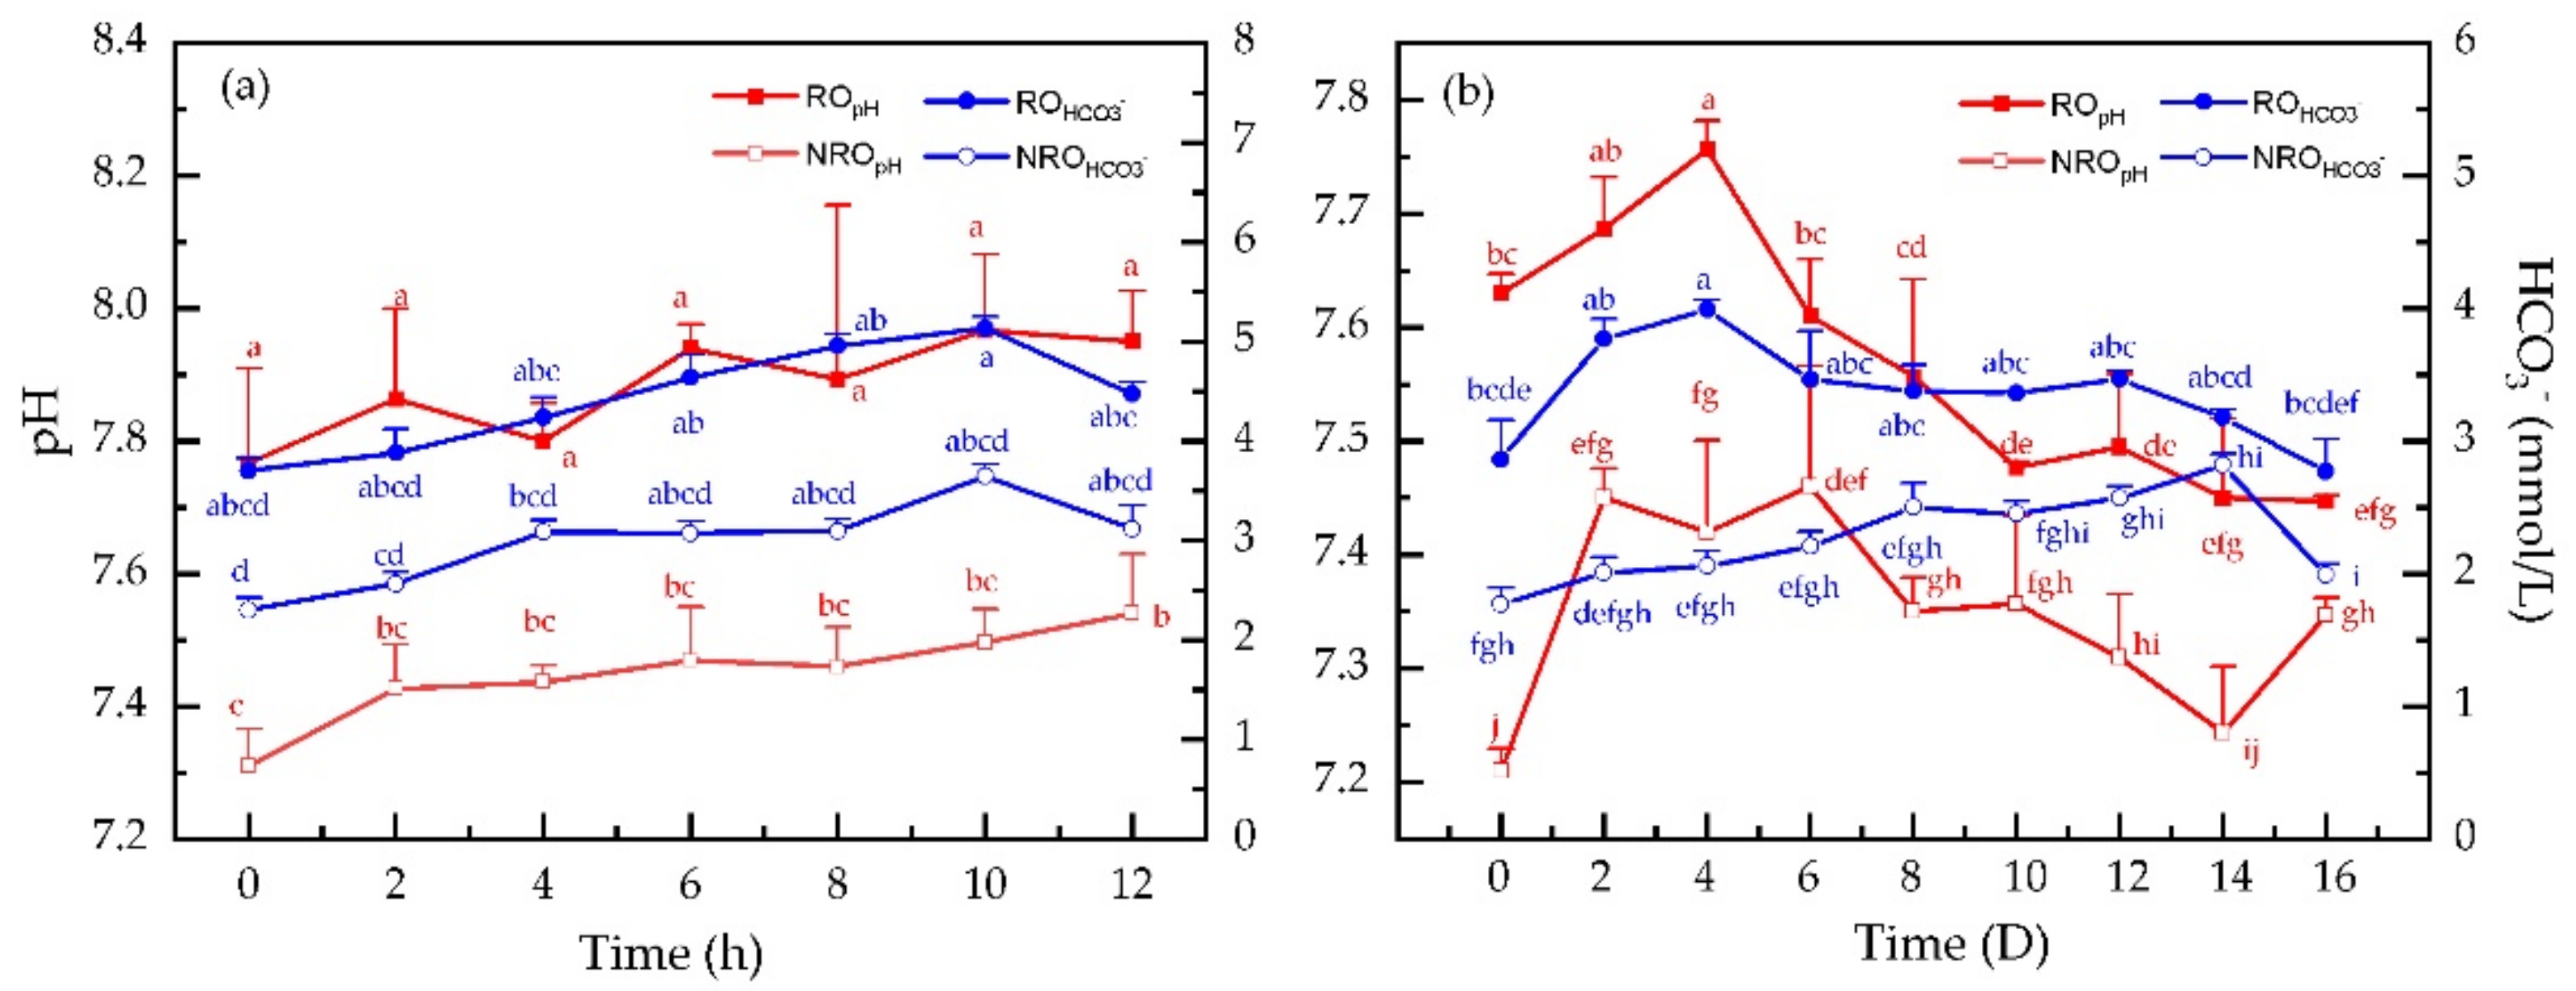
Soil HCO3− concentration and pH varied significantly with drought time. Under diurnal variation (Figure 5a), soil HCO3− concentrations in both rock outcrops and non-outcrops reached the maximum values (4.8042 mmol/L and 3.5373 mmol/L) at 10 h after simulated rainfall. The soil solution pH changed slightly in the non-outcrops, while no clear change was observed in the rock outcrops. Under day-to-day drought conditions (Figure 5b), the soil HCO3− concentration and pH varied remarkably as time increased, with significantly higher HCO3− concentration and pH in the rock outcrops than in non-outcrops, especially in the first 4 d of continuous drought, when both the HCO3− concentration and pH in rock outcrops reached a peak of 3.9909 mmol/L and 7.76 mmol/L, respectively. After 4 to 6 d of drought, the HCO3− produced by dissolution dissociated into CO2 and H2O, and the CO2 escaped, after which it showed a stable state. Therefore, in the drought period, the dynamic changes of HCO3− in the rock outcrops habitat with pH first increased, then degassed, and finally stabilized, achieving a zero-carbon sink. In contrast, the soil HCO3− concentration in non-outcrops did not change remarkably throughout the drought period, and its pH value increased incrementally after simulated rainfall then began to decrease, and slightly increased at the end the treatment. Figure 5a shows that the soil reached a high saturation level after simulated rainfall, and the H+ in the soil gradually diluted with increasing water content, resulting in a gradual increase in pH and HCO3− content. A similar trend was observed under day-to-day variations. In the first 4 d after simulated rainfall, the HCO3− in soil was enriched with increasing drought time because the soil water content was still in a more saturated state; after 4 consecutive d of drought, the HCO3− content and pH in the soil started to show a decreasing trend.
3.4.3. Correlation of Soil Parameters in Two Habitats
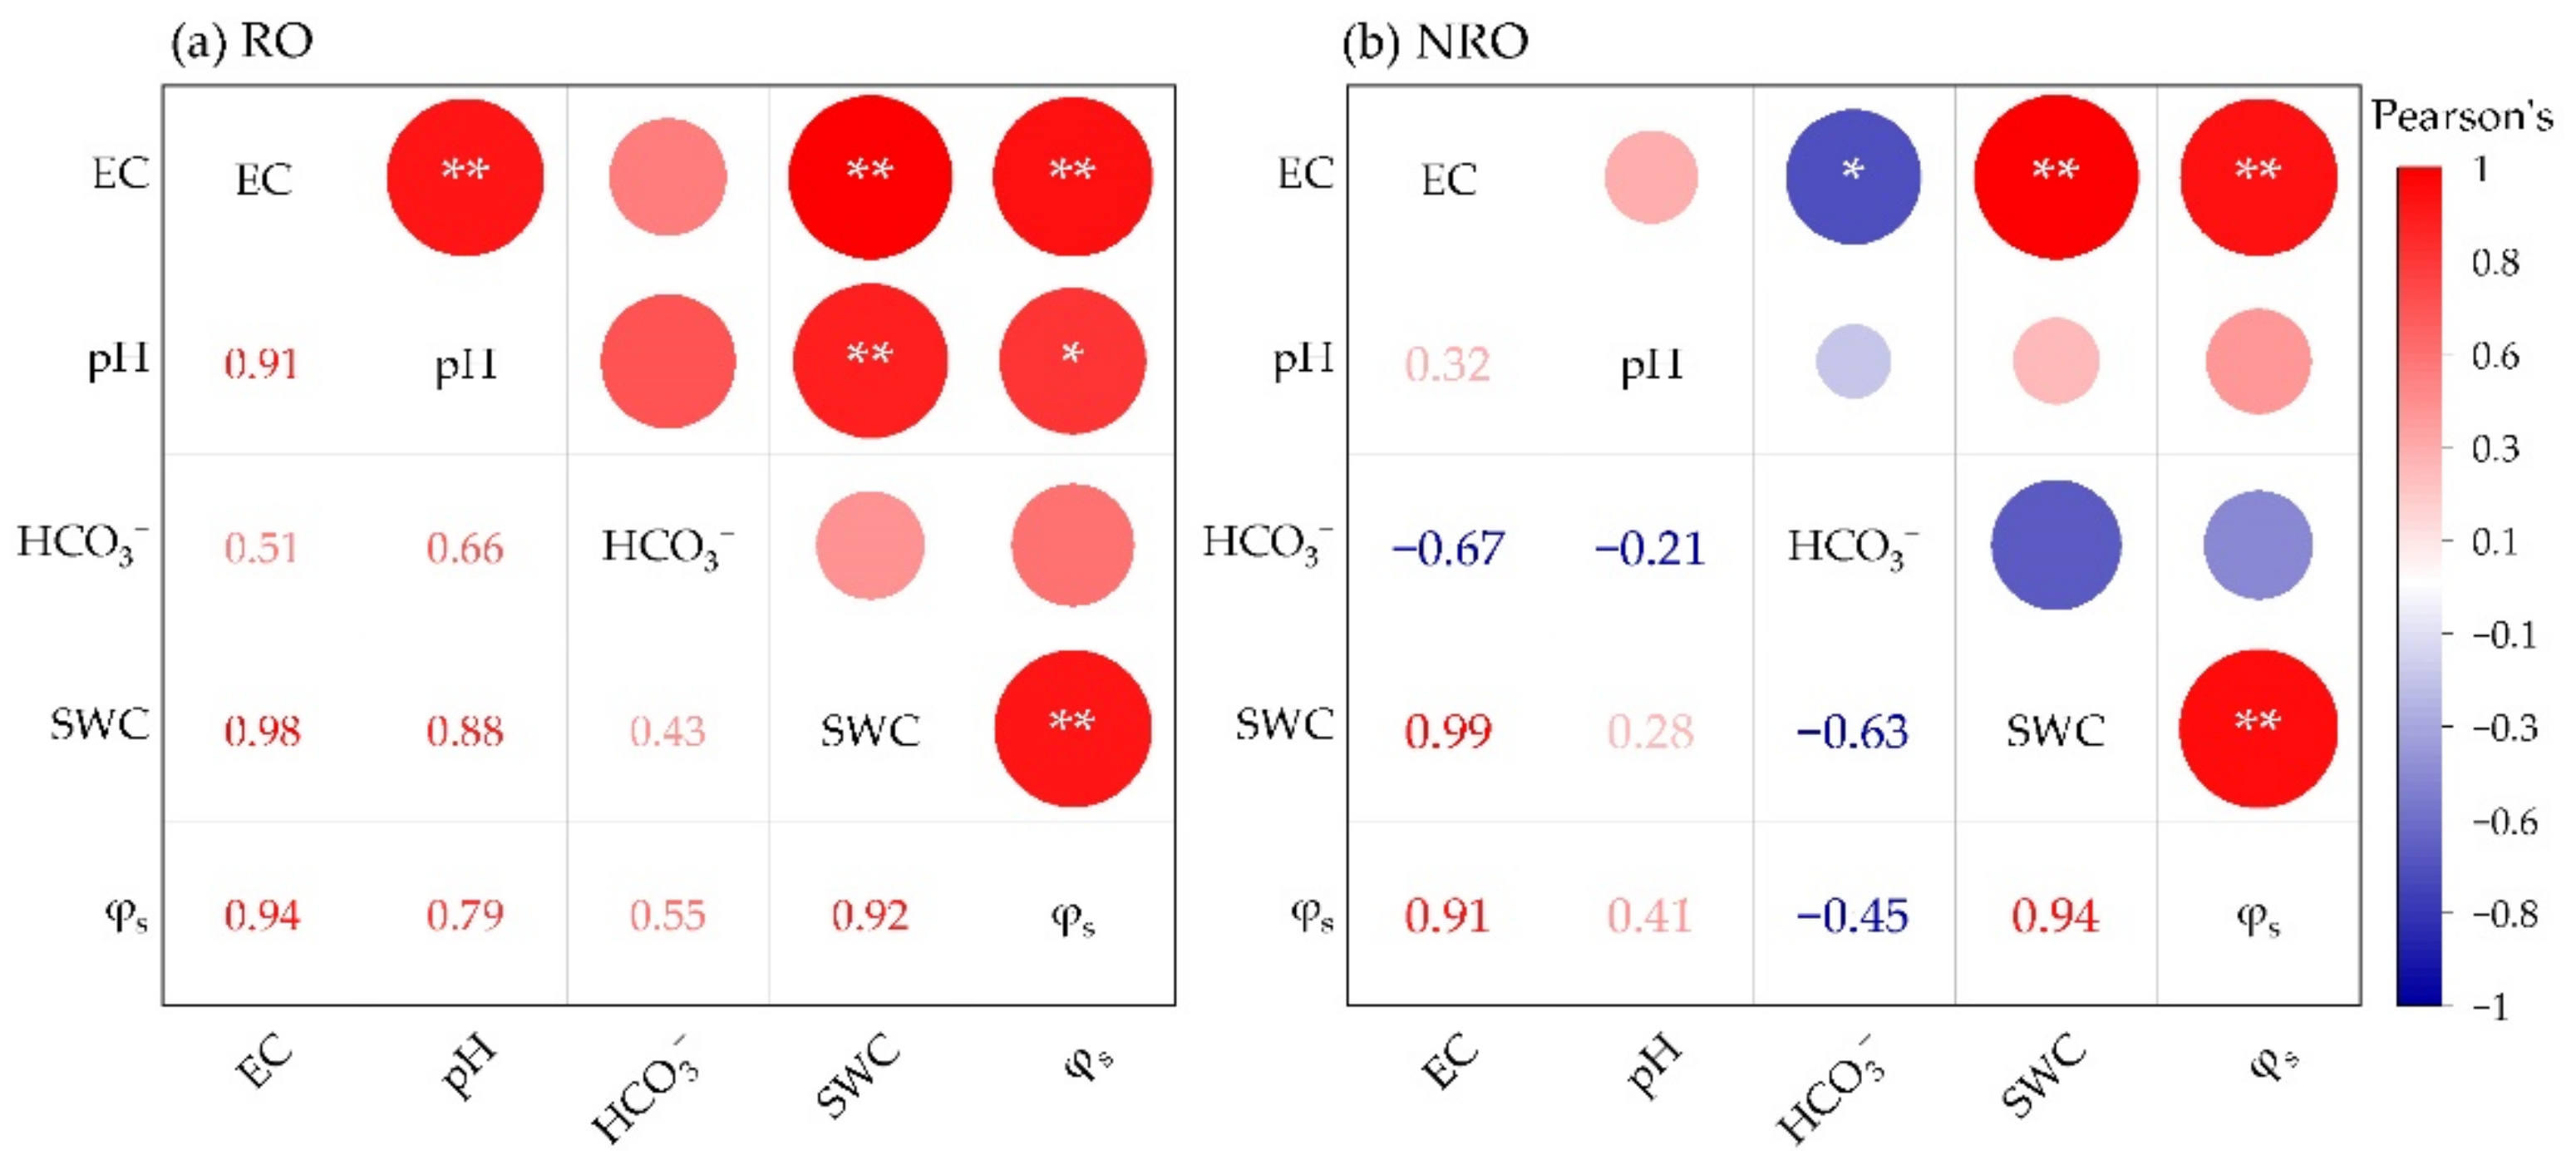
In this study, the relationships between EC, pH, HCO3−, SWC, and in two habitats was investigated. In rock outcrops (Figure 6a), EC was strongly positively correlated with pH, SWC and (p < 0.01). pH showed a strong positive correlation with SWC (p < 0.01), and a positive correlation with (p < 0.05). SWC was strongly positively correlated with (p < 0.01). In non-outcrops (Figure 6b), EC was strongly positively correlated with SWC and (p < 0.01), and a negatively correlated with HCO3− (p < 0.05). SWC was strongly positively correlated with (p < 0.01). The relationship between soil HCO3− concentration and other parameters in rock outcrop habitats during drought was not significant (p > 0.05). However, soil HCO3− concentrations in non-outcrop habitats during drought had a significant negative correlation only with EC, but not with any other parameters (p > 0.05).
4. Discussion
4.1. Water Retention Function of Soils under Drought in the Two Habitats
Karst soil water is influenced by a combination of rainfall, surface rock exposure, drought time, and geological structure, showing strong spatial and temporal heterogeneity [45]. It was found that the average evaporation of rock outcrops (4.15 mm/h) was significantly lower than that of non-outcrops (8.99 mm/h) in daily variation. At the same time, the soil water content of rock outcrops was significantly higher than that of non-outcrops on d 10 from the onset of drought. Rock outcrops have positive hydrological effects during drought periods, and different drought times and levels not only affect soil water content, but also lead to redistribution of soil water to a more uniform state, horizontally and vertically [42]. Our study showed that the rock outcrops in a karst area had a significant positive effect on soil water accumulation. With a continuous increase in drought time, the redistribution of water generated by runoff processes creates a heterogeneous spatial distribution of soil water [46], and the water retention function of soils in rock outcrops increased significantly. Under diurnal drought, rock outcrops are considered a potential factor influencing soil water distribution near exposed rocks, especially after rainfall [47]. Our results showed that the soil water content of the two habitats had a downward trend only for 0–4 h, and then changed steadily at the rates of 0.2% and 0.16%, with mean values of 0.381 m3/m3 and 0.374 m3/m3 respectively. The soil water potential changed slightly during the day (Figure 3). However, under day-to-day drought conditions, this phenomenon was very obvious (Figure 3). Both reduced evapotranspiration due to rock shading and infiltration of runoff at the rock–soil interface are expected to increase soil moisture near rock outcrops [11]. Within the drought period, non-outcrops showed a quick soil water response to rainfall and more pronounced evaporation and infiltration changes, while the rock outcrops created a heterogeneous spatial distribution of soil water during rainfall, which was attributed to the redistribution of rainfall caused by rock surface runoff [48,49], making the soil water content in rock outcrops relatively stable during continuous drought. The soil water content around the rock outcrops was significantly higher than that of the non-outcrops, indicating that the water retention function of the soil in the rock outcrops was greater than that of the non-outcrops.
4.2. Carbon Sequestration and Sinks in Soils of the Two Habitats under Drought
Soils in karst regions are often affected by drought, but rainfall in the region is actually quite abundant. The solubility of surface carbonate rocks depends on the pH of the water around it [50,51]; abundant rainfall promotes the dissolution of carbonate rocks and the production of soil CO2 [52,53], which is also an important driver of carbon flux. It was observed that the presence of surface limestone promoted the increase of soil HCO3− concentration in rock–soil–water interactions. The average concentration of HCO3− in the soil of rock outcrops was 3.36 mmol/L, while that of non-outcrops was 2.26 mmol/L. The soil HCO3− concentration was significantly different among different habitats, and the soil HCO3− concentration in rock outcrops was higher than that in non-outcrops. A portion of the absorbed carbon could be stored in the soil solid phase, when the soil has a high pH and sufficient calcium [54]. Results of this study indicated that the soil HCO3− concentration in rock outcrops fluctuated with the dynamics of drought and rainfall. In the early stages of drought, soil patches in rock outcrops habitats have sufficient water content and the soil CO2 is consumed by carbonate dissolution [55], which led to the increase of soil pH and HCO3− concentration generated by dissolution at the rate of 37.6% and 9.6%, respectively, within 0–4 d of drought. Although there was no significant difference in soil conductivity values, the values also showed a slightly increasing trend. Furthermore, soil pH and salinity affect carbonate dissolution and precipitation through biochemical and physico–chemical processes during the carbon cycle [54]. Therefore, the carbon sink in the soil of the rock outcrops habitat is increased relative to the non-outcrops, which is related to the soil water content, increased CO2 concentration, and CaCO3 dissolution [55]. At present, many studies have been carried out on the link between pH and carbon. Varadharajan et al. and Saaltink et al. have reported that the pH affects the carbon balance in the soil [56,57]. Meanwhile, Drysdale et al. and Montety et al. also revealed that temperature changes could affect pH, and hence the solubility of carbonate rocks, increasing CO2 escape [58,59]. This was also reflected in our study, where pH in rock outcrops gradually decreased from d 4 of drought onwards, and their soil conductivity and HCO3− concentrations also decreased. On d 0 to 4 from the onset of the drought, the soil HCO3− concentration gradually increased and a carbon sink occurred. Subsequently, from d 4 to 6, the soil HCO3− concentration began to decrease, the CO2 escaped, and soil degassing gradually appeared. Some studies have found that soil HCO3− can promote plant growth [60] and be used as a carbon source for plant uptake [61]. Therefore, rock outcrops have more carbon resources than non-outcrops, which can promote photosynthesis of plants. However, the carbon uptake and release of rock outcrops tended to be stable throughout the drought period, and the carbon sink gradually became zero. Our results are consistent with basic ecological theory, that is, the carbon sink of a given ecosystem will inevitably approach zero in an undisturbed natural state, which is attributed to of the long-term dynamics of the ecosystem [62]. In comparison, the variation in soil HCO3− concentration in non-outcrops during the drought period was not significant, thereby also indirectly corresponding to the possibility that the carbon sinks occurring in rock outcrops are only from rocky dissolution, and the depletion of atmospheric/soil CO2 is not significant.
4.3. Coupling Effect of Soil Water Content and HCO3− under Drought
Our research found that HCO3− concentrations in soils of rock outcrops were not significantly related to SWC throughout the drought period, whereas HCO3− in non-outcrops was negatively correlated with EC (Figure 6). In the study by Yang et al. [63], soils with higher water content and lower temperature were reported to promote CO2 fixation, while soil CO2 was gradually consumed by carbonate dissolution, increasing the dissolved carbonate content [64]. Cao et al. found that the lower the rainfall and temperature, the lower the carbonate rock erosion rate and carbon sink became [65]. This is consistent with the results in our study, where HCO3− in the soil showed large differences between drought times. The dynamic changes in soil HCO3− concentration with declining water content in the two habitats can be divided into two stages: enrichment and degassing. The two stages in the rock outcrops were an initial enrichment stage of 0–4 d and a degassing stage of 4–16 d; the two stages in the non-outcrops were an initial enrichment stage of 0–14 d and a degassing stage of 14–16 d. In the first stage, the soil of the rock outcrops had slight evaporation, insignificant changes in soil conductivity, and a high water retention capacity, and this gave the retained water in the soils of rock outcrops sufficient reaction time to dissolve CO2 as well as to promote the dissolution of limestone. With increasing time, the soil solution pH and HCO3− concentration increased more rapidly due to the influence of CO2 and limestone dissolution, consuming more soil CO2 and continuously enriching the HCO3− in the soil patches. However, in the second stage, the soil water content decreased significantly, which limited the ability of soil to obtain the atmospheric CO2 for carbon assimilation and weakened the process of limestone dissolution. The combination of H+ and HCO3− in the soil released CO2 into the soil and atmosphere, leading to the increased concentration of free CO2 in the water column and a significant decrease in the soil solution pH and soil conductivity; this was the time at which the soil degassing effect gradually appeared. While the rate of increase of the soil HCO3− concentration in the non-outcrops was not obvious in the first stage. In the second stage, under continuous drought, the soil water content decreased significantly, leading to a gradual decline in the soil HCO3− concentration and the beginning of degassing in non-outcrops. Moreover, the trends of pH and conductivity in non-outcrops were consistent with those in rock outcrops, and their values were lower than those in rock outcrops. In conclusion, under water-saturated conditions, soil HCO3− concentration increased gradually and was enriched, Under day-to-day drought conditions, degassing of HCO3− occurs. Soil HCO3− fluctuated with changes in the water content, thereby causing changes in the carbonate dissolution environment.
4.4. Limitations of the Study
The present study has several limitations. Firstly, the indoor potted simulated outcrop habitat is small and single in type, and the geological complexity of karst areas and the complex and variable patterns of soil water infiltration around rock outcrops are still unknown and need further research. Secondly, our experiments were carried out under ideal conditions, whereas rock outcrops in the field can be subject to the combined effects of weather, flora and fauna, and outcrop extent at any time. Consequently, our indoor simulation results may differ from those of field runoff infiltration and rock outcrop inorganic carbon dynamics. Finally, the current experimental results are limited to describing the dynamics of soil water and inorganic carbon in rock outcrops in stable ecological environments. Therefore, our study only provides the basis and rationale for further field experiments in rock outcrops.
5. Conclusions
This study quantitatively investigated the temporal variability of soil water carbon in rock outcrops and non-outcrop habitats under drought conditions, and discussed the response mechanism of soil water carbon in the two habitats to drought. We found that the evaporation of rock outcrops was slower and the soil water retention capacity was stronger than that of non-outcrops. Moreover, rain promoted the dissolution of limestone, which resulted in 1.49 times higher carbon sequestration capacity in the rock outcrops than in the non-outcrops. Furthermore, the inorganic carbon content of soils in karst areas was closely related to the soil water content, and other environmental factors. During the water deficit stage, a close to saturation water content in rock outcrops promoted carbonate dissolution, which changed the HCO3− concentrations in the soil solution from 2.862 mm/L to 3.991 mm/L, while low soil water content caused soil HCO3− to be released into the soil or atmosphere as CO2. As a result, the HCO3− concentrations in the soil solution changed from 3.991 mm/L to 2.772 mm/L. Therefore, the soil HCO3− concentration fluctuated with the external environmental conditions. In the rock–soil–water interaction, the soil HCO3− concentration in the rock outcrops in the early stage of drought caused a transient pulse phenomenon, but the overall carbon balance tended to be stable, showing the phenomenon of zero-carbon sinks. The variation in soil HCO3− concentration in non-outcrops was not significant during the drought period, which indirectly indicated that the carbon sink in rock outcrops was mainly derived from the dissolution of rocks, and the depletion of atmospheric/soil CO2 was not significant. Therefore, this study of the temporal characteristics of soil water and carbon under drought conditions provides a reference for matching the best crops to fragile karst ecosystems.
Author Contributions
Y.W. constructed and conceived the project. Y.W. and L.L. designed the research. L.L., Y.Z. and H.L. performed the research. L.L., A.X. and D.X. analyzed the data. L.L., D.X. and Y.W. wrote the paper. All authors have read and agreed to the published version of the manuscript.
Funding
This research was funded by Support Plan Projects of Science and Technology of Guizhou Province [number (2021) YB453].
Data Availability Statement
The data presented in this study are available on request from the corresponding author.
Acknowledgments
We are thankful to H.L. for providing the laboratory platform and experimental facilities, and to D.X. for his technical support during the experiments.
Conflicts of Interest
The authors declare no conflict of interest.
References
- Fitzsimons, J.A.; Michael, D.R. Rocky outcrops: A hard road in the conservation of critical habitats. Biol. Conserv. 2017, 211, 36–44. [Google Scholar] [CrossRef]
- Zhang, J.; Chen, H.; Su, Y.; Wu, J.; Zhang, W. Spatial variability of surface soil moisture content in depression area of karst region under moist and arid conditions. Chin. J. Appl. Ecol. 2006, 17, 2277–2282. [Google Scholar]
- Zhao, Z.; Shen, Y.; Jiang, R.; Wang, Q. Rock outcrops change infiltrability and water flow behavior in a karst soil. Vadose Zone J. 2020, 19, e20002. [Google Scholar] [CrossRef] [Green Version]
- Göransson, H.; Edwards, P.J.; Perreijn, K.; Smittenberg, R.H.; Olde Venterink, H. Rocks create nitrogen hotspots and N:P heterogeneity by funnelling rain. Biogeochemistry 2014, 121, 329–338. [Google Scholar] [CrossRef] [Green Version]
- Certini, G.; Campbell, C.D.; Edwards, A.C. Rock fragments in soil support a different microbial community from the fine earth. Soil Biol. Biochem. 2004, 36, 1119–1128. [Google Scholar] [CrossRef]
- Poesen, J.; Ingelmo-Sanchez, F.; Mucher, H. The hydrological response of soil surfaces to rainfall as affected by cover and position of rock fragments in the top layer. Earth Surf. Process. Landf. 1990, 15, 653–671. [Google Scholar] [CrossRef]
- Li, S.; Ren, H.; Yao, X. Responses of soil moisture to bare rocks in Karst rock desertification region of Southwest China during dry season. Chin. J. Ecol. 2012, 31, 3174–3178. [Google Scholar] [CrossRef]
- Shen, Y.; Wang, D.; Chen, Q.; Tang, Y.; Chen, F. Large heterogeneity of water and nutrient supply derived from runoff of nearby rock outcrops in karst ecosystems in SW China. Catena 2019, 172, 125–131. [Google Scholar] [CrossRef]
- Wang, D.; Shen, Y.; Li, Y.; Huang, J. Rock Outcrops Redistribute Organic Carbon and Nutrients to Nearby Soil Patches in Three Karst Ecosystems in SW China. PLoS ONE 2016, 11, e0160773. [Google Scholar] [CrossRef] [Green Version]
- Carlucci, M.B.; Bastazini, V.A.G.; Hofmann, G.S.; de Macedo, J.H.; Iob, G.; Duarte, L.D.S.; Hartz, S.M.; Müller, S.C. Taxonomic and functional diversity of woody plant communities on opposing slopes of inselbergs in southern Brazil. Plant Ecol. Divers. 2015, 8, 187–197. [Google Scholar] [CrossRef]
- Li, S.; Birk, S.; Xue, L.; Ren, H.; Chang, J.; Yao, X. Seasonal changes in the soil moisture distribution around bare rock outcrops within a karst rocky desertification area (Fuyuan County, Yunnan Province, China). Environ. Earth Sci. 2016, 75, 1482. [Google Scholar] [CrossRef]
- Khadka, M.B.; Martin, J.B.; Jin, J. Transport of dissolved carbon and CO2 degassing from a river system in a mixed silicate and carbonate catchment. J. Hydrol. 2014, 513, 391–402. [Google Scholar] [CrossRef]
- Liu, W.; Wei, J.; Cheng, J.; Li, W. Profile distribution of soil inorganic carbon along a chronosequence of grassland restoration on a 22-year scale in the Chinese Loess Plateau. Catena 2014, 121, 321–329. [Google Scholar] [CrossRef]
- Berner, R.A. Weathering, plants, and the long-term carbon cycle. Geochim. Cosmochim. Acta 1992, 56, 3225–3231. [Google Scholar] [CrossRef]
- Yuan, D. Sensitivity and records of karst effects to environment change. Chin. Sci. Bull. 1995, 40, 1210–1213. [Google Scholar] [CrossRef]
- Yuan, D. Progress in the Study on Karst Processes and Carbon Cycle. Adv. Earth Sci. 1999, 14, 425–432. [Google Scholar] [CrossRef]
- Manning, D.A.C. Biological enhancement of soil carbonate precipitation: Passive removal of atmospheric CO2. Mineral. Mag. 2008, 72, 639–649. [Google Scholar] [CrossRef]
- Carmi, I.; Kronfeld, J.; Moinester, M. Sequestration of atmospheric carbon dioxide as inorganic carbon in the unsaturated zone under semi-arid forests. Catena 2019, 173, 93–98. [Google Scholar] [CrossRef] [Green Version]
- Nyachoti, S.; Jin, L.; Tweedie, C.E.; Ma, L. Insight into factors controlling formation rates of pedogenic carbonates: A combined geochemical and isotopic approach in dryland soils of the US Southwest. Chem. Geol. 2019, 527, 118503. [Google Scholar] [CrossRef]
- Romero-Mujalli, G.; Hartmann, J.; Börker, J.; Gaillardet, J.; Calmels, D. Ecosystem controlled soil-rock pCO2 and carbonate weathering—Constraints by temperature and soil water content. Chem. Geol. 2019, 527, 118634. [Google Scholar] [CrossRef]
- Rose, M.T.; Rose, T.J.; Pariasca-Tanaka, J.; Yoshihashi, T.; Neuweger, H.; Goesmann, A.; Frei, M.; Wissuwa, M. Root metabolic response of rice (Oryza sativa L.) genotypes with contrasting tolerance to zinc deficiency and bicarbonate excess. Planta 2012, 236, 959–973. [Google Scholar] [CrossRef] [PubMed]
- Poschenrieder, C.; Fernandez, J.A.; Rubio, L.; Perez, L.; Teres, J.; Barcelo, J. Transport and Use of Bicarbonate in Plants: Current Knowledge and Challenges Ahead. Int. J. Mol. Sci. 2018, 19, 1352. [Google Scholar] [CrossRef] [PubMed] [Green Version]
- Shahsavandi, F.; Eshghi, S.; Gharaghani, A.; Ghasemi-Fasaei, R.; Jafarinia, M. Effects of bicarbonate induced iron chlorosis on photosynthesis apparatus in grapevine. Sci. Hortic. 2020, 270, 109427. [Google Scholar] [CrossRef]
- Wang, R.; Wu, Y.; Xing, D.; Hang, H.; Xie, X.; Yang, X.; Zhang, K.; Rao, S. Biomass Production of Three Biofuel Energy Plants’ Use of a New Carbon Resource by Carbonic Anhydrase in Simulated Karst Soils: Mechanism and Capacity. Energies 2017, 10, 1370. [Google Scholar] [CrossRef] [Green Version]
- Goudie, A.S.; Viles, H.A. Weathering and the global carbon cycle: Geomorphological perspectives. Earth Sci. Rev. 2012, 113, 59–71. [Google Scholar] [CrossRef]
- Harmon, R.S.; White, W.B.; Drake, J.J.; Hess, J.W. Regional hydrochemistry of North American carbonate terrains. Water Resour. Res. 1975, 11, 963–967. [Google Scholar] [CrossRef]
- Covington, M.D.; Vaughn, K.A. Carbon dioxide and dissolution rate dynamics within a karst underflow-overflow system, Savoy Experimental Watershed, Arkansas, USA. Chem. Geol. 2019, 527, 118689. [Google Scholar] [CrossRef]
- Piao, S.; Zhang, X.; Chen, A.; Liu, Q.; Lian, X.; Wang, X.; Peng, S.; Wu, X. The impacts of climate extremes on the terrestrial carbon cycle: A review. Sci. China Earth Sci. 2019, 49, 1321–1334. [Google Scholar] [CrossRef]
- Poulter, B.; Frank, D.; Ciais, P.; Myneni, R.B.; Andela, N.; Bi, J.; Broquet, G.; Canadell, J.G.; Chevallier, F.; Liu, Y.Y.; et al. Contribution of semi-arid ecosystems to interannual variability of the global carbon cycle. Nature 2014, 509, 600–603. [Google Scholar] [CrossRef] [Green Version]
- Piao, S.; Wang, X.; Wang, K.; Li, X.; Bastos, A.; Canadell, J.G.; Ciais, P.; Friedlingstein, P.; Sitch, S. Interannual variation of terrestrial carbon cycle: Issues and perspectives. Glob. Chang. Biol. 2019, 26, 300–318. [Google Scholar] [CrossRef] [Green Version]
- Dart, R.C.; Barovich, K.M.; Chittleborough, D.J.; Hill, S.M. Calcium in regolith carbonates of central and southern Australia:Its source and implications for the global carbon cycle. Palaeogeogr. Palaeoclimatol. Palaeoecol. 2007, 249, 322–334. [Google Scholar] [CrossRef]
- Liu, Z. Is pedogenic carbonate an important atmospheric CO2 sink? Chin. Sci. Bull. 2011, 56, 3794–3796. [Google Scholar] [CrossRef] [Green Version]
- Curl, R.L. Carbon Shifted but Not Sequestered. Science 2012, 335, 655. [Google Scholar] [CrossRef]
- Cao, J.; Yuan, D.; Chris, G.; Huang, F.; Yang, H.; Lu, Q. Carbon Fluxes and Sinks: The Consumption of Atmospheric and Soil CO2 by Carbonate Rock Dissolution. Acta Geol. Sin. 2012, 86, 963–972. [Google Scholar] [CrossRef]
- Zhao, Z.; Shen, Y. Rain-induced weathering dissolution of limestone and implications for the soil sinking-rock outcrops emergence mechanism at the karst surface: A case study in southwestern China. Carbonates Evaporites 2022, 37, 69. [Google Scholar] [CrossRef]
- Feng, T.; Chen, H.; Wang, K.; Nie, Y.; Zhang, X.; Mo, H. Assessment of underground soil loss via the tapering grikes on limestone hillslopes. Agric. Ecosyst. Environ. 2020, 297, 106935. [Google Scholar] [CrossRef]
- Mao, D.; Cao, Y.; Zhu, W.; Tian, F.; Hao, L.; Kang, L.; Zhang, T. Climatic Characteristics of Short-Time Severe Precipitation in Southwest China. Meteorol. Mon. 2018, 44, 1042–1050. [Google Scholar] [CrossRef]
- Yuan, C.; Lei, T.; Mao, L.; Liu, H.; Wu, Y. Soil surface evaporation processes under mulches of different sized gravel. Catena 2009, 78, 117–121. [Google Scholar] [CrossRef]
- Zeitoun, R.; Vandergeest, M.; Vasava, H.B.; Machado, P.V.F.; Jordan, S.; Parkin, G.; Wagner-Riddle, C.; Biswas, A. In-Situ Estimation of Soil Water Retention Curve in Silt Loam and Loamy Sand Soils at Different Soil Depths. Sensors 2021, 21, 447. [Google Scholar] [CrossRef]
- Wu, Y.; Hu, L.; Gu, R.; Wu, Y.; Li, M. Relationship between soil water potential and water content of two soils. J. Drain. Irrig. Mach. Eng. 2017, 35, 351–356. [Google Scholar] [CrossRef]
- Inskeep, W.P.; Bloom, P.R. A comparative study of soil solution chemistry associated with chlorotic and nonchlorotic soybeans in western Minnesota. J. Plant Nutr. 1984, 7, 513–531. [Google Scholar] [CrossRef]
- Boxma, R. Bicarbonate as the most important soil factor in lime-induced chlorosis in the Netherlands. Plant Soil 1972, 37, 233–243. [Google Scholar] [CrossRef]
- Xie, J.; Guan, W.; Cui, G.; Sun, G.; Wang, M.; Qi, Z. Soil moisture characteristics of different vegetation types in xilin gol grassland. J. Northeast For. Univ. 2009, 37, 45–48. [Google Scholar]
- Wang, H.; Li, H.; Dong, Z.; Chen, X.; Shao, S. Salinization characteristics of afforested coastal saline soil as affected by species of trees used in afforestation. Acta Pedol. Sin. 2015, 52, 706–712. [Google Scholar]
- Yang, J.; Chen, H.; Nie, Y.; Wang, K. Dynamic variations in profile soil water on karst hillslopes in Southwest China. Catena 2019, 172, 655–663. [Google Scholar] [CrossRef]
- Schlesinger, W.H.; Reynolds, J.F.; Cunningham, G.L.; Huenneke, L.F.; Jarrell, W.M.; Virginia, R.A.; Whitford, W.G. Biological Feedbacks in Global Desertification. Science 1990, 247, 1043–1048. [Google Scholar] [CrossRef] [PubMed] [Green Version]
- Zhang, T.; Berndtsson, R. Temporal patterns and spatial scale of soil water variability in a small humid catchment. J. Hydrol. 1988, 104, 111–128. [Google Scholar] [CrossRef]
- Wang, D.J.; Shen, Y.X.; Huang, J.; Li, Y.H. Rock outcrops redistribute water to nearby soil patches in karst landscapes. Environ. Sci. Pollut. Res. Int. 2016, 23, 8610–8616. [Google Scholar] [CrossRef]
- Yang, J.; Nie, Y.; Chen, H.; Wang, S.; Wang, K. Hydraulic properties of karst fractures filled with soils and regolith materials: Implication for their ecohydrological functions. Geoderma 2016, 276, 93–101. [Google Scholar] [CrossRef]
- Plummer, L.N.; Wigley, T. The dissolution of calcite in CO2-saturated solutions at 25 °C and 1 atmosphere total pressure. Geochim. Cosmochim. Acta 1976, 40, 191–202. [Google Scholar] [CrossRef]
- Sweeting, M.M. Karst landforms. Nature 1977, 269, 840. [Google Scholar] [CrossRef]
- Qin, C.; Li, S.L.; Yue, F.J.; Xu, S.; Ding, H. Spatiotemporal variations of dissolved inorganic carbon and controlling factors in a small karstic catchment, Southwestern China. Earth Surf. Process. Landf. 2019, 44, 2423–2436. [Google Scholar] [CrossRef]
- Pu, J.; Li, J.; Zhang, T.; Xiong, X.; Yuan, D. High spatial and seasonal heterogeneity of pCO2 and CO2 emissions in a karst groundwater-stream continuum, southern China. Environ. Sci. Pollut. Res. Int. 2019, 26, 25733–25748. [Google Scholar] [CrossRef] [PubMed]
- Zhao, X.; Conrads, H.; Zhao, C.; Ingwersen, J.; Stahr, K.; Wei, X. The effect of different temperature and pH levels on uptake of CO2 in Solonchaks. Geoderma 2019, 348, 60–67. [Google Scholar] [CrossRef]
- Jin, L.; Ogrinc, N.; Hamilton, S.K.; Szramek, K.; Kanduc, T.; Walter, L.M. Inorganic carbon isotope systematics in soil profiles undergoing silicate and carbonate weathering (Southern Michigan, USA). Chem. Geol. 2009, 264, 139–153. [Google Scholar] [CrossRef]
- Varadharajan, C.; Tinnacher, R.M.; Pugh, J.D.; Trautz, R.C.; Zheng, L.; Spycher, N.F.; Birkholzer, J.T.; Castillo-Michel, H.; Esposito, R.A.; Nico, P.S. A laboratory study of the initial effects of dissolved carbon dioxide (CO2) on metal release from shallow sediments. Int. J. Greenh. Gas Control 2013, 19, 183–211. [Google Scholar] [CrossRef]
- Saaltink, M.W.; Vilarrasa, V.; De Gaspari, F.; Silva, O.; Carrera, J.; Rötting, T.S. A method for incorporating equilibrium chemical reactions into multiphase flow models for CO2 storage. Adv. Water Resour. 2013, 62, 431–441. [Google Scholar] [CrossRef]
- Drysdale, R.; Lucas, S.; Carthew, K. The influence of diurnal temperatures on the hydrochemistry of a tufa-depositing stream. Hydrol. Process. 2003, 17, 3421–3441. [Google Scholar] [CrossRef]
- De Montety, V.; Martin, J.B.; Cohen, M.J.; Foster, C.; Kurz, M.J. Influence of diel biogeochemical cycles on carbonate equilibrium in a karst river. Chem. Geol. 2011, 283, 31–43. [Google Scholar] [CrossRef]
- Rao, S.; Wu, Y. Root-derived bicarbonate assimilation in response to variable water deficit in Camptotheca acuminate seedlings. Photosynth. Res. 2017, 134, 59–70. [Google Scholar] [CrossRef]
- Wu, Y. Strategies to increase carbon fixation and sequestration by karst adaptable plants. Carsologica Sin. 2011, 30, 461–465. [Google Scholar] [CrossRef]
- Piao, S.; Yue, C.; Ding, J.; Guo, Z. Perspectives on the role of terrestrial ecosystems in the ‘carbon neutrality’ strategy. Sci. China Earth Sci. 2022, 65, 1178–1186. [Google Scholar] [CrossRef]
- Gao, Y.; Zhang, P.; Liu, J. One third of the abiotically-absorbed atmospheric CO2 by the loess soil is conserved in the solid phase. Geoderma 2020, 374, 114448. [Google Scholar] [CrossRef]
- Apps, J.A.; Zheng, L.; Zhang, Y.; Xu, T.; Birkholzer, J.T. Evaluation of Potential Changes in Groundwater Quality in Response to CO2 Leakage from Deep Geologic Storage. Transp. Porous Media 2010, 82, 215–246. [Google Scholar] [CrossRef]
- Cao, J.; Yuan, D.; Zhang, C.; Jiang, Z. Karst ecosystem constrained by geological conditions in southwest China. Earth Environ. 2004, 32, 1–8. [Google Scholar] [CrossRef]
Figure 1.
Illustration of karst rock outcrops. (a) Profile of soil water loss in rock outcrops. (b) Field karst rock outcrops. (c) Experimental setup.
Figure 1.
Illustration of karst rock outcrops. (a) Profile of soil water loss in rock outcrops. (b) Field karst rock outcrops. (c) Experimental setup.

Figure 2.
Diurnal variation in soil evaporation and infiltration in two habitats. (a) Changes in soil infiltration over time in two habitats. (b) Changes in soil evaporation over time in two habitats. RO and NRO represent rock outcrops and non-outcrops, respectively.
Figure 2.
Diurnal variation in soil evaporation and infiltration in two habitats. (a) Changes in soil infiltration over time in two habitats. (b) Changes in soil evaporation over time in two habitats. RO and NRO represent rock outcrops and non-outcrops, respectively.

Figure 3.
Diurnal and day-to-day variations in the soil water content and water potential in two habitats. (a) Diurnal variation of soil water content and soil water potential under drought conditions. (b) Day-to-day variation of soil water content and soil water potential under drought conditions. The bar graph and line graph represent the soil water content and soil water potential, respectively. Small letters indicate significant differences at 5% level p < 0.05 (Tukey).

Figure 4.
Diurnal and day-to-day variations in soil conductivity in two habitats. (a) Diurnal variation of soil conductivity under drought conditions. (b) Day-to-day variation of soil conductivity under drought conditions. RO and NRO represent the rock outcrop habitat and the non-outcrop habitat, respectively. Small letters indicate significant differences at 5% level p < 0.05 (Tukey).

Figure 5.
Diurnal and day-to-day variations in soil HCO3− and pH in two habitats. (a) Diurnal variation of soil HCO3− and pH under drought conditions. (b) Day-to-day variation of soil HCO3− and pH under drought conditions. RO and NRO represent the rock outcrop habitat and the non-outcrop habitat, respectively. Small letters indicate significant differences at 5% level p < 0.05 (Tukey).

Figure 6.
Pearson correlation coefficients between different parameters in soils of the two habitats. (a) indicates Pearson correlation analysis in rock outcrops habitat. (b) indicates Pearson correlation analysis in non-outcrops habitat. RO and NRO represent the rock outcrops habitat and the non-outcrops habitat, respectively. ** Correlation is significant at the 0.01 level (2-tailed). * Correlation is significant at the 0.05 level (2-tailed).


Table 1.
Basic physical and chemical properties of the soil.
| Soil Type | Particle Size/% | Nutrient Content/(g/kg) | pH | |||||
|---|---|---|---|---|---|---|---|---|
| <0.002 mm | 0.02~0.002 mm | 0.02~2 mm | C | N | Mg | Ca | ||
| Loam | 7.62 | 39.97 | 51.81 | 26.95 | 2.10 | 1.49 | 1.48 | 7.63 |
Table 2.
Fitting effects and equations of soil water characteristic curves in two habitats.
| Habitat Type | Equations and Parameters | ||||
|---|---|---|---|---|---|
| R2 | K | y0 | p | Equation | |
| RO | 0.9943 | 0.0245 | −0.0159 | <0.0001 | = [−0.0159 + 0.0245ln (1 + P)/(1 + P)] |
| NRO | 0.9730 | 0.0134 | −0.0127 | <0.0001 | = [−0.0127 + 0.01341ln (1 + P)/(1 + P)] |
| ROC | 0.9815 | 5.0316 | −1.0396 | <0.0001 | = [−1.0396 + 5.0316ln (1 + P)/(1 + P)] |
| NROC | 0.9906 | 3.3624 | −0.6819 | <0.0001 | = [−0.6819 + 3.3624ln (1 + P)/(1 + P)] |
Note: ROC and NROC represent rock outcrops and non-outcrops, respectively, during day-to-day variations stage. p indicates a significance of 0.05; is the soil water potential; p is the soil water content.
Publisher’s Note: MDPI stays neutral with regard to jurisdictional claims in published maps and institutional affiliations. |
© 2022 by the authors. Licensee MDPI, Basel, Switzerland. This article is an open access article distributed under the terms and conditions of the Creative Commons Attribution (CC BY) license (https://creativecommons.org/licenses/by/4.0/).
Share and Cite
MDPI and ACS Style
Luo, L.; Wu, Y.; Li, H.; Xing, D.; Zhou, Y.; Xia, A. Drought Induced Dynamic Traits of Soil Water and Inorganic Carbon in Different Karst Habitats. Water 2022, 14, 3837. https://doi.org/10.3390/w14233837
AMA Style
Luo L, Wu Y, Li H, Xing D, Zhou Y, Xia A. Drought Induced Dynamic Traits of Soil Water and Inorganic Carbon in Different Karst Habitats. Water. 2022; 14(23):3837. https://doi.org/10.3390/w14233837
Chicago/Turabian StyleLuo, Liang, Yanyou Wu, Haitao Li, Deke Xing, Ying Zhou, and Antong Xia. 2022. "Drought Induced Dynamic Traits of Soil Water and Inorganic Carbon in Different Karst Habitats" Water 14, no. 23: 3837. https://doi.org/10.3390/w14233837
Note that from the first issue of 2016, this journal uses article numbers instead of page numbers. See further details here.