
Sedimentation Rates: Anthropogenic Impacts and Environmental Changes in Transitional Water Systems
 , , , ,
  ,
,
Abstract
:1. Introduction
2. Materials and Methods
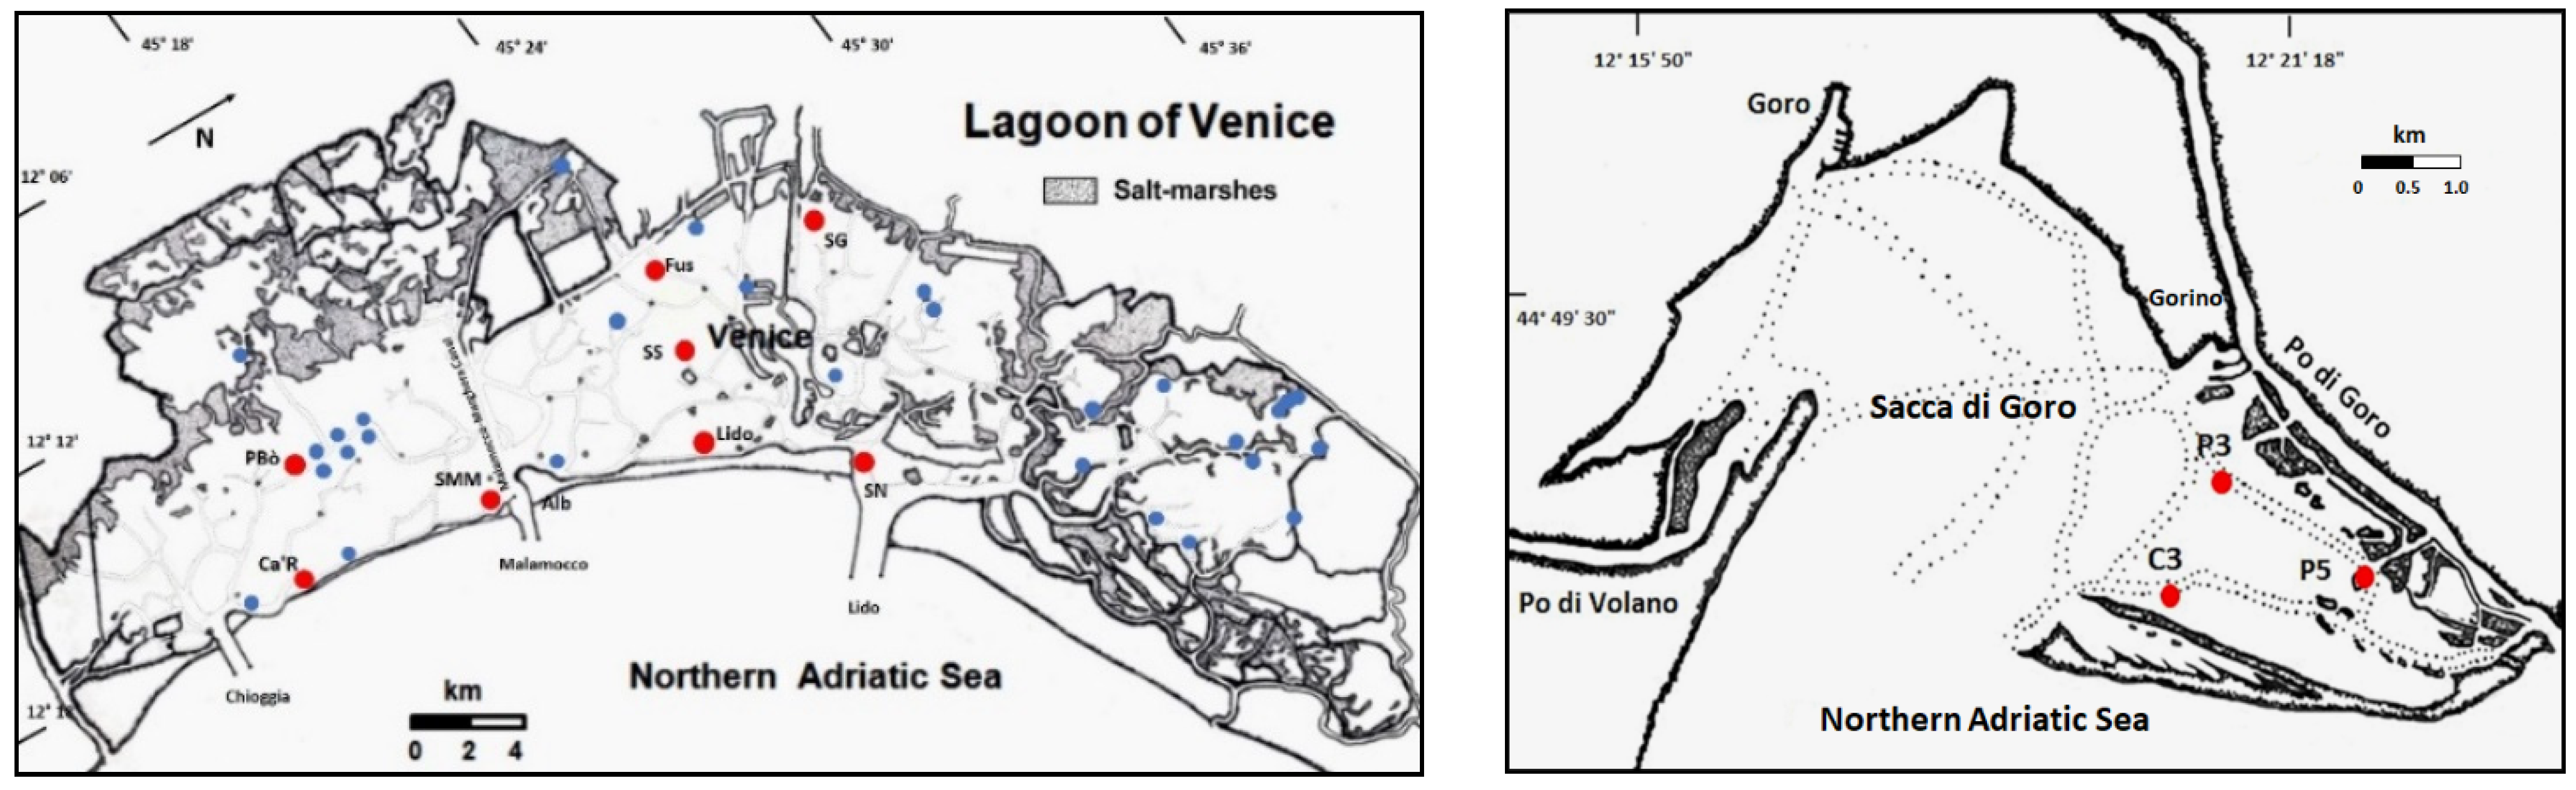
2.1. Study Areas
2.1.1. Venice Lagoon
2.1.2. Goro Lagoon
2.2. Sedimentation Traps
2.3. SPM Monitoring
3. Results
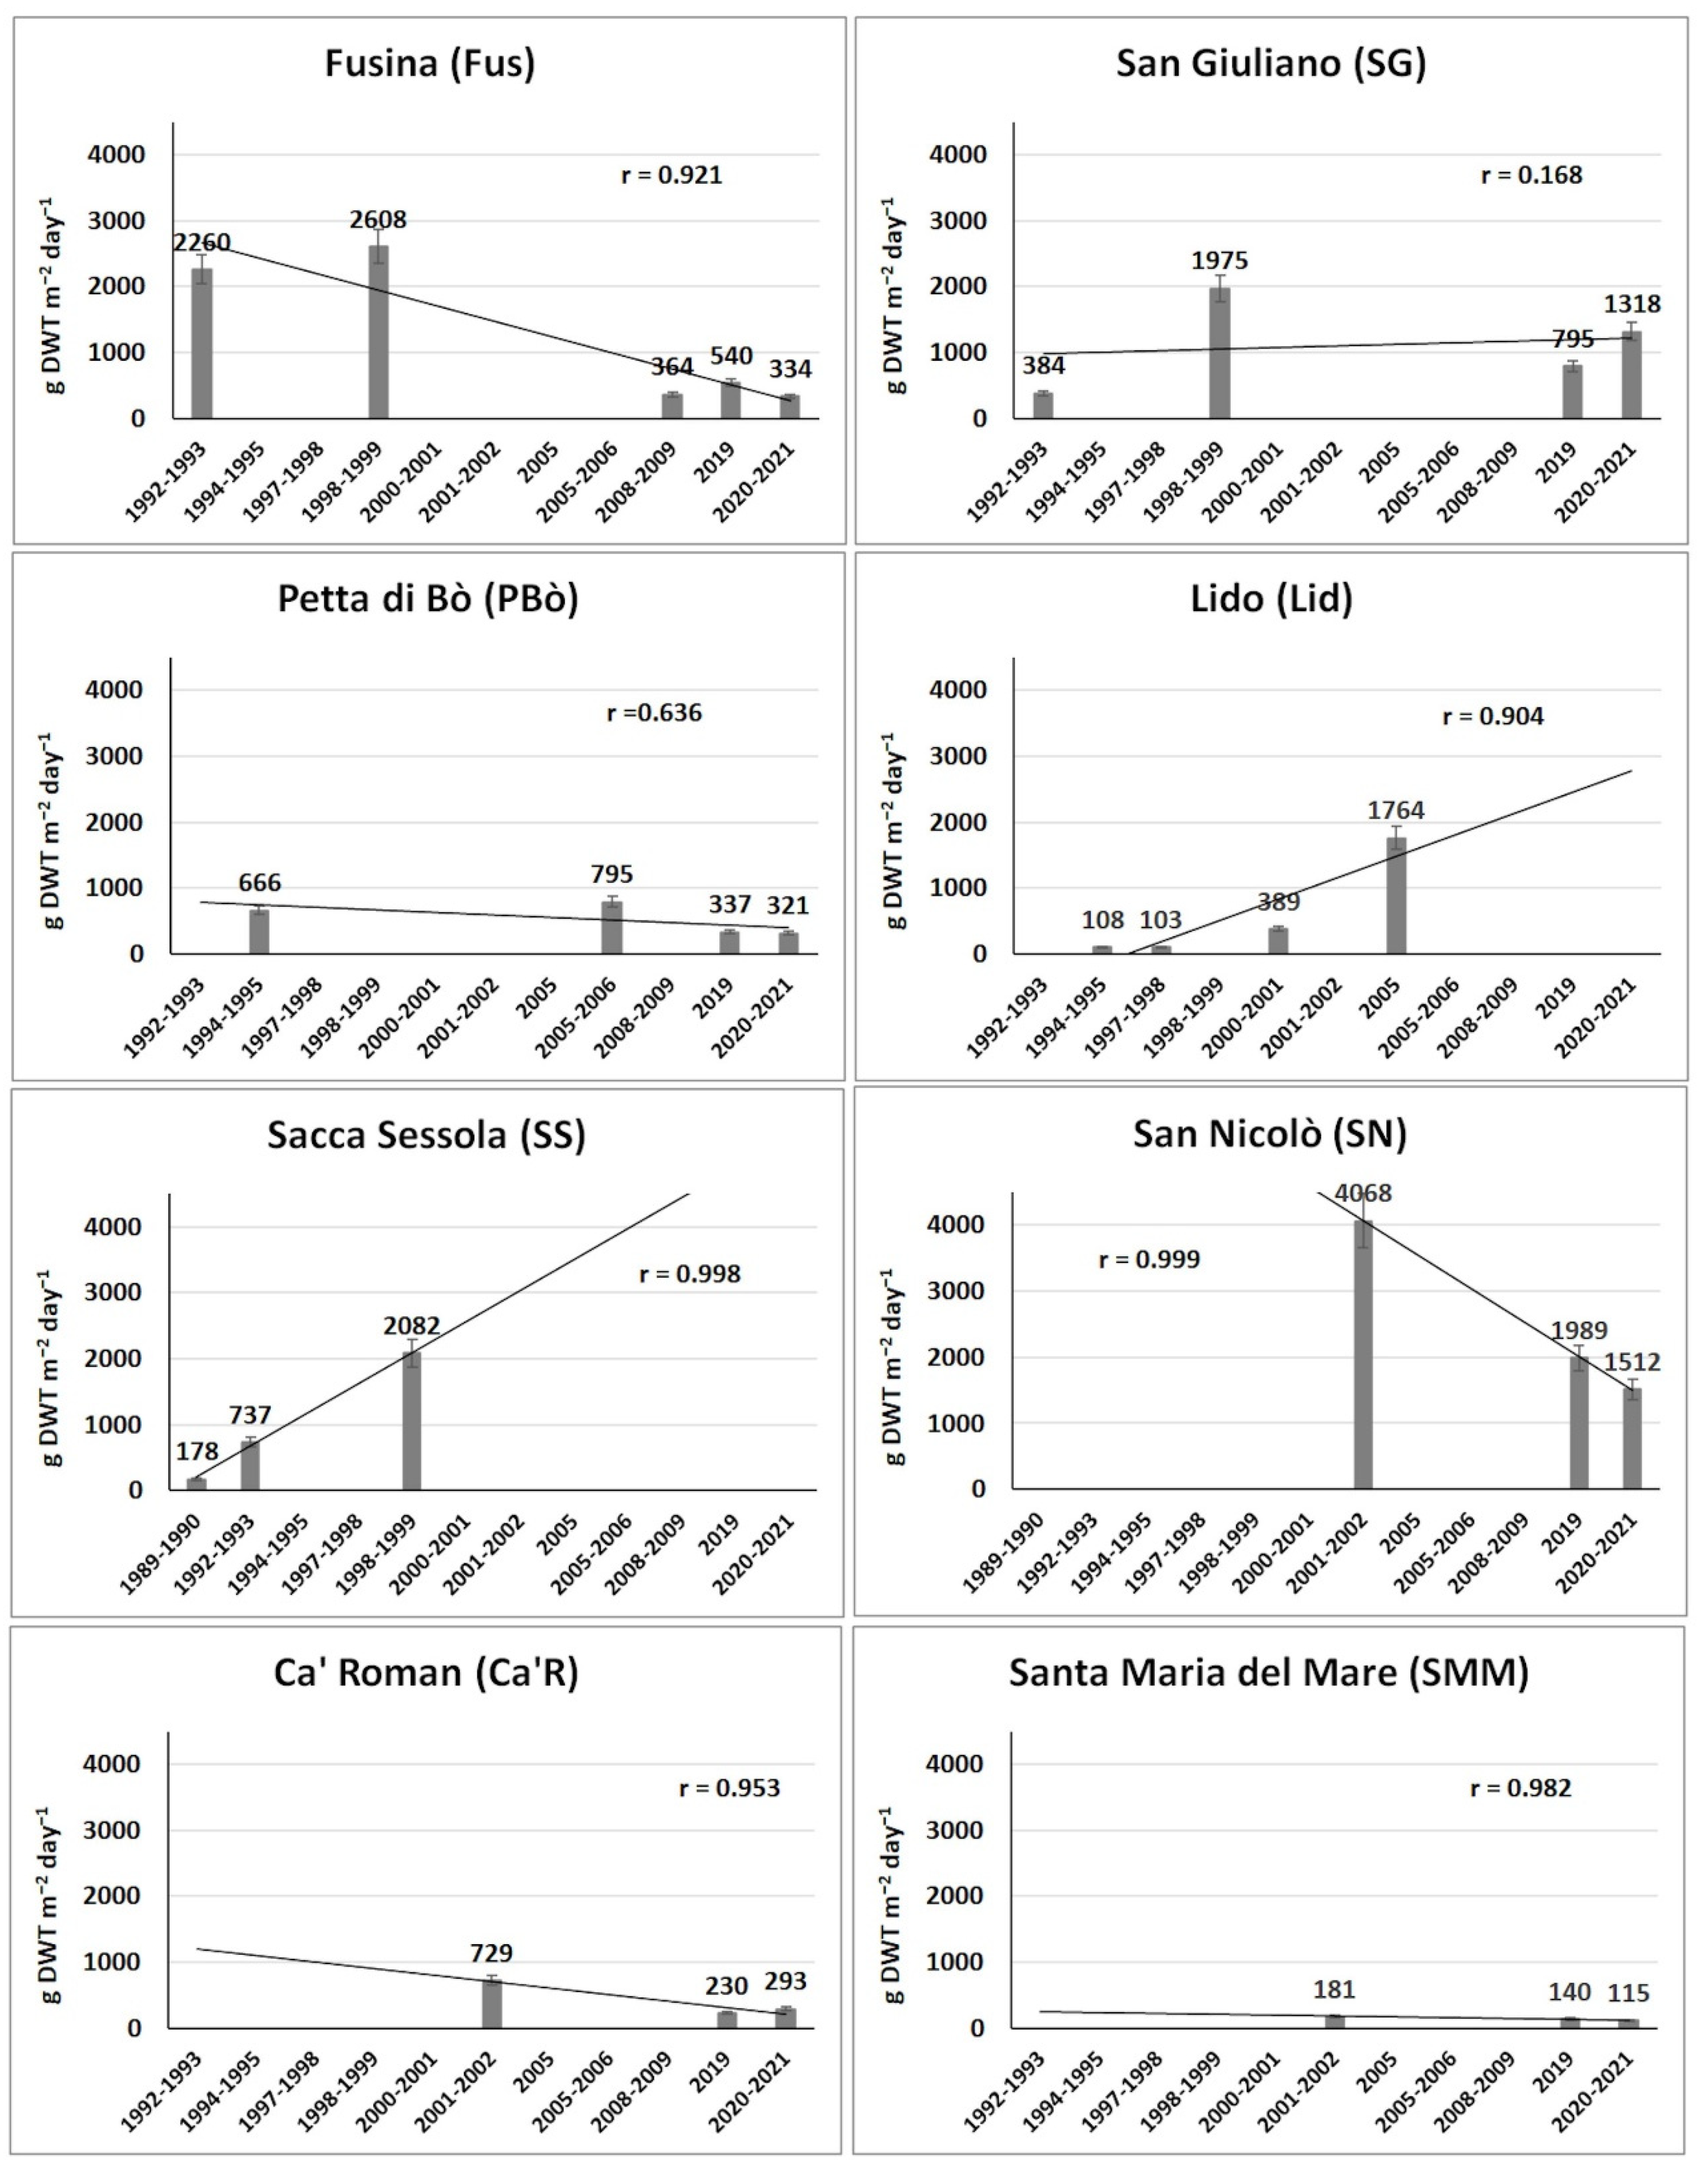
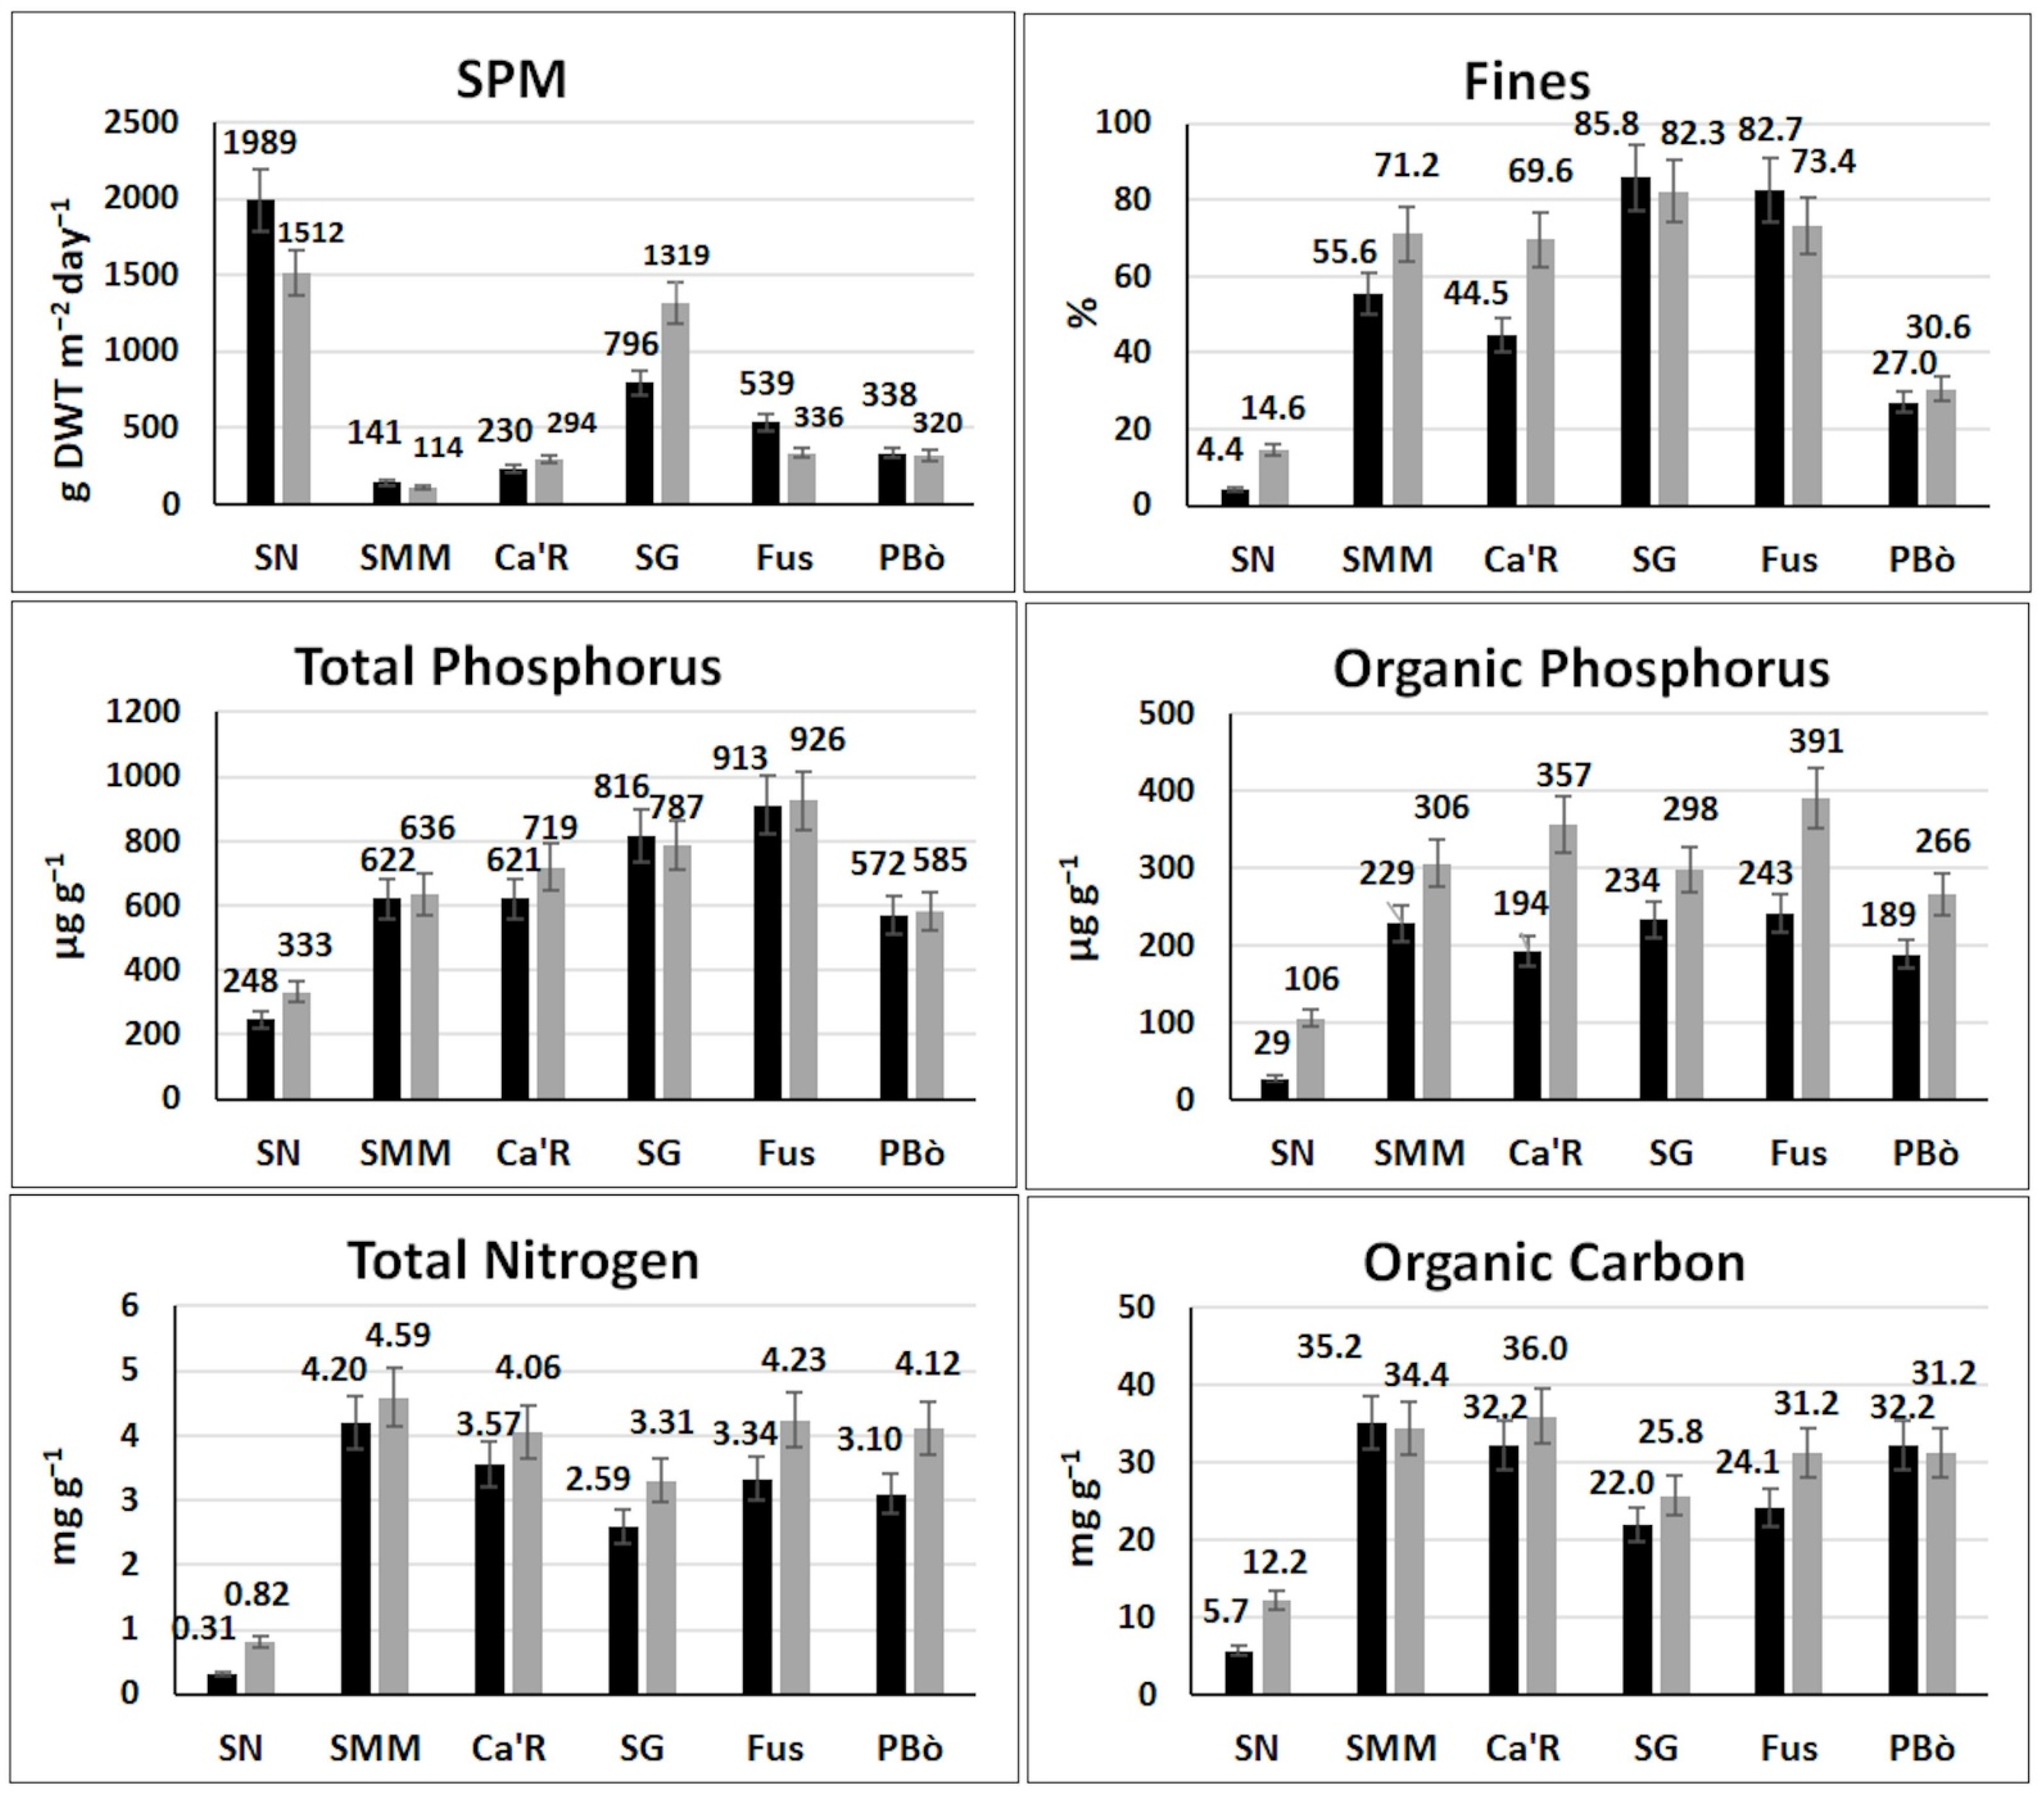
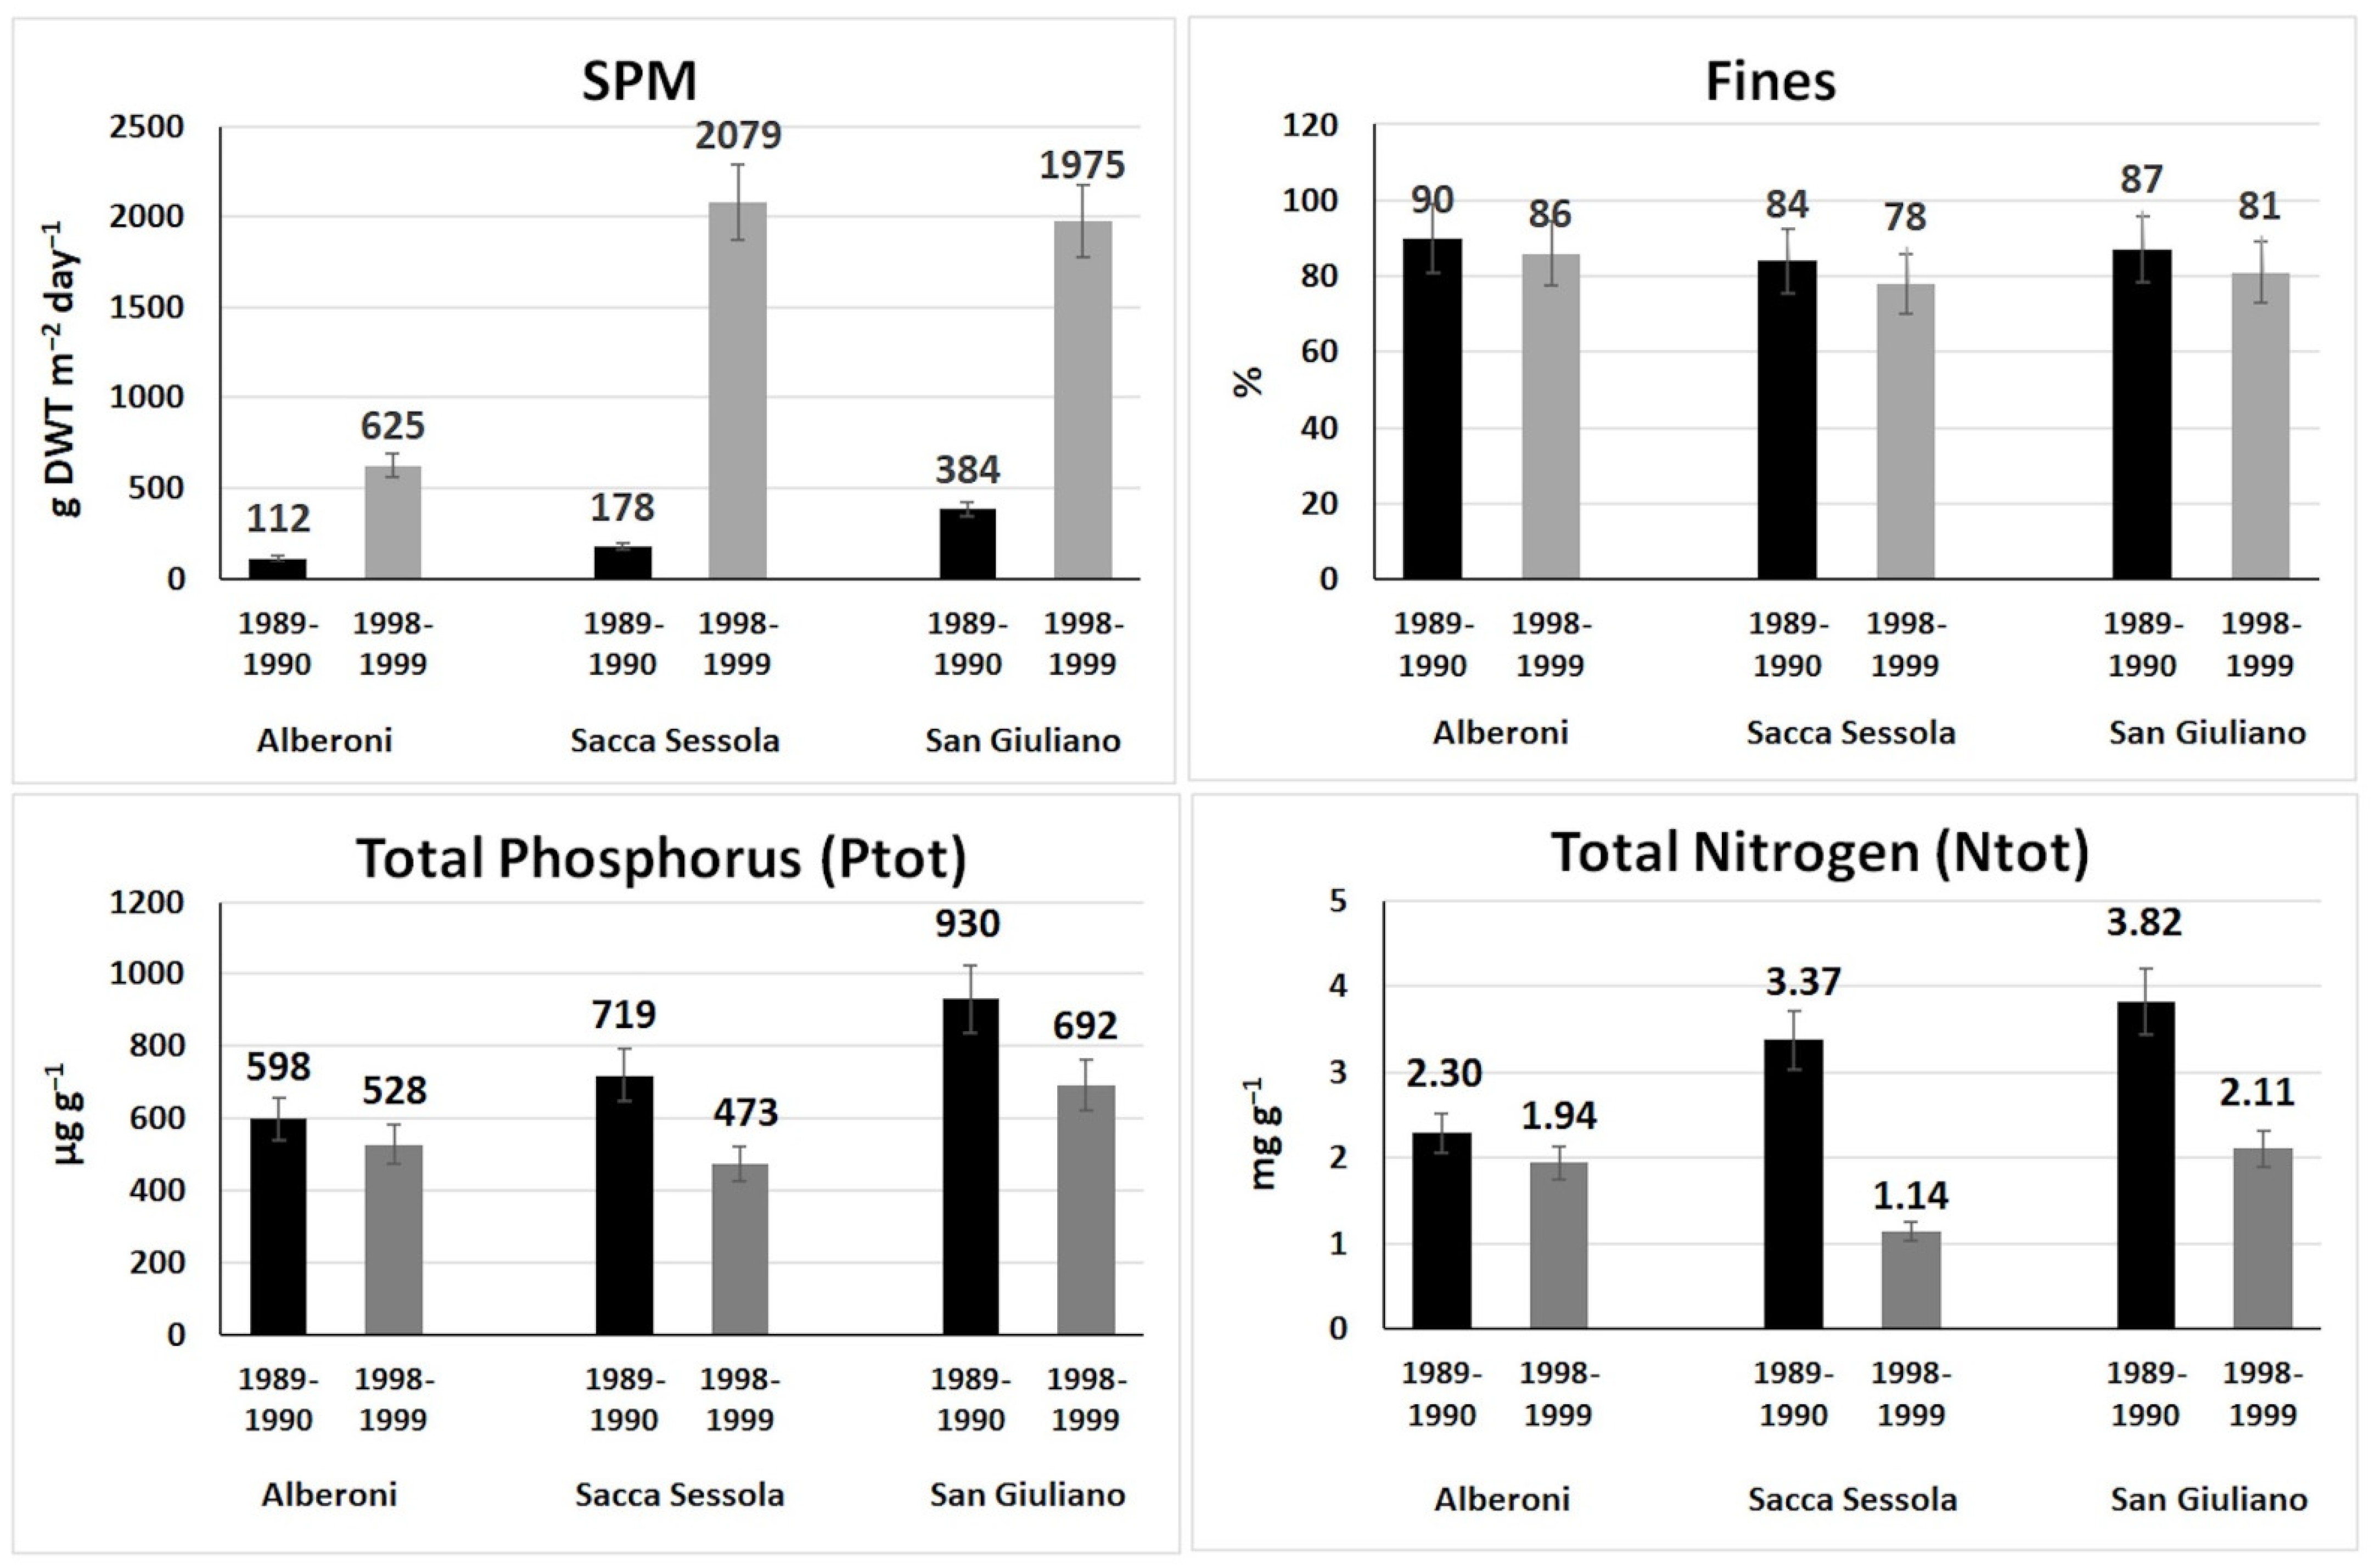
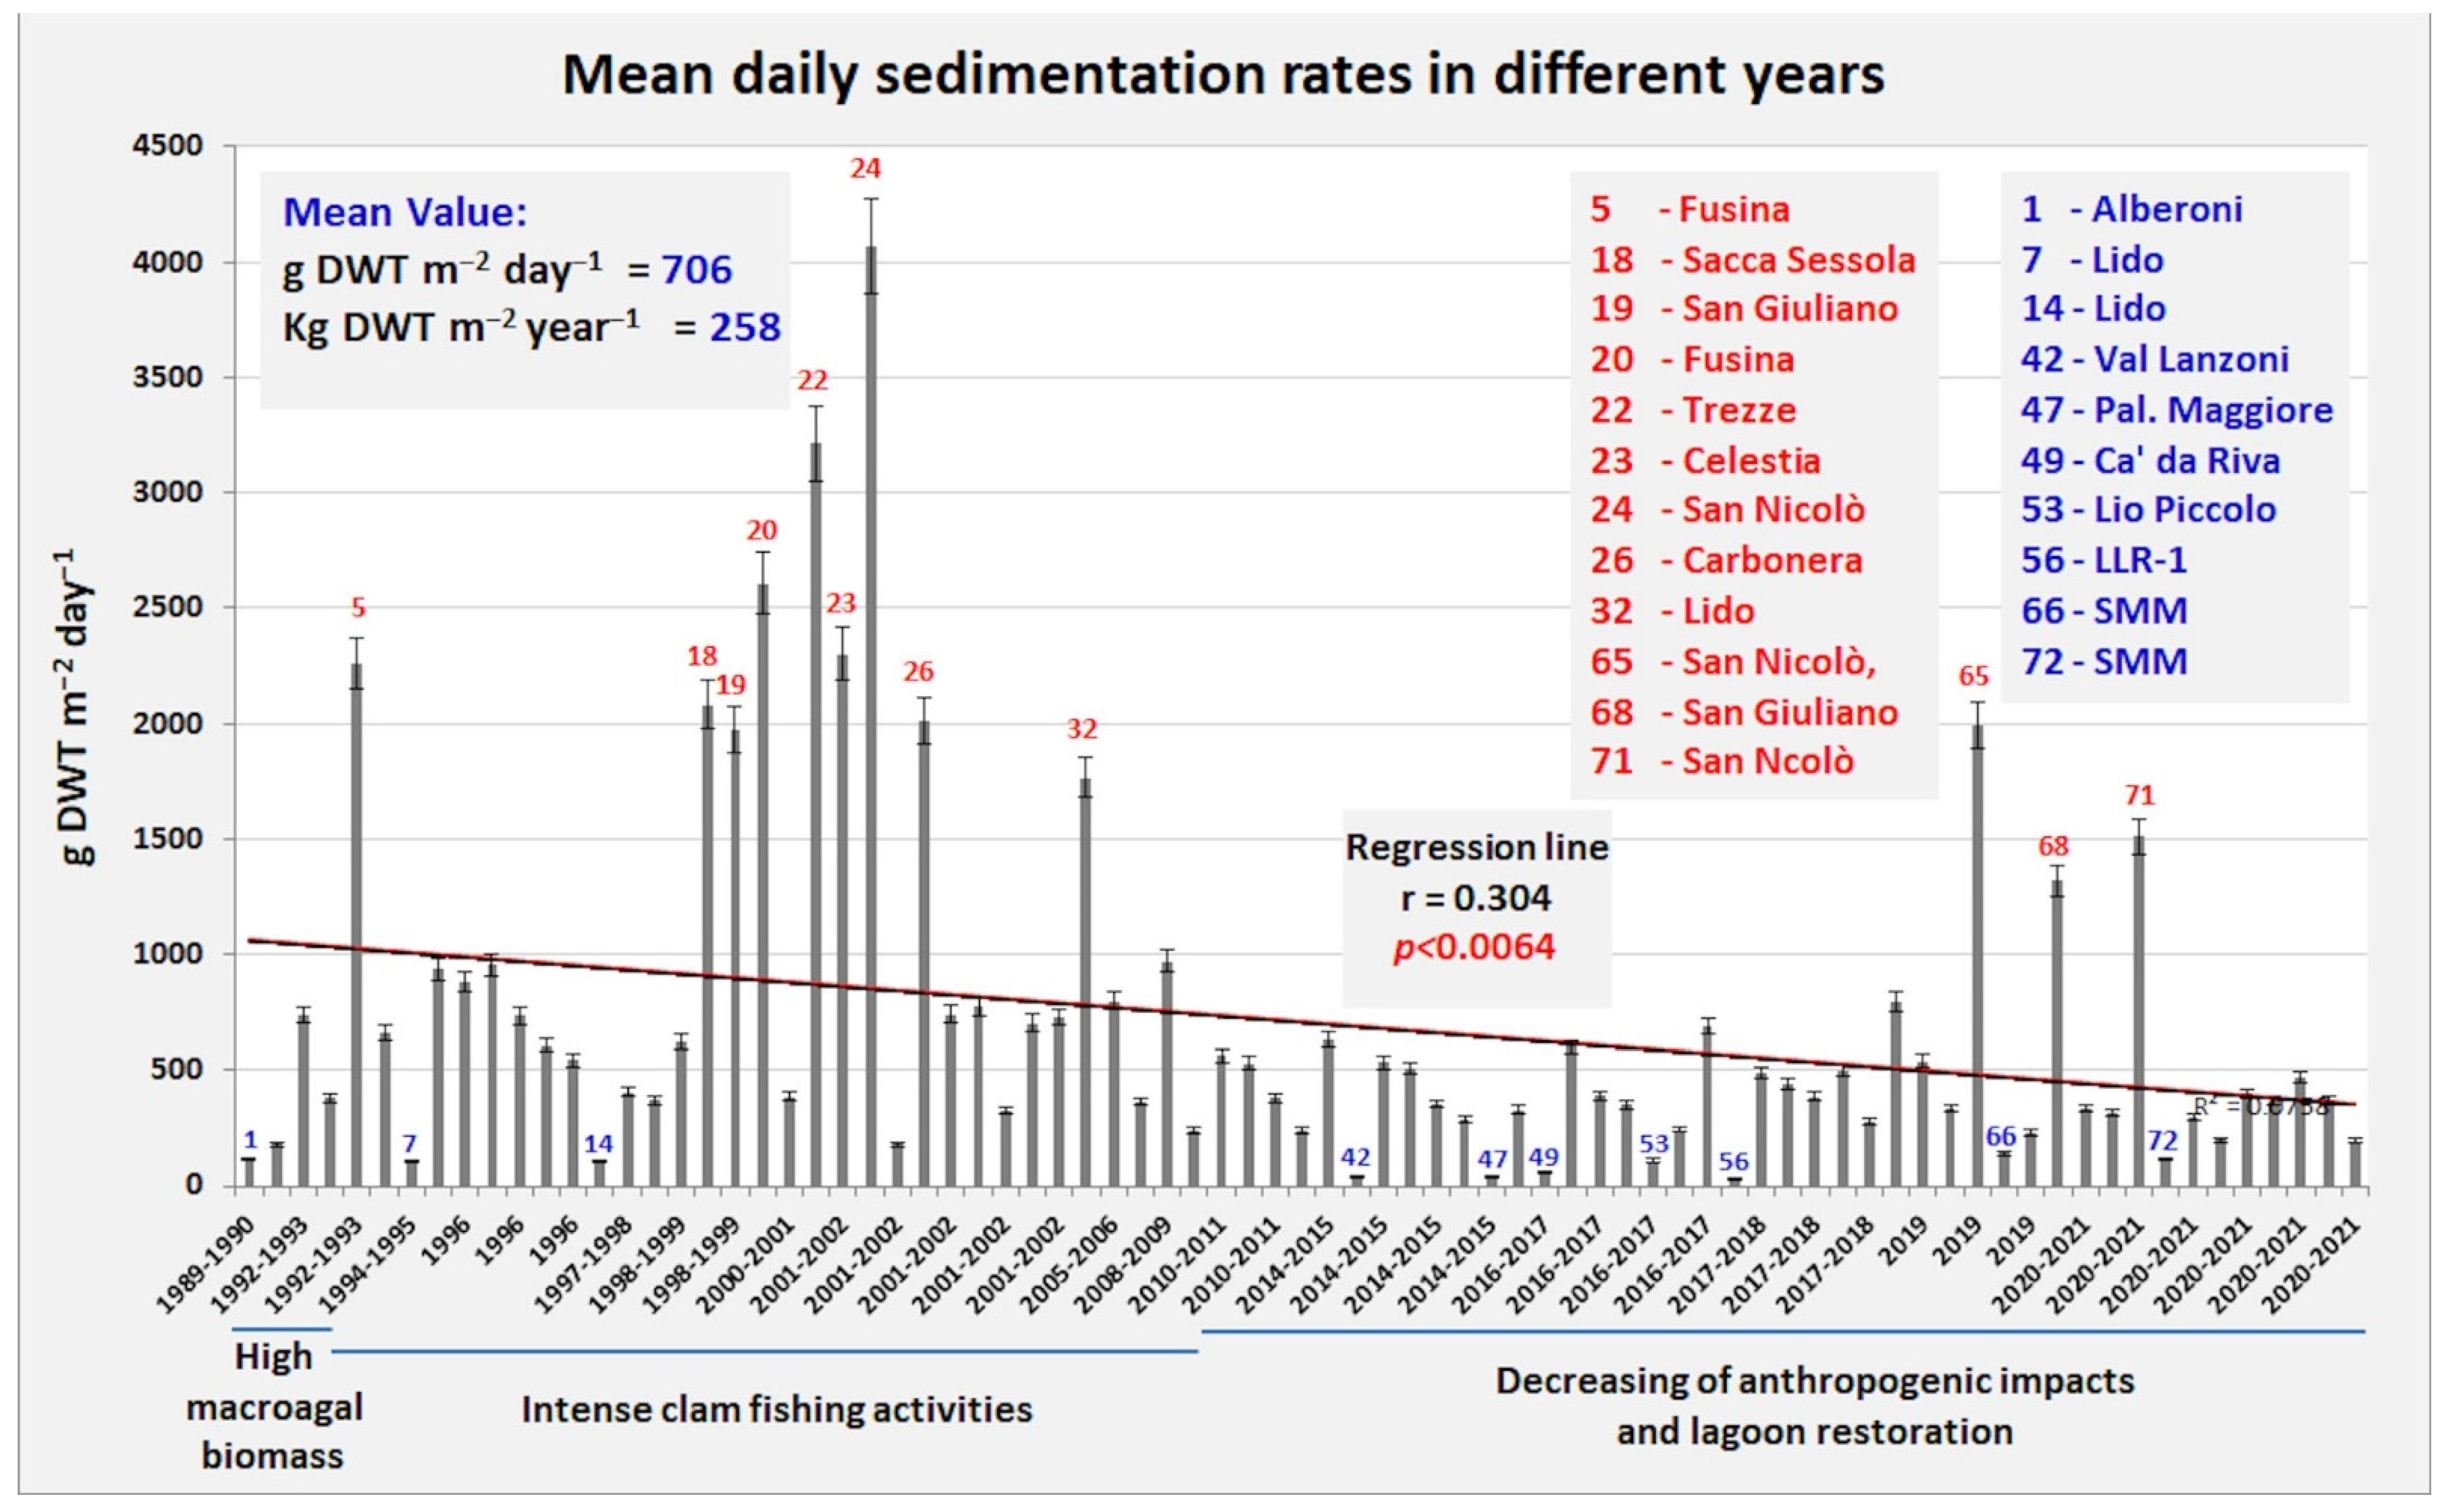
3.1. Venice Lagoon
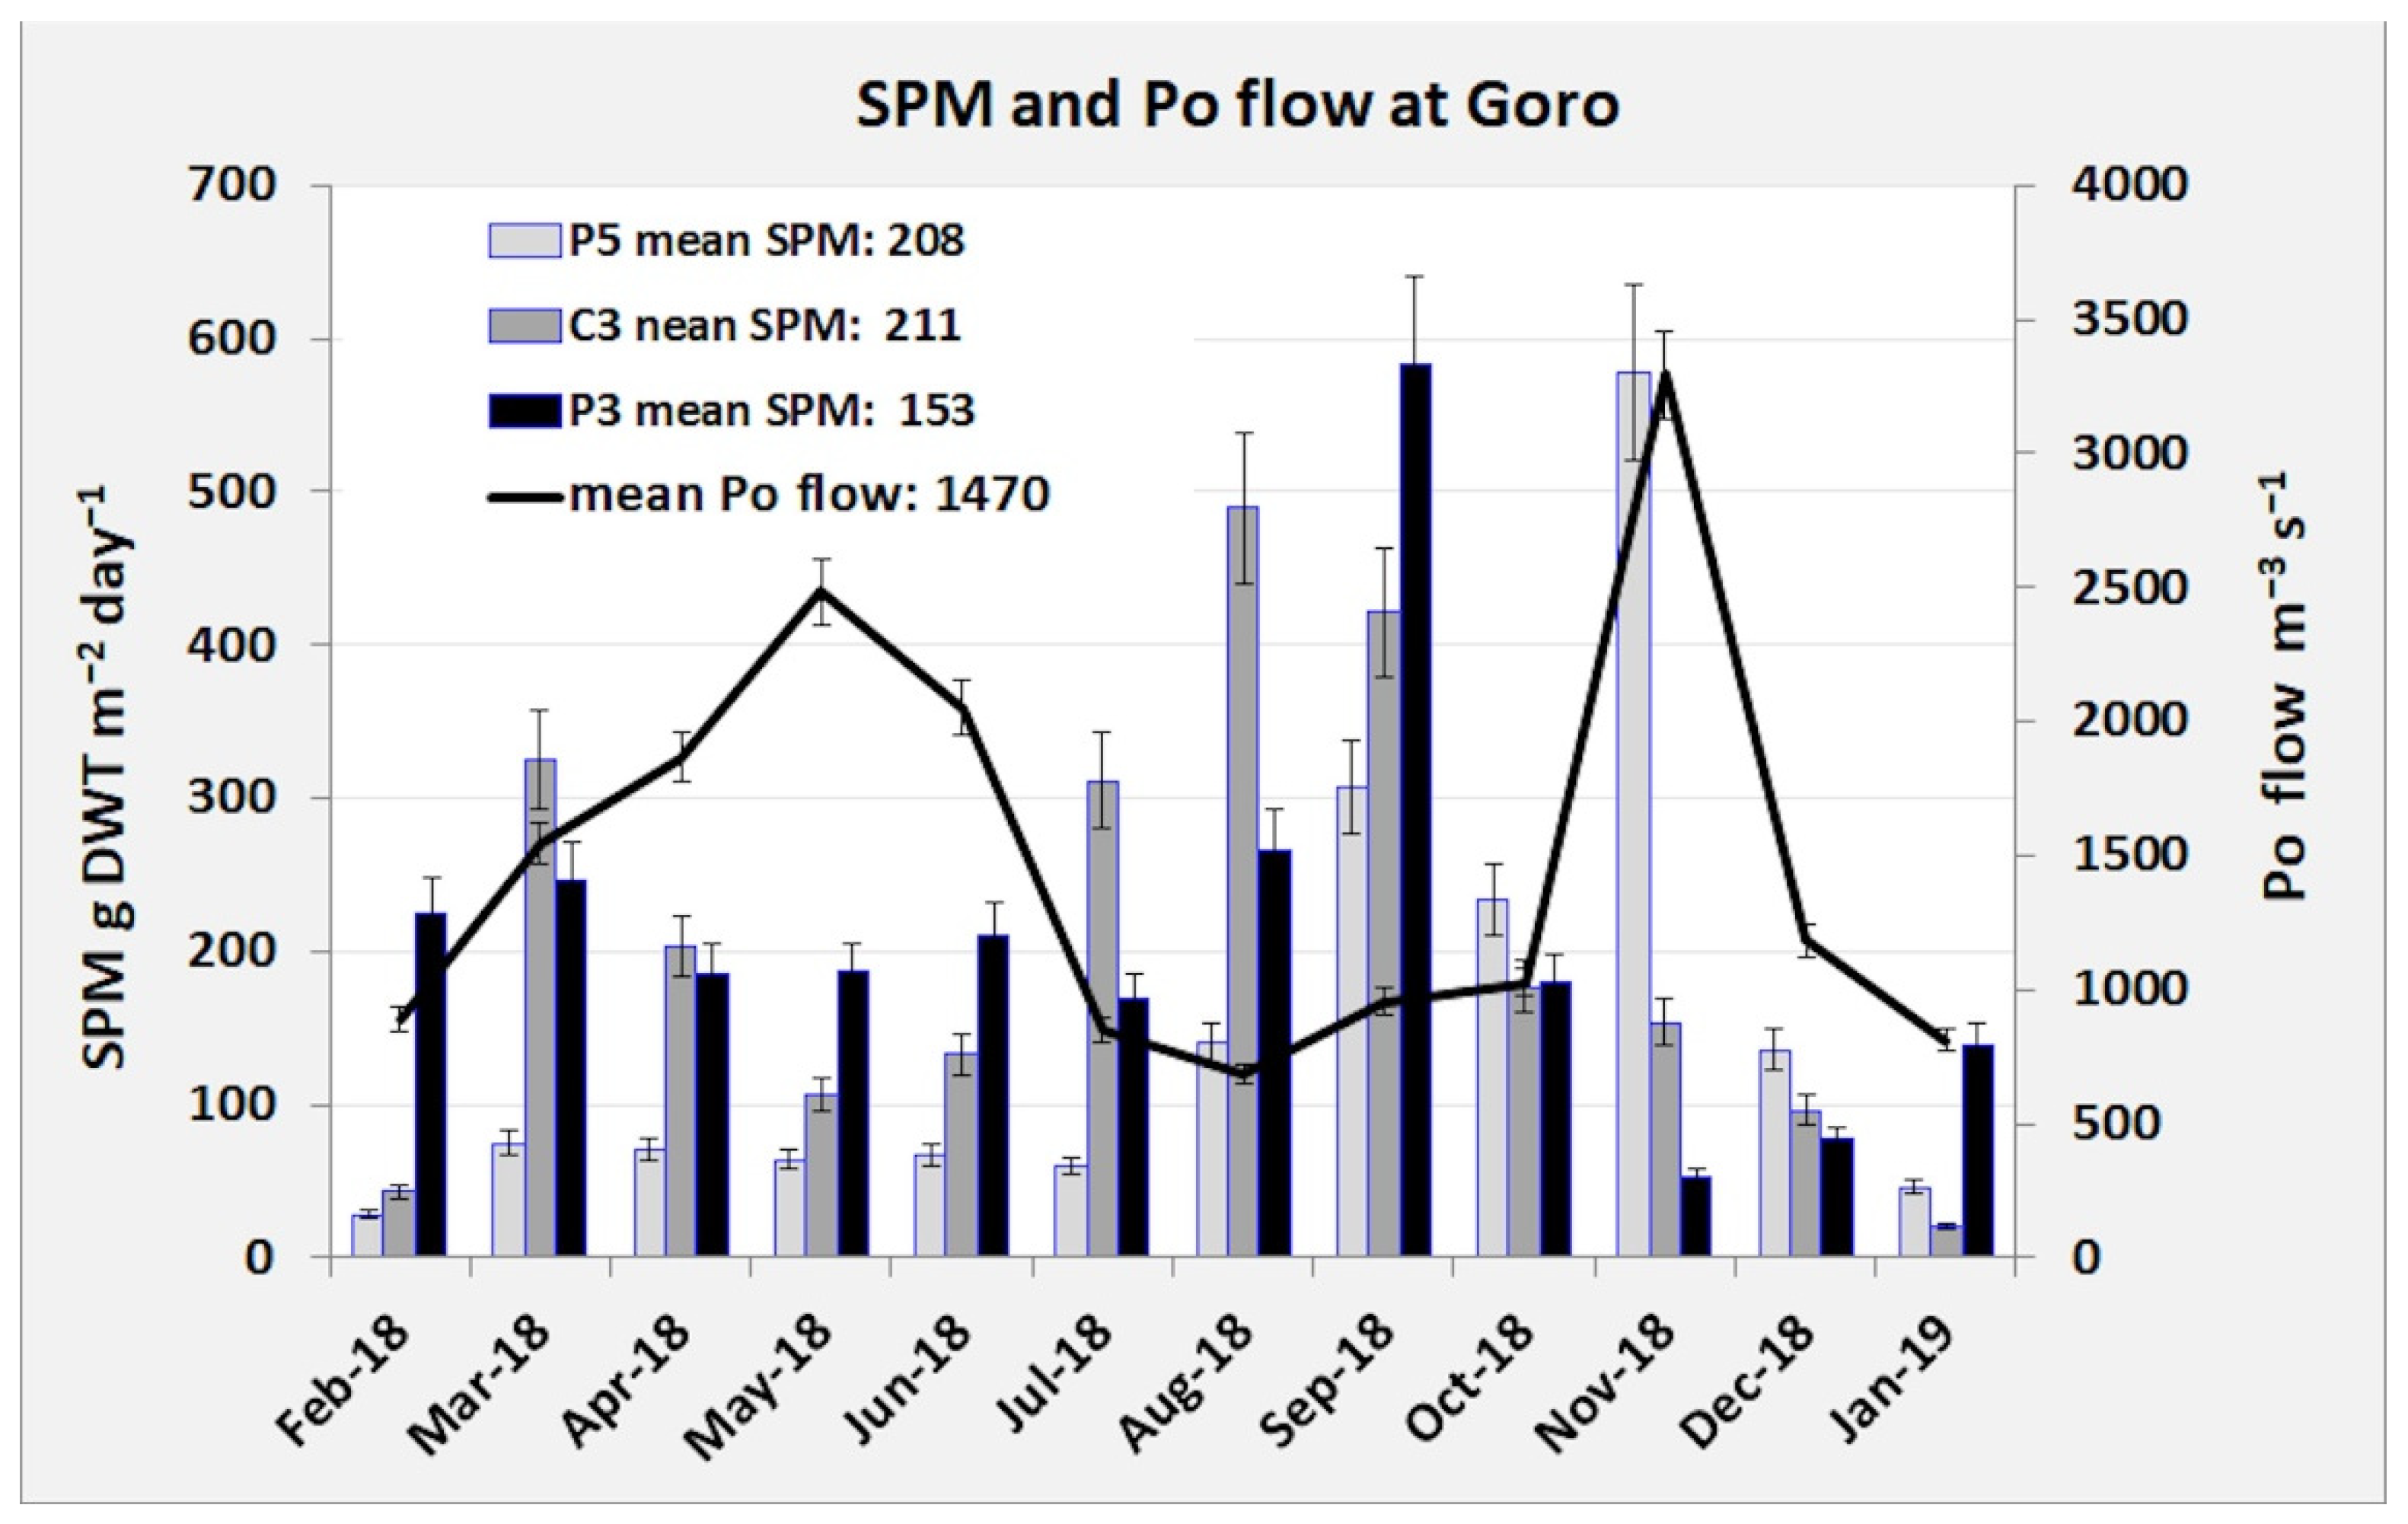
3.2. Sacca di Goro
4. Discussion
5. Conclusions
Supplementary Materials
Author Contributions
Funding
Institutional Review Board Statement
Informed Consent Statement
Data Availability Statement
Acknowledgments
Conflicts of Interest
References
- Solidoro, C.; Bandelj, V.; Bernardi, F.A.; Camatti, E.; Ciavatta, S.; Cossarini, G.; Facca, C.; Franzoi, P.; Libralato, S.; Melaku Canu, D.; et al. Response of the Venice Lagoon Ecosystem to Natural and Anthropogenic Pressures over the last 50 years. In Coastal Lagoons—Critical Habitats of Environmental Change; Kennish, M.J., Paerl, H.W., Eds.; CRC Press: Boca Raton, FL, USA, 2010; Chapter 19; pp. 483–511. [Google Scholar]
- Abarca, S.C.; Chávez, V.; Silva, R.; Martinez, M.L.; Anfuso, G. Understanding the Dynamics of a coastal lagoon: Drivers, Exchanges, state of the Environment, Consequences and Responses. Geosciences 2021, 11, 301. [Google Scholar] [CrossRef]
- Pranovi, F.; Giovanardi, O. The impact of hydraulic dredging for short-necked clams, Tapes spp., on an infaunal community in the lagoon of Venice. Sci. Mar. 1994, 58, 345–353. [Google Scholar]
- Scarpa, G.M.; Zaggia, L.; Manfe, G.; Lorenzetti, G.; Parnell, K.; Soomere, T.; Rapaglia, J.; Molinaroli, E. The effects of ship wakes in the Venice Lagoon and implications for the sustainability of shipping in coastal waters. Sci. Rep. 2019, 9, 19014. [Google Scholar] [CrossRef] [PubMed] [Green Version]
- Kies, F.; Ganuzas, M.M.; De Los Rios, P.; Elegbede, I.O.; Corselli, C. Integrated Coastal Zone Management (ICZM) Framework and Ecosystem Approach: Eutrophication phenomenon at the Mediterranean Sea. Bull. Soc. R. Sci. Liege 2020, 89, 55–73. [Google Scholar] [CrossRef]
- Dalla Valle, M.; Marcomini, A.; Sfriso, A.; Sweetman, A.J.; Kevin, C.J. Estimation of PCDD/F distribution and fluxes in the Venice lagoon, Italy. Chemosphere 2003, 51, 603–616. [Google Scholar] [CrossRef] [PubMed]
- Collavini, F.; Bettiol, C.; Zaggia, L.; Zonta, R. Pollutant loads from the drainage basin to the Venice lagoon. Environ. Int. 2005, 31, 939–947. [Google Scholar] [CrossRef]
- Viaroli, P.; Giordani, G.; Martinez, J.; Collos, Y.; Zaldivar, J.M. Ecosystem alteration and pollution in Southern European coastal lagoons. Chem. Ecol. 2005, 21, 413–414. [Google Scholar] [CrossRef]
- Cecere, E.; Moro, I.; Wolf, M.A.; Petrocelli, A.; Verlaque, M.; Sfriso, A. The introduced seaweed Grateloupia turuturu (Rhodophyta, Halymeniales) in two Mediterranean transitional water systems. Bot. Mar. 2011, 54, 23–33. [Google Scholar] [CrossRef]
- Sfriso, A.; Wolf, M.A.; Maistro, S.; Sciuto, K.; Moro, I. Spreading and autoecology of the invasive species Gracilaria vermiculophylla Gracilariales, Rhodophyta) in the lagoons of the north-western Adriatic Sea (Mediterranean Sea, Italy). Estuar. Coast. Shelf Sci. 2012, 11, 192–198. [Google Scholar] [CrossRef]
- Wolf, M.A.; Sfriso, A.; Moro, I. Thermal pollution and settlement of new tropical alien species: The case of Grateloupia yinggehaiensis (Rhodophyta) in the Venice Lagoon. Estuar. Coast. Shelf Sci. 2014, 147, 11–16. [Google Scholar] [CrossRef]
- Occhipinti-Ambrogi, A.; Marchini, A.; Cantone, G.; Castelli, A.; Chimenz, C.; Cormaci, M.; Froglia, C.; Furnari, G.; Gambi, M.C.; Giaccone, G.; et al. Alien species along the Italian coasts: An overview. Biol. Invasions 2011, 13, 215–237. [Google Scholar] [CrossRef]
- Tamburini, M.; Keppel, E.; Marchini, A.; Repetto, M.F.; Ruiz, G.M.; Ferrario, J.; Occhipinti-Ambrogi, A. Monitoring Non-indigenous Species in Port Habitats: First Application of a Standardized North American Protocol in the Mediterranean Sea. Front. Mar. Sci. 2021, 8, 700730. [Google Scholar] [CrossRef]
- ResourceWatch. Monitoring the Planet’s Pulse. Available online: https://resourcewatch.org (accessed on 4 October 2022).
- Creel, L. Ripple Effects: Population and Coastal Regions; Population Reference Bureau: Washington, DC, USA, 2003; p. 8. [Google Scholar]
- Coleman, S.E.; Smart, G.M. Fluvial sediment-transport processes and morphology. J. Hydrol. 2011, 50, 37–58. [Google Scholar]
- Pietroń, J.; Nittrouer, J.A.; Chalov, S.R.; Dong, T.Y.; Kasimov, N.; Shinkareva, G.; Jarsjö, J. Sedimentation patterns in the Selenga River delta under changing hydroclimatic conditions. Hydrol. Process. 2018, 32, 1–15. [Google Scholar] [CrossRef]
- Miozzi, E. Venezia nei Secoli; Officine Grafiche Trevisan, Castelfranco Veneto: San Martino di Lupari, Italy, 1969; Volume 4. [Google Scholar]
- Sfriso, A.; Facca, C.; Bon, D.; Buosi, A. Macrophytes and ecological status assessment in the Po delta transitional systems, Adriatic Sea (Italy). Application of Macrophyte Quality Index (MaQI). Acta Adriat. 2016, 57, 209–226. [Google Scholar]
- Serandrei-Barbero, R.; Albani, A.; Donnici, S.; Rizzetto, F. Past and recent sedimentation rates in the Lagoon of Venice (Northern Italy). Estuar. Coast. Shelf Sci. 2006, 69, 255–269. [Google Scholar] [CrossRef]
- Ciavola, P.; Organo, C.; Vintró, L.L.; Mitchell, P.I. Sedimentation processes on intertidal areas of the lagoon of Venice: Identification of exceptional flood events (acqua alta) using radionuclides. J. Coast. Res. 2002, 36, 139–147. [Google Scholar] [CrossRef]
- Saretta, A.; Pillon, S.; Molinaroli, E.; Fontolan, G. Sediment budget in the Lagoon of Venice, Italy. Cont. Shelf Res. 2010, 30, 934–949. [Google Scholar] [CrossRef] [Green Version]
- Carniello, L.; Defina, A.; D’Alpaos, L. Morphological evolution of the Venice lagoon: Evidence from the past and trend for the future. J. Geophys. Res. 2009, 114, F04002. [Google Scholar] [CrossRef]
- Sfriso, A.; Facca, C.; Marcomini, A. Sedimentation rates and erosion processes in the lagoon of Venice. Environ. Int. 2005, 31, 983–992. [Google Scholar]
- Sfriso, A.; Facca, C.; Ceoldo, S.; Pessa, G. Sedimentation Rates, Erosive Processes, Grain-Size and Sediment Density Changes in the Lagoon of Venice. In Scientific Research and Safeguarding of Venice. Corila Research—Program 2003 Results; Campostrini, P., Ed.; Multigraf: Spinea, Italy, 2005; Volume III, pp. 203–213. [Google Scholar]
- Sfriso, A.; Donazzolo, R.; Calvo, C.; Orio, A.A. Field resuspension of sediments in the Venice lagoon. Environ. Technol. 1990, 12, 371–379. [Google Scholar] [CrossRef]
- Sfriso, A.; Facca, C.; Ceoldo, S.; Marcomini, A. Recording the occurrence of trophic level changes in the lagoon of Venice over the ‘90s. Environ. Int. 2005, 31, 993–1001. [Google Scholar] [PubMed]
- Sfriso, A.; Facca, C. Distribution and production of macrophytes in the lagoon of Venice. Comparison of actual and past abundance. Hydrobiologia 2007, 577, 71–85. [Google Scholar] [CrossRef]
- Sfriso, A.; Buosi, A.; Sciuto, K.; Wolf, M.; Tomio, Y.; Juhmani, A.-S.; Sfriso, A.A. Effect of ecological recovery on macrophyte dominance and production in the Venice Lagoon. Front. Mar. Sci. 2022, 9, 882463. [Google Scholar] [CrossRef]
- Sfriso, A.; Facca, C.; Ceoldo, S.; Silvestri, S.; Ghetti, P.F. Role of macroalgal biomass and clam fishing on spatial and temporal changes in N and P sedimentary pools in the central part of the Venice lagoon. Oceanol. Acta 2003, 26, 3–13. [Google Scholar] [CrossRef] [Green Version]
- Sfriso, A.; Buosi, A.; Facca, C.; Sfriso, A.A. Role of environmental factors in affecting macrophyte dominance in transitional environments: The Italian Lagoons as a study case. Mar. Ecol. 2017, 38, e12414. [Google Scholar] [CrossRef]
- Sfriso, A.; Argese, E.; Bettiol, C.; Facca, C. Tapes philippinarum seed exposure to metals in polluted areas of the Venice lagoon (Italy). Estuar. Coast. Shelf Sci. 2008, 7, 581–590. [Google Scholar] [CrossRef]
- Argese, E.; Ramieri, E.; Bettiol, C.; Sfriso, A.; Pavoni, B.; Chiozzotto, E. Pollutant exchange at the water/sediment interface in the Venice canals. Wat. Air Soil Poll. 1997, 99, 255–263. [Google Scholar] [CrossRef]
- Sfriso, A.; Facca, C.; Raccanelli, S. PCDD/F and dioxin-like PCB bioaccumulation by Manila clam from polluted areas of Venice lagoon (Italy). Environ. Pollut. 2014, 184, 290–297. [Google Scholar] [CrossRef]
- Sfriso, A.; Buosi, A.; Mistri, M.; Munari, C.; Franzoi, P.; Sfriso, A.A. Long-term changes of the trophic status in transitional ecosystems of the northern Adriatic Sea, key parameters and future expectations: The lagoon of Venice as a study case. Nat. Conserv. 2019, 34, 193–215. [Google Scholar] [CrossRef] [Green Version]
- Sfriso, A.; Marcomini, A. Decline of Ulva growth in the lagoon of Venice. Bioresour. Technol. 1996, 58, 299–307. [Google Scholar] [CrossRef]
- Cesari, P.; Pellizzato, M. Molluschi pervenuti in Laguna di Venezia per apporti antropici volontari o casuali. Acclimazione di Saccostrea commercialis (Iredale & Roughely, 1933) e di Tapes philippinarum (Adams & Reeve, 1850). Boll. Malacol. 1985, 21, 237–274. [Google Scholar]
- ICRAM—Istituto Centrale per la Ricerca Scientifica e Tecnologica Applicata al Mare. Preliminary Investigation on the Hydraulic Dredge (Turbosoffiante) Employment for Fishing Bivalves in Lagoon Environments; Quaderni, N.7; Nicema: Roma, Italy, 1994; p. 52. (In Italian) [Google Scholar]
- Orel, G.; Boatto, V.; Sfriso, A.; Pellizzato, M. Piano per la Gestione delle Risorse Alieutiche delle Lagune della Provincia di Venezia; Sannioprint: Benevento, Italy, 2000; p. 102. [Google Scholar]
- Zentilin, A.; Pellizzato, M.; Rossetti, E.; Turolla, E. La venericoltura in Italia a 25 anni dal suo esordio. Pesce 2008, 3, 31–50. [Google Scholar]
- Atlante della Laguna. Available online: http://www.atlantedellalaguna.it (accessed on 4 October 2022).
- Pessa, G.; Sfriso, A. Monitoraggio degli Effetti della Pesca di Tapes Philippinarum sui Flussi di Sedimentazione, sui Processi di Erosione/Sedimentazione e Sulla Distribuzione di Macroalghe e Fanerogame Marine in Aree Bersaglio e Prossime alle Zone Date in Concessione per la Pesca Allevamento di Questi Molluschi; Final Report; Ca’ Foscari University: Venezia, Italy, 2002. [Google Scholar]


| 2019 | 2020–2021 | ||||||||||||
|---|---|---|---|---|---|---|---|---|---|---|---|---|---|
| SPM | Fines | Porg | Ptot | Ntot | Corg | SPM | Fines | Porg | Ptot | Ntot | Corg | ||
| SPM | 1.00 | SPM | 1.00 | ||||||||||
| Fines | −0.49 | 1.00 | Fines | −0.34 | 1.00 | ||||||||
| Porg | −0.86 | 0.85 | 1.00 | Porg | −0.70 | 0.83 | 1.00 | ||||||
| Ptot | −0.62 | 0.95 | 0.92 | 1.00 | Ptot | −0.44 | 0.86 | 0.93 | 1.00 | ||||
| Ntot | −0.98 | 0.56 | 0.88 | 0.66 | 1.00 | Ntot | −0.87 | 0.67 | 0.88 | 0.72 | 1.00 | ||
| Corg | −0.98 | 0.35 | 0.77 | 0.48 | 0.95 | 1.00 | Corg | −0.89 | 0.65 | 0.87 | 0.66 | 0.97 | 1.00 |
| Three Stations (1989–1990/1998–1999) | ||||
|---|---|---|---|---|
| SPM | Fines | Ptot | Ntot | |
| SPM | 1 | |||
| Fines | −0.88 | 1 | ||
| Ptot | −0.39 | 0.34 | 1 | |
| Ntot | −0.68 | 0.52 | 0.91 | 1 |
Publisher’s Note: MDPI stays neutral with regard to jurisdictional claims in published maps and institutional affiliations. |
© 2022 by the authors. Licensee MDPI, Basel, Switzerland. This article is an open access article distributed under the terms and conditions of the Creative Commons Attribution (CC BY) license (https://creativecommons.org/licenses/by/4.0/).
Share and Cite
Sfriso, A.; Buosi, A.; Juhmani, A.-S.; Tomio, Y.; Mistri, M.; Munari, C.; Sfriso, A.A. Sedimentation Rates: Anthropogenic Impacts and Environmental Changes in Transitional Water Systems. Water 2022, 14, 3843. https://doi.org/10.3390/w14233843
Sfriso A, Buosi A, Juhmani A-S, Tomio Y, Mistri M, Munari C, Sfriso AA. Sedimentation Rates: Anthropogenic Impacts and Environmental Changes in Transitional Water Systems. Water. 2022; 14(23):3843. https://doi.org/10.3390/w14233843
Chicago/Turabian StyleSfriso, Adriano, Alessandro Buosi, Abdul-Salam Juhmani, Yari Tomio, Michele Mistri, Cristina Munari, and Andrea Augusto Sfriso. 2022. "Sedimentation Rates: Anthropogenic Impacts and Environmental Changes in Transitional Water Systems" Water 14, no. 23: 3843. https://doi.org/10.3390/w14233843