

Comparison of the Microbial Communities Affected by Different Environmental Factors in a Polluted River
by
 , ,
, ,
Liao Ouyang
1,†,
Xinyue Liu
2,†,
Huirong Chen
2,
Xuewei Yang
2,
Shaofeng Li
1 and
Shuangfei Li
2,* 1
School of Materials and Environmental Engineering, Shenzhen Polytechnic, Shenzhen 518055, China
2
Shenzhen Key Laboratory of Marine Bioresource & Eco-Environmental Sciences, College of Life Sciences and Oceanography, Shenzhen University, Shenzhen 518071, China
*
Author to whom correspondence should be addressed.
†
These authors contributed equally to this work.
Water 2022, 14(23), 3844; https://doi.org/10.3390/w14233844
Submission received: 13 October 2022
/
Revised: 15 November 2022
/
Accepted: 23 November 2022
/
Published: 26 November 2022
(This article belongs to the Section Biodiversity and Functionality of Aquatic Ecosystems)
Abstract
:Understanding how bacterial communities adapt to different environmental factors provides a scientific basis for developing and utilizing microbial resources in rivers. This study investigated the changes in the microbial communities of water and mud samples from two sites of an urban river (GH: Gonghe Village and YC: Yanchuan). Analysis of the water samples showed that site GH had higher concentrations of ammonium, total nitrogen, Mn, and Ni than site YC. High-throughput sequencing was used to analyze the community composition of the samples. The results showed that the dominant phyla were Proteobacteria, Bacteroidete, Actinobacteria, and Chloroflexi. The alpha diversity of the microbial community in the mud samples was higher than in the water samples. Moreover, the relative abundance of the dominant genus varied a lot between the samples, with the highest relative abundance of Arcobacter and Vibrio found in the water samples at site GH in January and October, respectively. The correlation analysis showed that pH, TN, manganese, and fluoride were the main environmental factors that affected the composition and structure of the microbial communities. The phylogenetic investigation of communities by reconstruction of unobserved states (PICRUSt) analysis showed that species associated with nitrogen metabolism differed between the sampling sites. In addition, potential pathogens, such as Vibrio and Arcobacter, which may pose potential risks to the environment and human health, were found in the samples.
1. Introduction
The degree of river pollution is closely associated with a region’s economic development and population density [1,2]. In economically developed areas, excessively high ammonia levels in rivers are quite common [3,4]. The resulting increase in nitrogen and phosphorus levels in these rivers may directly lead to severe eutrophication [5].
Not only do microorganisms degrade organic matter in water bodies and sediments, but they also indicate the degree of pollution and the restoration status [6,7]. The degradation of organic matter and the circulation of nutrients in the water are mainly mediated by microbial activity; biotransformation of these substances may change the composition of carbon pools and other nutrients in rivers [8,9,10], oceans [11], and lakes [12]. As the main component of the food chain in a water body, the microbial community responds quickly to changes in the water environment and adjusts its structure to adapt to changes in the organic matter and nutrient concentrations [13]. Therefore, understanding the microbial community’s diversity, composition, and structure is necessary to predict and determine the functions of the microorganisms in a river.
The traditional method used to isolate microbes from cultures is time-consuming and expensive. Furthermore, 85–99% of natural microbes have not been successfully isolated from cultures [14]. In recent years, the use of high-throughput sequencing methods based on 16S rRNA gene sequences to analyze the microbes in various environments has become popular [15]. Many studies have focused on analyzing the structure and function of microbial communities in different ecological environments such as oceans, estuaries, lakes, and rivers. These investigations allow us to understand the diversity and spatial distribution of microbial communities. Current research finds that changes in freshwater microbial communities are associated with environmental factors such as temperature, flow velocity, dissolved organic matter (DOM), and nitrogen concentration [16,17,18]. The temporal changes of microbial communities are significant [19,20], especially in areas where the climate changes dramatically between seasons.
The Maozhou River is one of Shenzhen’s most severely polluted rivers [21]. In recent years, many methods, including limiting the pollution emissions of the surrounding industries and remediating the channels and banks, have been used to reduce pollution levels. However, different levels of pollution have still been observed downstream of the river. The spatial and temporal distribution of microplastics and organic pollutants in the Maozhou River [22,23] and the microbial community associated with antibiotic resistance genes [24] have both been studied previously. However, there are few records of seasonal changes in biodiversity. The present study aimed to understand how the diversity and composition of microbial communities change under different pollution levels and the impact of the environment on these changes. This study collected surface water and mud samples from two sites downstream of the Maozhou River during four seasons. Illumina high-throughput sequencing technology and phylogenetic investigation of communities by reconstruction of unobserved states (PICRUSt) analysis were used to study the structure of microbial communities in the water and mud samples and to determine the contributions of genera associated with nitrogen metabolism. Additionally, multivariate statistical analysis methods were used to determine the main factors affecting the structure and functional activity of microbial communities downstream of the Maozhou River. The results of this study helped to clarify the impact of pollution on the microbial community composition of rivers and provided a scientific basis for the development and utilization of microbial resources in the Maozhou River.
2. Materials and Methods
2.1. Sample Collection and Processing
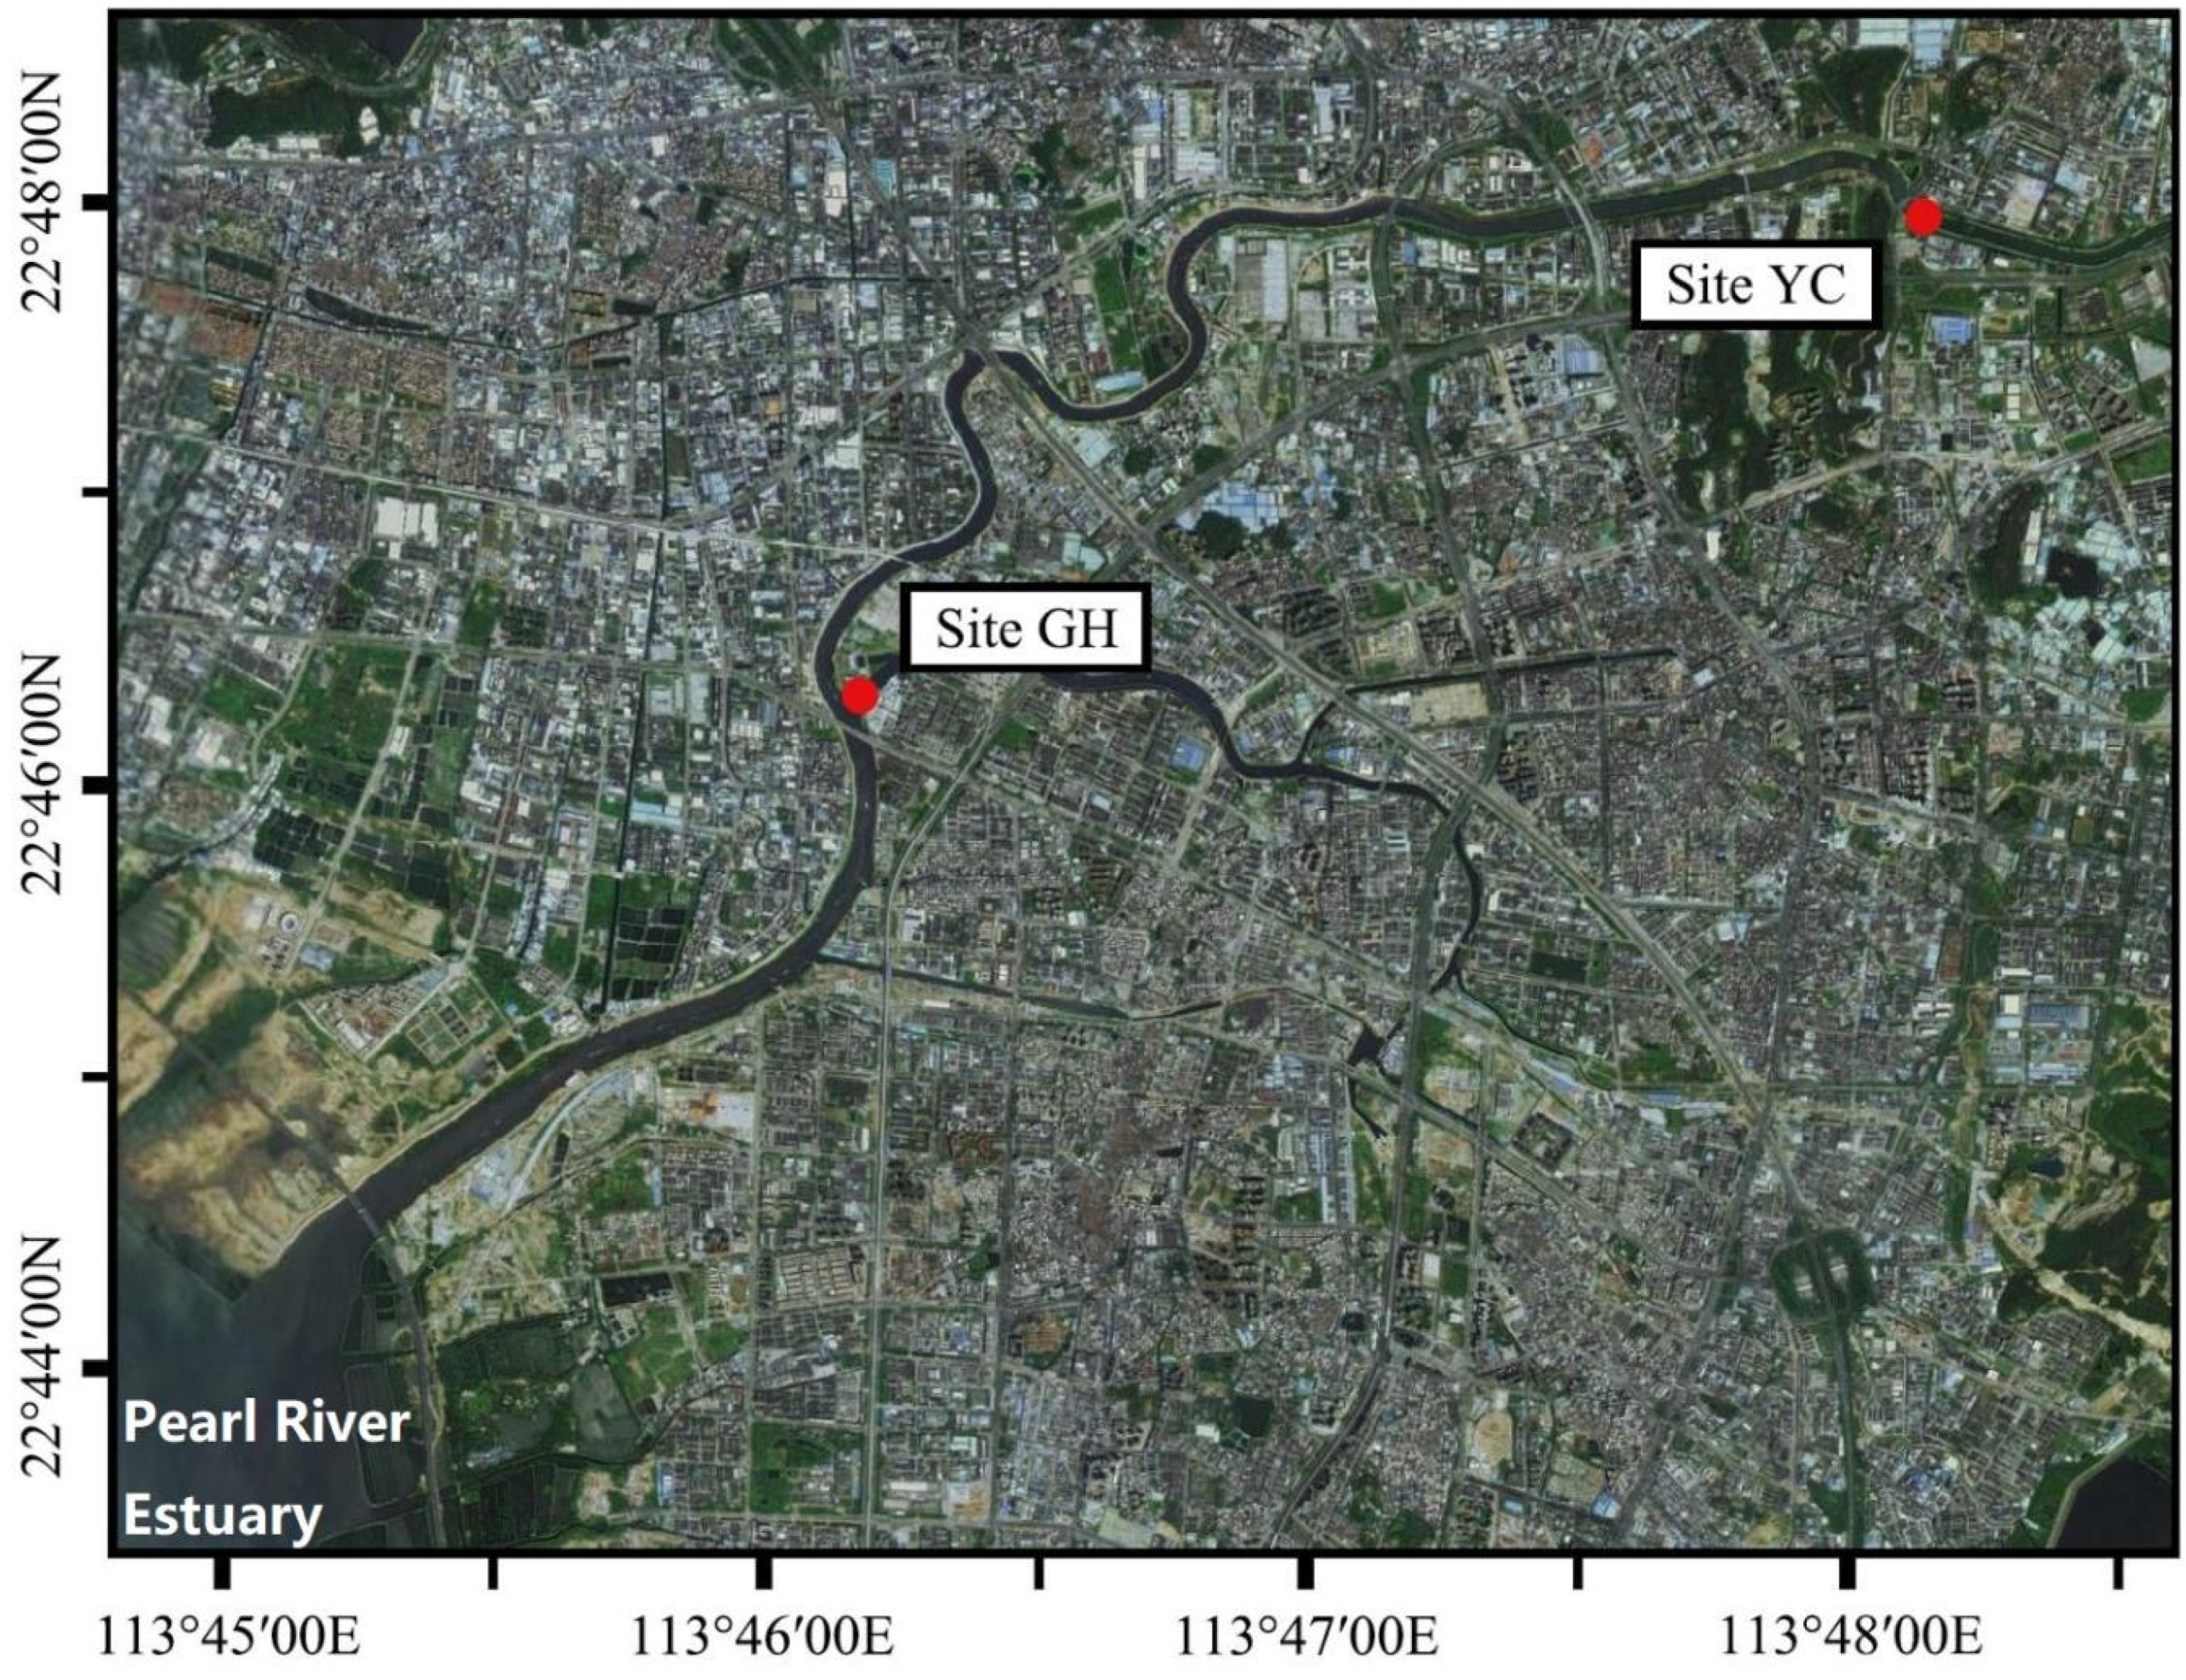
The Maozhou River (22°39′–22°48′ N, 113°44′–113°56′ E) is located in the northern part of Shenzhen [22]. It is the longest urban river in Shenzhen and has the largest river basin area. The river water passes through the rapidly urbanized and industrialized regions of northwestern Shenzhen and then flows westward into the Pearl River Estuary [23]. The average annual temperature of the river is 22.4 °C. Two sampling sites (GH: Gonghe Village (latitude: 113.7906843424; longitude: 22.7542931558) and YC: Yanchuan (latitude: 113.8547998663; longitude: 22.7928884860)) were located downstream of the Maozhou River (Figure 1). At each site, 500 mL of surface water samples (0–50 cm) were collected using sterile canisters; water collection was repeated three times and the samples were mixed to get a 1.5 L composite water sample. Mud samples (≥5 g) (0–10 cm) were also collected from three different sampling points and mixed into sterilized 50 mL centrifuge tubes to get a composite mud sample (Guangzhou Jet Bio-Filtration Co., Ltd., Guangzhou, China). Samples were collected and performed during four seasons (October, January, April, and July; Table 1). Water was first filtered using a peristaltic pump with 0.8–8 μm filters and then passed through 0.22 μm glass fiber filters (Merck KGaA, Darmstadt, Germany). All samples were stored at 4 °C for a maximum of 24 h before they were processed and glass fiber filters and mud samples for DNA extraction and PCR amplification were stored at −80 °C.
2.2. Physical and Chemical Parameters of Water
At each sampling site, the temperature, pH, and dissolved oxygen (DO) level were obtained using Orion Star A329 Multiparameter Probes (Thermo Scientific). The transparency of the water was detected by inserting a Sarcovich disk into the river. The concentrations of ammonium; total nitrogen (TN); total phosphorus (TP); and trace metals, including copper (Cu), zinc (Zn), nickel (Ni), manganese (Mn), arsenic (As), and lead (Pb); of the water samples were measured using the standard methods [25]. Briefly, the concentrations of ammonium, TN, and TP were determined by spectrophotometry using salicylic acid-hypochlorous acid, alkaline potassium persulphate, and ammonium molybdate, respectively. Filtered water samples were first acidified with concentrated nitric acid (V:V = 50:1) (Zhang et al. 2020), then the concentrations of metals were measured using an inductively coupled plasma mass spectrometer (ICP-MS, Thermo Fisher Scientific, Boston, MA, USA) according to the standard methods [25].
2.3. DNA Extraction and PCR Amplification
Water (glass fiber filters) and sediment samples were sent to Health Time Gene (Shenzhen, China) for DNA extraction and sequencing. Before DNA extraction, 0.22 μm filters were cut into small pieces with a sterile scalpel. Microbial DNA was extracted from the samples using the E.Z.N.A.® Soil DNA Kit (Omega Bio-Tek, Norcross, GA, USA) according to the manufacturer’s protocols. The V3-V4 region of the bacterial 16S rRNA gene was amplified by PCR (95 °C for 5 min followed by 27 cycles at 95 °C for 30 s, 55 °C for 30 s, 72 °C for 45 s, and a final extension at 72 °C for 5 min) [26] using primers 341F (5′-CCTAYGGGRBGCASCAG-3′) and 806R (5′-GGACTACNNGGGTATCTAAT-3′) [27] where the barcode was an eight-base sequence unique to each sample. PCR reactions were performed in triplicate in a 20 μL mixture containing 4 μL of 5 × FastPfu Buffer (TransGen Biotech Co., Ltd., Beijing, China), 2 μL of 2.5 mM dNTPs, 0.8 μL of each primer (5 μM), 0.4 μL of FastPfu Polymerase (TransGen Biotech Co., Ltd., Beijing, China), and 10 ng of template DNA.
2.4. Illumina HiSeq 2500 Sequencing
Amplicons extracted from 2% agarose gels were purified using the AxyPrep DNA Gel Extraction Kit (Axygen Biosciences, Union City, CA, USA) according to the manufacturer’s instructions and quantified using QuantiFluor®-ST (Promega, Madison, WI, USA). Purified amplicons were pooled in equimolar and paired-end sequenced (2 × 250) on a HiSeq 2500 platform (Illumina, San Diego, CA, USA) according to the standard protocols. The raw sequence data were submitted to the NCBI Sequence Read Archive (SRA) database (BioProject ID: PRJNA881228).
2.5. Data Processing and Statistical Analysis
The sequencing reads (933,105 total tags) were demultiplexed by the unique barcodes and analyzed within the QIIME pipeline. After removing the adaptors, primers, and low-quality reads, the pair-end reads were overlapped to assemble the final sequences. Chimera tags were filtered out using the Gold database by UCHIME (version 4.2.40). Then, an operational taxonomic unit (OTU) analysis was performed using the Uparse package (version 7.0.1001) with a 97% sequence identity. Each OTU was taxonomically assigned to the SILVA database (v 132). OTUs were processed by removing chloroplast, chondriosome, and unclassified sequences. The OTUs with relative abundance values > 0.001% (more than three tags) in at least one sample were retained. Principal Coordinates Analysis (PCoA) was used to ordinate the samples based on their unweighted uniFrac distance matrices. The Pearson correlation test was used to examine the correlations between environmental factors, alpha diversity indices, and the relative abundances of top phyla. Permutational multivariate analysis of variance (PERMANOVA) was performed to investigate the effects of environmental factors on bacterial community structure at the genus level. The Phylogenetic Investigation of Communities by Reconstruction of Unobserved States (PICRUSt) approach was used on data from the Kyoto Encyclopedia of Genes and Genomes (KEGG) to predict the potential metabolic functions of the microbial communities.
3. Results
3.1. Environmental Characteristics of the Water
Table 1 shows the ranges of the physical and chemical factors of the water samples. The ammonium concentration at site GH and YC ranged from 1.87 to 7.99 mg·L−1 and 0.44 to 3.56 mg·L−1, respectively. The maximum ammonium occurred at site GH in October. TN concentrations at GH and YC ranged from 9.16 to 17.26 mg·L−1 and 7.89 to 13.78 mg·L−1, respectively. Total phosphorus (TP) concentrations varied from 0.24 to 0.70 mg·L−1, with the maximum value found at site GH in April. The pH values of the samples fluctuated slightly between seasons but remained relatively stable overall (6.96–7.52). The concentration of DO varied from 0.72 to 8.21 mg·L−1, with the highest DO concentrations found in January for both sites. The concentrations of manganese and nickel fluctuated between 0.014 and 0.287 mg·L−1 and 0.014 and 0.130 mg·L−1, respectively. Overall, the concentrations of ammonium, Mn, and Ni at site GH were slightly higher than at site YC (t-test, p = 0.08, p = 0.04, and p = 0.03, respectively), while the DO concentration at site GH was slightly lower than at site YC (t-test, p = 0.06). The average concentrations of TN (13.81 ± 1.81 and 10.86 ± 1.21 mg·L−1) and TP (0.52 ± 0.10 and 0.42 ± 0.09 mg·L−1) at sites GH and YC exceeded the China national surface water quality criteria of category V (i.e., agricultural waters; TN and TP should be less than 2 and 0.4 mg/L, respectively). The concentration of DO was negatively correlated with ammonium and TP (Table 2).
3.2. Alpha Diversity of the Samples
Rarefaction curves of all the samples tended to approach their respective saturation plateaus (Figure S1), indicating that the bacteria in these sites were well-represented by this library. The alpha diversity of the samples is shown in Table 3. The observed species, Chao 1, and Shannon indices of the water samples ranged from 796 to 3075, 1109.95 to 3869.16, and 5.33 to 9.91, respectively. The highest observed species, Chao 1, and Shannon values were detected in the sediment sample collected from site GH in January (GHs-Jan), while the lowest Shannon and observed species values were detected in the water sample from site GH in October (GHw-Oct). However, the lowest Chao 1 value was found in sample GHw-Jan. Overall, the mud samples showed relatively higher bacterial richness and diversity than the water samples.
3.3. Microbial Community Composition in the Water and Mud Samples
At the phylum level (Figure 2A), Proteobacteria was dominant (58.89 ± 4.47%) in all samples, followed by Bacteroidetes (8.48 ± 1.30%), Actinobacteria (5.48 ± 0.91%), and Chloroflexi (5.22 ± 1.53%). The top four phyla accounted for 78.07 ± 0.08% of the total OTUs. Proteobacteria had the highest abundance in the GHw-Oct sample (87.99%), while the highest relative abundance of Bacteroidetes was found in the YCw-Oct sample (22.59%). The highest abundance of Chloroflexi (19.95%) and Acidobacter (14.52%) were observed in the GHs-Oct and YCw-Apr samples, respectively. Specifically, the water samples from YC in April and January (YCw-Apr and YCw-Jan) showed a relatively high abundance of Saccharibacteria (15.84% and 14.63%, respectively).
The top five bacterial classes were Betaproteobacteria (24.79 ± 4.17%), Gammaproteobacteria (12.28 ± 2.94%), Epsilonproteobacteria (5.66 ± 2.69%), Deltaproteobacteria (8.28 ± 1.48%), and Alphaproteobacteria (7.78 ± 1.05%) (Figure 2B). The relative abundance of Betaproteobacteria was the highest in the YCw-Jul sample (56.8%). The relative abundances of Betaproteobacteria and Epsilonproteobacteria were higher in the water samples than in the mud samples. On the contrary, the relative abundances of Gammaproteobacteria and Deltaproteobacteria were higher in the mud samples than in the water samples.
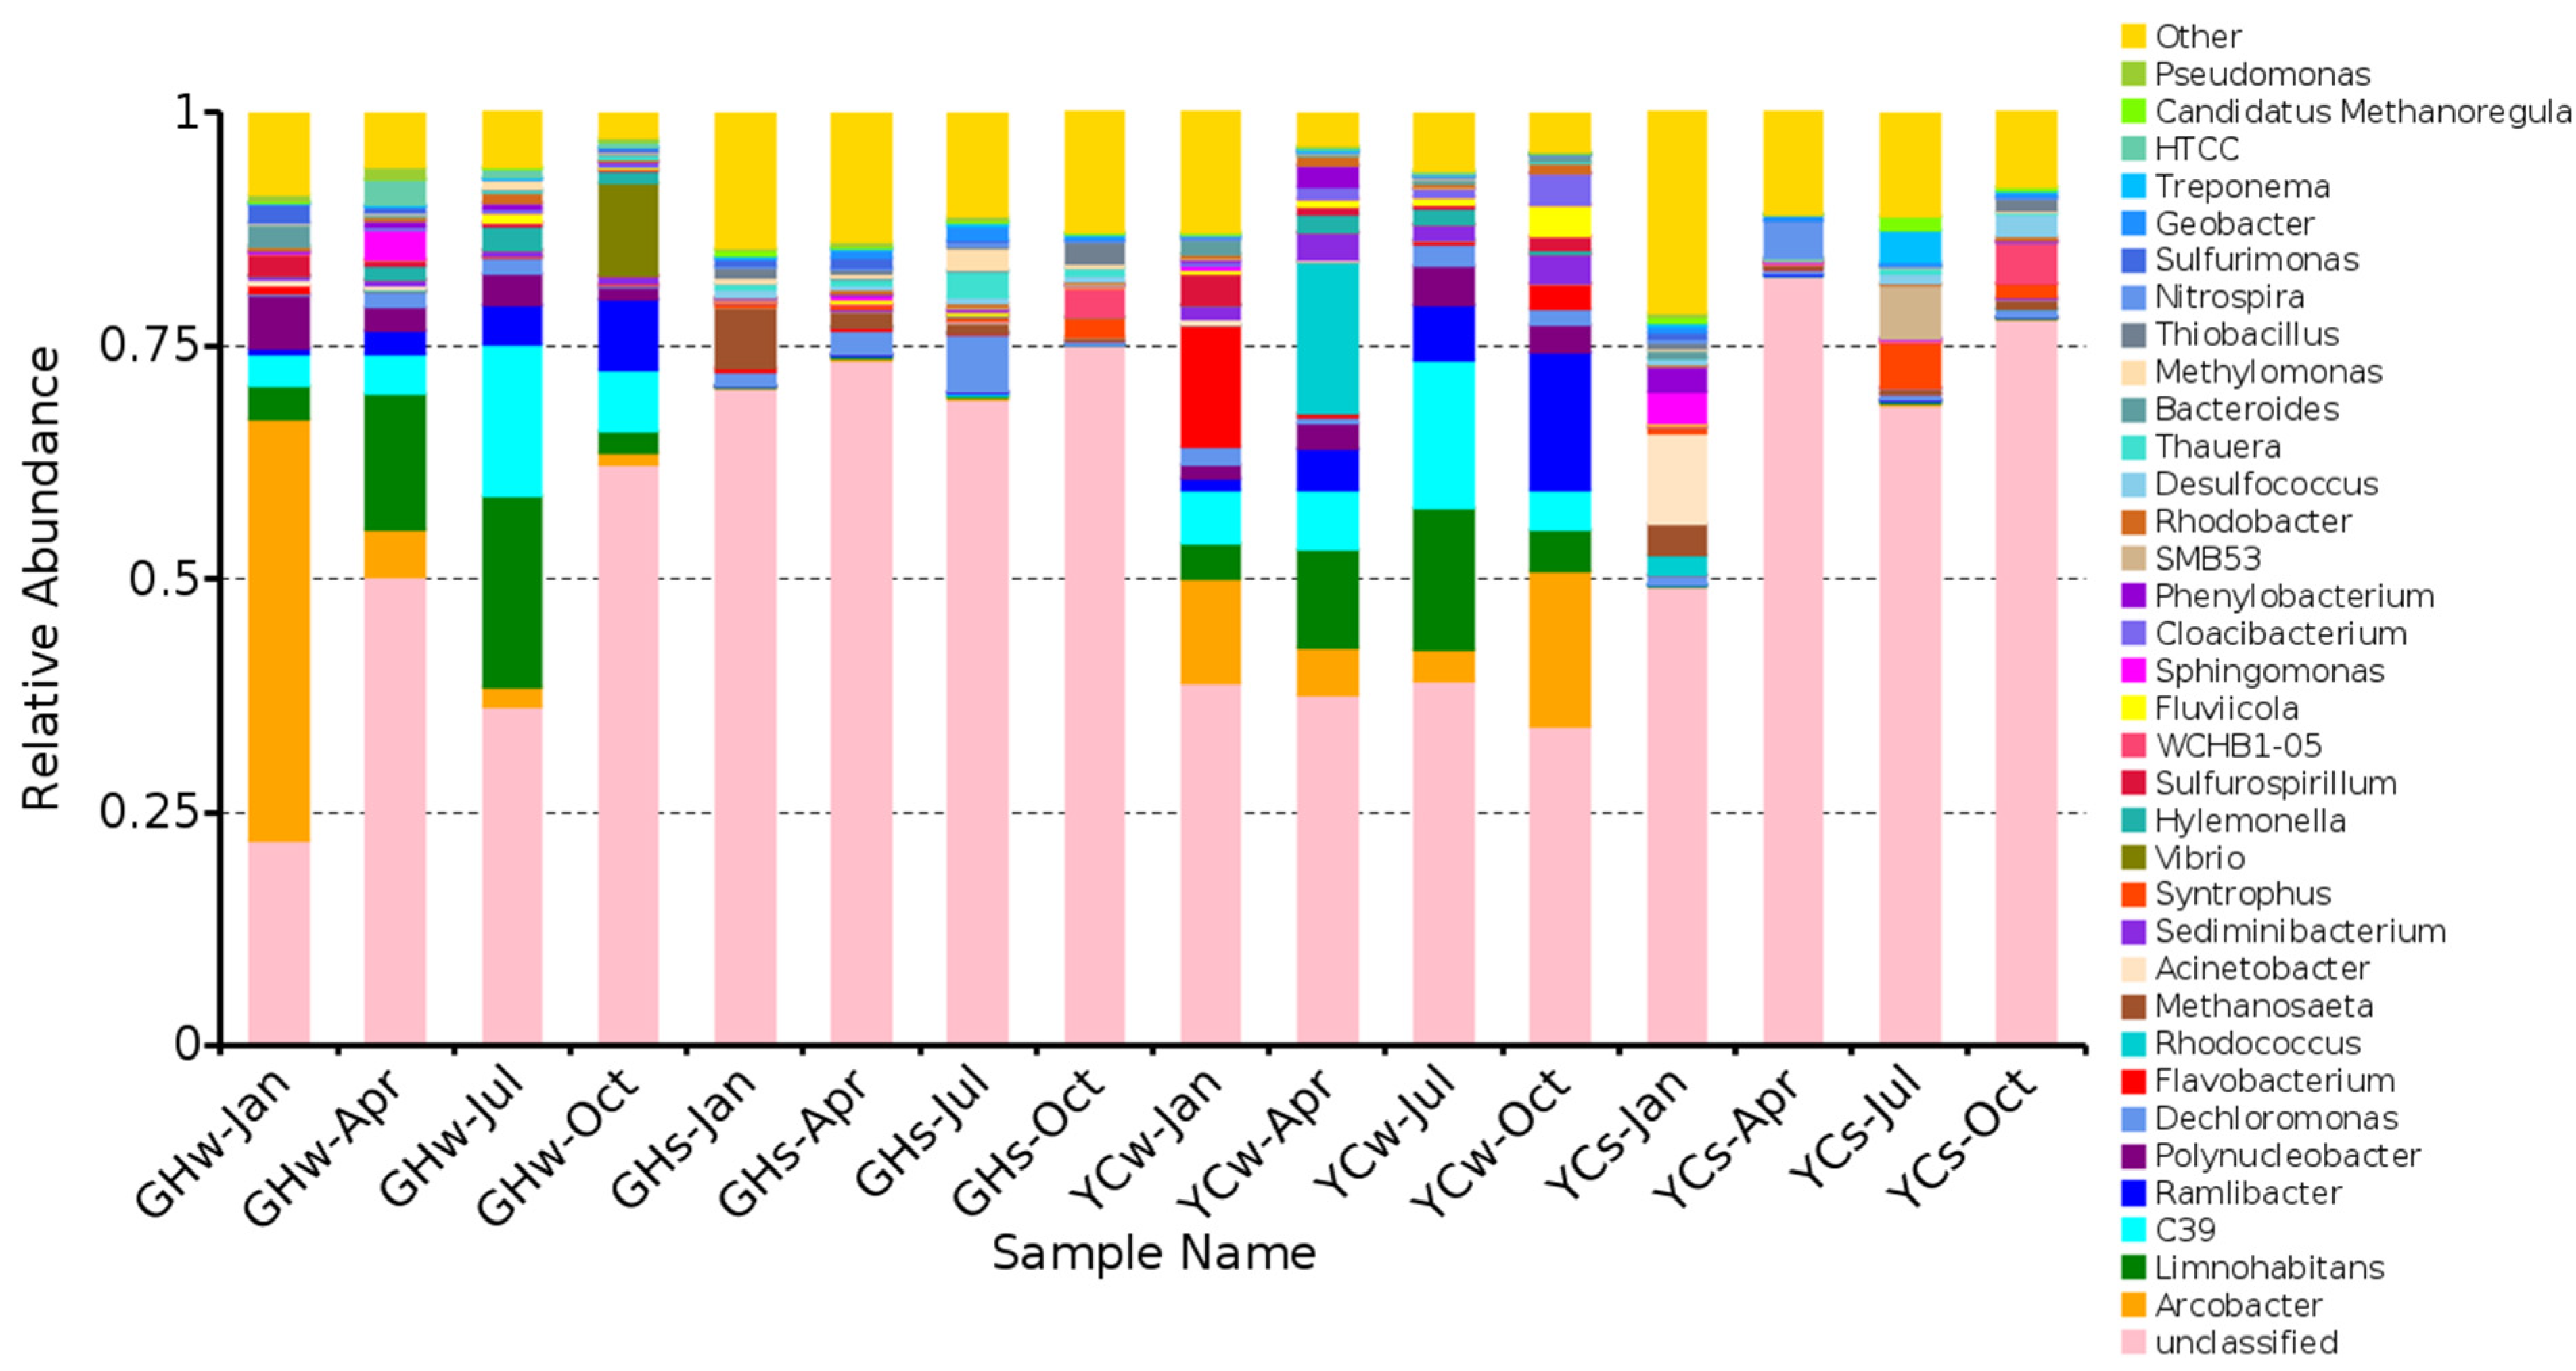
The top five genera from the GH and YC sites were as follows: Vibrio, Arcobacter, 12up, Limnohabitans, and Caldisericum (Figure 2C). Except for Caldisericum, which belongs to the Caldiserica phylum, the others belong to the Proteobacteria phylum. The relative abundances of Vibrio (43.83%) and Arcobacter (38.52%) were the highest in the GHw-Oct and GHw-Jan samples, respectively. The YCs-Jul and YCs-Jan mud samples showed the highest relative abundances of Caldisericum (13.63%) and Acinetobacter (7.46%). It is worth noting that the dominant genus in most water samples was Arcobacter. At the same time, a relatively higher abundance of the genus 12up was found in the water samples in July at both sites (YC and GH) when compared to the other samples.
PCoA was performed to analyze the dissimilarity of the bacterial community composition. As is shown in Figure 3, a separation between water and mud samples was observed. However, the distinction between the water samples obtained from the two sites was not clear. The distribution of the mud samples was relatively scattered, indicating different microbial community structures in these samples.
3.4. Correlation Analysis between Microbial Species and Environmental Factors
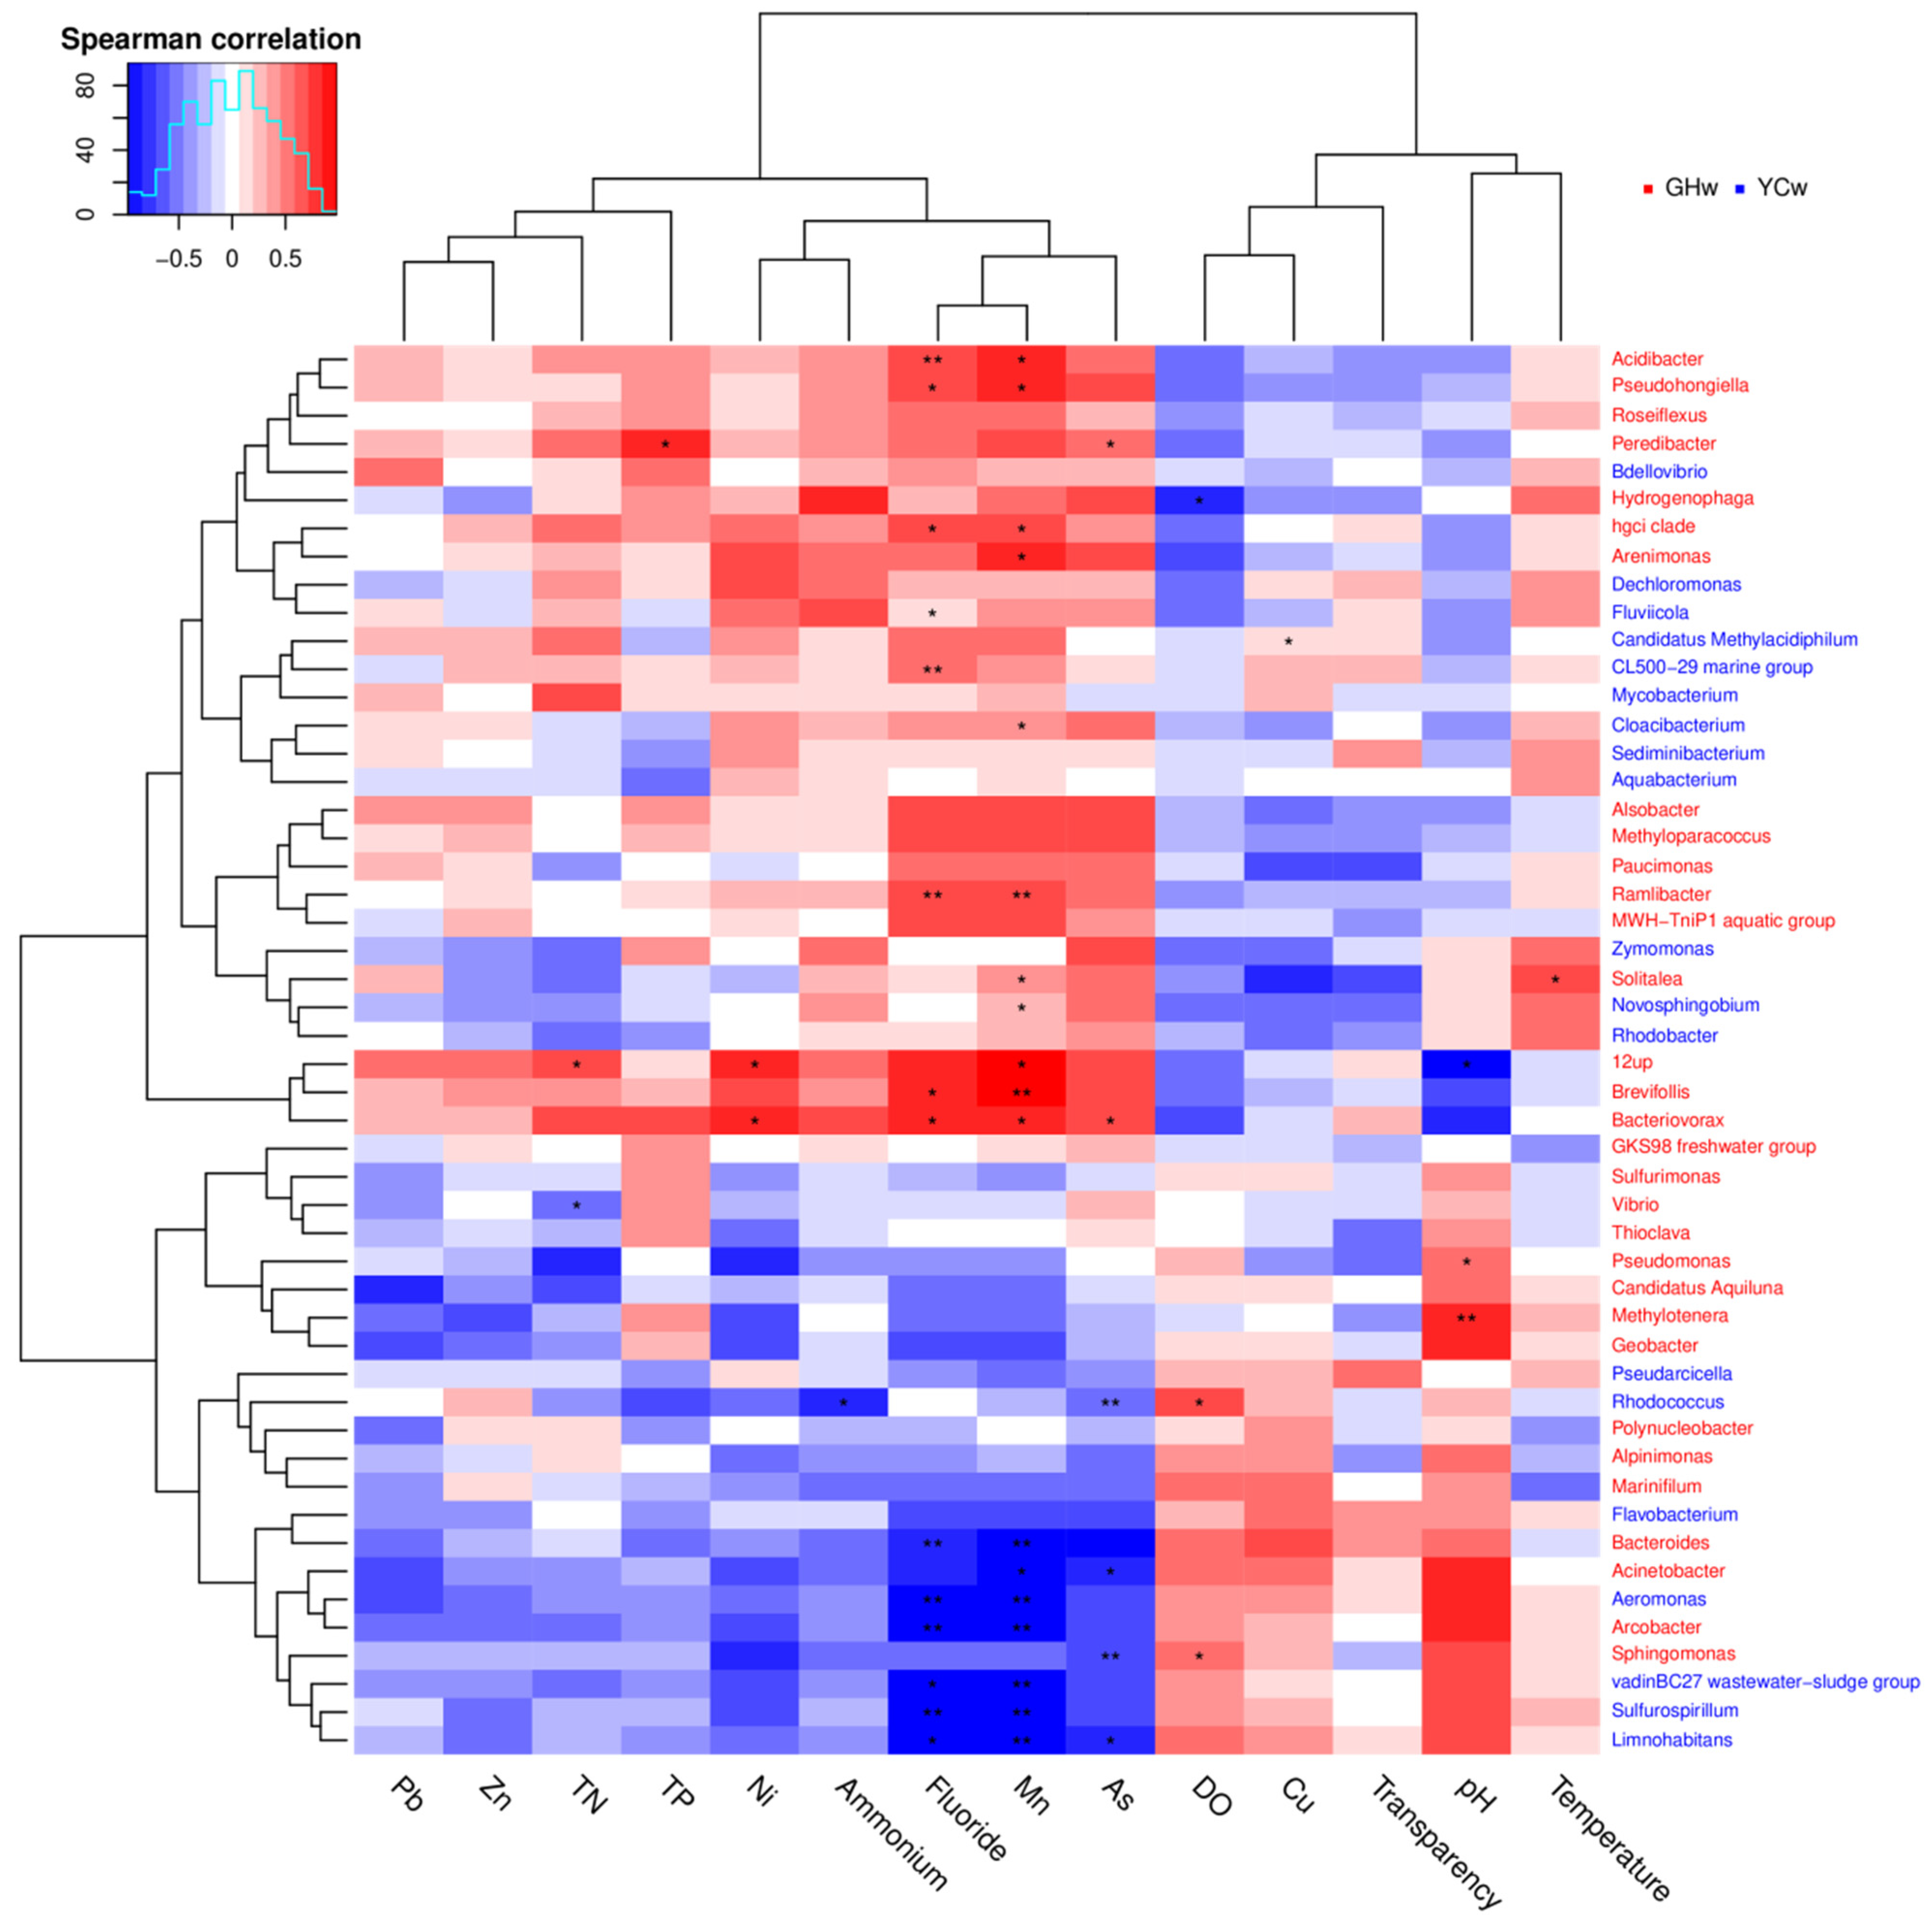
The Pearson correlation test was used to examine the correlations between environmental factors and alpha diversity indices and the relative abundances of top phyla. Chao 1 and observed species showed significant positive correlations with pH (p < 0.01 and p = 0.03, respectively), whereas they showed negative correlations with TN (p < 0.01 and p < 0.03, respectively). The relative abundance of Proteobacteria was negatively correlated with DO concentration, but positively correlated with ammonium (p = 0.01 and p = 0.03, respectively). The relative abundances of Bacteroidetes and Acidobacteria were negatively correlated with Mn concentration (p = 0.02 and p = 0.04, respectively). A significant negative correlation between Acidobacteria and fluoride concentration (p = 0.03) was also observed. The correlations between different genera and environmental factors are shown in Figure 4. Most genera showed strong correlations with Mn and fluoride concentrations, indicating that these are important factors that influence the composition of microbial communities. Acidibacter, Pseudohongiella, and hgcI clade were positively correlated with Mn and fluoride. In contrast, Arcobacter and Limnohabitans were negatively correlated with Mn and fluoride concentrations. Vibrio was negatively correlated with TN, while 12up was positively correlated with TN. 12up was negatively correlated with pH.
3.5. Predictive Analysis of the Genera Associated with Nitrogen Metabolism
PICRUSt analysis showed that many species were associated with nitrogen metabolism (Figure 5). The top genera associated with nitrogen metabolism were Arcobacter, Limnohabitans, and C39, with their highest contributions found in water samples (GHw-Jan, GHw-Jul, and GHw-Jul, respectively). The contribution of Dechloromonas was the highest in the GHs-Jul and YCs-Apr samples. The relative abundance of the classified nitrogen metabolism-related species in the water samples was higher than that of the mud samples. A greater distribution of the classified species related to nitrogen metabolism was found in the GH samples.
4. Discussion
The two sampling sites downstream of the Maozhou River experienced different pollution levels, as reflected by the water characteristics (Table 1). The average concentrations of TN (13.81 ± 1.81 and 10.86 ± 1.21 mg·L−1) and TP (0.52 ± 0.10 and 0.42 ± 0.09 mg·L−1) at sites GH and YC exceeded the China national surface water quality criteria of category V (i.e., agricultural waters; TN and TP should be less than 2 and 0.4 mg/L, respectively). The concentrations of metals were consistent with previous records from this area [28]. In general, site GH showed more serious pollution than site YC. This may be because site GH was in a denser industrial area with a greater population and a larger amount of domestic sewage and industrial wastewater discharge. As the Maozhou River is in the core area of the Guangdong-Hong Kong-Macao Greater Bay Area, the restoration and protection of the Maozhou River basin are of the utmost importance.
In our study, we found that the Chao 1 and observed species showed significant positive correlations with pH (p < 0.01 and p = 0.03, respectively), whereas they showed negative correlations with TN (p < 0.01 and p < 0.03, respectively). This is consistent with the previous finding that the bacterial community diversity was weak in areas with severe ammonia pollution [29]. Wastewater discharged from the surrounding plastic, paper, and electroplating industries might be responsible for the increase of chemical loading and resulting decrease in bacterial richness in TN-polluted areas. In a previous study, anthropogenic contaminants appeared to affect the water samples more than mud samples [9]. In our study, we found that the composition and structure of the microbial communities in water samples differed a lot (Figure 2 and Figure 3). Lu et al. studied seasonal changes in the bacterial community composition of water and sediment in a tributary of the Yellow River [16]. Various domestic and industrial wastewater discharge levels could offer the most plausible explanation for the apparent differences between the sites.
The dominant phyla in our samples were Proteobacteria, Bacteroidetes, Actinobacteria, and Chloroflexi. Our results are in accordance with previous studies about the Maozhou River [28]. Proteobacteria has also been found to play a dominant role in lakes [26] and reservoirs [30]. Bacteroidetes, which plays a vital role in the degradation of complex biopolymers [31], had the second highest relative abundance in the samples. Betaproteobacteria, which is considered a typical river clade and is dominant in freshwater bodies such as the Qingyi River in Sichuan, China [32] and the Apies River in South Africa [33], was the most abundant class (Figure 2B).
Arcobacter was dominant in most of the water samples from both sites. Members of the Arcobacter genus are also typical zoonotic pathogens [34]. Vibrio was the dominant genus in the water samples from site GH in October (GHw-Oct) (Figure 2C). Vibrio is a genus of heterotrophic bacteria that are widely distributed [35] and is generally associated with human and marine animal diseases [36]. Pathogens such as Vibrio and Arcobacter are usually detected in the final effluents of wastewater [37]. In our study, sewage discharge and wastewater from the surrounding wastewater treatment plants (i.e., Songgang WWTPs near site YC) may be the primary origin of these potential pathogens. Disinfecting sewage discharge could help control the spread and diffusion of potential pathogens in the river. Further research on pathogenicity, transmission mechanism, and factors affecting the spread of Vibrio in the Maozhou River is required. A large number of genera with potential bioremediation functions were also detected. Microorganisms involved in bioremediation are the main drivers of nitrogen degradation and water pollution. For example, Rhodococcus spp. has a variety of catabolic genes whose products can degrade numerous natural and synthetic organic compounds [38,39]. Caldisericum has been shown to degrade heterocyclic nitrogen compounds under anaerobic conditions and promote the hydrolysis of biorefractory pollutants and petroleum organics [40]. In addition, our results showed that the abundance of Limnohabitans was relatively high in the water samples collected from both sites. This is because members of the Limnohabitans genus are typical and indispensable freshwater bacterioplankton and are widely distributed throughout water bodies [41].
The water body of the Maozhou River was affected by various point and non-point sources and its quality was unstable, further complicating our pollutant analysis [23,42]. The correlation analysis showed that various environmental factors were strongly correlated with the bacterial distribution in the water samples. The level of bacterial richness (Chao 1 and observed species) showed significant correlations with pH and TN. At the phylum level, the relative abundance of the dominant phylum, Proteobacteria, was negatively correlated with DO concentration, but positively correlated with ammonium (p = 0.01 and p = 0.03, respectively). The relative abundances of Bacteroidetes and Acidobacteria were negatively correlated with Mn concentration (p = 0.02 and p = 0.04, respectively). We also observed a significant negative correlation between Acidobacteria and fluoride concentration (p = 0.03). At the genus level, Mn and fluoride were the main factors that affected community composition, as they showed negative correlations with the relative abundances of the dominant genera Arcobacter and Limnohabitans (Figure 4). The effect of Mn on the microbial community in the Maozhou River has been previously reported on [28] and fluoride has been reported to play an essential role in shaping the microbial community structure in groundwater systems [43]. Bacteria with specific ecological functions carry out many metabolic activities associated with metabolic function genes [44]. The PICRUSt analysis indicated that the genera associated with nitrogen metabolism differed between samples (Figure 5). This is consistent with the findings regarding the temporal dynamics of bacterial communities and the prediction of nitrogen metabolism genes in large wastewater treatment plants reported by Fan et al. [45]. Moreover, this result provides a scientific basis for developing and utilizing denitrifying microbial resources in the river. Future studies that explore the dynamic changes of functional genes associated with nitrogen removal and the dynamic changes of nitrogen metabolism pathway genes are warranted [45,46].
5. Conclusions
In conclusion, this study proved that the bacterial community composition varies significantly under different pollution levels related to the physiochemical properties of the study site. pH, TN, Mn, and fluoride were the main environmental factors that affected the richness and composition of the microbial communities. Furthermore, potential risk-posing pathogens, such as Vibrio and Arcobacter, were found in water samples. Our findings provide a foundation for elucidating the mechanisms underlying bacterial function in freshwater bodies. Moreover, further investigations that examine specific bacteria or the community composition at sites covering the entire river should be conducted.
Supplementary Materials
The following supporting information can be downloaded at: https://www.mdpi.com/article/10.3390/w14233844/s1, Figure S1: Rarefaction curves of all samples.
Author Contributions
L.O.: Formal analysis, Writing—original draft, Writing—review & editing. X.L.: Investigation, Methodology, Writing—original draft, Writing—review & editing. H.C.: Methodology, Formal analysis. X.Y.: Methodology, Formal analysis. S.L. (Shaofeng Li): Writing—review & editing. S.L. (Shuangfei Li): Conceptualization, Project administration, Funding acquisition, Supervision. All authors have read and agreed to the published version of the manuscript.
Funding
This work was supported by the Scientific Research Startup Fund for Shenzhen High-Caliber Personnel of SZPT (No. 6022310040K), Post-doctoral Later-stage Foundation Project of Shenzhen Polytechnic (6021271015K1), National Key Research and Development Program of China (2020YFD0901003), and Shenzhen Sustainable Development Science and Technology Project (KCXFZ20201221173404012 and KCXFZ20201221173203010).
Data Availability Statement
The raw reads of the sequencing data were submitted to the NCBI Sequence Read Archive (SRA) database (BioProject ID: PRJNA881228). Other data are available from the corresponding author on reasonable request.
Conflicts of Interest
The authors declare no conflict of interest.
References
- Li, D.R.; Zhang, J. Measurement and analysis of ecological pressure due to industrial development in the Yangtze River economic belt from 2010 to 2018. J. Clean. Prod. 2022, 353, 131614. [Google Scholar] [CrossRef]
- Yin, H.L.; Islam, M.S.; Ju, M.D. Urban river pollution in the densely populated city of Dhaka, Bangladesh: Big picture and rehabilitation experience from other developing countries. J. Clean. Prod. 2021, 321, 129040. [Google Scholar] [CrossRef]
- Huang, T.Y.; Wu, W.; Li, W.W. Identifying the major pollution sources and pollution loading status of Qiputang River in Taihu Lake basin of China. Desalination Water Treat. 2013, 51, 4736–4743. [Google Scholar] [CrossRef]
- Yang, J.F.; Lei, K.; Khu, S.; Meng, W.; Qiao, F. Assessment of water environmental carrying capacity for sustainable development using a coupled system dynamics approach applied to the Tieling of the Liao River Basin, China. Environ. Earth Sci. 2015, 73, 5173–5183. [Google Scholar] [CrossRef]
- Jarvie, H.P.; Neal, C.; Withers, P.J. Sewage-effluent phosphorus: A greater risk to river eutrophication than agricultural phosphorus? Sci. Total Environ. 2006, 360, 246–253. [Google Scholar] [CrossRef]
- Kaiser, K.; Canedo-Oropeza, M.; McMahon, R.; Amon, R.M. Origins and transformations of dissolved organic matter in large Arctic rivers. Sci. Rep. 2017, 7, 13064. [Google Scholar] [CrossRef] [Green Version]
- Bhardwaj, R.; Gupta, A.; Garg, J. Impact of heavy metals on inhibitory concentration of Escherichia coli—a case study of river Yamuna system, Delhi, India. Environ. Monit. Assess. 2018, 190, 674. [Google Scholar] [CrossRef] [PubMed]
- McLellan, S.L.; Fisher, J.C.; Newton, R.J. The microbiome of urban waters. Int. Microbiol. 2015, 18, 141–149. [Google Scholar] [CrossRef]
- Xie, Y.; Wang, J.; Wu, Y.; Ren, C.; Song, C.; Yang, J.; Yu, H.; Giesy, J.P.; Zhang, X. Using in situ bacterial communities to monitor contaminants in river sediments. Environ. Pollut. 2016, 212, 348–357. [Google Scholar] [CrossRef]
- Sun, W.; Xia, C.; Xu, M.; Guo, J.; Sun, G. Seasonality Affects the Diversity and Composition of Bacterioplankton Communities in Dongjiang River, a Drinking Water Source of Hong Kong. Front. Microbiol. 2017, 8, 1644. [Google Scholar] [CrossRef]
- Catania, V.; Cappello, S.; Di Giorgi, V.; Santisi, S.; Di Maria, R.; Mazzola, A.; Vizzini, S.; Quatrini, P. Microbial communities of polluted sub-surface marine sediments. Mar. Pollut. Bull. 2018, 131, 396–406. [Google Scholar] [CrossRef] [PubMed]
- Fang, J.; Yang, R.; Cao, Q.; Dong, J.; Li, C.; Quan, Q.; Huang, M.; Liu, J. Differences of the microbial community structures and predicted metabolic potentials in the lake, river, and wetland sediments in Dongping Lake Basin. Environ. Sci. Pollut. Res. 2020, 27, 19661–19677. [Google Scholar] [CrossRef] [PubMed]
- Xu, Z.; Woodhouse, J.N.; Te, S.H.; Yew-Hoong Gin, K.; He, Y.; Xu, C.; Chen, L. Seasonal variation in the bacterial community composition of a large estuarine reservoir and response to cyanobacterial proliferation. Chemosphere 2018, 202, 576–585. [Google Scholar] [CrossRef] [PubMed]
- Pham, V.H.; Kim, J. Cultivation of unculturable soil bacteria. Trends Biotechnol. 2012, 30, 475–484. [Google Scholar] [CrossRef] [PubMed]
- Zwart, G.; Crump, B.C.; Agterveld, M.P.K.; Hagen, F.; Han, S.-K. Typical freshwater bacteria: An analysis of available 16S rRNA gene sequences from plankton of lakes and rivers. Aquat. Microb. Ecol. 2002, 28, 141–155. [Google Scholar] [CrossRef] [Green Version]
- Lu, S.; Sun, Y.; Lu, B.; Zheng, D.; Xu, S. Change of abundance and correlation of Nitrospira inopinata-like comammox and populations in nitrogen cycle during different seasons. Chemosphere 2020, 241, 125098. [Google Scholar] [CrossRef]
- Wang, L.; Zhang, J.; Li, H.; Yang, H.; Peng, C.; Peng, Z.; Lu, L. Shift in the microbial community composition of surface water and sediment along an urban river. Sci. Total Environ. 2018, 627, 600–612. [Google Scholar] [CrossRef]
- Markussen, T.; Happel, E.M.; Teikari, J.E.; Huchaiah, V.; Alneberg, J.; Andersson, A.F.; Sivonen, K.; Riemann, L.; Middelboe, M.; Kisand, V. Coupling biogeochemical process rates and metagenomic blueprints of coastal bacterial assemblages in the context of environmental change. Environ. Microbiol. 2018, 20, 3083–3099. [Google Scholar] [CrossRef]
- Kaevska, M.; Videnska, P.; Sedlar, K.; Slana, I. Seasonal changes in microbial community composition in river water studied using 454-pyrosequencing. SpringerPlus 2016, 5, 409. [Google Scholar] [CrossRef] [Green Version]
- Leff, L.G.; Brown, B.J.; Lemke, M.J. Spatial and Temporal Changes in Bacterial Assemblages of the Cuyahoga River. Ohio J. Sci. 1999, 99, 44–48. [Google Scholar]
- Bik, E.M.; Costello, E.K.; Switzer, A.D.; Callahan, B.J.; Holmes, S.P.; Wells, R.S.; Carlin, K.P.; Jensen, E.D.; Venn-Watson, S.; Relman, D.A. Marine mammals harbor unique microbiotas shaped by and yet distinct from the sea. Nat. Commun. 2016, 7, 10516. [Google Scholar] [CrossRef] [PubMed]
- Wu, P.; Tang, Y.; Dang, M.; Wang, S.; Jin, H.; Liu, Y.; Jing, H.; Zheng, C.; Yi, S.; Cai, Z. Spatial-temporal distribution of microplastics in surface water and sediments of Maozhou River within Guangdong-Hong Kong-Macao Greater Bay Area. Sci. Total Environ. 2020, 717, 135187. [Google Scholar] [CrossRef] [PubMed]
- Zhang, D.; Wang, J.J.; Ni, H.G.; Zeng, H. Spatial-temporal and multi-media variations of polycyclic aromatic hydrocarbons in a highly urbanized river from South China. Sci. Total Environ. 2017, 581–582, 621–628. [Google Scholar] [CrossRef] [PubMed]
- Qiu, W.; Sun, J.; Fang, M.; Luo, S.; Tian, Y.; Dong, P.; Xu, B.; Zheng, C. Occurrence of antibiotics in the main rivers of Shenzhen, China: Association with antibiotic resistance genes and microbial community. Sci. Total Environ. 2019, 653, 334–341. [Google Scholar] [CrossRef]
- APHA. Standard Methods for the Examination of Water and Wastewater, 21st ed.; APHA: Washington, DC, USA, 2005. [Google Scholar]
- Kozich, J.J.; Westcott, S.L.; Baxter, N.T.; Highlander, S.K.; Schloss, P.D. Development of a Dual-Index Sequencing Strategy and Curation Pipeline for Analyzing Amplicon Sequence Data on the MiSeq Illumina Sequencing Platform. Appl. Environ. Microbiol. 2013, 79, 5112–5120. [Google Scholar] [CrossRef] [Green Version]
- Mori, H.; Maruyama, F.; Kato, H.; Toyoda, A.; Dozono, A.; Ohtsubo, Y.; Nagata, Y.; Fujiyama, A.; Tsuda, M.; Kurokawa, K. Design and Experimental Application of a Novel Non-Degenerate Universal Primer Set that Amplifies Prokaryotic 16S rRNA Genes with a Low Possibility to Amplify Eukaryotic rRNA Genes. DNA Res. 2014, 21, 217–227. [Google Scholar] [CrossRef]
- Liao, H.; Yu, K.; Duan, Y.; Ning, Z.; Li, B.; He, L.; Liu, C. Profiling microbial communities in a watershed undergoing intensive anthropogenic activities. Sci. Total Environ. 2019, 647, 1137–1147. [Google Scholar] [CrossRef]
- Diao, M.; Sinnige, R.; Kalbitz, K.; Huisman, J.; Muyzer, G. Succession of Bacterial Communities in a Seasonally Stratified Lake with an Anoxic and Sulfidic Hypolimnion. Front. Microbiol. 2017, 8, 2511. [Google Scholar] [CrossRef] [Green Version]
- Nyirabuhoro, P.; Liu, M.; Xiao, P.; Liu, L.; Yu, Z.; Wang, L.; Yang, J. Seasonal Variability of Conditionally Rare Taxa in the Water Column Bacterioplankton Community of Subtropical Reservoirs in China. Microb. Ecol. 2019, 80, 14–26. [Google Scholar] [CrossRef]
- Newton, R.J.; Jones, S.E.; Eiler, A.; McMahon, K.D.; Bertilsson, S. A guide to the natural history of freshwater lake bacteria. Microbiol. Mol. Biol. Rev. 2011, 75, 14–49. [Google Scholar] [CrossRef] [Green Version]
- Sha, J.; Wu, J.; Bi, C.; Chen, C.; Su, Q.; Wang, S.; Wang, C.; Zhou, Y. Responses of microbial community to different concentration of perchlorate in the Qingyi River. 3 Biotech 2020, 10, 21. [Google Scholar] [CrossRef] [PubMed]
- Abia, A.L.K.; Alisoltani, A.; Keshri, J.; Ubomba-Jaswa, E. Metagenomic analysis of the bacterial communities and their functional profiles in water and sediments of the Apies River, South Africa, as a function of land use. Sci. Total Environ. 2018, 616–617, 326–334. [Google Scholar] [CrossRef] [PubMed]
- Ghaju Shrestha, R.; Sherchan, S.P.; Kitajima, M.; Tanaka, Y.; Gerba, C.P.; Haramoto, E. Reduction of Arcobacter at Two Conventional Wastewater Treatment Plants in Southern Arizona, USA. Pathogens 2019, 8, 175. [Google Scholar] [CrossRef] [PubMed] [Green Version]
- Chakraborty, S.; Nair, G.B.; Shinoda, S. Pathogenic vibrios in the natural aquatic environment. Rev. Environ. Health 1997, 12, 63–80. [Google Scholar] [CrossRef]
- Rubio-Portillo, E.; Gago, J.F.; Martinez-Garcia, M.; Vezzulli, L.; Rossello-Mora, R.; Anton, J.; Ramos-Espla, A.A. Vibrio communities in scleractinian corals differ according to health status and geographic location in the Mediterranean Sea. Syst. Appl. Microbiol. 2018, 41, 131–138. [Google Scholar] [CrossRef]
- Chen, X.; Lang, X.L.; Xu, A.-L.; Song, Z.-W.; Yang, J.; Guo, M.-Y. Seasonal Variability in the Microbial Community and Pathogens in Wastewater Final Effluents. Water 2019, 11, 2856. [Google Scholar] [CrossRef] [Green Version]
- Wever, H.D.; Cort, S.D.; Noots, I.; Verachtert, H. Isolation and characterization of Rhodococcus rhodochrous for the degradation of the wastewater component 2-hydroxybenzothiazole. Appl. Microbiol. Biotechnol. 1997, 47, 458–461. [Google Scholar] [CrossRef]
- Whyte, L.G.; Greer, C.W.; Inniss, W.E. Assessment of the biodegradation potential of psychrotrophic microorganisms. Can. J. Microbiol. 1996, 42, 99–106. [Google Scholar] [CrossRef]
- Shi, J.; Han, Y.; Xu, C.; Han, H. Enhanced biodegradation of coal gasification wastewater with anaerobic biofilm on polyurethane (PU), powdered activated carbon (PAC), and biochar. Bioresour. Technol. 2019, 289, 121487. [Google Scholar] [CrossRef]
- Jezberova, J.; Jezbera, J.; Znachor, P.; Nedoma, J.; Kasalicky, V.; Simek, K. The Limnohabitans Genus Harbors Generalistic and Opportunistic Subtypes: Evidence from Spatiotemporal Succession in a Canyon-Shaped Reservoir. Appl. Environ. Microbiol. 2017, 83, e01530-17. [Google Scholar] [CrossRef] [Green Version]
- Chai, M.; Li, R.; Ding, H.; Zan, Q. Occurrence and contamination of heavy metals in urban mangroves: A case study in Shenzhen, China. Chemosphere 2019, 219, 165–173. [Google Scholar] [CrossRef]
- Zhang, X.; Gao, X.; Li, C.; Luo, X.; Wang, Y. Fluoride contributes to the shaping of microbial community in high fluoride groundwater in Qiji County, Yuncheng City, China. Sci. Rep. 2019, 9, 14488. [Google Scholar] [CrossRef] [PubMed] [Green Version]
- Liao, H.; Yen, J.Y.; Guan, Y.; Ke, D.; Liu, C. Differential responses of stream water and bed sediment microbial communities to watershed degradation. Environ. Int. 2020, 134, 105198. [Google Scholar] [CrossRef] [PubMed]
- Fan, X.-Y.; Gao, J.-F.; Pan, K.-L.; Li, D.-C.; Dai, H.-H. Temporal dynamics of bacterial communities and predicted nitrogen metabolism genes in a full-scale wastewater treatment plant. RSV Adv. 2017, 7, 56317–56327. [Google Scholar] [CrossRef] [Green Version]
- Kuypers, M.M.M.; Marchant, H.K.; Kartal, B. The microbial nitrogen-cycling network. Nat. Rev. Microbiol. 2018, 16, 263–276. [Google Scholar] [CrossRef] [PubMed]
Figure 1.
Map of the sampling sites in the Maozhou River.

Figure 2.
Bacterial community composition at (A) the phylum level (top 15), (B) the class level (top 20), and (C) the genus level (top 35).
Figure 2.
Bacterial community composition at (A) the phylum level (top 15), (B) the class level (top 20), and (C) the genus level (top 35).

Figure 3.
Principal coordinate analysis (PCoA) based on the unweighted uniFrac profile demonstrated the dissimilarities in the microbial community composition of the different samples. [Note: PC1 and PC2 contributes of 33.47% and 10.73%, respectively.] Each point in the figure represents a sample; red and orange dots represent water and mud samples from site GH while green and blue dots represent water and mud samples from site YC, respectively.

Figure 4.
Correlation analysis between the microbial species and environmental factors from all water samples. Each row represents a microbial species and the color of the species name indicates the species that are enriched in the corresponding color group in the upper right corner. The columns represent environmental factors. In the plot, blue-colored boxes represent negative correlations and red-colored boxes represent positive correlations; the darker the color, the stronger the correlation. The * in the figure indicates a p-value < 0.05, and the ** in the figure indicates a p-value < 0.01.

Figure 5.
The relative contribution of bacterial genera associated with nitrogen metabolism.


Table 1.
Sampling sites and physicochemical properties of the water.
| Site | Sample | Transparency | Temperature | pH | DO | Ammonium | TP | TN | Cu | Zn | Ni | Mn | Fluoride |
|---|---|---|---|---|---|---|---|---|---|---|---|---|---|
| (cm) | (°C) | (mg·L−1) | |||||||||||
| GH | GHw-Jan | 62 | 16.8 | 6.97 | 5.4 | 1.87 | 0.27 | 15.98 | 0.072 | 0.094 | 0.13 | 0.256 | 0.77 |
| GHw-Apr | 30 | 27.2 | 6.96 | 2.01 | 4.23 | 0.7 | 12.84 | 0.006 | 0.055 | 0.087 | 0.264 | 0.9 | |
| GHw-Jul | 25 | 30.2 | 7.2 | 0.92 | 5.11 | 0.48 | 9.16 | 0.006 | 0.01 | 0.045 | 0.173 | 0.63 | |
| GHw-Oct | 18 | 28.2 | 7.03 | 0.72 | 7.99 | 0.63 | 17.26 | 0.006 | 0.026 | 0.073 | 0.287 | 0.73 | |
| YC | YCw-Jan | 25 | 15.8 | 7.32 | 8.21 | 0.44 | 0.32 | 11.13 | 0.011 | 0.036 | 0.035 | 0.014 | 0.45 |
| YCw-Apr | 20 | 27.4 | 7.1 | 6.71 | 0.99 | 0.24 | 10.64 | 0.006 | 0.05 | 0.039 | 0.201 | 0.71 | |
| YCw-Jul | 13 | 29.7 | 7.52 | 3.79 | 2.25 | 0.51 | 7.89 | 0.006 | 0.016 | 0.014 | 0.174 | 0.7 | |
| YCw-Oct | 35 | 28.4 | 7.14 | 4.36 | 3.56 | 0.62 | 13.78 | 0.007 | 0.024 | 0.04 | 0.074 | 0.66 | |
Note: ‘Jan’, ‘Apr’, ’ Jul’, and ‘Oct’ in the second column represent January, April, July, and October, respectively, and the letter ‘w’ represents water samples.
Table 2.
Pearson’s correlation matrix for the chemical and physical properties of the water samples (* p value < 0.05; ** p value < 0.01).
Table 2.
Pearson’s correlation matrix for the chemical and physical properties of the water samples (* p value < 0.05; ** p value < 0.01).
| Transparency | Temperature | pH | DO | Ammonium | TP | TN | Cu | Zn | Ni | Mn | Fluoride | As | Pb | |
|---|---|---|---|---|---|---|---|---|---|---|---|---|---|---|
| Transparency | −0.59 | −0.55 | 0.20 | −0.21 | −0.28 | 0.52 | 0.90 ** | 0.79 * | 0.80 * | 0.14 | 0.23 | −0.13 | −0.27 | |
| Temperature | −0.59 | 0.12 | −0.68 | 0.55 | 0.60 | −0.29 | −0.66 | −0.65 | −0.44 | 0.27 | 0.35 | 0.52 | 0.22 | |
| pH | −0.55 | 0.12 | 0.24 | −0.35 | −0.12 | −0.76 * | −0.37 | −0.61 | −0.81 * | −0.58 | −0.59 | −0.49 | −0.25 | |
| DO | 0.20 | −0.68 | 0.24 | −0.91 ** | −0.75 * | −0.17 | 0.26 | 0.38 | −0.16 | −0.59 | −0.50 | −0.84 ** | 0.27 | |
| Ammonium | −0.21 | 0.55 | −0.35 | −0.91 ** | 0.73 * | 0.44 | −0.27 | −0.37 | 0.19 | 0.52 | 0.35 | 0.72 * | −0.21 | |
| TP | −0.28 | 0.60 | −0.12 | −0.75 * | 0.73 * | 0.19 | −0.49 | −0.44 | −0.05 | 0.21 | 0.41 | 0.69 | −0.35 | |
| TN | 0.52 | −0.29 | −0.76 * | −0.17 | 0.44 | 0.19 | 0.45 | 0.49 | 0.74 * | 0.42 | 0.33 | 0.20 | −0.07 | |
| Cu | 0.90 ** | −0.66 | −0.37 | 0.26 | −0.27 | −0.49 | 0.45 | 0.82 * | 0.77 * | 0.26 | 0.18 | −0.24 | −0.24 | |
| Zn | 0.79 * | −0.65 | −0.61 | 0.38 | −0.37 | −0.44 | 0.49 | 0.82 * | 0.82 * | 0.37 | 0.42 | −0.05 | 0.16 | |
| Ni | 0.80 * | −0.44 | −0.81 * | −0.16 | 0.19 | −0.05 | 0.74 * | 0.77 * | 0.82 * | 0.62 | 0.56 | 0.34 | −0.14 | |
| Mn | 0.14 | 0.27 | −0.58 | −0.59 | 0.52 | 0.21 | 0.42 | 0.26 | 0.37 | 0.62 | 0.84 ** | 0.71 * | 0.21 | |
| Fluoride | 0.23 | 0.35 | −0.59 | −0.50 | 0.35 | 0.41 | 0.33 | 0.18 | 0.42 | 0.56 | 0.84 ** | 0.74 * | 0.19 | |
| As | −0.13 | 0.52 | −0.49 | −0.84 ** | 0.72 * | 0.69 | 0.20 | −0.24 | −0.05 | 0.34 | 0.71 * | 0.74 * | −0.01 | |
| Pb | −0.27 | 0.22 | −0.25 | 0.27 | −0.21 | −0.35 | −0.07 | −0.24 | 0.16 | −0.14 | 0.21 | 0.19 | −0.01 |
Table 3.
Alpha diversity indices of microbial communities in the surface water and mud samples.
| Sample ID | Total Tags | OTUs | Shannon | Chao 1 | Observed Species |
|---|---|---|---|---|---|
| GHw-Jan | 50,577 | 1180 | 5.84 | 1109.95 | 895 |
| GHw-Apr | 54,099 | 1600 | 7.08 | 1412.93 | 1127 |
| GHw-Jul | 44,143 | 1431 | 6.35 | 1608.23 | 1084 |
| GHw-Oct | 147,186 | 1700 | 5.33 | 1246.58 | 796 |
| GHs-Jan | 54,625 | 3965 | 9.91 | 3869.16 | 3075 |
| GHs-Apr | 30,309 | 3055 | 9.88 | 3057.23 | 2637 |
| GHs-Jul | 56,693 | 3938 | 9.62 | 3723.96 | 2924 |
| GHs-Oct | 73,603 | 3540 | 9.46 | 3597.09 | 2597 |
| YCw-Jan | 36,991 | 1453 | 7.55 | 1491.31 | 1280 |
| YCw-Apr | 37,399 | 1370 | 6.79 | 1419.25 | 1046 |
| YCw-Jul | 43,415 | 1766 | 6.84 | 1803.79 | 1312 |
| YCw-Oct | 103,871 | 1658 | 6.03 | 1340.58 | 914 |
| YCs-Jan | 45,662 | 2009 | 9.12 | 2059.23 | 1865 |
| YCs-Apr | 47,229 | 2673 | 9.49 | 2888.29 | 2281 |
| YCs-Jul | 35,880 | 1773 | 7.40 | 1917.98 | 1444 |
| YCs-Oct | 71,423 | 2732 | 8.64 | 2728.06 | 2009 |
Note: ‘Jan’, ‘Apr’, ’ Jul’, and ‘Oct’ in the second column represent January, April, July, and October, respectively, ‘w’ represents water samples, and ‘s’ represents mud samples. Total tags represent tags after data processing.
Publisher’s Note: MDPI stays neutral with regard to jurisdictional claims in published maps and institutional affiliations. |
© 2022 by the authors. Licensee MDPI, Basel, Switzerland. This article is an open access article distributed under the terms and conditions of the Creative Commons Attribution (CC BY) license (https://creativecommons.org/licenses/by/4.0/).
Share and Cite
MDPI and ACS Style
Ouyang, L.; Liu, X.; Chen, H.; Yang, X.; Li, S.; Li, S. Comparison of the Microbial Communities Affected by Different Environmental Factors in a Polluted River. Water 2022, 14, 3844. https://doi.org/10.3390/w14233844
AMA Style
Ouyang L, Liu X, Chen H, Yang X, Li S, Li S. Comparison of the Microbial Communities Affected by Different Environmental Factors in a Polluted River. Water. 2022; 14(23):3844. https://doi.org/10.3390/w14233844
Chicago/Turabian StyleOuyang, Liao, Xinyue Liu, Huirong Chen, Xuewei Yang, Shaofeng Li, and Shuangfei Li. 2022. "Comparison of the Microbial Communities Affected by Different Environmental Factors in a Polluted River" Water 14, no. 23: 3844. https://doi.org/10.3390/w14233844
Note that from the first issue of 2016, this journal uses article numbers instead of page numbers. See further details here.