
Evaluation on Development Height of Water-Conduted Fractures on Overburden Roof Based on Nonlinear Algorithm

1
School of Economics and Management, Beijing University of Posts and Telecommunications, Beijing 100876, China
2
College of Energy and Mining Engineering, Shandong University of Science and Technology, Qingdao 266590, China
*
Author to whom correspondence should be addressed.
Water 2022, 14(23), 3853; https://doi.org/10.3390/w14233853
Submission received: 29 October 2022
/
Revised: 22 November 2022
/
Accepted: 23 November 2022
/
Published: 26 November 2022
(This article belongs to the Special Issue The Research on Effects of Coal Mining on Groundwater Environment and System)
Abstract
:Based on the support vector machine theory, the particle swarm algorithm is used to optimize parameters, combined with an analytic network process in order to feature dimensionality reduction of the original data, and a nonlinear algorithm model combining statistical analysis and machine learning analysis is established. Taking the relevant data of overlying rock from two zones in Yingpanhao Coal Mine as an example, the main factors such as rock tectonic development, coal seam dip, mining height, mining operation method and stope width are ranked according to the weights of their contribution to the development height of the two zones in order to determine the main control factors, such as stope width and mining height. Using MATLAB as the experimental platform, 16 sets of two-dimensional mine data similar to the geology of the study area were divided into training and test sets for prediction and simulation, comparing the optimal solutions of various optimization-seeking algorithms to obtain quantitative prediction results based on the nonlinear algorithm model. The kriging interpolation process was carried out by ArcGIS to realize qualitative visualization, and effective classification is carried out according to the natural breakpoint method to obtain six development height divisions of the water-conducting fracture zone in the study area. The results show that the prediction model of the development height of two zones in the coal roof based on the non-linear algorithm has better accuracy and generalization ability. Predicted by the test set, the model’s prediction result MAE is less than 10%, and the accuracy is better than the traditional empirical formula method, which makes up for its lack of rough calculation accuracy and solves the problem of not being able to locate the height of roof crack development at specific borehole locations, which has significance in guiding the prediction and prevention of roof water damage and subsidence disasters.
1. Introduction
Western China is rich in coal resources, with stable occurrence, convenient mining and large-scale mechanized operations. However, the proportion of lithological sandstone in the mining area is large, showing obvious weak cementation; the coal seam is buried deep, the mining thickness is large, and mining damage is obvious, which leads to overlying rock movement and the development of the water-conducting fracture zone’s communication with the upper aquifer structure, resulting in frequent roof water inrush disasters [1,2,3].
Scholars at home and abroad have contributed many valuable achievements to research on the development height of the two zones of overlying rock. Liu [4] put forward the upper three zones theory to lay the foundation for subsequent roof research, divided the roof types and deduced a suitable empirical formula to calculate the height of the water-conducting fracture zone. Gao et al. [5] proposed the “four-zones” theory of rock movement on the basis of this earlier theory, and divided the overlying strata into four zones: loose sedimentary zone, sagging zone and fracture zone, from top to bottom. After in-depth research on mine pressure and rock formation control, Professor Qian, an academician of the Chinese Academy of Engineering [6,7], put forward the key stratum theory, which further broadened understanding of the water permeability mechanism. The roof is damaged due to mining and produces bending deformation. Many scholars have proposed and analyzed the force model to explain the formation mechanism of the two zones of overlying rock. Halbaum earlier presented a view of the rock formation above the goaf as a cantilever beam and Eckardt came to the conclusion that the rock movement process was regarded as the gradual bending of each rock formation. Belgian scholar La Paz [8] raised the hypothesis of prefabricated fissures, revealing the mechanism of supporting pressure destroying the rock formations around the stope. In terms of predicting the development height of channeling, Shi’s team [9,10] established a BP neural network water-conduted fractures’ height prediction model, and used soft science methods to predict the degree of damage to the roof. Gao et al. [11] used the Micro-seismic Monitoring System (MMS) to monitor the surrounding areas of the working face in the study area in real time to obtain information on micro-seismic events during the development of the fault. The details of the fault water conduction area in three-dimensional space are determined through computer analysis. The above research results have promoted the development of overlying rock failure research. However, due to the selection of research objects and research dimensions, most of the research theories and empirical formulas are applicable to shallow coal mining in north and southwest China, and are poorly generalized to mines with deep burial and low rock cementation in western and northwestern China [12]. The application of empirical formulas to calculate the height of the two zones of the roof of the whole working face, or to estimate the development of the fracture zone by sampling and testing with physical probing methods, is too far from the actual situation to accurately determine the extent of the fracture of the roof of the whole working face and to make a prediction for the water inrush. In recent years, intelligent modelling methods such as BP neural networks and LSTM [13,14,15] have emerged, which require data with time-series characteristics or a large amount of data training to ensure the accuracy of the prediction. The requirements for data are high.
Therefore, in view of the development height of the two zones of Yingpanhao Coal Mine roof in the western mining area of China, this paper uses the analytic network process to extract features and reduce dimensional analysis of the main controlling factors of overlying rock failure, calculates the roof water-conducting fracture zone height through machine learning simulation, and realizes the threshold classification through ArcGIS interpolation. This study uses a combination of statistical analysis and machine learning simulation to achieve accurate predictive zoning of the degree of crack development in the roof slab to achieve a qualitative hazard prediction classification. It provides a more accurate prediction method to determine the development degree of water-conduted channels, and further effectively predict and prevent roof water inrush.
2. Overview of SVM Algorithm
Support vector machine is a prediction method suitable for dealing with complex system relations. Through nonlinear mapping, it can enhance the dimension of research samples to find common laws and quickly and accurately learn and analyze the causal relationship between multiple factors [16,17,18].
The mathematical essence of a support vector regression machine is to solve a quadratic programming problem, which can be easily realized by transforming it into a dual equation for further solution. In dealing with nonlinear problems with small samples, it has the following advantages:
- Universality (can realize internal nesting of various function sets).
- Robustness (no need to fine tune for practical application problems).
- Effectiveness (prediction accuracy and generalization ability meet the needs of different research fields).
- Simple calculation (the Lagrange multiplier is gradually converted to the dual equation for solution and the calculation and optimization are more simplified).
- Theoretical improvement (relying on the framework of the generalization theory of the Vapnik-Chervonenkis Dimension).
The prediction of the development height of the roof water conducting fracture zone has characteristics of insufficient data and moderate dimensions, which is suitable for the regression prediction of a nonlinear algorithm. Combining the analytical network process to reduce the dimension of factors can improve the accuracy of regression prediction.
2.1. Basic Principles of SVM Algorithm
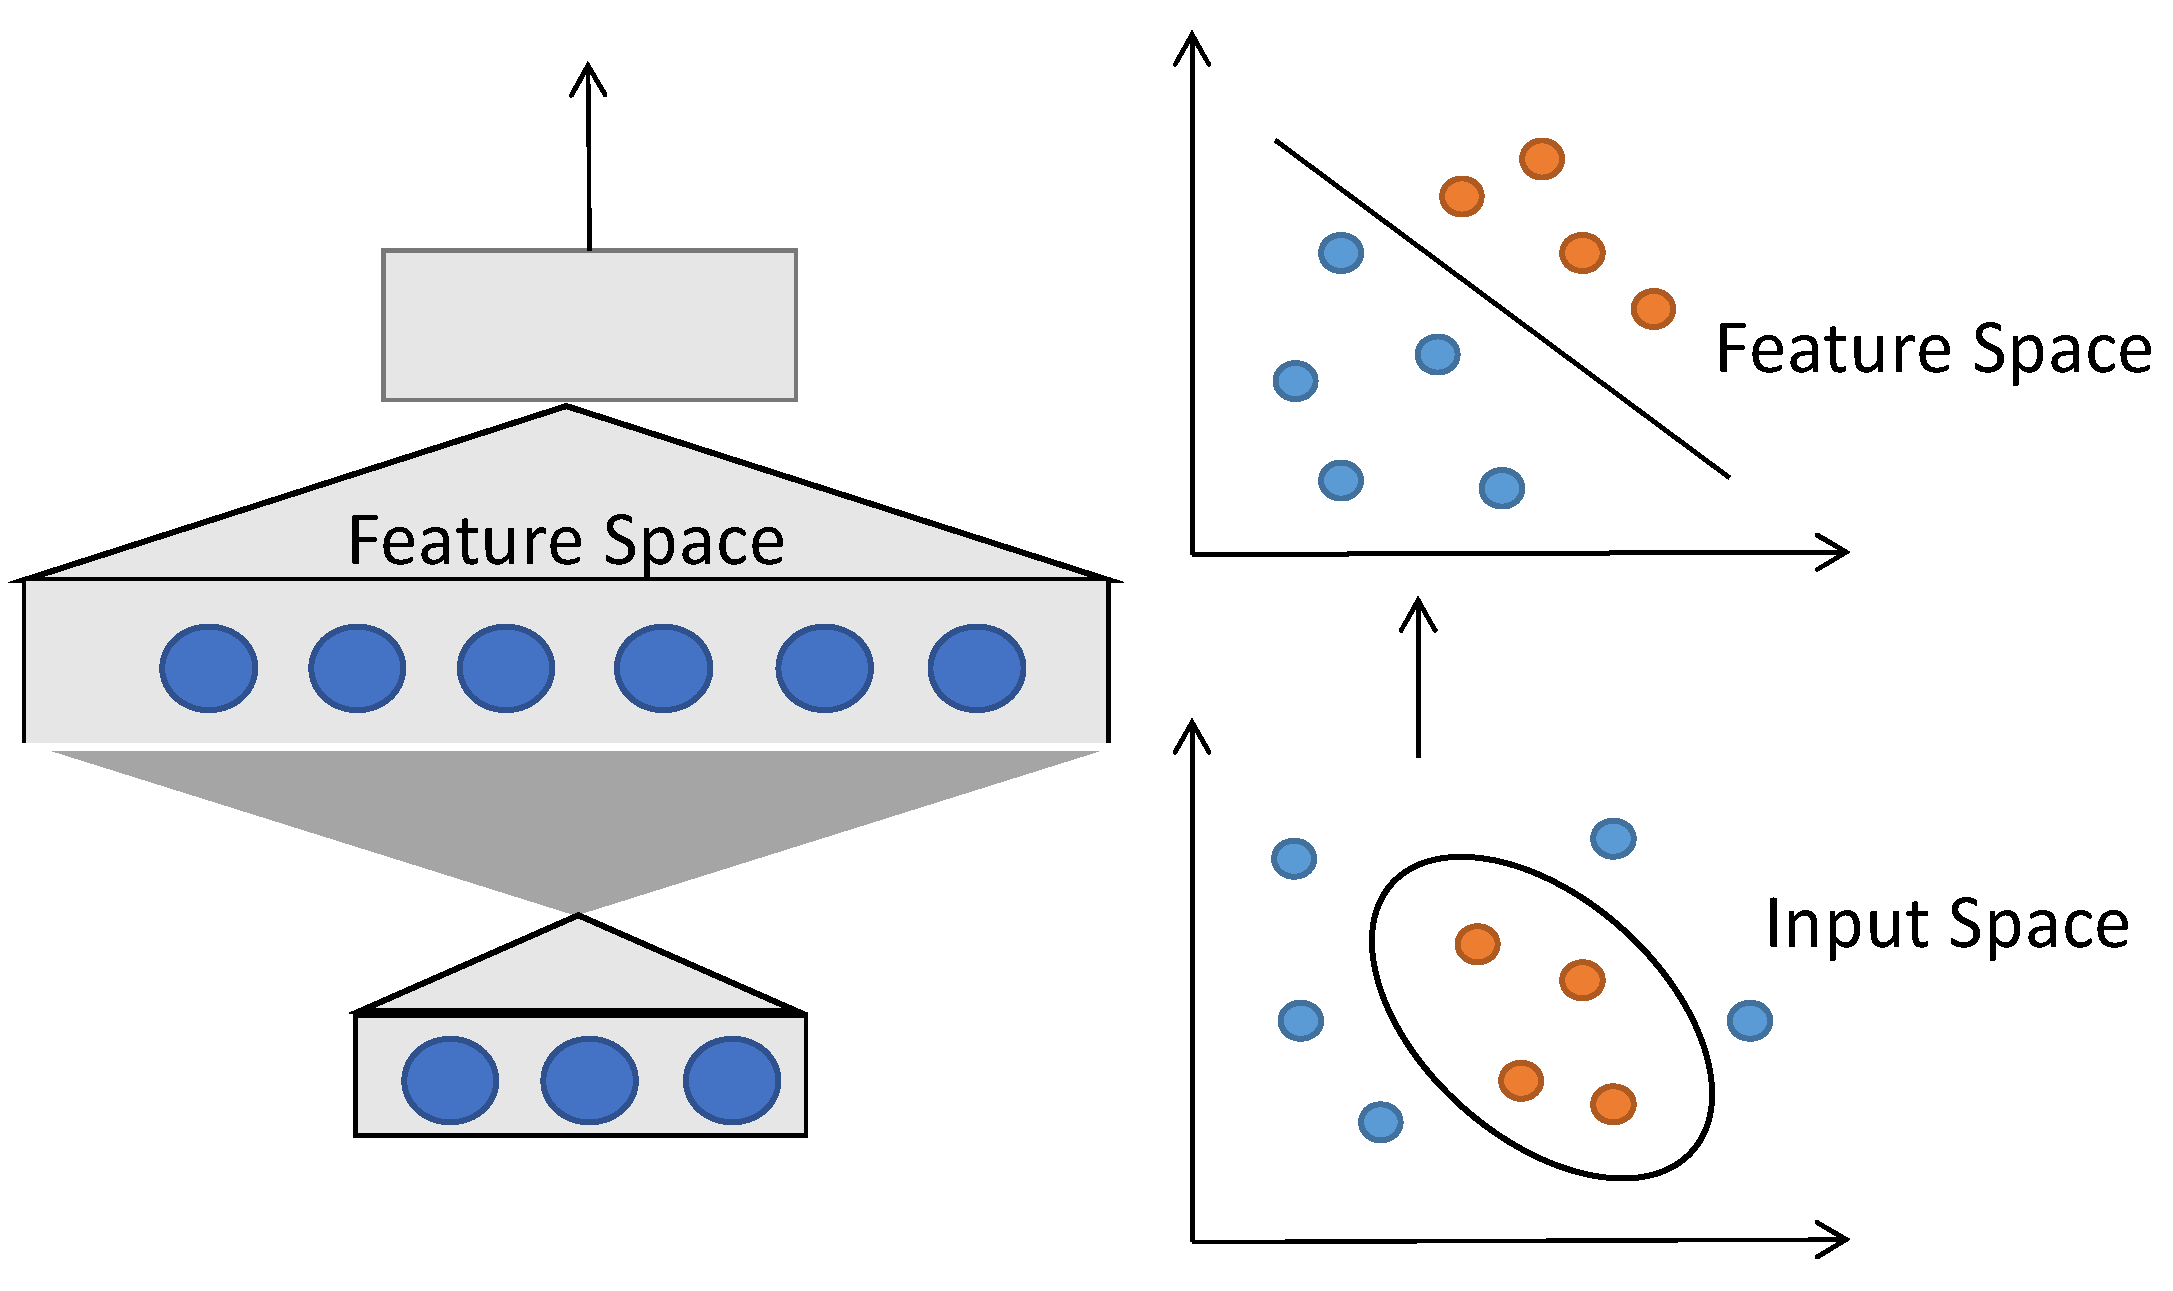
The basic principle of the support vector machine projects linearly indivisible vectors from low dimensions to high dimensions, constructs the optimal classification hyperplane in high-dimensional feature space as a decision surface, seeks the linear relationship between dependent variables and independent variables, and then reduces the dimensions to the original space [19], as shown in Figure 1:
A support vector regression machine is a learning machine that introduces an insensitive loss function and applies it to regression problems. The ultimate goal of the regression problem is to take the two points with the farthest Euclidean distance as the maximum spacing [20]. When the vertical displacement deviation between the other points and the maximum spacing is the smallest, the optimal hyperplane is obtained. The mathematical definition of regression is as follows:
The Training Sets:
where xi, yi are the corresponding target values and l is the number of samples. Assume that the training set is an independent identically distributed sample point selected according to a certain probability distribution M(x, y) on , and given the loss function C(x, y, f), find f(x, y) to minimize the expected risk value:
Here, M(x, y) is unknown and only the training set is known.
For a nonlinear support vector regression machine, sample x can be mapped to high-dimensional feature space H through nonlinear mapping ϕ(x) and the optimal regression function can be solved in H.
By introducing the transformation from the input space Rn to a high-order Hilbert space H, the original training set corresponding to the input space Rn is transformed into a new training set corresponding to the Hilbert space H:
In this way, the linear regression in the high order space corresponds to the nonlinear regression in the low dimension space. Therefore, the kernel function is used to replace the vector inner product in the high-dimensional space in the optimal regression function to achieve the linear fitting after linear transformation, but relatively low computational difficulty is maintained. At this point, the optimization problem can be transformed into:
The regression function and its normal vector are correspondingly transformed into:
The optimal problem is transformed into the minimum problem as follows:
RBF kernel function is selected for the nonlinear regression machine:
Finding the optimal solution to a regression problem ultimately translates into finding the optimal penalty factor c and the kernel function parameter g. The higher the c, the more intolerant the error and the more likely it is to be overfitting. The smaller the c, the more likely it is to be underfitting. The larger or smaller the c, the worse the generalization ability. g implicitly determines the distribution of the data after mapping to the new feature space, affecting the speed of training and prediction.
2.2. Solving the Optimal Parameters of the SVM Model
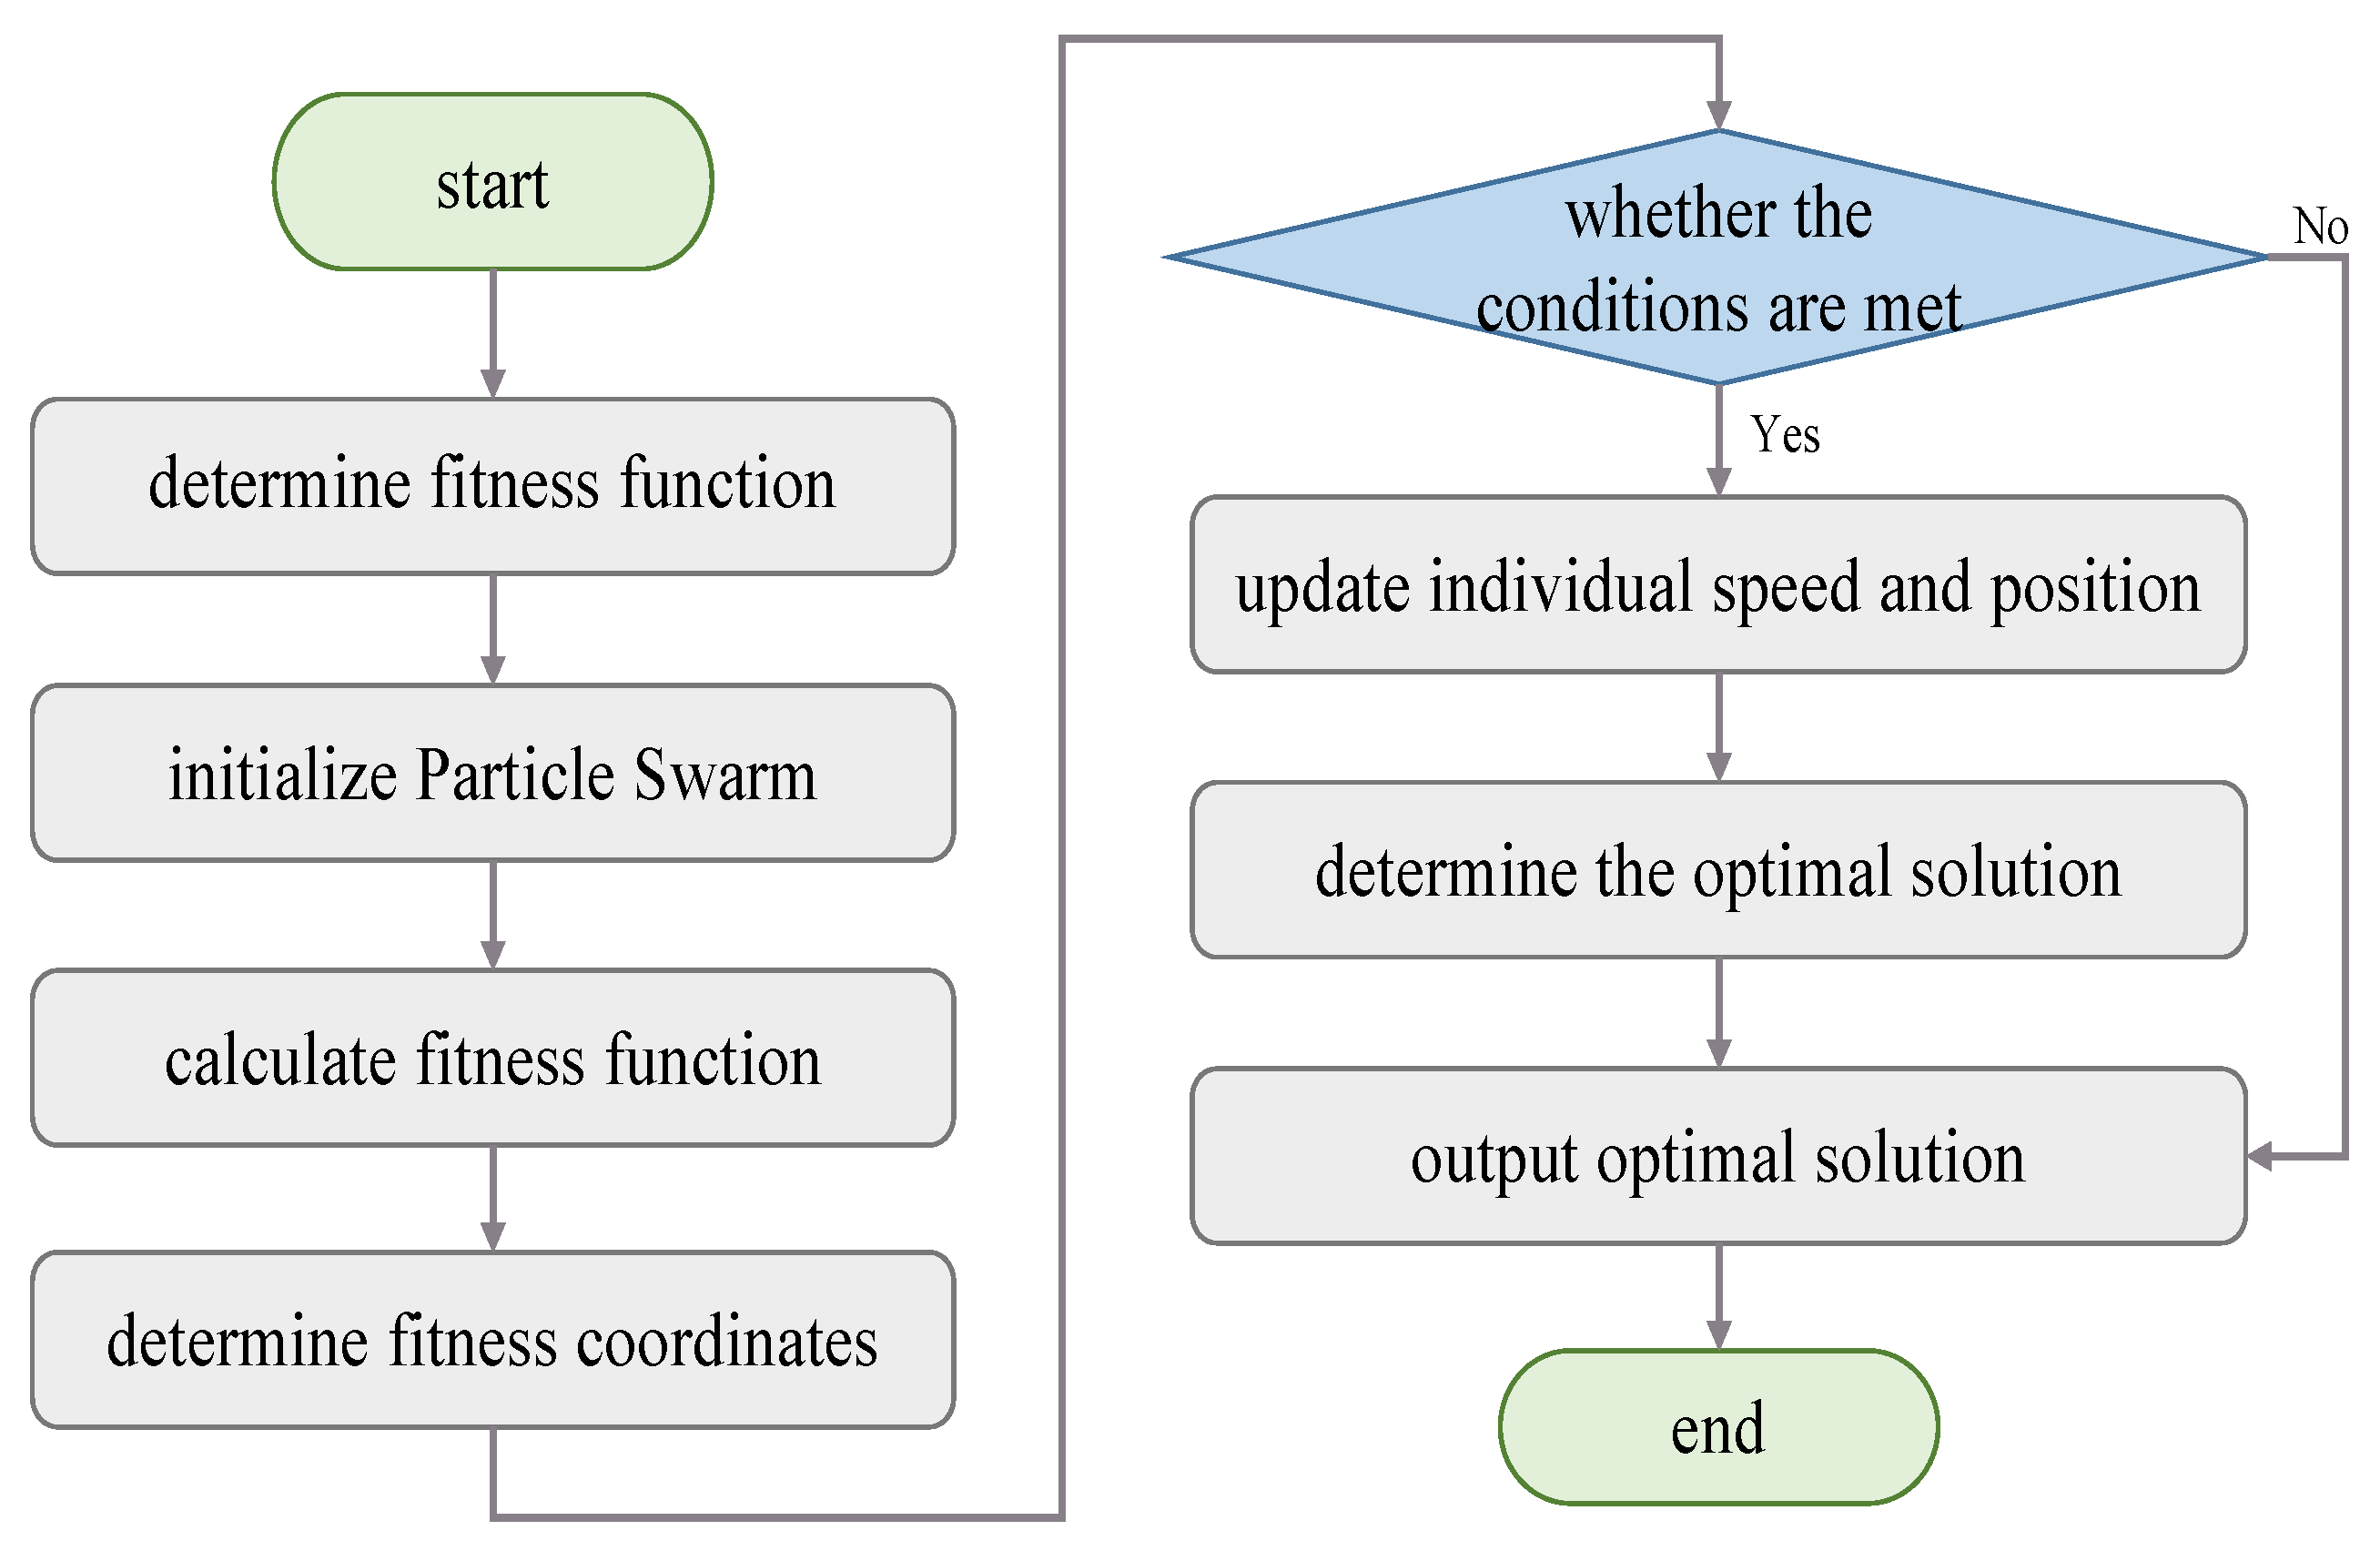
Particle swarm optimization imitates the biological behavior of bird predation and finds the optimal solution through the mutual coordinated adjustment of individuals [21]. Each particle automatically records the speed and displacement during the movement and shares it with other particles in the space. Other particles accept the global optimal solution of different individuals and adjust their own route. The optimal individual value filtered through continuous iteration is the final value global optimal solution [22,23]. The update formula is:
in the formula:
- —inertia weight, i = 1,2,3…, N—the size of the particle population
- k—number of iterations, pi—individual extreme value,
- gi—global extrema c1,c2—learning factor
- vik—The magnitude and direction in the last iteration
- c1r1(pi − xik)—The distance vector between the current and optimal position
- c2r2(gi − xik)—The distance vector between the current and the best neighbor
The optimization mechanism of particle swarm optimization can be completed through the process shown in Figure 2.
3. Selection of Indicator System
3.1. Research Background
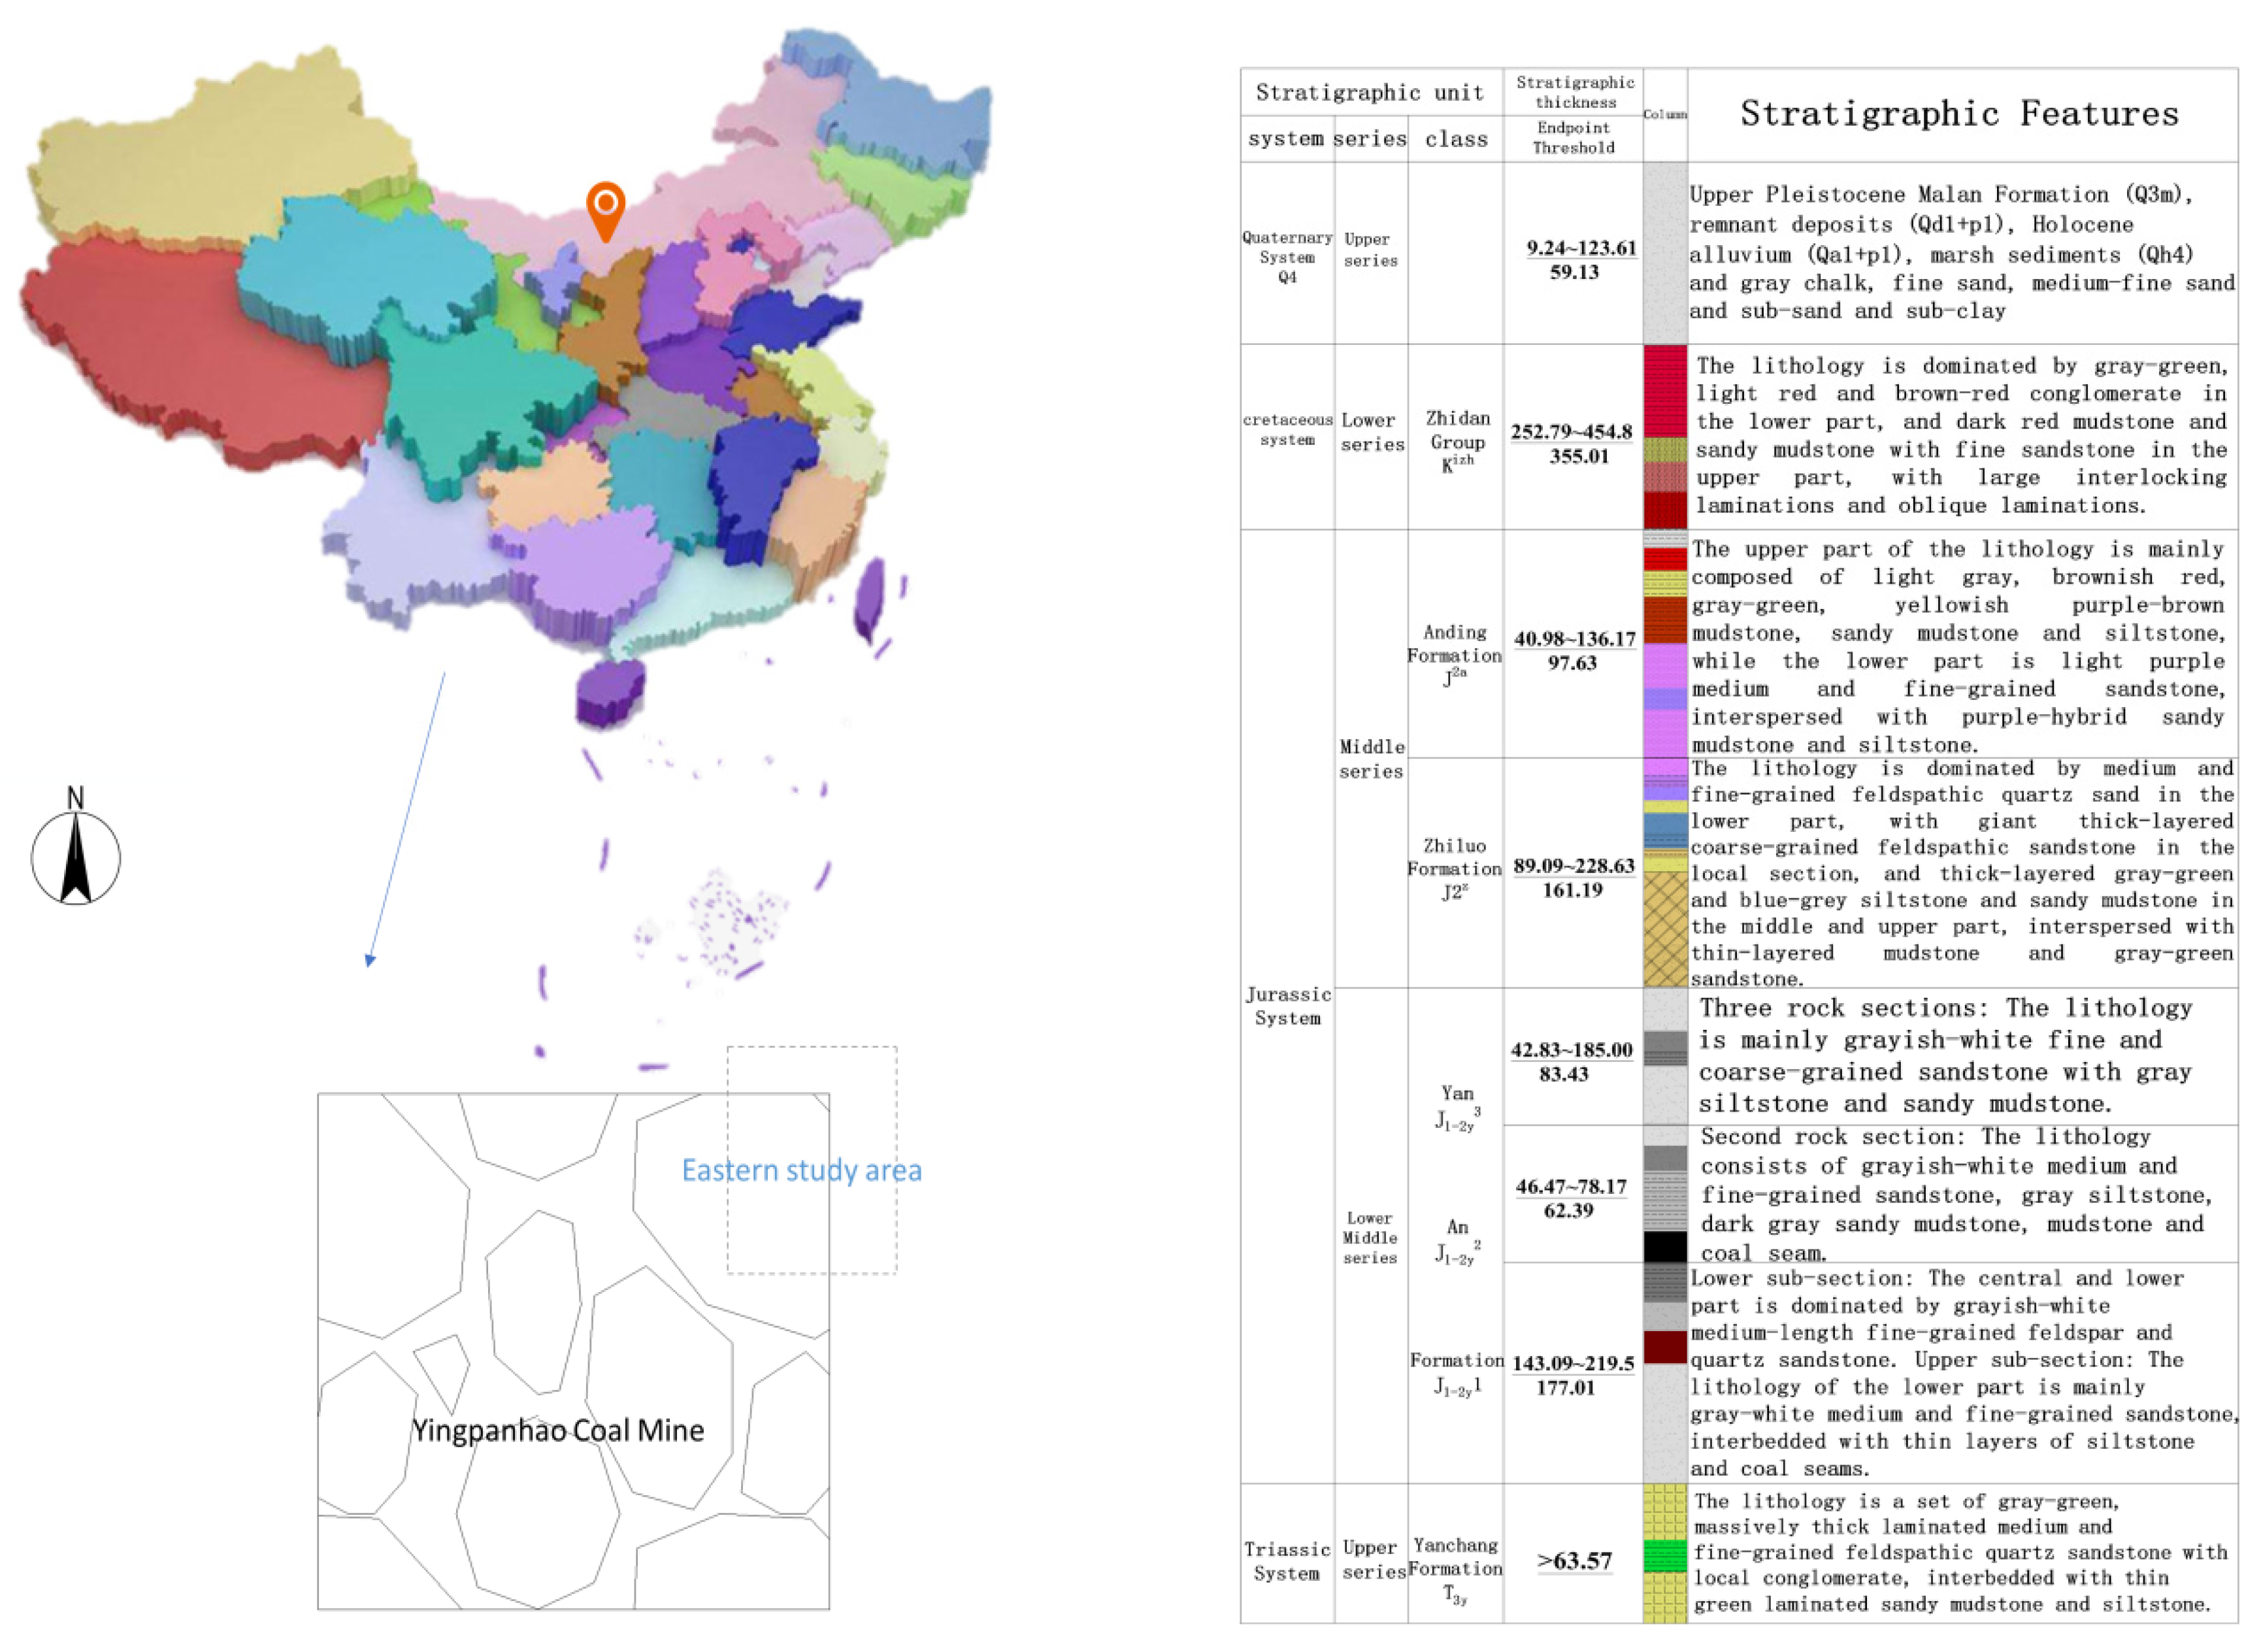
The two zones of the roof of the Yingpanhao Coal Mine are more developed and differ significantly from the results calculated by empirical formulae. Few studies have been conducted to accurately predict the height of roof development and delineate zoning in the mining areas of northwest China. In this paper, the 2022 working face of Yingpanhao Coal Mine is taken as an example to study the damage of the overlying rock structure and the development of the water-conducting fracture zone on the roof. Yingpanhao Coal Mine belongs to Dongsheng Coalfield, located in the east-central part of Mawusu, Wuzheng Banner, Ordos City, Inner Mongolia Autonomous Region, China. Its administrative division is Galutu Town, Wushen Banner. Most of the surface in this area is covered by modern aeolian sand and lake sand, and there are quaternary loess exposed in sporadic areas. According to the drilling exposure and geological mapping data, the strata in the area from old to new are: Upper Triassic Yanchang Formation(T3y),Jurassic Middle and Lower Yan’an Formation (J1-2y), Middle Zhiluo Formation (J2z), Anding Formation (J2a),Lower Cretaceous Zhidan Group (K1zh), Neogene Pliocene (N2), Quaternary Upper Pleistocene Malan Formation (Q3m), residual slope product (Q3dl + pl), Holocene alluvial deposits (Q4al + pl), swamp sediments (Q4h) and aeolian sands (Q4eol). The location and topographic histogram are shown in Figure 3.
The Yingpanhao mine field is located in the northwest inland, the terrain is high in the northwest and low in the east, with relatively flat topography, dominated by sand dunes and beaches. The study area is located in the Inner Mongolia Autonomous Region, which has a mid-temperate semi-arid continental climate, with hot and cold seasons and precipitation concentrated in summer and autumn, accounting for 70% of the total annual precipitation. The Yingpanhao mine field has a simple structure, and the stratum is a monoclinic structure in general, with a few gentle undulations and no faults, folds or magma intrusion.
3.2. Factor Primaries
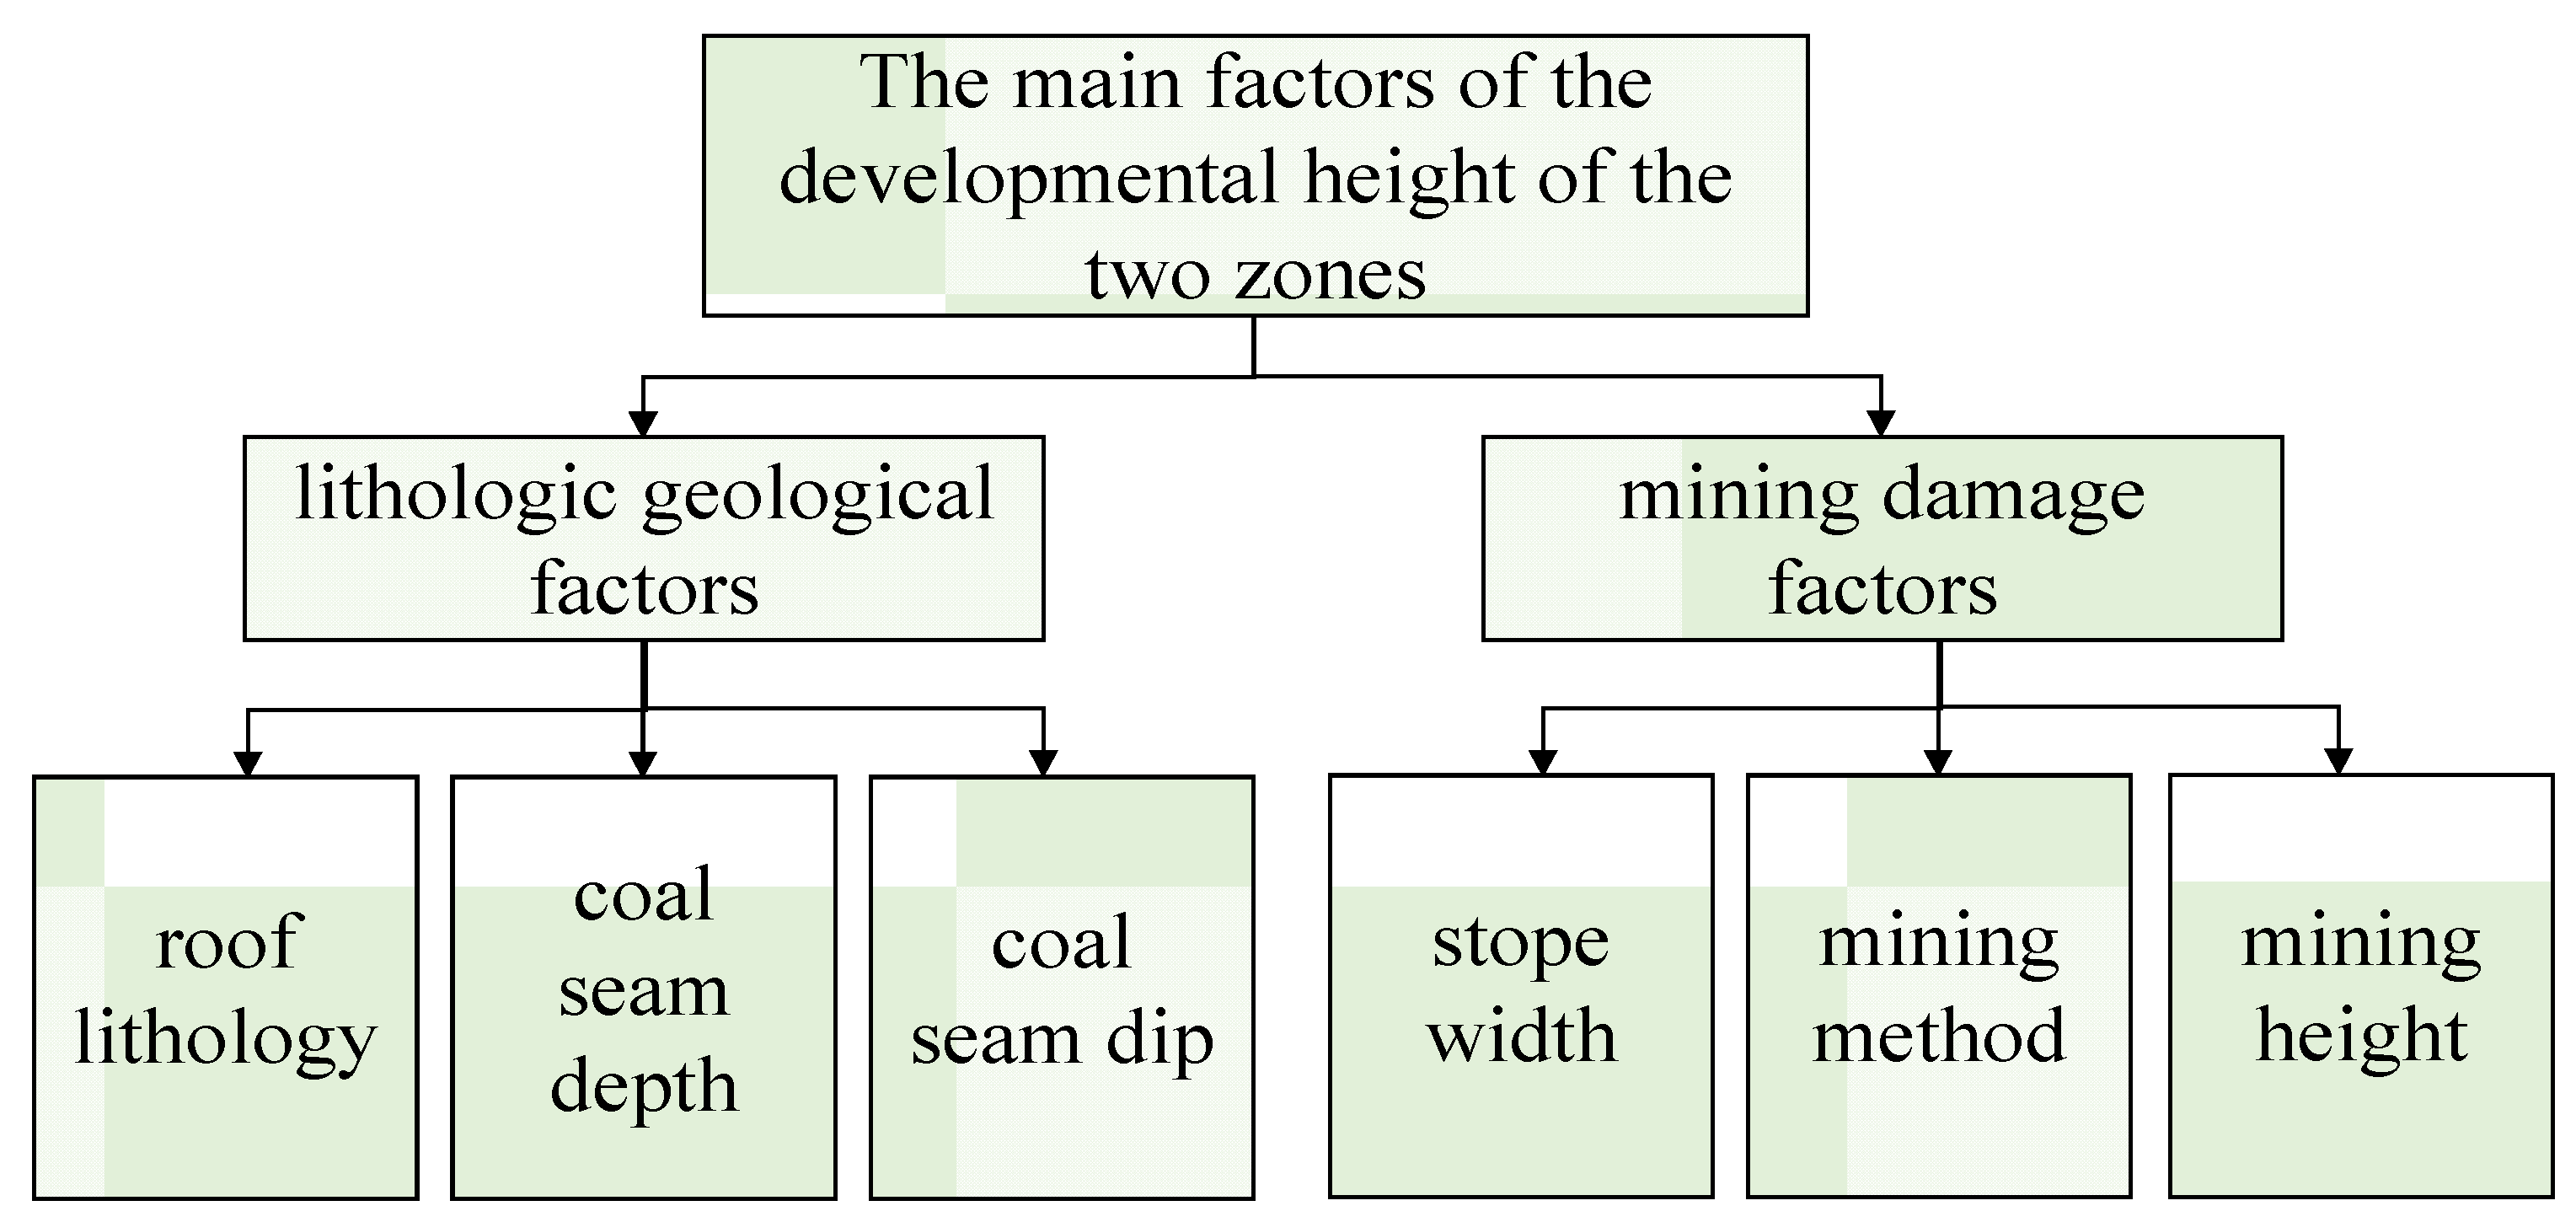
The development height of caving zone and fissure zone in the “three zones” of mining overburden is affected by many factors, mainly involving geological factors and mining factors. The differential interaction between the factors makes the development heights of the two zones fluctuate greatly in different regions. After reviewing much of the literature and geological reports, the factors affecting the height of overburden damage in coalfield mining such as roof lithology, coal seam depth, mining height, mining operation method, stope width, etc., are shown in Figure 4.
3.3. Feature Dimension Reduction
In this paper, the analytic network process is used to reduce the feature dimension of the six-dimensional main control factor. Among the semi-quantitative and semi-quantitative pan-decision analysis methods, AHP can simplify semi-structured or unstructured problems and make the decision-making level concise and efficient. However, in practical applications, there are interactions and feedbacks, internal dependencies and external dependencies between and within element sets. As the optimization and extension of traditional AHP, ANP solves the problem of distortion of results caused by situations where factors at the same level in a decision problem have dependencies and feedbacks, while retaining the original structure [24,25,26,27].
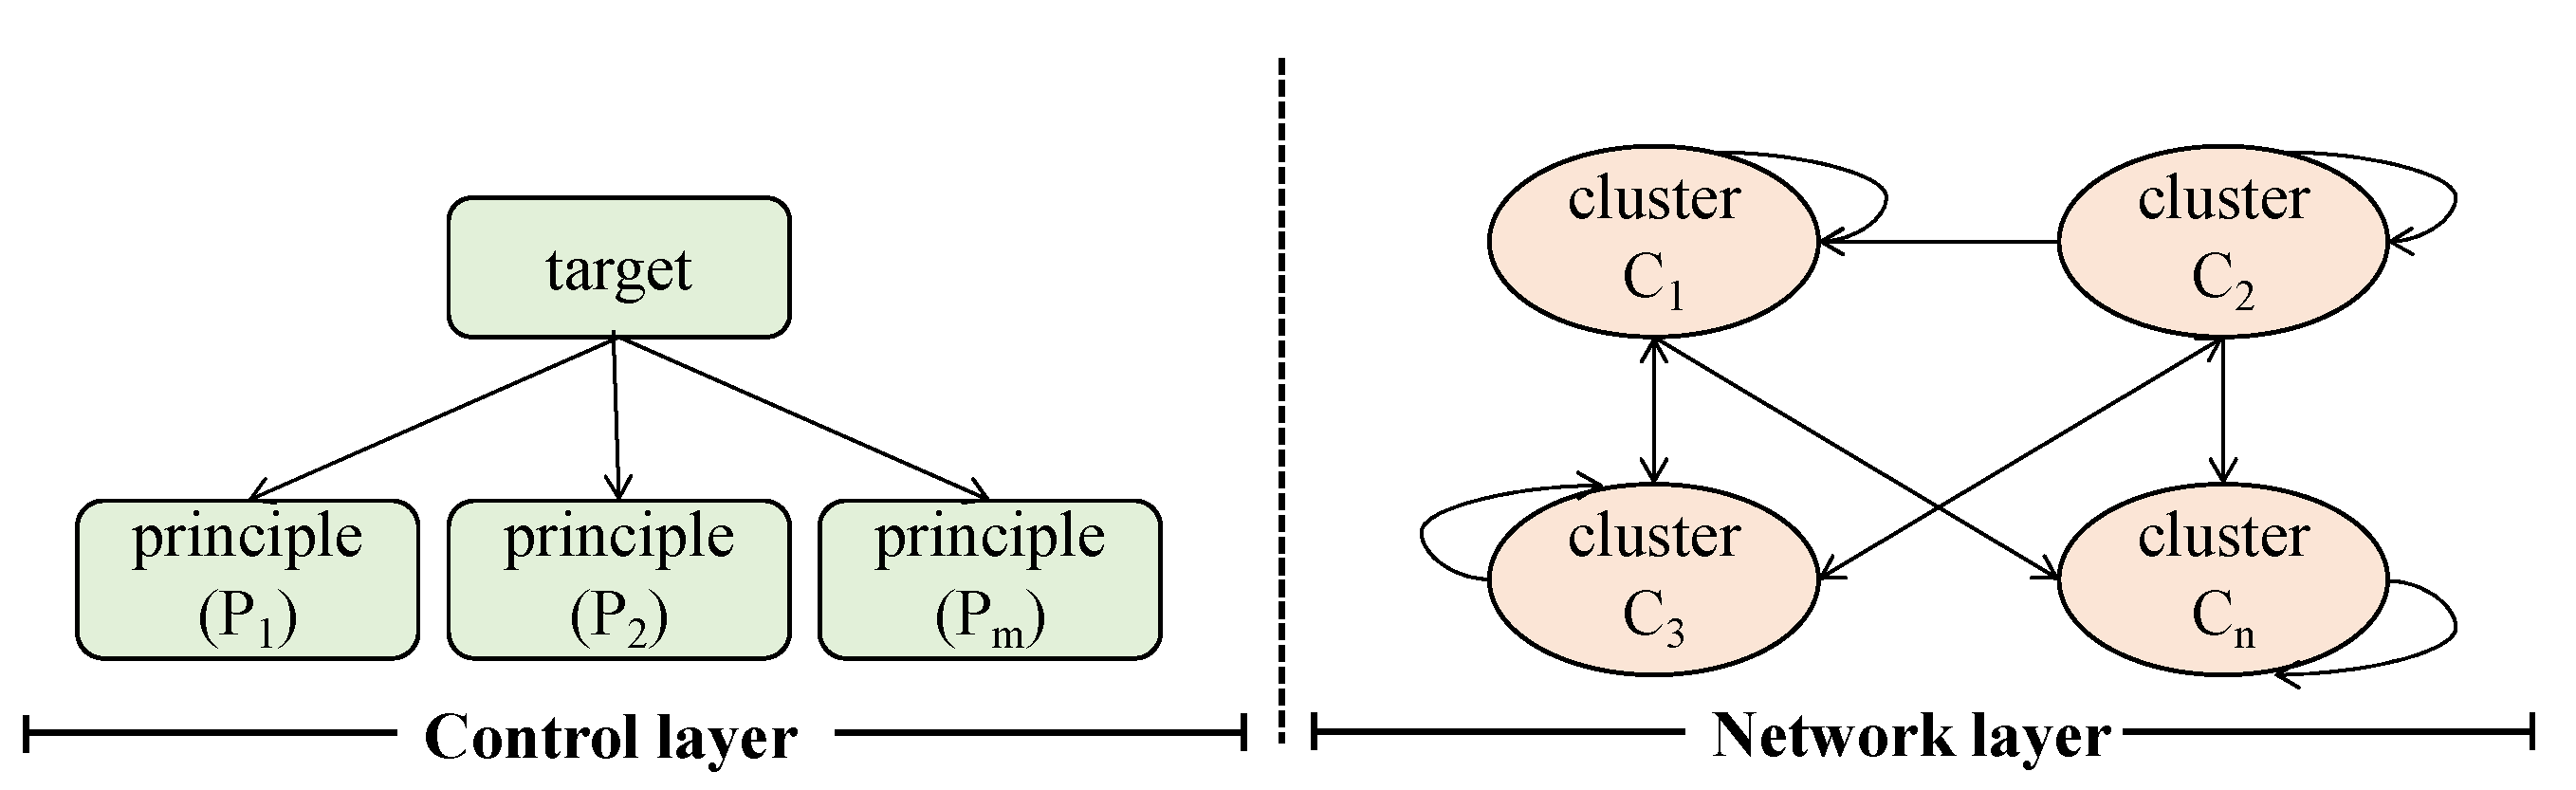
The ANP model consists of a control layer and network layer, as shown in Figure 5.
The control layer includes problem objectives and decision criteria. Each element is interdependent and inter-governed, and each element and layer are not internally independent. Each criterion in the hierarchy is not a simple internal independent element, but an interdependent feedback network structure. The advantage of the ANP model is in comparing the degree of interaction between elements in the same layer and obtaining a direct advantage by comparing the relationship between the elements and the criterion. It is also possible to determine the degree of interaction between these two elements relative to the third element’s indirect advantage under the same criterion.
The weight calculation steps are as follows:
- Construction of judgment matrix. Taking the elements of the control layer as the criterion and the elements of the network layer as the sub-criteria, and comparing the importance of the elements in the element group on Bij, the construction judgment matrix is obtained:
- 2.
- ANP weighted super-matrix and limit matrix. Combine the sorted vectors of the degree of interaction of network layer elements to obtain the super-matrix under the control element:
Taking the control layer B as the criterion and any element group Bi as the sub-criteria, compare the importance of each element group to obtain the matrix P. To normalize the matrix W, the eigenmatrix is obtained as follows:
The weighted super-matrix is obtained by the formula and the limit matrix is obtained by the formula .
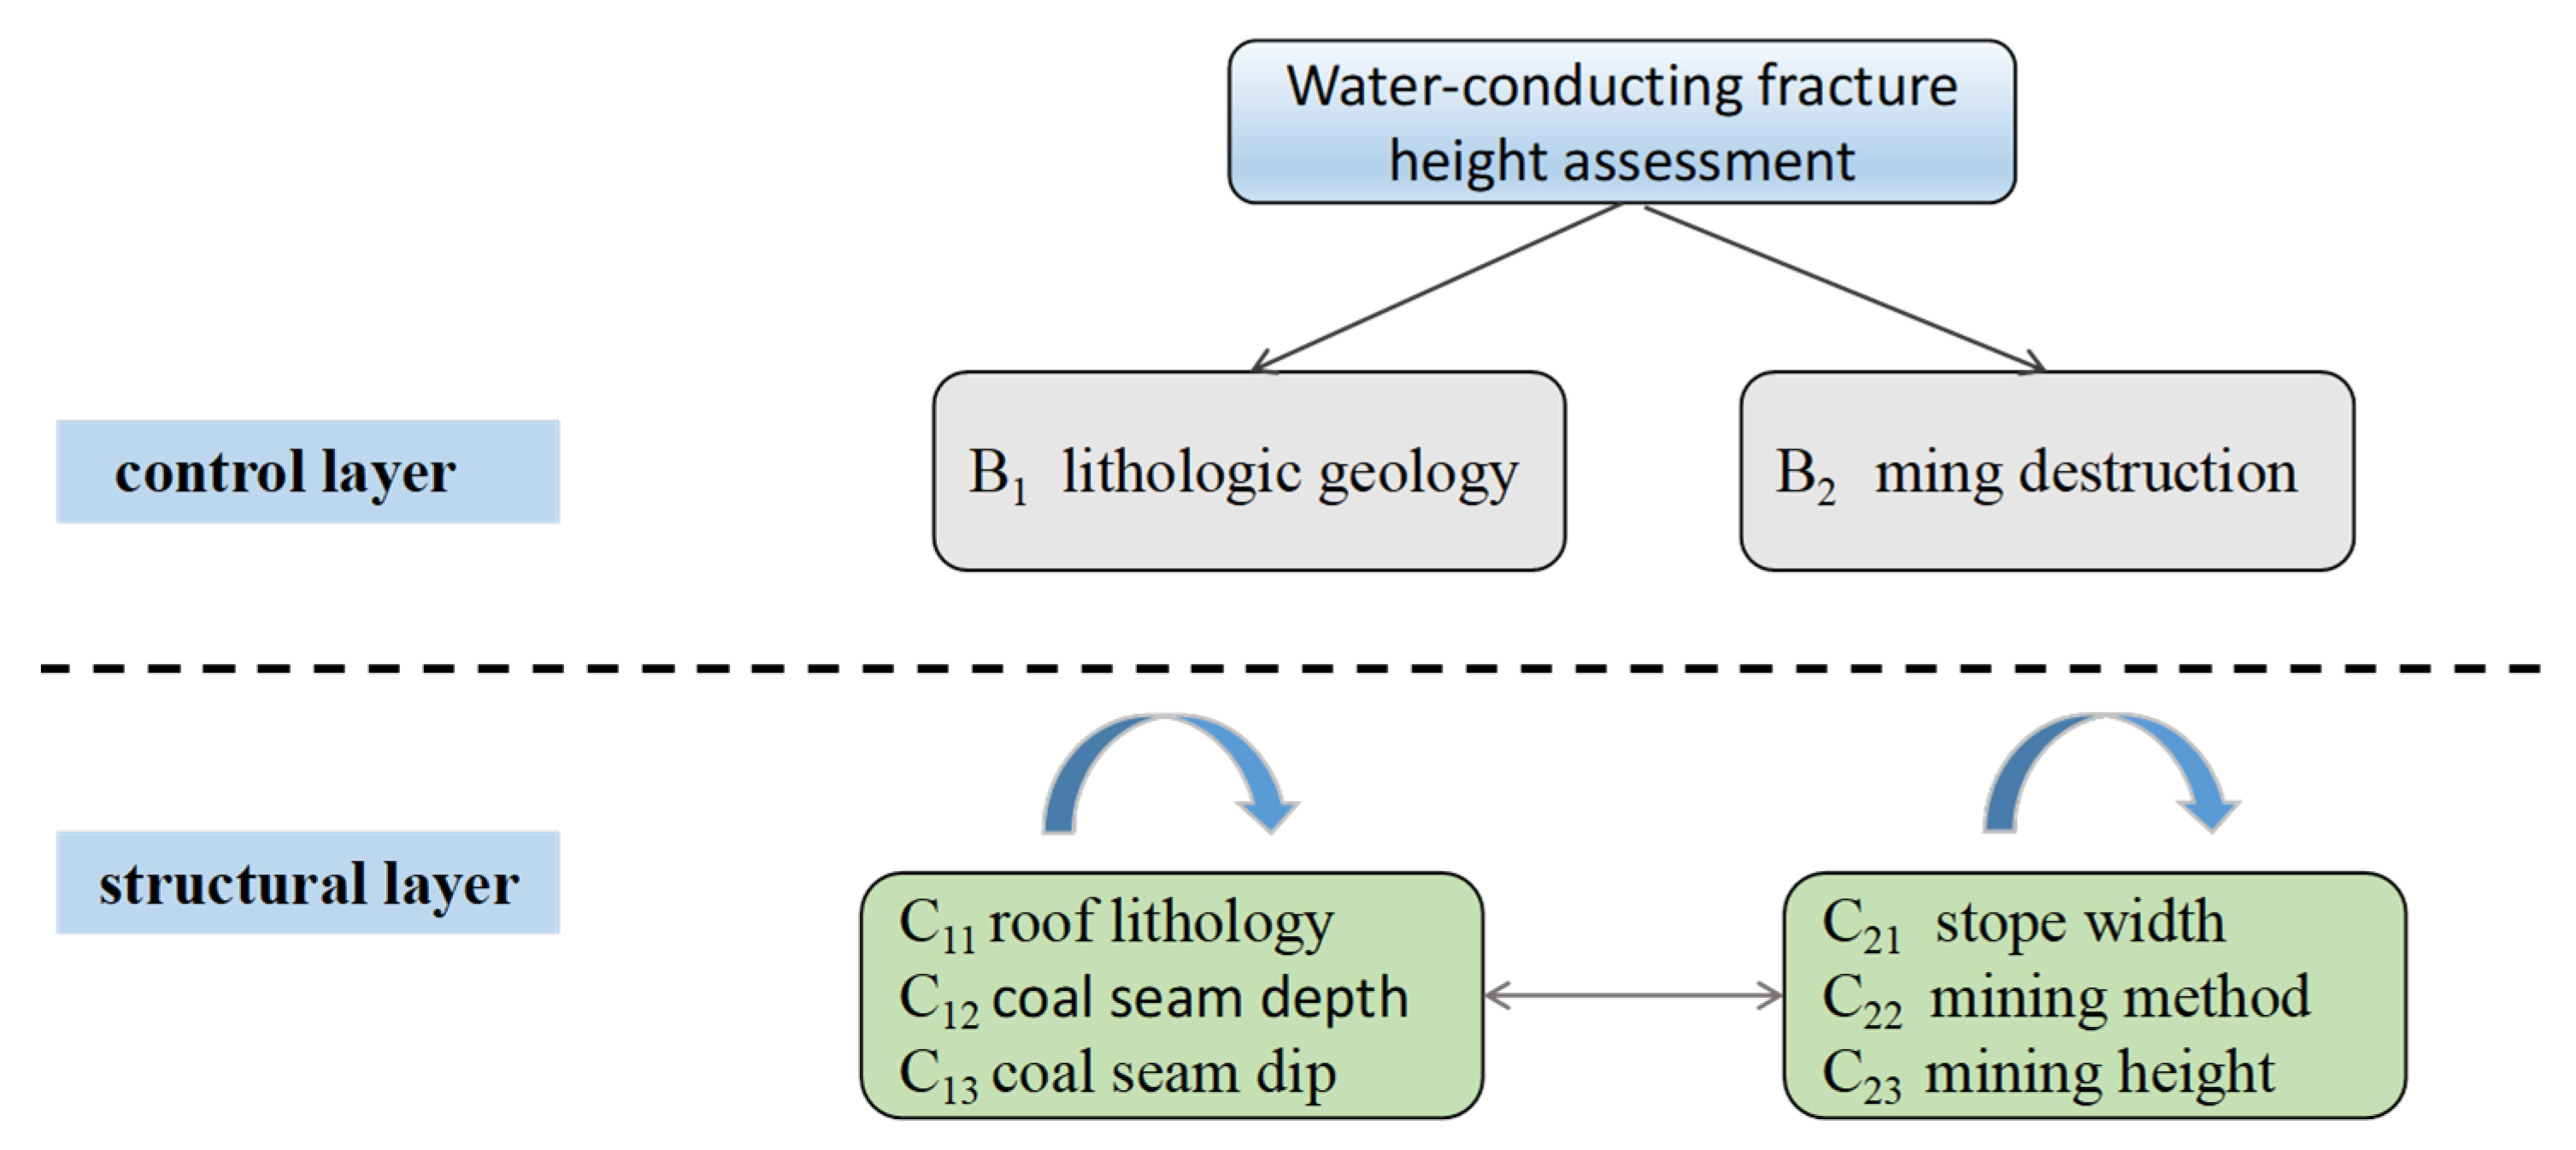
Combined with the lithological and geological background of Yingpanhao Coal Mine, the main factors for the development of roof water-conducting fracture zones are classified according to their attributes and a three-cluster ANP network model is established as shown in Figure 6.
The calculation results of the second-level unweighted super-matrix are shown in Table 1.
Multiply the weight matrix A and the second-level unweighted super-matrix W to get the weighted super-matrix as shown in Table 2.
Take the limit of n approaching infinity for the weighted super-matrix, make it converge to a fixed value and normalize it, and get the normalized limit super-matrix, ass shown in Table 3.
The result of the normalization of the convergence value of the limit super-matrix is the subjective weight result of the water-rich main control factor obtained by FANP, as shown in Table 4.
The research background of this paper is the Yingpanhao Coal Mine, which belongs to the hydrogeological unit of the Ordos Plateau. Different from the eastern mining area, the overlying rock is a weakly cemented rock mass, with large particle gaps, uneven distribution of cements and a looser structure. Under the dual action of geological movement and mining propulsion failure, it often presents the forms of conjugate failure, shear failure and splitting failure. In order to ensure the accuracy of the subsequent model simulation, we cleaned the existing mine drilling data, and retained the western mine data with similar lithology and region to the research mining area, the same mining method, and mining height greater than 5 m. Combining the data analysis and the weight calculation results in Table 4, the main control factors are set as mining height and stope width.
4. Establishment and Application of Prediction Model
4.1. Model Building
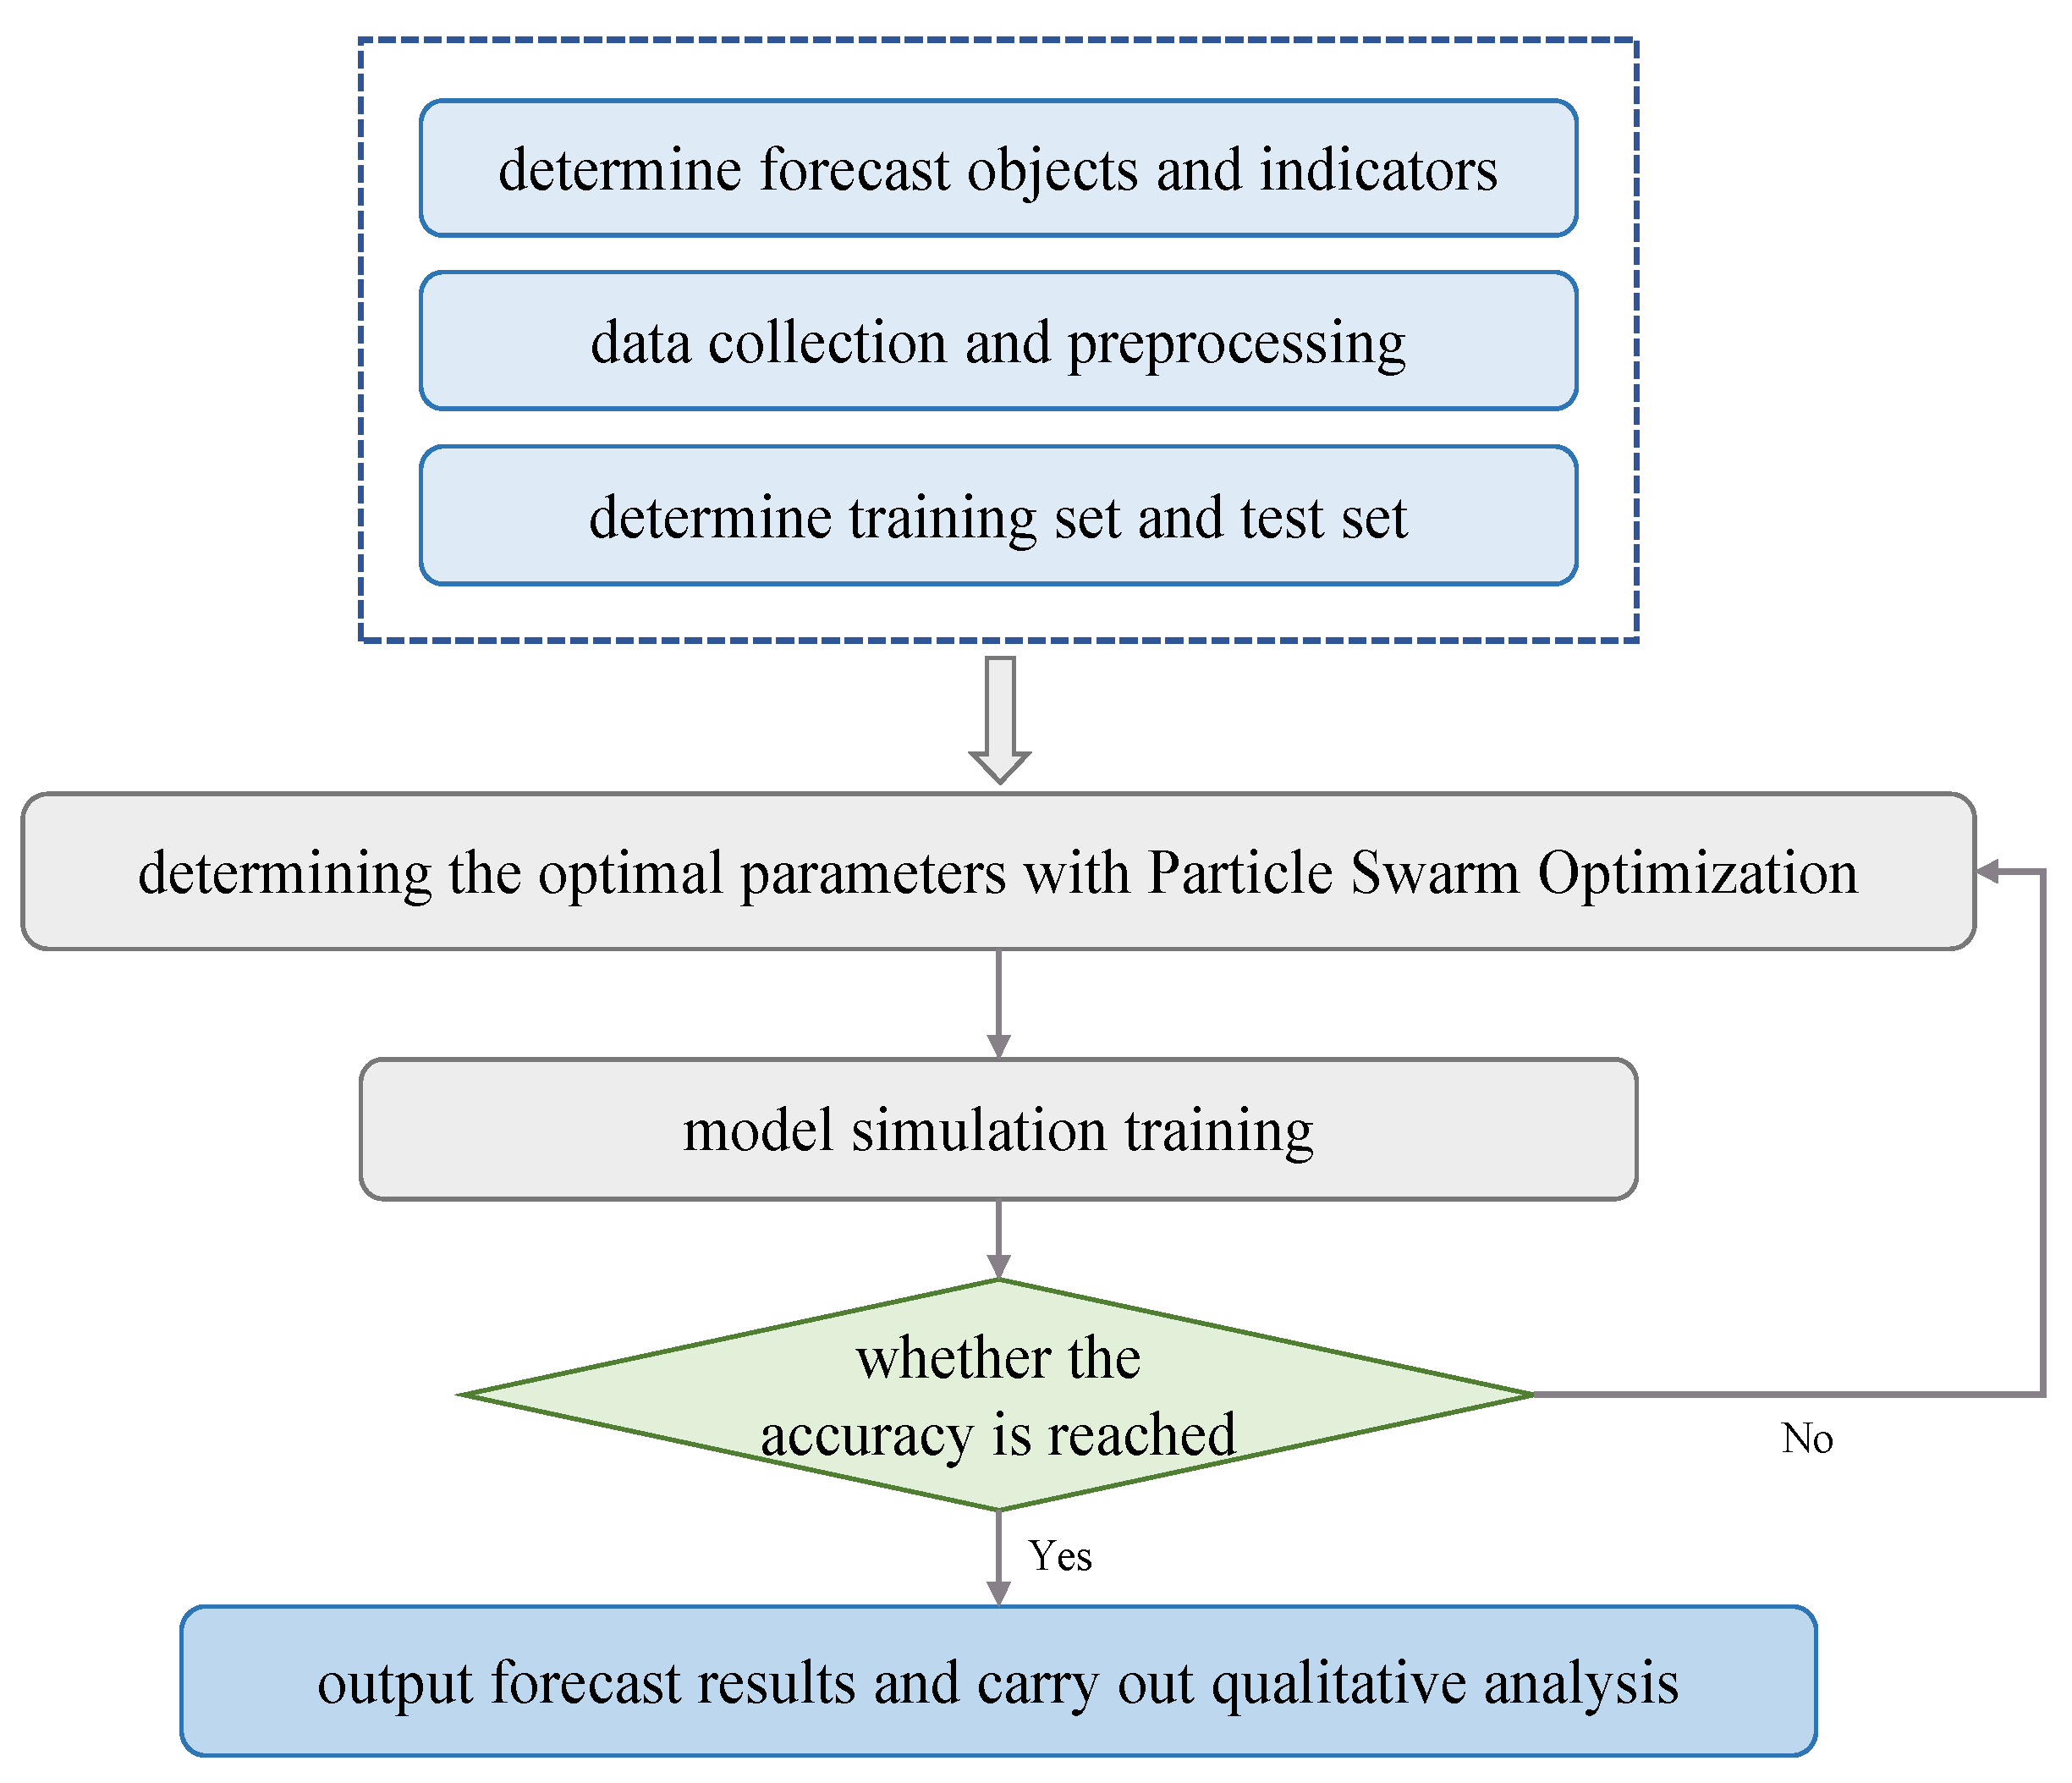
In this paper, we choose MATLAB software (R2012b) experimental environment and use Libsvm toolbox for extended compilation to build the PSO-SVM model as shown in Figure 7.
The specific implementation steps of the PSO-SVM model are as follows:
- Collect sample data, complete data cleaning, classification and noise reduction. Normalize or normalize the data and divide the training and test sets.
- The particle swarm optimization algorithm is used to optimize the population parameters, and the smaller the fitness value, the closer to the optimal solution.
- Judging the end condition of the parameter optimization loop, if it meets the set value of the number of iterations or fitness, it will end; otherwise, continue to iterative optimization.
- The optimized optimal parameters c and g are respectively substituted into the SVM regression model to train the sample data.
- Test the PSO-SVM regression prediction performance; if it meets the accuracy requirements, the loop ends, otherwise continue to optimize until the accuracy set value is met.
4.2. Data Processing
Collect and count sample data such as stope width, mining height, and fracture zone development height in western mines with mining heights greater than 5 m, as shown in Table 5.
A data set of factors affecting the development height of channel in the western mining area with two dimensions based on the stope width and mining height is established. Due to the different dimensions of the factors and the existence of noise data, singular sample values will be affected, which will affect the convergence and the kernel function. To avoid the above problems, it is necessary to use the extreme value normalization method to standardize the original data for the subsequent model establishment. Then, 12 sets of standardized data are randomly selected as the training sets according to the principle of information equivalence, and the remaining four sets are used as the test sets for training and to test the performance of the PSO-SVM model.
The standardized formula is as follows:
In the formula:
- min(Xi)—minimum, max(Xi)—maximum,
- Ni—normalized data, Xi—the quantized value before normalization.
4.3. Parameter Optimization and Model Training
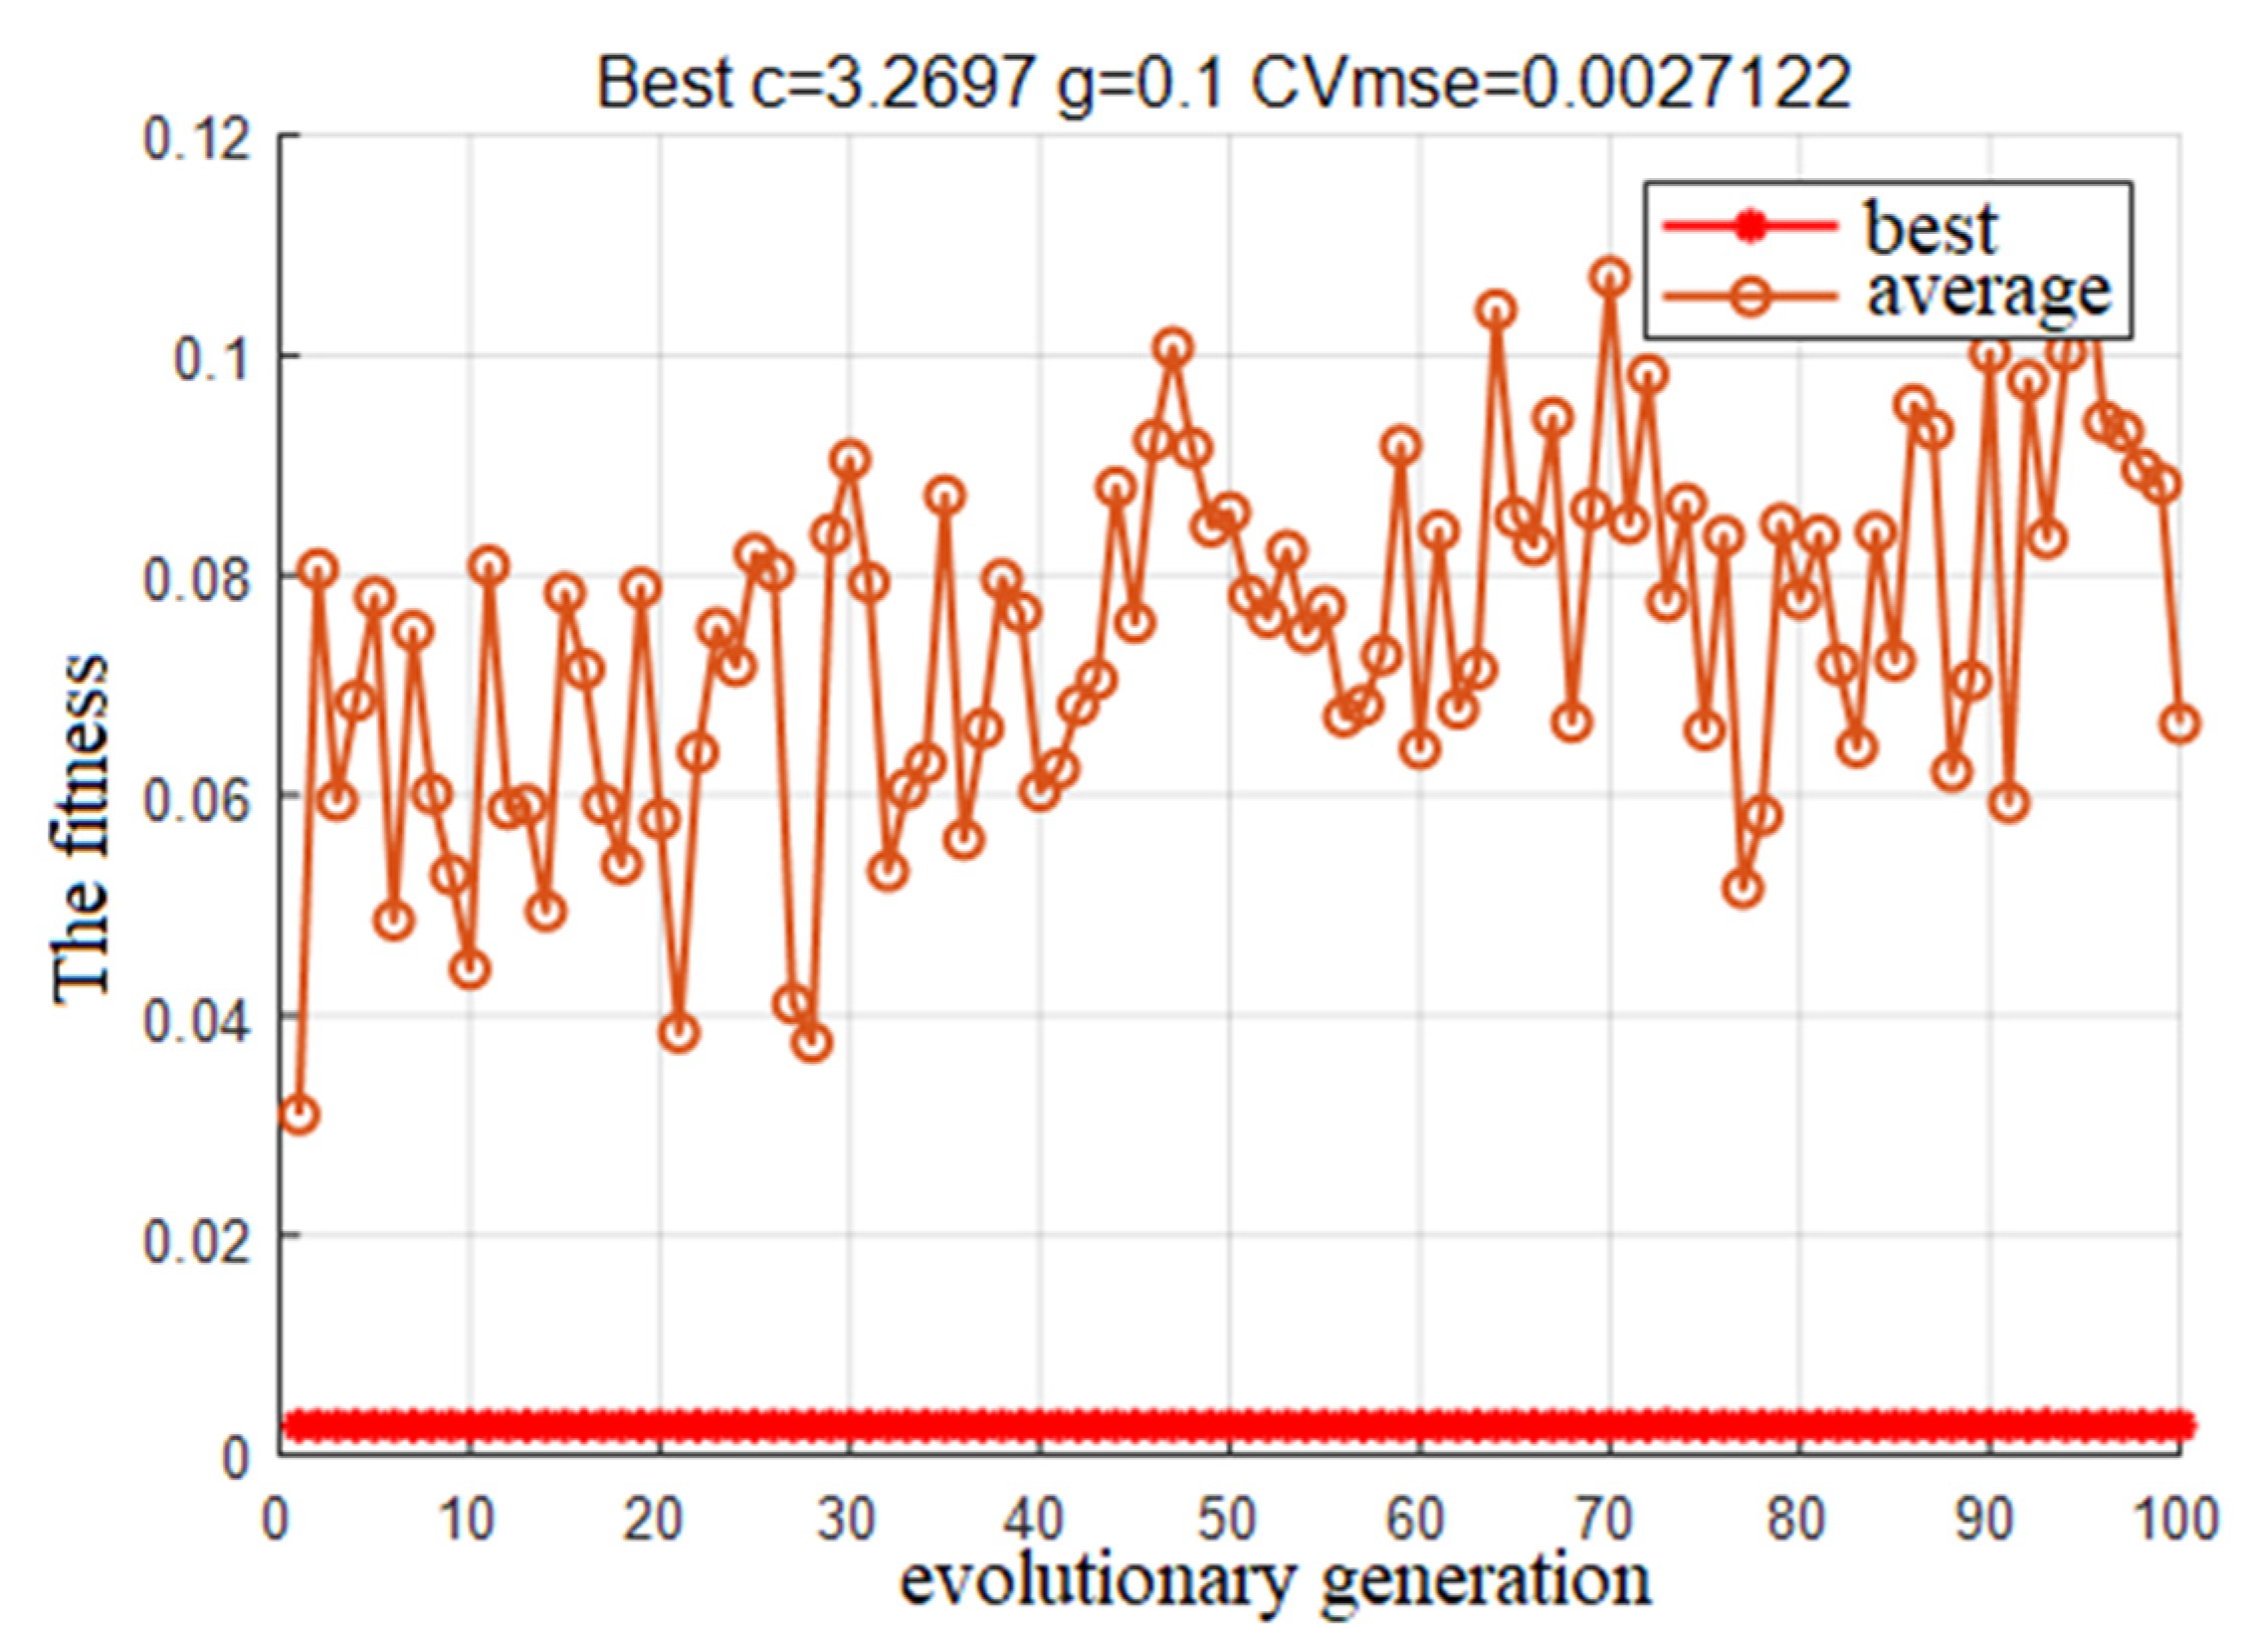
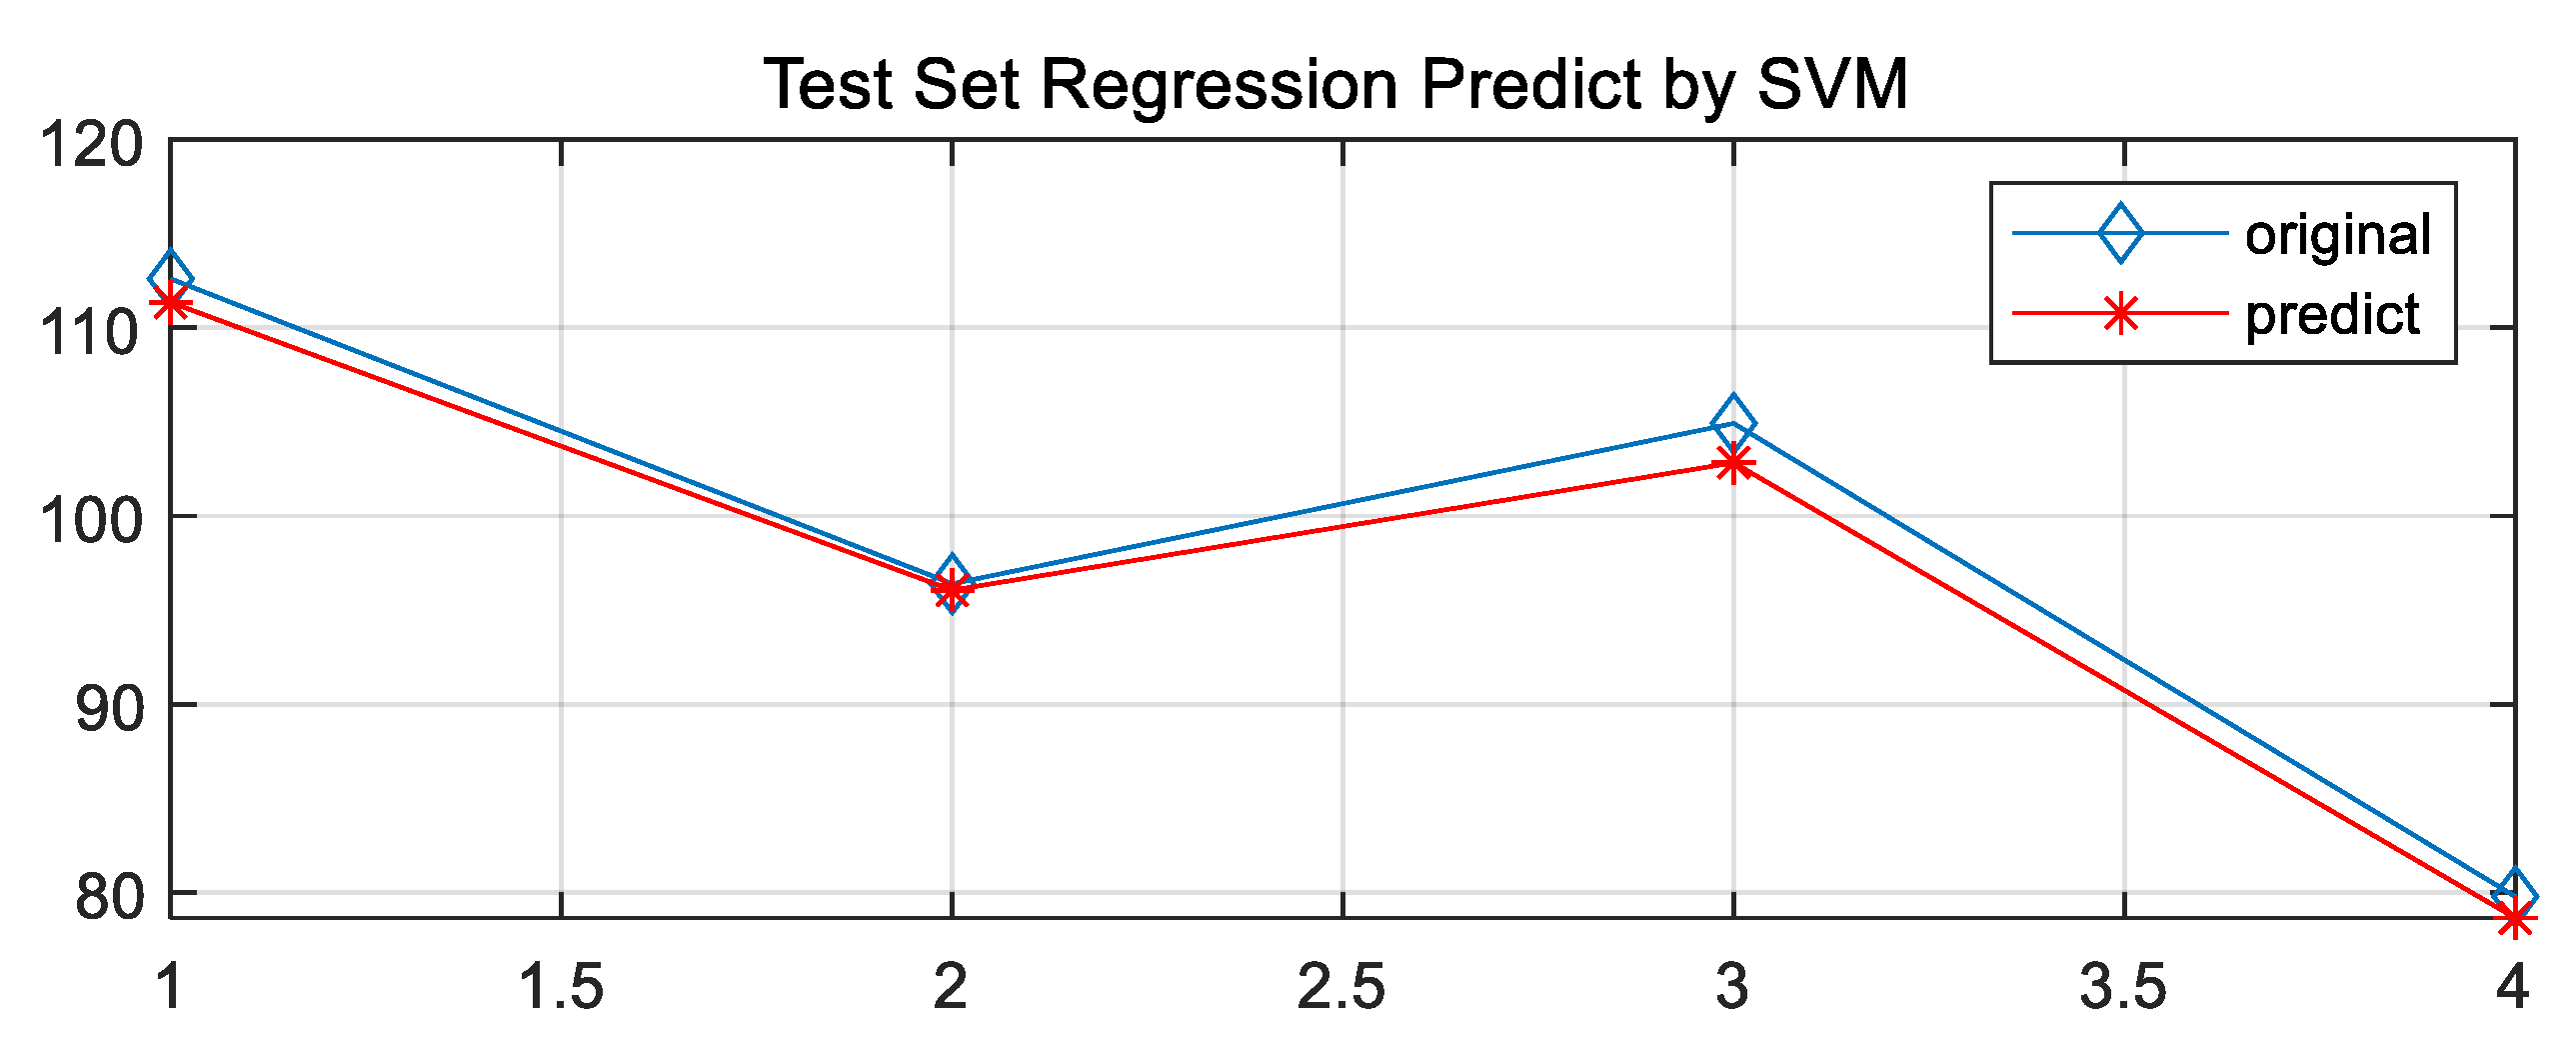
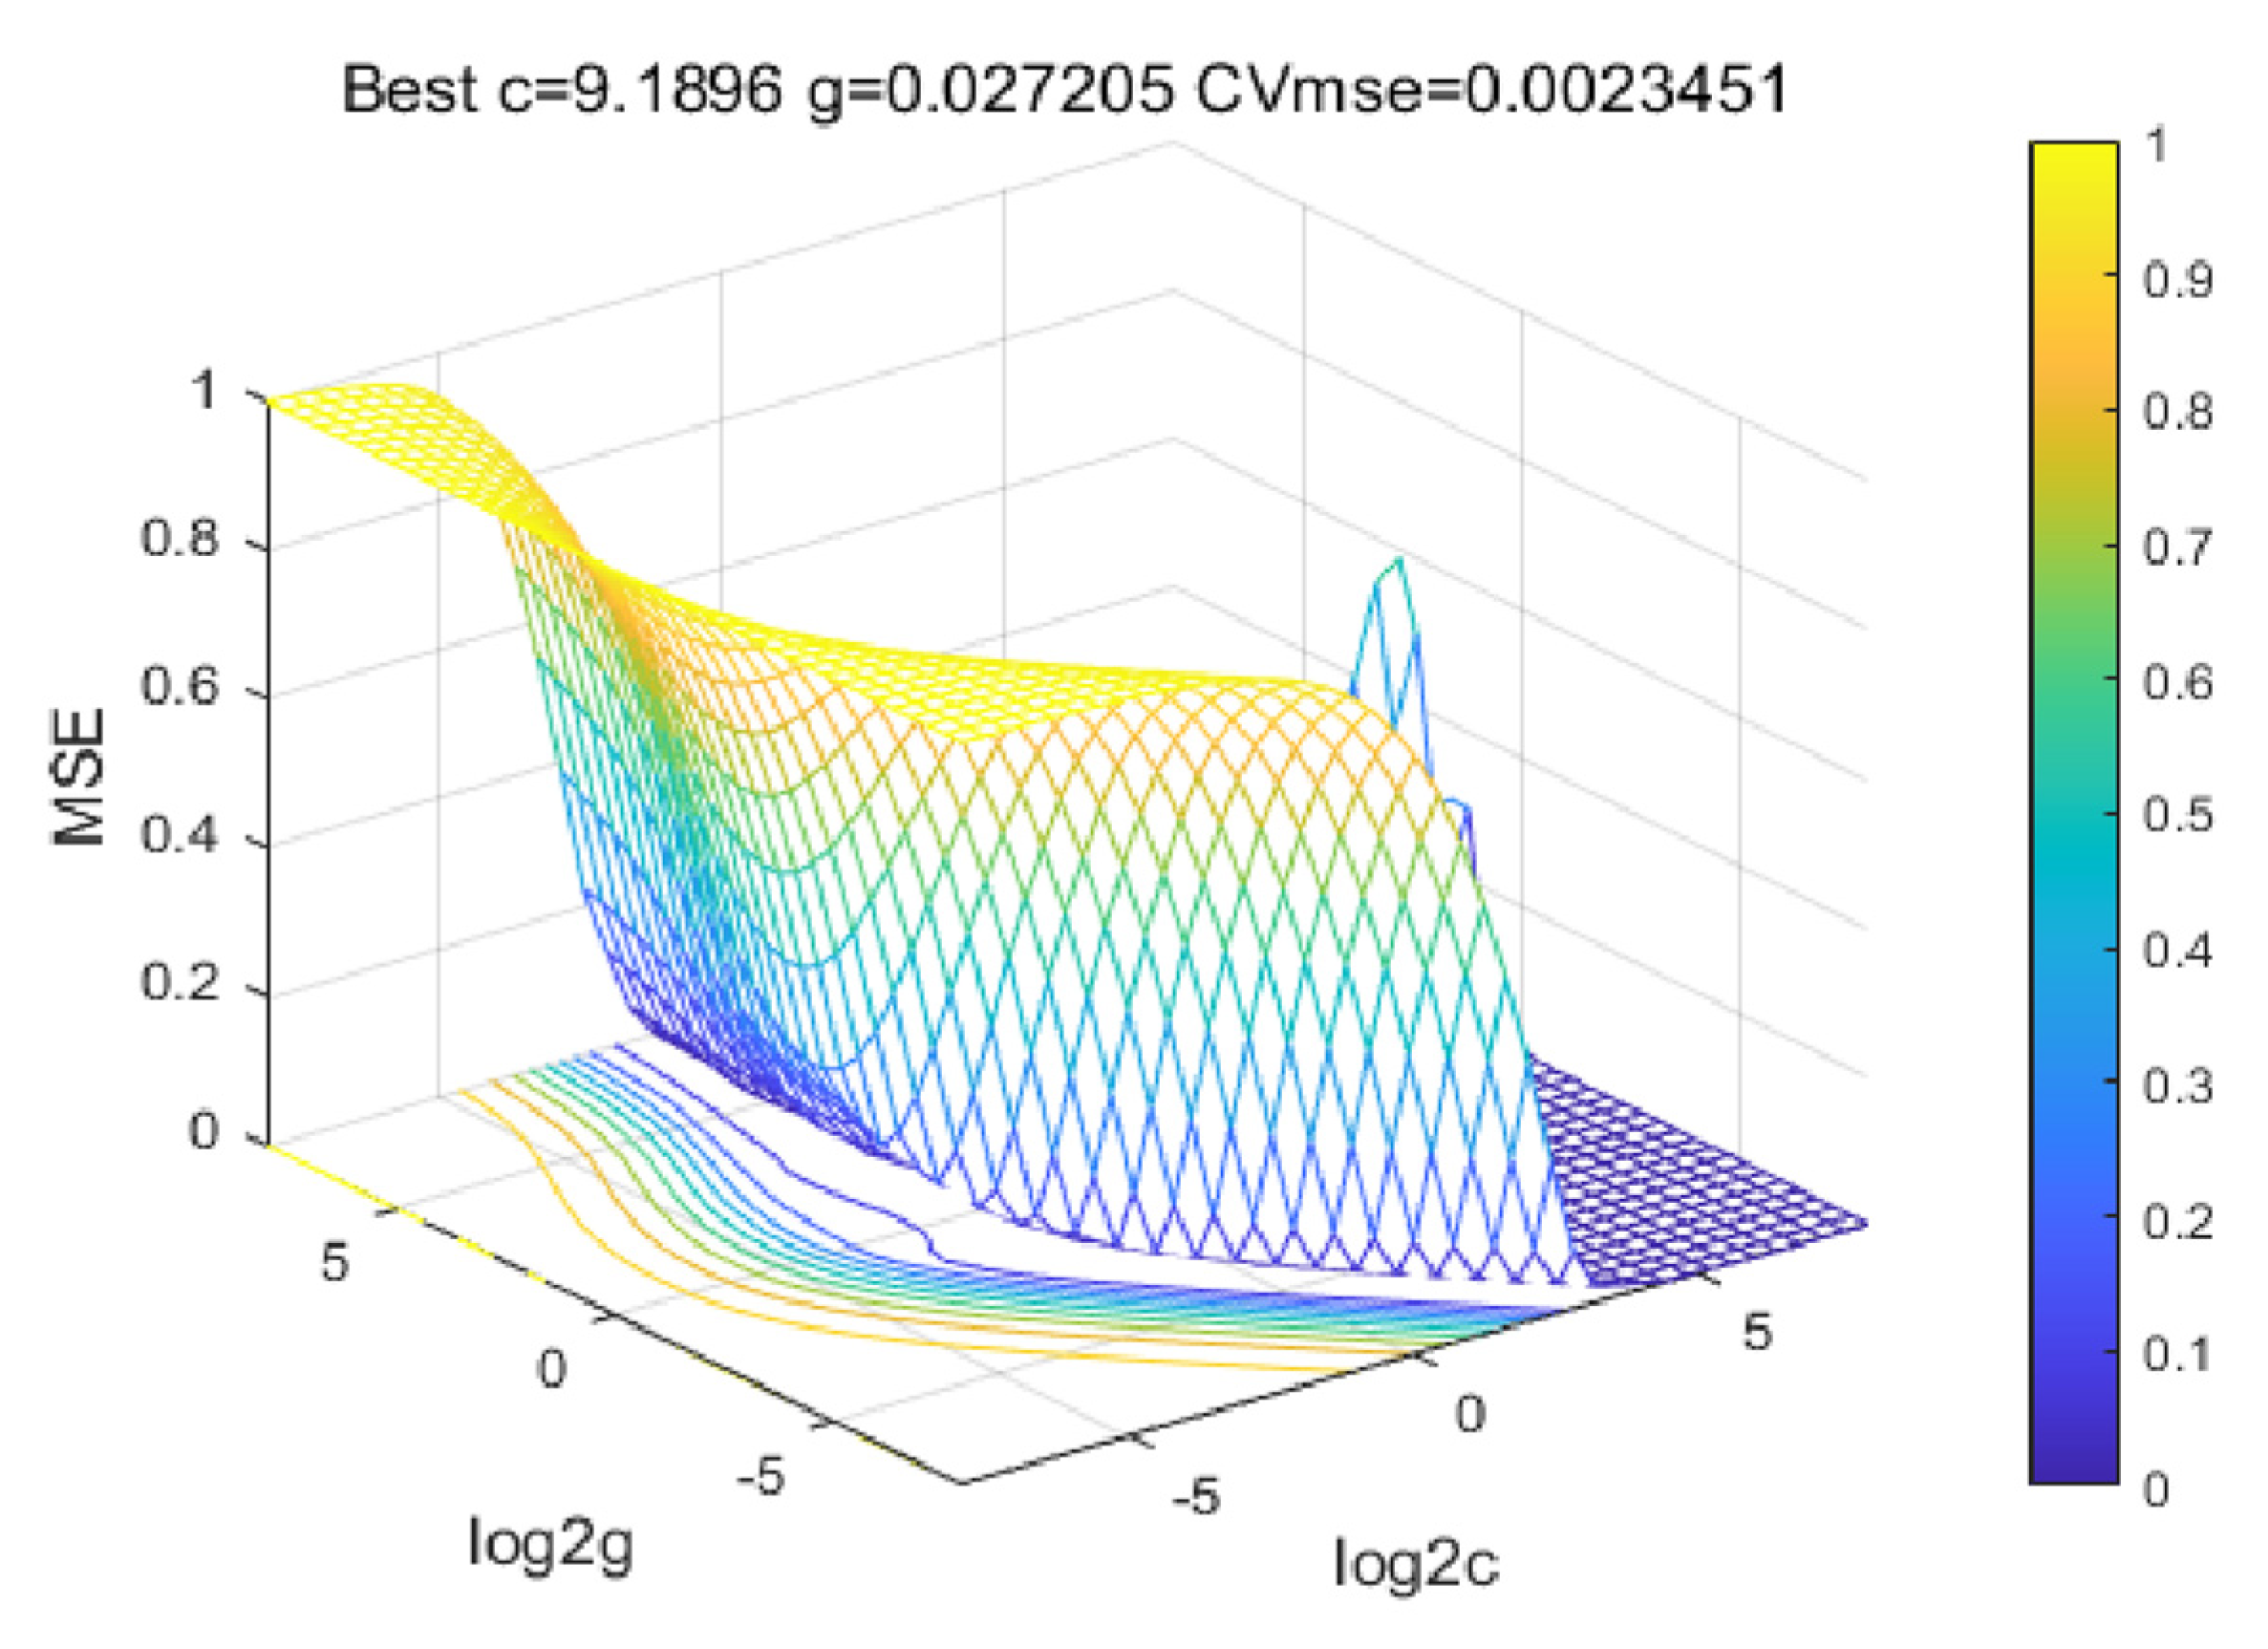
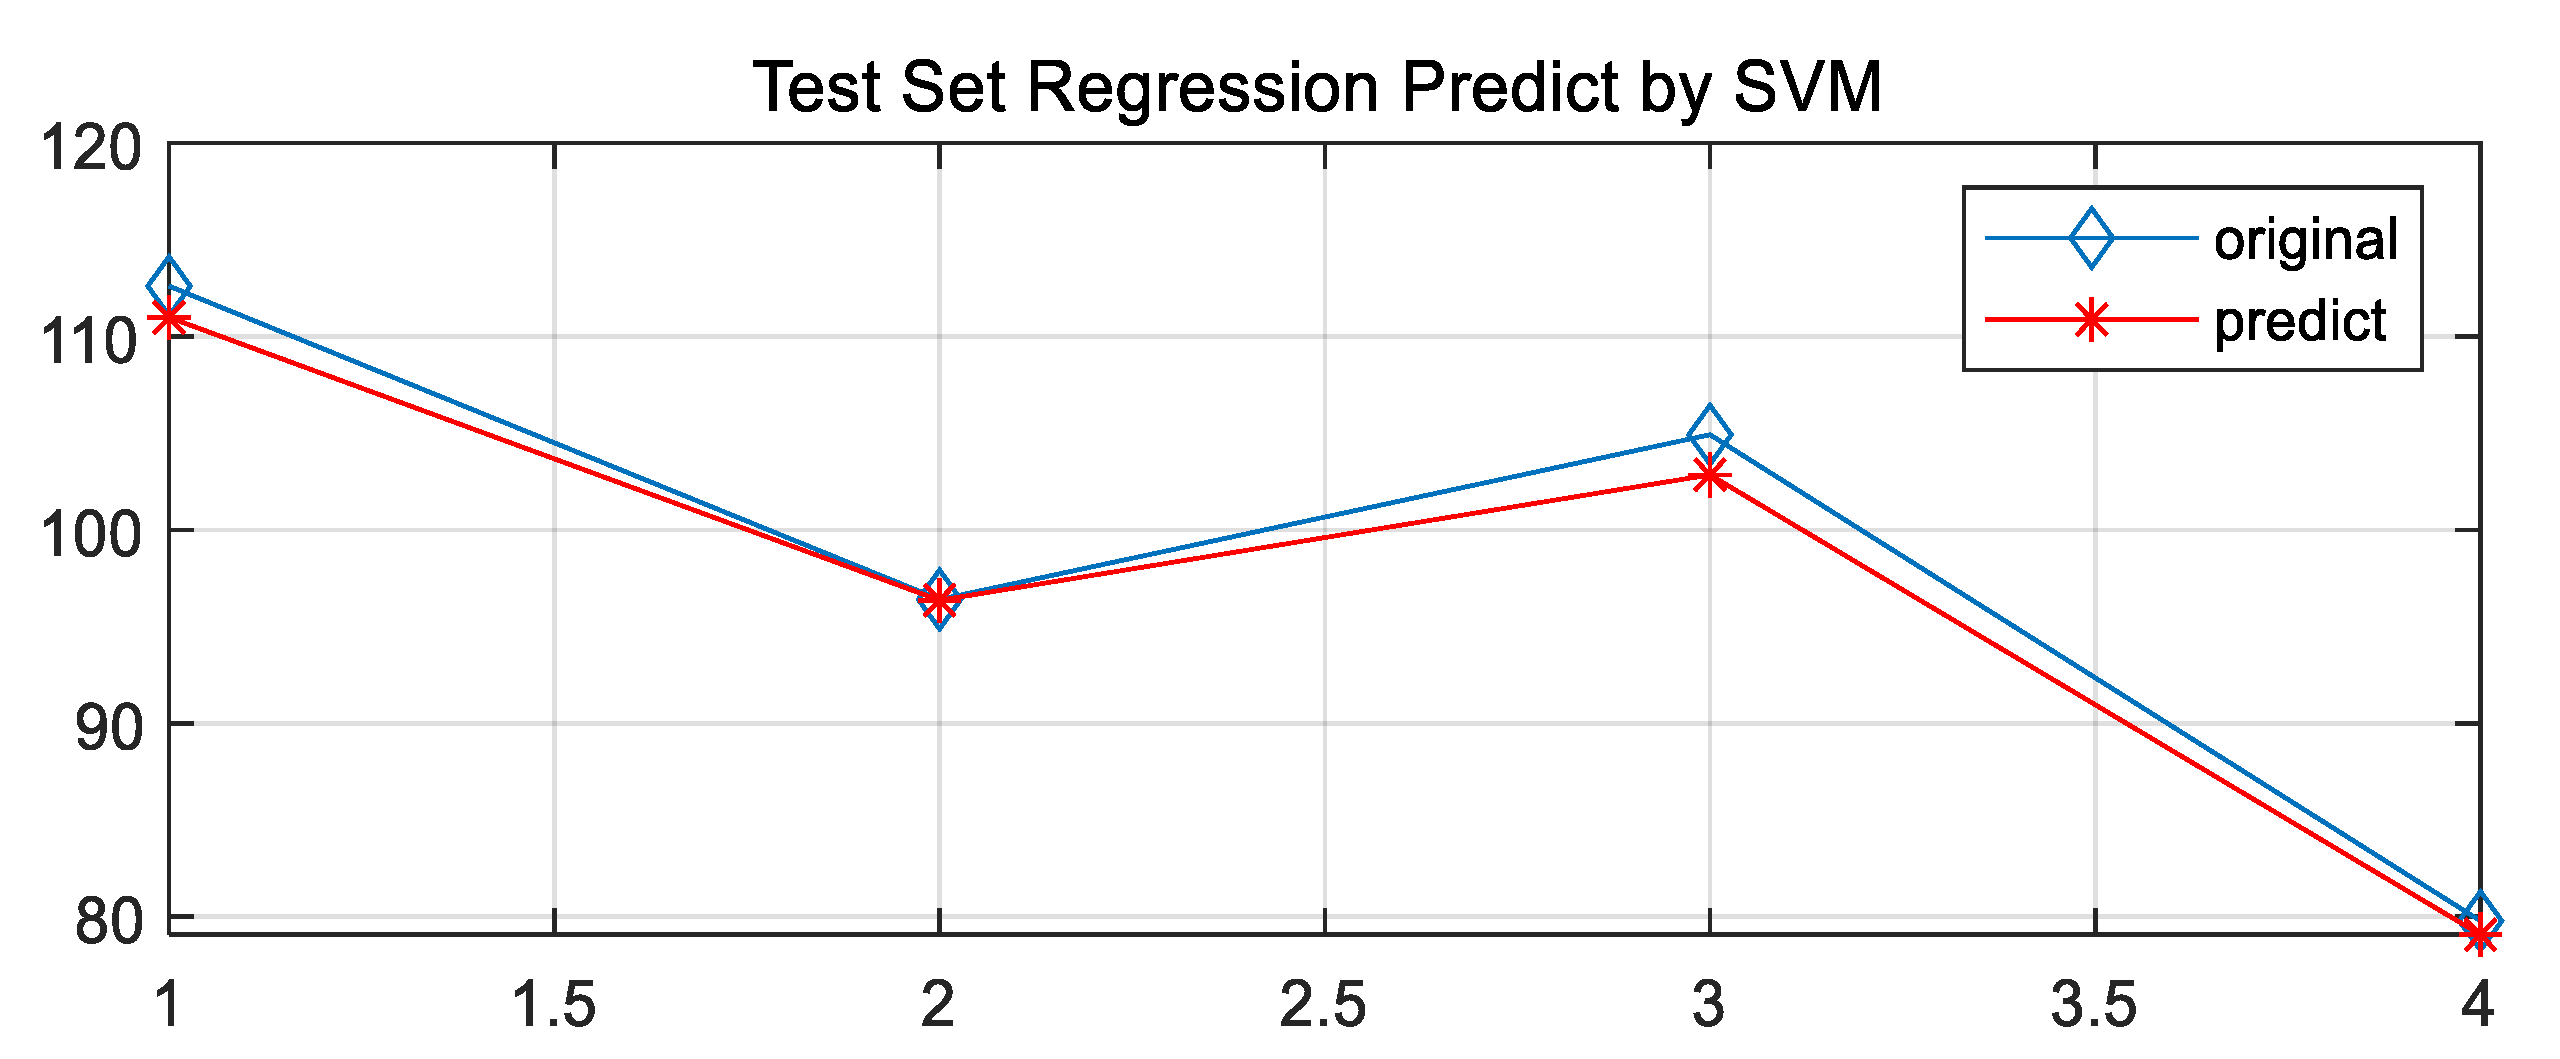
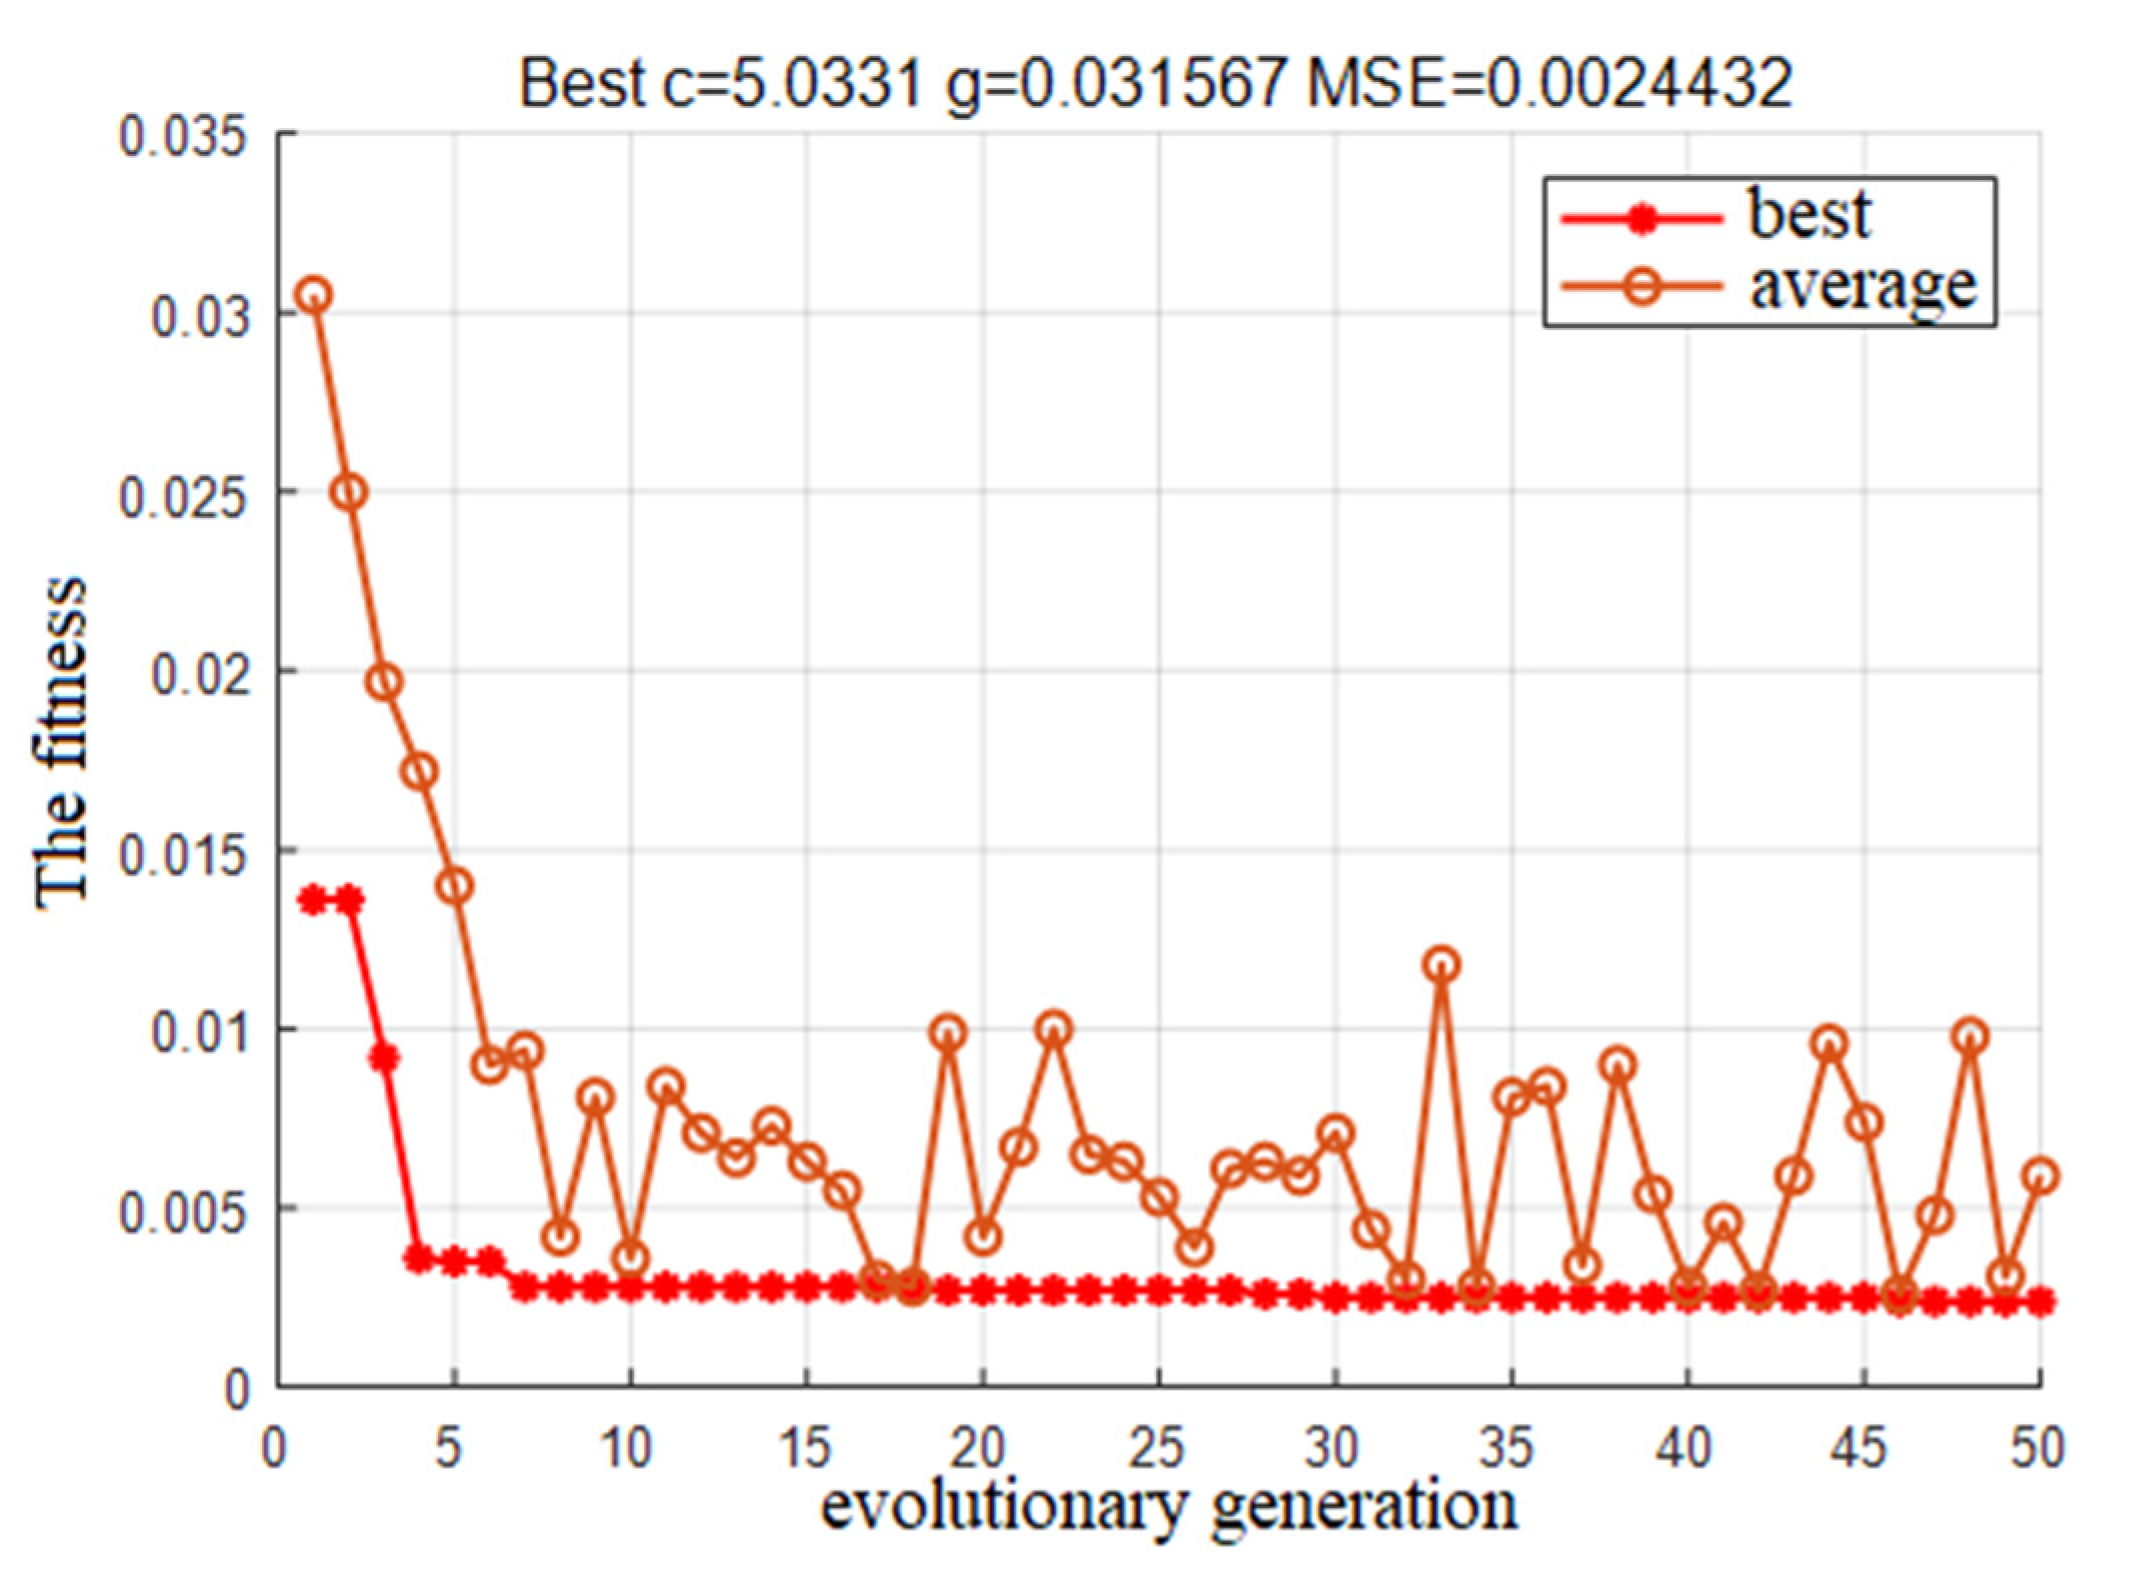
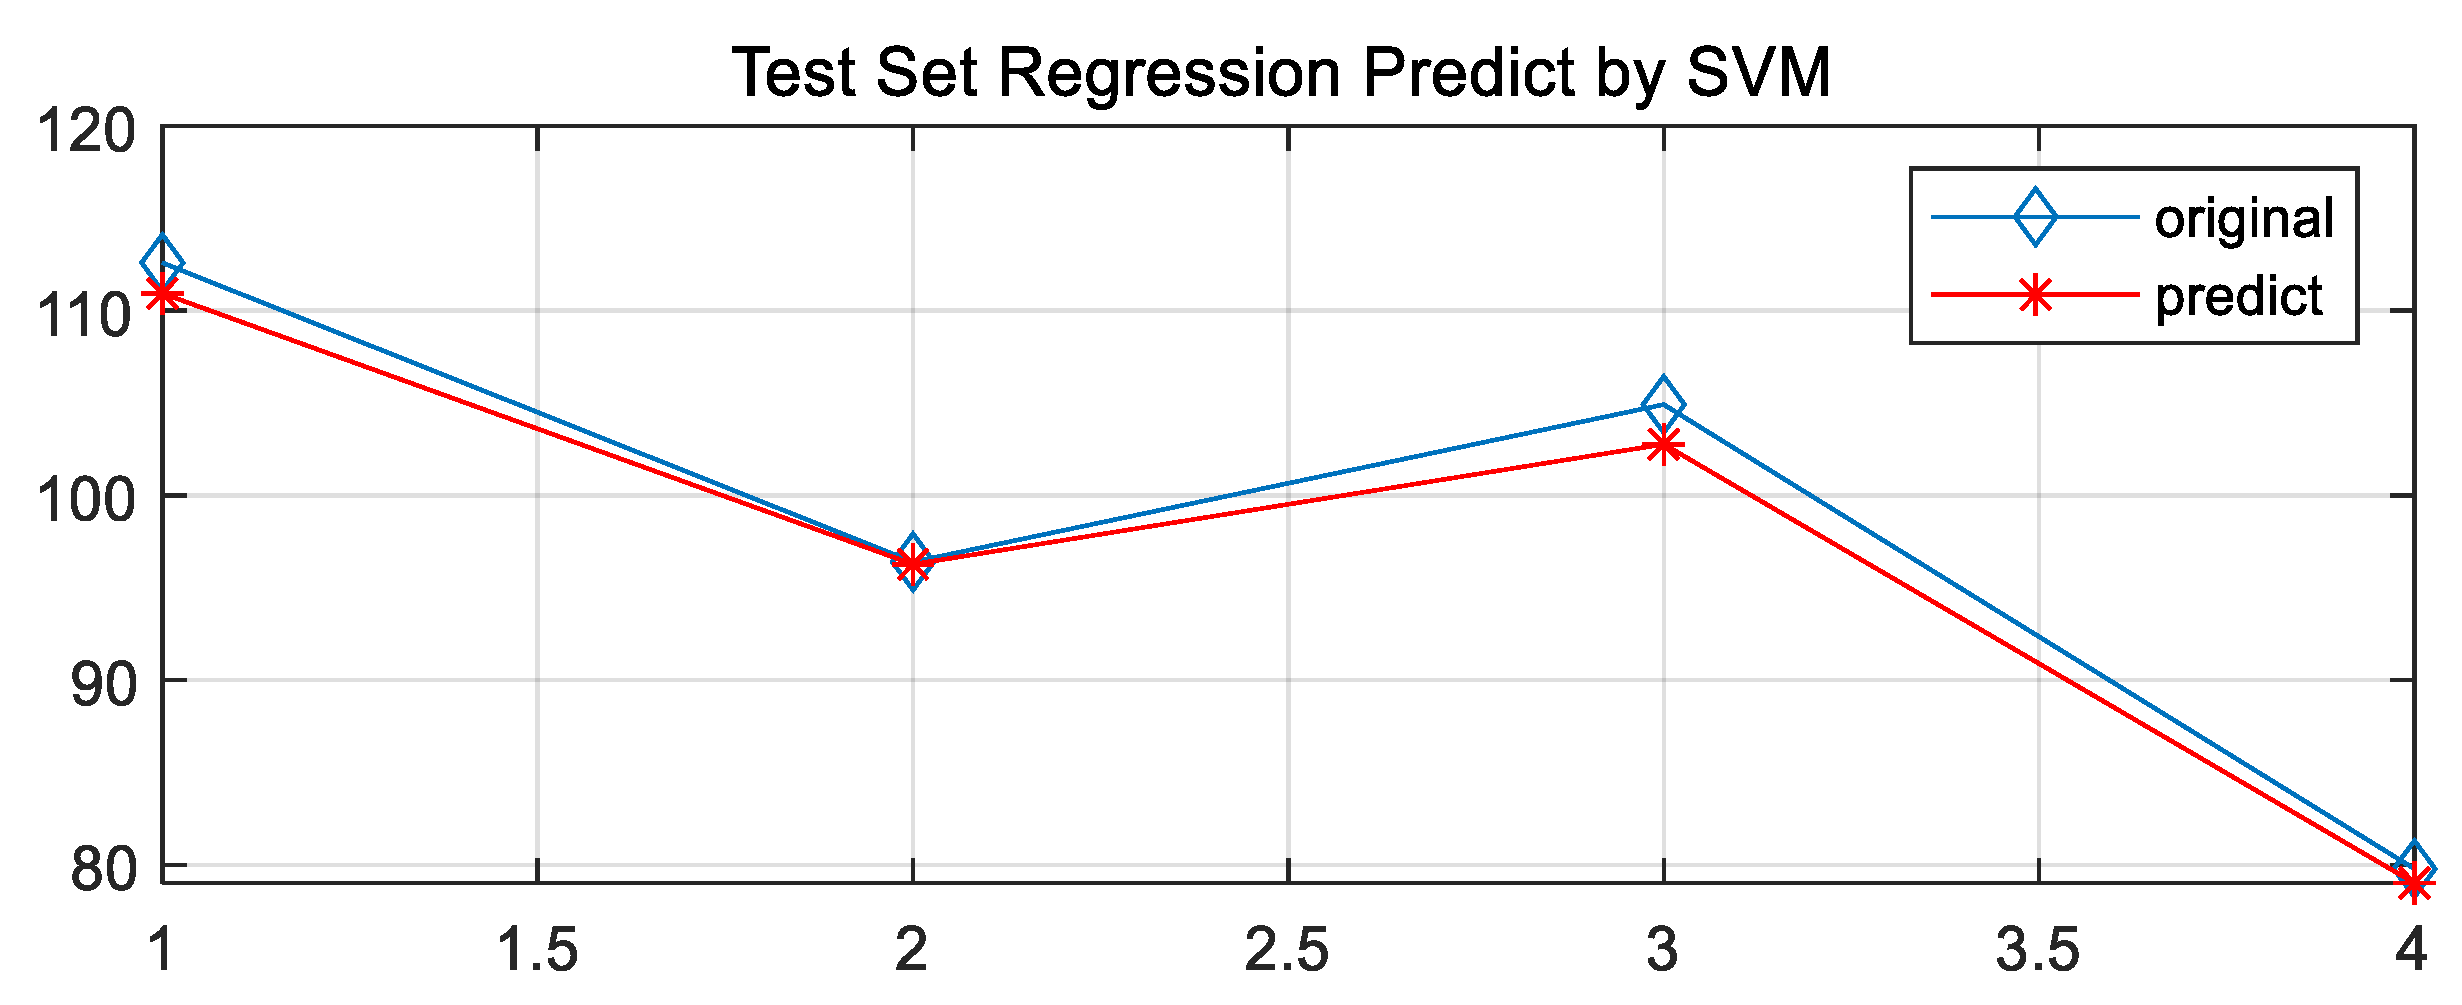
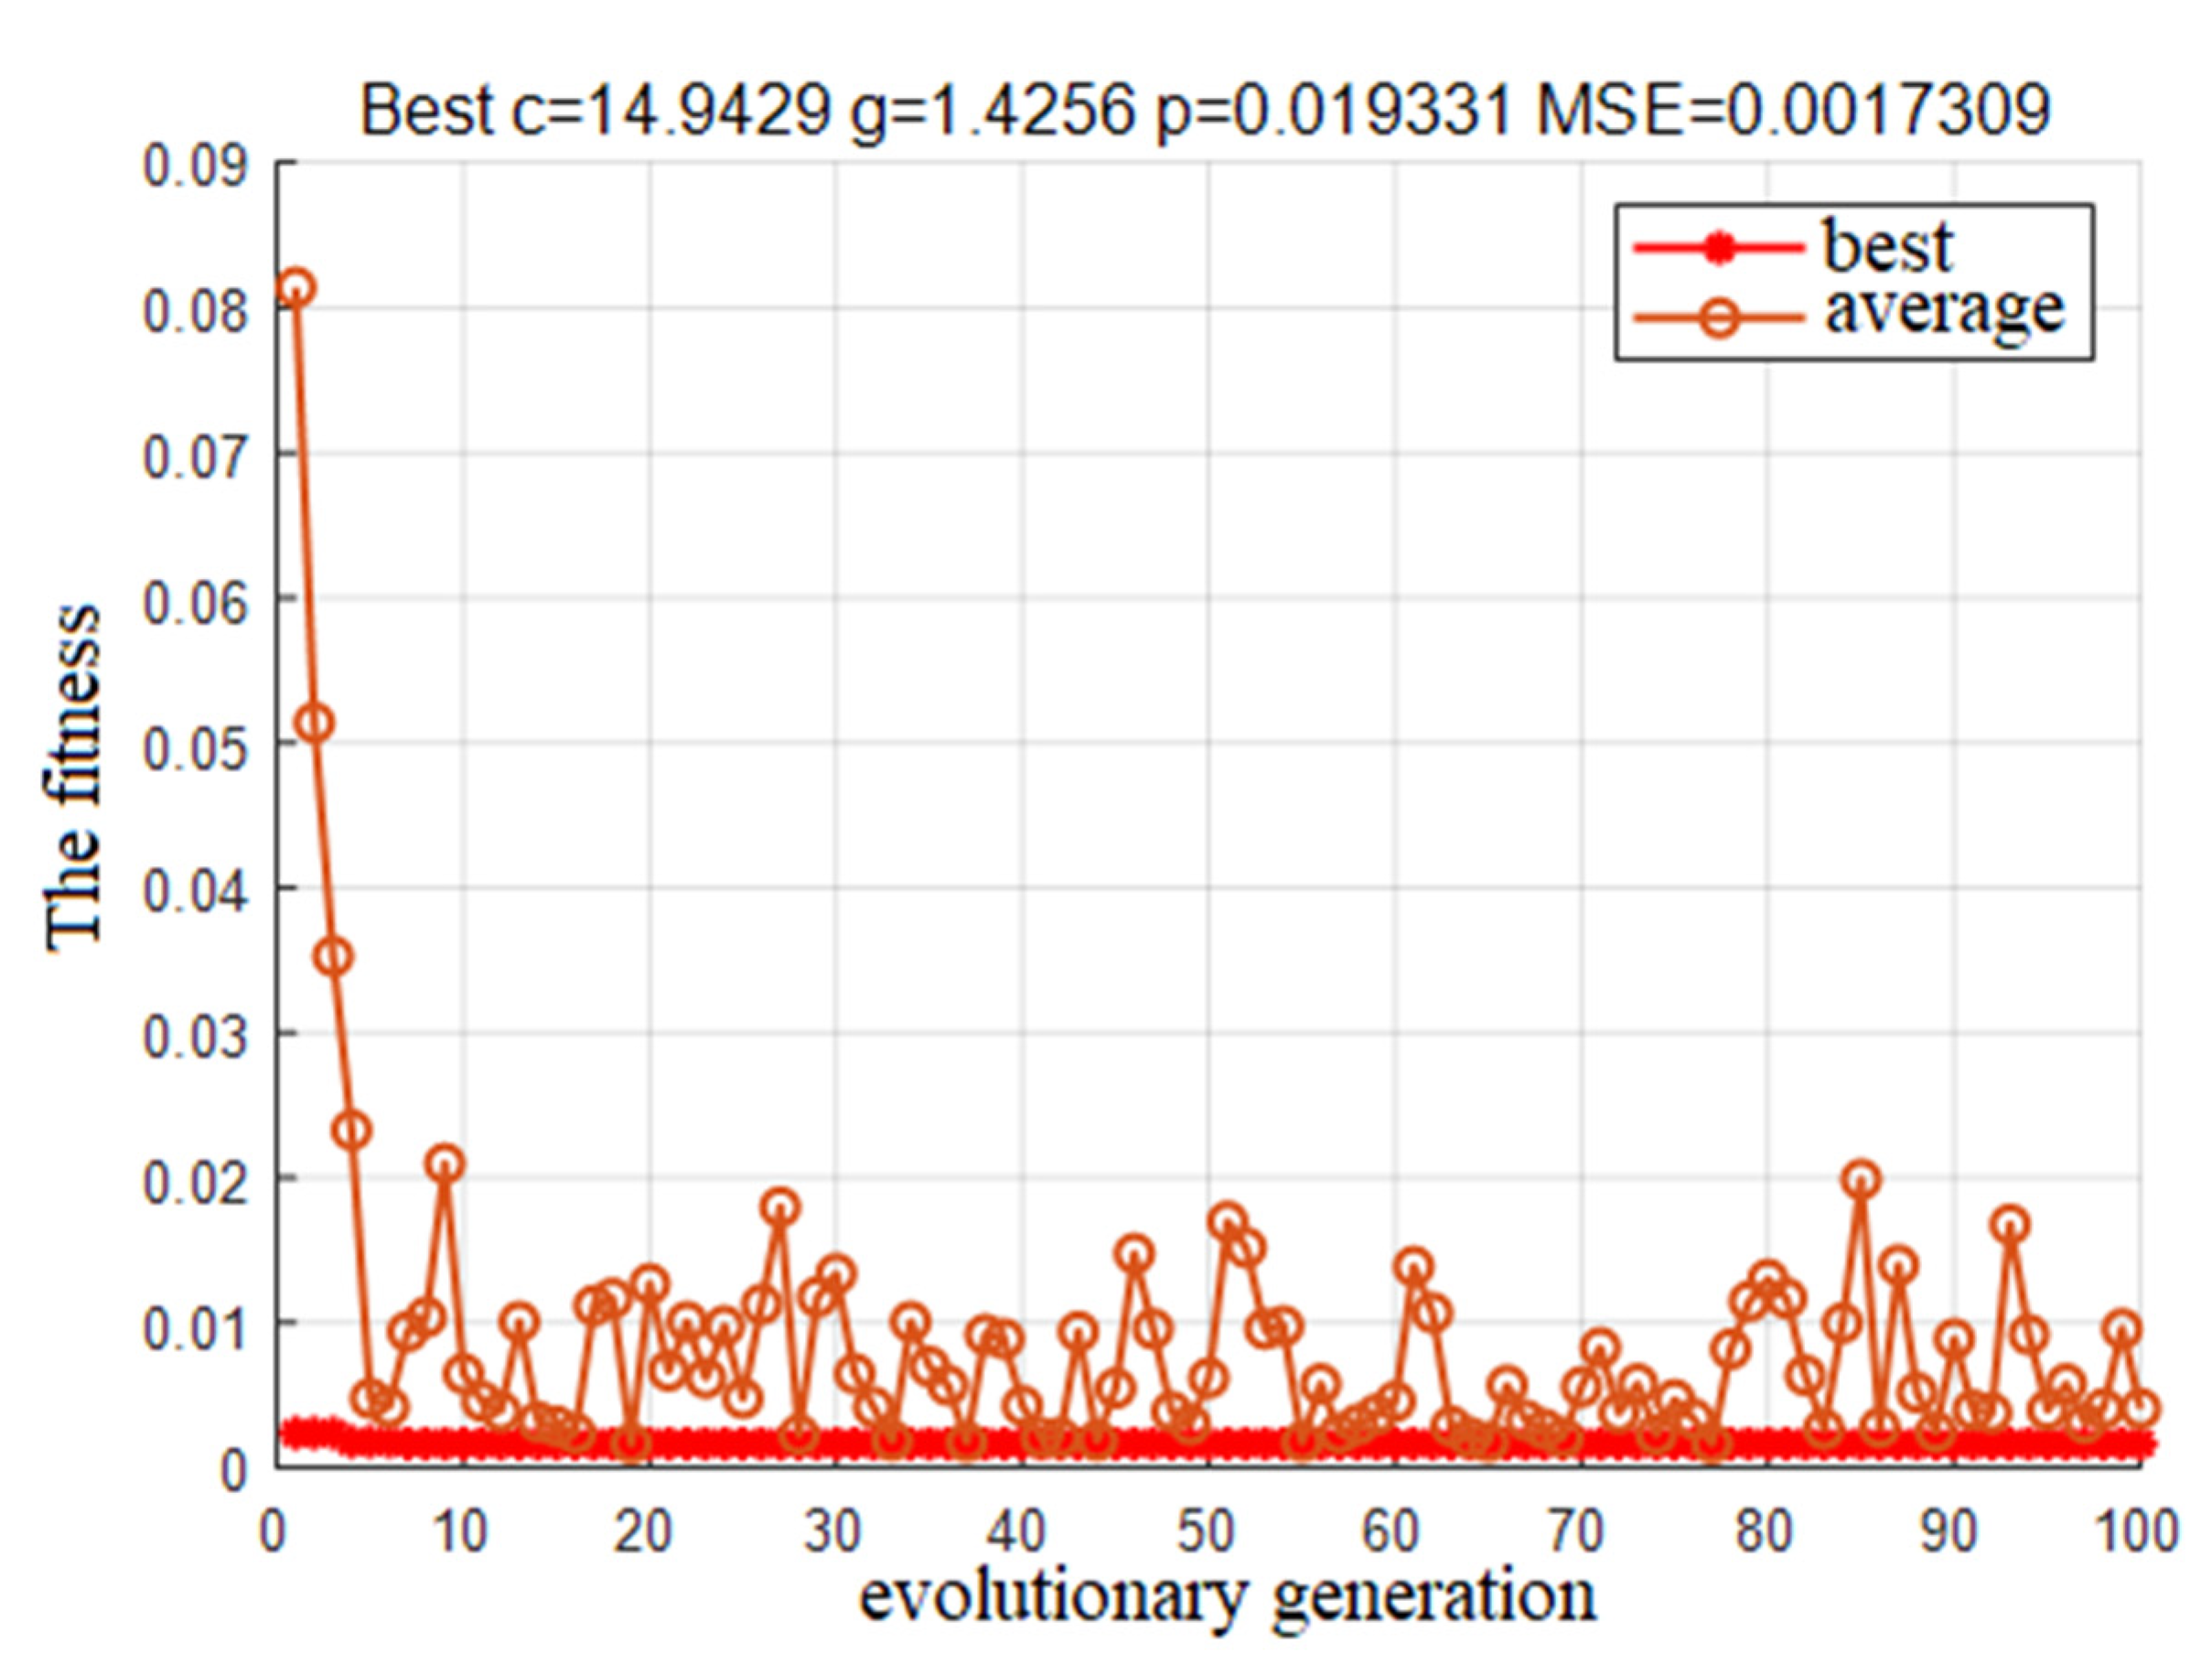
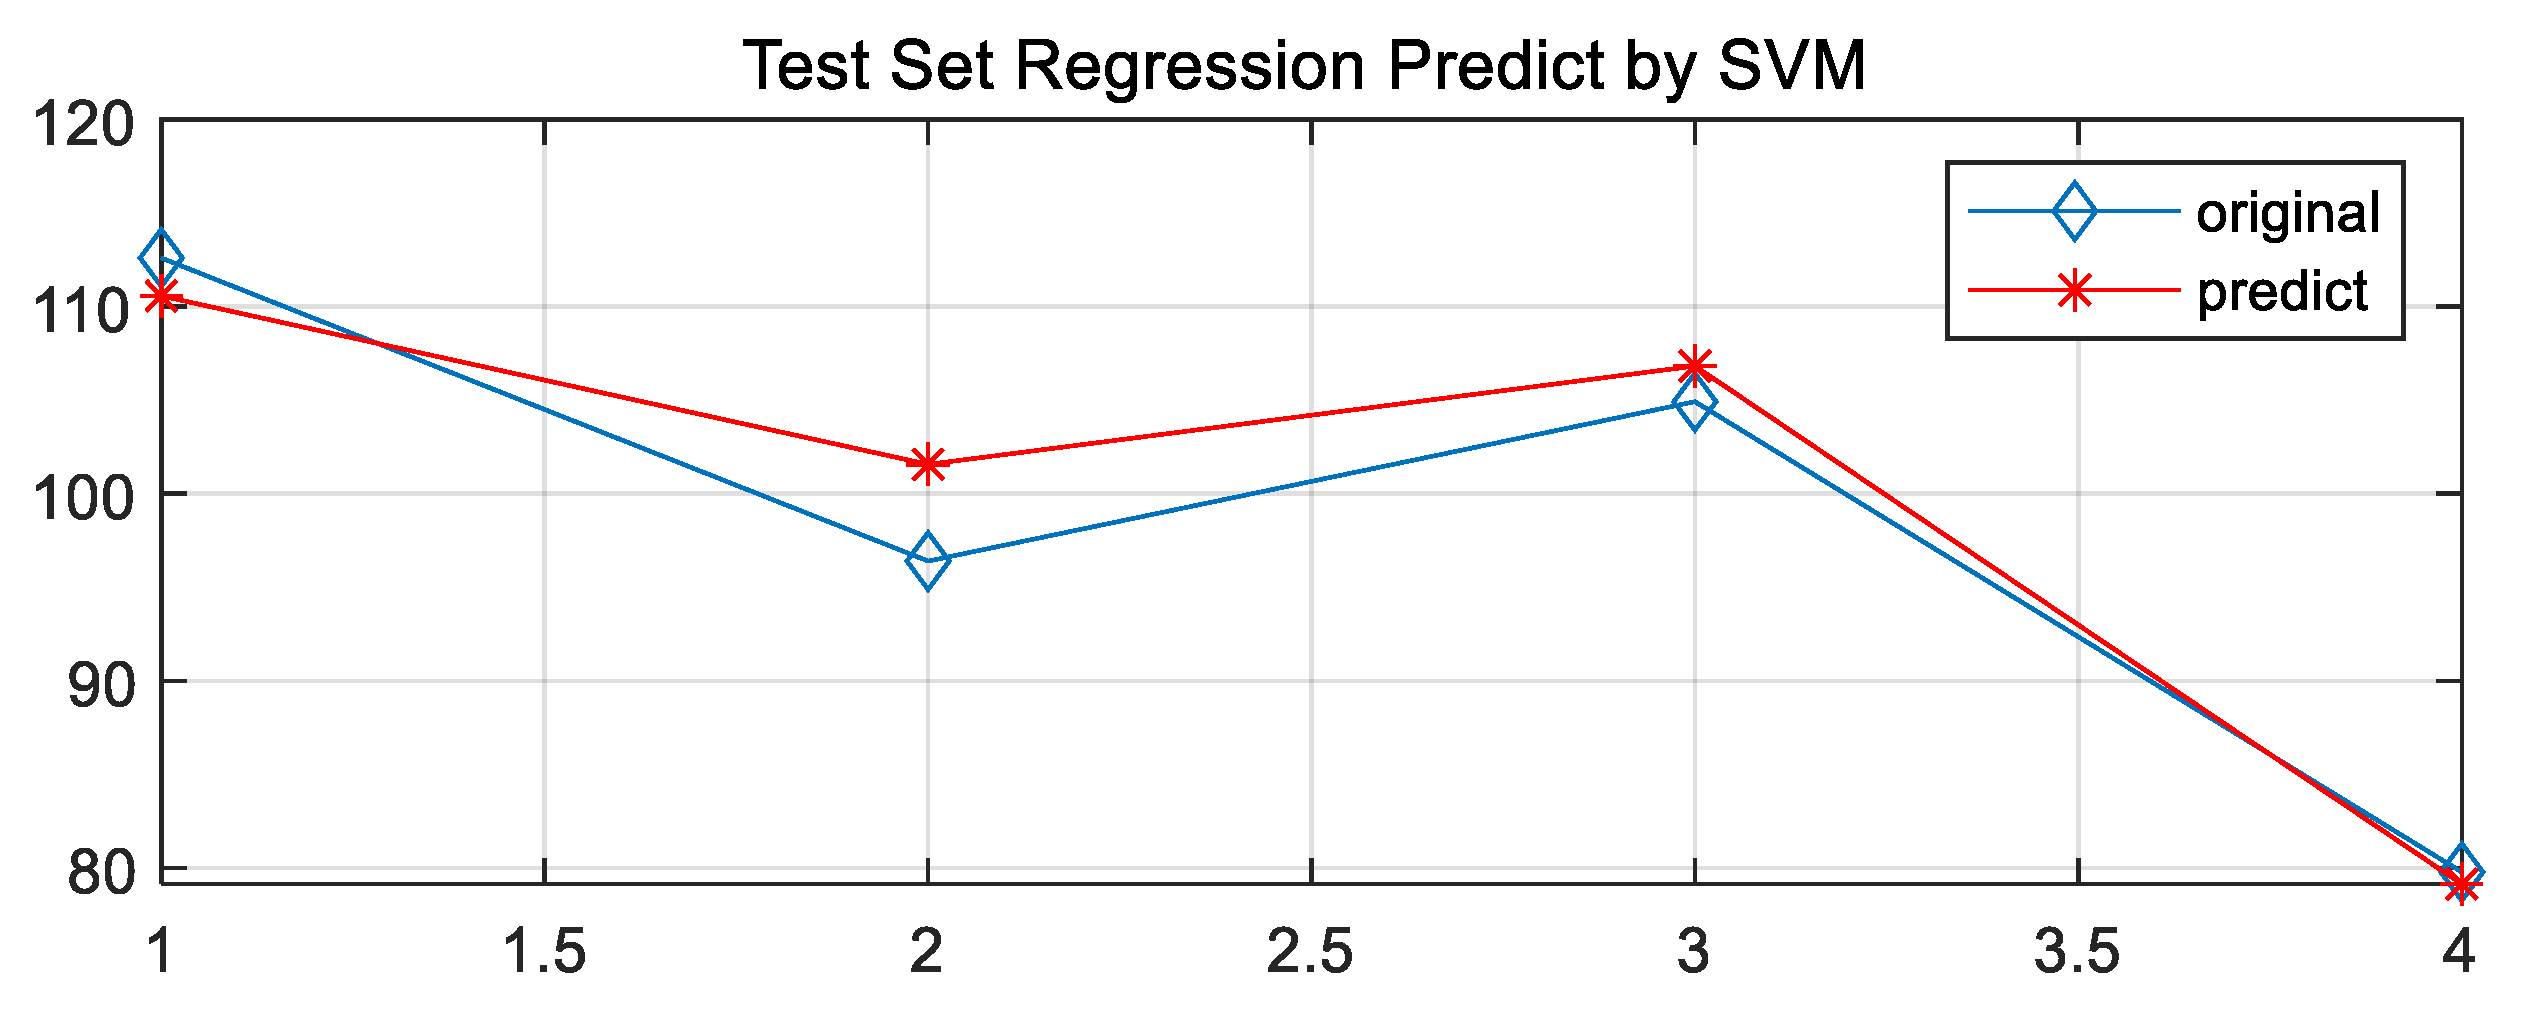
In this paper, the PSO optimization algorithm is used to improve the performance of the regression model and the Grid Search Method algorithm and the GA Method are used for comparative analysis to obtain the regression model with the highest adaptability. The optimization results and the fitting of the test set are shown in Figure 8, Figure 9, Figure 10, Figure 11, Figure 12, Figure 13, Figure 14 and Figure 15.
For the fitting conditions of the four optimization algorithms combined with SVM for the training set and the test set, the mean absolute error and the mean square error are introduced to test the difference between the predicted value and the true value.
In the formula: e—the difference between the true value and the predicted value
- Mean absolute error (MAE): The mean value of the modulus of the prediction error in the data. The smaller the mean absolute error, the better the prediction and fitting effect of the model. The calculation method is as in formula (16).
- 2.
- Mean Square Error (MSE): The expected error of each observation period in the retrospective forecast value is used as a sample and the mean square error of the sample is calculated. The larger the MSE, the lower the accuracy.
Based on the MATLAB platform running toolbox and related compiler handles, the regression model test set results of four different optimization algorithms are obtained. The accuracy evaluation of the four algorithms is shown in Table 6:
Based on the comparison of the results of the test set, it is clear that the PSO-cg finding algorithm works best. The Error cost c of the regression model was selected as 29.2697 and g as 0.1, which laid down a perfect model preparation for the prediction of the development height of the channel in the study area.
4.4. Water-Conducting Fracture Zone Division
Using the trained PSO-SVM model [PredictLabel,MSE], the command [PredictLabel,MSE] = svmpredict (test_scale_label,test_scale_data,model) was input based on the MATLAB platform to predict the height of the fracture zone at the borehole and obtain the data for Yingpanhao Coal Mine The heights of the two zones of roof overlying failure are predicted and the prediction results are shown in Table 7.
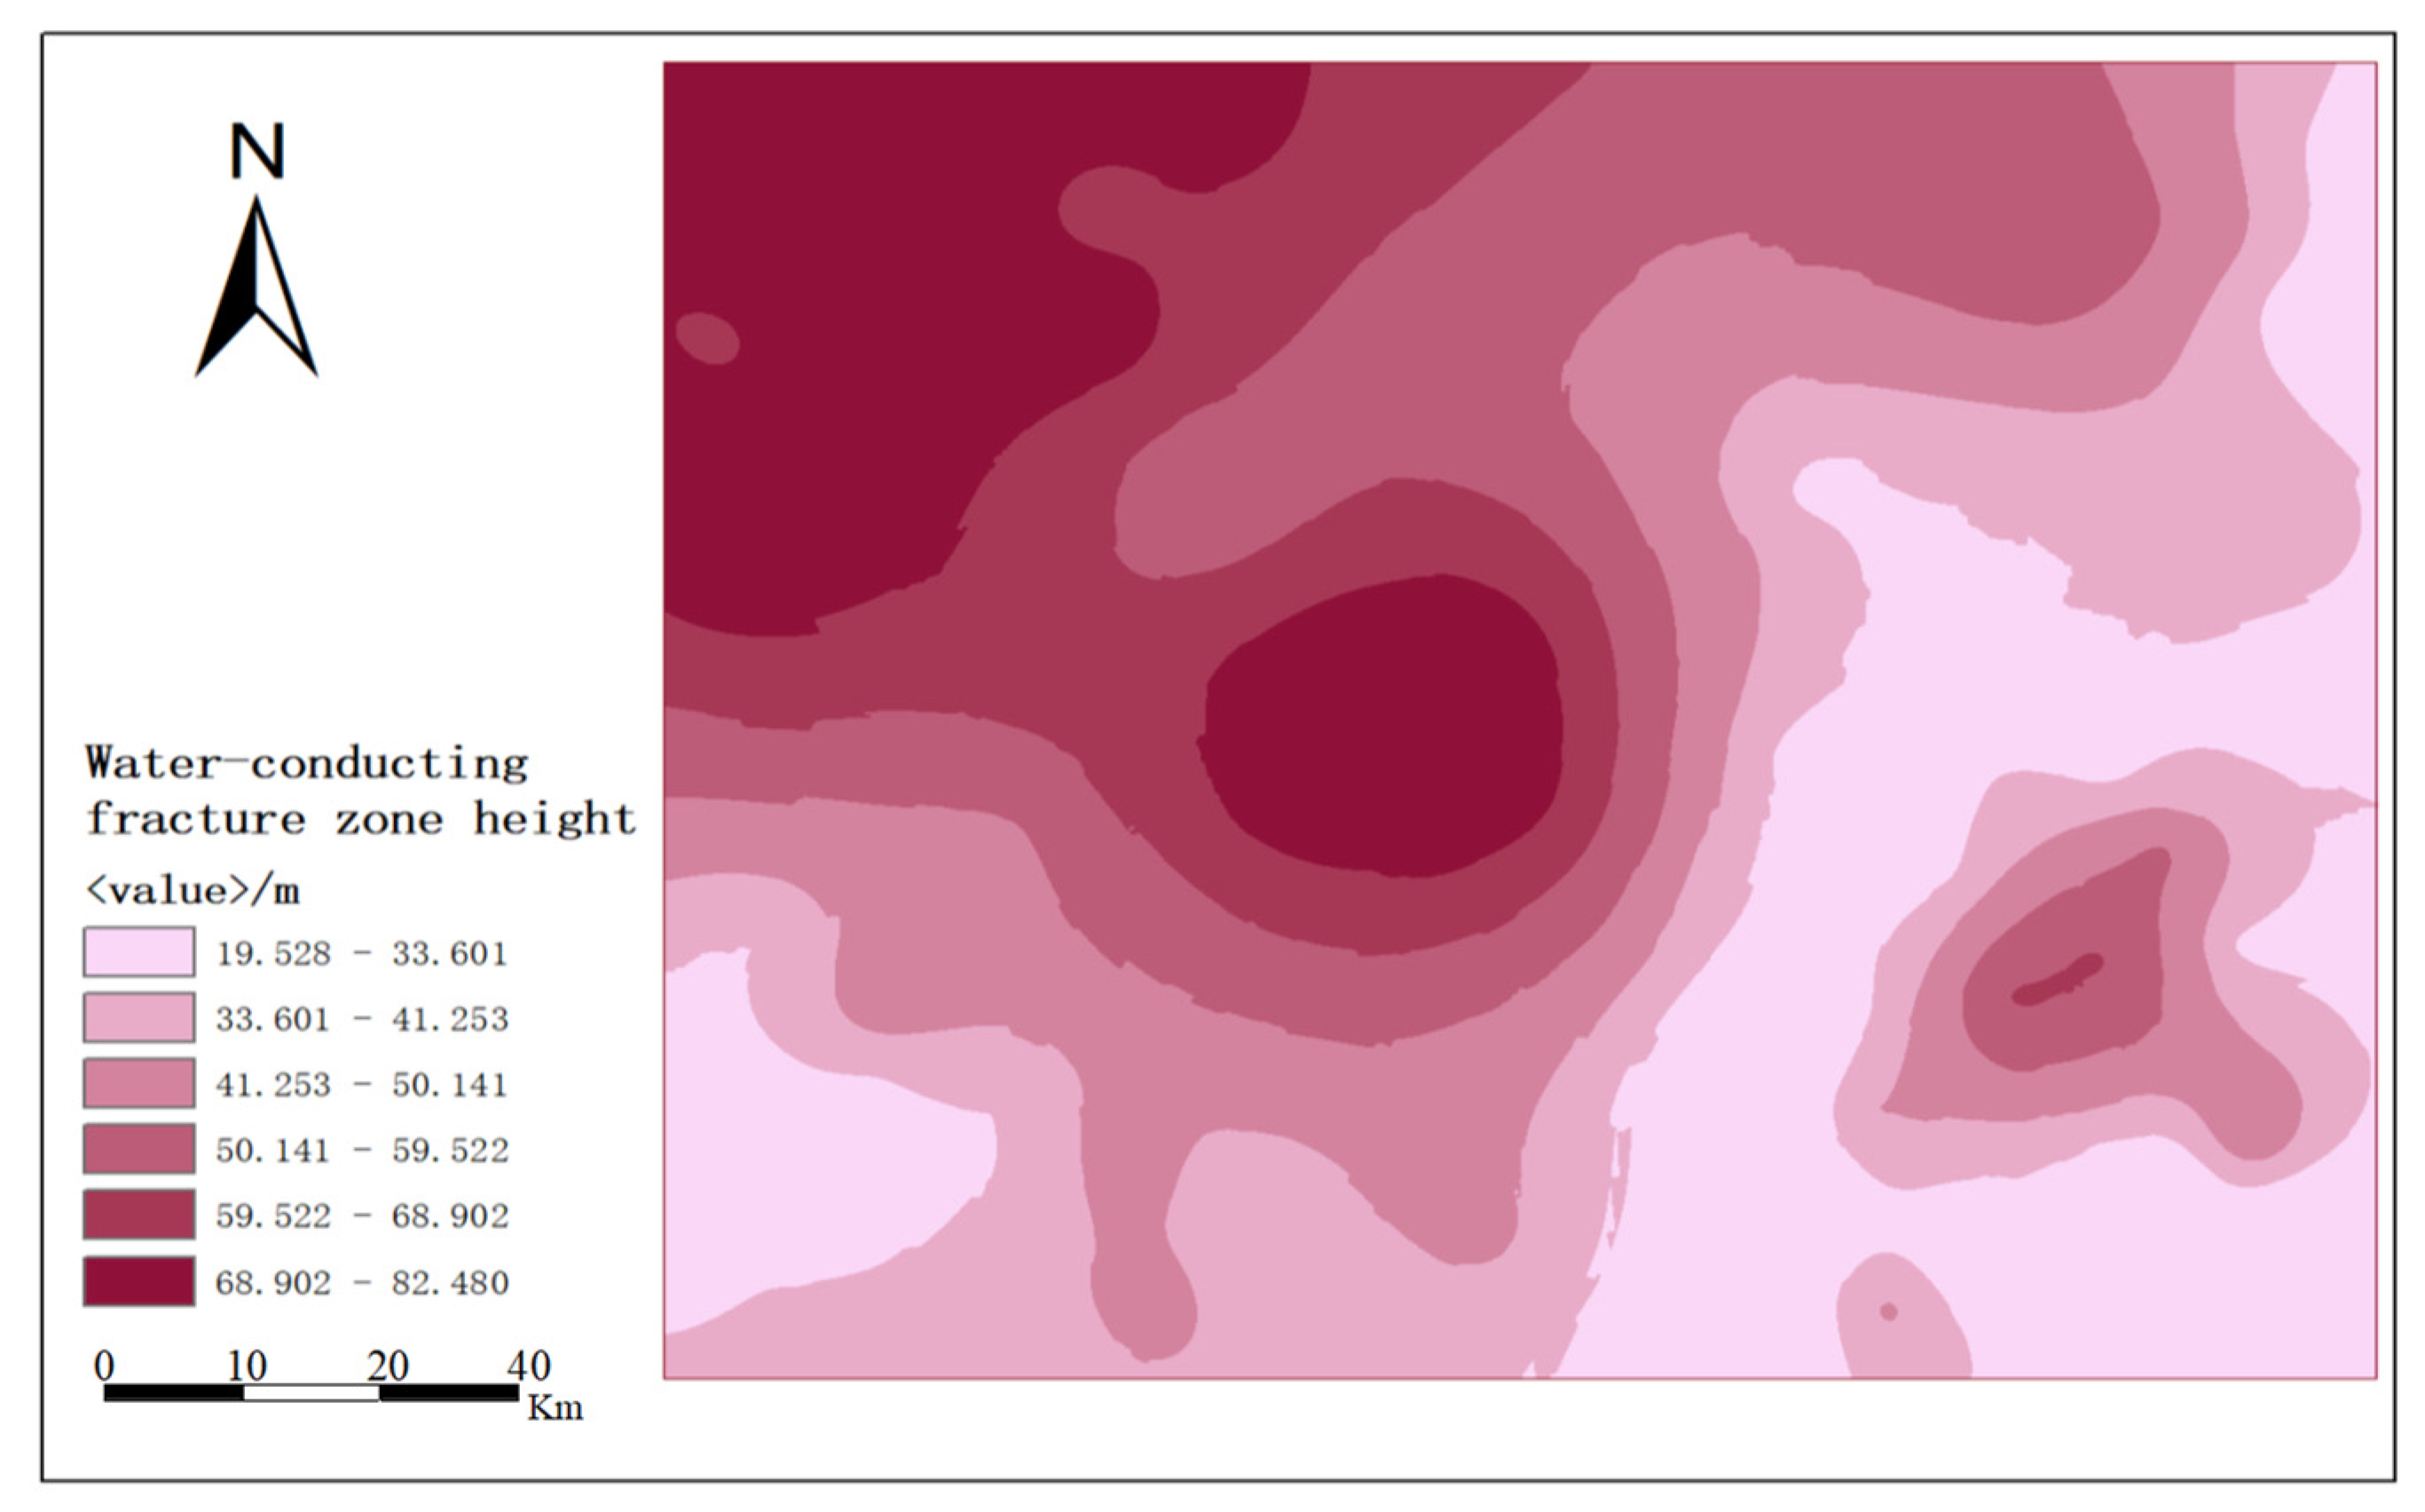
In this paper, we use ArcGIS data spatial analysis function to analyze and mine the known borehole data, effectively manage and integrate the database, and evaluate and interpolate the unknown geographic information of the study area by using the Kriging interpolation method to obtain the distribution map of the water-conducting fracture zone in Yingpanhao Coal Mine, as shown in Figure 16.
From Figure 16, it can be seen that the development height range of the water-conducting fracture zone in Yingpanhao is between 10 m~85 m and the equidistant interval method is selected to classify the degree of crack height into five grades. The color ranges from light pink to dark purple, representing the height of crack from small to large. In the Yingpanhao mining area, as the mining height and depth of the western coal seam are larger than those of the central and eastern coal seams, the interaction of the vast coal seam mining space and structural factors has led to the development of aqueducts. The northwest and central regions have the highest degree of cracking and the water-conducting fracture zones are developed at a height of 70 m to 85 m; in the northeast and southeast, there are small areas of roof water-conducting fracture zones that are relatively developed, but the scope is limited and the development degree is not regional. The development height of the eastern, southern and central-northern is low; in the southwest and southeast directions, the two zones have the lowest degree of development, with heights ranging from 10 m to 25 m. Therefore, the northwestern and central aqueducts are relatively well-developed and it is easy to communicate the occurrence of roof permeation disasters in the upper aquifer. This should be strengthened to check whether there is a considerable thickness of the aquifer above, so as to avoid the formation of a permeable channel due to continuous mining. Corresponding measures such as grouting and water blocking can be taken to block the water channel to avoid accidents.
5. Conclusions
This chapter focuses on calculating the height of the water-conducting fracture zone of the roof of the Yingpan Trench mine through machine learning simulation. Based on the characteristics of small samples of data and nonlinearity, the training and testing of the SVM model is completed by using mine data with similar geological structure and stratigraphic lithology distribution as the training and testing sets, and the quantitative results predicted by the support vector regression machine are visualized qualitatively through ArcGIS. The method differs from the traditional empirical formula of generalized calculation for the whole area and provides targeted zoning for the development height of two zones at different locations, which provides a more accurate prediction method for predicting the development height of the roof water conductivity channel and provides guidance for the subsequent prevention and control of roof water breakout. The main research contents and results are as follows.
- With the hydrogeological structure of the study area as the background, the statistical analysis model was established, the analytic network process method was used for feature dimensionality reduction and the pairwise comparison matrix was constructed to compare the weight distribution of the main control factors according to the scoring by the field technicians and experts, and the two-dimensional factor influence sources of the overburden failure event were identified as the mining height and the stope width of the working face.
- Based on the LIBSVM toolbox on the MATLAB platform, the PSO-SVM model is extended and compiled to realize the combination of the optimization algorithm and the learning machine. Fit the PSO optimization results, the grid-cg optimization, GA-cg optimization and GA-cgp optimization regression model training results with the actual measurement to obtain the result with the best PSO effect in terms of accuracy, and determine the optimal parameter c as 29.2697, g as 0.1. The prediction model of water-conducting fracture zone based on PSO-SVM is established.
- The PSO-SVM model was used to predict the development height of the two zones in the Yingpanhao mine area and the data were analytically mined, effectively managed and integrated with the help of ArcGIS data spatial analysis function. The unknown geographic information of the study area was evaluated and interpolated by using the Kriging interpolation method, and it can be seen from the figure that the water-conducting channels are more developed in the northwest, which can easily communicate with the upper aquifer in the event of water inrush disaster on the roof.
Due to the limited hydrogeological data available in the study area, the dimensions of the main control factors are singular and do not take more into account the influence of tectonic aspects, which may lead to inaccuracy between the prediction results and the real values. It is hoped that relying on the advantages of big data, the factor dimensions can be improved, the traditional data analysis path can be optimized, the problem of information asymmetry and information distortion can be solved and the predicted values and model parameters can be revised.
Author Contributions
For research articles with several authors, Conceptualization, Q.Z.; methodology, C.W.; supervision, L.P. and W.L. All authors have read and agreed to the published version of the manuscript.
Funding
This research was funded by [the National Emergency Management System Construction Project] grant number [20VYJ061], [the Construction and Empirical Research on Early Warning Index System of Major Engineering Safety Risks Based on Optimal Control Theory, National Natural Science Foundation of China] grant number [71271031].
Data Availability Statement
Data can be obtained by contacting the author of this research correspondence email.
Acknowledgments
This research was funded by the National Emergency Management System Construction Project (grant 20VYJ061),the Construction and Empirical Research on Early Warning Index System of Major Engineering Safety Risks Based on Optimal Control Theory, National Natural Science Foundation of China (grant 71271031).
Conflicts of Interest
The authors declare no conflict of interest.
References
- Ministry of Natural Resources, PRC. China Energy Development Report 2021; Geology Press: Beijing, China, 2021.
- Guo, W.B.; Ma, Z.B.; Bai, E.H. Current status and prospect of coal mining technology under buildings, water bodies and railways, and above confined water in China. Coal Sci. Technol. 2020, 48, 16–26. [Google Scholar]
- Bai, X.H.; Zhang, N.; Liu, H. Review on current situation of coal industry in China. Guangdong Chem. Ind. 2018, 45, 84–85. [Google Scholar]
- Liu, T.Q. Current status and prospect of coal mining technology under buildings, water bodies and railways, and above confined water. Coal Sci. Technol. 1995, 1, 5–7. [Google Scholar]
- Gao, Y.F. “Four-zone” model of rockmass movement and back analysis of dynamic displacement. J. China Coal Soc. 1996, 21, 51–56. [Google Scholar]
- Qian, M.G.; Liao, X.X.; Xu, J.L. Resources and environment harmonics (green) mining and its technological system. J. Min. Saf. Eng. 2006, 23, 1–5. [Google Scholar]
- Qian, M.G.; Liao, X.X.; Xu, J.L. Theoretical study of key stratumin ground control. J. China Coal Soc. 1996, 3, 2–7. [Google Scholar]
- Zhou, Y.F.; Deng, K.Z.; Ma, W.M. Mining Subsidence Engineering; China University of Mining and Technology Press: Xuzhou, China, 2003. [Google Scholar]
- Shi, L.Q.; Han, J. Theory and practice of dividing coal mining area floor into four-zone. J. China Univ. Min. Technol. 2005, 34, 8. [Google Scholar]
- Shi, L.Q. Research on the Mechanism and Prediction of Water Inrush from the Floor of Thin Aquifer; Shangdong University of Science and Technology: Qingdao, China, 1999. [Google Scholar]
- Gao, W.; Li, Y.; He, Q. Determination of fractured water-conducting zone height based on microseismic monitoring: A case study in Weiqiang coalmine, Shaanxi, China. Sustainability 2022, 14, 8385. [Google Scholar] [CrossRef]
- Li, X.; Chen, S.; Wang, E.; Li, Z. Rockburst mechanism in coal rock with structural surface and the microseismic (MS) and electromagnetic radiation (EMR) response. Eng. Fail. Anal. 2021, 124, 105396. [Google Scholar] [CrossRef]
- Ikram, R.M.A.; Dai, H.L.; Ewees, A.A.; Shiri, J.; Kisi, O.; Zounemat-Kermani, M. Application of improved version of multi verse optimizer algorithm for modeling solar radiation. Energy Rep. 2022, 8, 12063–12080. [Google Scholar] [CrossRef]
- Di, Z.; Lin, J.; Peng, Q.; Wang, D.; Yang, T.; Sorooshian, S.; Liu, X.; Zhuang, J. Modeling and simulating of reservoir operation using the artificial neural network, support vector regression, deep learning algorithm. J. Hydrol. 2018, 565, 720–736. [Google Scholar]
- Farajzadeh, J.; Alizadeh, F. A hybrid linear–nonlinear approach to predict the monthly rainfall over the urmia lake watershed using wavelet-sarimax-lssvm conjugated model. J. Hydroinformatics 2017, 20, 1–2. [Google Scholar] [CrossRef] [Green Version]
- Noble, W.S. What is a support vector machine. Nat. Biotechnol. 2006, 24, 1565–1567. [Google Scholar] [CrossRef] [PubMed]
- Cortes, C.; Vapnik, V. Support-vector networks. Mach. Learn. 1995, 20, 273–297. [Google Scholar] [CrossRef]
- Cristianini, N.; Shawe -taylor, J. An Introduction to Support Vector Machines and Other Kernel Based Learning Method; Publishing House of Electronics Industry: Beijing, China, 2014. [Google Scholar]
- Cherkassky, V.; Ma, Y. Practical selection of SVM parameters and noise estimation for SVM regression. Neural Netw. 2004, 17, 113–126. [Google Scholar] [CrossRef] [Green Version]
- Vishwanathan, S.V.M.; Murty, M.N. SSVM: A simple SVM algorithm. In Proceedings of the 2002 International Joint Conference on Neural Networks, Honolulu, HI, USA, 12–17 May 2002; IEEE: Piscataway Township, NJ, USA; Volume 3, pp. 2393–2398. [Google Scholar]
- Marini, F.; Walczak, B. Particle swarm optimization (PSO). A tutorial. Chemom. Intell. Lab. Syst. 2015, 149, 153–165. [Google Scholar] [CrossRef]
- Liu, B.; Wang, L.; Jin, Y.H. An effective PSO-based memetic algorithm for flow shop scheduling. IEEE Trans. Syst. Man Cybern. Part B (Cybern.) 2007, 37, 18–27. [Google Scholar] [CrossRef]
- Shi, X.H.; Liang, Y.C.; Lee, H.P.; Lu, C.; Wang, L.M. An improved GA and a novel PSO-GA-based hybrid algorithm. Inf. Process. Lett. 2005, 93, 255–261. [Google Scholar] [CrossRef]
- Liu, W.T.; Zheng, Q.S.; Pang, L.; Pang, L.F.; Dou, W.M.; Meng, X.X. Study of roof water inrush forecasting based on EM-FAHP two-factor model. Math. Biosci. Eng. 2021, 18, 4987–5005. [Google Scholar] [CrossRef]
- Yan, B.Q.; Ren, F.H.; Cai, M.F.; Qiao, C. Bayesian model based on Markov chain Monte Carlo for identifying mine water sources in Submarine Gold Mining. J. Clean. Prod. 2020, 253, 120008. [Google Scholar] [CrossRef]
- Jharkharia, S.; Shankar, R. Selection of logistics service provider: An analytic network process (ANP) approach. Omega 2007, 35, 274–289. [Google Scholar] [CrossRef]
- Chung, S.H.; Lee, A.H.I.; Pearn, W.L. Analytic network process (ANP) approach for product mix planning in semiconductor fabricator. Int. J. Prod. Econ. 2005, 96, 15–36. [Google Scholar] [CrossRef]
Figure 1.
Support Vector Machine Mapping Schematic.

Figure 2.
Particle swarm algorithm flow chart.

Figure 3.
Location of the Yingpanhao Coal Mine and column diagram of boreholes.

Figure 4.
Factors affecting the height of the water-conducting fracture.

Figure 5.
ANP Hierarchy.

Figure 6.
ANP model of water-rich controlling factor.

Figure 7.
PSO-SVM model.

Figure 8.
Particle swarm optimization parameter optimization fitness curve.

Figure 9.
PSO-SVM test set data fit.

Figure 10.
Grid-cg parameter optimization 3D view.

Figure 11.
Grid-SVM test set data fit.

Figure 12.
GA-cg parameter optimization fitness curve.

Figure 13.
GA(cg)-SVM test set data fit.

Figure 14.
GA-cgp parameter optimization fitness curve.

Figure 15.
GA(cgp)-SVM test set data fit.

Figure 16.
Development height distribution of Yingpanhao water-conducting fracture.


Table 1.
Unweighted super-matrix.
| C11 | C12 | C13 | C21 | C22 | C23 | |
|---|---|---|---|---|---|---|
| C11 | 0.000 | 0.000 | 0.000 | 0.356 | 0.347 | 0.215 |
| C12 | 0.000 | 0.000 | 0.000 | 0.221 | 0.458 | 0.398 |
| C13 | 0.000 | 0.000 | 0.000 | 0.423 | 0.195 | 0.387 |
| C21 | 0.515 | 0.510 | 0.528 | 0.000 | 0.000 | 0.000 |
| C22 | 0.104 | 0.007 | 0.044 | 0.000 | 0.000 | 0.000 |
| C23 | 0.381 | 0.420 | 0.428 | 0.000 | 0.000 | 0.000 |
Table 2.
Weighted super-matrix.
| C11 | C12 | C13 | C21 | C22 | C23 | |
|---|---|---|---|---|---|---|
| C11 | 0.000 | 0.000 | 0.000 | 0.407 | 0.265 | 0.265 |
| C12 | 0.000 | 0.000 | 0.000 | 0.328 | 0.407 | 0.407 |
| C13 | 0.000 | 0.000 | 0.000 | 0.265 | 0.328 | 0.328 |
| C21 | 0.495 | 0.300 | 0.588 | 0.000 | 0.000 | 0.000 |
| C22 | 0.099 | 0.100 | 0.089 | 0.000 | 0.000 | 0.000 |
| C23 | 0.407 | 0.600 | 0.323 | 0.000 | 0.000 | 0.000 |
Table 3.
Limit super-matrix.
| C11 | C12 | C13 | C21 | C22 | C23 | |
|---|---|---|---|---|---|---|
| C11 | 0.164 | 0.164 | 0.164 | 0.164 | 0.164 | 0.164 |
| C12 | 0.186 | 0.186 | 0.186 | 0.186 | 0.186 | 0.186 |
| C13 | 0.150 | 0.150 | 0.150 | 0.150 | 0.150 | 0.150 |
| C21 | 0.225 | 0.225 | 0.225 | 0.225 | 0.225 | 0.225 |
| C22 | 0.048 | 0.048 | 0.048 | 0.048 | 0.048 | 0.048 |
| C23 | 0.227 | 0.227 | 0.227 | 0.227 | 0.227 | 0.227 |
Table 4.
FANP calculation results.
| Factor | Roof Lithology | Coal Seam Depth | Coal Seam Dip | Stope Width | Mining Method | Mining Height |
|---|---|---|---|---|---|---|
| Weight | 0.164 | 0.186 | 0.150 | 0.225 | 0.048 | 0.227 |
Table 5.
Height data of water-conducting fracture in the western mining.
| Serial No. | Mine Name | Working Surface | Stope Width/m | Mining Height/m | Two Zones Height/m | H-T Ratio |
|---|---|---|---|---|---|---|
| 1 | Daliuta Coal Mine | 52,304 | 147.5 | 6.44 | 68.76 | 10.7 |
| 2 | Daliuta Coal Mine | 52,306 | 301 | 7 | 137.32 | 19.6 |
| 3 | SDIC Chahasu Coal Mine | 3103-2 | 300 | 5.1 | 63.1 | 12.4 |
| 4 | Bulianta Coal Mine | 12,511 | 319.1 | 8 | 124.42 | 15.6 |
| 5 | Bulianta Coal Mine | 31,401 | 265 | 5.92 | 147.2 | 24.9 |
| 6 | Tai’an Coal Mine | 6103 | 195 | 6 | 63.4 | 10.6 |
| 7 | Shangwan Coal Mine | 51,201 | 155 | 5.8 | 73 | 12.6 |
| 8 | Burtai Coal Mine | 42,106 | 216 | 6.6 | 80.52 | 12.2 |
| 9 | Zhangjiamao Coal Mine | 15,204 | 300 | 6 | 75.6 | 12.6 |
| 10 | Chenjiagou Coal Mine | 3202 | 98 | 10.79 | 134.98 | 12.5 |
| 11 | Duolun GCL Coal Mine | 1703-1 | 120 | 9.58 | 112 | 11.7 |
| 12 | Jinjitan Coal Mine | 101 | 300 | 5.5 | 108.59 | 19.7 |
| 13 | Hanglai Coal Mine | 30,101 | 300 | 7.5 | 112.6 | 15 |
| 14 | Binchang Coal Mine | 101 | 116 | 7.4 | 96.4 | 13 |
| 15 | Wangpo Coal Mine | 3202 | 180 | 5.89 | 104.92 | 17.8 |
| 16 | Mindong Coal Mine | L3414 | 196 | 7.7 | 79.78 | 10.4 |
Table 6.
Optimal prediction scheme accuracy.
| Optimization Algorithm | Error Cost c | Kernel Function Parameters g | MAE% | MSE% |
|---|---|---|---|---|
| PSO-cg | 29.2697 | 0.1 | 9.51 | 14.66 |
| Grid-cg | 9.1896 | 0.027205 | 16.73 | 19.32 |
| GA-cg | 5.0331 | 0.031567 | 40.16 | 61.59 |
| GA-cgp | 14.9429 | 1.4256 | 17.26 | 23.85 |
Table 7.
Predicted value by PSO-SVM model.
| Drill No. | Mining Height/m | The Two Zones Height/m |
|---|---|---|
| ST-01 | 5.51 | 78.47 |
| ST-02 | 2.32 | 28.51 |
| ST-03 | 5.89 | 65.06 |
| ST-04 | 4.12 | 49.14 |
| ST-05 | 6.11 | 74.18 |
| ST-06 | 5.92 | 67.09 |
| ST-07 | 5.57 | 61.43 |
| ST-08 | 6.72 | 82.95 |
| ST-09 | 4.98 | 55.72 |
| ST-10 | 6.02 | 69.08 |
| ST-11 | 6.43 | 79.11 |
| ST-12 | 4.68 | 52.03 |
| ST-13 | 6.24 | 75.94 |
| ST-14 | 6.72 | 65.32 |
| ST-15 | 6.01 | 67.43 |
| ST-16 | 6.42 | 78.05 |
| ST-17 | 5.86 | 63.98 |
Publisher’s Note: MDPI stays neutral with regard to jurisdictional claims in published maps and institutional affiliations. |
© 2022 by the authors. Licensee MDPI, Basel, Switzerland. This article is an open access article distributed under the terms and conditions of the Creative Commons Attribution (CC BY) license (https://creativecommons.org/licenses/by/4.0/).
Share and Cite
MDPI and ACS Style
Zheng, Q.; Wang, C.; Liu, W.; Pang, L. Evaluation on Development Height of Water-Conduted Fractures on Overburden Roof Based on Nonlinear Algorithm. Water 2022, 14, 3853. https://doi.org/10.3390/w14233853
AMA Style
Zheng Q, Wang C, Liu W, Pang L. Evaluation on Development Height of Water-Conduted Fractures on Overburden Roof Based on Nonlinear Algorithm. Water. 2022; 14(23):3853. https://doi.org/10.3390/w14233853
Chicago/Turabian StyleZheng, Qiushuang, Changfeng Wang, Weitao Liu, and Lifu Pang. 2022. "Evaluation on Development Height of Water-Conduted Fractures on Overburden Roof Based on Nonlinear Algorithm" Water 14, no. 23: 3853. https://doi.org/10.3390/w14233853
Note that from the first issue of 2016, this journal uses article numbers instead of page numbers. See further details here.