

Field-Monitoring Sediment Basin Performance during Highway Construction


1
School of Civil and Environmental Engineering, Oklahoma State University, Stillwater, OK 74078, USA
2
Department of Civil and Environmental Engineering, Auburn University, Auburn, AL 36849, USA
3
Department of Concrete and Construction Management, Middle Tennessee State University, Murfreesboro, TN 37130, USA
4
Department of Civil and Environmental Engineering, Michigan State University, East Lansing, MI 48824, USA
*
Author to whom correspondence should be addressed.
Water 2022, 14(23), 3858; https://doi.org/10.3390/w14233858
Submission received: 31 August 2022
/
Revised: 13 November 2022
/
Accepted: 19 November 2022
/
Published: 27 November 2022
(This article belongs to the Special Issue Water Quality Modeling and Monitoring)
Abstract
:Stormwater regulations require erosion and sediment control practices to be implemented during construction to prevent discharging polluted water offsite and mitigate downstream effects. Sediment basins are a common practice used to detain suspended sediment from stormwater runoff by providing residence time and storage to promote gravitational settling. Sediment basin design, and thus pollutant removal efficiency, vary regionally due to local design standards and preferences. This manuscript presents the results of a case study from Highway U.S. 30 construction in Tama County, Iowa, USA where two sediment basin systems were created within a conveyance channel by constructing an earthen berm across the channel to detain sediment-laden stormwater. A dewatering riser pipe was routed through the earthen berm to provide primary dewatering. The in-channel sediment basin was constructed with a 3% slope and a 10 ft. bottom width. The first system consisted of one basin created by a single earthen berm damming sediment-laden runoff, whereas the second system included two earthen berms, creating two in-channel sediment basins in series. Field monitoring was conducted on in-situ basins by deploying a rain gauge and automated water samplers positioned at the inflow and discharge points of a (a) single basin and (b) two basins in series within a roadside channel. During the monitoring period, no maintenance or dredging was recorded. Water samples were taken from the monitored basins at regular time intervals and analyzed for turbidity. Inflow turbidities often reached magnitudes up to the 103 NTU and discharge samples indicated negligible turbidity reduction after residence. On several occasions, the in-channel sediment basins acted as a sediment source, with discharge turbidities measuring higher than inflow. Despite their initial performance, there was interest in improving the in-channel basin design due to the potential to maximize length-to-width flow ratios, and use of existing infrastructure, which reduced the amount of right of way needed for basin construction, installation time and cost. As a result, several potential design improvements and techniques were recommended to enhance in-channel sediment basin performance.
1. Introduction
Increased urbanization and development under the pressures of a changing climate, has fueled discussion, regulation, and research around stormwater management. In many areas of the United States, one effect of climate change has taken form in more intense or frequent storms, yielding increased stormwater runoff events [1]. Although there are unique challenges faced in every stage of land development to preserve and protect water resources, stormwater runoff poses a significant threat during earthwork when bare soil is exposed, expediting overland erosion processes [2,3]. As a result, sediment and sorbed pollutants can become entrained in stormwater runoff and discharged into receiving waterways such as creeks, streams, and rivers resulting in potentially profound environmental and economic consequences [3,4,5,6,7,8]. Under the U.S. Clean Water Act’s Construction General Permit, construction operators must develop a Stormwater Pollution Prevention Plan (SWPPP) outlining sensitive site areas, key personnel, mitigation strategies, and an erosion and sediment control (ESC) plan to minimize the risk of pollution into receiving waters [2].
In the U.S., State Departments of Transportation (DOTs) are major operators of linear construction and are regulated for stormwater discharges from their sites. Due to the nature of linear construction, there are many outfall areas that may discharge polluted stormwater from the construction site. To mitigate sediment discharge and downstream effects, state DOTs have a set of ESC standards that are used throughout their state; however, ESC design guidance and standards vary from region to region [9,10,11,12,13,14]. The designs between these guides, and thus the performance of an ESC practice, are widely variable. Traditionally, rules of thumb are used in ESC design and accepted as “best” management practices; despite “best” efforts, waters in the U.S. have remained at risk from sediment pollution. Depleting water quality and increased regulations for poor stormwater and pollution management induced from enforcement agencies has spurred testing, research, training, and education within the ESC field. In the past decade, research efforts have been conducted to answer the call for scientifically backed data on the design, implementation, and maintenance of ESC practices [15,16,17,18,19,20,21,22].
Detention practices, such as temporary sediment basins, are commonly implemented prior to discharge to capture pollutants such as suspended solids through gravitational settling and attenuate discharge flow rates [21,23,24]; subsequently, sediment basins often have the secondary benefit of capturing nutrients, heavy metals, and organic compounds, which may be sorbed to the sediment, prior to discharge. Sediment basin design is based on Stoke’s Law for settling solids and assumes a spherical particle when calculating settling; however, this is an estimation, as particle sizes and shapes are not always consistent with spheres or ellipsoids [25].
Although sediment basins are heralded within the construction industry as an effective practice, performance is dependent on the design, installation, and maintenance strategies and site application. Sediment capture within a basin is dependent on design parameters such as geometry, sizing, and dewatering and site characteristics including soil type, rainfall distribution, topography, area of disturbance, and right-of-way. At a minimum, a temporary sediment basin should include an inflow structure, settling pond, dewatering structure, and auxiliary spillway. Many DOTs also include components such as surface dewatering, energy dissipation, and chemical treatment in their sediment basin design standards [10,14,26]. The most common method to achieve surface dewatering is through the use of a floating skimmer, that dewaters the storage volume from the top of the water column. Energy dissipation outside of the settling pond, such as a stabilized inflow channel or rock pad at the discharge outfall, is important to reduce erosion; however, energy dissipation within the basin may be used to increase the effective flow path and dissipate energy that may cause turbulence or resuspension of settled material. Coir flow baffles are most typically used, and installed across the width of the basin, perpendicular to the inflow path. When surface dewatering and coir flow baffles are used in conjunction with a chemical flocculant, sediment capture greatly increases [17,21,24]. Chemical flocculant promotes bonding of finer particles to create larger flocs that settle from suspension more rapidly. Flocculants may be introduced upstream of sediment basins, so that the flocs can settle within the basin before discharging offsite. When properly introduced, flocculant aids in sediment capture and is an important tool to achieve water quality standards, including TSS and turbidity limits. Turbidity, or the measure of cloudiness of the water, is caused by sediment runoff, but is often associated with higher concentrations of other water pollutants. As a benchmark, the USEPA requires drinking water to be always less than 1 Nephelometric Turbidity Unit (NTU) and must be less than 0.3 NTU in 95% of samples [27]. Turbidity thresholds for surface water and discharges vary from state to state; however, in Iowa, the turbidity of a receiving water must not be increased by more than NTU by a point of discharge [28].
1.1. Background
Currently, the U.S. Environmental Protection Agency (USEPA) Construction General Permit allows for sizing sediment basins using one of two methods: (a) the calculated volume of runoff from a local 2 y, 24 h design storm, or (b) 252 m3 (3600 ft3) of storage per hectare (acre) drained into the basin [2]. The two design methods may result in significantly different volumes required depending on local hydrology. Basins should be designed long and narrow to optimize settling across the flow length. Typically, a minimum length to width ratio of 2:1 is recommended [29]. Sediment basin design must also include a primary and auxiliary spillway, utilized in overflow conditions to safely pass larger storm events, such as the 10 or 25 y storm event [26]. The primary spillway is required to dewater from the surface; however, the interpretation of “surface” dewatering is widely contested in the field.
As stormwater management has been increasingly regulated and received a greater emphasis from state DOTs, research evaluation of ESC practices has emerged in recent years. Excavated sediment basins, such as the examples from the Alabama (ALDOT), North Carolina (NCDOT), and Tennessee (TDOT) DOTs, have been evaluated in controlled studies with various design components to improve performance related to turbidity and total solids reduction [17,21,24,30]. Findings from these and similar research efforts have led to evolving sediment basin design. For example, TDOT, NCDOT, and ALDOT, are several examples of DOTs that include the use of surface skimmers for primary dewatering [10,14,31], which discharges the topmost layer of detained water where particles have dropped from suspension, as opposed to a traditional perforated riser structure that dewaters throughout the water column. Additionally, the NCDOT and ALDOT divide sediment basins into four equal bays through implementation of three coir flow baffle rows to dissipate flow velocity, reducing turbulence and resuspension of settled material [10,14]. ALDOT also includes an excavated forebay, which consists of an excavated sump and riprap ditch check in the inflow channel to capture rapidly settable solids, while only subjecting the larger basin to receive smaller grain-sized particles. The inlets are armored, and the basins are typically lined with a geotextile or established vegetation to prevent erosion from occurring within the basin [10]. In the U.S., 39% of DOTs implement flocculant in upstream channels or practices to bond fine sized particles to create larger flocs that gravitationally settle more rapidly in a basin environment [32].
Sediment basins are typically employed on the edge of disturbed watersheds to capture suspended solids by providing residence time for captured runoff, promoting sedimentation prior to offsite discharge [30]. Site constraints, such as limited right-of-way, can impede appropriately sized and designed sediment basins or the implementation of sediment basins at all. One technique to navigate this constraint is to create a sediment basin within a roadside channel environment, first observed in the Iowa DOT ESC specifications [12]. In-channel basins utilize existing channels on-site to treat stormwater and provide an opportunity to maximize length-to-width flow ratios. As a result of the use of existing infrastructure, installation time and costs are reduced; however, minimal performance data exist.
This research effort aimed to evaluate and document the field performance of an in-channel sediment basin during active construction. This was achieved through two main goals: (1) develop a field-assessment protocol for existing in-channel sediment basins and (2) field monitoring of a single in-channel basin and two basins in-series throughout two construction seasons. Monitoring included recording site rainfall, water quality sampling for turbidity and total solids, and visual forensic observations of the in-channel sediment basin performance.
1.2. In-Channel Sediment Basin Design
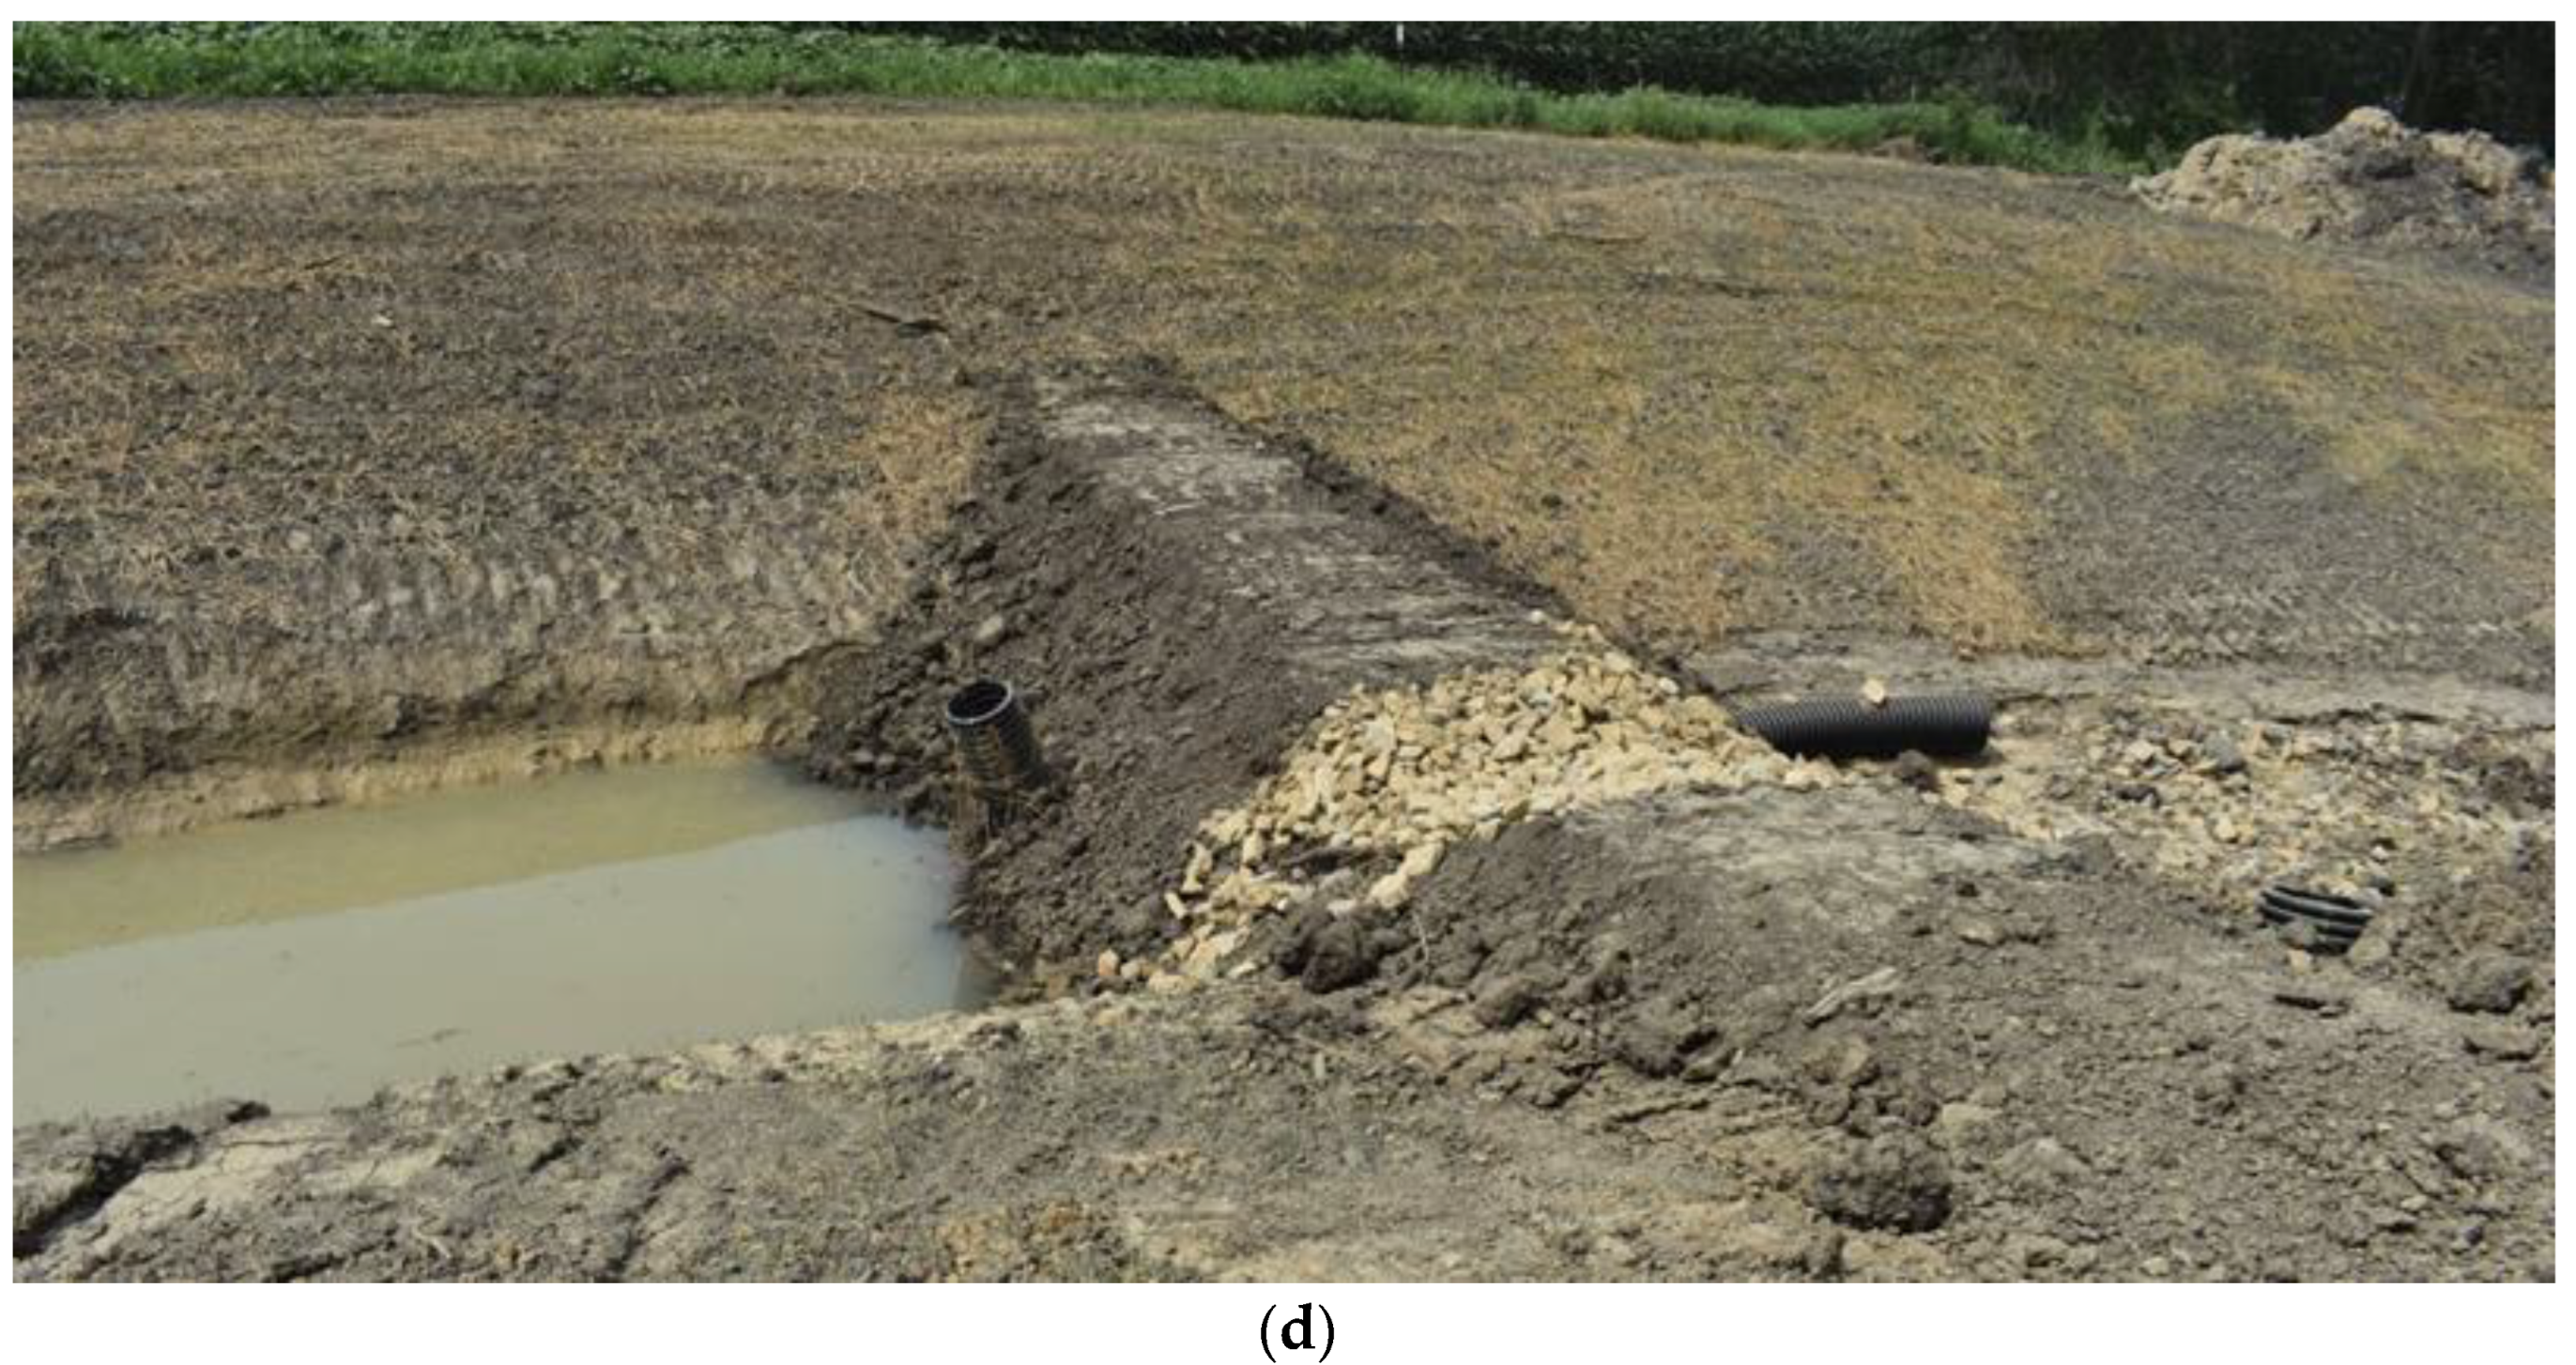
The Iowa DOT’s standard sediment basin detail is designed to create temporary detention within the typical channel environment. Iowa DOT design standards specify a trapezoidal channel with a horizontal (H) to vertical (V) ratio of 3.5H:1V foreslope, 3H:1V backslope, 3.0 m (10 ft) channel bottom, and 3% grade. The basin portion was constructed by excavating an additional 30 cm (12 in) and using the material to create an earthen berm. The berm spans the width of the basin and has a 1.2 m (4 ft) top length and is 1.2 m (4 ft) high at the midpoint of the berm. Side slopes are 1H: 2V. Situated along the berm, a 1.2 m (4 ft) wide by 15 cm (6 in) deep spillway allows runoff to bypass the sediment basin when the volume capacity is exceeded. The spillway is armored with nominal 15.2 cm (6 in) stone to prevent scour during overtopping events. A 1.2 m (4 ft) stone armored apron extends beyond the toe of the berm along the downstream face of the sediment basin. A 30 cm (12 in) diameter corrugated riser pipe is installed through the berm. The upstream face of the dewatering pipe is turned upward at a 90-degree bend to create a riser structure at the end of the sediment basin. The top of the riser pipe has four sets of three 2.5 cm (1.0 in) orifices. The sets of orifices occur every quarter-turn for a total of 12 perforations. The top orifice elevation is 5 cm (2.0 in) from the top of the riser pipe, and the remaining orifices are spaced 5 cm (2.0 in) on center [12]. The sediment basin design standard and photo of a field installation is shown in Figure 1.
2. Materials and Methods
Two separate sediment basin systems were evaluated through this study: (1) single sediment basin and (2) two sediment basins in series. The in-channel sediment basins were constructed and evaluated for field performance during construction of the U.S. Highway 30 Expansion in Tama County, Iowa, during the 2018 and 2019 construction seasons. In total, the expansion spanned 19.3 km (12 mi) and involved 3.44 million m3 (4.5 million yd3) of grading and relied on sediment basins to capture sediment before discharge. Construction of the expansion required abandoning two operational lanes and constructing four lanes with accompanying shoulders and median to accommodate increased traffic flow throughout the U.S. 30 corridor between Ames and Cedar Rapids, Iowa.
Initial site visits identified locations and conditions of existing sediment basin systems. Site soils and the respective particle size distributions were important factors in understanding the settling behavior within the basin, as fine-grained soils such as silts and clays would stay suspended longer than coarse grained soils. During initial site visits, soil samples were collected from the upper most layer of exposed soil (top 7.6 cm (3 in)) within the operational sediment basins and classified according to the Unified Soil Classification System (USCS). To classify these soils, dry and wet sieve analyses, Atterberg limits test, and hydrometer analyses were conducted according to ASTMs C136/C136M-19, D4318-00, and D7928-17, respectively [33,34,35,36].
A field-monitoring plan was then devised to collect (1) rainfall depth, (2) influent water quality samples, (3) effluent water quality samples, and (4) regular visual observations. A multi-faceted research team, including scientists, state highway agency personnel (Iowa DOT), and site contractors coordinated to identify and instrument a newly constructed sediment basin, located approximately 11.3 km (7 mi) into the project. The sediment basin was constructed by site contractors according to the Iowa DOT standard sediment basin detail [12]. There was no known maintenance conducted on the basin throughout the monitoring.
Rainfall depth and water sampling was conducted using Teledyne™ ISCO 6712 (Lincoln, NE) automated water samplers. Water samplers were deployed to collect samples at a sediment basin’s inflow and discharge. Rainfall was recorded using an ISCO 674 rain gauge connected to the ISCO-6712 sampler (Lincoln, NE, USA). Samplers were housed in constructed 1.52 m long by 0.61 m wide by 1.22 m tall (5 ft long by 2 ft wide by 4 ft tall) plywood lockboxes to prevent vandalism and theft. A 12V deep cycle marine battery was used to power each sampler and placed inside each housing with a sampler. A 36-cell, 50-watt solar panel was mounted to the top of each housing to charge the 12V batteries.
Samplers were programmed to take 0.75 L (25 oz) samples from the basin at regular intervals of 12 h. The intake of each sampler hose was secured to a PVC float to ensure water samples were pulled from the top of the water column, which was presumably the cleanest water due to settling. Water samples were analyzed for turbidity and total solids at inflow and discharge locations. Samples from the inflow and discharge locations were compared to evaluate turbidity and total solids after detention in the basin. Turbidity was measured using a Hach 2100 Q (Loveland, CO, USA) portable turbidimeter, which had a maximum turbidity reading of 1000 NTU. If the turbidity reading of a sample was higher than 1000 NTU, the sample was diluted with deionized (DI) water until a measurement reading was achieved. Total solids testing was conducted following ASTM D3977-97 following Test Method, A, the evaporation test method [36]. The evaporation test method involves allowing sediments to settle and decanting the supernatant. The settled sediment, or total solids, is then dried and weighed. The volume of the supernatant is measured, and a subsample is used to determine a dissolved-solids correction factor [36]. In addition to measured parameters, visual inspections were conducted during site visits for water sample collection. Visual inspections documented practice deficiencies, sedimentation patterns, and general observation notes.
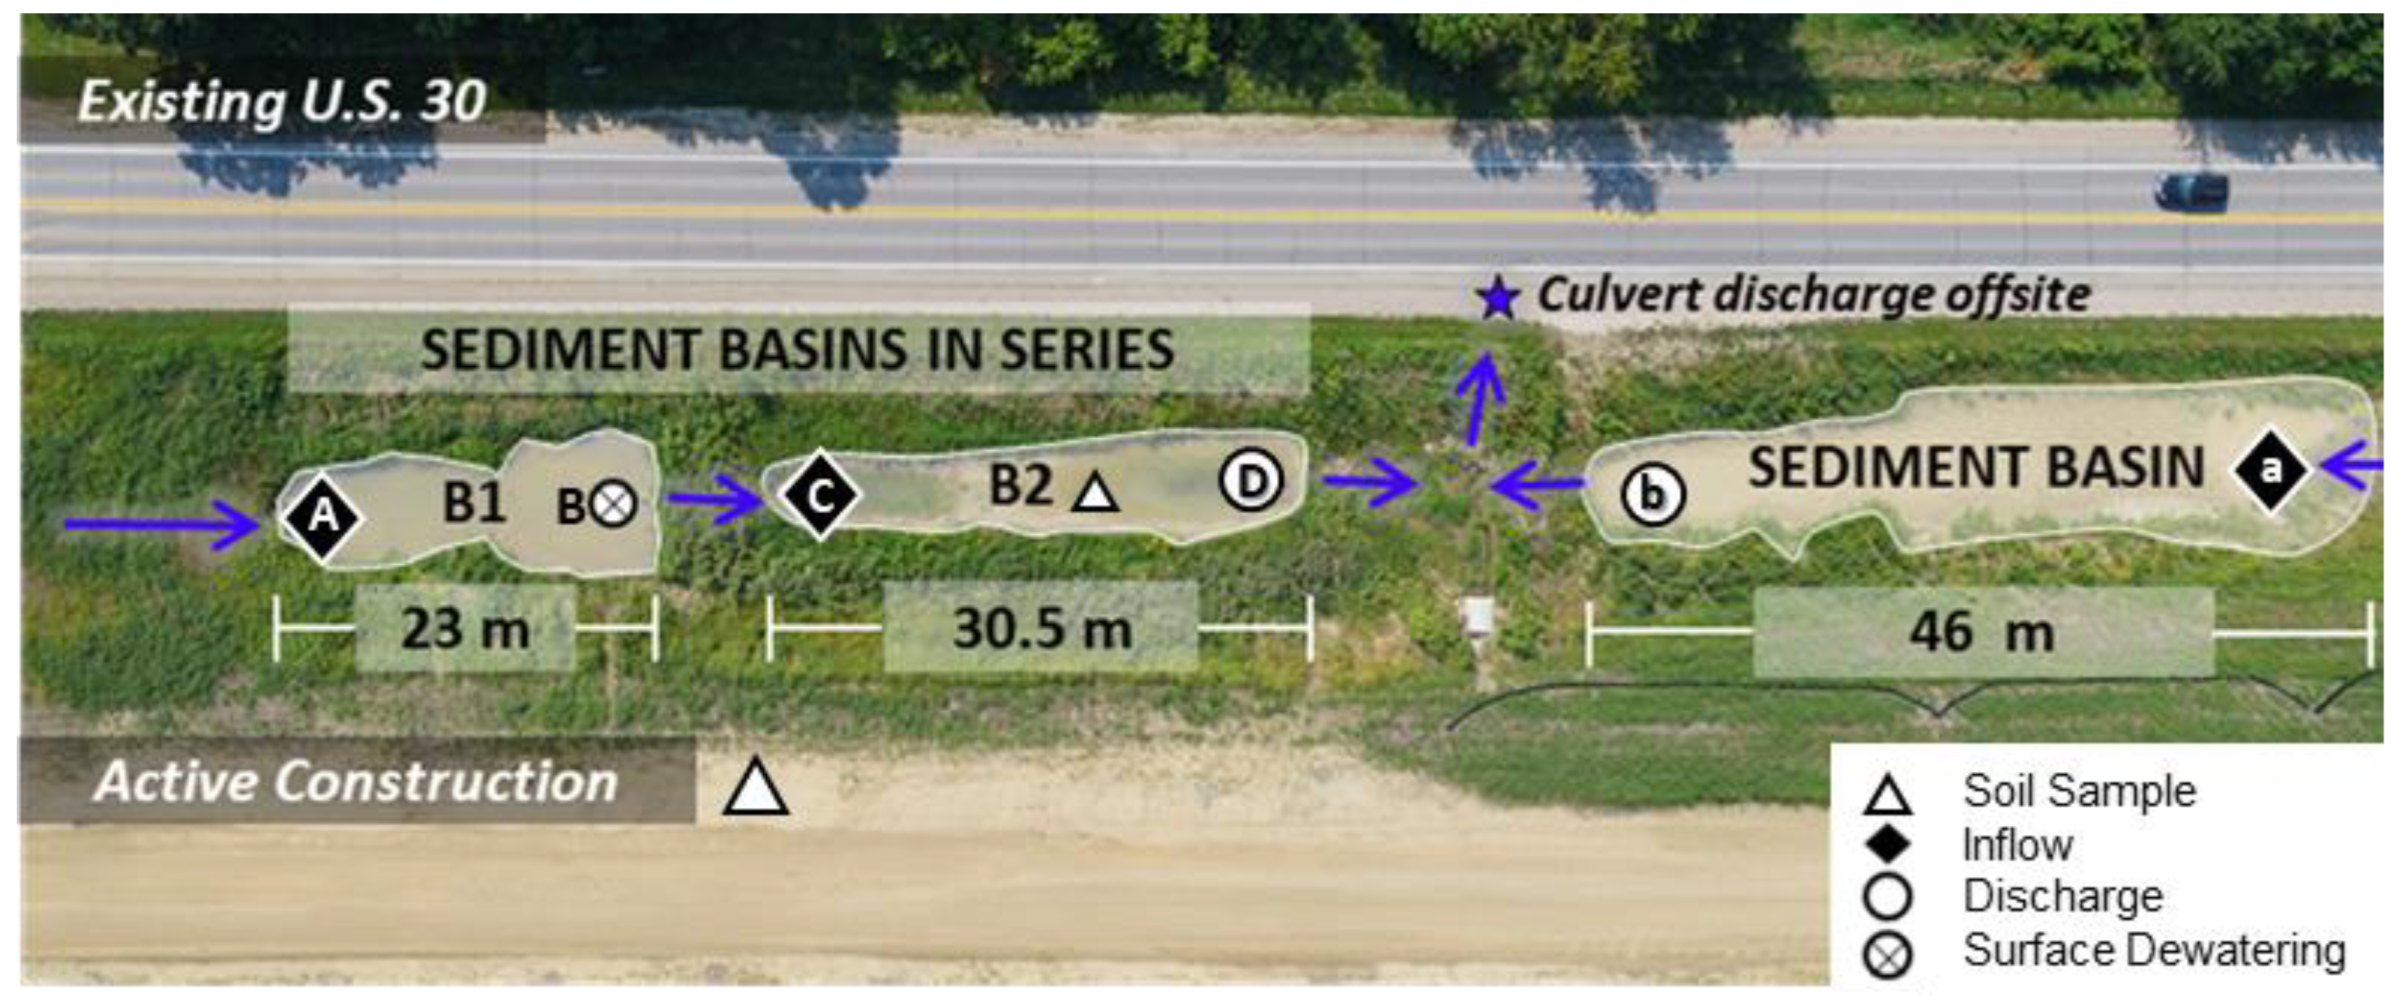
Monitoring was conducted on the single basin system for six weeks between September and October of 2018. The single basin had two sampling locations: (a) in the inflow channel and (b) the t-post that secured the dewatering riser pipe at discharge. The basin had a flow path of approximately 45.7 m (150 ft) from inflow to discharge and had a receiving drainage area of 0.38 ha (0.95 ac). The sampling locations of the single basin system are shown in Figure 2. Monitoring was discontinued in the third week of October as freezing temperatures became consistent in the season and hindered sampling.
Monitoring was renewed on two-basins in series in May 2019 and continued through September 2019. In total, the series system at four sampling locations: (A) in the inflow channel, (B) at the t-post that secured the dewatering riser pipe at discharge of the first basin, which hydraulically connected to the second basin, (C) floating above the discharge of the riser pipe at the inflow of the second basin, and (D) the t-post that secured the dewatering riser pipe at discharge of the second basin, which discharged offsite. All samples were collected from the surface of the water column using floating sampling devices, which presumably had the lowest sediment concentrations considering gravitational settling. Despite the basins being hydraulically connected through the riser outlet of the first basin (location B and C), samples were collected at both locations. Sampler B collected samples at the surface of the water column nearest the discharge of the first basin, which would be reflective of a decanting outlet structure; however, the riser outlet structure allowed the first basin to dewater throughout the depth of the water column. Sampler C collected samples at the surface nearest the inflow of the second basin, which was assumed to be representative of discharged water quality from the riser outlet structure. Due to surface sampling at both locations, B and C provided a subset of data, which allowed to make an indirect comparison of effluent discharged through a surface dewatering device or perforated riser structure.
The first and second basins in the series had flow paths of approximately 22.9 m (75 ft) and 30.5 m (100 ft), respectively. The sediment basin collected a drainage area of 2.65 ha (6.56 ac). The sampling locations on the basins-in-series system are shown in Figure 2.
Total solids and turbidity were measured for each sample and plotted over time. Twenty-four-hour rainfalls were used to generate a hyetograph and plotted on the secondary y-axis. Both turbidity and total solids measurements were used to generate treatment ratios for accessible and standardized evaluation of the sediment basins and followed similar methods documented in Whitman et al. [37] and Perez et al. [38]. The treatment ratios were calculated by dividing the discharge water quality measurement (e.g., turbidity (NTU) or total solids concentration (mg/L)) by the same inflow water quality measurement; thus, treatment ratios less than 1.0 indicated an improvement in water quality (i.e., turbidity reduction) as flow passed through the basin. Values below 1.0 are the desired result in basin design. In contrast, values greater than 1.0 indicated a decrease in water quality (i.e., turbidity increase) as flow passed through the basin. The treatment ratios for turbidity and total solids are shown in Equation 1 and 2, respectively.
The treatment ratio (TR) for the single basin compares water quality at discharge location (b) with inflow location (a). Several comparisons were made for the basins in series:
- ▪
- The Basin 1 TR compared location B with A,
- ▪
- Basin 2 TR compared location D with C
- ▪
- Discharge TR compared location D with A
- ▪
- Outlet TR compared location C with B
3. Results
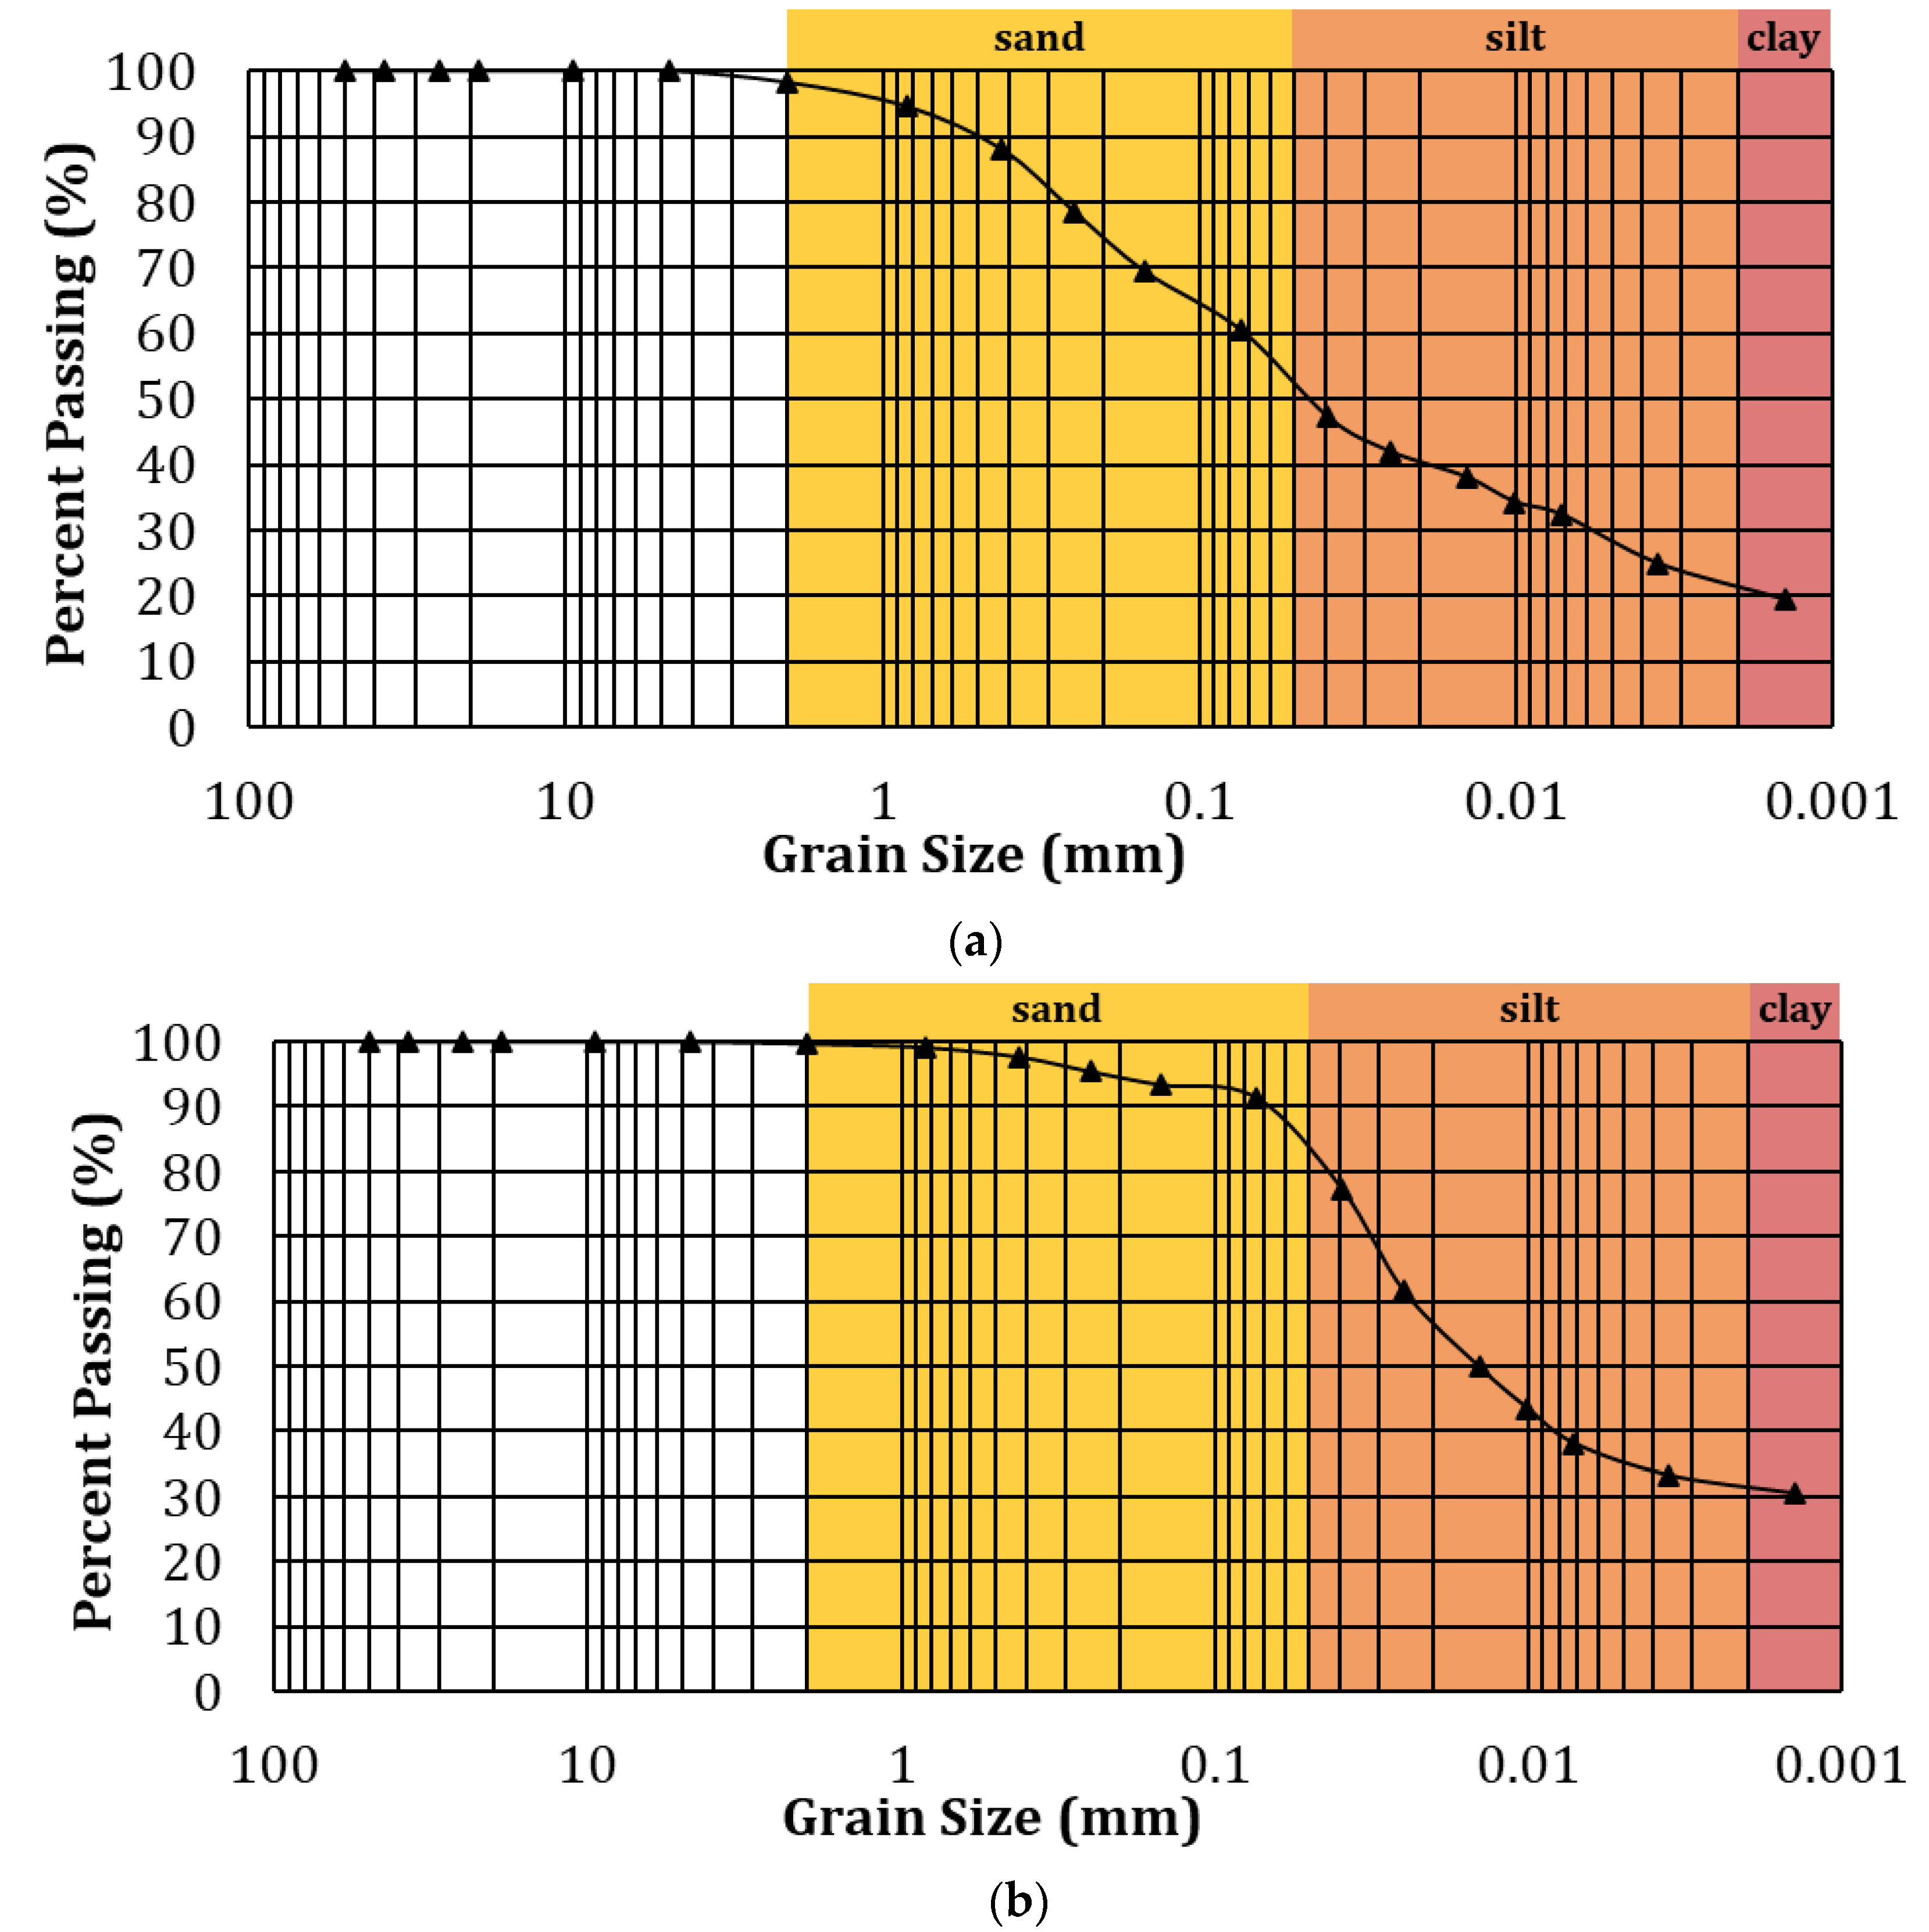
During initial site visits, sediment basin locations were identified, and site soil samples were collected from (a) site grade and (b) dredged material from in situ sediment basins. Samples collected from the site grade were classified as sandy lean clay and the dredged material was classified as a lean clay, according to the USCS. Due to the high silt and clay fractions in the site soil, which were more likely to remain suspended in the water column, turbidity was the primary unit of measurement for water quality samples. Soils sampled from the deposited material in the basin and site prior to grading had plasticity indices of 18.7 and 19, respectively. Basin materials had a liquid limit of 46.3, whereas site materials had a liquid limit of 35.6. The soil gradation for the two sample locations is shown in Figure 3. The NRCS Web Soil Survey was used to determine the hydrologic soil group of the soils [39]. The soils were determined to belong to hydrologic soil group C, indicating a low permeability and high potential for runoff.
3.1. Single Basin
Initial monitoring occurred on a temporary sediment basin from 21 September 2018, through 16 October 2018. During the monitoring period, 18.8 cm (7.40 in) of cumulative rainfall occurred over the drainage area captured by the basin. In total, there were seven qualifying events, which were considered as an event with at least 0.65 cm (0.25 in) of cumulative rainfall within a 24 h period. Based on the hydrologic soil characteristics, rain events of less than 0.65 cm (0.25 in) on the site were not expected to produce enough runoff to affect the basins. The qualifying storm events and turbidity measurements from the closest sample time are displayed in Table 1.
Blank measurements indicated dry or contaminated samples that could not be used for comparisons. Dry samples could have occurred due “beached” sampling intakes or programmatic issues with the automated samplers. During the seven captured events, there were 68 viable water samples for comparison of water quality at inflow and discharge of the basin (34 inflow, 34 discharge). Water samples from the inflow and discharge locations were compared to quantify the treatment efficiency of the sediment basin. However, inflow turbidity ranged between 43 and 7000 NTU and discharge turbidity ranged between 45 and 9200 NTU. The turbidity measurements only provided a snapshot in time of the basin performance. In many cases, turbidity values peaked several hours after the storm ceased. To standardize performance characterization of the basin, the results were reported using a turbidity ratio for each sample time.
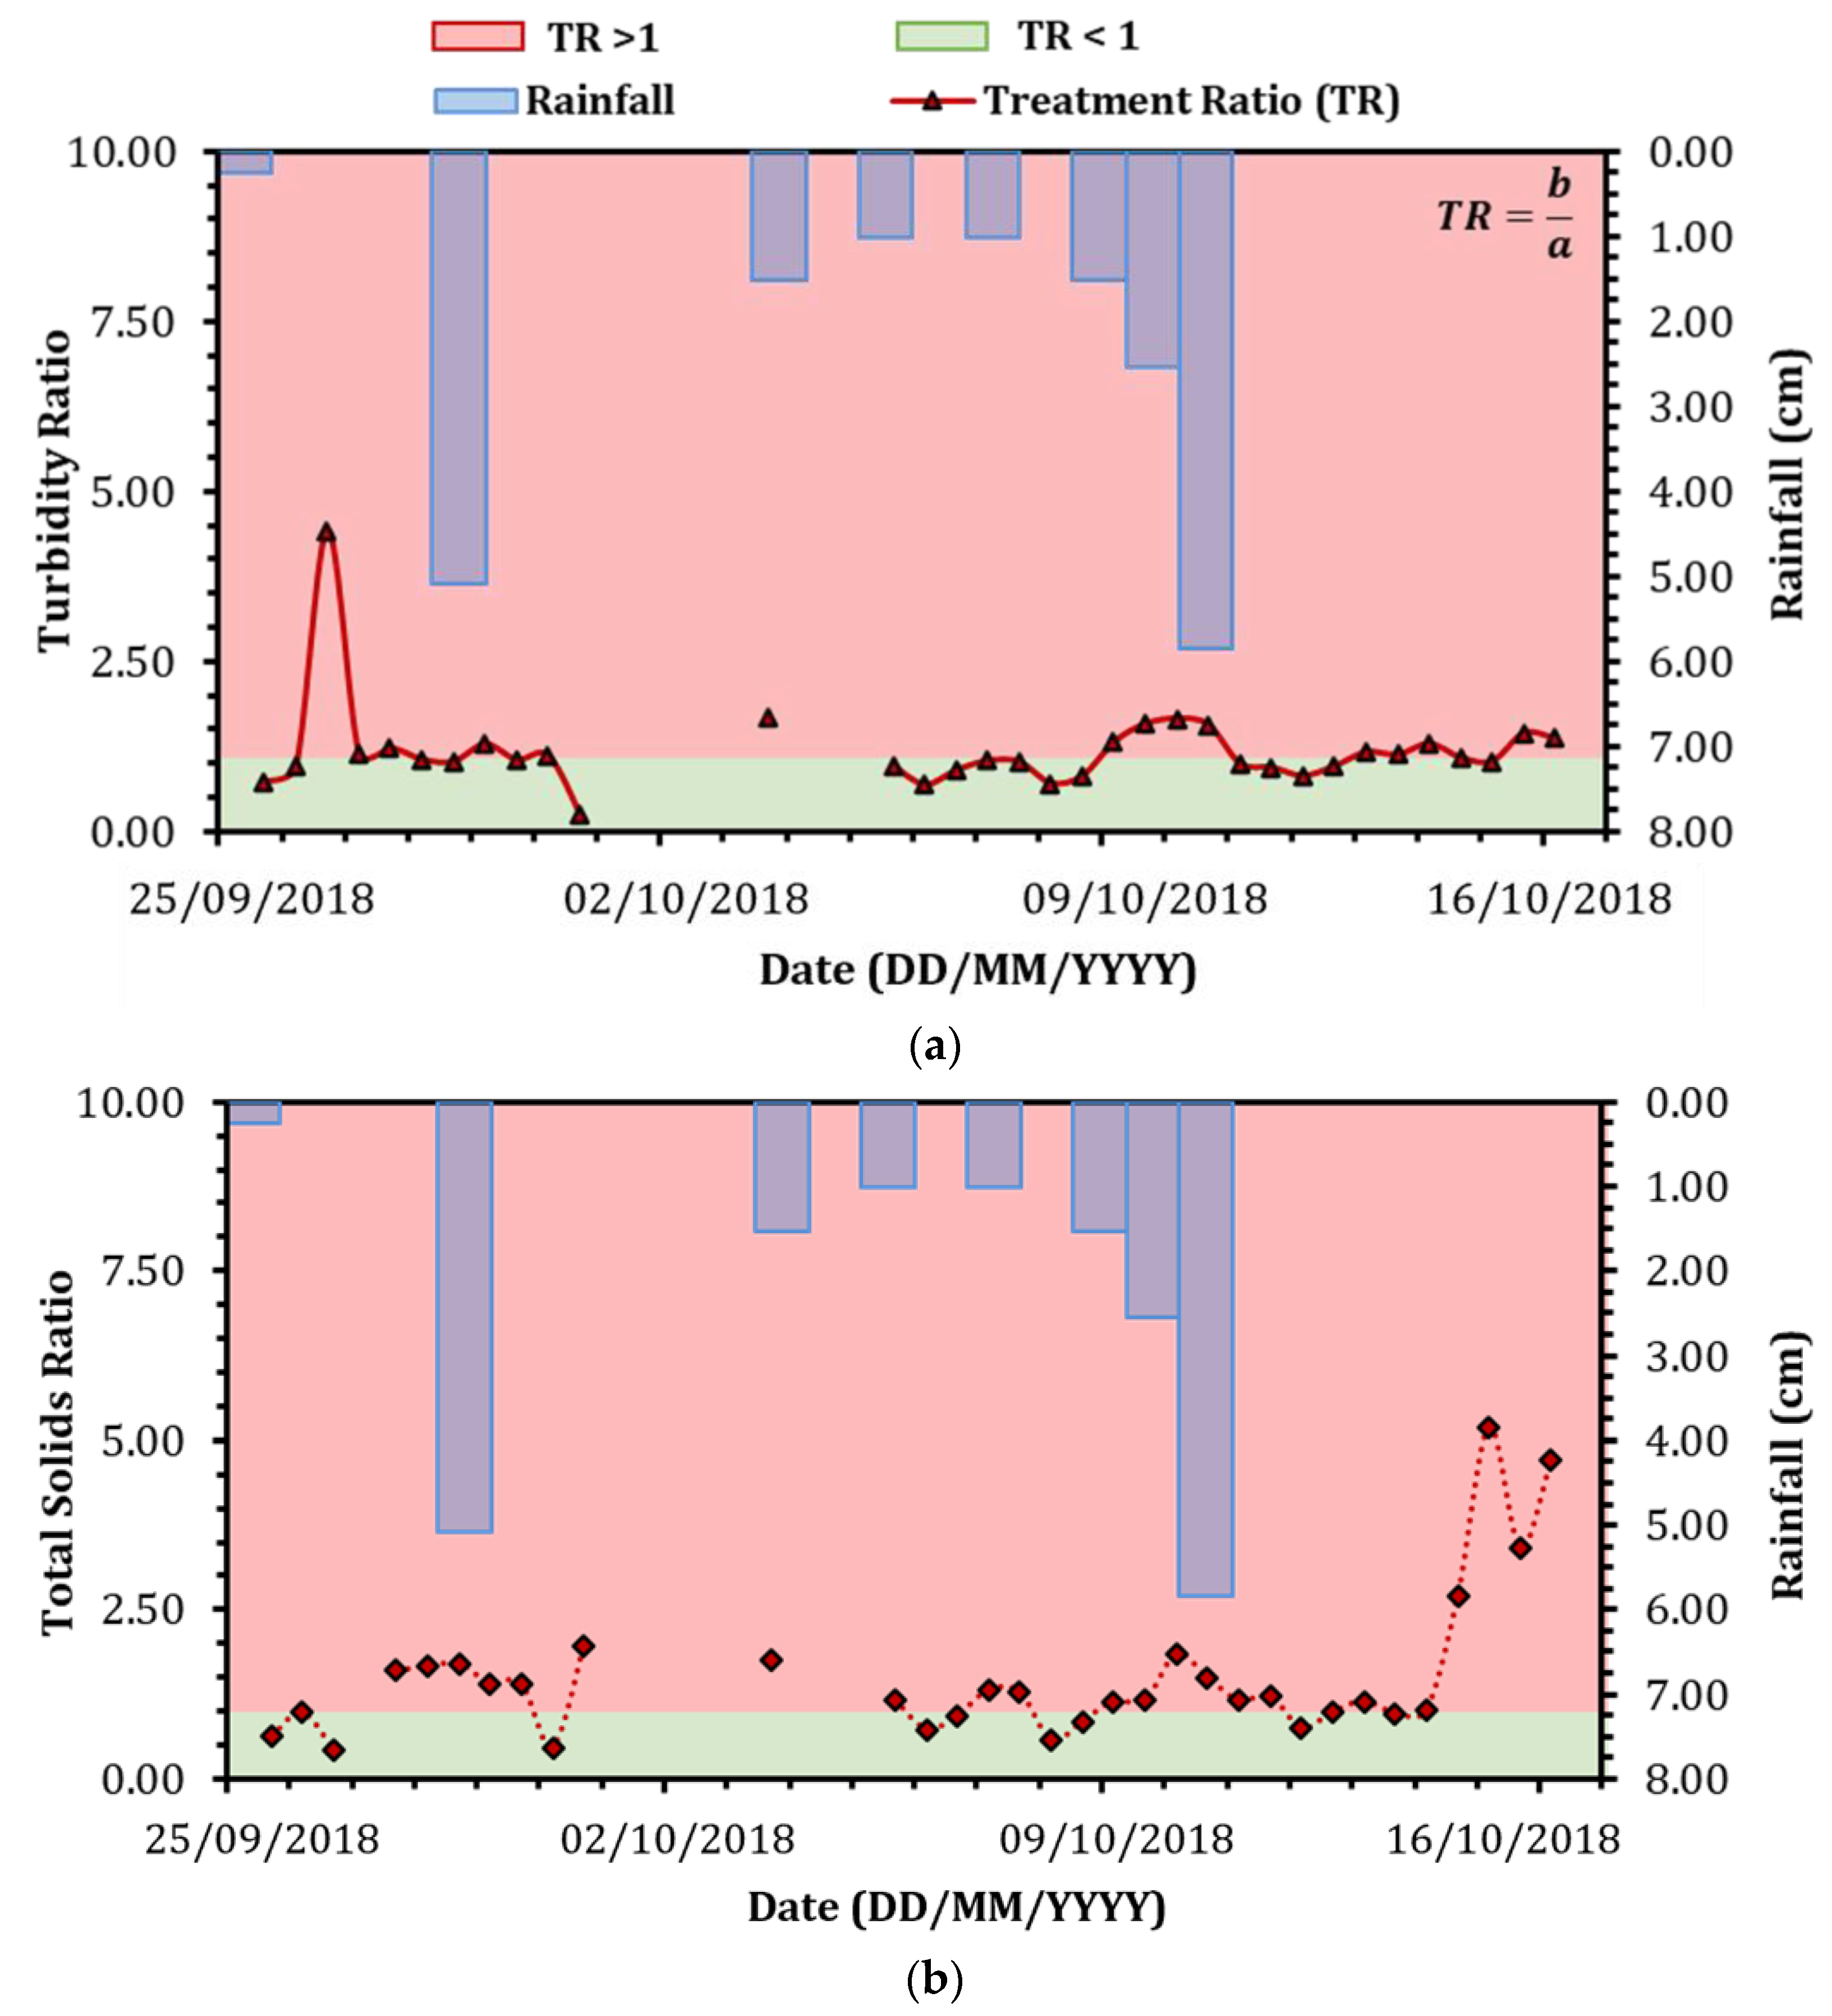
Throughout the 2018 monitoring season, total solids testing was also conducted on all the samples. A total solids ratio was generated, following the same process as turbidity. The sediment basin treatment ratios for turbidity and total solids from the first monitoring period are shown in Figure 4. There were several days in October (1st–6th), where the autosampler did not have samples. Field observations revealed that this was due to the intake host becoming beached, and thus unable to sample.
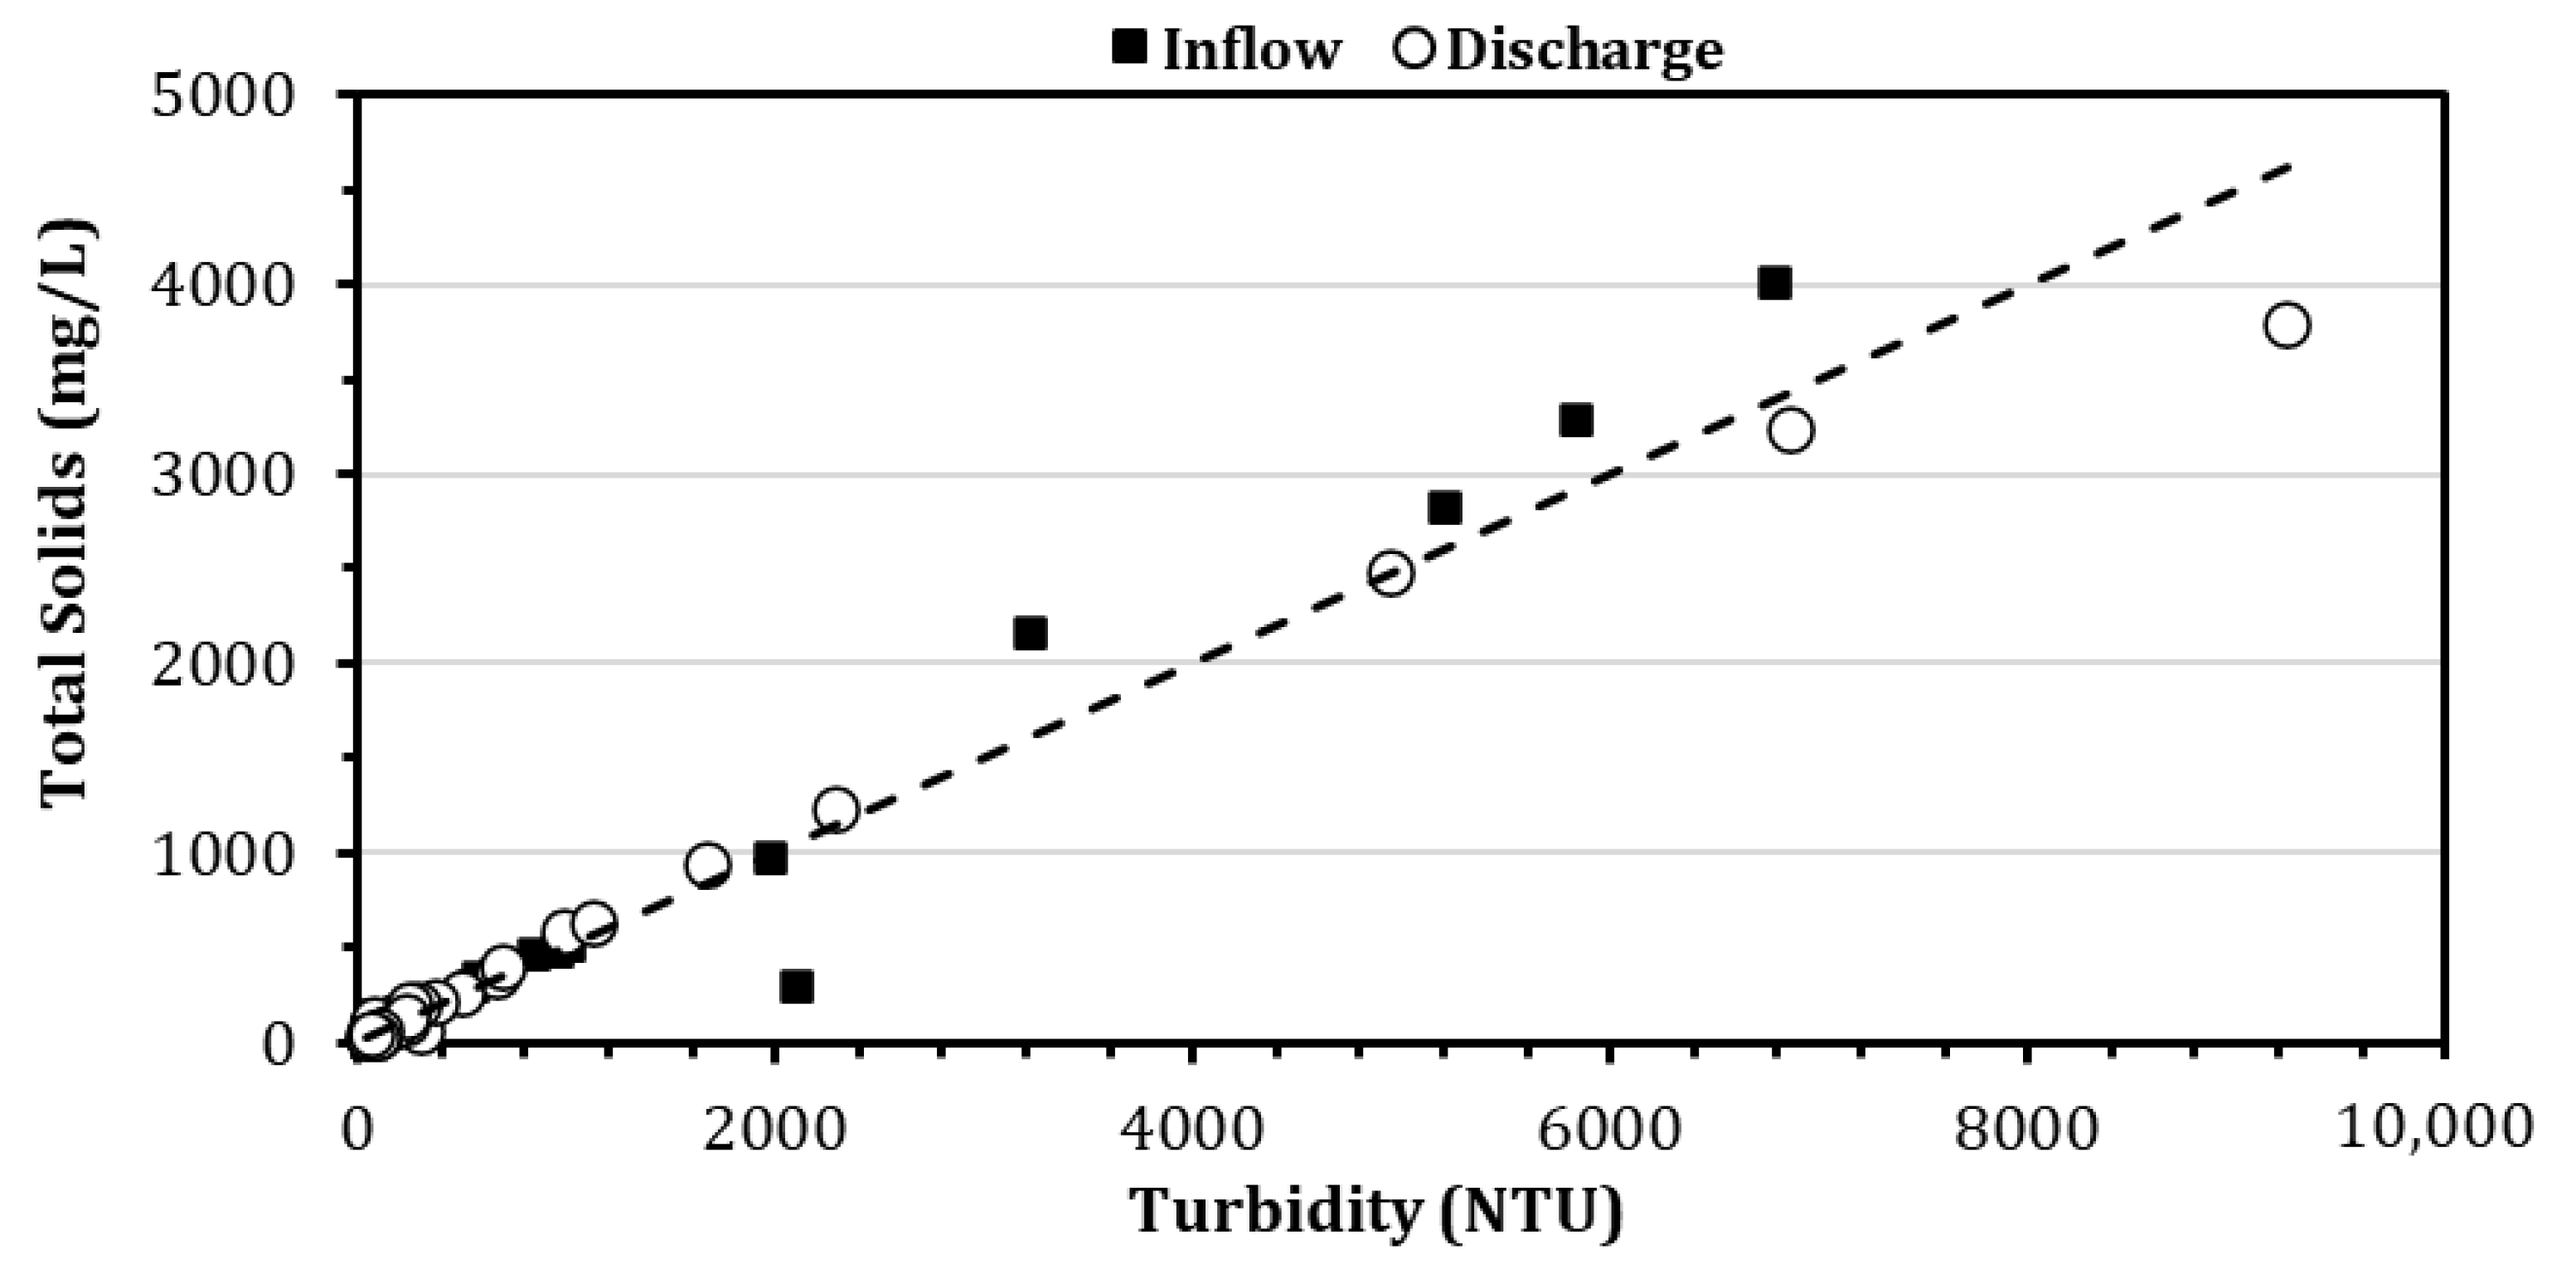
Visual observation of the treatment ratio trends for turbidity and total solids revealed similar trends after rainfall. For better comparison of the two water quality parameters, the measured values were plotted and evaluated for a relationship following laboratory analysis. The graphical comparison of the two parameters (turbidity and total solids concentration) from the 2018 construction season is shown in Figure 5. The observed relationship between turbidity and total solids was linear when set to have an intercept of zero. The resulting relationship is shown in Equation (3).
Developing a relationship between turbidity and total suspended solids concentrations, to estimate total solids concentrations, is a commonly used and well-documented method in water quality analysis [17,37,40,41,42,43,44]. Fang et al. [17] conducted a similar analysis for a rain event encountered during field monitoring in Franklin County, AL, but determined a TSS–turbidity relationship at inflow and outflow, independently. The determined relationship at outflow (TSS = 0.4287 NTU) was within 10% of the relationship described in Equation (2). However, Fang et al. [17] determined another linear relationship at inflow (TSS = 0.9193 NTU), which resulted in nearly double the TSS concentrations as described in Equation (2). The relationships are not always linear and may require calibration. However, under various storm events, the linear relationship from samples taken during the 2018 construction season resulted in an R2 value of 0.96. The R2 indicated a strong relationship between the two water quality parameters for the samples from U.S. 30 sampling site.
Therefore, in the 2019 construction season, total solids concentrations were not directly measured, but rather estimated from Equation (2). The estimation procedure for total solids from measured turbidity values allowed for more samples to be taken, transported from the sampling site, and processed in the laboratory; however, turbidity was the water quality reporting mechanism, following the primary inspection parameter for ESC applications [38].
3.2. Sediment Basins In-Series
In the next construction season of 2019, monitoring efforts were shifted to a system referred to as sediment basins in series. The two monitored basins were hydraulically connected via a corrugated pipe through an earthen berm, which separated the impoundments. The riser pipe served as the outlet structure of the first basin and designated inflow of the second basin. The first basin had a flow path of 22.9 m (75 ft), and the second basin had a flow path of 30.5 m (100 ft). Prior to this field-monitoring effort, the performance of basins in series was not well documented; however, an early monitoring study suggested that sedimentation increased if the length to width flow path was maximized [44]. Monitoring the system of basins aimed to determine if it was better to maximize the length to width flow or split the basins into two. It was suspected that the first basin was acting as a forebay to capture rapidly settable solids, and the second basin provided extended detention to settle finer particles, such as silts and clays.
The system was instrumented and monitored from 17 May 2019, through 1 September 2019. In total, there were 14 qualifying events during monitoring; events were numbered 8–22 to differentiate from the events captured during the single basin monitoring in the 2018 construction season. Events 8–22 are summarized in Table 2.
Throughout the sampling period, 802 viable water samples were collected (190 A-inflow, 192 B-discharge, 214 C-inflow, and 206 D-discharge). Water samples were only measured for turbidity after consideration of the quantity of samples, feasibility of laboratory measurements, and limited total solids concentration differences measured during 2018 monitoring effort. Like the single basin performance discussion, the measured turbidity from the water samples was only indicative of the basin performance at that time. Turbidity values ranged hours and days after storm events occurred. Turbidity value ranges at each location are shown in Table 3.
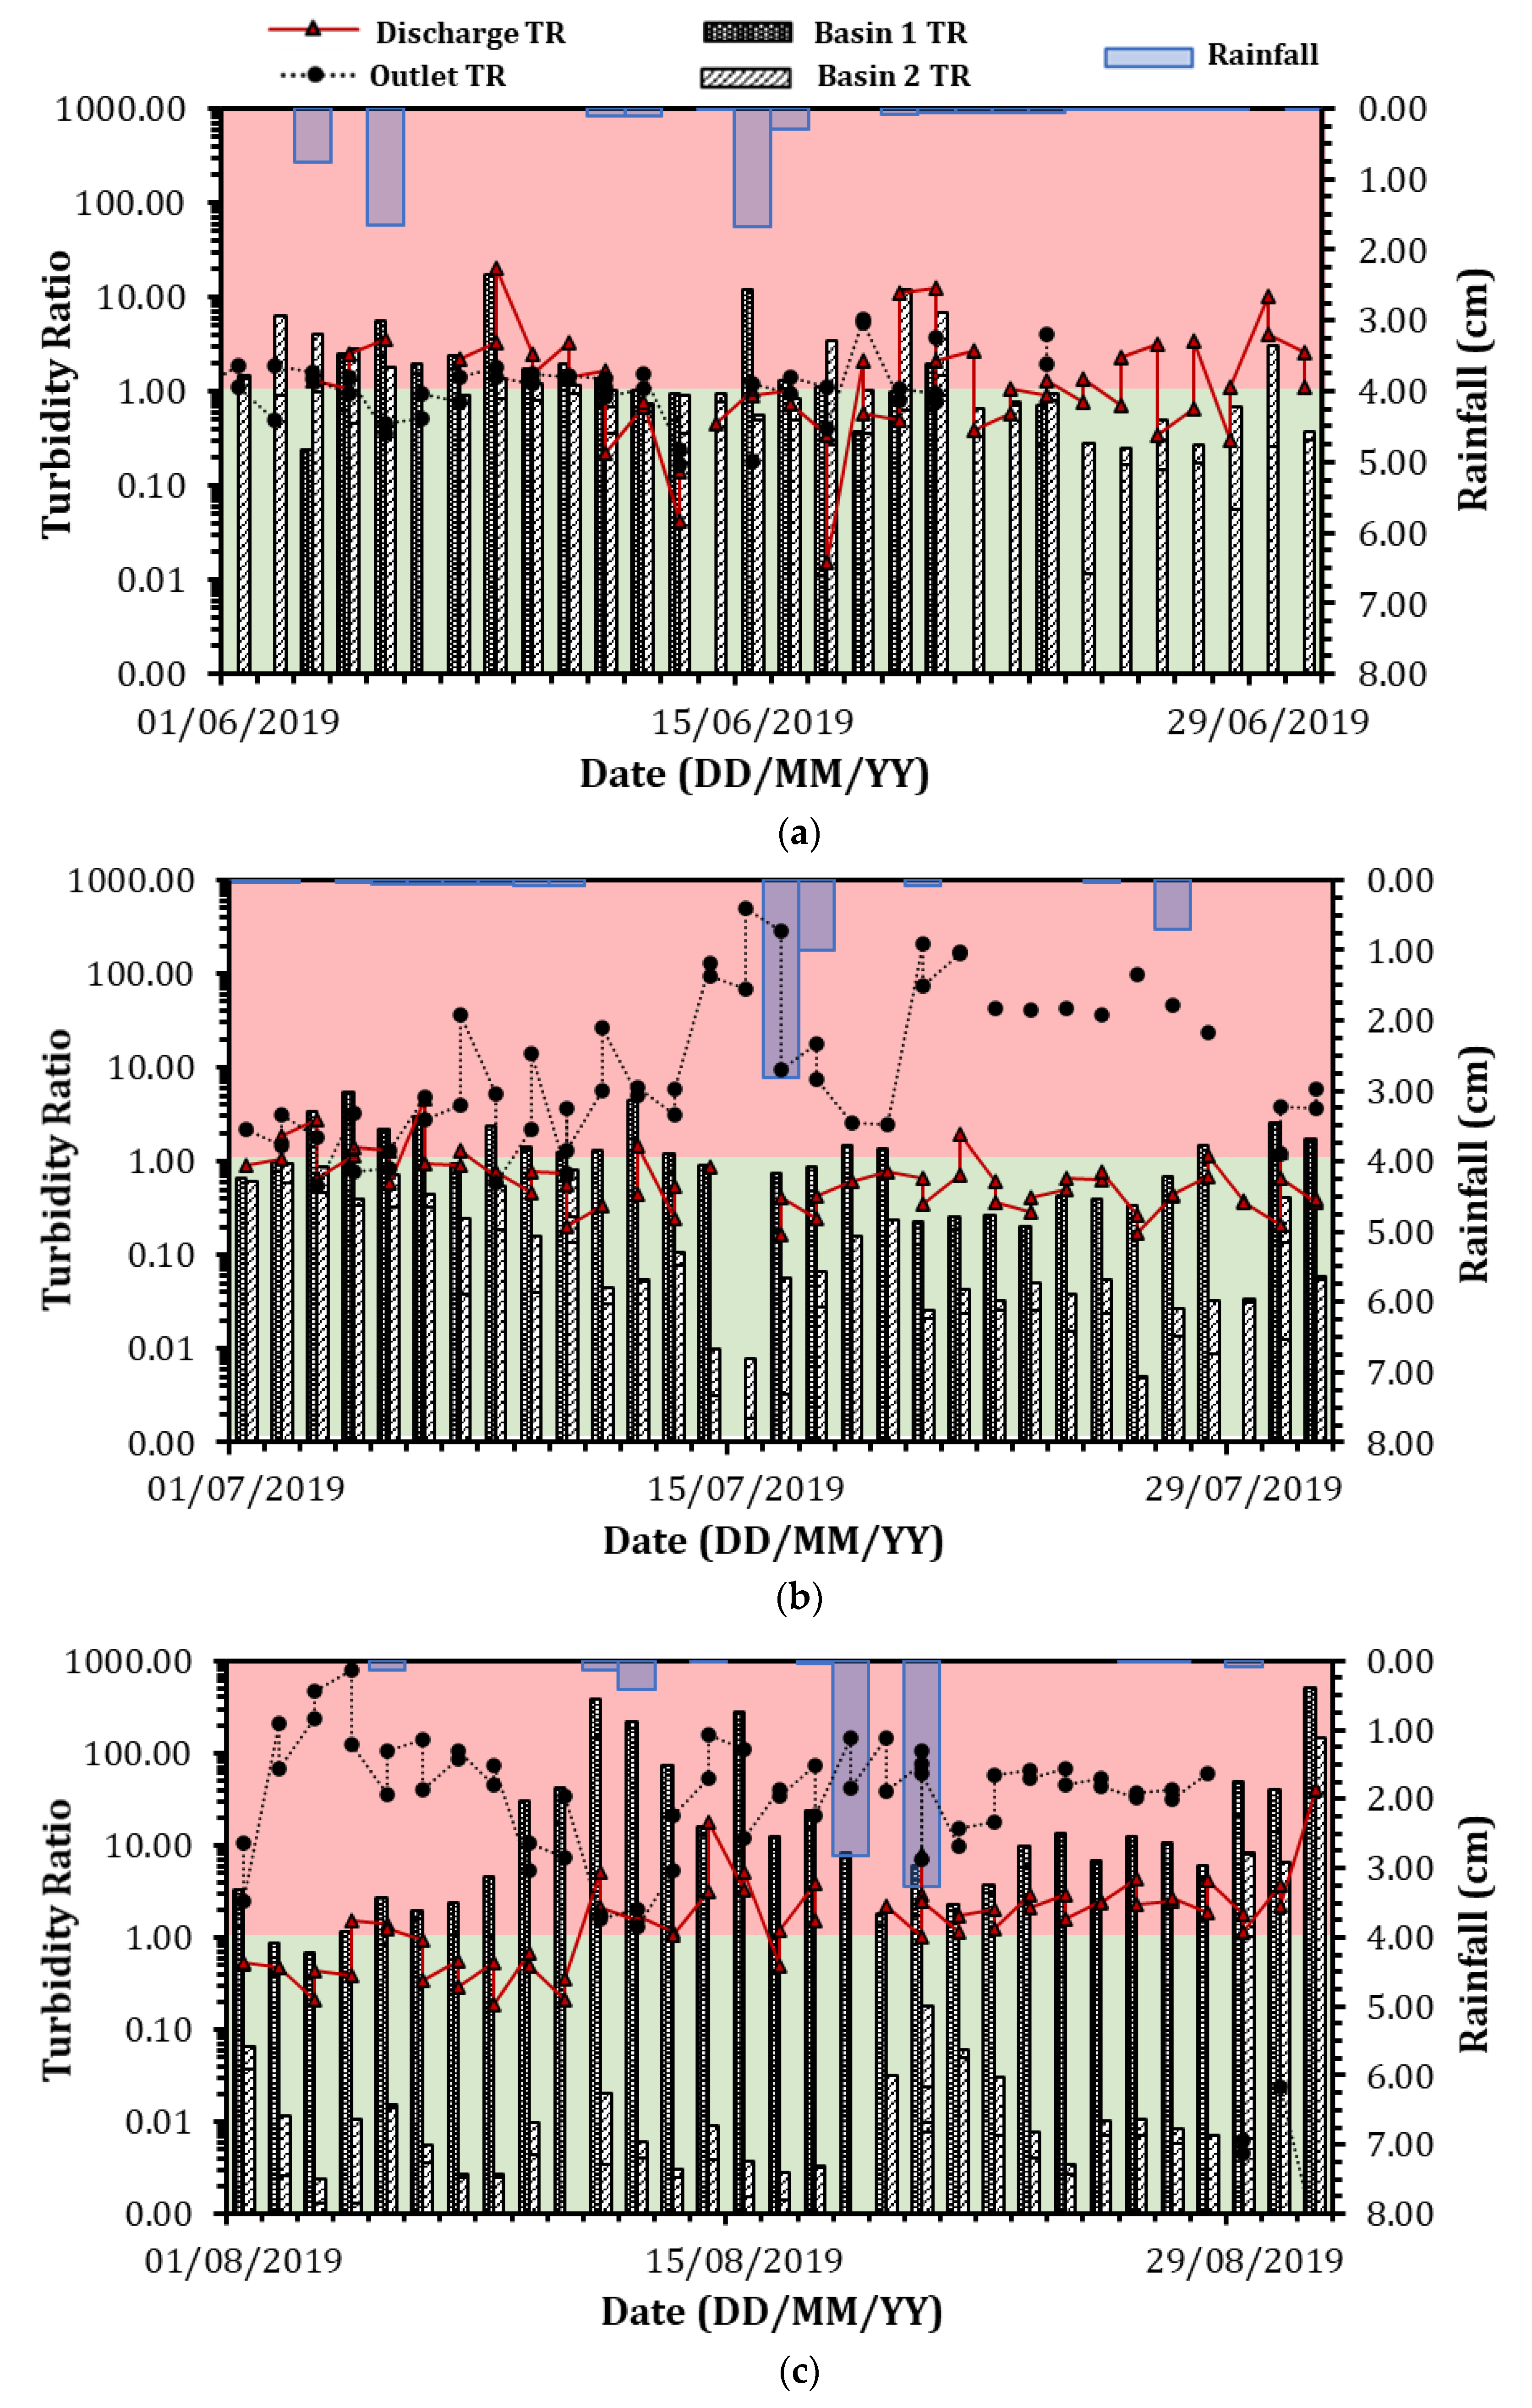
To standardize performance characterization, treatment ratios were used to understand the performance of the first basin, second basin, and series system. An additional comparison was made by diving the turbidity measured from location C by the turbidity measured at location B to understand the effects of dewatering techniques. These turbidity ratios are shown in Figure 6.
4. Discussion
4.1. Single Basin
During single basin monitoring, turbidity ratios peaked on 9 October 2018, after receiving nearly 5.84 cm (2.30 in) of rain across three days. During this measurement, turbidity values at discharge were measured at 9236 NTU, which was more than 1.5 times greater than the inflow’s turbidity. Throughout sampling the single basin, discharge water samples had an average turbidity increase of 92 NTU when compared to the inflow samples. The turbidity increase was attributed to the clay fractions in the sediment loading from the erosion of the basin structure, in addition to resuspension of previously settled matter. When analyzed for total solids, discharge sample concentrations were 15.5 mg/L lower than inflow samples, with a standard deviation of 345 mg/L. This indicated that the heavier, settable solids concentrations were reduced after residence in the basin. The high standard deviations indicate the wide range of measured turbidity and total solids experienced during monitoring, with no predictability on basin performance based on storm events. When detention practices have defined and stabilized inflow and discharge channels, mass balance can be used to account for sediment deposition and yield. Results and visual observations from this monitoring effort revealed that the sediment basins had several undefined inflow paths, resulting from sheet and shallow concentrated flow. Additionally, the basins became a sediment source, rather than sink, due to lack of maintenance.
Inflow turbidity values regularly reached magnitudes of 103 NTU and up to 104 NTU during larger storm events, especially after consecutive storm events. Despite the vastly different geographic locations, inflow turbidity value magnitudes were consistent with a field-study of an excavated sediment basin from Franklin County, AL [17]. Consecutive storm events likely caused the site to reach field saturation, increasing runoff and erosive forces with each event. Increased sediment load and lack of maintenance between events likely caused sediment deposition to exceed the dead storage, or available volume beneath the discharge pipe, within the basin. Furthermore, increased flow velocities may have caused turbulence at the basin’s inflow, resuspending and discharging previously settled material, which is documented to decrease the efficiency of the basin [17]. After detention in the basin, discharge values were commonly higher than influent turbidity. The larger storm events presumably produced greater flow velocities, potentially causing resuspension of settled materials or increased erosion potential, which lead to elevated sediment concentrations.
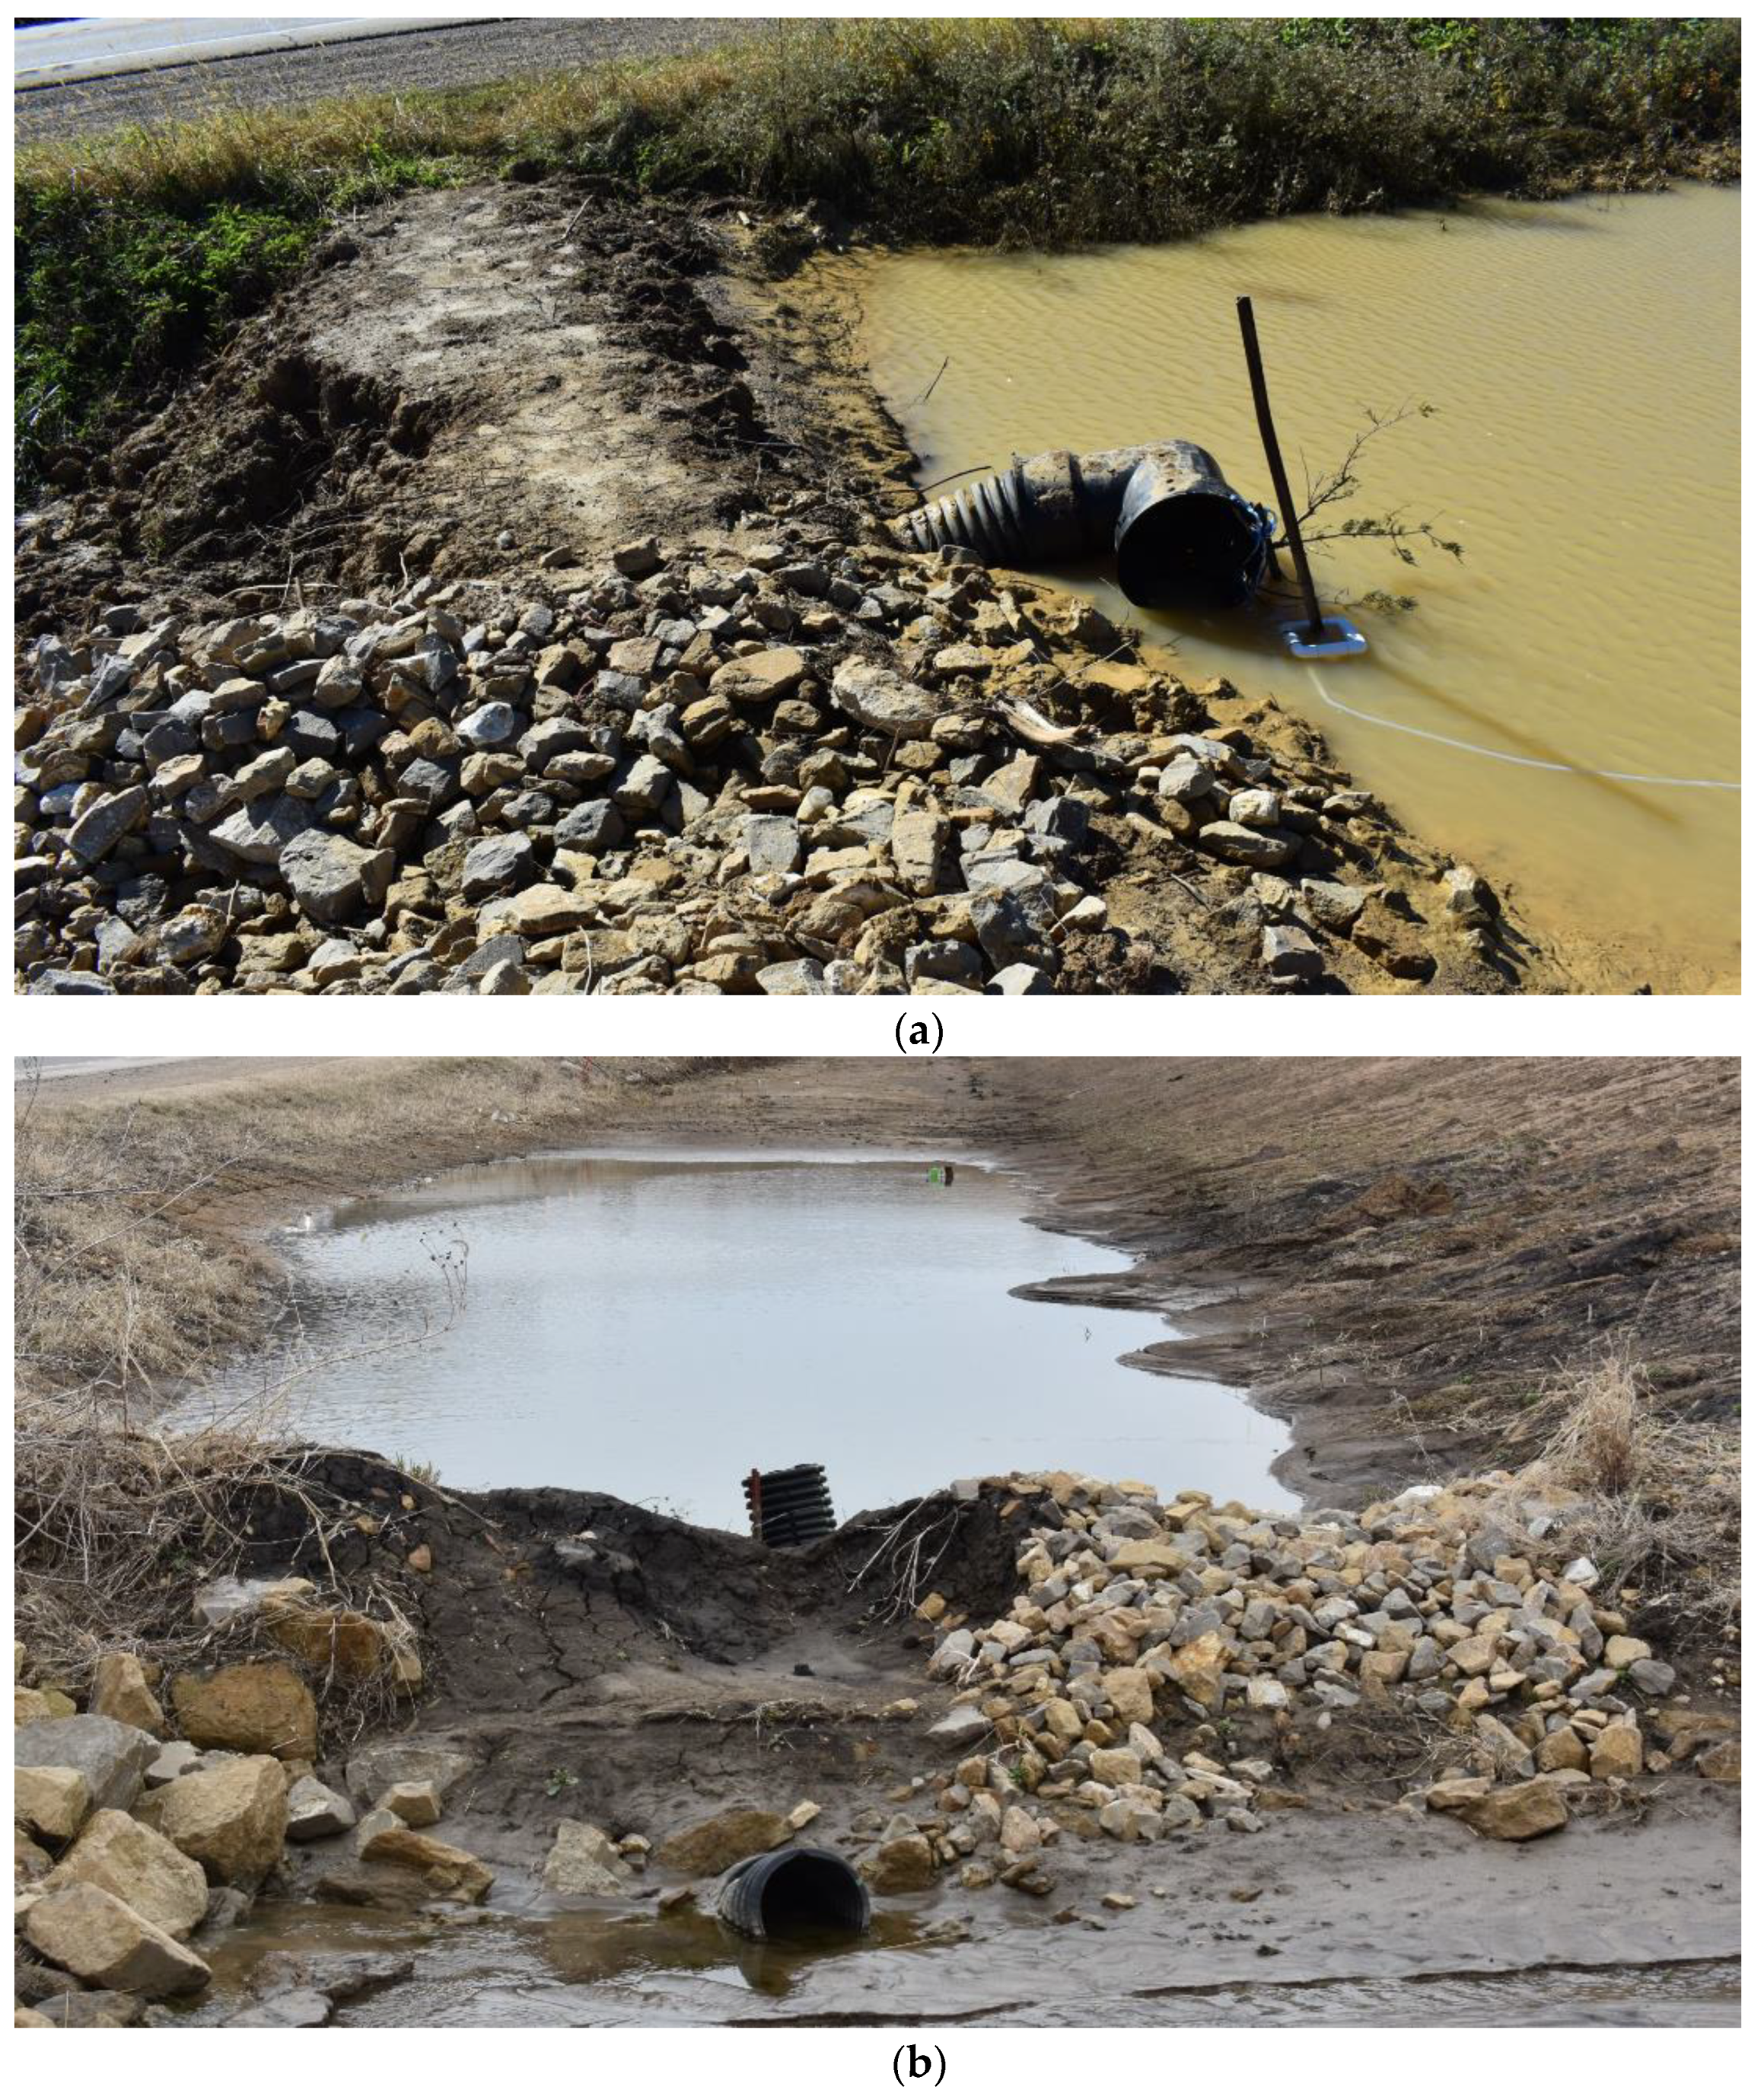
Dewatering deficiencies were visually observed during monitoring. The dewatering riser pipe was inadequately anchored to the basin floor and became buoyant, which caused the basin to retain stormwater volumes without controlled dewatering, causing subsequent events to flow over earthen berm. Although erosion stone was used to hard armor the spillway, the spillway was not the lowest point on the earthen berm. This allowed overflows to flow over the unprotected, unvegetated portion of the berm, resulting in erosion of the earthen berm. The invert of the discharge end of the riser was elevated as a result of the earthen berm erosion and sedimentation downstream of the discharge pipe and contributed to dewatering deficiencies even after re-anchoring and reattachment. This is captured in Figure 7b. Discharge downstream of the earthen berm was not captured during monitoring, as discharge samples were taken proximal to the discharge pipe. However, the erosion of the earthen berm contributed to the sediment loading discharged from the site. It is suspected that discharged turbidity and total solids concentrations were significantly higher than captured by the sampler due to suspending and transporting washed out material in the downstream conveyance. These visual observations were captured in Figure 7.
4.2. Sediment Basins In-Series
Throughout monitoring the basins in series, the turbidity ratio for the series (comparing Discharge D to Inflow A) averaged 9 NTU. Inflow turbidity values were again in the order of magnitude ranging from 103 to 104 NTU, so the reduction was negligible. In the series, it was expected that Basin 1 should have performed like a forebay, capturing rapidly settable solids before flowing into the longer, narrower Basin 2, for extended treatment. It was hypothesized that inflow to Basin 2 would have lower sediment concentrations than inflow to Basin 1 as a result; however, turbidity was highest in the water samples from inflow of Basin 2. In the first month of monitoring, Basins 1 and 2 had similar turbidity treatment ratios; however, in the second and third monitoring months, the turbidity ratios were much lower for Basin 2, indicating higher turbidity removal. After visual inspection and data collection, it was suspected that larger, heavier particles settled in Basin 1, causing sediment deposition to consume available storage. Subsequent inflows caused resuspension, contributing to an increased sediment load flowing to Basin 2. Since the first basin in the series provided limited effect or benefit to the series, future design should consider eliminating the first basin and using the available channel area to extend the flow path of a single basin, maximizing the length to width ratio.
In addition to the individual basins and system evaluations, Discharge B and Inflow C were compared. Sampling location B represented true surface dewatering, with a floating sampling intake, whereas Sampling Location C was the hydraulic connection between basins (Inflow Basin 2/Riser Discharge of Basin 1). In the first month, the sampling locations had similar turbidities; however, in the second and third months, as sediment was deposited and subsequent runoff events occurred, sampling location B had much lower turbidities. This indicated that a floating dewatering mechanism, such as a surface skimmer; may yield decreased sediment concentrations discharging from a detention system. Additionally, surface skimmers are designed according to detention volume and desired dewatering time, leading to more control in detention time for enhanced settling.
4.3. Limitations
There were limitations encountered in this field-monitoring methodology that should be considered when qualifying the reported results and planning future studies. Samplers at inflow and discharge were programmed using time-paced sampling. Samples at both locations were taken simultaneously; however, the basins’ flow length and volume fluctuated. The samples taken at discharge had presumably maximized the flow path and residence time in the basin; however, samples taken at inflow were likely more representative of immediate runoff conditions. Although sediment basins also have the potential to reduce additional pollutants such as nutrients and heavy metals, pollutant reduction outside of suspended sediment was not evaluated in this study.
Performance of sediment basins, and other erosion and sediment control techniques, are dependent on site-specific characteristics such as soil type, topography, drainage areas, intensity, and frequency of rainfall. Monitoring was conducted on constructed in-channel basins, and conditions including live and dead storage capacities were unknown, as they were not specifically designed. Installation of the basins was not directly monitored and may have varied from DOT specification, for example the elevation of the auxiliary spillway; therefore, results cannot be directly extrapolated to other basins. The monitored sediment basins were subject to dynamic site conditions, including rainfall, drainage areas, and changing topography due to ongoing grading. Challenges during field-monitoring are well-documented [17,18,19].
After the initial site visits, soil classification testing was conducted, and samples taken from the sediment basin were lean clay and site grade indicated soils were a lean clay with sand (CL-SC) according to the USCS. It is suspected that aggregated clays were physically dispersed in flow conditions. Due to their small size, clays are the slowest to settle. This causes water to be highly turbid and requires chemical dosage or longer detention time than basins treating silts and sands. This study included direct measurements of turbidity and total solids in the 2018 monitoring season; however, in the 2019 monitoring season, turbidity was directly measured, and total solids was estimated based on the relationship established from the previous monitoring season. The equation used to estimate total soils concentrations is specific to the soils encountered on the site, and important to note it is an estimation. Varying flow rates, water column depths, and soil types will change the development and calibration of a turbidity and total solids relationship. In this study, turbidity was used as the primary reporting parameter, as the soils sampled had large clay fractions, which would most affect turbidity. Additionally, turbidity is the primary metric in erosion and sediment control inspections and applications [38]. While results may indicate the basin performance on the Tama U.S. 30 site, repeatability of results on other construction sites is uncertain due to the lack of control on site activities.
4.4. Design Reccommendations
On Tama U.S. 30, more than 450 silt basins and 70 basins were included in the DOT’s stormwater pollution prevention plan, which highlighted that detention practices were heavily relied on for sediment capture. Additionally, the DOT paid per detention practice installation despite performance. Monitoring revealed that the basins provided negligible water quality treatment and were inconsistent across storm events. This signaled to researchers and the DOT that design improvements were necessary for a successful stormwater management plan and environmental stewardship.
The data analysis and visual observations were considered when comparing the current in-channel sediment design to other sediment basin designs in the literature. Although other in-channel sediment basins were not identified, several sediment basin and sediment trap designs exist. In these designs, various structural components were identified to potentially implement for enhance sediment capture, such as lining, forebays, skimmers, and baffles. Another design suggestion was to size according to the 2-year, 24 h design storm, rather than the current 252 m3/ha (3600 ft3). A sizing analysis for a 0.81 ha (2 acre) drainage area was conducted. The complete analysis is shown in Table 4; however, sizing according to the 2-year, 24 h design storm resulted in a basin with more than double the stormwater volume.
There has been criticism on adopting sizing for the 2-year, 24 h storm, as Fang et al. [17] attributes increased turbidity to rainfall intensity rather than volume. In addition to increased sizing, it may be beneficial to eliminate the basins in series as a design and utilize the basin area to extend the flow path of a single basin. This would maximize the length to width flow path ratio, and minimize installation error [9,26]. This is supported by the data comparing Basins 1 and 2 in the series. Area within a single, longer basin, may be dedicated to creating using a rock check dam or level spreader. This will provide a distributed, shallow, slower inflow introduction. In an effort to reduce flow velocities, turbulence, and resuspension, baffles are recommended [30]. Due to erosion within the basin, stabilization should be considered in future design, and may be achieved by lining the basin with a geotextile. The results from this study supported the implementation of a surface skimmer for less turbid discharge and compliance with USEPA surface dewatering guidance.
Future studies may consider controlled testing with designed inflow and sediment introduction rates to quantify the impact of the suggested components, as described in Perez et al. [21]. Additional research may include flocculant introduction upstream up the basin to minimize detention time and basin sizing. Future studies may also consider various soil types and particle distributions to qualify performance.
5. Conclusions
ESC design have historically lacked performance-based design. Although controlled testing methods and standards exist, it is difficult to replicate the conditions and dynamics of construction site conditions and thus evaluate the performance of ESC practices. This field-based monitoring aimed to quantify the performance of an in-channel sediment basin singularly and as a system. In places like Australia and New Zealand, monitoring discharge water quality from detention practices is required; however, it is not as common in the United States, so limited field-performance data exist. This study compared sediment concentrations at the inflow and discharge of the basins were compared to quantify sediment removal. Data analysis revealed that the basins provided negligible turbidity reduction throughout monitoring, visual observations were recorded to support sampling and inform design improvement recommendation.
Visual inspections revealed that the basins did not have defined inflow channels and received sediment-laden sheet flows from several directions. The channels that existed eroded with each storm due to lacking controls, which contributed to the incoming sediment load. There was progressive widening due to the sloughing of the basin walls after dewatering. As the sidewalls sloughed, the basin’s length-to-width ratio was compromised and increased the sediment load. Due to lack of maintenance, sediment accumulated in the basin exceeding the dead storage available for sediment deposition; this consequently decreased the available live storage volume intended to detain runoff during subsequent storm events. Future research opportunities exist to investigate enhanced performance provided by innovative treatment features within the basin, such as varying sizing criteria and implementing an upstream forebay, geotextile lining, baffles, floating surface skimmer, and flocculant dosing. This study provided an understanding of the water quality impact provided by the current in-channel sediment basin design and highlighted areas for improvement. Modifications and, consequently, enhanced performance will protect water quality downstream of construction activities, allowing state highway agencies to meet environmental commitments while reducing regulatory compliance issues.
Author Contributions
Conceptualization, J.C.S., M.A.P. and B.C.; methodology, J.C.S. and M.A.P.; formal analysis, J.C.S.; data curation, J.C.S. and J.B.W.; writing—original draft preparation, J.C.S.; writing—review and editing, M.A.P., J.B.W. and B.C.; project administration, M.A.P.; funding acquisition, M.A.P. and B.C. All authors have read and agreed to the published version of the manuscript.
Funding
This research was funded by the Iowa Department of Transportation and the Federal Highway Administration under project number 18-SPR-001.
Institutional Review Board Statement
Not applicable.
Informed Consent Statement
Not applicable.
Data Availability Statement
Not applicable.
Conflicts of Interest
The authors declare no conflict of interest. The funders had no role in the design of the study; in the collection, analyses, or interpretation of data; in the writing of the manuscript, or in the decision to publish the results.
References
- Wuebbles, D.J.; Easterling, D.R.; Hayhoe, K.; Knutson, T.; Kopp, R.E.; Kossin, J.P.; Kunkel, K.E.; LeGrande, A.N.; Mears, C.; Sweet, W.V.; et al. Our globally changing climate. In Climate Science Special Report: Fourth National Climate Assessment; U.S. Global Change Research Program: Washington, DC, USA, 2017; Volume I, pp. 35–72. [Google Scholar] [CrossRef] [Green Version]
- United States Environmental Protection Agency. National Pollutant Discharge Elimination System General Permit for Discharge from Construction Activities; Office of Water: Washington, DC, USA, 2022.
- Bugg, R.A.; Donald, W.N.; Zech, W.C.; Perez, M.A. Improvements in Standardized Testing for Evaluating Sediment Barrier Performance: Design of a Full-Scale Testing Apparatus. ACSE J. Irrig. Drain. Eng. 2017, 143, 1. [Google Scholar] [CrossRef]
- Mitchell, G.F.; Shad, M.S.; Masada, T. Erosion and Sediment Control Practices in Highway Construction. In Proceedings of the International Erosion Control Association, Orlando, FL, USA, 20–22 February 1991. [Google Scholar]
- Boyd, E.C.; Lichtkoppler, F. Turbidity and Color. In Water Quality Management in Pond Fish Culture; Research and Development Series of the International Center for Aquaculture Agricultural Experiment Station: Auburn, AL, USA, 1979. [Google Scholar]
- Water and Rivers Commission of Western Australia. Water Quality and Macroinvertebrates; Water and Rivers Commission of Western Australia: Perth, Australia, 2011.
- United States Department of Agriculture. Erosion Control Treatment Selection Guide; United States Department of Agriculture: Washington, DC, USA, 2006.
- Pimentel, D.; Harvey, C.; Resosudarmo, P.; Sinclair, K.; Kurz, D.; McNair, M.; Crist, S.; Shpritz, L.; Fitton, L.; Saffouri, R.; et al. Environmental and Economic Costs of Soil Erosion and Conservation Benefits. Science 1995, 264, 1117–1123. [Google Scholar] [CrossRef] [PubMed] [Green Version]
- Alabama Soil and Water Conservation Committee. Alabama Handbook for Erosion Control, Sediment Control and Stormwater Management on Construction Sites and Urban Areas; Alabama Soil and Water Conservation Committee: Montgomery, AL, USA, 2018.
- Alabama Department of Transportation. Standard and Special Drawings for Highway Construction; Alabama Department of Transportation: Montgomery, AL, USA, 2020.
- Iowa Statewide Urban Design and Specifications. Iowa SUDAS Design Manual; Iowa State University of Science and Technology: Ames, IA, USA, 2013. [Google Scholar]
- Iowa Department of Transportation. Standard Road Plan Erosion Control Standards; Iowa Department of Transportation: Ames, IA, USA, 2017. [Google Scholar]
- North Carolina Department of Environmental Quality. Erosion and Sediment Control Planning and Design Manual; North Carolina Department of Environmental Quality: Raleigh, NC, USA, 2013.
- North Carolina Department of Transportation. Erosion & Sediment Control Design and Construction Manual; North Carolina Department of Transportation: Raleigh, NC, USA, 2015.
- Kaufman, H.M. Erosion Control at Construction Sites: The Science–Policy Gap. Environ. Manag. 2000, 36, 89–97. [Google Scholar] [CrossRef] [PubMed] [Green Version]
- Chapman, J.M.; Proulx, C.L.; Veilleux, M.A.; Levert, C.; Bliss, S.; André, M.; Lapointe, N.W.; Cooke, S.J. Clear as mud: A meta-analysis on the effects of sedimentation on freshwater fish and the effectiveness of sediment-control measures. Water Res. 2014, 56, 190–202. [Google Scholar] [CrossRef] [PubMed]
- Fang, X.; Zech, W.C.; Logan, C.P. Stormwater Field Evaluation and Its Challenges of a Sediment Basin with Skimmer and Baffles at a Highway Construction Site. Water 2015, 7, 3407–3430. [Google Scholar] [CrossRef]
- McLaughlin, R.A.; Rajbhandari, N.; Hunt, W.F.; Line, D.E.; Sheffield, R.E.; White, N.M. The Sediment and Erosion Control Research and Education Facility at North Carolina State University. In Proceedings of the Soil Erosion Research for the 21st Century, Honolulu, HI, USA, 3–5 January 2001. [Google Scholar] [CrossRef]
- Zech, W.C.; McDonald, J.S.; Clement, T.P. Field Evaluation of Silt Fence Tieback Systems at a Highway Construction Site. ASCE Pract. Period. Struct. Des. Constr. 2009, 14, 105–112. [Google Scholar] [CrossRef]
- Donald, W.N.; Zech, W.C.; Perez, M.A.; Fang, X. Ditch Check Installation Evaluations of Wheat Straw Wattles Used for Velocity Reduction. Transp. Res. Rec. J. Transp. Res. Board 2013, 2358, 69–78. [Google Scholar] [CrossRef]
- Perez, M.A.; Zech, W.C.; Fang, X.; Vasconcelos, J.G. Methodology and Development of a Large-Scale Sediment Basin for Performance Testing. J. Irrig. Drain. Eng. 2016, 142, 04016042. [Google Scholar] [CrossRef]
- Whitman, J.B.; Schussler, J.C.; Perez, M.A.; Liu, L. Hydraulic Performance Evaluation of Wattles Used for Erosion and Sediment Control. J. Irrig. Drain. Eng. 2021, 147, 04021028. [Google Scholar] [CrossRef]
- Fennessey, L.A.J.; Jarrett, A.R. Influence of principal spillway geometry and permanent pool depth on sediment retention of sedimentation basins. Trans. Am. Soc. Agric. Eng. 1997, 40, 53–59. [Google Scholar] [CrossRef]
- Bidelspach, D.A.; Jarrett, A.R. Influence of increasing the delay time between the inflow and outflow hydrographs of a sediment basin. Trans. Am. Soc. Agric. Eng. 2004, 47, 439–444. [Google Scholar] [CrossRef]
- Sun, J.; Huang, Y. Modeling the Simultaneous Effects of Particle Size and Porosity in Simulating Geo-Materials. Materials 2022, 15, 1576. [Google Scholar] [CrossRef] [PubMed]
- International Erosion and Sediment Control Association. Sediment Basin Design Standard; International Erosion and Sediment Control Association: Aurora, CO, USA, 2021. [Google Scholar]
- United States Environmental Protection Agency. National Primary Drinking Water Regulations; United States Environmental Protection Agency: Washington, DC, USA, 2022.
- United States Environmental Protection Agency. Water Quality Standards Regulations: Lowa; United States Environmental Protection Agency: Washington, DC, USA, 2017.
- Chen, C.N. Design of Sediment Retention Basins. In the Proceedings of the National Symposium on Urban Hydrology and Sediment Control, Lexington, KY, USA, 28–31 July 1975; University of Kentucky, Office of Research and Engineering Services: Lexington, KY, USA, 1975. [Google Scholar]
- Thaxton, C.S.; Calantoni, J.; McLaughlin, R.A. Hydrodynamic assessment of various types of baffles in a sediment retention pond. Trans. ASAE 2004, 47, 741–750. [Google Scholar] [CrossRef]
- Tennessee Department of Transportation. Erosion Prevention and Sediment Control; Tennessee Department of Transportation: Nashville, TN, USA, 2020.
- Kazaz, B.; Perez, M.A.; Donald, W.N. State-of-the-Practice Review on the Use of Flocculants for Construction Stormwater Management in the United States. Transp. Res. Rec. J. Transp. Res. Board 2021, 2675, 248–258. [Google Scholar] [CrossRef]
- ASTM. Standard Test Method for Sieve Analysis of Fine and Coarse Aggregates; ASTM: West Conshohocken, PA, USA, 2017. [Google Scholar]
- ASTM. Standard Test Method for Liquid Limit, Plastic Limit, and Plasticity Index of Soils; ASTM: West Conshohocken, PA, USA, 2018. [Google Scholar]
- ASTM. Standard Test Method for Particle-Size Distribution (Gradation) of Fine Grained Soils Using the Sedimentation (Hydrometer) Analysis; ASTM: West Conshohocken, PA, USA, 2021. [Google Scholar]
- ASTM. Standard Test Methods for Determining Sediment Concentration in Water Samples; ASTM: West Conshohocken, PA, USA, 2015. [Google Scholar]
- Whitman, J.B.; Zech, W.; Donald, W.N. Full-Scale Performance Evaluations of Innovative and Manufactured Sediment Barrier Practices. Transp. Res. Rec. 2019, 2673, 284–297. [Google Scholar] [CrossRef]
- Perez, M.A.; Zech, W.C.; Vasconcelos, J.G.; Fang, X. Large-Scale Performance Testing of Temporary Sediment Basin Treatments and High-Rate Lamella Settlers. Water 2019, 11, 316. [Google Scholar] [CrossRef] [Green Version]
- Soil Survey Staff, Natural Resources Conservation Service, United States Department of Agriculture. Web Soil Survey. Available online: http://websoilsurvey.sc.egov.usda.gov/ (accessed on 25 September 2022).
- Deletic, A.B.; Maksimovic, C.T. Evaluation of Water Quality Factors in Storm Runoff from Paved Areas. J. Environ. Eng. 1998, 124, 869–879. [Google Scholar] [CrossRef]
- Métadier, M.; Bertrand-Krajewski, J.-L. The use of long-term on-line turbidity measurements for the calculation of urban stormwater pollutant concentrations, loads, pollutographs and intra-event fluxes. Water Res. 2012, 46, 6836–6856. [Google Scholar] [CrossRef]
- Wang, Q.; Zhang, Q.; Dzakpasu, M.; Lian, B.; Wu, Y.; Wang, X.C. Development of an indicator for characterizing particle size distribution and quality of stormwater runoff. Environ. Sci. Pollut. Res. 2018, 25, 7991–8001. [Google Scholar] [CrossRef]
- Sims, C.; Cotching, B. Erosion and water quality: Turbidity and sediment loads from selected catchments in northwest Tasmania. Nat. Resour. Manag. 2000, 3, 8–14. [Google Scholar]
- Persson, J.; Somes, N.L.G.; Wong, T.H.F. Hydraulics Efficiency of Constructed Wetlands and Ponds. Water Sci. Technol. 1999, 40, 291–300. [Google Scholar] [CrossRef]
Figure 1.
In-channel sediment basin design standard. (a) channel profile; (b) dewatering cross section; (c) dewatering riser; (d) installation. Reproduced from the Iowa DOT Standard Road Plans (2018) with permission from the Iowa DOT, 2022.
Figure 1.
In-channel sediment basin design standard. (a) channel profile; (b) dewatering cross section; (c) dewatering riser; (d) installation. Reproduced from the Iowa DOT Standard Road Plans (2018) with permission from the Iowa DOT, 2022.


Figure 2.
Annotated aerial image of monitored site sediment basins.

Figure 3.
Site soil gradation sampled from (a) site grade; (b) sediment basin.

Figure 4.
Sediment basin treatment ratios (TR) and site rainfall for September–October 2018. (a) Turbidity TR; (b) Total solids TR.
Figure 4.
Sediment basin treatment ratios (TR) and site rainfall for September–October 2018. (a) Turbidity TR; (b) Total solids TR.

Figure 5.
Turbidity and total solids relationship from sediment basin water samples.

Figure 6.
Basins in series turbidity treatment ratios and site rainfall for months: (a) June 2019; (b) July 2019; (c) August 2019.
Figure 6.
Basins in series turbidity treatment ratios and site rainfall for months: (a) June 2019; (b) July 2019; (c) August 2019.

Figure 7.
Dewatering deficiencies; (a) Buoyant riser pipe; (b) Earthen berm erosion.


Table 1.
Qualifying events (at least 0.65 cm of rainfall in 24 h period) during 2018 monitoring.
| Event No. | Date of Occurrence | 24 h Rainfall, cm (in) | Inflow NTU | Outflow NTU |
|---|---|---|---|---|
| 1 | 25 September 2018 | 5.08 (2.00) | 6781 | 4945 |
| 2 | 1 October 2018 | 1.52 (0.60) | 2105 | - |
| 3 | 3 October 2018 | 1.02 (0.40) | 669 | 1122 |
| 4 | 4 October 2018 | 1.02 (0.40) | 1972 | - |
| 5 | 6 October 2018 | 1.52 (0.60) | 954 | 656 |
| 6 | 8 October 2018 | 2.54 (1.00) | 3224 | 2286 |
| 7 | 9 October 2018 | 5.65 (2.30) | 5843 | 9236 |
Table 2.
Qualifying events (at least 0.65 cm of rainfall in 24 h period) during 2019 monitoring.
| Event No. | Date of Occurrence | 24 h Rainfall Depth, cm (in) | Turbidity (NTU) | |||
|---|---|---|---|---|---|---|
| A | B | C | D | |||
| 8 | 17 May 2019 | 0.51 (0.20) | 514 | 314 | 284 | 79 |
| 9 | 18 May 2019 | 4.24 (1.67) | 21 | 31 | 45 | 43 |
| 10 | 21 May 2019 | 2.57 (1.01) | - | 48 | - | 17 |
| 11 | 24 May 2019 | 4.11 (1.62) | - | 543 | 2599 | - |
| 12 | 27 May 2019 | 1.42 (0.56) | - | 1237 | 1445 | 73 |
| 13 | 28 May 2019 | 2.51 (0.99) | - | 825 | 869 | 23 |
| 14 | 3 June 2019 | 0.76 (0.30) | - | 12 | 19 | 19 |
| 15 | 5 June 2019 | 1.65 (0.65) | 157 | 375 | 171 | - |
| 16 | 15 June 2019 | 1.70 (0.67) | 226 | 298 | 357 | 201 |
| 17 | 16 June 2019 | 2.00 (0.79) | 64 | 83 | 79 | 66 |
| 18 | 16 July 2019 | 2.82 (1.11) | 326 | 246 | 2300 | 133 |
| 19 | 17 July 2019 | 0.99 (0.39) | 201 | 177 | 1329 | 87 |
| 20 | 27 July 2019 | 0.71 (0.28) | - | - | 220 | - |
| 21 | 18 August 2019 | 2.82 (1.11) | - | 109 | 4464 | - |
| 22 | 20 August 2019 | 3.28 (1.29) | 10 | 44 | 2632 | 26 |
Table 3.
Range of turbidity values during monitoring at sampling locations.
| Sampling Location | Lowest Turbidity (NTU) | Highest Turbidity (NTU) |
|---|---|---|
| A | 1.4 | 684 |
| B | 2.1 | 4068 |
| C | 1.4 | 5978 |
| D | 1.9 | 806 |
Table 4.
Basin Sizing for 0.81 ha (2 ac) drainage area.
| Sizing Parameter | 3600 ft3/ac | 2-Year, 24 h |
|---|---|---|
| Top length | 40. 8 m (134 ft) | 57.3 m (188 ft) |
| Top width | 20.4 m (67 ft) | 28.7 m (94 ft) |
| Bottom length | 33.5 m (110 ft) | 50 m (164 ft) |
| Bottom width | 13.1 m (43 ft) | 21.3 m (70 ft) |
| Side slopes (H:V) | 3:1 | 3:1 |
| Depth | 1.2 m (4 ft) | 1.2 m (4 ft) |
| Volume | 765 m3 (27,000 ft3) | 1633 m3 (57,682 ft3) |
| Skimmer | 7.6 cm (3 in) w/ 7.4 cm (2.9 in) orifice | 10.2 cm (4 in) w/ 9.9 cm (3.9 in) orifice |
| Earthen berm width | 3 m (10 ft) | 3 m (10 ft) |
Publisher’s Note: MDPI stays neutral with regard to jurisdictional claims in published maps and institutional affiliations. |
© 2022 by the authors. Licensee MDPI, Basel, Switzerland. This article is an open access article distributed under the terms and conditions of the Creative Commons Attribution (CC BY) license (https://creativecommons.org/licenses/by/4.0/).
Share and Cite
MDPI and ACS Style
Schussler, J.C.; Perez, M.A.; Whitman, J.B.; Cetin, B. Field-Monitoring Sediment Basin Performance during Highway Construction. Water 2022, 14, 3858. https://doi.org/10.3390/w14233858
AMA Style
Schussler JC, Perez MA, Whitman JB, Cetin B. Field-Monitoring Sediment Basin Performance during Highway Construction. Water. 2022; 14(23):3858. https://doi.org/10.3390/w14233858
Chicago/Turabian StyleSchussler, Jaime C., Michael A. Perez, Jarrell Blake Whitman, and Bora Cetin. 2022. "Field-Monitoring Sediment Basin Performance during Highway Construction" Water 14, no. 23: 3858. https://doi.org/10.3390/w14233858
Note that from the first issue of 2016, this journal uses article numbers instead of page numbers. See further details here.