
Evolution and Influencing Factors of Landscape Pattern in the Yellow River Basin (Henan Section) Due to Land Use Changes
by
 ,
,
Haipeng Niu
1,2,
Xiaoming Zhao
1,
Dongyang Xiao
2,3,* ,
,
Mengmeng Liu
1,
Ran An
1 and
Liangxin Fan
1,2 1
School of Surveying and Land Information Engineering, Henan Polytechnic University, Jiaozuo 454000, China
2
Research Centre of Arable Land Protection and Urban-Rural High-Quality Development of Yellow River Basin, Henan Polytechnic University, Jiaozuo 454000, China
3
School of Resources & Environment, Henan Polytechnic University, Jiaozuo 454000, China
*
Author to whom correspondence should be addressed.
Water 2022, 14(23), 3872; https://doi.org/10.3390/w14233872
Submission received: 25 October 2022
/
Revised: 23 November 2022
/
Accepted: 24 November 2022
/
Published: 27 November 2022
(This article belongs to the Special Issue Yellow River Basin Management under Pressure: Present State, Restoration and Protection II)
Abstract
:The temporal and spatial evolution of landscape pattern is the most intuitive form of land use transition. Analyzing the change of landscape pattern and its driving factors is of great significance to land use management and water quality protection in the basin. Based on the land use data obtained from the remote sensing image interpretation of the Yellow River Basin (Henan section) in 1990, 2000, 2010, and 2020, the landscape pattern evolution characteristics of the Yellow River Basin (Henan section) were quantitatively studied using the methods of multi-angle land use transfer matrix, land use information atlas, and landscape pattern index, and the influencing factors of landscape pattern evolution of the Yellow River Basin (Henan section) were revealed using the geographic detectors (a new statistical method to measure the explanatory power of independent variables to dependent variables mainly by analyzing the overall differences among various types of geographical spaces). The results show that: (1) From 1990 to 2020, the mutual transformation of land use types in the Yellow River Basin (Henan section) was frequent, and the transformation tracks were diversified. Among them, the outflow behavior of land use types is mainly manifested in the transformation from cultivated land to construction land, and the inflow behavior of land use types is mainly manifested in the transformation from grassland and water to cultivated land. (2) In the information map of land use change in the Yellow River Basin (Henan section) from 1990 to 2020, the stable type had the widest distribution range, accounting for 94.60% of the total area of the study area, with two main change patterns: “cultivated land-cultivated land-cultivated land-cultivated land” and “woodland-woodland-woodland-woodland”, which indicates that the landscape pattern of the basin dominated by cultivated land and woodland has not changed fundamentally. The four land use change structure types, repeated change, early change, intermediate change and continuous change, account for a relatively small proportion and are concentrated in the vicinity of the Yellow River. (3) At the landscape level, the watershed generally shows the trend of decreasing landscape fragmentation, increasing landscape heterogeneity and constantly balancing landscape patch types. At the level of patch type, the landscape dominance of cultivated land decreases, while that of construction land increases. The occupation of construction land is the main reason for the fragmentation and homogenization of cultivated land. (4) From the perspective of landscape scale and patch type scale, through the geographical exploration of various natural factors and socio-economic factors that potentially affect the landscape pattern evolution, it is found that the spatial differences of natural factors such as slope, elevation, temperature, and precipitation can better reflect the spatial heterogeneity of the landscape pattern in the Yellow River Basin (Henan section) than those of socio-economic factors such as GDP and population density, and the interaction of any two driving factors has a greater influence on the spatial distribution characteristics of landscape pattern than any single factor, indicating that the formation of spatial heterogeneity in the Yellow River Basin (Henan section) is the result of the interaction of various influencing factors. The results of this study can provide ideas for exploring the trend and influencing mechanism of landscape pattern change in the basin, and have important reference significance for ecological environment management, ecosystem protection, and land use planning in the Yellow River Basin (Henan section).
1. Introduction
Land use/cover change is an important component and determinant of global environmental change, as well as the main manifestation of landscape pattern change of land surface system [1,2]. As one of the comprehensive new methods of land use/cover change research, land use transition has gradually entered the international academic field of vision. The concept of land use transformation originated from the study of forest transformation carried out by British geographer Grainger in the 1980s and 1990s, and land use transformation is defined as the change of land use form in a country or region in the process of economic and social development [3]. At the beginning of the 21st century, researcher Long first proposed the concept of land use transformation in the study of land use transformation characteristics along the Yangtze River transect [4]. As the subject of land use transformation has captured the attention of domestic and foreign scholars, its scientific connotations have become clearer. Many scholars have explored the theory and hypothesis of land use transformation [5,6], the characteristics of land use transformation [7,8], the development trend [9], the research framework [10], the driving mechanism [11,12], the relationship between land use transformation and urban and rural development [13], the economic and social [14,15] and the ecological environment effect [16,17], and the transformation of special land types such as cultivated land, construction land, and rural homestead [18,19,20]. The scenario simulation of future land use structure [21] has gradually formed a systematic research framework.
Landscape pattern evolution is the most intuitive manifestation of land use trans-formation, and landscape pattern evolution analysis based on land use transformation is an important component of landscape ecology research [22,23,24]. Landscape mainly reflects inland topography, landforms or scenery (such as grasslands, forests, mountains, lakes, etc.), or reflects the comprehensive topographic features of a certain geographical area. Landscape pattern in ecology refers to the spatial pattern, which is the spatial arrangement and combination of landscape elements patches with different sizes and shapes, including the types, numbers, spatial distribution, and configuration of landscape components. For example, different types of patches can be randomly, uniformly, or clustered in space [25]. It is not only the concrete embodiment of landscape heterogeneity, but also the final result of the action of various natural and social factors on complex time-space scales [26]. Previous studies have shown that land use change analysis is usually regarded as the basis for studying landscape pattern change. Scholars mostly choose dynamic-attitude models of land use, comprehensive index models of land use, land use transfer matrices, and geo-information map methods to reflect the mutual transformation characteristics of different land use types [27,28,29,30], and they use Geographic Information Science (GIS) spatial analysis and landscape pattern index models to detect the spatial structure composition and configuration characteristics of different landscape patches [31]. Among them, the former emphasizes the change of surface properties in different periods, whereas the latter emphasizes the change of the potential ecological pattern [32]. At present, the research on the landscape pattern of land use mainly focuses on the index characteristics, temporal and spatial evolution, fragmentation, driving factors, and analysis of sustainable development. For example, based on remote sensing image data, Wei et al. performed quantitative research on landscape structure, landscape dominance, landscape fragmentation, and landscape diversity using the Fragstats index database [33]. Cabral et al. combined remote sensing images and geospatial information to study the change trends of land cover and landscape pattern in the border area between northern Guinea-Bissau and southern Senegal, as well as the socio-economic factors and boundary effects driving its changes [34]. Yang et al. relying on ENVI and ArcGIS technologies, analyzed the temporal and spatial evolution of land use and landscape pattern in the Yangtze River Basin and conducted an in-depth analysis of the driving factors for the changes [35]. Xu et al. calculated and screened landscape pattern indexes based on hydrological response units and explored the impact of landscape pattern change on soil erosion in large open-pit coal mining areas, providing reference for land reclamation, ecological restoration, and sustainable development in mining areas [36]. From the research object, the forest vegetation, wetland landscape, city, karst mountain area, and alpine shrub meadow landscape of the Qinghai-Tibet Plateau were studied. For example, Eker et al. studied the relationship between deep forest road networks and forest landscape structures in southern Turkey, quantitatively analyzed the relationship between forest landscape patch area/size and road density, and provided a scientific basis for the construction of public infrastructure [37]. Yu et al. selected remote sensing data to analyze the dynamic changes and driving factors of the landscape pattern of Ebinur Lake wetland from 1972 to 2013 [38]. Based on landscape ecology methods, Wang et al. used the landscape index to analyze the landscape pattern of land use in Wuhan, and they introduced the analytic hierarchy process (AHP) to study the spatial scale effect and its response mechanism of the landscape pattern of land use in Wuhan [39]. Lu et al. used the landscape index and spatial autocorrelation analysis methods to explore the spatial and temporal evolution characteristics of landscape pattern vulnerability in typical karst mountain areas of Guizhou in the last 30 years [40]. From the perspective of the research area, there are mainly large-scale plain agricultural areas, arid oases, and Yangtze River Delta and Pearl River Delta economic zones. Daniela et al. took Volturno Delta Plain in Campania, southern Italy, as an example and comprehensively analyzed the changes of land use and landscape pattern caused by land reclamation using RS and GIS technology [41]. Lud et al. used remote sensing technology to analyze landscape pattern changes in arid and semi-arid areas [42]. Chen et al. evaluated the ecosystem service values of various land use types based on land use data and analyzed the dynamic changes of land ecosystem service values in Jiaxing City in the past 30 years and their responses to land use changes and landscape pattern changes [43]. Zhang et al. analyzed the landscape of the Liang Cheng Lake Basin and its change process based on landscape type data; at the same time, they constructed a comprehensive index of landscape vulnerability using the landscape sensitivity index and landscape fitness index and analyzed the spatial-temporal differentiation of landscape pattern vulnerability in the study area and its influencing factors [44]. Some studies have also performed detailed analyses of the situation of provinces, municipalities, and autonomous regions in China. For example, based on RS and GIS technology, Deng et al. used remote sensing images of Jixi City from 1993, 2003, and 2015 as data sources to quantitatively analyze the spatial and temporal evolution characteristics of the landscape pattern in the central city of Jixi in the last 22 years [45]. Wang et al. took Hebei Province, which is facing new development opportunities, as the research area, simulated the land use situation in 2030 using the GeoSOS-FLUS model, and discussed the evolution of regional landscape pattern based on the ecological software Fragstats [46]. Generally speaking, the existing research literature has paid insufficient attention to the overall landscape pattern changes of small- and medium-sized watersheds.
The Yellow River Basin is an important ecological barrier and a key area for national economic development in China, and it plays an important role in the high-quality development of China’s economy and society and the construction of an ecological civilization. At the symposium on ecological protection and high-quality development of the Yellow River Basin held in 2019, it was proposed that resources should be rationally developed and utilized, and the sustainability should be taken into account to improve the recycling of resources [47]. Since then, the ecological protection of the Yellow River Basin has officially risen to the level of national strategy. The Yellow River Basin (Henan section) is located in the middle and lower reaches of the Yellow River Basin. Rapid population growth and the urbanization process have accelerated the land use transformation of the Yellow River Basin (Henan section), and the landscape pattern of the basin has changed dramatically, exposing different degrees of fragmentation. It is extremely urgent to strengthen the ecological management and protection of the Yellow River Basin (Henan section) and promote its high-quality development. Therefore, it is particularly important to study its landscape pattern on multiple scales.
To sum up, researchers have carried out a series of studies on landscape pattern evolution from different angles and made phased progress. However, the long time series studies from the perspective of multi-scale landscape pattern evolution, taking small- and medium-scale watersheds, especially those in the Yellow River system, as a unit, have not been systematically carried out. Therefore, based on the four periods of land use data in 1990, 2000, 2010, and 2020, taking the Yellow River Basin (Henan section) as the research unit, this paper systematically analyzed the long-term time series spatial-temporal changes of landscape pattern in small- and medium-sized watersheds using land use transfer matrix and land use information atlas. With the help of Fragstats4.2.1 software, No Sampling was used to analyze the landscape pattern fragmentation, patch shape and diversity of the Yellow River Basin (Henan section) from two scales of patch type and landscape type, and to clarify the characteristic differences among various landscape components and evaluate the landscape pattern change degree of the basin. Through geographical detectors, the driving factors of spatial heterogeneity of landscape pattern in river basins are discussed from the aspects of nature and socio-economy, and the factors of spatial and temporal changes of landscape pattern are comprehensively quantified. Our results can improve the understanding of landscape pattern dynamics in river basins and reveal the relationships between the changes of landscape pattern in river basins, social and economic activities, and natural ecological processes, which are of great significance to landscape planning and management, effective utilization of resources, and ecological protection.
2. Materials and Methods
2.1. Overview of Study Area
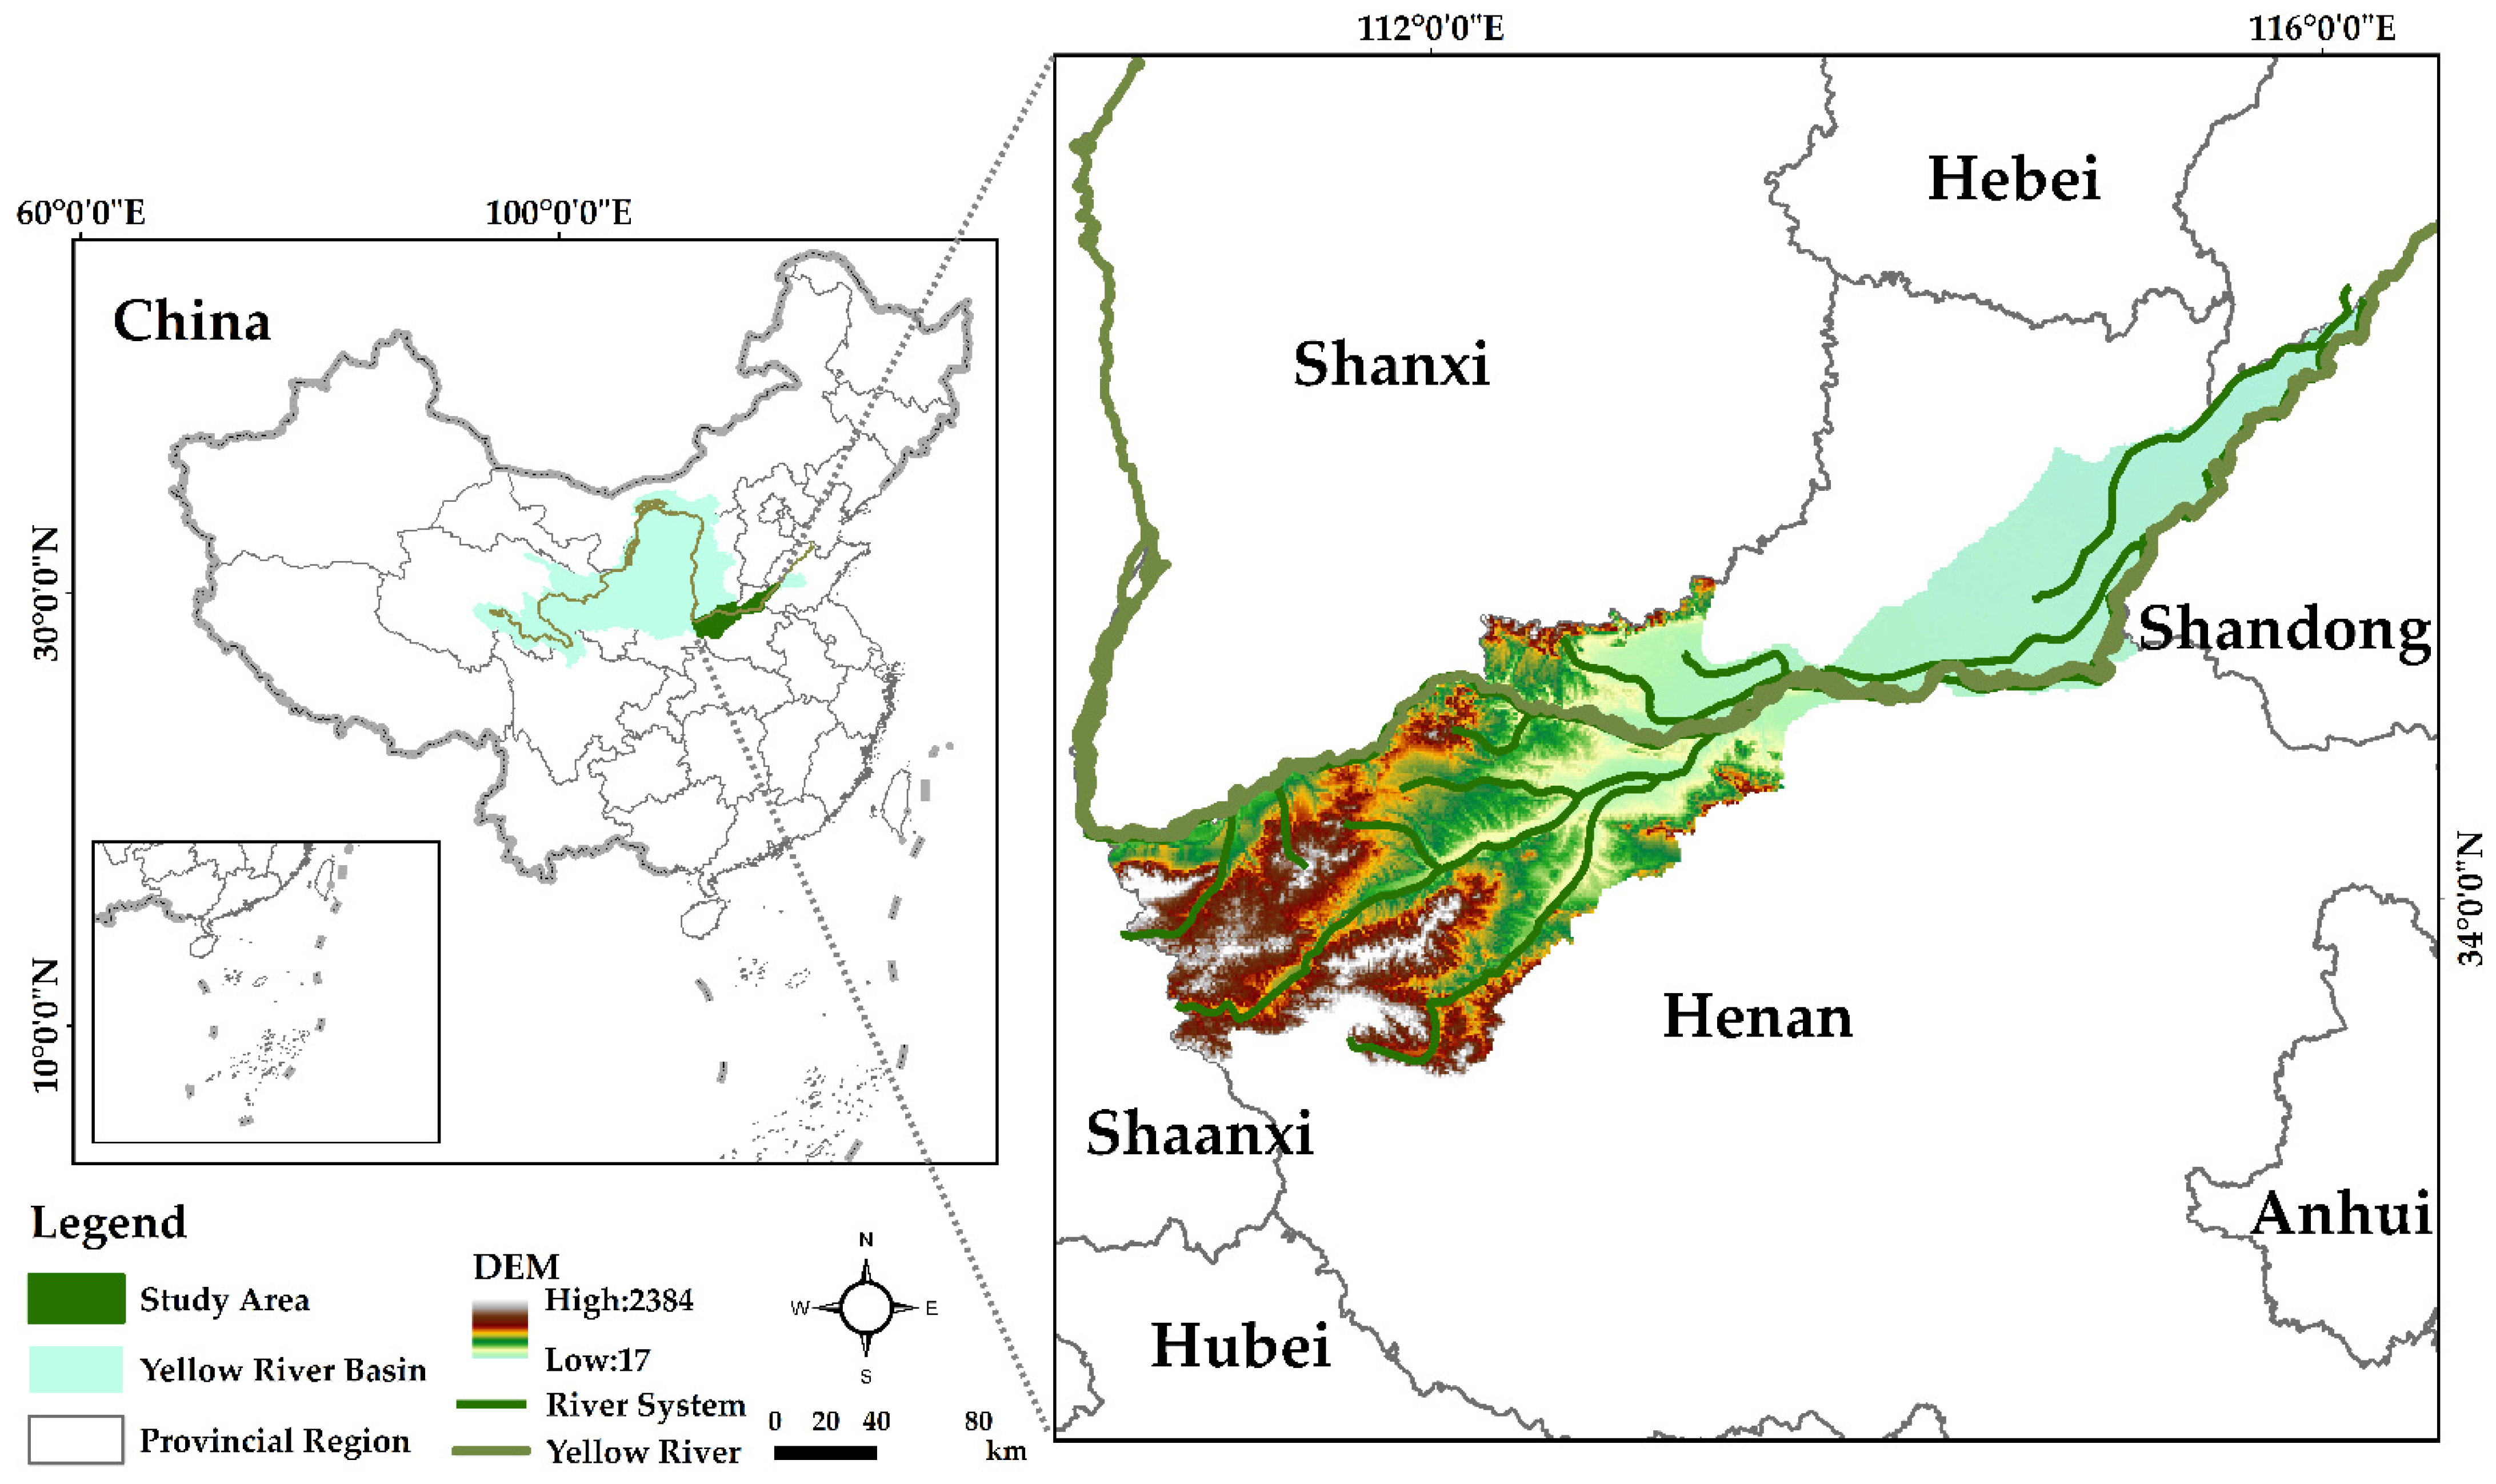
The Yellow River Basin (Henan section) spans the second and third steps of China’s topography and has experienced three different river sections: mountains and valleys, low hills and plains. The valley channel from Sanmenxia to Mengjin, the transition zone from Mengjin to Zhengzhou from the valley channel to the wide and shallow channel, the typical “hanging river” from Taohuayu to Lankao, and the meandering channel to the east of Lankao are very rich in geographical landscape. The Yellow River Basin in Henan Province is located in the middle and lower reaches of the Yellow River Basin. The main river in the province is 711 km long, and the main tributaries are the Yiluo River and Qinhe River. The basin area is 36,200 km2, accounting for 5.1% of the total area of the Yellow River Basin (Figure 1). The Yellow River enters Henan Province in Lingbao city, Henan Province, and flows through eight provincial cities, including Sanmenxia, Luoyang, Zhengzhou, Jiaozuo, Xinxiang, Kaifeng etc. The average annual precipitation of the Yellow River Basin (Henan section) is 450~700 mm, the average annual temperature is 11~15 °C, the average annual sunshine is 1285.7~2292.9 h, and the frost-free period of the whole year is 201~285 d. Rainfall is unevenly distributed in time and space, with the highest time from June to August, showing a trend of more in the south and less in the north in space. The Yellow River Basin (Henan section) mainly belongs to the warm temperate zone, which belongs to the continental monsoon climate from the north subtropical zone to the warm temperate zone. It has the characteristics of four distinct seasons, synchronous rain and heat, complexity and diversity, and frequent meteorological disasters.
The altitude of the Yellow River Basin (Henan section) gradually decreases from southwest to northeast, and the landscape pattern of land use shows the characteristics of woodland and grassland in the middle reaches, cultivated land in the lower reaches, and scattered urban and rural settlements of different sizes. The landscape includes the Yellow River Basin and several water systems, mainly distributed at the junction of the middle and lower reaches. The land use types in the basin are mainly cultivated land and woodland; agriculture is the main pillar industry, and the economic development level is low, which is typical of an agricultural basin.
2.2. Source of Data
The main research data include land use, elevation, meteorology, and socio-economic data (Table 1). The data of land use in 1990, 2000, 2010, and 2020 are from the Resource and Environment Data Center of Chinese Academy of Sciences (https://www.resdc.cn/ (accessed on 9 September 2021)), which has a spatial resolution of 30 m. Among them, Landsat-TM/ETM remote sensing images were used for obtained data for 1990, 2000, and 2010, and Landsat 8 OLI remote sensing images were for 2020. The Kappa coefficient of the dataset was 88.95%, and the overall accuracy was good. In this study, we divide the land use types into six types (Table 2). The Digital Elevation Model (DEM) data came from the geospatial data cloud platform (https://www.gscloud.cn/ (accessed on 9 September 2021)), and slopes are calculated according to DEM data after correction, depression filling and other treatments. The meteorological data come from the temperature and precipitation readings of meteorological stations around the Yellow River Basin (Henan section) provided by the China Meteorological Science Data Sharing Service Network (http://data.cma.cn (accessed on 9 September 2021)), with a spatial resolution of 1 km. Societal raster data (population density and GDP) are from the Resource and Environment Data Center of the Chinese Academy of Sciences (http://www.resdc.cn (accessed on 9 September 2021)) with a spatial resolution of 1 km.
2.3. Study Methods
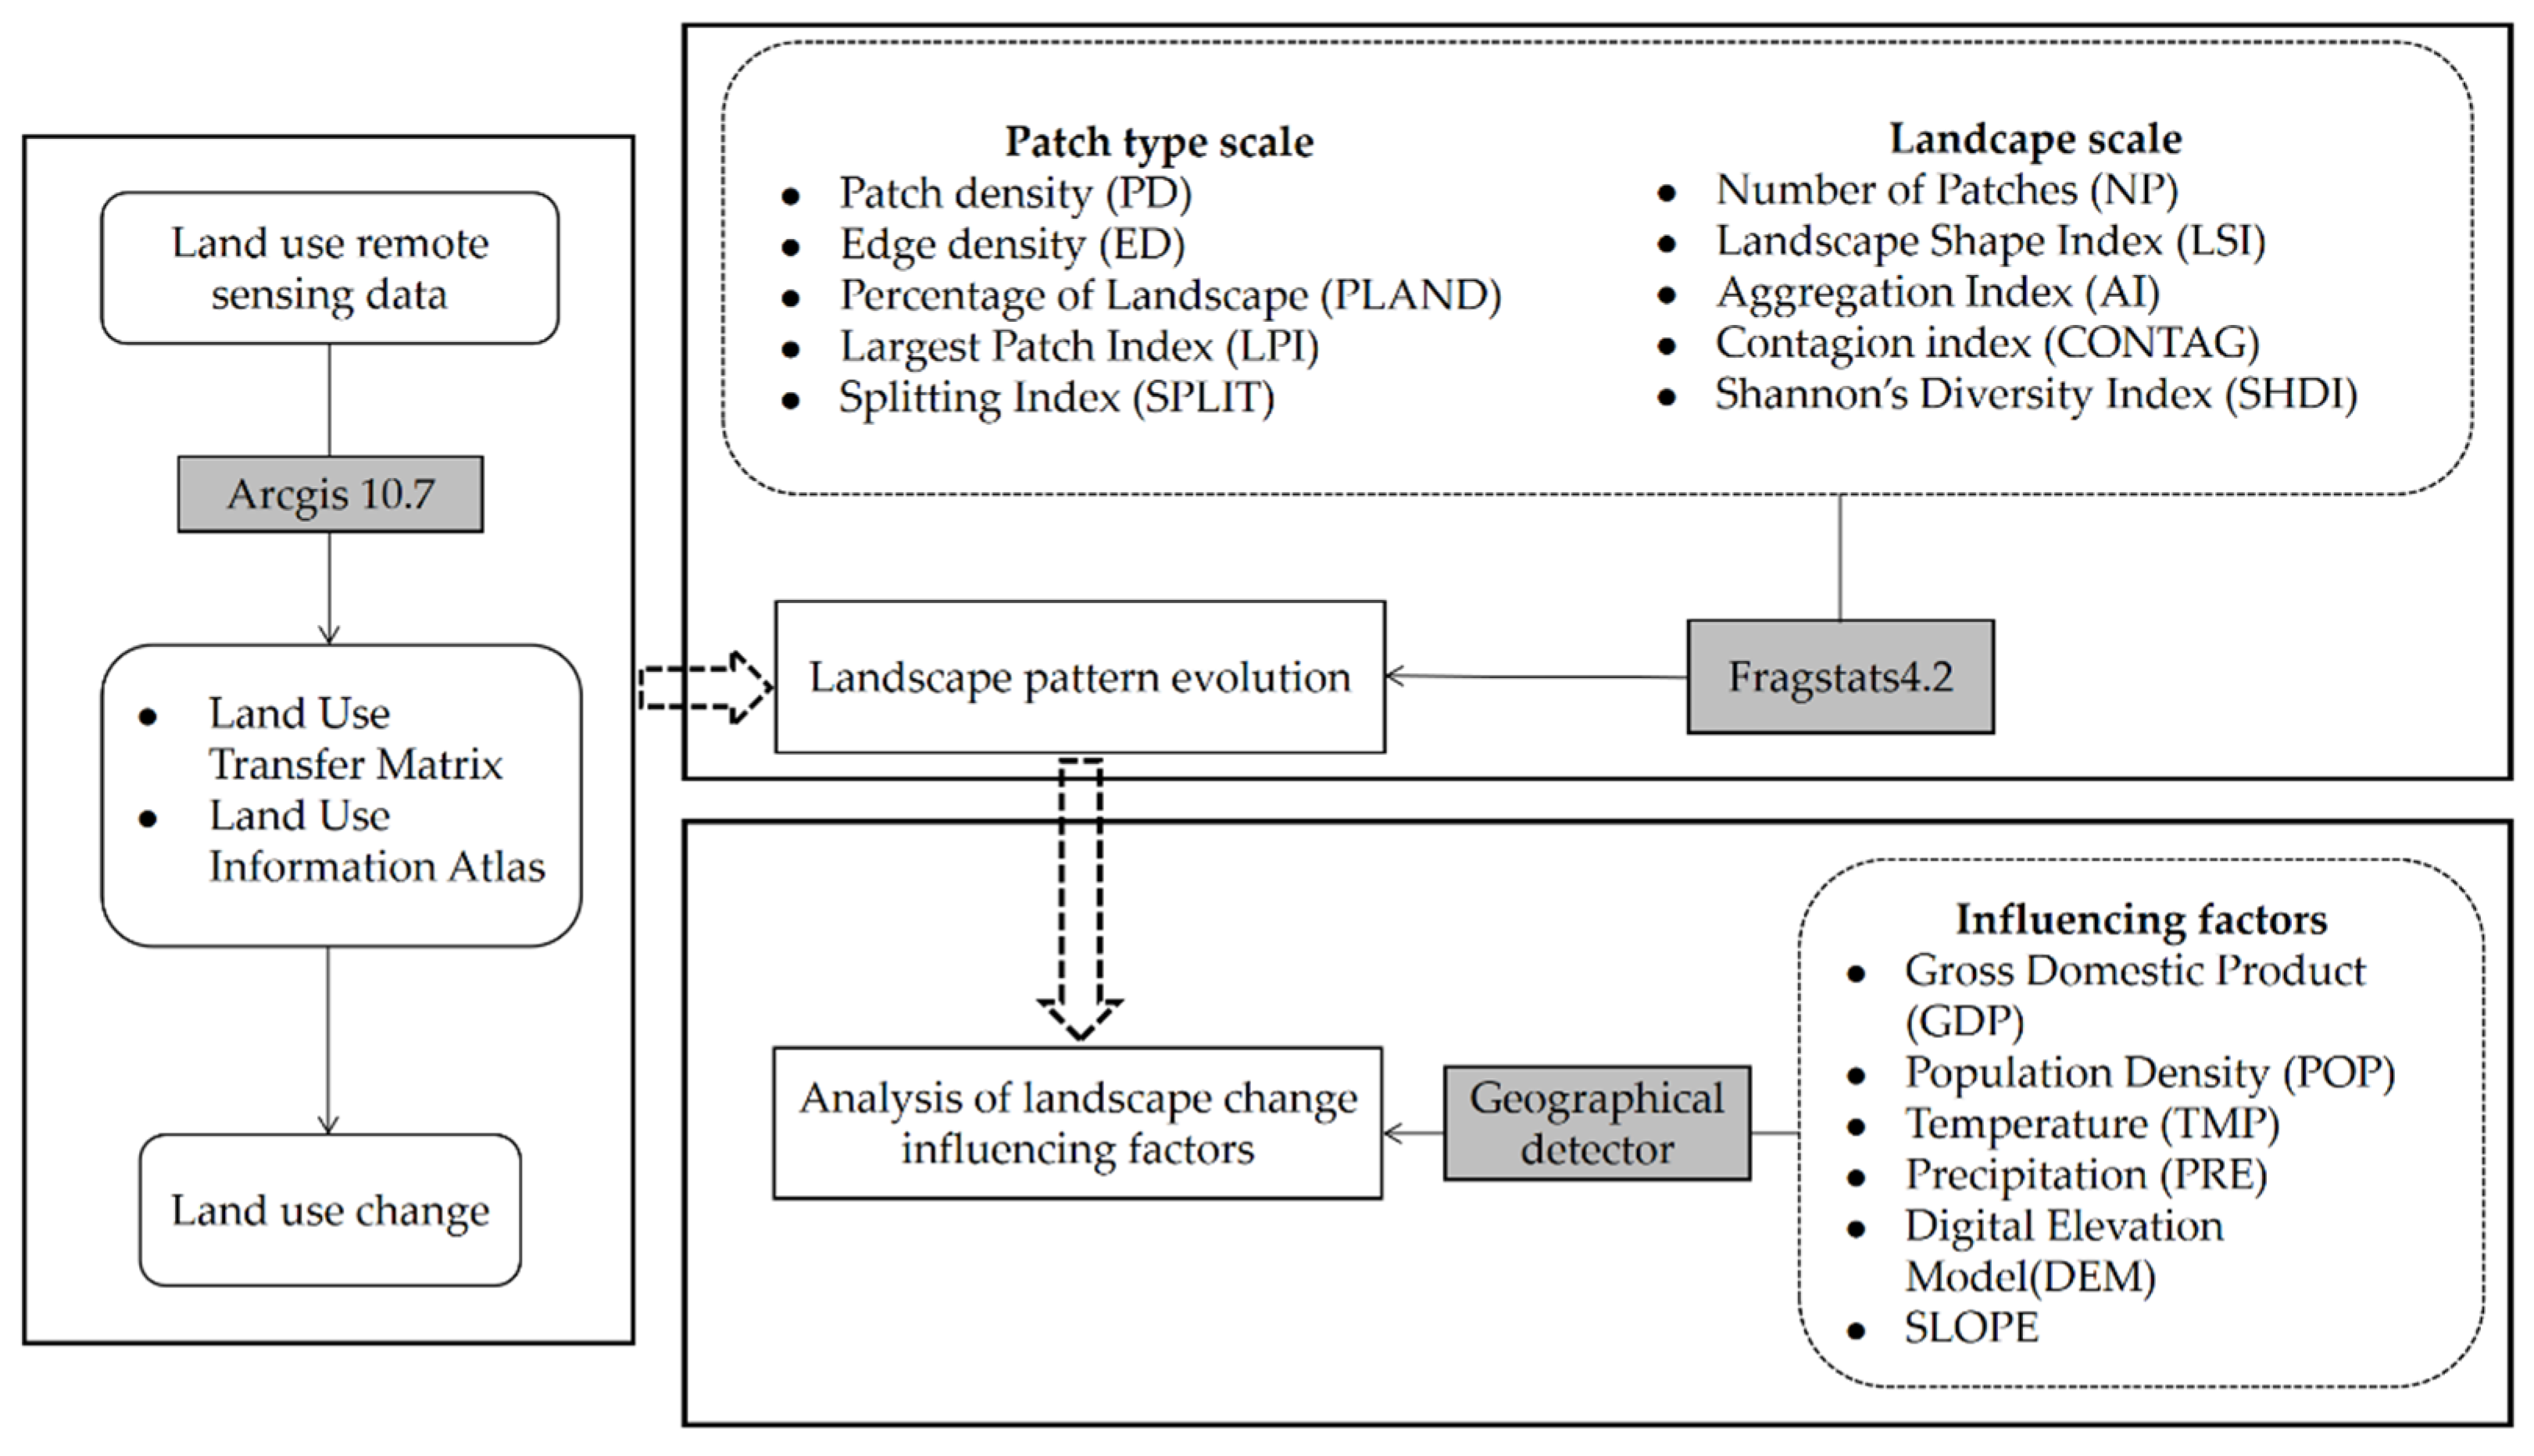
The workflow of the methods in this paper mainly included three steps: land use change, landscape pattern evolution, and analysis of landscape change influencing factors (Figure 2). Land use transfer matrix, land use information atlas, and landscape pattern index were conducted using ArcGIS10.7 and Fragstats4.2. The core methods were described as follows.
2.3.1. Land Use Transfer Matrix
The landscape transfer matrix can quantitatively display the conversion between different landscape types, quantitatively describe the system state and transfer state between different land use types in a certain time series unit, and comprehensively reflect the conversion amount, structural characteristics, and transfer direction of land use type change. The matrix has been widely used in the study of land use change [48,49,50], and its mathematical expression is as follows:
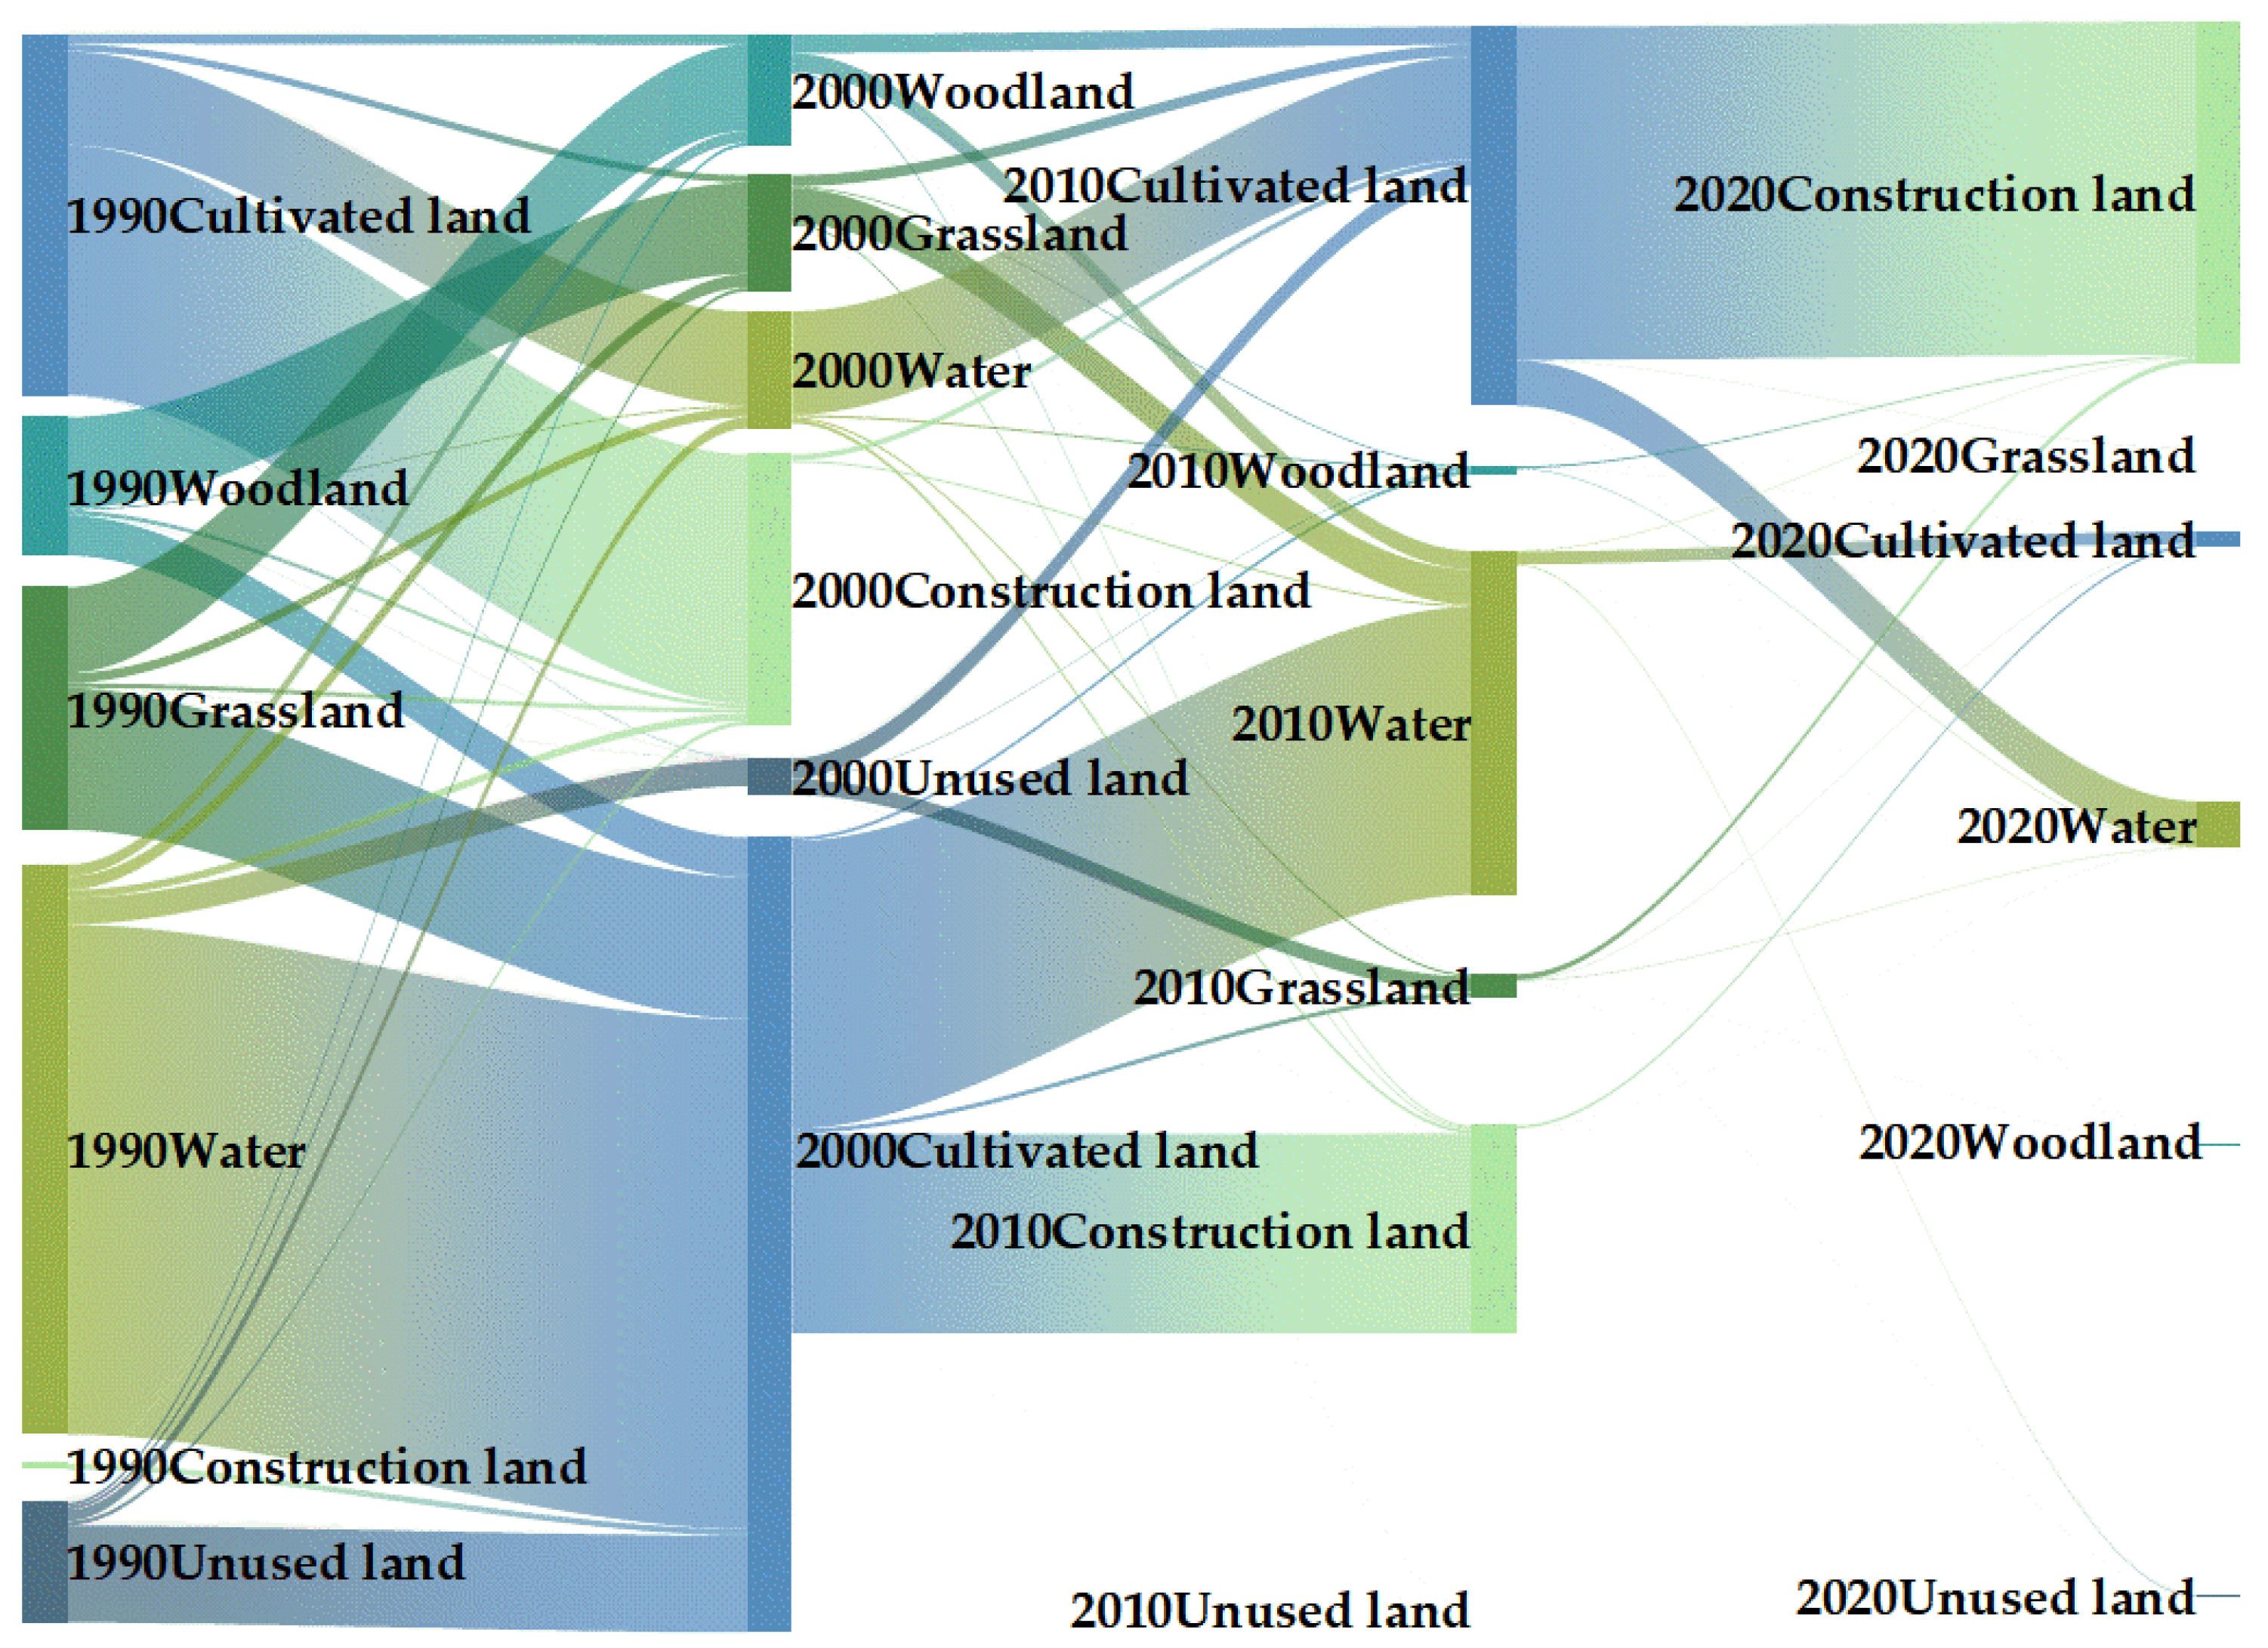
In Formula (1), represents the area where the i-th land use type at the early stage of the research is transformed into the j-th land use type at the end of the research, and i and j are the land use types at the early stage and the end of the research, respectively; n is the number of types of land use [51]. In this paper, the Origin software is used to visualize the land use transfer matrix using a Sankey diagram.
2.3.2. Land Use Information Atlas
A geo-information map is a spatial-temporal composite analysis methodology supported by GIS that can comprehensively reflect the spatial-temporal distribution pattern of land use integration of space-attribute-process. With the support of ArcGIS, the digital codes of four land use types—0000, 000, 00, and 0—are given, and the land use evolution map is obtained by reorganizing the unit types of the land use map. Drawing on the existing research of relevant teams [52,53] and the actual situation of the study area, the pattern changes can be divided into stable, early-stage, late-stage, intermediate, repeated, and continuous patterns (Table 3).
2.3.3. Landscape Pattern Index and Its Influencing Factors
- (1)
- Landscape pattern index: Landscape pattern index is a quantitative research method to describe landscape changes, which can effectively reflect the spatial distribution and structural characteristics of landscape patterns [54]. To fully reflect the landscape spatial pattern characteristics of the Yellow River Basin (Henan section), based on previous studies and the land use situation in the study area, the ecological significance of each landscape pattern index was comprehensively considered [55]. In this study, a series of landscape pattern indicators (Table 4) were selected at the patch-type scale and landscape scales, and the characteristics of quantity, shape, and spatial distribution of landscape elements in the Yellow River Basin (Henan section) were analyzed. The patch type scale refers to the spatial distribution characteristics of each land use type landscape, and the landscape scale refers to the spatial distribution characteristics of the whole landscape.
- (2)
- Selection of influencing factors of landscape change: The influencing factors of landscape development are different in different time and space scales, and most studies divide them into natural factors and socio-economic factors [56]. This study mainly analyzes the spatial differences of landscape heterogeneity caused by natural factors and socio-economic factors. Therefore, this study selects the spatial distribution data of Gross Domestic Product (GDP) and Population Density (POP) to represent the spatial differences between socio-economic level and population density. In addition, it is found that climatic conditions have a small impact on the landscape spatial distribution of small-scale watersheds [57], and landscape spatial heterogeneity can be explained by terrain factors [58,59]. Therefore, this study selects the spatial data of Temperature (TMP) and Precipitation (PRE) to represent the climatic conditions. The meteorological data comes from the temperature and precipitation of meteorological stations around the Yellow River Basin (Henan section) provided by the Resources and Environment Data Center of China Academy of Sciences (https://www.resdc.cn/ (accessed on 9 September 2021)). Temperature is characterized by the average temperature of 12 months, and precipitation is characterized by the total precipitation of 12 months. Moreover, topographic variables (DEM and SLOPE) are also considered.
2.3.4. Analysis of Landscape Influencing Factors
Geographic detector: The geo-detector model is a new statistical method to detect spatial differences and reveal the influencing factors behind them, which mainly measures the explanatory power of independent variables to dependent variables by analyzing the overall differences among various types of geographic spaces [60,61]. In this study, the geographical detector model is used to detect the natural and socio-economic factors that affect the spatial heterogeneity of the landscape pattern in the Yellow River Basin (Henan section). This method has a concise form and a clear physical meaning, that is, the embodiment of q-value, which quantifies the influence of different influencing factors on the spatial distribution of landscape indicators between 0 and 1 to reflects the degree of spatial heterogeneity of landscape indicators. The larger the q-value, the stronger the heterogeneity of the landscape pattern. The model has four detector modules. This study mainly uses “factor detector” and “interaction detector” to quantitatively analyze the factors affecting the spatial heterogeneity of landscape pattern in the Yellow River Basin (Henan section) and obtains the relative importance of each influencing factor and the interaction among them.
- (1)
- Factor detection: Detect the explanatory power of each influence factor X to the target factor Y, measured by q-value, and the expression is:
In Formula (2), q is the index of the detection power of the influencing factors of spatial differentiation, and the value interval is [0, 1]; L is the stratification of variable Y or factor Y; Nh is the number of sample units in layer h; N is the number of sample units in the whole area; σh² is the variance of layer h; σ² is the variance of the whole area.
When running the geographic probe model, each factor needs to be discretized, and combining with the actual situation of the region, the natural breakpoint method is mainly used for classification. GDP, POP, TMP, PRE, DEM, and SLOPE are divided into five categories by natural fracture method. Using ArcGIS 10.7 software to create fishing net tools, 5 km × 5 km grid points were created in the whole area, and the data set was resampled based on the nearest distance method. After filtering and sorting the exported data, the missing values were deleted, and 1393 pieces of data were obtained. Taking the landscape pattern index of the Yellow River Basin (Henan section) as the Y variable, the data of six factors, GDP, POP, TMP, PRE, DEM, and SLOPE, as the X variables, are input into the geographic detector for detection. Finally, the analysis results of the influence intensity and interaction of each driving factor on the landscape spatial heterogeneity of the Yellow River Basin (Henan section) are obtained.
- (2)
- Interactive detection: This method can be used to identify the interaction between different influencing factors X, that is, to evaluate whether the interaction of two influencing factors X1 and X2 will increase or decrease the explanatory power of dependent variable Y, or whether the influences of these factors on Y are independent of each other. The evaluation method is to first calculate the q-values of two factors X1 and X2 for Y: q(X1) and q(X2), respectively, and calculate their interactive values: q(X1∩X2), and compare q(X1), q(X2), and q(X1∩X2). The relationship between the two factors can be divided into the following categories (Table 5):
3. Results
3.1. Land Use Space and Area Distribution
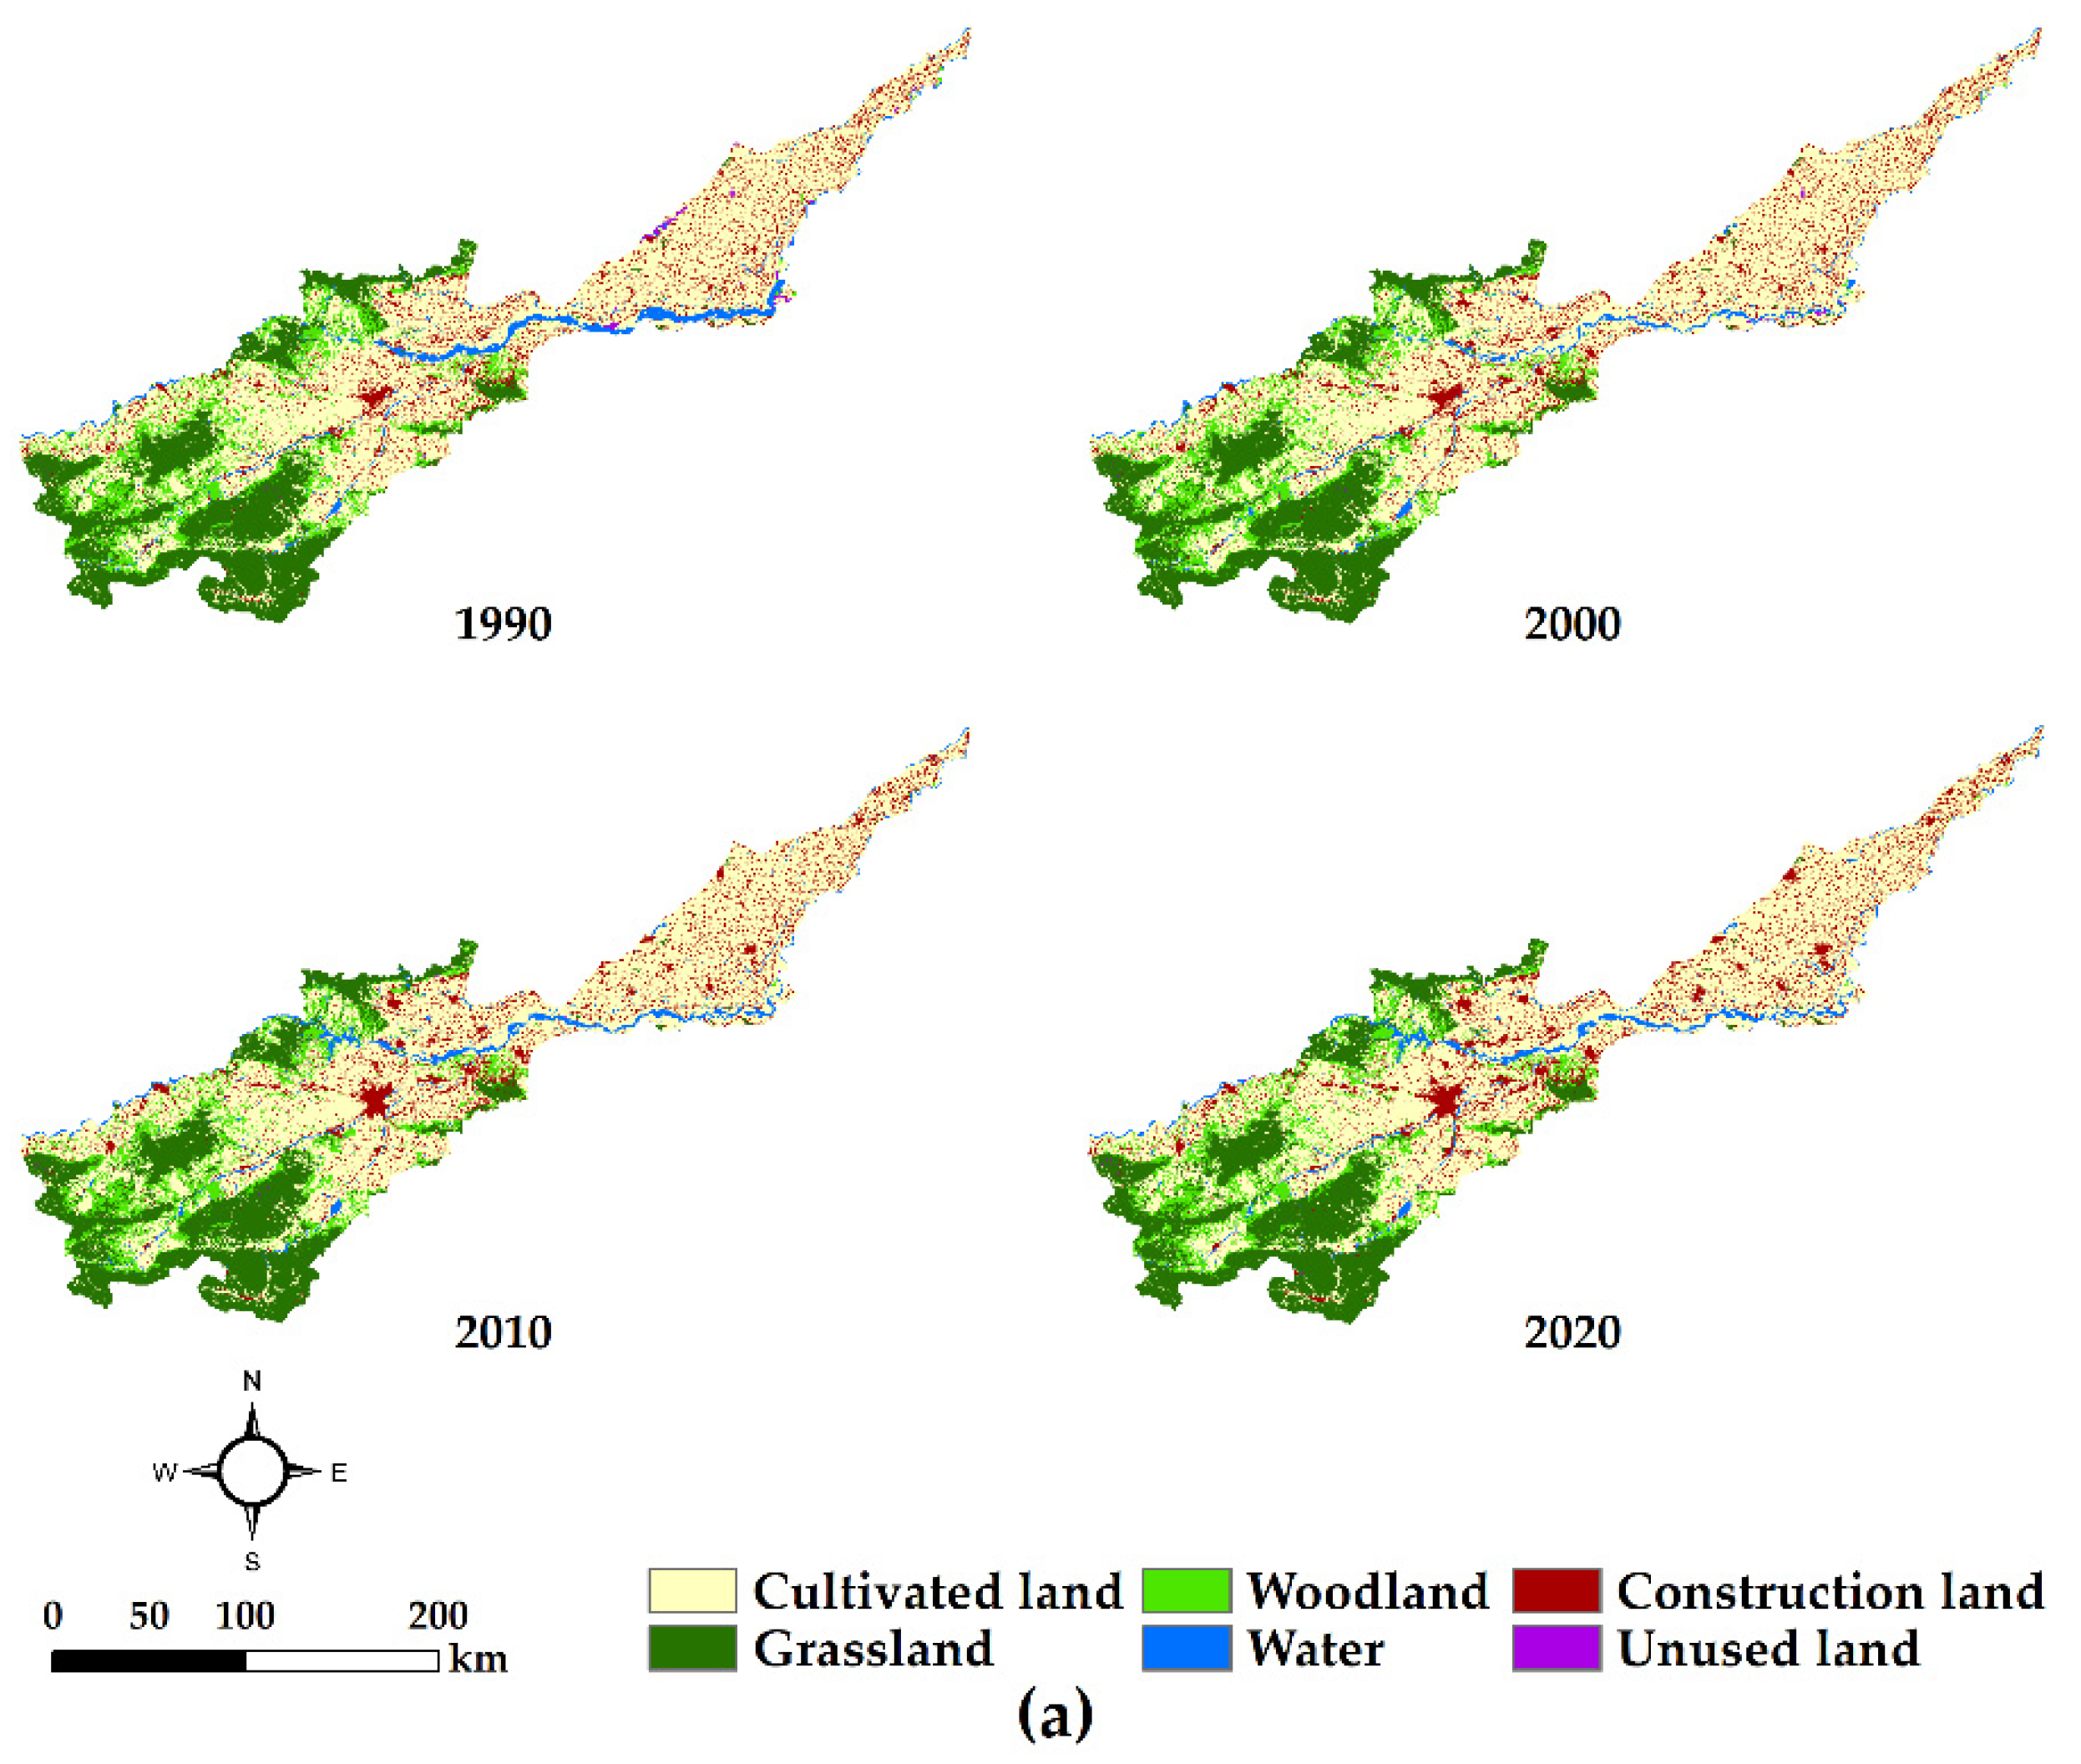
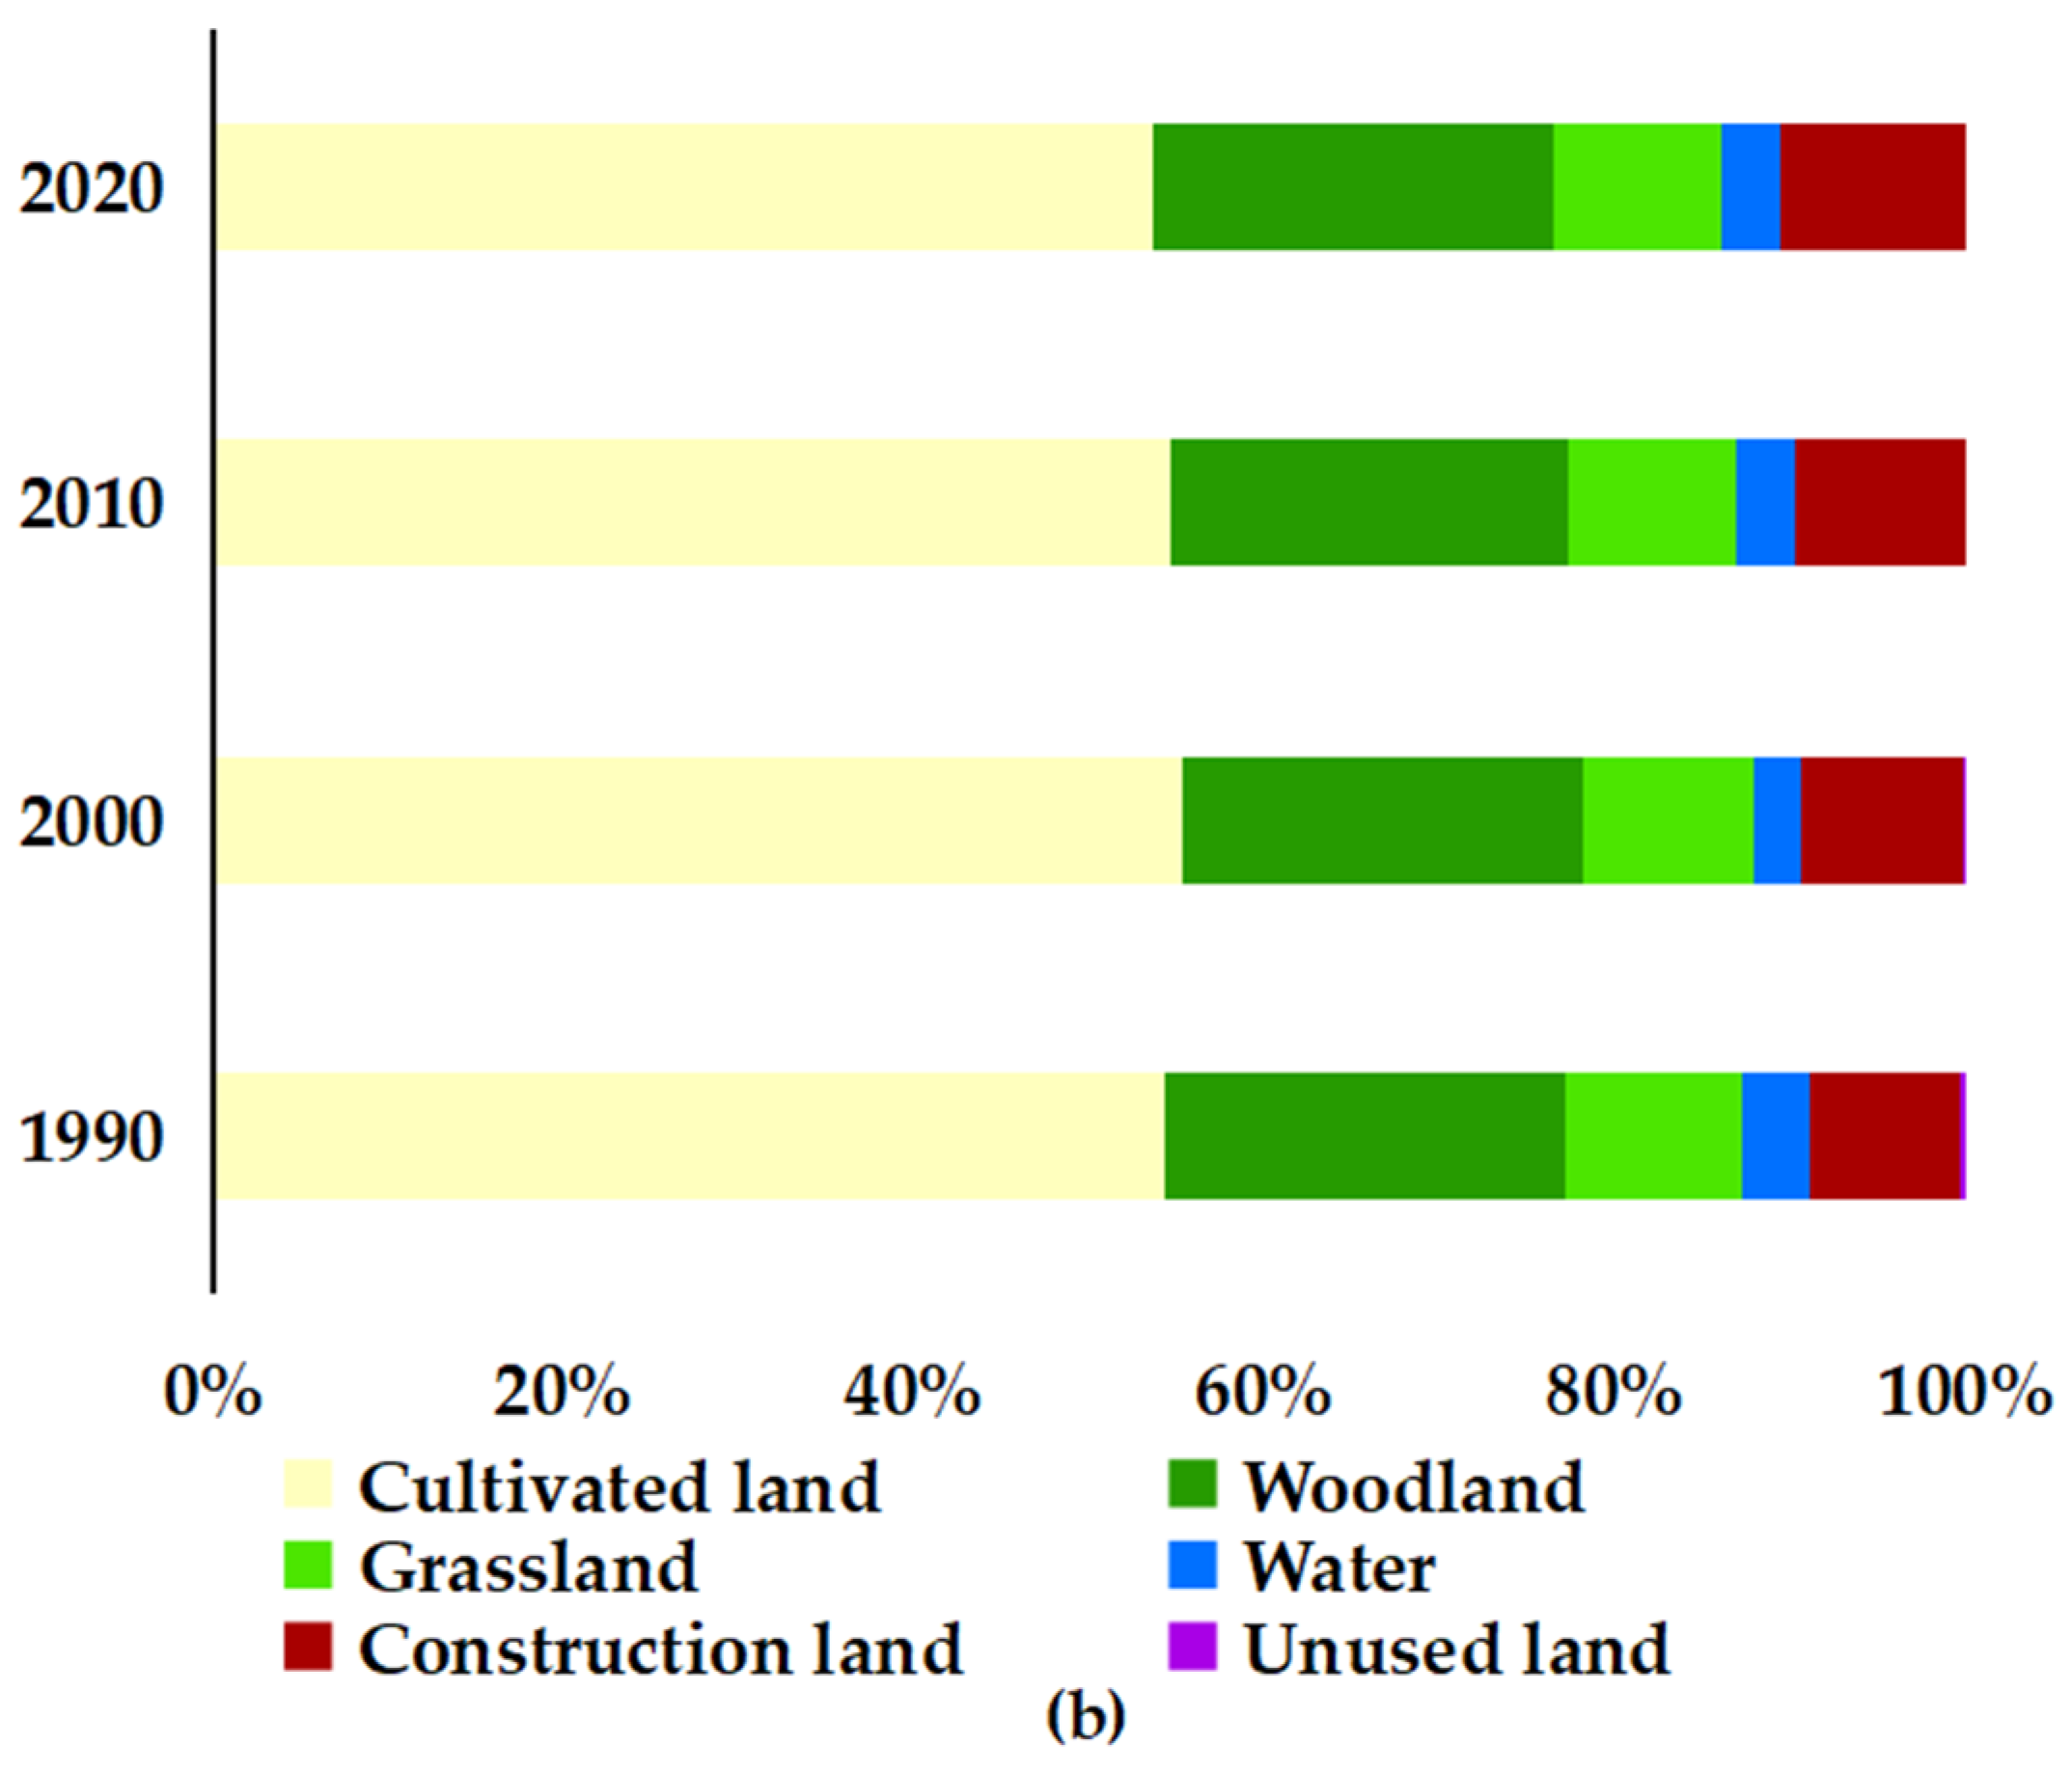
The distribution of land use space and area in the Yellow River Basin (Henan section) from 1990 to 2020 is shown in Figure 3. Cultivated land is widely distributed in the middle and lower reaches of the basin, and the distribution area in the middle reaches is larger than that in the lower reaches. Woodland and grassland are mainly distributed in the middle reaches of the basin, showing a concentrated distribution state. The waters are the Yellow River and its tributaries, which flow from east to west. Urban and rural construction land is concentrated in the middle reaches of the basin and scattered in the lower reaches. Unused land accounts for a small proportion, which is scattered in the middle and lower reaches of the basin. It is the dominant land use type in basin, with the widest distribution range and an average area accounting for 54.87% of the total for many years, showing a trend of first increasing and then decreasing as a whole. Woodland, with an average area of 22.73% of the total for many years, shows a trend of first decreasing and then increasing. The average area of grassland accounts for 10.38% of the total for many years, showing a slow decreasing trend as a whole. The average area of water accounts for 3.2% of the total for many years, showing a trend of first decreasing and then increasing. The average area of urban and rural construction land accounts for 8.76% of the total over many years, showing a slow increasing trend as a whole. The average area of unused land is relatively small, accounting for 0.15% of the total over many years.
During the 30 years from 1990 to 2020, the areas of various land types in the Yellow River Basin (Henan section) have changed to different degrees and trends (Table 6). Cultivated land, woodland, and grassland are the main types of land use in the basin. The cultivated land area increased first and then decreased; from 1990 to 2000, it increased substantially and then decreased to the level of 1990 in 2010. The change trend of woodland area is opposite that of cultivated land, showing a trend of first decreasing and then increasing, with a slight decrease from 1990 to 2010, and then increasing to the level of 1990 in 2020. The increased amount of woodland is mainly distributed in the middle reaches of the basin. The grassland area showed a small downward trend, with a decrease of about 1.15% in 2020 compared with 1990. The water area decreased by about 1.21% from 1990 to 2000, and then increased slightly. Urban and rural construction land showed a substantial growth trend, with an increase of 1270.25 km² in 2020 compared with 1990, reflecting the accelerating urbanization process in China. The unused land area accounts for a very small proportion, and its area change is related to that of other land types. After 2000, with the increase in woodland, water area, and urban and rural construction land area, the area of unused land has been further reduced.
3.2. Temporal and Spatial Change of Land Use
The change of land use types shows two kinds of change behaviors: inflow and outflow. The outflow behavior refers to the transformation of a land use type to other land use types, while the inflow behavior refers to the transformation of other land use types to this land use type (Table 7). From 1990 to 2020, a total of 868.98 km² of cultivated land in the Yellow River Basin (Henan section) was transformed into other land types. The area of cultivated land converted from other land types was about 643.10 km², of which 76% went to construction land and 25% to woodland, grassland and waters. The decrease in cultivated land area is mainly due to the occupation of construction land, and the increase in cultivated land area mainly came from the occupied waters and grasslands. Among them, the area converted from waters accounted for 59% of the increased area of cultivated land, and that from grassland accounted for 20%. The inflow and outflow of forestland area are basically balanced—mainly between cultivated land and grassland—and outflow behavior has dominated the grassland for 30 years. The area of forest land converted to other land types was 387.13 km², and that of other land types converted to forest land is 183.58 km². The outflow of water was the leading factor, and the area of water converted to other land types was about 405.01 km², and other land types converted to the area of water was 256.24 km², which was mainly converted to cultivated land. Construction land was dominated by inflow. In the past 30 years, the area of construction land has obviously increased, and the area of other land types converted into construction land was about 693.36 km². The expansion of construction land was mainly occupied by cultivated land, and about 95% of the newly increased construction land came from the occupation of cultivated land.
In addition, land use transformation also showed a big difference in time and space. In time, the Sankey diagram in Figure 4 temporally visualizes the transformation of each land use type in the Yellow River Basin (Henan section) in different periods. During 1990–2000, waters were transformed into other land types, and most of them were converted to cultivated land. Grassland also had an obvious outflow trend, mainly flowing to cultivated land and woodland. The outflow and inflow of cultivated land were obvious; the inflow land use type was mainly water area, and the outflow land use type was mainly construction land. During the 10 years from 2000 to 2010, the outflow of cultivated land dominated, mainly flowing to water areas and construction land, and the overall outflow was greater than the inflow. From 2010 to 2020, cultivated land was transformed into other land types, mainly into construction land and water areas. On the whole, the mutual transformation of land use types in each period from 1990 to 2020 was active, and the transformation tracks were diverse.
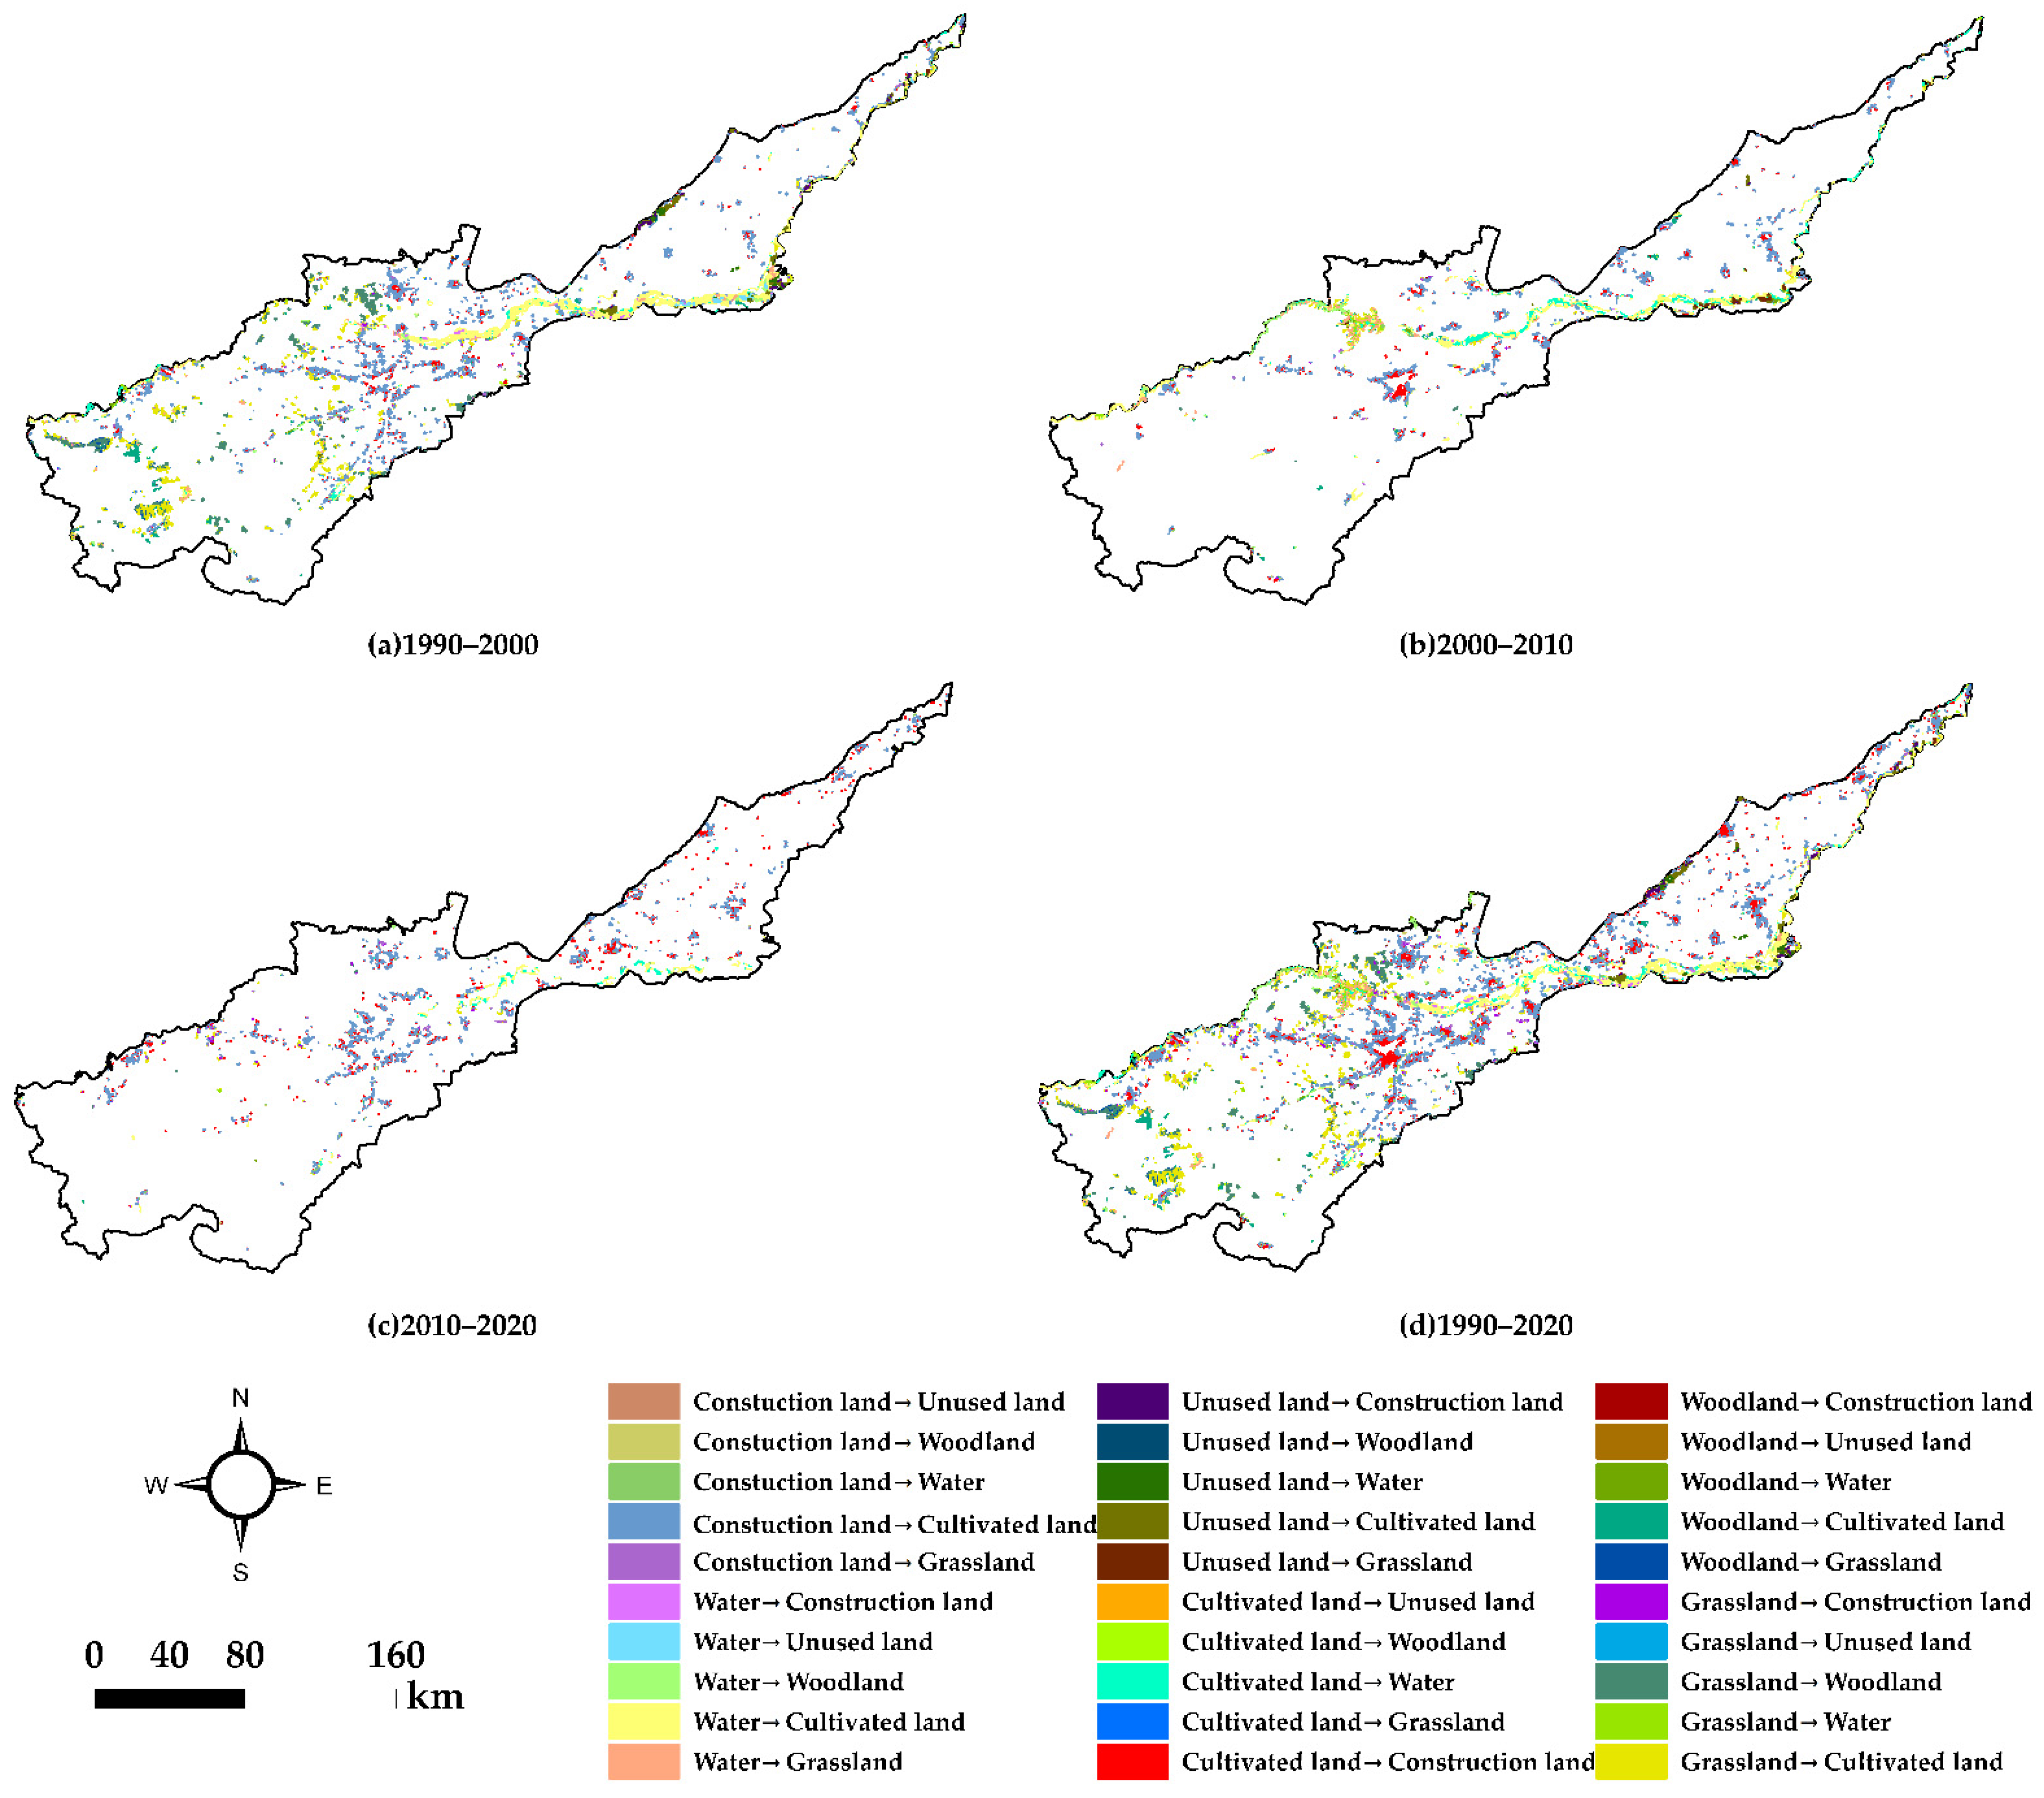
Spatially (Figure 5), the map patches that changed from 1990 to 2000 were mainly concentrated in the middle reaches of the Yellow River (Henan section) and along the Yellow River channel. From the point of view of the transformation of land use types, this period was mainly involved the transformation of cultivated land, grassland, woodland, and waters to other land use types, and the situation of the Yellow River channel turning into cultivated land was more prominent. From 2000 to 2010, the transformation of land use types in the basin was evenly distributed in the middle and lower reaches, mainly from cultivated land to water area and construction land, and the transformation of land use types along the Yellow River was more intense than that in the previous stage. From 2010 to 2020, the transformation of land use types in the upper and lower reaches of the basin was more drastic. Among them, the transformation of cultivated land in the lower reaches of the basin was obvious, and the transformation of land use types along the Yellow River was obviously weakened. On the whole, the changes of land use types in the basin were mainly concentrated in the middle and lower reaches of the plain, and those from 1990 to 2000 were significantly higher than those in other periods.
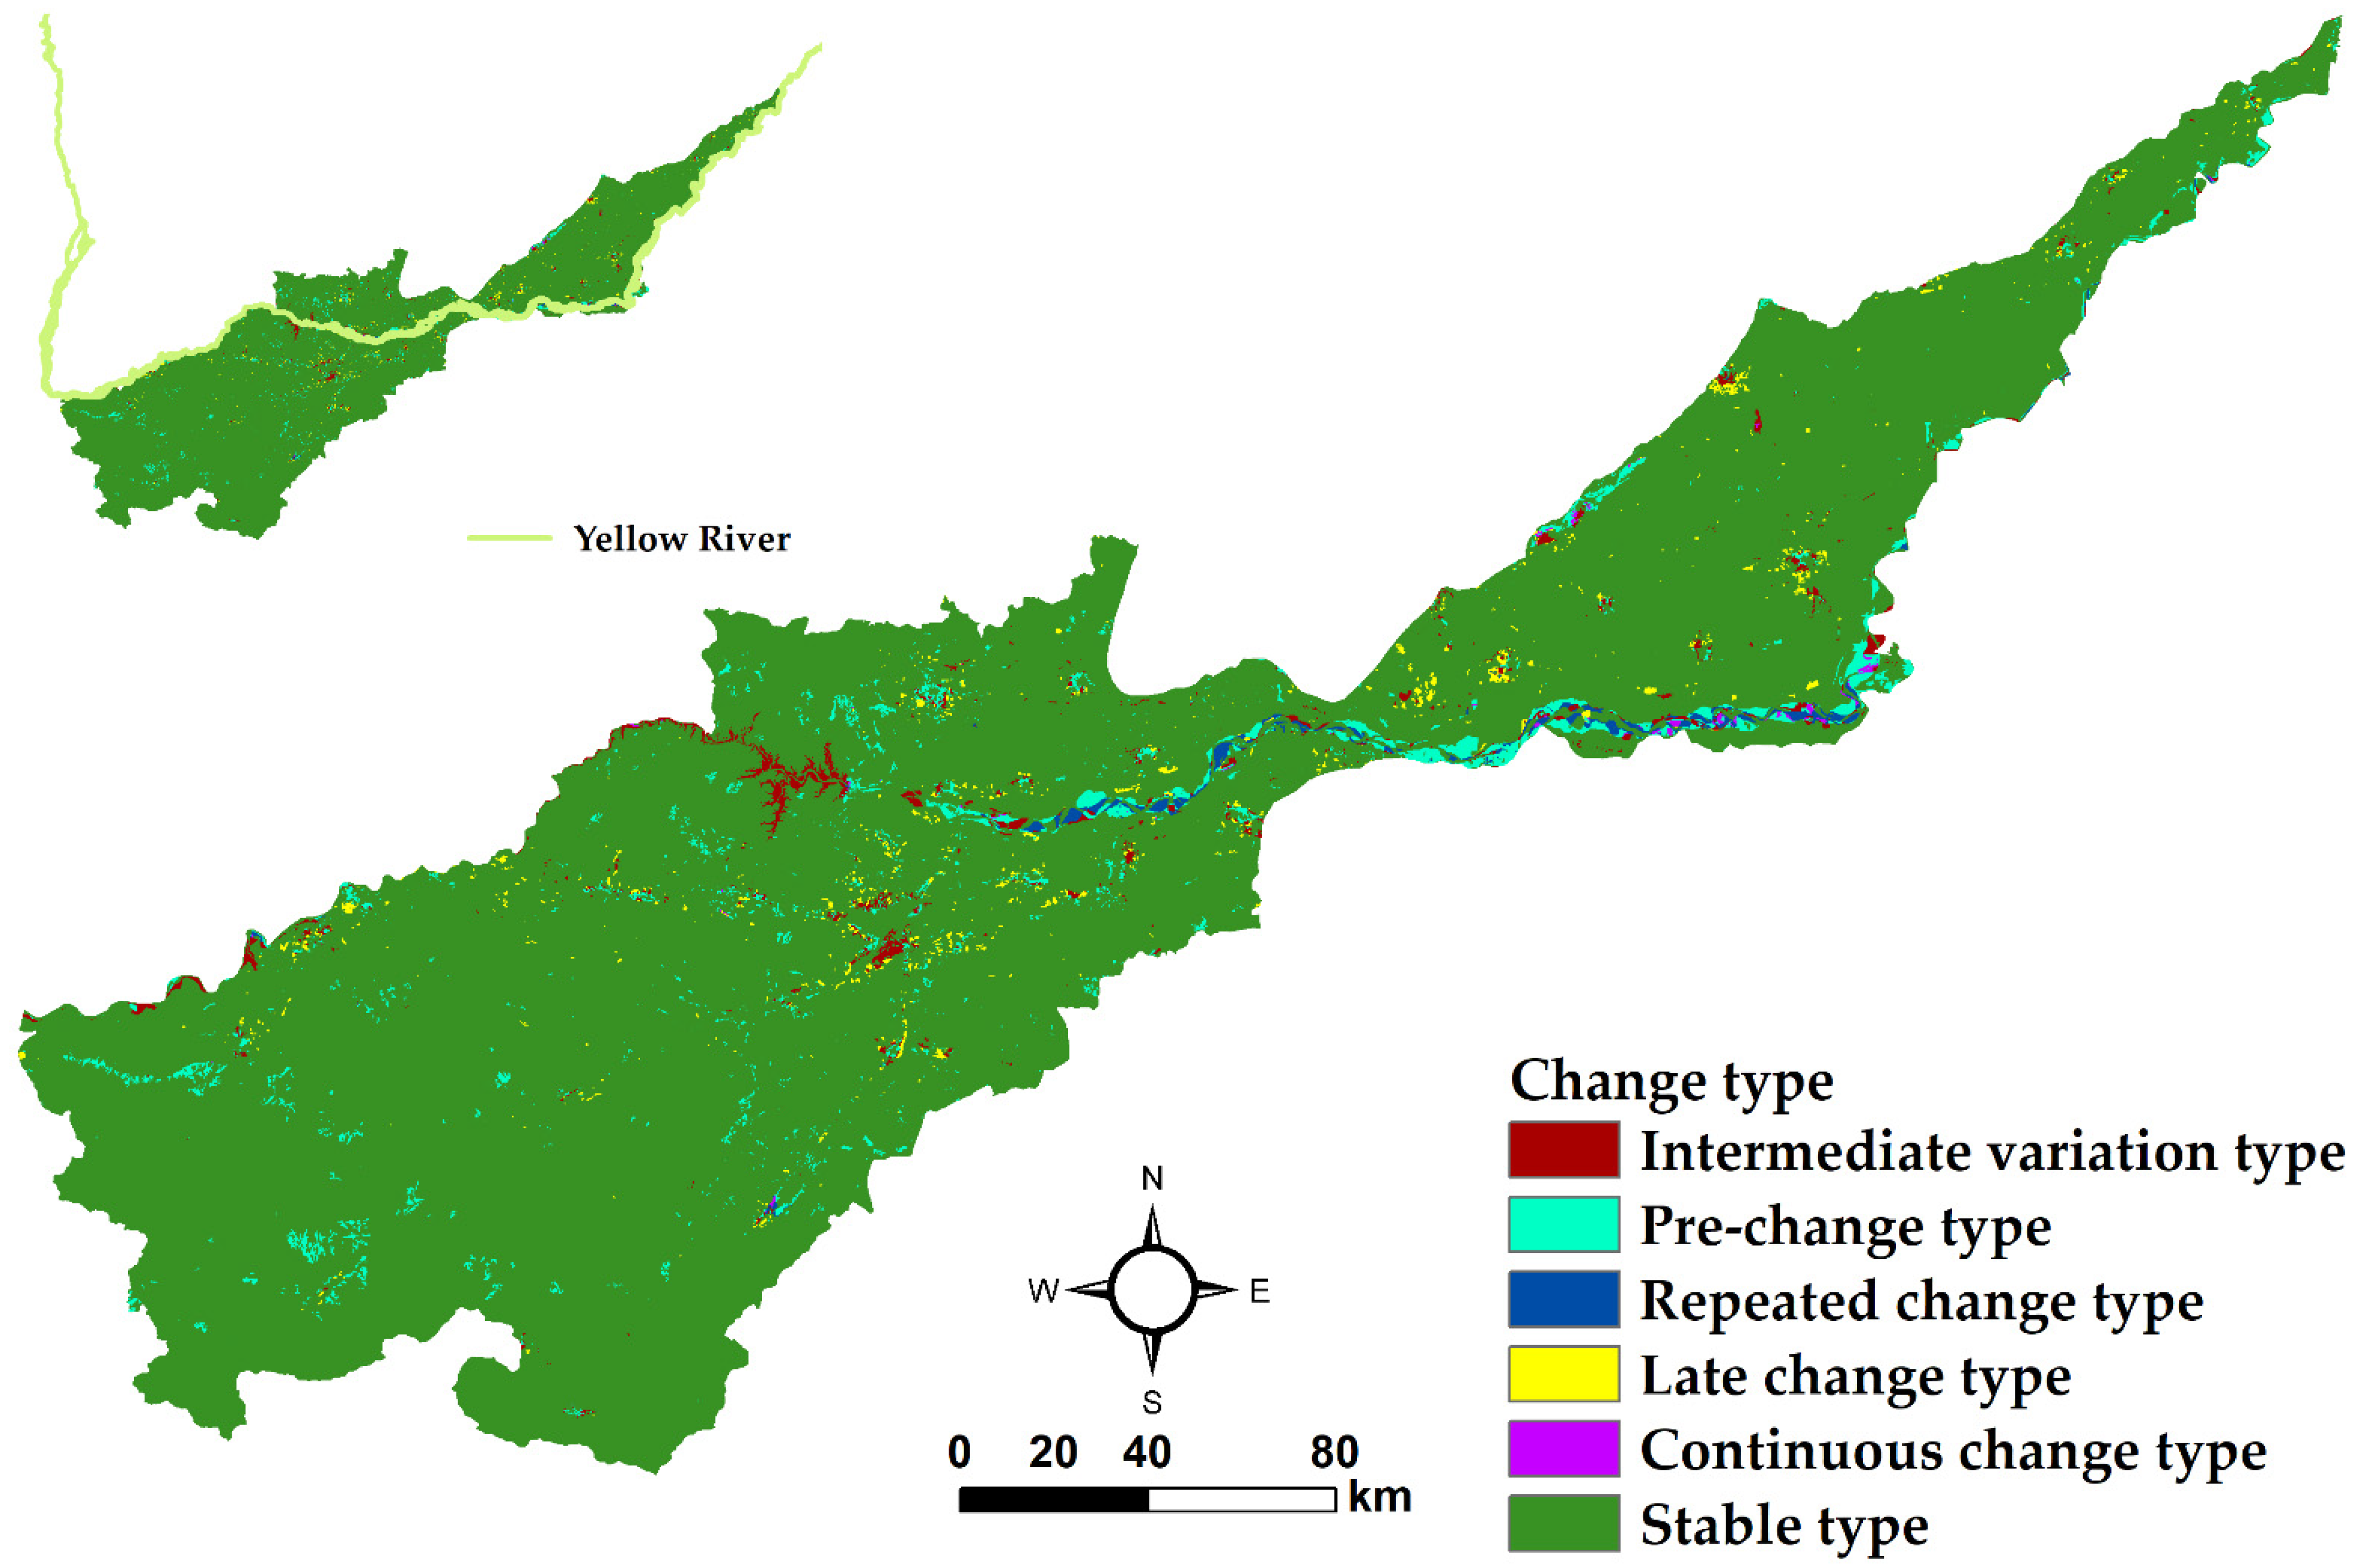
According to the spatial analysis, the structure of the land use change in the Yellow River Basin (Henan section) from 1990 to 2020 was complicated (Figure 6). The stable structural type was the most widely distributed, accounting for 94.63% of the whole basin area, and it was mainly composed of two stable types: “cultivated land-cultivated land-cultivated land-cultivated land” and “woodland-woodland-woodland-woodland”, which indicates that the landscape pattern of the basin dominated by cultivated land has not changed fundamentally at present. The pre-change type accounted for 2.74% of the whole watershed area, and water area changing to cultivated land, cultivated land changing to construction land, and grassland changing to cultivated land accounting for 28.71%, 20.86%, and 11.82% of the changing area in the pre-change type, respectively. The intermediate type accounted for 1.19% of the whole watershed area, mainly including “cultivated land-cultivated land-construction land-construction land”, “cultivated land-cultivated land-water area-water area”, and “water area-water area-cultivated land-cultivated land”, accounting for 38.79%, 26.67%, and 16.15% of this type of change structure area, respectively. The late-stage change type accounted for 0.82% of the watershed area, which mostly comprised the change from cultivated land to water area, accounting for 92.14% of the area of this type of change structure. The recurrent pattern accounted for 0.51% of the total watershed area, which was mainly manifested in the mutual transformation between cultivated land and water area, namely “water area-cultivated land-water area-water area” and “cultivated land-water area-cultivated land-cultivated land”, accounting for 65.11%, 6.75%, and 6.21% of the recurrent pattern, respectively. The least was the continuous change type, which accounted for only 0.10% of the total area of the study area. The maps of “water area-unused land-cultivated land-cultivated land”, “water area-woodland-cultivated land-cultivated land” and “water area-grassland-cultivated land-cultivated land” were the main maps, and the changes among various land use types were very drastic. Spatially, the stable type occupies a large area and was widely distributed in the Yellow River Basin (Henan section), and its later variability was mainly distributed in the middle and lower reaches of the basin in patches, but the lower reaches were relatively more fragmented and had poor continuity. Affected by tourism development activities, four types—repeated change, early change, intermediate change, and continuous change, were concentrated in the vicinity of the Yellow River. Specifically, the continuous change type was mainly distributed in the middle reaches of the Yellow River basin in patches, and the repeated change type was mainly distributed around the Yellow River. The early change type and the middle change type were significantly broken, and they are mainly scattered in patches or strips among the four main information map types: stable, continuous, repeated, and late change types.
3.3. Spatial-Temporal Change of Landscape Pattern
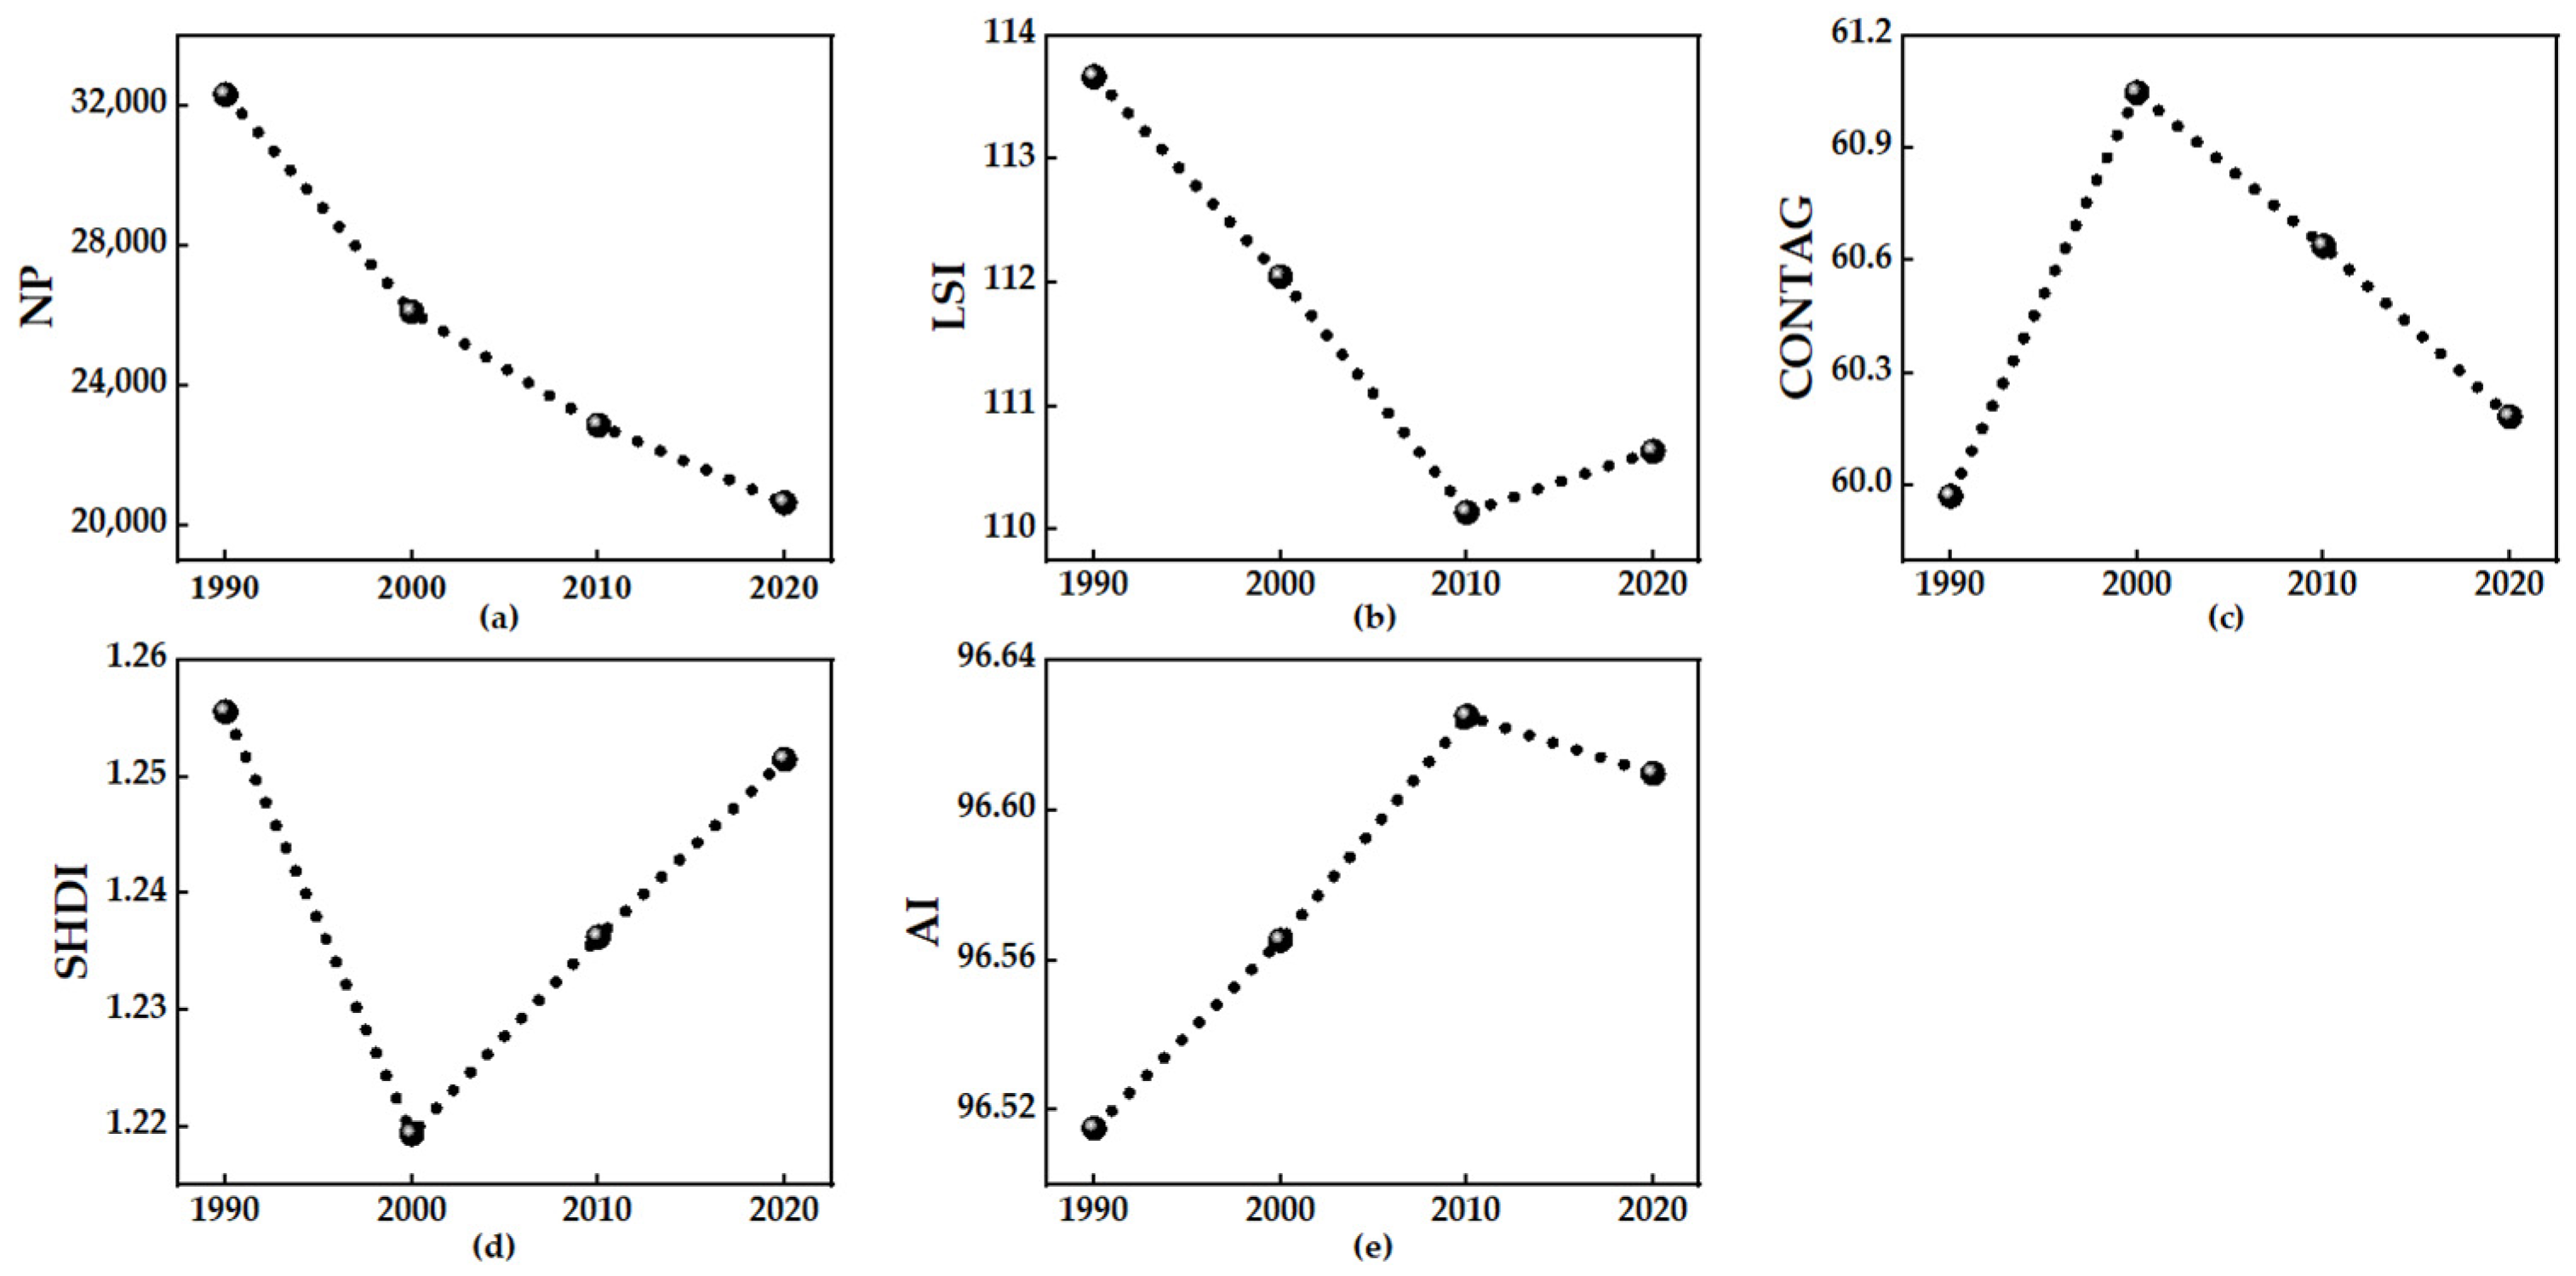
Different landscape pattern indexes of landscape scale and patch type scale were calculated at a scale of 30 × 30 m. The former represents the spatial distribution characteristics of the whole landscape, while the latter reflects the spatial distribution characteristics of various land use types. From the five landscape indexes at the landscape level, the landscape characteristics of the whole area of the Yellow River Basin (Henan section) can be clearly defined (Figure 7). From 1990 to 2020, the total number of Number of Patches (NP) decreased (32,317 to 20,654), the total number of NP decreased by 11663, and the number of visible patches decreased, indicating that the degree of landscape fragmentation decreased. Landscape Shape Index (LSI) decreased first and then increased, with a maximum in 1990 (113.67) and a minimum in 2010 (110.14). The total LSI decreased by 3.03, indicating that the patch shape tended to be stable. Contagion index (CONTAG) showed a trend of “increasing first and then decreasing”, and the maximum value appeared in 2000 (61.05), which indicated that the CONTAG of the landscape reached a maximum in 2000, and the landscape had a good geographical distribution and connectivity. Contrary to CONTAG, Shannon’s Diversity Index (SHDI) showed a trend of “first decreasing and then increasing”, and SHDI showed an increasing trend from 2000 to 2020, indicating that the landscape patch types were constantly balanced and landscape heterogeneity was enhanced. Aggregation Index (AI) increased continuously in 1990–2010 and decreased slightly in 2010–2020, with a maximum in 2010 (96.63%), and the overall AI increased by 0.09%, indicating that the degree of aggregation among patches increased slightly, and the degree of landscape fragmentation decreased. It can be seen that in the past 30 years, the Yellow River Basin (Henan section) generally showed a trend of decreasing landscape fragmentation, increasing landscape heterogeneity, and constantly balancing landscape patch types.
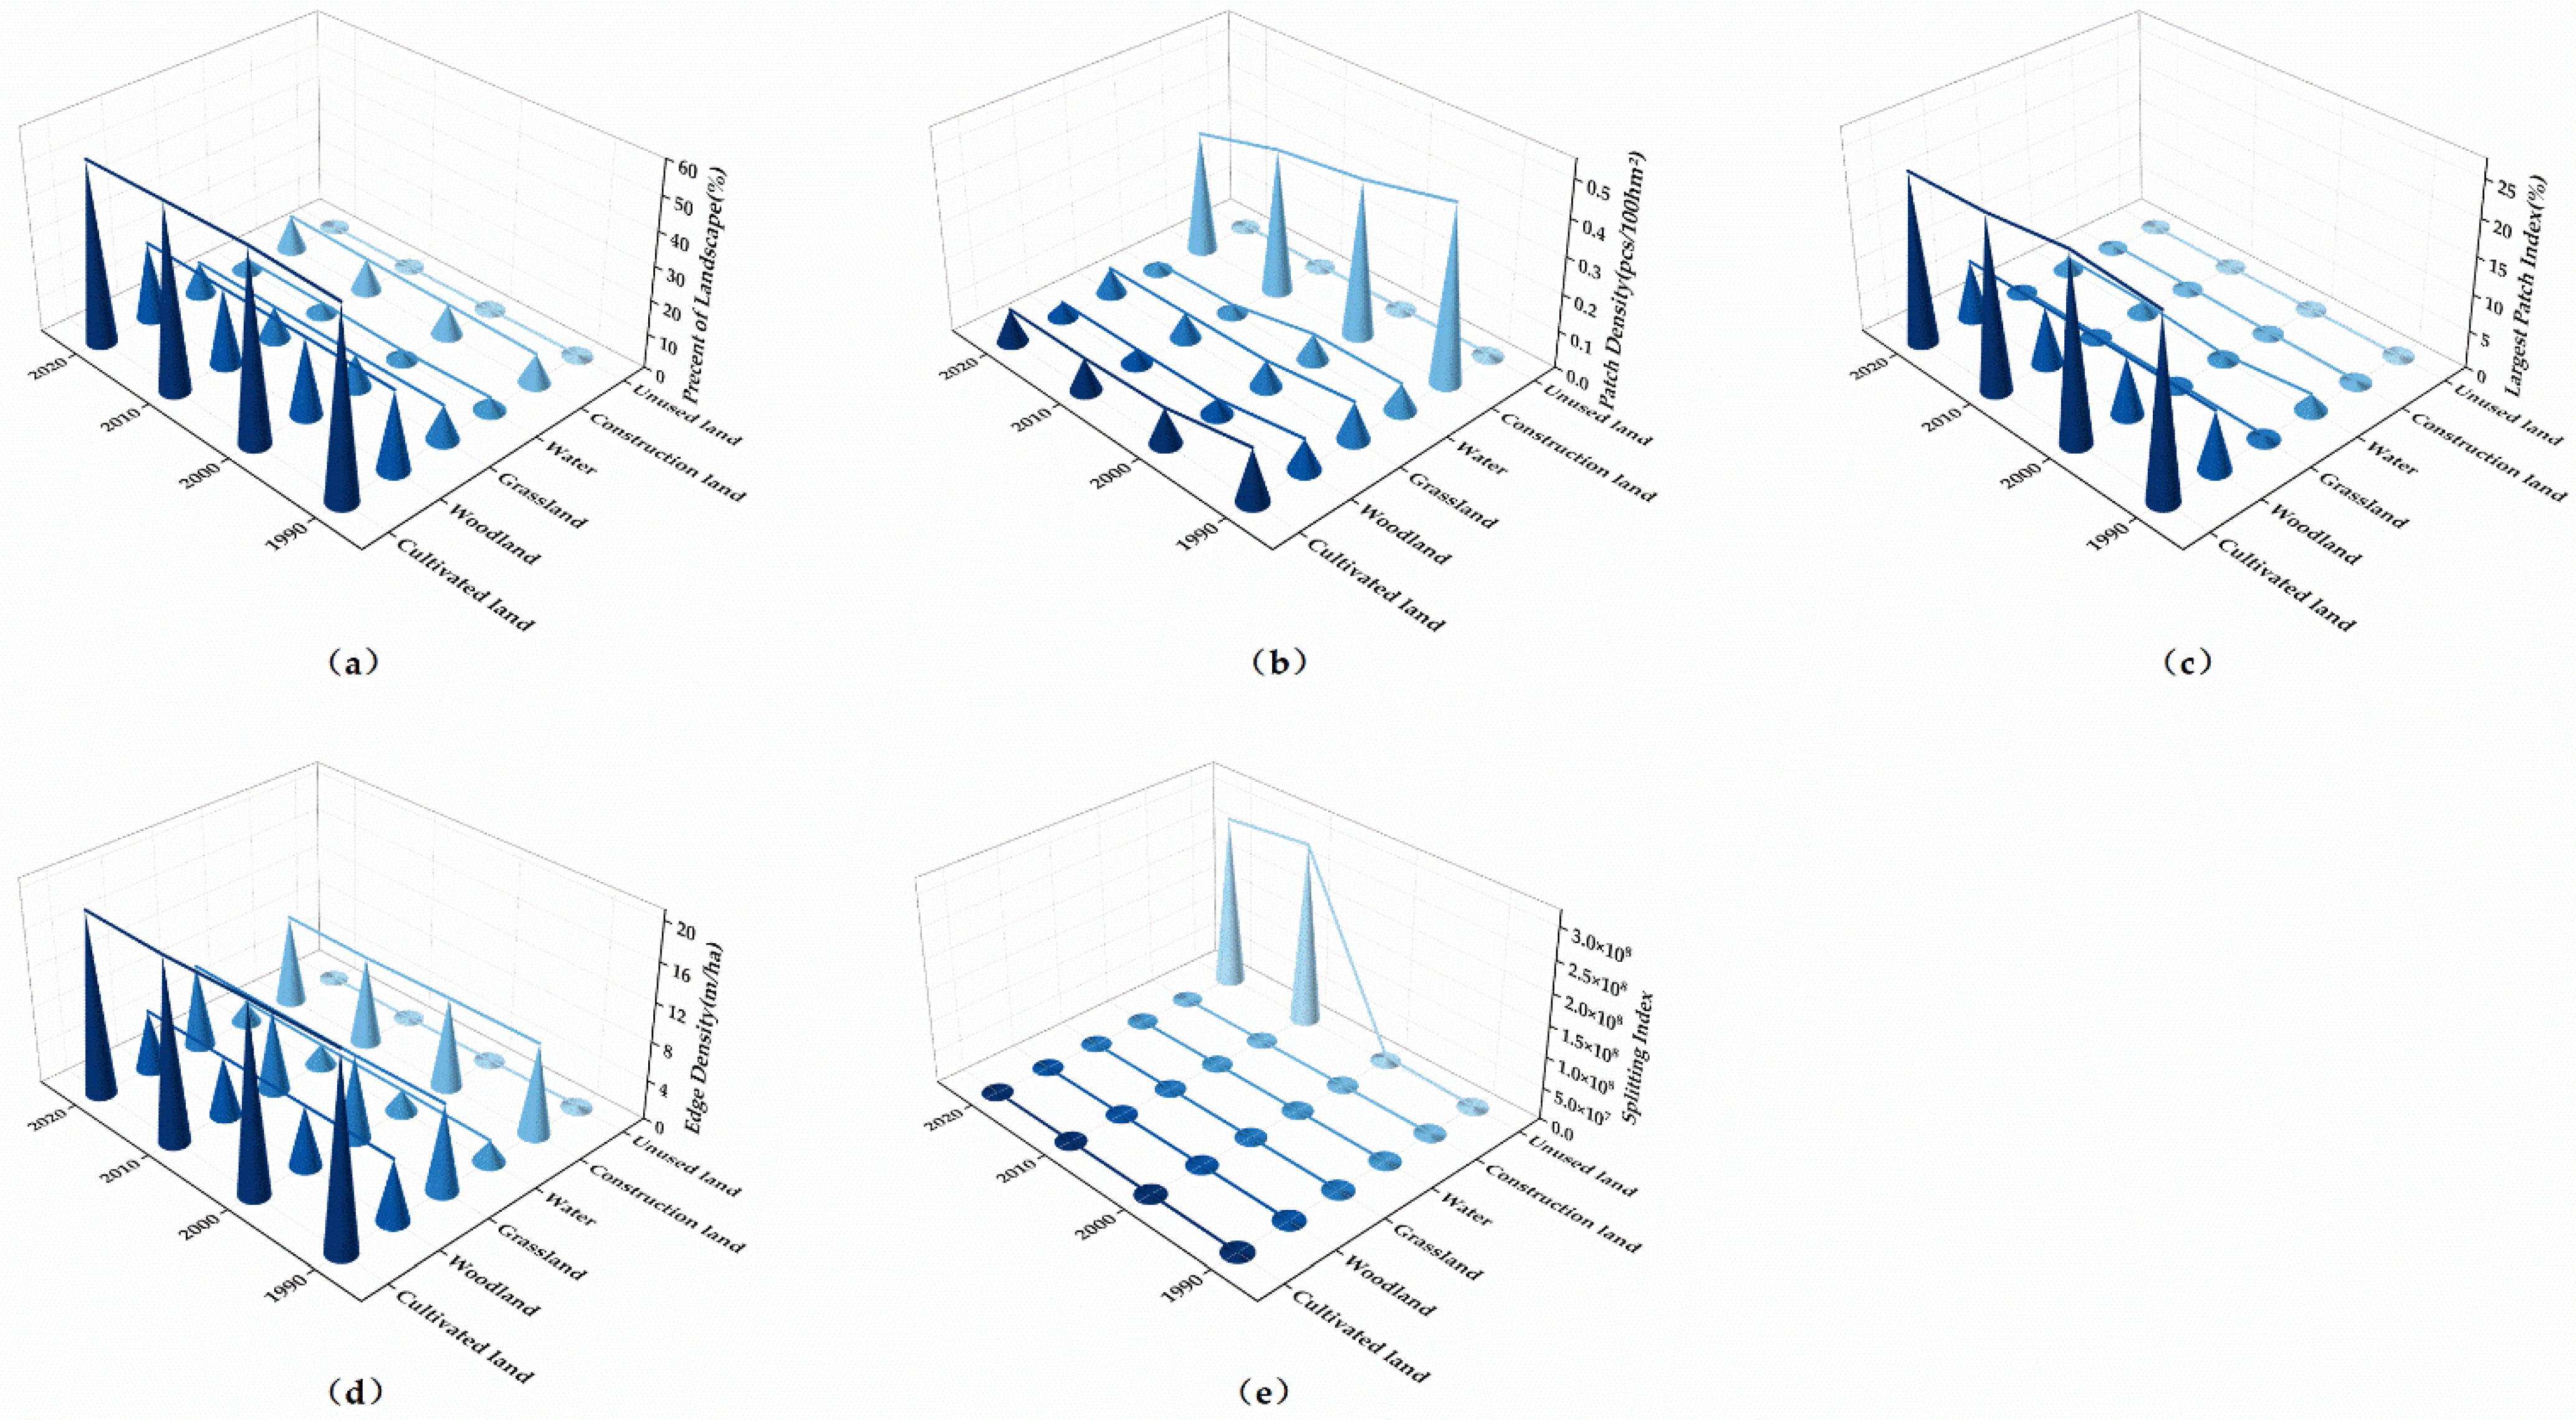
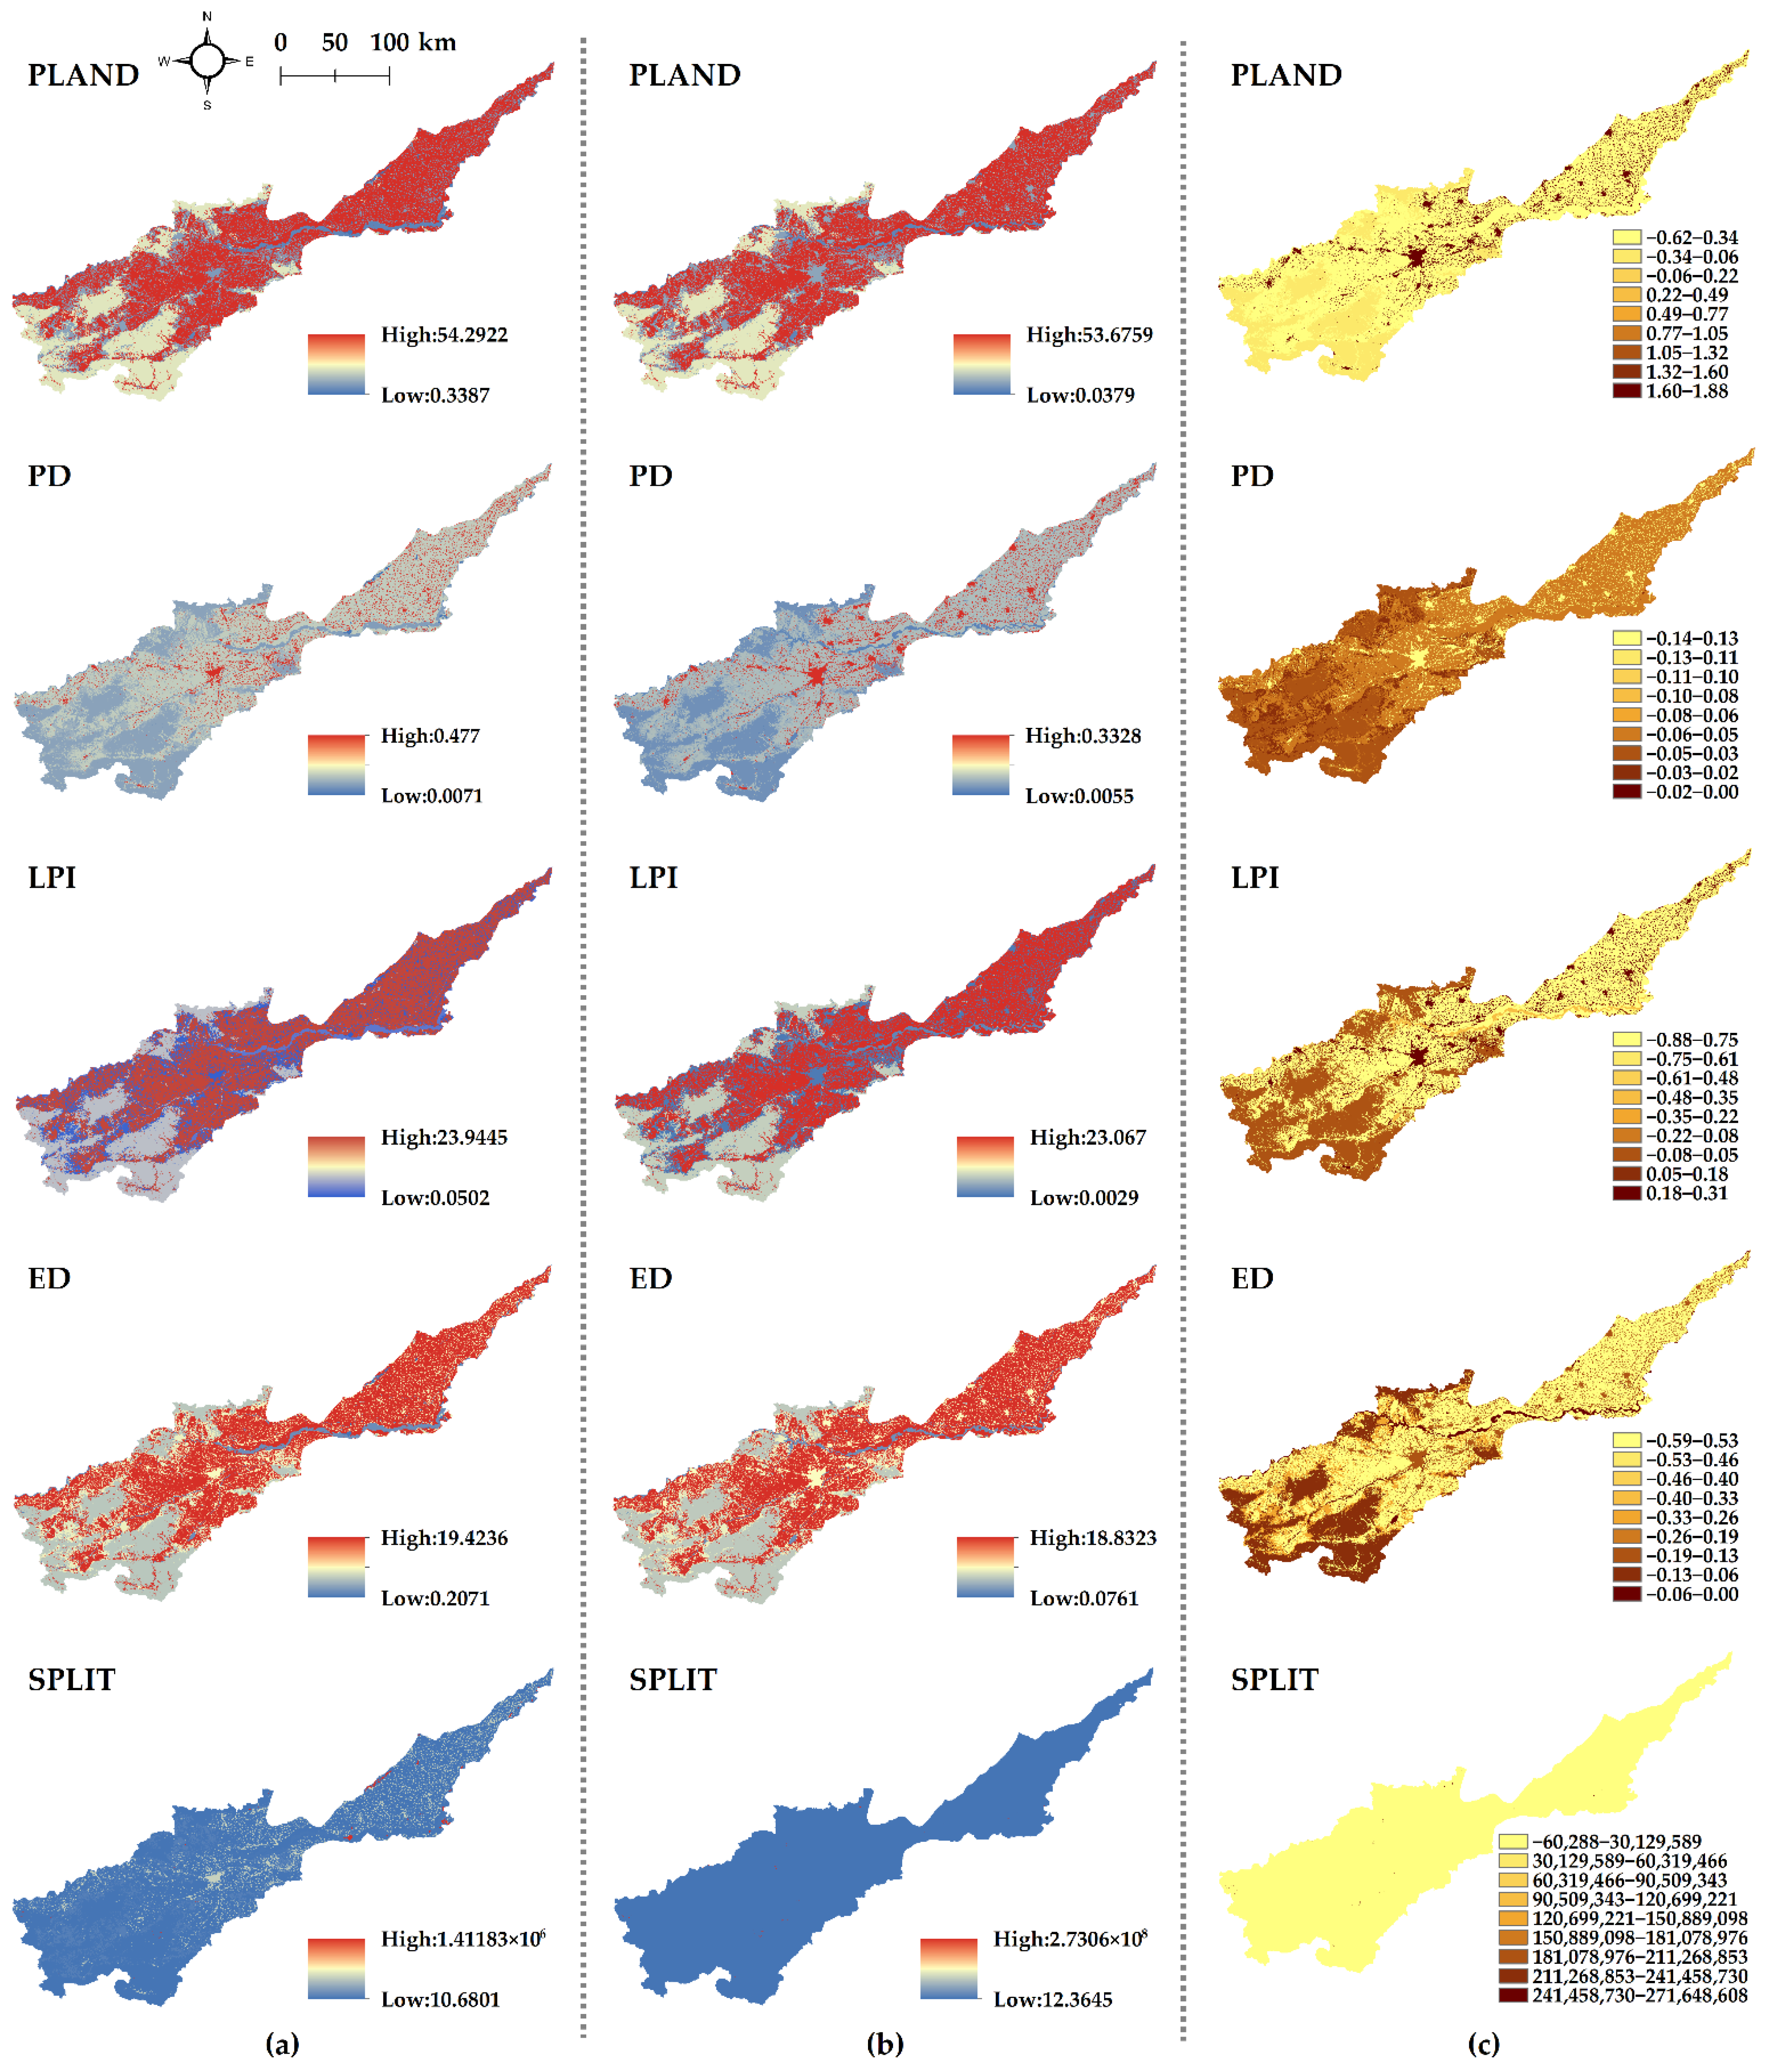
The landscape pattern evolution characteristics of the Yellow River Basin (Henan section) from 1990 to 2020 were analyzed in terms of patch type scale (Figure 8). The Percentage of Landscape (PLAND) of cultivated land and forest land in the basin was much larger than that of other landscape types, and the sum of the two areas accounted for more than 76% of the total area of the study area, making it the dominant landscape type in the basin. The PLAND of cultivated land first increased and then decreased, reached a maximum (55.31%) in 2000, and then continued to decrease, whereas the PLAND of woodland landscape decreased year after year. At the same time, the PLAND of construction land increased continuously, which to some extent reflects the weakening of the landscape dominance of cultivated land and woodland in the study area, as well as the improvement of landscape dominance of construction land. In all land use types, the changes of Patch density (PD) and Edge density (ED) values were stable, and there was not much fluctuation during the study period. The Largest Patch Index (LPI) value of construction land changed obviously in the whole study area, and the LPI value of construction land in 2020 was 1.05 times that of 1990. The LPI of cultivated land reached a maximum (24.89%) in 2000 and decreased to a minimum (23.07%) in 2020. The Splitting Index (SPLIT) of construction land and unused land was the largest, and both showed opposite change trends during the study period; the SPLIT value of construction land decreased by 76.86%, whereas the SPLIT value of unused land increased. In 2020, the SPLIT value was 193 times that of 1990, which shows that construction land was distributed from decentralization to centralization, and unused land evolved from centralization to decentralization. Similar to the land use change, the landscape pattern also showed obvious spatial characteristics, reflecting the heterogeneity of the landscape in the Yellow River Basin (Henan section). As shown in Figure 9, PD in the middle reaches was relatively small, whereas PLAND, LPI, and ED were relatively large. However, this trend was reversed in the lower reaches, which indicates that the landscape in the lower reaches was more fragmented, heterogeneous and disturbed than that in the middle reaches. In addition, by comparing the patch type index values of 1990 and 2020 in Figure 8, the landscape index of most areas was almost unchanged except some areas in the downstream watershed.
3.4. Analysis of Landscape Change Influencing Force
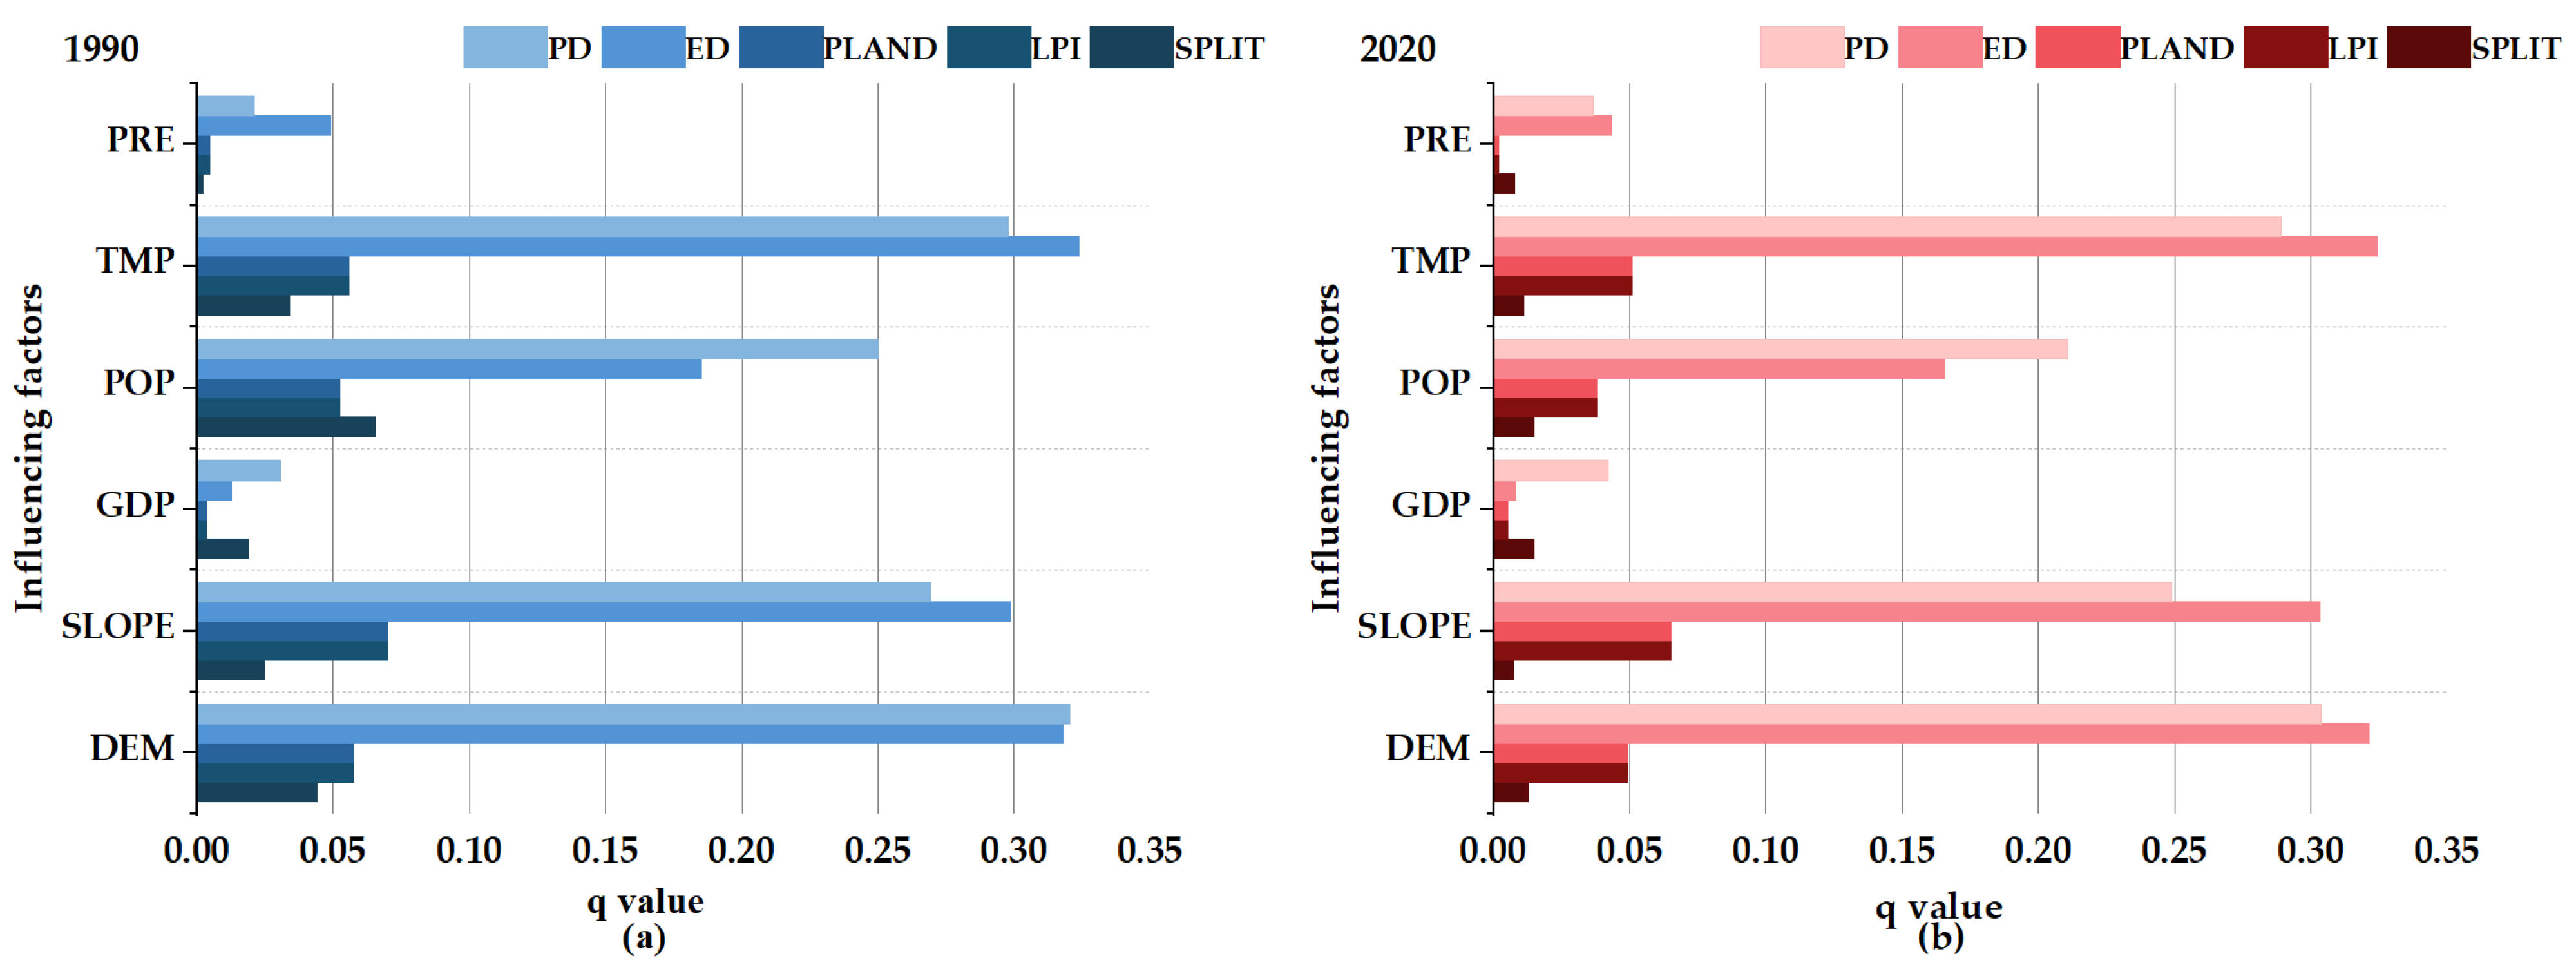
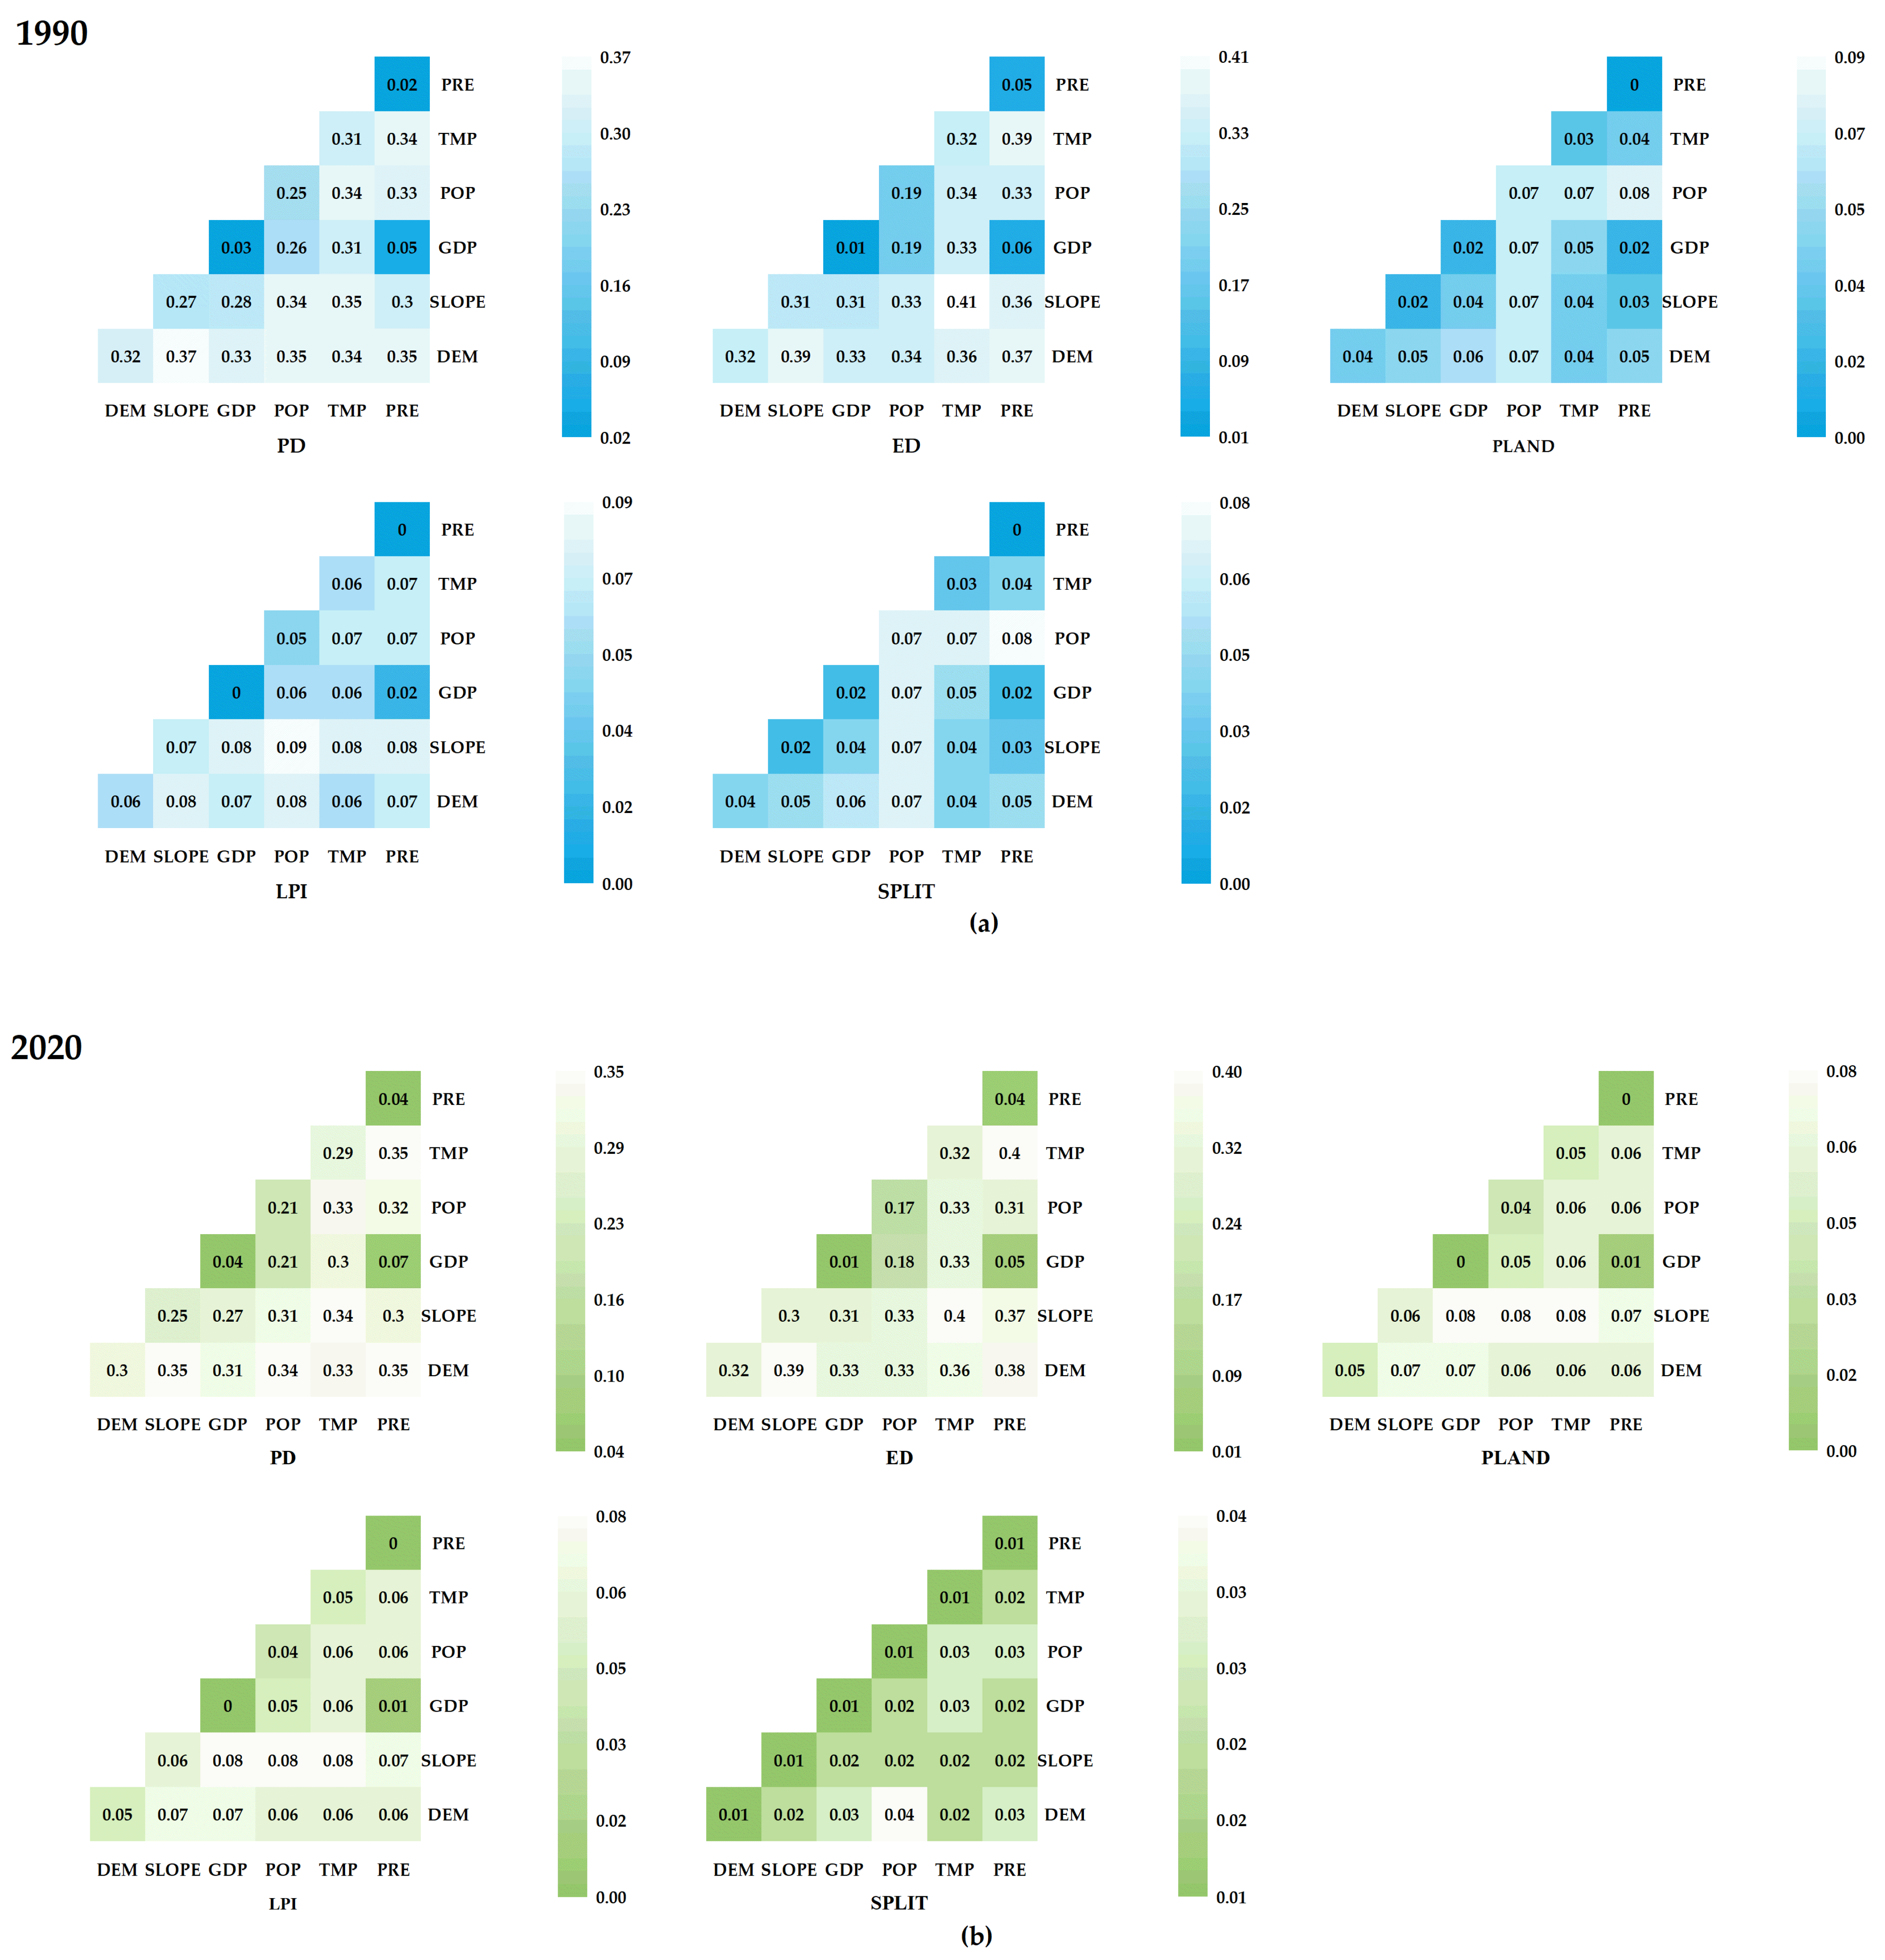
Geographic detector is an important tool for measuring and mining spatial stratification heterogeneity and spatial pattern attributes. Through spatial heterogeneity, it detects the consistency of spatial distribution pattern between dependent variables and independent variables, and then measures the explanatory degree of independent variables to dependent variables, that is, q-value. The model has four detector modules. This study mainly uses “factor detector” and “interaction detector” to quantitatively analyze the factors affecting the spatial heterogeneity of landscape pattern in the Yellow River Basin (Henan section) and obtains the relative importance of each influencing factor and the interaction among them (Appendix A). According to the results of factor detection (Figure 10), in 1990, the influencing factors of the Yellow River Basin (Henan section) explained the spatial distribution of the landscape patterns of PD and ED to a relatively high degree, and the explanatory power of the landscape patterns of PLAND, LPI and SPLIT was far lower than that of PD and ED. Elevation, slope, temperature and population distribution factors accounted for more than 15% of the spatial distribution of PD and ED landscape patterns, which were the main influencing factors affecting landscape fragmentation and complexity. In addition, the explanatory power of precipitation and GDP was less than 5%, which was the secondary influencing factor of landscape fragmentation and complexity. In 2020, the explanatory power of various influencing factors for the spatial distribution of PD, ED, PLAND, LPI, and SPLIT changed slightly, among which the explanatory power of GDP and precipitation for the spatial distribution of PD increased slightly, whereas that of elevation, slope and population distribution for SPLIT decreased, among which the population distribution was the most obvious, and the q-value decreased from 0.06 in 1990 to 0.01 in 2020. In addition, as shown in Figure 11, the interaction of slope ∩ elevation and slope ∩ temperature on the spatial distribution of ED and PD in the Yellow River Basin (Henan section) in 1990 was strong, among which the interaction influence of slope ∩ temperature (q-value = 0.41) on the spatial distribution of ED ranked first, followed by slope ∩ elevation (q-value = 0.39). The interaction between slope and other detection factors further indicates that slope greatly influenced the spatial heterogeneity of the landscape pattern in 1990. Figure 11 shows that in 2020, the explanatory power of the interaction between slope ∩ elevation and slope ∩ temperature in the Yellow River Basin (Henan section) was still the strongest. Therefore, the spatial differences of natural factors such as slope, elevation, temperature, and precipitation can better reflect the spatial heterogeneity of landscape pattern of the Yellow River Basin (Henan section) than those of socio-economic factors such as GDP and population density. Furthermore, the influence of any two driving factors on the spatial distribution characteristics of landscape pattern was greater than that of any single factor, indicating that the formation of spatial heterogeneity in the Yellow River Basin (Henan section) was the result of the interaction of various driving factors.
4. Discussion
To study the evolution trend of a watershed landscape pattern, this paper compares and analyzes the landscape pattern characteristics between typical landscape areas (cultivated land, woodland, grassland, water, construction land and unused land) and between them and the whole watershed. During 1990–2020, six land use types in the Yellow River Basin (Henan section) all changed, the area of cultivated land and water area fluctuated and decreased, and the area of grassland and unused land continued to decrease. The area of woodland fluctuated and increased, and that of construction land continued to increase. From the perspective of spatial pattern, the information map effectively represents the long-term change track of the different land use types. Influenced by tourism development activities, four land use change structure types—repeated change type, early change type, intermediate change type, and continuous change type—were concentrated in the vicinity of the Yellow River. The stable structure had the widest distribution range, with two change patterns: “cultivated land-cultivated land-cultivated land-cultivated land” and “woodland-woodland-woodland-woodland”, which indicates that the landscape pattern of the basin dominated by cultivated land and woodland has not changed fundamentally. Cultivated land and woodland are the dominant landscape types in the basin, but the largest patch area decreased sharply from 2000 to 2020. At the same time, the PLAND of construction land showed a continuous increase, which reflected, to some extent, how the dominant position of cultivated land and woodland landscape in the study area weakened and the landscape dominance of construction land increased. These results show that the fragmentation and homogenization of landscape pattern intensified the encroachment of construction land on forestland and cultivated land, that is, the decrease in cultivated land and forestland was accompanied by the decrease in landscape dominance of cultivated land and forestland and the increase in the fragmentation and homogenization of cultivated land and forestland. It was further confirmed that there existed corresponding characteristics and interactions between land use change and landscape pattern change proposed by relevant scholars [62,63]. Therefore, researchers can use the temporal change of land use types to reflect the temporal change pattern of a certain landscape type in a certain period. In addition, we have found similar results in other literatures, and existing studies have shown that the weakening of landscape dominance of cultivated land and woodland and the improvement of landscape dominance of construction land will accelerate the expansion of urbanization, and the built-up areas and settlements will become more concentrated [64]. At the same time, the watersheds around the rapidly urbanized areas are more sensitive to the changes of landscape types because of their rich and fragile natural ecosystems [65]. The landscape pattern characteristics of the Yellow River Basin (Henan section) not only included the vulnerability and sensitivity of rivers and water sources but also the contradiction between man and land in economically developed urbanized areas. Therefore, with the strengthening of human activities and the acceleration of urbanization, the disturbance and damage to the natural landscape of the river basin have increased, and how to maintain economic development and protect the natural environment is an urgent problem that needs to be solved.
In addition, it is helpful to identify and control the main influencing factors and guide watershed protection management and sustainable planning by focusing on the spatial dimension influence of each influencing factors on the watershed landscape pattern change. The factors that influence the landscape pattern change of the river basin are complex and diverse, and social and economic factors and natural factors are often used to summarize when establishing an index system of driving factors. Previous studies mainly discussed the influencing factors of land use type change in different locations [66,67] and different time periods [67,68]. The research on landscape pattern and influencing factors mainly focuses on the analysis of the temporal difference of landscape pattern in a single scope, but few studies pay attention to the spatial difference, and there was a lack of comprehensive quantitative research on the influencing factors leading to the spatial heterogeneity of landscape patterns in river basins and the factors of spatial and temporal changes of these patterns. However, at present, most works use classification methods to describe the spatial characteristics of landscape patterns in different regions and their influencing factors, and they seldom perform quantitative analyses on the spatial relationship between variables [64]. The research of Ju et al. [69]. proved the applicability of the geographic probe model in analyzing the influencing force of construction land expansion and provided a new idea for analyzing the interaction among various spatial factors. Therefore, this paper comprehensively considers the socio-economic factors and natural factors that affect the landscape pattern change in the Yellow River Basin (Henan section), and it reveals the influencing factors of landscape pattern spatial heterogeneity in the basin from the perspectives of patch type scale, aiming at the differences of spatial allocation characteristics of different landscape patches reflected by the landscape pattern change. The influencing factors of spatial heterogeneity of landscape pattern in the Yellow River Basin (Henan section) were revealed from the spatial perspective, and the spatial relationship among variables was quantitatively analyzed. A geographical detector was used to compare the impacts of different natural factors on spatial landscape heterogeneity in the period of land use change in the Yellow River Basin (Henan section) from 1990 and 2020 from a patch type scale. The results showed that the spatial differences of natural factors such as slope, elevation, temperature and precipitation can better reflect the spatial heterogeneity of the landscape pattern in the Yellow River Basin (Henan section) than those of socio-economic factors such as GDP and population density, and the interaction of any two driving factors has a greater influence on the spatial distribution characteristics of landscape pattern than any single factor, indicating that the formation of spatial heterogeneity in the Yellow River Basin (Henan section) is the result of the interaction of various driving factors.
This study quantitatively estimated the temporal and spatial changes of land use types and landscape patterns and analyzed the main reasons for the landscape pattern evolution. Due to data constraints, this paper only takes the land use data of the Yellow River Basin (Henan section) from 1990 to 2020 as an example to analyze the landscape pattern evolution. Although remote sensing images or land cover data separated by 10 years can be used to determine the temporal changes of landscape pattern in detail, the longer time interval may cover up the real situation of landscape structure changes, and it is impossible to accurately establish the relationship between various land use types and different influencing factors, nor to accurately compare the driving factors of spatial heterogeneity of landscape pattern in each period, thus affecting the landscape structure. In future research, it will be necessary to accurately analyze and verify the changing characteristics of land use and landscape pattern through a short time interval or continuous year land use data and case studies in other regions. According to the characteristics of the research object, it is very important to choose appropriate observation and analysis scales to accurately understand the change trends of landscape pattern. In addition, considering the influence of policy factors, how to establish a qualitative and quantitative influencing force detection model for landscape pattern evolution, deepen the research on influencing forces, comprehensively consider the influence of social economy, nature, and policy, and put forward a scientific and comprehensive implementation strategy for land use and landscape pattern optimization are the central questions to be answered.
5. Conclusions
Based on ArcGIS and Fragstats 4.2.1 software, the process of land use and landscape pattern change in the Yellow River Basin (Henan section) from 1990 to 2020 was quantified and visualized, and the main influencing factors affecting the landscape pattern change in the basin were revealed using a geographic detector. The following conclusions were drawn:
- (1)
- The structure of land use in the Yellow River Basin (Henan section) was obviously clustered, and the main land use types were cultivated land, woodland, grassland, water area, construction land and unused land. From 1990 to 2020, the mutual transformation of land use types in the Yellow River Basin (Henan section) was frequent, and the transformation tracks were diversified. Among them, the outflow behavior is mainly manifested in the transformation from cultivated land to construction land, and the inflow behavior is mainly manifested in the transformation from grassland and water to cultivated land. The most obvious feature of land use change is the large-scale transition from cultivated land and woodland to construction land.
- (2)
- In the information map of land use change in the Yellow River Basin (Henan section) from 1990 to 2020, stable structural change has the widest distribution range, accounting for 94.63% of the whole basin area. In the early stage, the changing area of the changing structure accounted for 2.74% of the whole basin area, and in the early stage, it was mainly the conversion of water area to cultivated land, cultivated land to construction land, and grassland to cultivated land. The Intermediate variation type were mainly “cultivated land-cultivated land-construction land-construction land” and “cultivated land-cultivated land-water area-water area”. In the later stage, the change type mostly manifested as the conversion from cultivated land to water area. Repeated changes were mainly manifested in the mutual transformation between cultivated land and waters, namely “waters-cultivated land-waters-waters” and “cultivated land-waters-cultivated land-cultivated land”. Although the continuous change type accounted for only 0.10% of the watershed area, the changes among various land use types were very drastic.
- (3)
- After analyzing the landscape pattern evolution characteristics of the Yellow River Basin (Henan section) from the five landscape indexes at the landscape level, it can be concluded that the landscape fragmentation of the basin has been reduced, the landscape heterogeneity has been enhanced, and the landscape patch types have been constantly balanced in the last 30 years. According to the analysis of different landscape pattern indexes at the level of land use, the landscape dominance of cultivated land decreases, whereas that of construction land increases. The occupation of construction land was the main reason for the fragmentation and homogenization of cultivated land.
- (4)
- Through geographical exploration, we found many natural factors and socio-economic factors that might influence the landscape pattern evolution. Compared with the spatial differences of socio-economic factors such as GDP and population density, the spatial differences of natural factors such as slope, elevation, temperature and precipitation can better reflect the spatial heterogeneity of landscape pattern in the Yellow River Basin (Henan section), and the influence of any two driving factors on the spatial distribution characteristics of landscape pattern is greater than that of a single factor, indicating that the formation of spatial heterogeneity in the Yellow River Basin (Henan section) is the result of the interaction of various driving factors.
Author Contributions
Conceptualization, H.N., X.Z. and D.X.; methodology, H.N., X.Z. and D.X.; software, H.N. and D.X.; validation, X.Z.; formal analysis, X.Z.; resources, H.N., D.X. and X.Z.; data curation, H.N. and D.X.; writing—original draft preparation, X.Z.; writing—review and editing, H.N., X.Z. and D.X.; visualization, X.Z.; supervision, M.L., R.A. and L.F.; project administration, H.N.; funding acquisition, H.N. All authors have read and agreed to the published version of the manuscript.
Funding
This research was funded by the National Natural Science Foundation of China (Grant No. 42271283; 42201297), Think Tank Research Project of Colleges and Universities in Henan Province in 2021 (Grant No. 2021-ZKYJ-07), Scientific and Technological Innovation Team of Universities in Henan Province (Grant No. 22IRTSTHN008), Program for Innovative Research Team (in Philosophy and Social Science) in University of Henan Province (Grant No. 2022-CXTD-02), Annual Program of Philosophy and Social Science Planning in Henan Province (Grant No. 2022BJJ049).
Data Availability Statement
The data presented in this study are available on request from the corresponding website.
Acknowledgments
We acknowledge all people who contributed to the date collection and processing, as well as the construction and insightful comments by the editor and anonymous reviewers.
Conflicts of Interest
The authors declare no conflict of interest.
Appendix A

Table A1.
The force (q-value) among each influencing factor on each landscape pattern metric in 1990.
Table A1.
The force (q-value) among each influencing factor on each landscape pattern metric in 1990.
| DEM | SLOPE | GDP | POP | TMP | PRE | |
|---|---|---|---|---|---|---|
| PD | 0.320265 | 0.269227 | 0.030555 | 0.249925 | 0.297511 | 0.021016 |
| ED | 0.317664 | 0.298653 | 0.012679 | 0.185272 | 0.323857 | 0.049003 |
| PLAND | 0.057356 | 0.068945 | 0.003199 | 0.051945 | 0.056169 | 0.004931 |
| LPI | 0.057186 | 0.069836 | 0.003442 | 0.052241 | 0.055672 | 0.004846 |
| SPLIT | 0.043870 | 0.024579 | 0.018951 | 0.06542 | 0.034021 | 0.002010 |
Table A2.
The force (q-value) among each influencing factor on each landscape pattern metric in 2020.
Table A2.
The force (q-value) among each influencing factor on each landscape pattern metric in 2020.
| DEM | SLOPE | GDP | POP | TMP | PRE | |
|---|---|---|---|---|---|---|
| PD | 0.303486 | 0.248857 | 0.04203 | 0.21082 | 0.288939 | 0.036415 |
| ED | 0.321365 | 0.303087 | 0.008251 | 0.165651 | 0.323940 | 0.043316 |
| PLAND | 0.047560 | 0.064782 | 0.004896 | 0.038845 | 0.051109 | 0.001829 |
| LPI | 0.049030 | 0.064894 | 0.004991 | 0.037977 | 0.050909 | 0.001734 |
| SPLIT | 0.012620 | 0.007354 | 0.014943 | 0.014789 | 0.011247 | 0.007602 |
Table A3.
The force (q-value) among any two influencing factors on Patch density (PD) interactively in 1990.
Table A3.
The force (q-value) among any two influencing factors on Patch density (PD) interactively in 1990.
| DEM | SLOPE | GDP | POP | TMP | PRE | |
|---|---|---|---|---|---|---|
| DEM | 0.320265 | |||||
| SLOPE | 0.366379 | 0.269227 | ||||
| GDP | 0.326063 | 0.278900 | 0.030555 | |||
| POP | 0.352265 | 0.344493 | 0.259322 | 0.249925 | ||
| TMP | 0.339093 | 0.353331 | 0.302255 | 0.342300 | 0.297511 | |
| PRE | 0.347441 | 0.298648 | 0.048802 | 0.334315 | 0.339730 | 0.021016 |
Table A4.
The force (q-value) among any two influencing factors on Edge density (ED) interactively in 1990.
Table A4.
The force (q-value) among any two influencing factors on Edge density (ED) interactively in 1990.
| DEM | SLOPE | GDP | POP | TMP | PRE | |
|---|---|---|---|---|---|---|
| DEM | 0.317664 | |||||
| SLOPE | 0.387969 | 0.298653 | ||||
| GDP | 0.326882 | 0.302781 | 0.012679 | |||
| POP | 0.336864 | 0.334696 | 0.193830 | 0.185272 | ||
| TMP | 0.356540 | 0.395255 | 0.326194 | 0.339173 | 0.323857 | |
| PRE | 0.374806 | 0.361172 | 0.061956 | 0.333414 | 0.389954 | 0.049003 |
Table A5.
The force (q-value) among any two influencing factors on Percentage of Landscape (PLAND) interactively in 1990.
Table A5.
The force (q-value) among any two influencing factors on Percentage of Landscape (PLAND) interactively in 1990.
| DEM | SLOPE | GDP | POP | TMP | PRE | |
|---|---|---|---|---|---|---|
| DEM | 0.057356 | |||||
| SLOPE | 0.083462 | 0.068945 | ||||
| GDP | 0.067369 | 0.078631 | 0.003199 | |||
| POP | 0.079342 | 0.088952 | 0.057369 | 0.051945 | ||
| TMP | 0.062908 | 0.083681 | 0.062764 | 0.073216 | 0.056169 | |
| PRE | 0.066765 | 0.078011 | 0.019010 | 0.073906 | 0.069120 | 0.004931 |
Table A6.
The force (q-value) among any two influencing factors on Largest Patch Index (LPI) interactively in 1990.
Table A6.
The force (q-value) among any two influencing factors on Largest Patch Index (LPI) interactively in 1990.
| DEM | SLOPE | GDP | POP | TMP | PRE | |
|---|---|---|---|---|---|---|
| DEM | 0.057186 | |||||
| SLOPE | 0.081694 | 0.069836 | ||||
| GDP | 0.069208 | 0.075461 | 0.003442 | |||
| POP | 0.077554 | 0.089637 | 0.059201 | 0.052241 | ||
| TMP | 0.062402 | 0.081454 | 0.061516 | 0.071548 | 0.055672 | |
| PRE | 0.068275 | 0.077914 | 0.016770 | 0.071807 | 0.067510 | 0.004846 |
Table A7.
The force (q-value) among any two influencing factors on Splitting Index (SPLIT) interactively in 1990.
Table A7.
The force (q-value) among any two influencing factors on Splitting Index (SPLIT) interactively in 1990.
| DEM | SLOPE | GDP | POP | TMP | PRE | |
|---|---|---|---|---|---|---|
| DEM | 0.04387 | |||||
| SLOPE | 0.046222 | 0.024579 | ||||
| GDP | 0.056009 | 0.039179 | 0.018951 | |||
| POP | 0.073137 | 0.068457 | 0.068585 | 0.065420 | ||
| TMP | 0.044943 | 0.038447 | 0.046465 | 0.070756 | 0.034021 | |
| PRE | 0.048021 | 0.029017 | 0.022987 | 0.076758 | 0.039991 | 0.002010 |
Table A8.
The force (q-value) among any two influencing factors on Patch density (PD) interactively in 2020.
Table A8.
The force (q-value) among any two influencing factors on Patch density (PD) interactively in 2020.
| DEM | SLOPE | GDP | POP | TMP | PRE | |
|---|---|---|---|---|---|---|
| DEM | 0.303486 | |||||
| SLOPE | 0.347119 | 0.248857 | ||||
| GDP | 0.314081 | 0.265913 | 0.042030 | |||
| POP | 0.33608 | 0.310521 | 0.213333 | 0.210820 | ||
| TMP | 0.328339 | 0.339372 | 0.301340 | 0.327140 | 0.288939 | |
| PRE | 0.347989 | 0.303457 | 0.066416 | 0.324448 | 0.346093 | 0.036415 |
Table A9.
The force (q-value) among any two influencing factors on Edge density (ED) interactively in 2020.
Table A9.
The force (q-value) among any two influencing factors on Edge density (ED) interactively in 2020.
| DEM | SLOPE | GDP | POP | TMP | PRE | |
|---|---|---|---|---|---|---|
| DEM | 0.321365 | |||||
| SLOPE | 0.390951 | 0.303087 | ||||
| GDP | 0.331398 | 0.306532 | 0.008251 | |||
| POP | 0.331089 | 0.328772 | 0.175638 | 0.165651 | ||
| TMP | 0.358784 | 0.395712 | 0.328311 | 0.334229 | 0.323940 | |
| PRE | 0.384677 | 0.369056 | 0.052370 | 0.306907 | 0.396613 | 0.043316 |
Table A10.
The force (q-value) among any two influencing factors on Percentage of Landscape (PLAND) interactively in 2020.
Table A10.
The force (q-value) among any two influencing factors on Percentage of Landscape (PLAND) interactively in 2020.
| DEM | SLOPE | GDP | POP | TMP | PRE | |
|---|---|---|---|---|---|---|
| DEM | 0.047560 | |||||
| SLOPE | 0.075211 | 0.064782 | ||||
| GDP | 0.067396 | 0.078950 | 0.004896 | |||
| POP | 0.064758 | 0.079236 | 0.045332 | 0.038845 | ||
| TMP | 0.058121 | 0.07698 | 0.064861 | 0.061562 | 0.051109 | |
| PRE | 0.061357 | 0.072691 | 0.013734 | 0.058267 | 0.062946 | 0.001829 |
Table A11.
The force (q-value) among any two influencing factors on Largest Patch Index (LPI) interactively in 2020.
Table A11.
The force (q-value) among any two influencing factors on Largest Patch Index (LPI) interactively in 2020.
| DEM | SLOPE | GDP | POP | TMP | PRE | |
|---|---|---|---|---|---|---|
| DEM | 0.049030 | |||||
| SLOPE | 0.074544 | 0.064894 | ||||
| GDP | 0.067172 | 0.076780 | 0.004991 | |||
| POP | 0.063646 | 0.079321 | 0.047001 | 0.037977 | ||
| TMP | 0.055395 | 0.075560 | 0.064553 | 0.063485 | 0.050909 | |
| PRE | 0.064105 | 0.073934 | 0.013237 | 0.056173 | 0.063852 | 0.001734 |
Table A12.
The force (q-value) among any two influencing factors on Splitting Index (SPLIT) interactively in 2020.
Table A12.
The force (q-value) among any two influencing factors on Splitting Index (SPLIT) interactively in 2020.
| DEM | SLOPE | GDP | POP | TMP | PRE | |
|---|---|---|---|---|---|---|
| DEM | 0.317664 | |||||
| SLOPE | 0.387969 | 0.298653 | ||||
| GDP | 0.326882 | 0.302781 | 0.012679 | |||
| POP | 0.336864 | 0.334696 | 0.193830 | 0.185272 | ||
| TMP | 0.356540 | 0.395255 | 0.326194 | 0.339173 | 0.323857 | |
| PRE | 0.374806 | 0.361172 | 0.061956 | 0.333414 | 0.389954 | 0.049003 |
References
- Lambin, E.F.; Turner, B.L.; Geist, H.J.; Agbola, S.B.; Angelsen, A.; Bruce, J.W.; Coomes, O.T.; Dirzo, R.; Fischer, G.; Folke, C.; et al. The causes of land-use and land-cover change: Moving beyond the myths. Global. Environ. Chang. 2001, 11, 261–269. [Google Scholar] [CrossRef]
- Chen, W.; Li, J.; Zeng, J.; Ran, R.; Yang, B. Spatial heterogeneity and formation mechanism of eco-environmental effect of land use change in China. Geogra. Resaust. 2019, 38, 2173–2187. [Google Scholar] [CrossRef]
- Grainger, A. The Future Role of Tropical Rain Forests in the World Forest Economy. Ph.D. Thesis, University of Oxford, Oxford, UK, 1986. [Google Scholar]
- Long, H. Land Use Transition: A New Integrated Approach of Land Use/Cover Change Study. Geogr. Geo-Inf. Sci. 2003, 19, 87–90. [Google Scholar] [CrossRef]
- Li, X. Theoretical Hypotheses about Agricultural Land use Changes and the Relevant Propositions about Environmental Impacts. Adv. Earth. Sci. 2008, 11, 1124–1129. [Google Scholar] [CrossRef]
- Hosonuma, N.; Herold, M.; De Sy, V.; De Fries, R.S.; Brockhaus, M.; Verchot, L.; Angelsen, A.; Romijn, E. An assessment of deforestation and forest degradation drivers in developing countries. Environ. Res. Lett. 2012, 7, 044009. [Google Scholar] [CrossRef]
- Chen, L.; Zhou, S.; Zhou, B.; Lu, L.; Chang, T. Characteristics and Driving Forces of Regional Land Use Transition Based on the Leading Function Classification: A Case Study of Jiangsu Province. Econ. Geogr. 2015, 35, 155–162. [Google Scholar] [CrossRef]
- Guo, L.; Li, D.; Gang, L.; Luo, Q.; Gao, M. GIS-based detection of land use transformation in the Loess Plateau: A case study in Baota District, Shaanxi Province, China. J. Geogr. Sci. 2015, 25, 12. [Google Scholar] [CrossRef] [Green Version]
- Luo, H.; Hu, S.; Wu, S. Research Trends and Development Trends of Land Use Transformation in China. Nat. Resour. Econ. China 2019, 32, 65–74. [Google Scholar] [CrossRef]
- Song, X. Discussion on land use transition research framework. Acta. Geogr. Sin. 2017, 72, 471–487. [Google Scholar] [CrossRef]
- Liu, Y.; Long, H. Land use transitions and their dynamic mechanism in the Huang-Huai-Hai Plain. Acta. Geogr. Sin. 2017, 72, 471–487. [Google Scholar] [CrossRef]
- Ashraf, J.; Pandey, R.; Jong, W.D. Assessment of bio-physical, social and economic drivers for forest transition in Asia-Pacific region. Forest. Policy. Econ. 2017, 76, 35–44. [Google Scholar] [CrossRef]
- Wang, J.; Zhao, C.; Han, M. Evalution of coordinated development betweeen Urban-Rural construction land transition and rural transformation and diagnosis of obstacle factors. Chin. J. Agric. Resour. Reg. Plan. 2022, 43, 140–152. [Google Scholar] [CrossRef]
- Liao, L.; Long, H.; Gao, X.; Ma, E. Effects of land use transitions and rural aging on agricultural production in China’s farming area: A perspective from changing labor employing quantity in the planting industry. Land Use Policy 2019, 88, 104152. [Google Scholar] [CrossRef]
- Lu, X.; Tang, Y.; Yi, J.; Jiang, X. Study on the Impact of Cultivated Land Use Transition on Agricultural Economic Growth based on Spatial Econometric Model. China Land Sci. 2019, 33, 53–61. [Google Scholar] [CrossRef]
- Dong, J.; Zhang, Z.; Da, X.; Zhang, W.; Feng, X. Eco-environmental effects of land use transformation and its driving forces from the perspective of “production-living-ecological” spaces: A case study of Gansu Province. Acta. Ecol. Sin. 2021, 41, 5919–5928. [Google Scholar] [CrossRef]
- Liu, Y.; Long, H.; Ting, T.; Shuang, S. Land use transitions and their effects on water environment in Huang-Huai-Hai Plain, China. Land Use Policy 2015, 47, 293–301. [Google Scholar] [CrossRef]
- Shi, Y.; Lu, X.; Guo, G.; Gong, C. Temporal-Spatial Pattern and Driving Mechanism of Cultivated Land Use Transition Based on GIS and Spatial Econometric Model. China Land Sci. 2019, 33, 51–60. [Google Scholar] [CrossRef]
- Long, H.; Li, X. Rual Housing Land Transition in Transect of the Yangtse River. Acta. Geogr. Sin. 2005, 2, 179–188. [Google Scholar] [CrossRef]
- Xu, F.; Lu, X.; Chen, C. Spatial-temporal Pattern of Urban-rural Construction Land Transition in Shandong Province. J. Nat. Resour. 2017, 32, 1554–1567. [Google Scholar] [CrossRef]
- Almeida, C.M.; Monteiro, A.; Camara, G. Modeling the Urban Evolution of Land Use Transitions Using Cellular Automata and Logistic Regression. In Proceedings of the 2003 IEEE International Geoscience and Remote Sensing Symposium, Toulouse, France, 21–25 July 2003; pp. 1564–1566. [Google Scholar]
- Xu, X.; Wang, X.; Zhu, X.; Jia, H.; Han, D. Landscape Pattern Changes in Alpine Wetland of Bayanbulak Swan Lake during 1996-2015. J. Nat. Resour. 2018, 33, 1897–1911. [Google Scholar]
- Sarker, S.; Veremyev, A.; Boginski, V.; Singh, A. Critical Nodes in River Networks. Sci Rep. 2019, 9, 11178. [Google Scholar] [CrossRef]
- Gao, Y.; Sarker, S.; Sarker, T.; Leta, O.T. Analyzing the critical locations in response of constructed and planned dams on the Mekong River Basin for environmental integrity. Environ. Res. Commun. 2022, 4, 101001. [Google Scholar] [CrossRef]
- Chen, L.; Liu, Y.; Lu, Y.; Feng, X.; Fu, B. Landscape pattern analysis in landscape ecology: Current, challenges and future. Acta. Ecol. Sin. 2008, 28, 5521–5531. [Google Scholar] [CrossRef]
- Zhang, Q.; Fu, B.; Chen, L. Several Problems about Landscape Pattern Change Research. Sci. Geogr. Sin. 2003, 7, 264–270. [Google Scholar] [CrossRef]
- Buyantuyev, A.; Wu, J.; Gries, C. Multiscale analysis of the urbanization pattern of the Phoenix metropolitan landscape of USA: Time, space and thematic resolution. Landsc. Urban. Plan. 2015, 94, 206–217. [Google Scholar] [CrossRef]
- Wu, H.; Zeng, G.; Liang, J.; Chen, J.; Xu, J.; Dai, J.; Sang, L.; Li, X.; Ye, S. Responses of landscape pattern of China’s two largest freshwater lakes to early dry season after the impoundment of Three-Gorges Dam. Int. J. Appl. Earth Obs. Geoinf. 2017, 56, 36–43. [Google Scholar] [CrossRef]
- Li, D. The Influence of Channel and Coastline Evolution on Landscape Pattern in Yellow River Delta Based on Geo-information Map. Master’s Thesis, Lu Dong University, Yantai, China, 2018. [Google Scholar]
- Li, H.; Zhang, J.; Guo, J. Spatio-temporal evolution pattern of wetland landscape in the Yellow River Basin. Bull. Surv. Mapp. 2021, 6, 28–33. [Google Scholar] [CrossRef]
- Dadashpoor, H.; Azizi, P.; Moghadasi, M. Land use change, urbanization, and change in landscape pattern in a metropolitan area. Sci. Total. Environ. 2019, 655, 707–719. [Google Scholar] [CrossRef]
- Zhu, Z.; Liu, B.; Wang, H.; Hu, M. Analysis of the Spatiotemporal Changes in Watershed Landscape Pattern and Its Influencing Factors in Rapidly Urbanizing Areas Using Satellite Data. Remote Sens. 2021, 13, 1168. [Google Scholar] [CrossRef]
- Wei, Y.; Chen, W.J. RS and GIS based Analysis of Landscape Pattern due to Land-use Change. Shaanxi For. Sci. Technol. 2018, 46, 5–8. [Google Scholar] [CrossRef]
- Cabral, A.I.; Costa, F.L. Land cover changes and landscape pattern dynamics in Senegal and Guinea Bissau borderland. Appl. Geogr. 2017, 82, 115–128. [Google Scholar] [CrossRef]
- Yang, Y.; Tang, X.; Li, Z.; Jia, Y. Spatial-temporal Evolution of Landscape Pattern of Land Use in the Yangtze River Basin and Analysis of Its Driving Factors: A Case Study from2008 to 2018. J. Northwest For. Univ. 2021, 36, 220–230. [Google Scholar] [CrossRef]
- Xu, Q.; Wang, J.; Shi, W. Influence of Landscape Pattern Changes in Large-scale Open-pit Coal Mining Area on Soil Erosion: A Case Study on Pingshuo Mining Area in Shanxi Province. China Land Sci. 2022, 36, 96–106. [Google Scholar] [CrossRef]
- Eker, M.; Coban, H.O. Impact of road network on the structure of a multifunctional forest landscape unit in southern Turkey. J. Environ. Biol. 2010, 31, 157. [Google Scholar]
- Yu, H.; Zhang, F.; Kung, H.T.; Johnson, V.C.; Bane, C.S.; Wang, J.; Ren, Y.; Zhang, Y. Analysis of land cover and landscape change patterns in Ebinur Lake Wetland National Nature Reserve, China from 1972 to 2013. Wetl. Ecol. Manag. 2017, 25, 619–637. [Google Scholar] [CrossRef]
- Wang, L.; Yuan, Y.; Dong, H.; Huang, X.; Huang, P.; Zhang, C. Research on spatial scale effect of landscape pattern of land use in Wuhan City. World Reg. Stud. 2020, 29, 96–103. [Google Scholar]
- Lu, Q.; Zhao, C.; Wang, J.; Yang, X. Research on the Temporal and Spatial Evolution of Landscape Pattern Vulnerability in Guizhou Karst Mountains in the Past 30 Years. Resour. Environ. Yangtze Basin 2022, 31, 634–646. [Google Scholar] [CrossRef]
- Ruberti, D.; Vigliotti, M. Land use and landscape pattern changes driven by land reclamation in a coastal area: The case of Volturno delta plain, Campania Region, southern Italy. Environ. Earth. Sci. 2017, 76, 694. [Google Scholar] [CrossRef]
- Ludwig, J.A.; Bastin, G.N.; Chewings, V.H.; Eager, R.W.; Liedloff, A.C. Leakiness: A new index for monitoring the health of arid and semiarid landscapes using remotely sensed vegetation cover and elevation data. Ecol. Indic. 2007, 7, 442–454. [Google Scholar] [CrossRef]
- Hu, C.; Guo, X.; Lian, G.; Zhang, Z. Effects of land use change on ecosystem service value in rapid urbanization areas in Yangtze River Delta: A case study of Jiaxing City. Resour. Environ. Yangtze Basin 2017, 26, 333–340. [Google Scholar] [CrossRef]
- Zhang, Y.; Zhang, J.; Gong, J. Landscape pattern vulnerability and its influencing factors on a semi-arid lake basin: A case study of LiangCheng County. Arid. Zone. Res. 2022, 39, 1259–1269. [Google Scholar] [CrossRef]
- Zheng, D.; Jia, C.; Yuan, H. Spatial and temporal evolution of landscape pattern in downtown area of Jixi City, China. Eur. J. Remote. Sens. 2020, 53, 104–113. [Google Scholar] [CrossRef] [Green Version]
- Wang, X.; Pan, P.; Wang, X.; Wang, X. Simulation of landscape pattern for land use in Hebei province based on GeoSOS—FLUS model. Jiangsu J. Agric. Sci. 2021, 37, 667–675. [Google Scholar] [CrossRef]
- Jiao, N.; Zheng, X.; Yin, J. Coupling Coordinative Analysis and Influencing Factors of Tourism Economy and Ecological Environment in the Yellow River Basin. Resour. Dev. Mark. 2020, 36, 591–598. [Google Scholar] [CrossRef]
- Zhang, M.; Rong, G.; Han, A.; Riao, D.; Liu, X.; Zhang, J.; Tong, Z. Spatial-Temporal Change of Land Use and Its Impact on Water Quality of East-Liao River Basin from 2000 to 2020. Water 2021, 13, 1955. [Google Scholar] [CrossRef]
- Wang, Y.; Liu, X.; Li, J.; Wang, Y.; Bai, J.; Zhou, Z. Quantifying the spatial flow of soil conservation service to optimize land-use pattern under ecological protection scenarios. Front. Earth Sci. 2022, 10, 957520. [Google Scholar] [CrossRef]
- Peng, L.; Zhang, L.; Li, X.; Wang, Z.; Wang, H.; Jiao, L. Spatial expansion effects on urban ecosystem services supply-demand mismatching in Guanzhong Plain Urban Agglomeration of China. J. Geogr. Sci. 2022, 32, 806–828. [Google Scholar] [CrossRef]
- Liu, R.; Zhu, D. Methods for Detecting Land Use Changes Based on the Land Use Transition Matrix. Resour. Sci. 2010, 32, 1544–1550. [Google Scholar]
- Li, S.; Shen, Z.; Liu, K.; Xu, Z.; Wang, H.; Jiao, S.; Liu, X.; Lei, Y. Analysis of terrain gradient effects of land use change in Daqing River Basin. Trans. Chin. Soc. Agric. Eng. 2021, 37, 275–284. [Google Scholar] [CrossRef]
- Ding, Z.; Hua, H.; Wang, P.; Li, Y. Land use change geo-spectrum and its topographic gradient effect in the core areas of Hani Terraces, a World Heritage Site. Trans. Chin. Soc. Agric. Eng. 2021, 37, 225–234. [Google Scholar] [CrossRef]
- Wang, R. Connotation and Characteristics of Landscape Scale, Process and Pattern (LSPP) Research. Trop. Geogr. 2018, 38, 458–464. [Google Scholar] [CrossRef]
- Wu, J. Landscape Ecology—Concept and Theories. Chin. J. Ecol. 2000, 11, 42–52. [Google Scholar] [CrossRef]
- Su, C.; Fu, B.; Lu, Y.; Nan, L.; Yuan, Z.; He, A.; Lamparski, H. Land use change and anthropogenic driving forces: A case study in YanHe River Basin. Chin. Geogr. Sci. 2011, 21, 13. [Google Scholar] [CrossRef]
- Wang, L.J.; Wu, L.; Hou, X.Y.; Zheng, B.H.; Li, H.; Norra, S. Role of reservoir construction in regional land use change in Pengxi River basin upstream of the Three Gorges Reservoir in China. Environ. Earth. Sci. 2016, 75, 1–15. [Google Scholar] [CrossRef]
- Shi, Y.; Yamaguchi, Y. Quantifying the spatial differences of landscape change in the Hai River Basin, China, in the 1990s. Int. J. Remote. Sens. 2012, 33, 4482–4501. [Google Scholar] [CrossRef]
- Liu, X.; Li, Y.; Shen, J.; Fu, X. Landscape pattern changes at a catchment scale: A case study in the upper Jinjing River catchment in subtropical central China from 1933 to 2005. Landsc. Ecol. Eng. 2014, 10, 263–276. [Google Scholar] [CrossRef]
- Ju, H.; Zhang, Z.; Zuo, L.; Wang, J.; Zhang, S.; Wang, X.; Zhao, X. Driving forces and their interactions of built-up land expansion based on the geographical detector—A case study of Beijing, China. Int. J. Geogr. Inf. Sci. 2016, 30, 2188–2207. [Google Scholar] [CrossRef]
- Wang, J.; Li, X.; Christakos, G.; Liao, Y.; Zhang, T.; Gu, X.; Zheng, X. Geographical Detectors-Based Health Risk Assessment and its Application in the Neural Tube Defects Study of the Heshun Region, China. Int. J. Geogr. Inf. Sci. 2010, 24, 107–127. [Google Scholar] [CrossRef]
- Ováková, K.K.; Semerádová, S.; Mudrochová, M.; Skalo, J. Landscape functions and their change—A review on methodological approaches. Ecol. Eng. 2015, 75, 378–383. [Google Scholar] [CrossRef]
- Xin, L.; Ling, L.; Cheng, G.; Xiao, H. Quantifying landscape structure of the Heihe River Basin, north-west China using FRAGSTATS. J. Arid. Environ. 2001, 48, 521–535. [Google Scholar] [CrossRef]
- Tang, J.; Li, Y.; Cui, S.; Xu, L.; Ding, S. Linking land-use change, landscape patterns, and ecosystem services in a coastal watershed of southeastern China. Glob. Ecol. Conserv. 2020, 23, e1177. [Google Scholar] [CrossRef]
- Hamere, Y.; Teshome, S.; Mekuria, A.; Ashraf, D. Impact of landscape pattern changes on hydrological ecosystem services in the Beressa watershed of the Blue Nile Basin in Ethiopia. Sci. Total Environ. 2021, 793, 145790. [Google Scholar] [CrossRef]
- Gong, Y.; Li, J.; Li, Y. Spatiotemporal characteristics and driving mechanisms of arable land in the Beijing-Tianjin-Hebei region during 1990-2015. Socio-Econ. Plan. Sci. 2019, 70, 100720. [Google Scholar] [CrossRef]
- Wang, S.Y.; Liu, J.S.; Ma, T.B. Dynamics and changes in spatial patterns of land use in Yellow River Basin, China. Land Use Policy 2010, 27, 313–323. [Google Scholar] [CrossRef]
- Su, S.; Wang, Y.; Luo, F.; Mai, G.; Jian, P. Peri-urban vegetated landscape pattern changes in relation to socioeconomic development. Ecol. Indic. 2014, 46, 477–486. [Google Scholar] [CrossRef]
- Gong, C.; Yu, S.; Joesting, H.; Chen, J. Determining socioeconomic drivers of urban forest fragmentation with historical remote sensing images. Landsc. Urban. Plan. 2013, 117, 57–65. [Google Scholar] [CrossRef]
Figure 1.
Schematic diagram of the Yellow River Basin (Henan section).

Figure 2.
The workflow of this study.

Figure 3.
The types of land use in the Yellow River Basin (Henan section) (1990–2020): (a) spatial distribution of land use; (b) percent coverage of the land use types.
Figure 3.
The types of land use in the Yellow River Basin (Henan section) (1990–2020): (a) spatial distribution of land use; (b) percent coverage of the land use types.


Figure 4.
Quantitative change track of land use types in the Yellow River Basin (Henan section) from 1990 to 2020. Note: The curve of the Sankey diagram represents the transfer between landscape types, and the thickness of the curve represents the amount of transfer. The thicker the curve is, the greater the amount of transfer, and the thinner the curve is, the smaller the amount of transfer.

Figure 5.
Spatial distribution of land use change in the Yellow River Basin (Henan section) from 1990 to 2020.
Figure 5.
Spatial distribution of land use change in the Yellow River Basin (Henan section) from 1990 to 2020.

Figure 6.
Information atlas of land use change in the Yellow River Basin (Henan Section) from 1990 to 2020.
Figure 6.
Information atlas of land use change in the Yellow River Basin (Henan Section) from 1990 to 2020.

Figure 7.
Changes of landscape metrics (a) Number of Patches (NP), (b) Landscape Shape Index (LSI), (c) Contagion index (CONTAG), (d) Shannon’s Diversity Index (SHDI), and (e) Aggregation Index (AI) at the landscape level from 1990 to 2020.
Figure 7.
Changes of landscape metrics (a) Number of Patches (NP), (b) Landscape Shape Index (LSI), (c) Contagion index (CONTAG), (d) Shannon’s Diversity Index (SHDI), and (e) Aggregation Index (AI) at the landscape level from 1990 to 2020.

Figure 8.
Changes of landscape metrics: (a) Percentage of Landscape (PLAND), (b) Patch density (PD), (c) Largest Patch Index (LPI), (d) Edge density (ED), and (e) Splitting Index (SPLIT) at the patch type level from 1990 to 2020.
Figure 8.
Changes of landscape metrics: (a) Percentage of Landscape (PLAND), (b) Patch density (PD), (c) Largest Patch Index (LPI), (d) Edge density (ED), and (e) Splitting Index (SPLIT) at the patch type level from 1990 to 2020.

Figure 9.
Spatial distribution of the changes in landscape metrics between (a) 1990 and (b) 2020, with (c) showing the results of subtracting the 1990 indices from those of 2020.
Figure 9.
Spatial distribution of the changes in landscape metrics between (a) 1990 and (b) 2020, with (c) showing the results of subtracting the 1990 indices from those of 2020.

Figure 10.
The force (q-value) among each influencing factor on each landscape pattern metric in (a) 1990 and (b) 2020.
Figure 10.
The force (q-value) among each influencing factor on each landscape pattern metric in (a) 1990 and (b) 2020.

Figure 11.
The force (q-value) among any two influencing factors on each landscape pattern metric interactively in (a) 2000 and (b) 2010.
Figure 11.
The force (q-value) among any two influencing factors on each landscape pattern metric interactively in (a) 2000 and (b) 2010.

Table 1.
Required data and sources.
| Data | Type | Source | Website Link |
|---|---|---|---|
| Land use type | Grid | Resource and Environment Science and Data Center | https://www.resdc.cn/ (accessed on 9 September 2021) |
| Social economy, population density | Grid | Resource and Environment Science and Data Center | https://www.resdc.cn/ (accessed on 9 September 2021) |
| DEM | Grid | Geospatial Data Cloud | https://www.gscloud.cn/ (accessed on 9 September 2021) |
| Precipitation, temperature, etc. | Num | National Meteorological Science Data Center | http://data.cma.cn/ (accessed on 9 September 2021) |
Table 2.
Description of land use types in the Yellow River Basin (Henan section).
| Land Use Types | Description |
|---|---|
| Cultivated land | Paddy fields and dry land |
| Woodland | Natural and semi-natural manmade woodland, including closed forest land, shrub, open woodland, nursery, garden and other woodlands |
| Grassland | Natural and artificial grassland |
| Water | Rivers, creeks, canals, ponds, lakes, reservoirs, and bays |
| Construction land | Mainly urban and rural settlements, mining land, transportation land, and other special construction land |
| Unused land | Mainly land without vegetation cover and difficult to use, including bare soil, sandy land, desert, saline, and landfills |
Table 3.
Map change patterns of the Yellow River Basin (Henan section) from 1990 to 2020.
| Type | Description |
|---|---|
| Stable type | The land use pattern has not changed from 1990 to 2020. |
| Pre-change type | Only from 1990 to 2000 has the land use pattern changed. |
| Late change type | Only from 2010 to 2020 has the land use pattern changed. |
| Intermediate variation type | The land use pattern changed only once from 2000 to 2010. |
| Repeated change type | There were more than two changes from 1990 to 2020, and the land use patterns in 1990 and 2020 were the same. |
| Continuous change type | There were more than two changes from 1990 to 2020, and the land use patterns in 2005 and 2020 were different. |
Table 4.
Landscape Pattern Index of Yellow River Basin (Henan Section).
| Scale Level | Index Selection | Equation | Ecological Significance |
|---|---|---|---|
| Patch type | Patch density (PD) | The larger the number of patches per unit area, the higher the fragmentation degree. | |
| Edge density (ED) | Indicates the complexity of the boundary shape | ||
| Percentage of Landscape (PLAND) | Reflects the dominant types of landscape | ||
| Largest Patch Index (LPI) | The change of this value can reflect the influence of human activities on land use types, determine the dominant landscape types, and reflect the degree of landscape disturbance. | ||
| Splitting Index (SPLIT) | Directly indicates the overall fragmentation degree of the landscape. The higher the value, the greater the impact of human activities on the landscape. | ||
| Landscape | Number of Patches (NP) | Reflects the spatial pattern of the landscape and describes its heterogeneity and fragmentation. | |
| Landscape Shape Index (LSI) | Reflects the change law of patch shape in the landscape. The larger the value, the more irregular the shape of a patch in the landscape. | ||
| Aggregation Index (AI) | Indicates the aggregation degree of a patch type in the landscape. The larger the value, the more compact the aggregation degree. | ||
| Contagion index (CONTAG) | Indicates the degree of aggregation or extension among different patch types in the landscape. | ||
| Shannon’s Diversity Index (SHDI) | Focuses on the heterogeneity of the landscape. |
Notes: i = 1, ..., m patch types (classes); j = 1, ..., n patches; A = total area of each landscape type (m2); aij = area (m2) of patch ij; Pij = perimeter (m) of patch ij; Ni = number of patches in the landscape of patch type (class) i; m = number of patch types (classes) present in the landscape, excluding the landscape border if present; Pi = proportion of the landscape occupied by patch type (class) i. E = the total length of patch boundary in the landscape; N = the total number of landscape patches.
Table 5.
Factor interaction type and basis for determination.
| Judgment Basis | Interaction Type |
|---|---|
| q(X1∩X2) < Min(q(X1), q(X2)) | Reduction of nonlinearity |
| Min(q(X1), q(X2)) < q(X1∩X2) < Max(q(X1), q(X2)) | Nonlinear attenuation of single factor |
| q(X1∩X2) > Max(q(X1), q(X2)) | Two-factor enhancement |
| q(X1∩X2) = q(X1) + q(X2) | Mutual independence of factors |
| q(X1∩X2) > q(X1) + q(X2) | Enhancement of nonlinearity |
Table 6.
Area (km²) and ratio (%) of land use types in the Yellow River Basin (Henan section) from 1990 to 2020.
Table 6.
Area (km²) and ratio (%) of land use types in the Yellow River Basin (Henan section) from 1990 to 2020.
| Land Use Types | 1990 | 2000 | 2010 | 2020 | ||||
|---|---|---|---|---|---|---|---|---|
| Area | Ratio | Area | Ratio | Area | Ratio | Area | Ratio | |
| Farmland | 19,898.43 | 54.29 | 20,272.34 | 55.31 | 19,983.48 | 54.52 | 19,672.54 | 53.68 |
| Woodland | 8385.25 | 22.879 | 8362.09 | 22.816 | 8335.33 | 22.743 | 8332.71 | 22.736 |
| Grassland | 3674.53 | 10.03 | 3566.16 | 9.73 | 3529.15 | 9.63 | 3523.52 | 9.61 |
| Water | 1414.17 | 3.86 | 1024.58 | 2.80 | 1237.48 | 3.38 | 1265.40 | 3.45 |
| Construction land | 3154.10 | 8.61 | 3380.83 | 9.22 | 3552.33 | 9.69 | 3842.56 | 10.48 |
| Unused land | 124.14 | 0.34 | 44.61 | 0.12 | 12.84 | 0.04 | 13.88 | 0.04 |
Table 7.
Land Use Transfer Matrix of the Yellow River Basin (Henan Section) from 1990 to 2020 (km²).
Table 7.
Land Use Transfer Matrix of the Yellow River Basin (Henan Section) from 1990 to 2020 (km²).
| 1990 | 2020 | 1990 Total | |||||
|---|---|---|---|---|---|---|---|
| Cultivated Land | Woodland | Grassland | Water | Construction Land | Unused Land | ||
| Cultivated land | 19,029.44 | 10.29 | 8.19 | 193.53 | 656.91 | 0.06 | 19,898.43 |
| Woodland | 42.13 | 8243.43 | 78.12 | 13.47 | 7.69 | 0.41 | 8385.25 |
| Grassland | 125.70 | 74.42 | 3429.21 | 33.89 | 10.90 | 0.41 | 3674.53 |
| Water | 382.04 | 4.56 | 5.96 | 1009.16 | 10.86 | 1.59 | 1414.17 |
| Construction land | 3.37 | 0.00 | 0.15 | 1.37 | 3149.20 | 0.00 | 3154.10 |
| Unused land | 89.86 | 0.00 | 1.89 | 13.98 | 7.00 | 11.41 | 124.14 |
| 2020 total | 19,672.54 | 8332.71 | 3523.52 | 1265.40 | 3842.56 | 13.88 | |
Publisher’s Note: MDPI stays neutral with regard to jurisdictional claims in published maps and institutional affiliations. |
© 2022 by the authors. Licensee MDPI, Basel, Switzerland. This article is an open access article distributed under the terms and conditions of the Creative Commons Attribution (CC BY) license (https://creativecommons.org/licenses/by/4.0/).
Share and Cite
MDPI and ACS Style
Niu, H.; Zhao, X.; Xiao, D.; Liu, M.; An, R.; Fan, L. Evolution and Influencing Factors of Landscape Pattern in the Yellow River Basin (Henan Section) Due to Land Use Changes. Water 2022, 14, 3872. https://doi.org/10.3390/w14233872
AMA Style
Niu H, Zhao X, Xiao D, Liu M, An R, Fan L. Evolution and Influencing Factors of Landscape Pattern in the Yellow River Basin (Henan Section) Due to Land Use Changes. Water. 2022; 14(23):3872. https://doi.org/10.3390/w14233872
Chicago/Turabian StyleNiu, Haipeng, Xiaoming Zhao, Dongyang Xiao, Mengmeng Liu, Ran An, and Liangxin Fan. 2022. "Evolution and Influencing Factors of Landscape Pattern in the Yellow River Basin (Henan Section) Due to Land Use Changes" Water 14, no. 23: 3872. https://doi.org/10.3390/w14233872
Note that from the first issue of 2016, this journal uses article numbers instead of page numbers. See further details here.