
Study on Waterlogging Reduction Effect of LID Facilities in Collapsible Loess Area Based on Coupled 1D and 2D Hydrodynamic Model
by
Jie Mu
1,2, 
Miansong Huang
3,*,
Xiaoli Hao
1,2,
Xiaolan Chen
1,2,
Haijun Yu
1,2 and
Binbin Wu
1,2 1
State Key Laboratory of Simulation and Regulation of Water Cycle in River Basin, China Institute of Water Resources and Hydropower Research, Beijing 100038, China
2
Research Center on Flood and Drought Disaster Reduction of the Ministry of Water Resources, Beijing 100038, China
3
Intelligent Environmental Protection Division, Beijing Capital Eco-Environment Protection Group Co., Ltd., Beijing 100044, China
*
Author to whom correspondence should be addressed.
Water 2022, 14(23), 3880; https://doi.org/10.3390/w14233880
Submission received: 30 September 2022
/
Revised: 19 November 2022
/
Accepted: 21 November 2022
/
Published: 28 November 2022
(This article belongs to the Special Issue Assessment of Urban Pluvial Flood Risk and Utilization of Rainwater & Flood Resources)
Abstract
:The accurate evaluation method of LID toward the attenuation of urban flood is still a hot issue. This paper focuses on a coupled 1D and 2D hydrodynamic model, investigating the model parameters set in a collapsible loess area, and the changes in the surface runoff, waterlogged area, and drainage network indicators under different rainfall patterns. The results show that the coupled model can effectively simulate the effect of LID facilities under unaltered and retrofitted conditions. It is found that the infiltration parameters in a collapsible loess area are higher than in other eastern cities by calibration and validation. After implementing the LID facilities, the total runoff, peak flood flow, waterlogged area, runoff coefficient, and drainage pressure under different rainfall patterns have all been reduced. With the increases in the rainfall return period, the waterlogging reduction effect of LID facilities would gradually weaken. The rainfall return period has a great impact on the indicators of surface runoff, waterlogged area, and drainage capacity. The coefficient of rainfall peak has a relatively big impact on indicators of pipelines, such as the proportion of overflow nodes, the proportion of fully loaded pipelines, and the average full-load duration. The rainfall duration has a major impact on the total runoff quantity, runoff coefficient, and average full-load duration.
1. Introduction
Ever since the reform and opening up, China’s urbanization drive has been increasing rapidly. The urbanization rate of China has increased from 17.9% [1] in 1978 to 64.72% [2] by the end of 2021. The rapid city expansion has changed the pattern of urban land use, significantly raised the proportion of impervious land, and changed the hydrological effect of cities [3,4]. The “urban heat island” and “rain island” have increased extreme rainfall around cities. On top of that, the construction of underground pipelines in our country still lags behind the ground projects, the drainage network building constantly fell behind the drive of urban expansion, which significantly raised the risk of urban waterlogging [5]. As result, following decades of urbanization, overexploitation and pollution, China is now experiencing a serious water shortage and flooding made worse by the climate crisis.
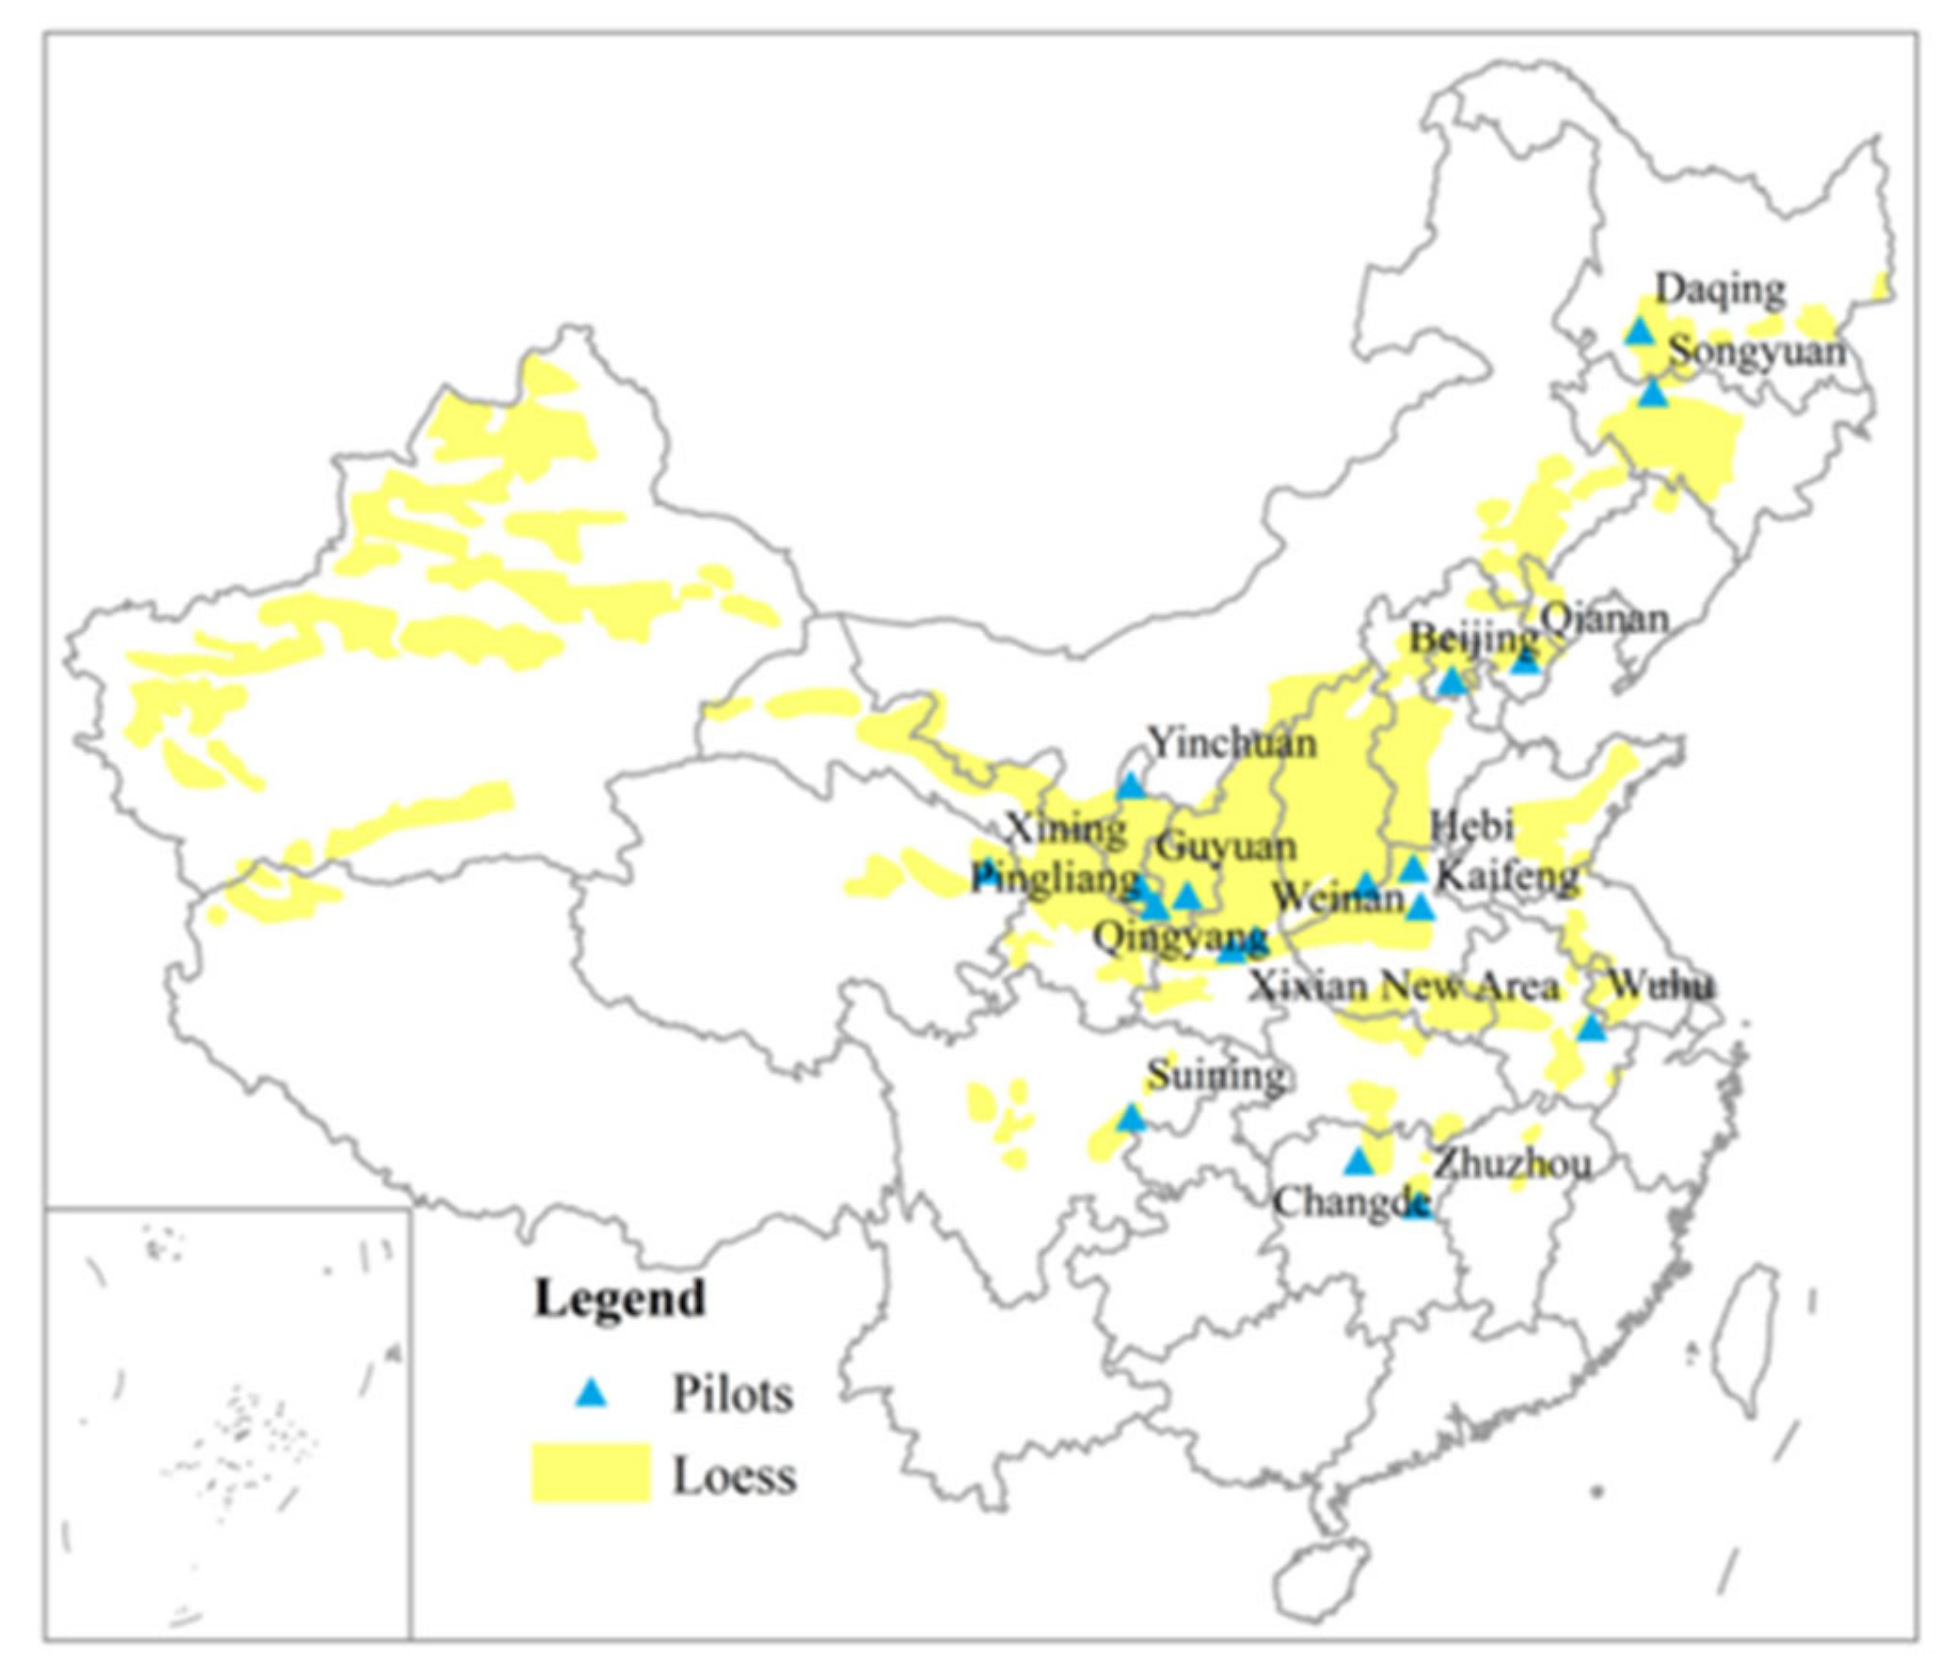
In December 2013, the Central Working Conference of Urbanization proposed the idea of “building a sponge city with natural storing ability, natural perviousness, and natural purifying capacity”, where the philosophy of a sponge city was raised for the first time [6]. In 2014 and 2015, the Ministry of Housing and Urban-Rural Development and the General Office of State Council rolled out the “Sponge City Construction Guide-Low-Impact Development System” and the “Guiding Opinions on Promoting the Construction of the Sponge City” [7,8], respectively. Sponge cities represent a shift in environmental governance and planning in China, focusing on the increasingly evident impacts of years of resource exploitation and rapid urbanization and seeking to mitigate the damaging implications of flooding, water shortages and pollution [9,10]. Its main content includes low-impact development measures, drainage network promotion, and over-standard rainwater discharge systems [11,12,13]. Since 2015, there have been three batches of 55 different pilot sponge cities implemented across China. Among the 55 pilot sponge cities, about 22 percent are located in the loess region (Figure 1). With the construction and operation of LID facilities in pilot cities, the post-evaluation of sponge cities is needed to resolve the range of challenges for its necessary implementation on flood mitigation [14].
In general, the SWMM model is one of the most widely used urban stormwater models at home and abroad. By establishing a 1D drainage network model, the SWMM model can simulate urban runoff and drainage, and assess the beneficial effect of sponge city construction [15,16,17,18]. Peng et al. and Sin et al. used the SWMM model to analyze the runoff reduction effect of the different LID schemes [19,20,21]. Lee et al. used the SWMM model to compare the runoff reduction rate before and after the installation of LID facilities [22]. Huang et al. used the SWMM model to study flood mitigation schemes with multiple LID complex facilities in megacities [23]. Cui et al. analyzed the improvement effect of different LID schemes on the drainage network system of Taiyuan city [24].
It is noteworthy that in a comprehensive review, dozens of theses in the past two years show that most of the previous research is based on the SWMM model. One-dimensional (1D) models of the existing studies have been widely used to evaluate the flood reduction in pipes, which cannot effectively simulate the surface water accumulation and flooding process, and were proved insufficient in some applications such as the optimization for LID facility layout on waterlogged points.
Apart from the studies on the attenuation of urban flooding by LID facilities by SWMM, some researchers focused on the effects of the rainfall characteristics on the urban inundation via 2D hydrodynamic model [25,26].
Moreover, the sponge city construction in the loess region of China has just entered the research stage; the sponge measures adopted in pilots of the loess areas are different from those in other cities, and with few studies carried out to evaluate its effect [27,28]. Despite the fact that runoff reduction performance of pilot sponge cities is widely recognized in humid regions, waterlogging reduction is still a new practice in the loess region, and it is still subject to further research to answer the following questions:
- (1)
- What are the reasonable infiltration parameters for the hydrodynamic model in collapsible loess regions;
- (2)
- How to effectively evaluate the effects of LID facilities on the degree of waterlogging and the drainage capacity of pipelines;
- (3)
- What are the changes in waterlogging levels before and after LID facility construction in the collapsible loess region;
- (4)
- What are the changes in the surface runoff, waterlogged area, and drainage network indicators under different rainfall patterns.
Attempting to answer these questions, this paper has adopted a flood analysis model independently developed by the China Institute of Water Resources and Hydropower Research, and selected the pilot sponge city—Guyuan—as the research object, with a focus on the effect of LID facilities in the collapsible loess areas. A coupled 1D and 2D hydrodynamic model was put forward to evaluate the indicators of waterlogging and drainage capacity. The numerical model of Guyuan city has been constructed, calibrated and validated with the observed precipitation and waterlogging data. By analyzing the effect of LID facilities on urban waterlogging reduction and under different rainfall patterns, this paper provides guidance on the optimization and improvement of sponge city measures in the collapsible loess plateau of northwest China.
2. Materials and Methods
2.1. Study Site
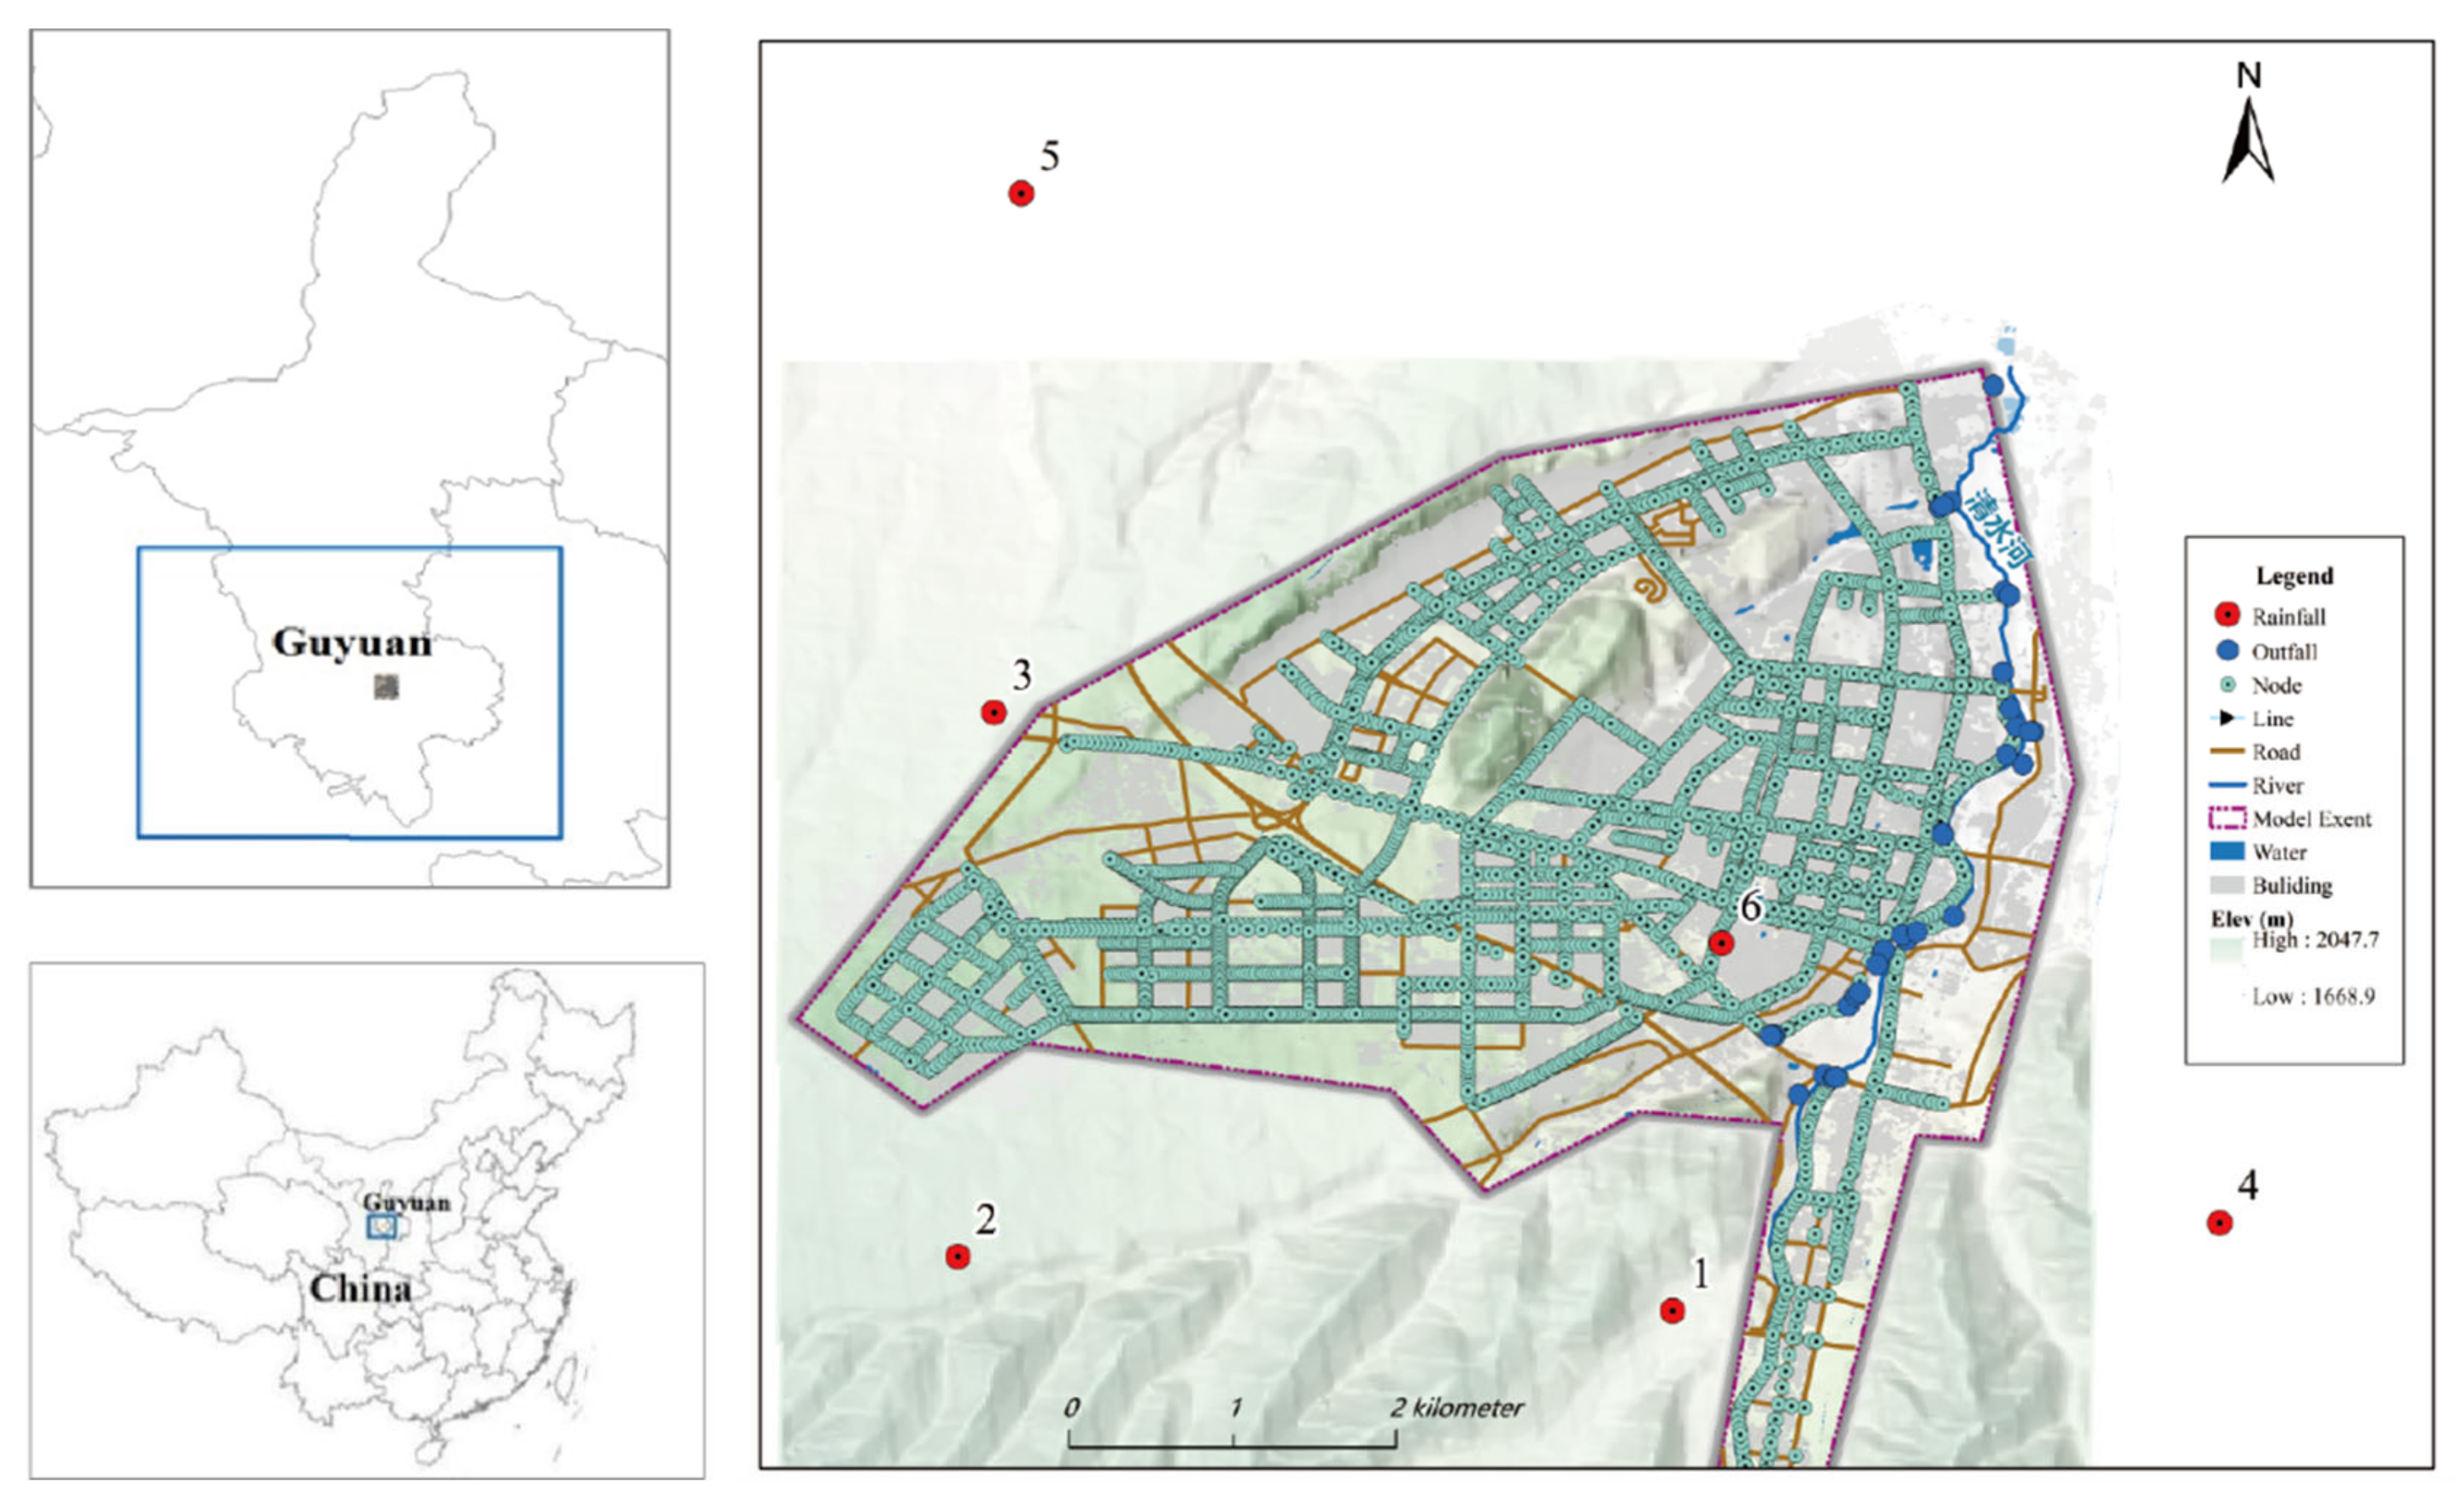
Guyuan is located in the south of the Ningxia Hui Autonomous Region. It was approved as one of the second batch of pilot sponge cities in 2016 and is located in the collapsible loess region of China. The study area covers about 42.6 km2. The specific location and range of the study area are shown in Figure 2. Guyuan is a semiarid region that belongs to the Loess Plateau. The average annual rainfall of Guyuan is 466 mm and the average evaporation is 1471 mm [29]. As a result, Guyuan faces shortage of water resources caused by strong evaporation, and its precipitation is extremely unevenly distributed throughout the year. In total, 70% of its precipitation is concentrated from June to September, with alternating drought and floods hitting the city all the time. In view of this, the sponge city construction is of great importance to Guyuan, since it can alleviate the situation of drought and flood, improve the city’s resilience, and avoid losses caused by extreme weather.
The structure of soil layers in Guyuan were destroyed after soaking, leading to differential settlement and thereby causing damages to above-ground construction. This is the reason large-scale infiltration facilities are not fit for a sponge city construction in Guyuan, nor are the pervious roads or pervious pavements. In view of this, the LID facilities in Guyuan mainly consists of rainwater utilization and drainage facilities, including rainwater gardens, green space reconstruction, grass swale and rain barrels.
2.2. Data Collection and Preprocessing
2.2.1. Topographic Data
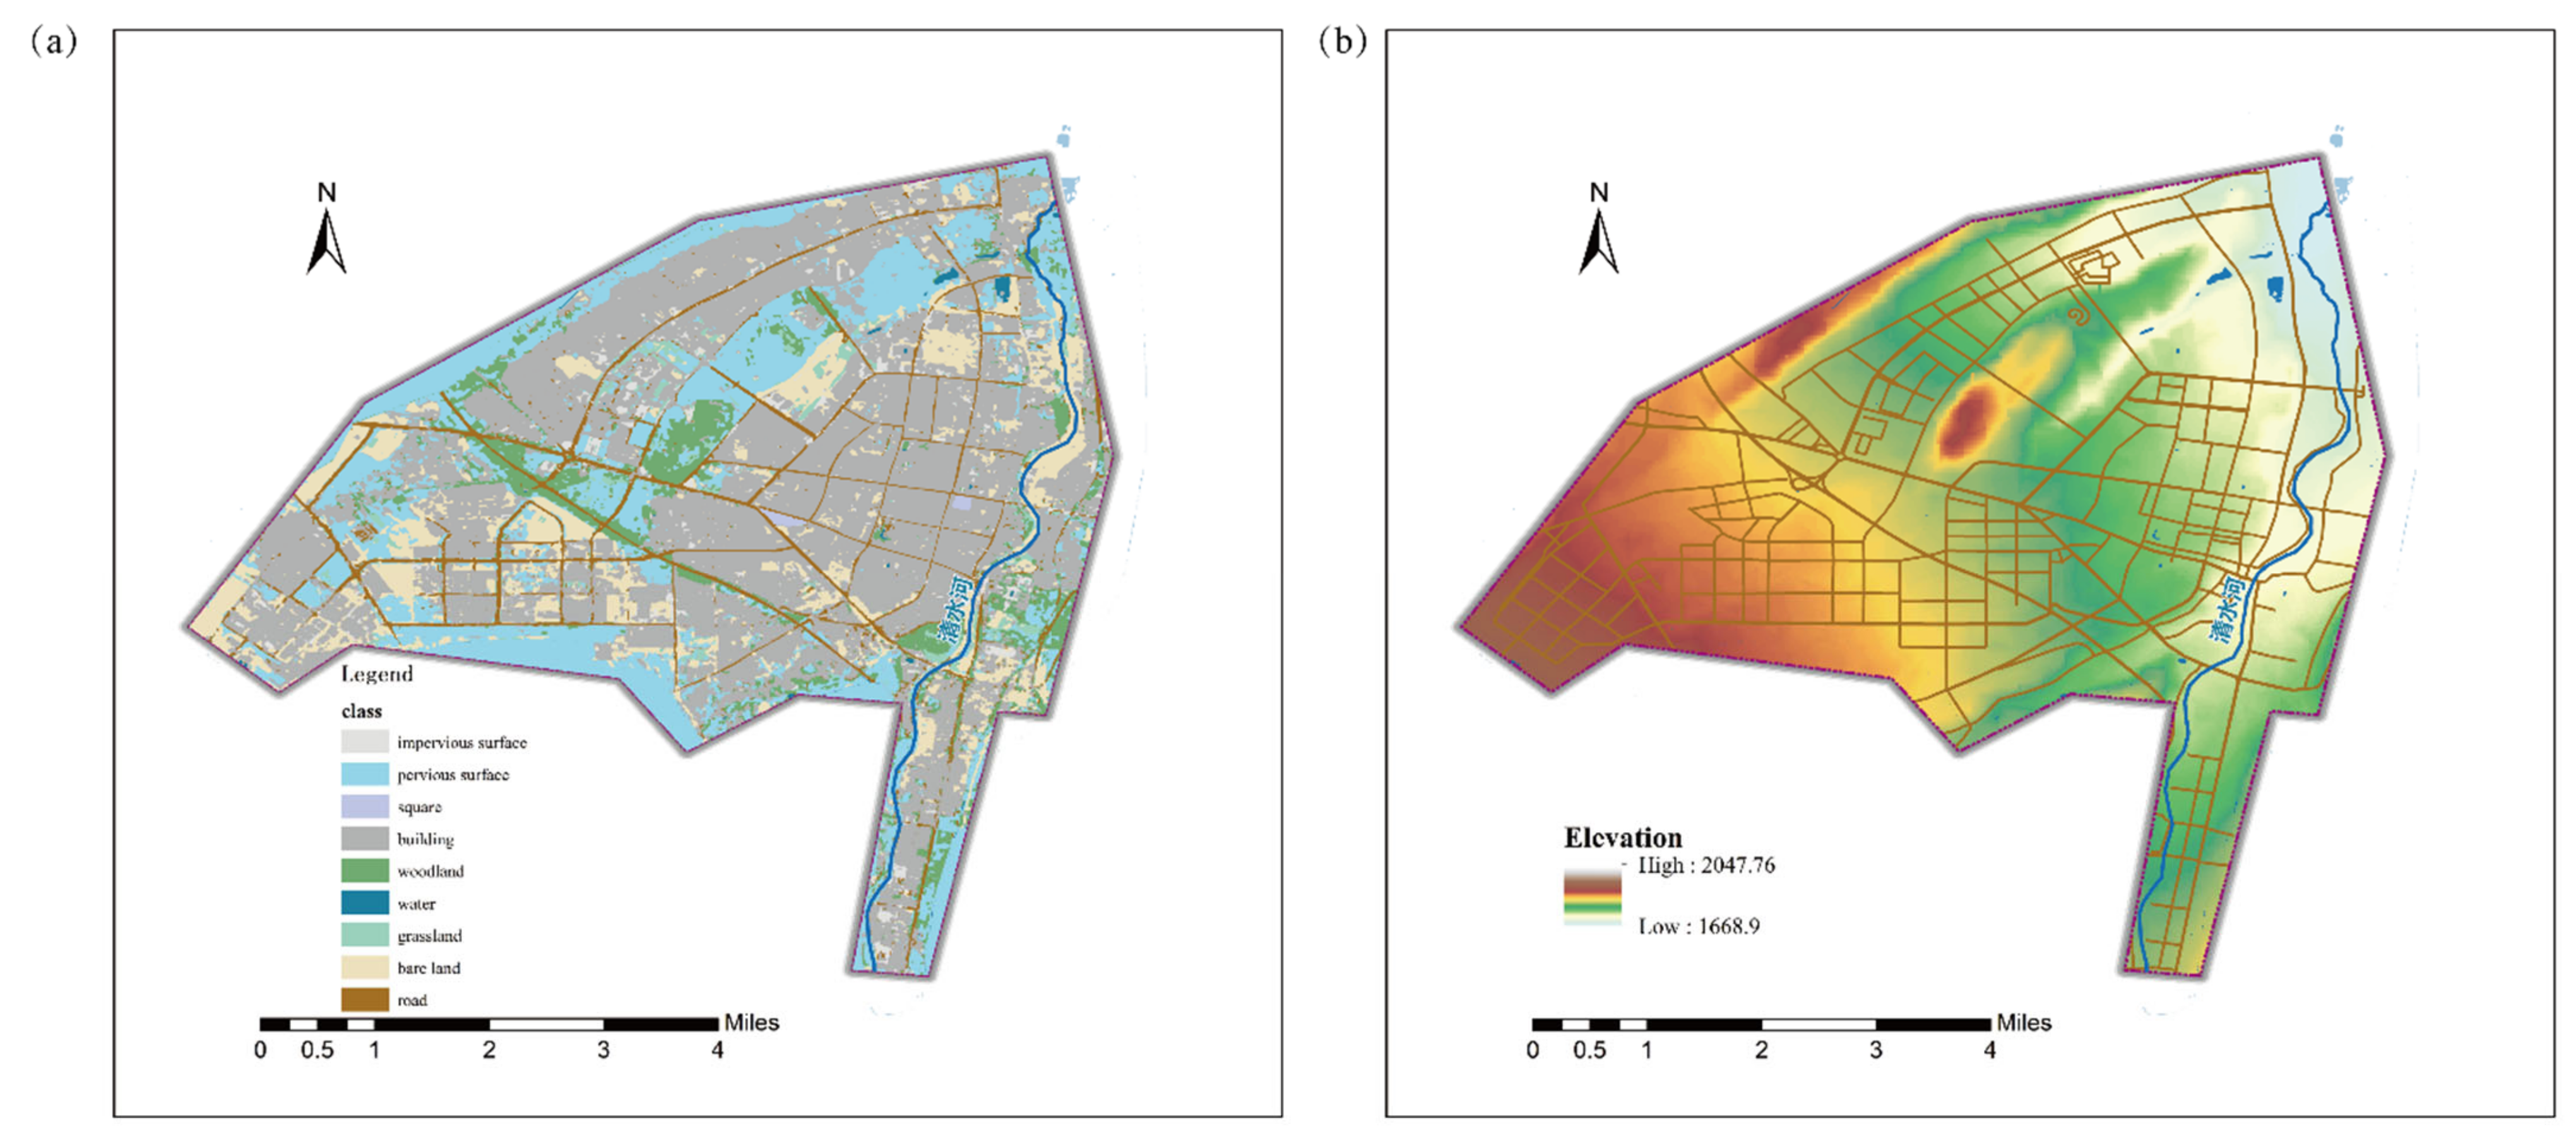
The DEM and remote sensing image data of the study area were provided by the undertaker of sponge city construction (Ningxia Capital Sponge City Construction and Development CO., LTD., Guyuan, China) with a data accuracy of 10 m. Additionally, the DEM and other GIS data use the projection of CGCS2000_3_degree_Gauss_Kruger_CM_105E and the datum of the 1985 National Height reference point. The elevations of railways and highways were duly corrected based on field survey. The land use data in this paper was manually interpreted using the image data of 2017, with 1 m resolution. The remote sensing image was interpreted into nine land use types, constituting land use classification research with results as follows: grassland, woodland, bare land, road, square, building, water, other pervious surface, and impervious surface (Figure 3a). Based on the DEM data (Figure 3b) and land use data, elevation calculation, roughness setting, and area correction of the 2D grid cells were conducted.
2.2.2. Drainage Network Data
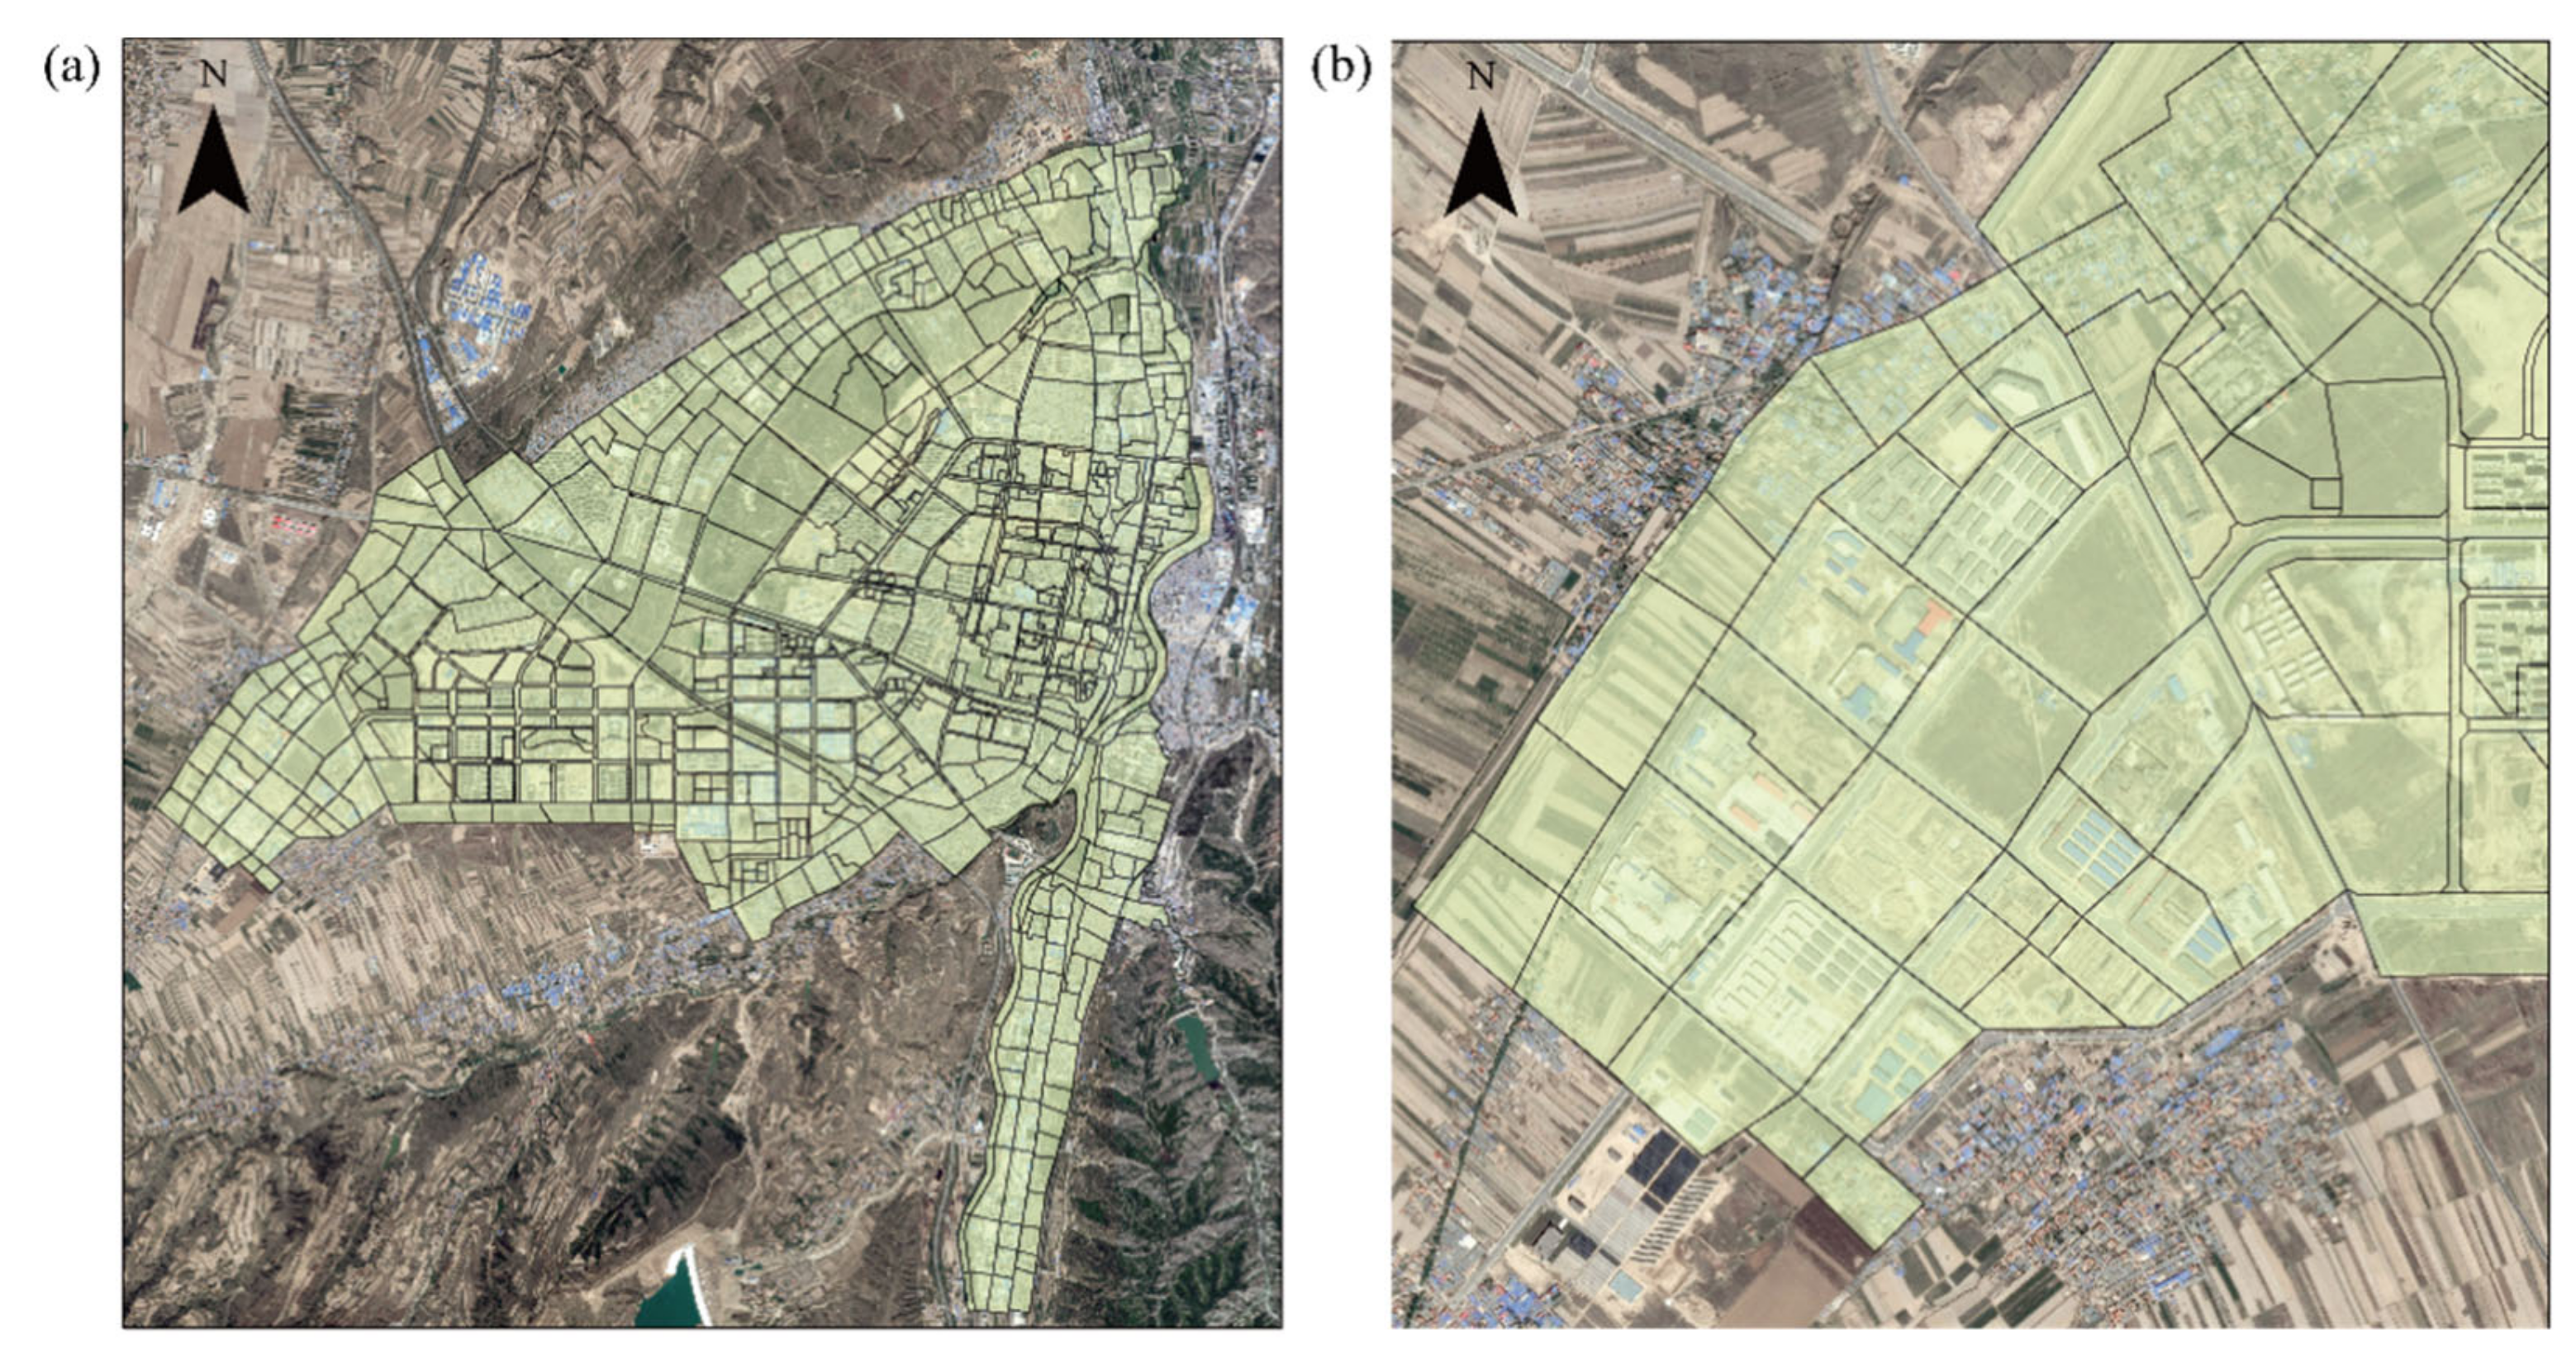
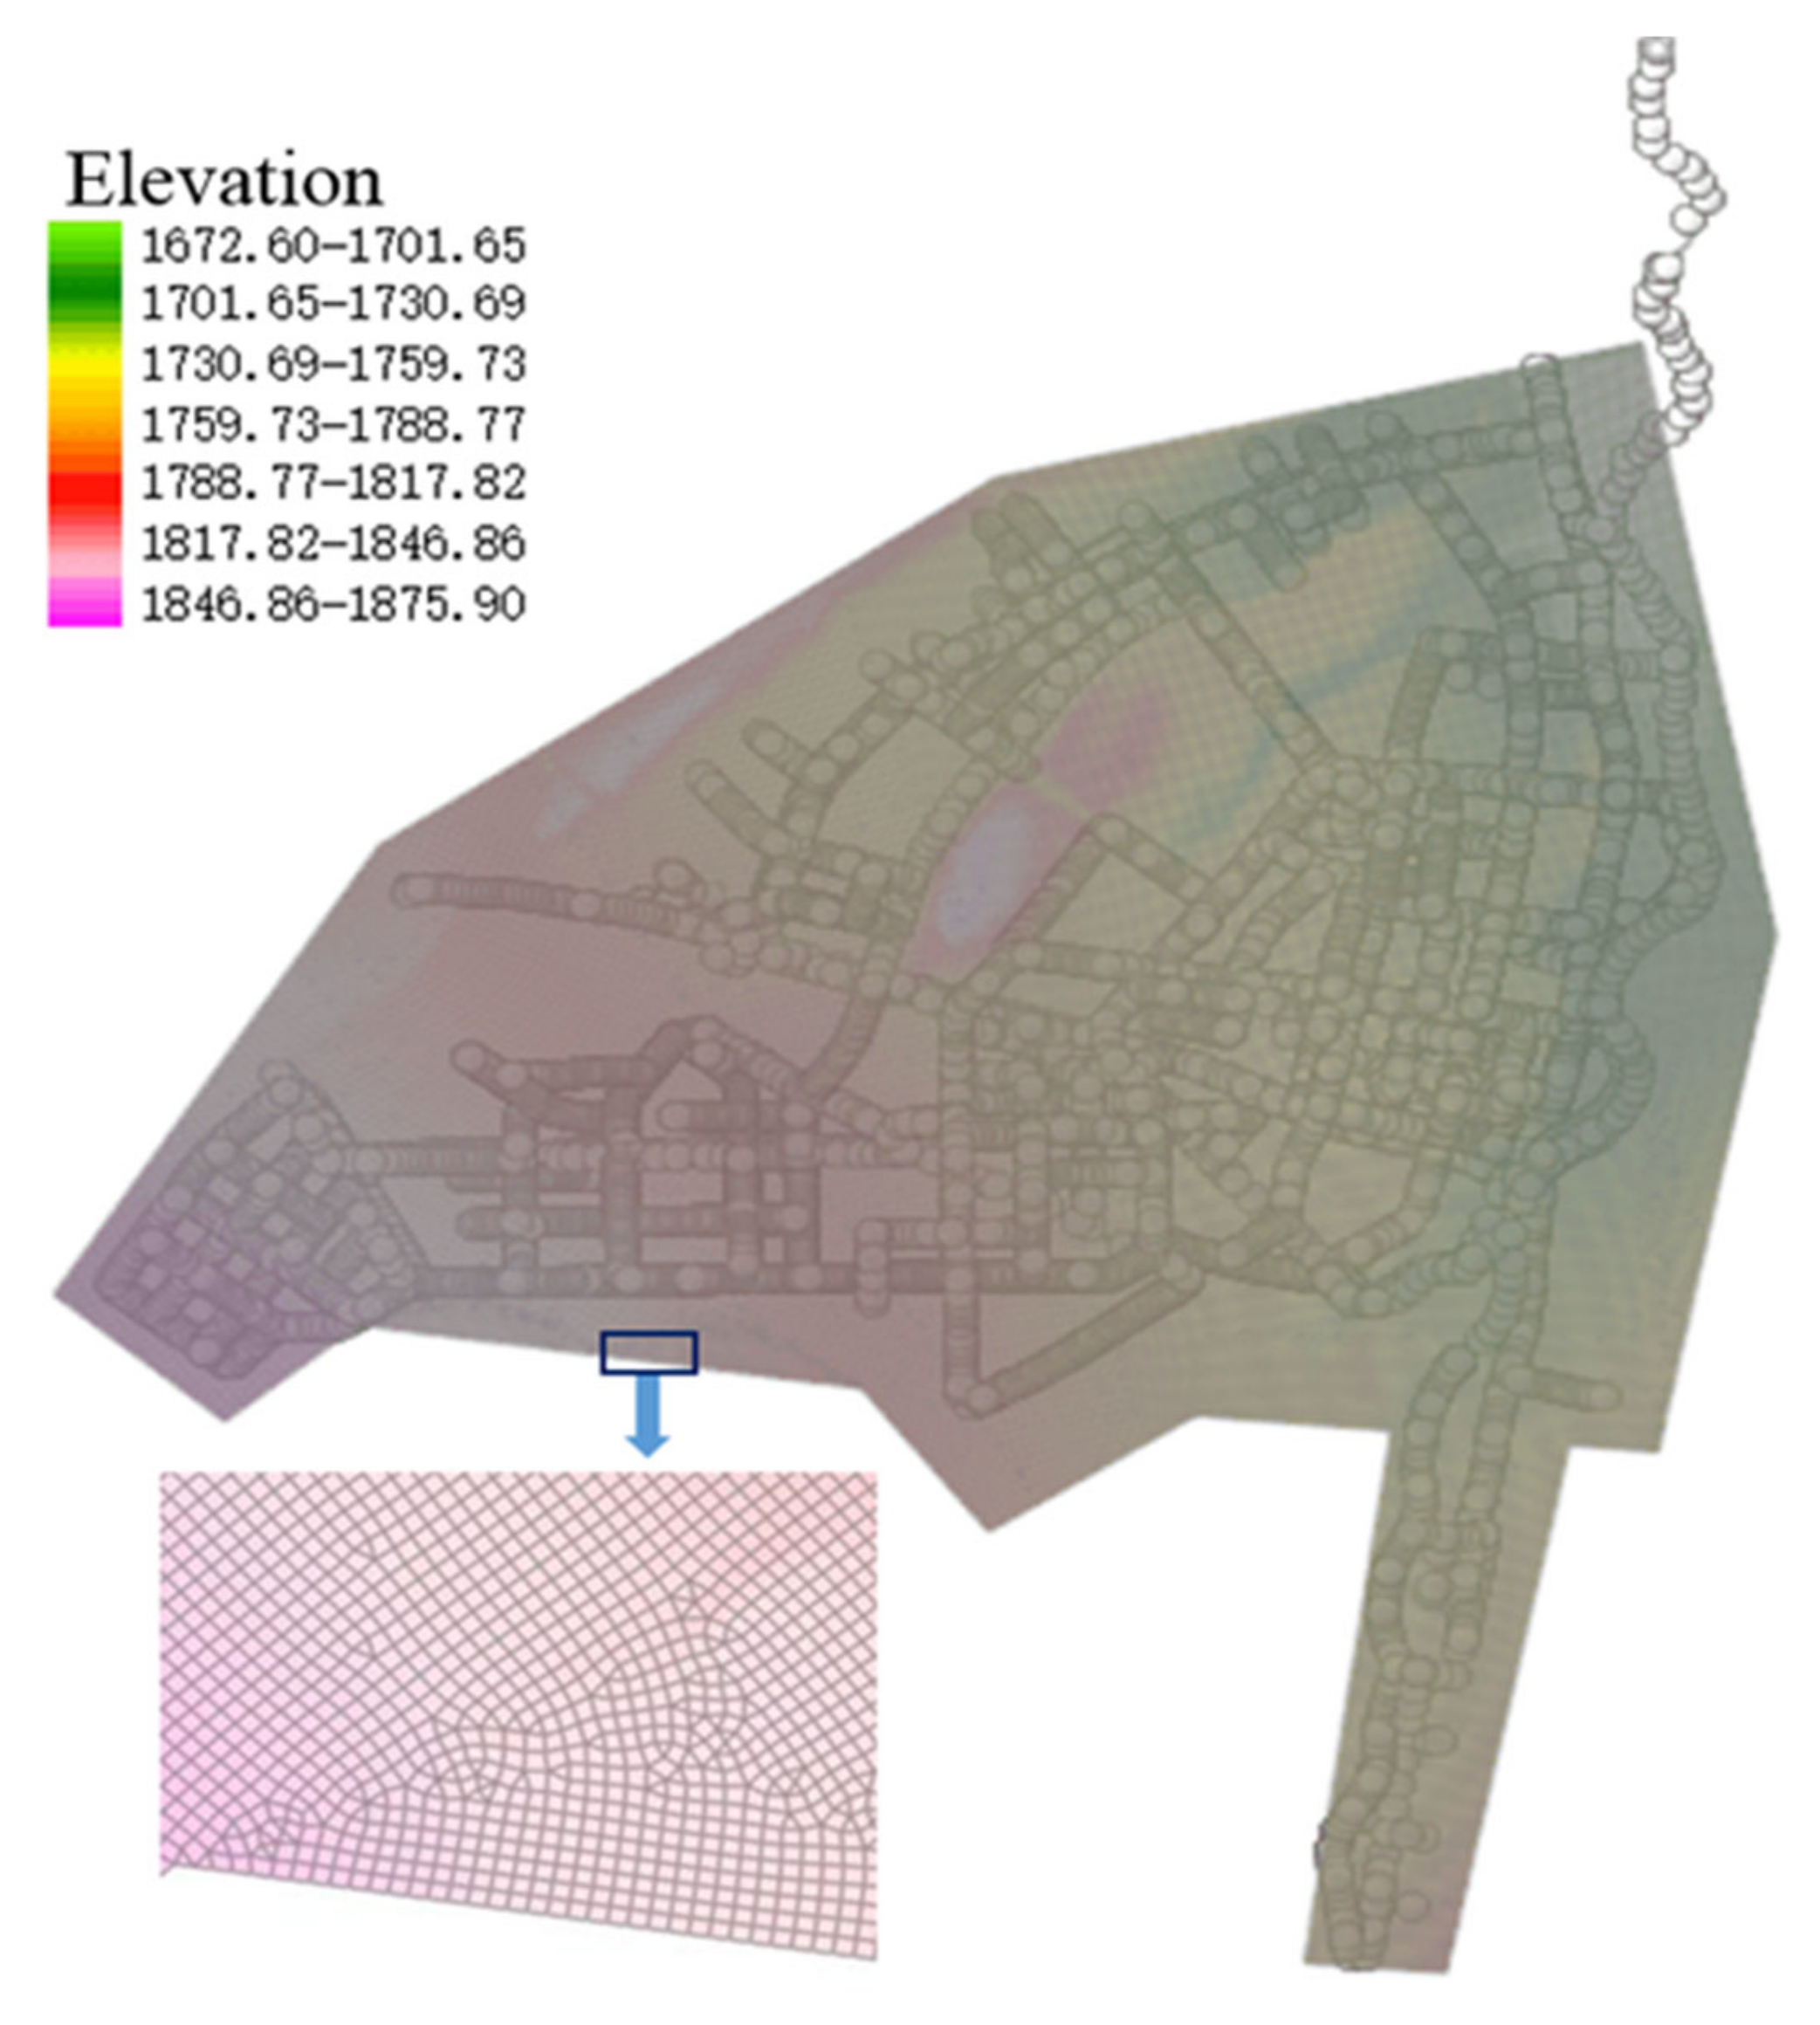
Drainage network data in the study area include river data and pipe data. These data were provided by the undertaker of sponge city construction. The river considered in the study model is Qingshui River, which goes across the study area from south to north. After processing, there are a total of 4623 pipes with a total length of 208.027 km and 4512 nodes. The diameter of the pipes is about 0.2–2.2 m, with a total of 32 discharge outlets according to field survey. The study area was divided into 1494 sub-catchment areas based on topography, roads, buildings, LID measures and other factors, as shown in Figure 4. Figure 5 shows the coupled 1D and 2D hydrodynamic model of the study area, and the details are added in the Supplementary Materials.
2.2.3. Rainstorm Data
This study used two observed rainstorms data to calibrate and validate the coupled 1D and 2D hydrodynamic model, and used design rainstorms to analyze the changes of waterlogging levels before and after LID facilities construction in collapsible loess region.
The two observed rainstorms happened on 27 July 2017 and 21 August 2018, respectively; the statistical values of them as shown in Table 1. Moreover, the first rainstorm started at 5:00 and ended at 13:00, lasting for 8 h; the peak rainfall was at 12.6 mm/h, and the cumulative rainfall reached 46.822 mm. The second rainfall started at 4:00 and ended at 9:00, lasting for 6 h; the peak rainfall was at 21.6 mm/h, and the cumulative rainfall reached 63.816 mm. The maximum rainfall intensity of two rainfall events mainly focuses on the 6:00–9:00 (20170727) and 4:00–8:00 (20180821) events, respectively.
Based on the literature [30], this paper has adopted the following rainstorm intensity formula:
where: i is the intensity of the rainstorm, mm/min; p is the return period, a; t is the duration of the rainstorm, min. In order to evaluate the effect of sponge city construction in Guyuan on the flooding process of the waterlogged nodes under different rainfall patterns, rainstorms with different return periods (once in every 2, 10, and 50 years), different peak position coefficients (0.25, 0.5, 0.75) and different duration (2 h, 6 h, 12 h) were derived from the Chicago approach using Formula 1. Scenarios with different rainfall patterns are shown in Table 2.
2.2.4. LID Data
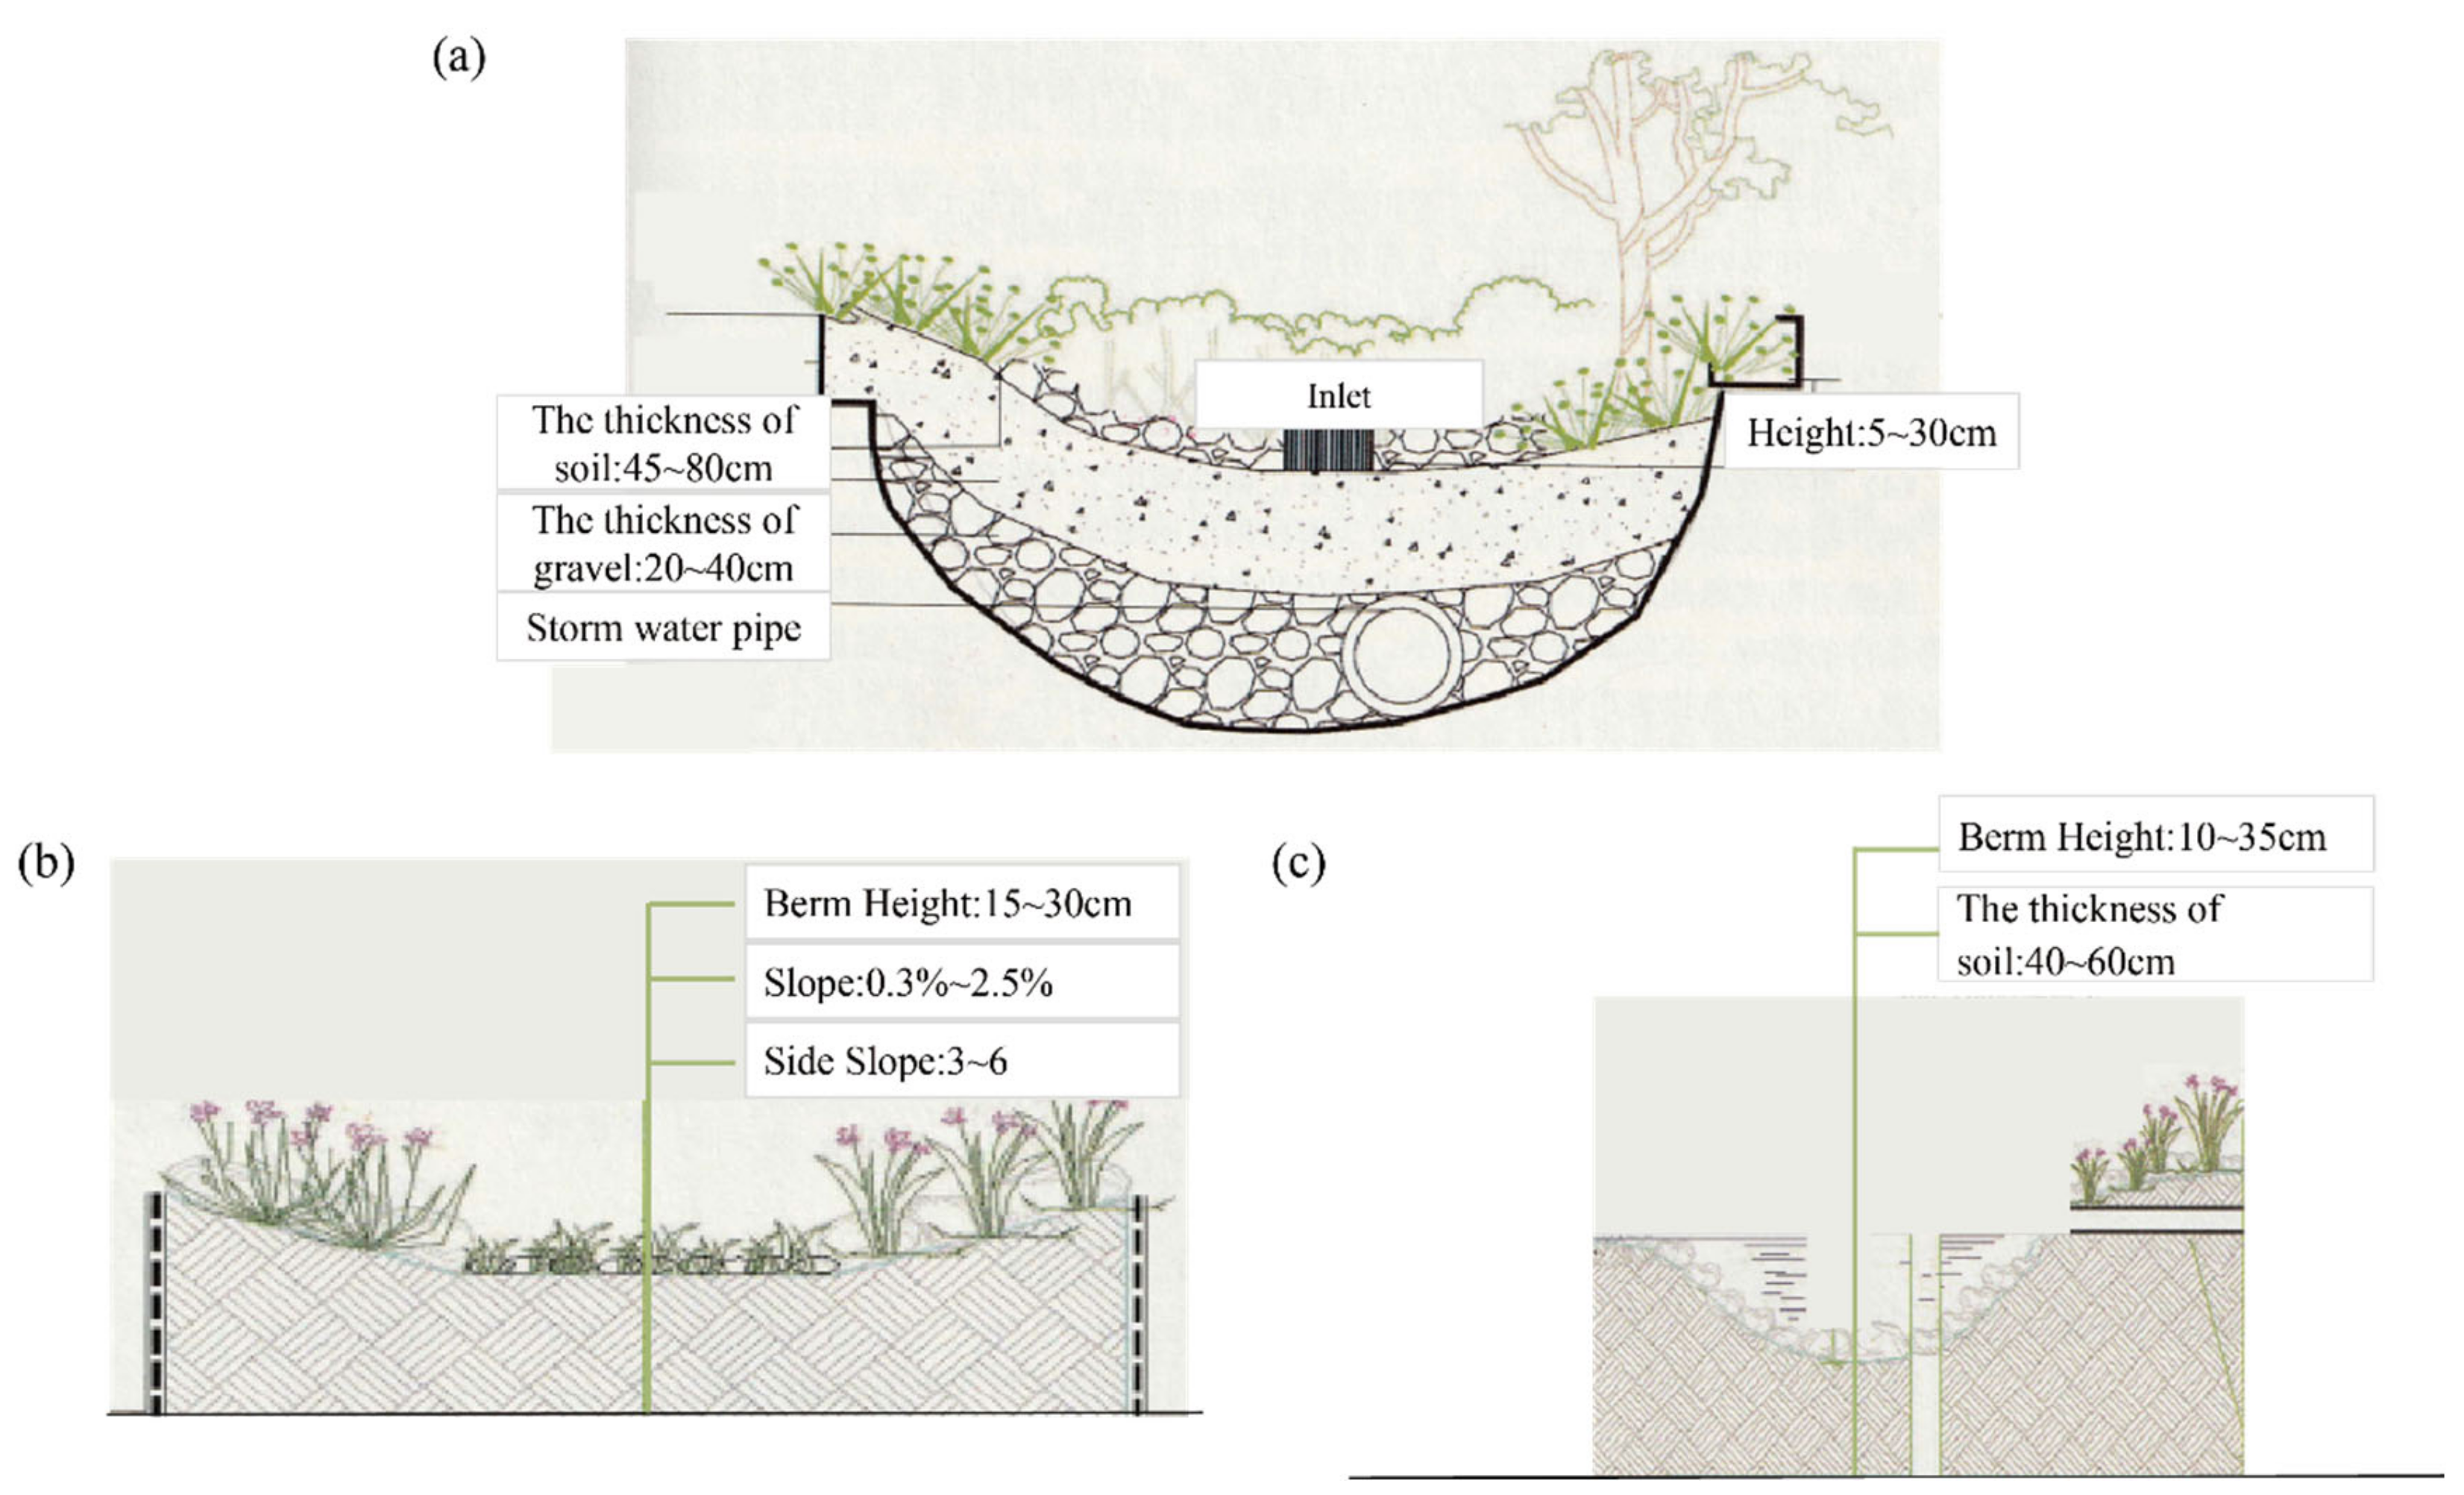
The LID facilities in Guyuan city includes rainwater gardens, sunken green space, vegetative swale, rain barrels. The implementation area of sponge city measures in Guyuan is shown in Table 3. These four LID facilities are adopted in three types of projects, which consist of the sponge renovation of parks and squares, communities, and government-funded projects. The size of LIDs in the study area is shown in Figure 6. the height of rain barrel is about 0.6~1.4 m. Because Guyuan city is located in the collapsible loess region, therefore, its LID facilities do not include permeable pavement.
To reflect the waterlogging reduction changes in sponge measures, the parameters of the LID facilities in each sub-catchment are adjusted in the simulation model according to the sponge city planning. The parameters of the LID measures of the model are not exactly the same in different sponge renovation projects. Here, Table 4 shows the parameters setting of LID facilities for a residential community as an example.
2.3. Model Theory
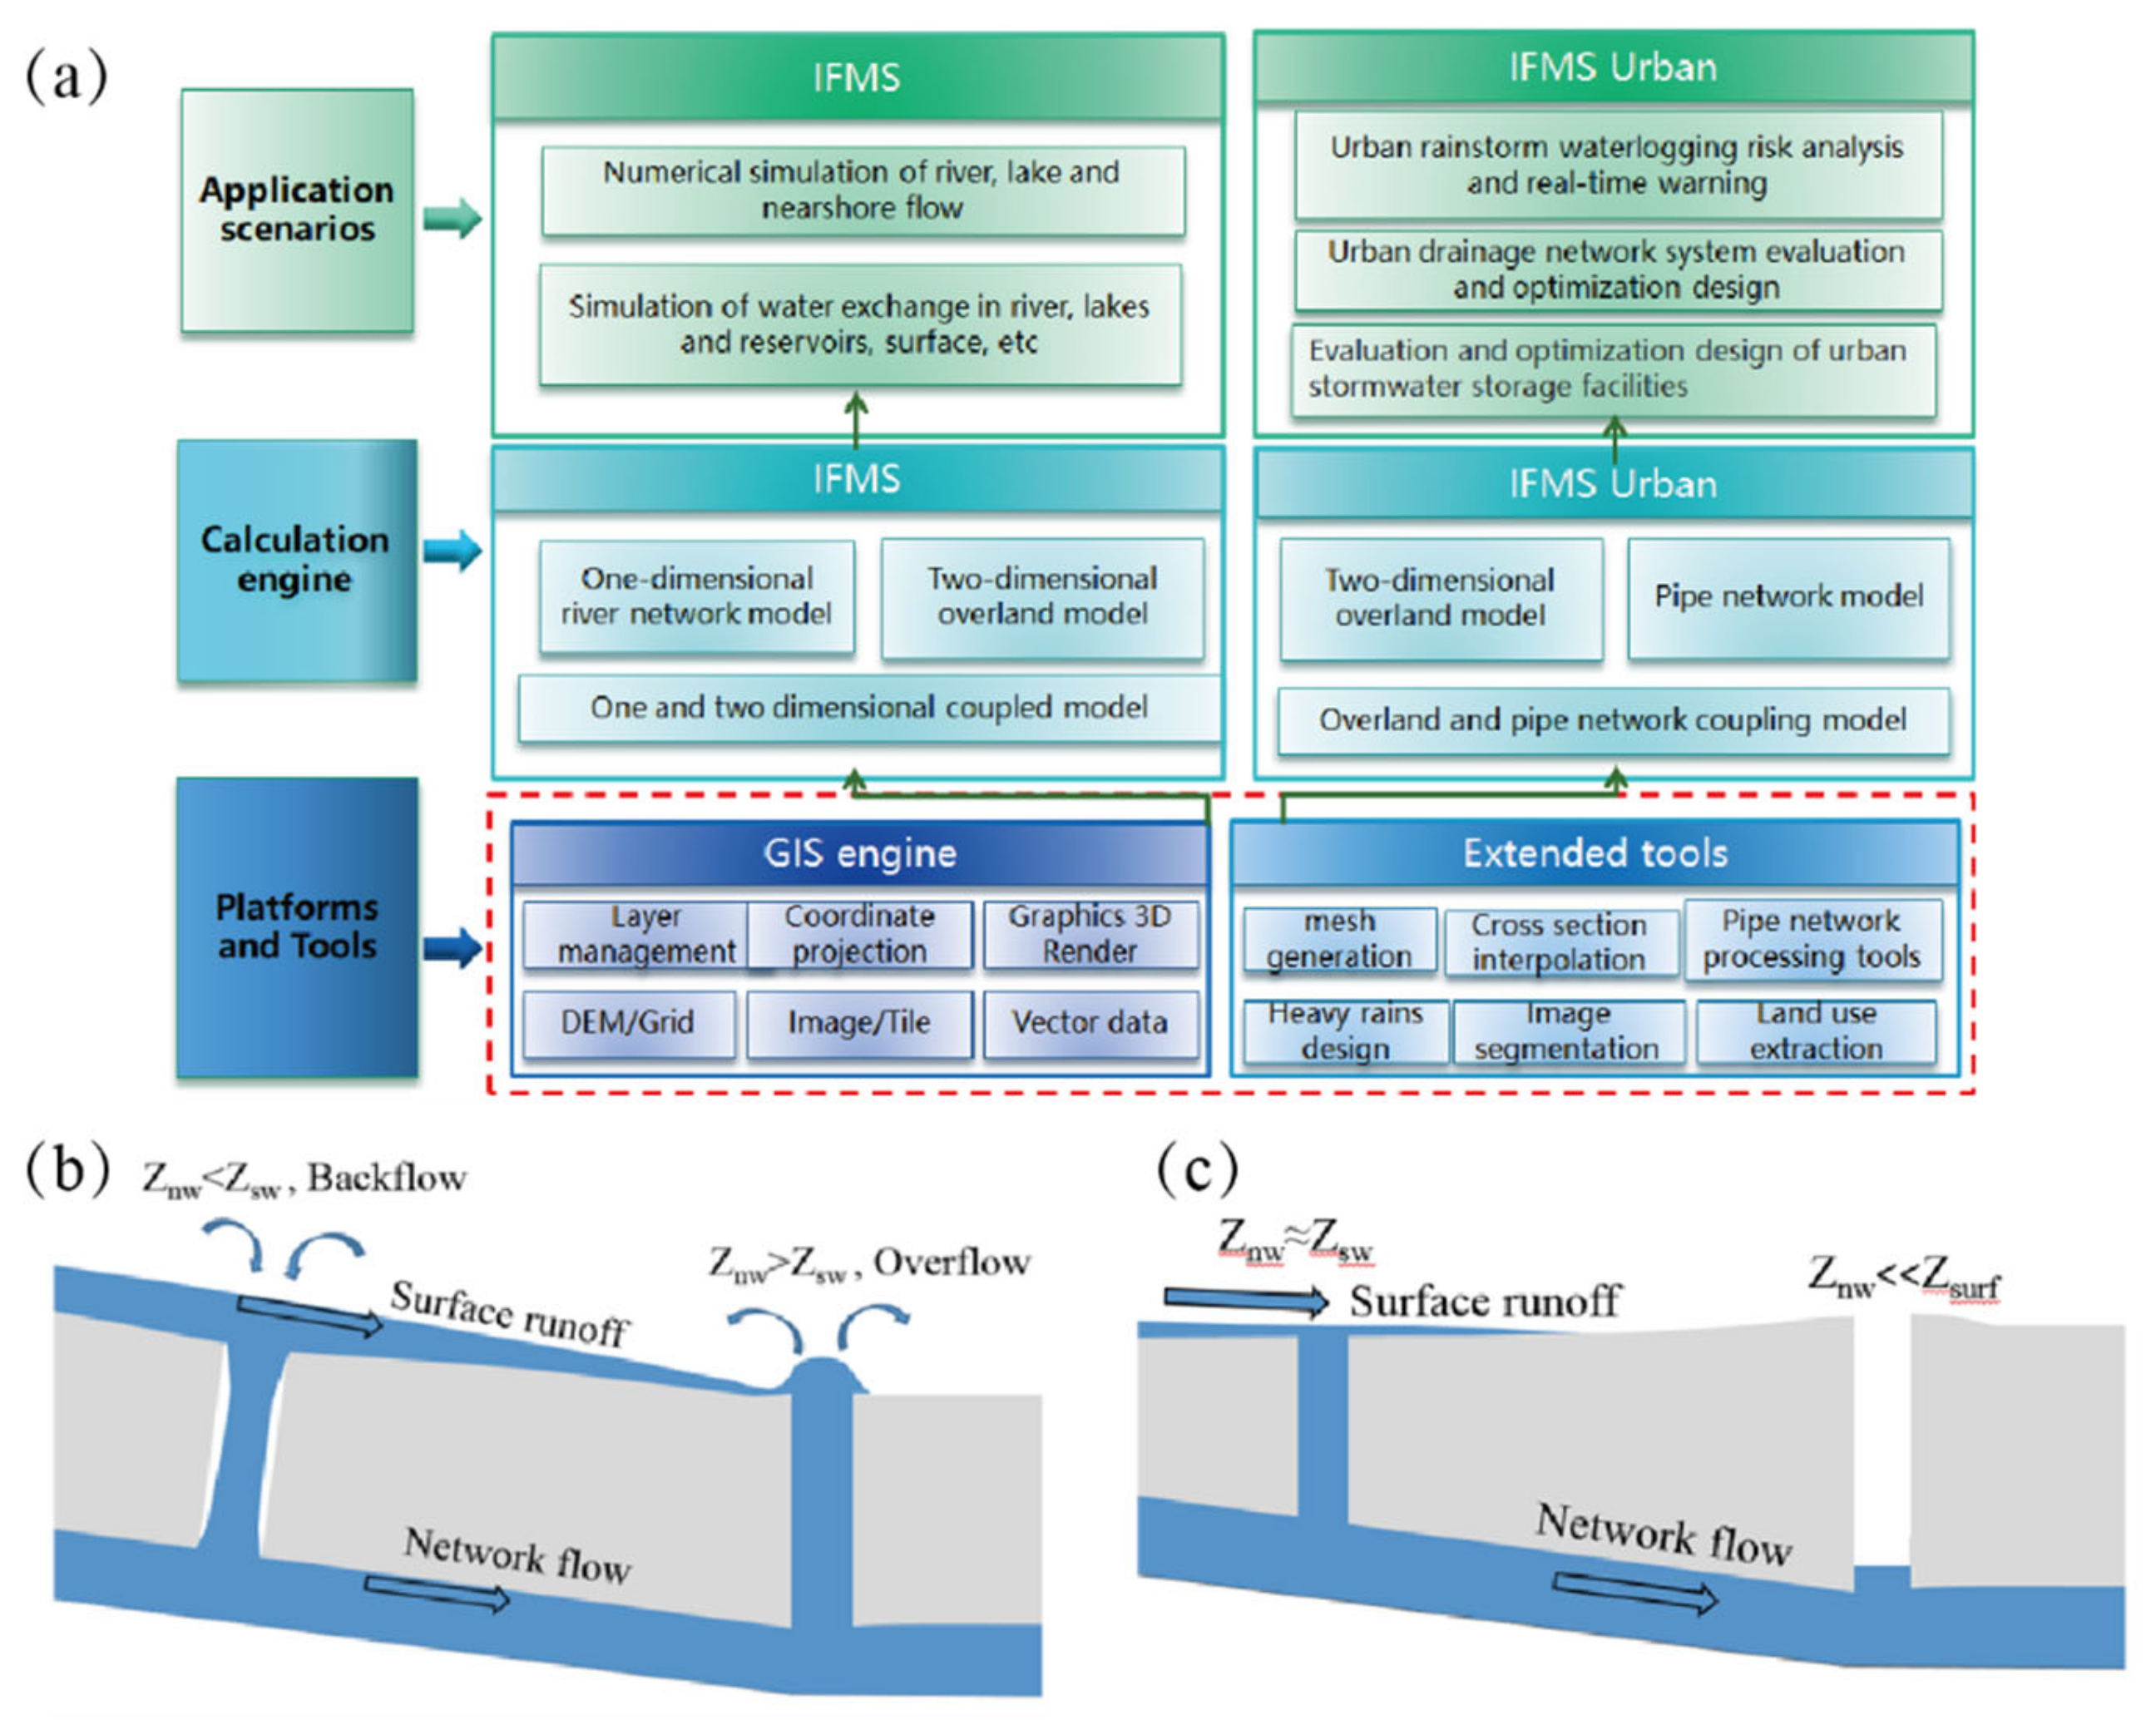
This paper has adopted an independently-developed coupled 1D and 2D hydrodynamic model [31,32,33,34,35,36,37]. This model is listed among the promotion projects of the National Flood Risk Map. It has been tested in a number of urban flooding simulation programs including Chengdu and Haikou, and has achieved good application results with high reliability. The specific application scenario, computing engine and related functions of the model are shown in Figure 7a. The model can accurately simulate a variety of flood types in urban, such as the urban rainstorm inundation, design and assessment of rainwater storage facilities, sponge cities and drainage network planning.
The model includes a 1D river and pipe network engine, a 2D shallow water engine with high-resolution, and a rapid unstructured grid generation module. Additionally, the model adopts the parallel GPU-accelerated technique, which is a stream processing scheme for highly efficient parallel computing. For example, the calculation of the future 3 h waterlogging conditions in 600 km2 area takes about 5~10 min. The flood in urban drainage networks and river was simulated using the 1D hydrodynamic model, with the governing equation being the 1D Saint-Venant equations. The basic principle of the 2D model is to use the finite volume method based on unstructured grid to discretely solve the 2D unsteady flow governing equation. The Godunov scheme based on the finite-volume method is used to discretize the equations. The 2D model uses the Roe’s approximate Riemann solver in the calculation of flow flux. The bed slope source term is discretized by feature classification to ensure the conservation of the model, and friction source term is discretized by implicit treatment to improve the stability of the model. The MUSCL format and the Runge-Kutta approach are also applied to achieve second-order accuracy in space and time. This method is suitable for models with complex terrain and large water discontinuities, which have been tested with a classical numerical case [31,38,39]. Besides, the models’ details are added in the Supplementary Materials.
To realize the flow exchange between the surface runoff and drainage network flows, the overflow and backflow at the sewer system nodes (catch-basins and manholes, etc.) are put forward [40]. The interaction between the surface runoff and drainage network flows is shown in Figure 7b,c; is the water level inside the drainage network nodes and is the water level of surface runoff.
When , there would be overflow at the drainage network node. The interaction flow was approximately equal to the overflowing quantity calculated based on the sewer system, ;
When , there would be backflow at the drainage network node. The interaction flow was calculated using the empirical weir formula.
In the formula, m1 and m2 are the flow coefficients, and ε is the contraction coefficient, which is determined by the shape of the rain gates, C is the width of the rain gates, , and is the top elevated level of the rain gates.
When or , there would be no flow interaction between the surface runoff and the flood at the drainage network nodes.
3. Results and Discussion
3.1. Model Calibration and Validation
According to the sensitivity analysis of model parameters [41], the sensitivity of imperviousness, infiltration rate and manning coefficient are relativity high. Therefore, these sensitive parameters are calibrated by comparing the simulated values with observed values of two rainfall events 20170727 and 20180821. The calibrated parameters of the model are shown in Table 5. It is found that the infiltration parameter in the collapsible loess area is relatively high, as compared with other cities in humid regions such as the Haidian island in Haikou city (the maximum infiltration rate is 78.1 mm/h) or the Lijia Mountain in Nanjing city (the maximum infiltration rate is 36 mm/h) [21,26].
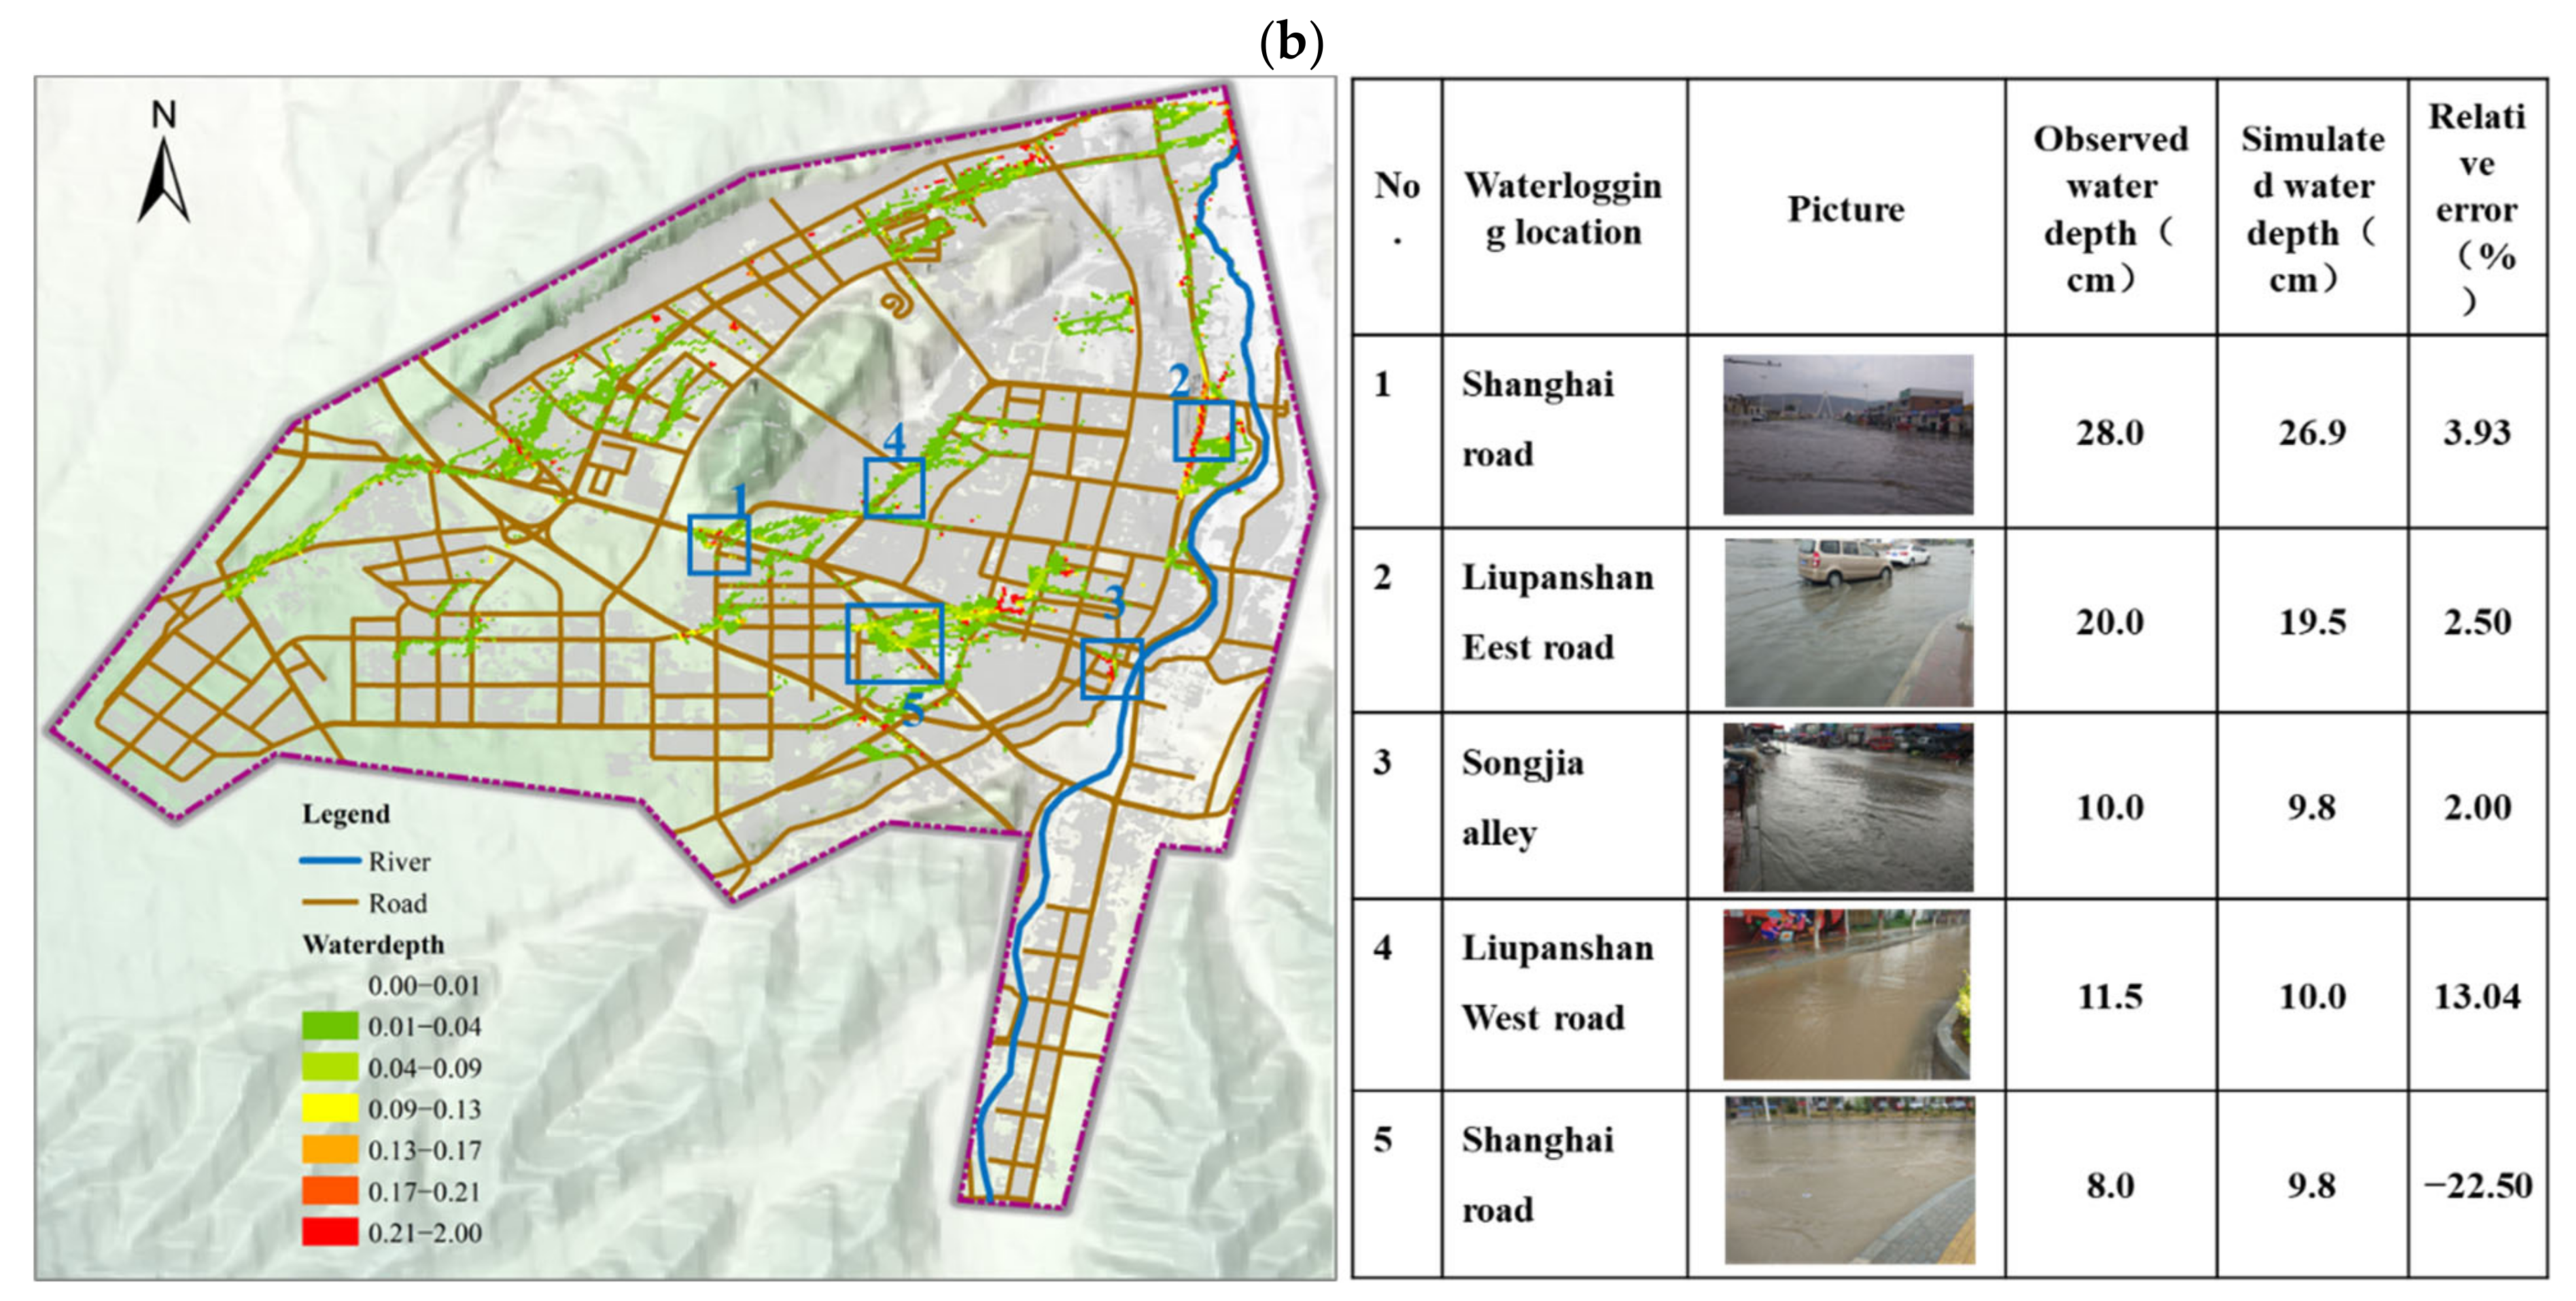
Figure 8 shows the comparison of simulated and observed water depths of partially submerged points. Except for the errors in water depth at the Shanghai Road, all simulated water depths are within the allowed error and match well with the records. This is because the data of this point were collected manually after the rainfall peak had already passed. This is why there is a slightly larger gap between the simulated water depth and measured water depth.
3.2. Waterlogging Reduction Effect of LID Facilities
This paper evaluated the effect of Guyuan’s sponge city construction on urban stormwater flooding process under different rainfall patterns of three aspects: surface runoff process, waterlogged area, and drainage network capacity. The waterlogged areas are divided into three types based on the submerged water depth: 3 cm < hs < 10 cm is deemed mildly waterlogged, 10 cm ≤ hs < 25 m is deemed moderately waterlogged, and hs ≥ 25 cm is deemed severely waterlogged.
3.2.1. Rainfall Return Period
This paper simulated and analyzed the flooding process before and after the implementation of LID facilities in Guyuan city under different rainfall return periods. The distributions of waterlogged points and drainage capacity under different rainfall return periods are shown in Figure 9 and Figure 10, respectively. According to the statistical analysis of surface runoff under different return periods (Table 6), it can be known that after the implementation of the LID facilities, the total runoff and peak flood flow under all the return periods have decreased. This is because the implementation of sponge city measures has led to greater stormwater infiltration and storage. For rainfalls that appear once every 2, 10, and 50 years, the reduction rates of total runoff were 10.2%, 9.6%, and 9.3%, respectively, and the reduction rates of peak flood flow were 10.3%, 10.2%, and 9.8%, respectively.
According to the waterlogging situation under different rainfall return periods (Table 7), it can be known that when the return period remained the same, the mildly-waterlogged area was the largest, and it was reduced the most after the implementation of sponge city measures. This shows that LID facilities have a better mitigation effect on mildly waterlogged areas. Before and after the implementation of LID facilities, with the increase in rainfall intensity, both the total waterlogged area and the waterlogged area with different submerged depths went up, while the reduction rate of waterlogged areas went down. This shows that as the rainfall return period goes up, the waterlogging reduction effect of sponge city measures would gradually weaken.
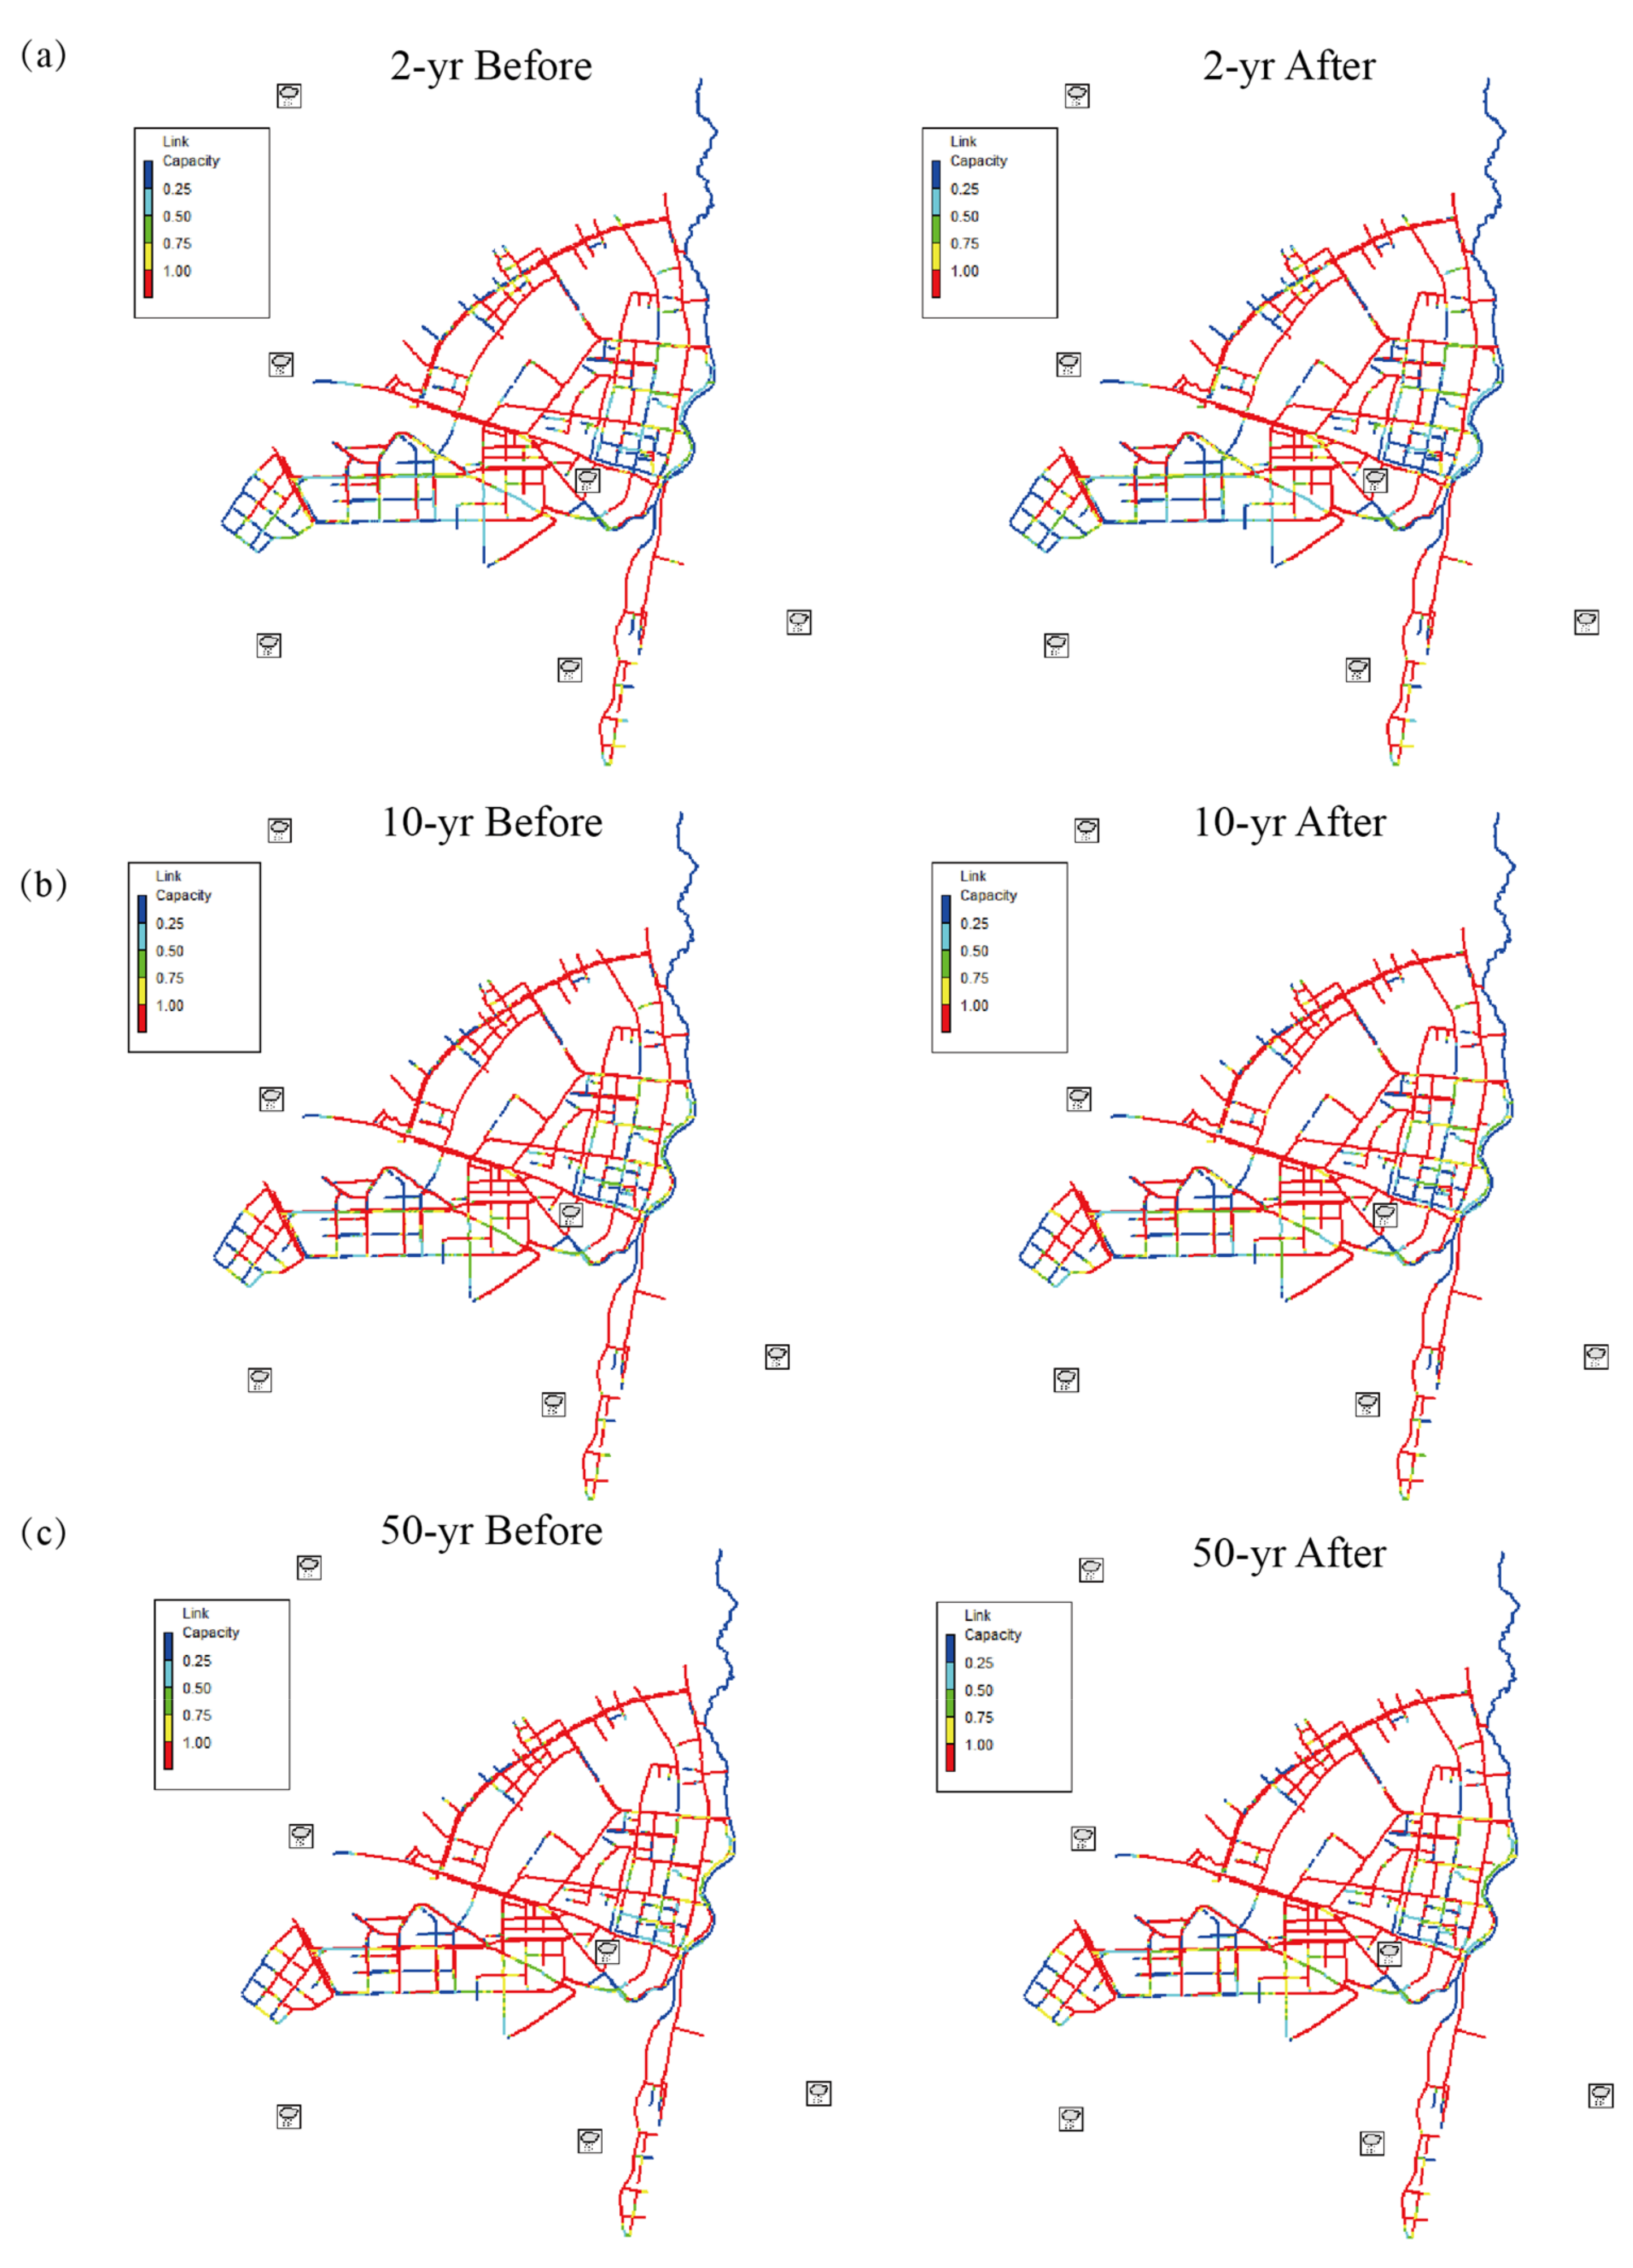
According to the drainage capacity under different return periods (Table 8), it can be known that before and after the implementation of the sponge city measures, as the rainfall intensity goes up, the runoff coefficient, the number of overflow nodes, the total overflow quantity and the number of full-load pipelines all increased; with various sponge city measures in place, the runoff coefficients in all of the three designed rainstorms were lower than 0.5, the ratio of overflow nodes all decreased by 2%, and the proportion of full-load pipelines decreased by about 3%. For a small or medium rainstorm that occurs once in every 2 years and 10 years, the total overflow quantity dropped by more than 16% as a result of the sponge city measures. However, for a big rainstorm that occurs once in every 50 years, the total overflow quantity dropped by 13%; this shows that sponge city measures have a more significant effect on the improvement of drainage capacity in the case of small/medium rainstorms. The result is caused by limited LID reconstruction in Guyuan city. Moreover, the local area of LID setting area is the old city, the drainage capacity of the related pipeline is lower than 2 years.
3.2.2. Rainfall Peak Coefficient
As can be analyzed from Section 3.2.1, the waterlogging reduction effect for a rainstorm that appears once every 2 years is the most evident. Therefore, this paper simulated the waterlogging process before and after the implementation of the LID facilities in Guyuan city for rainstorms that appears once every 2 years with different rainfall peak position coefficients.
When the duration and return period remain the same, the earlier the rainfall peak comes, the larger the total surface runoff, the lager the waterlogging reduction rate, and the smaller the peak flood flow. When the rainfall peak comes at about the halfway through, the reduction rate of the peak flood flow is relatively high: up to 10.2% (Table 9). For mildly and moderately waterlogged points, the later the rainfall peak comes, the larger the reduced waterlogged area and the higher the reduction rate; for severely waterlogged points, the reduction rate in the case where rainfall peak comes early or halfway through is greater than when rainfall peak comes later (Table 10).
The position of the rainfall peak has little impact on the number of overflow nodes or the proportion of a full-load pipeline, but it has a greater impact on the runoff coefficient, average full-load duration, and total overflow; the later the rainfall peak comes, the lower the runoff coefficient and the longer the average full-load duration would be. The overflow quantity is also relatively large (Table 11). The possible reason is that when the rainfall peak comes later, the pre-peak stormwater infiltration and retention would be greater, resulting in lower runoff coefficient.
3.2.3. Rainfall Duration
In the case of rainfall that occurs once every 2 years, the shorter the rainfall duration is, the smaller the surface runoff, waterlogged area, runoff coefficient, and overflow quantity would be. When the rainfall return period and the peak position remain unchanged, after the implementation of the sponge city measures, the rainfall duration has little impact on the reduction rate of total runoff or peak flood flow: about 10.2% (Table 12). After the implementation of sponge city measures, for severely waterlogged areas, the reduction rate in the case of rainstorm that last for 2 h is the largest; in terms of total waterlogged area and mildly waterlogged area, the reduction rate in the cases of rainstorm that last for 6 h is the largest (Table 13). Before and after the implementation of sponge city measures, when the rainfall return period and the rainfall peak position remain the same, the change in rainfall duration has little impact on the proportion of overflow nodes or fully loaded pipelines. After the implementation of sponge city measures, the proportion of overflow nodes in the three scenarios decreased by about 1%, and the proportion of fully loaded pipelines decreased by about 3%; as the rainstorm duration gets longer, the runoff coefficient, total overflow quantity, and average full-load duration would all go up. After sponge city measures are in place, the rainfall runoff coefficient in the case of rainstorm that lasts for 12 h is 9% higher than in rainstorm that lasts for 2 h, and the total overflow quantity also went up by 13%. The average full-load duration sees the largest increase: in the case of rainstorm that lasts for 12 h, the number is 5.5 times of that in the case of rainstorm that last for 2 h. (Table 14).
3.3. Impact Analysis of Waterlogging Reduction Indicators
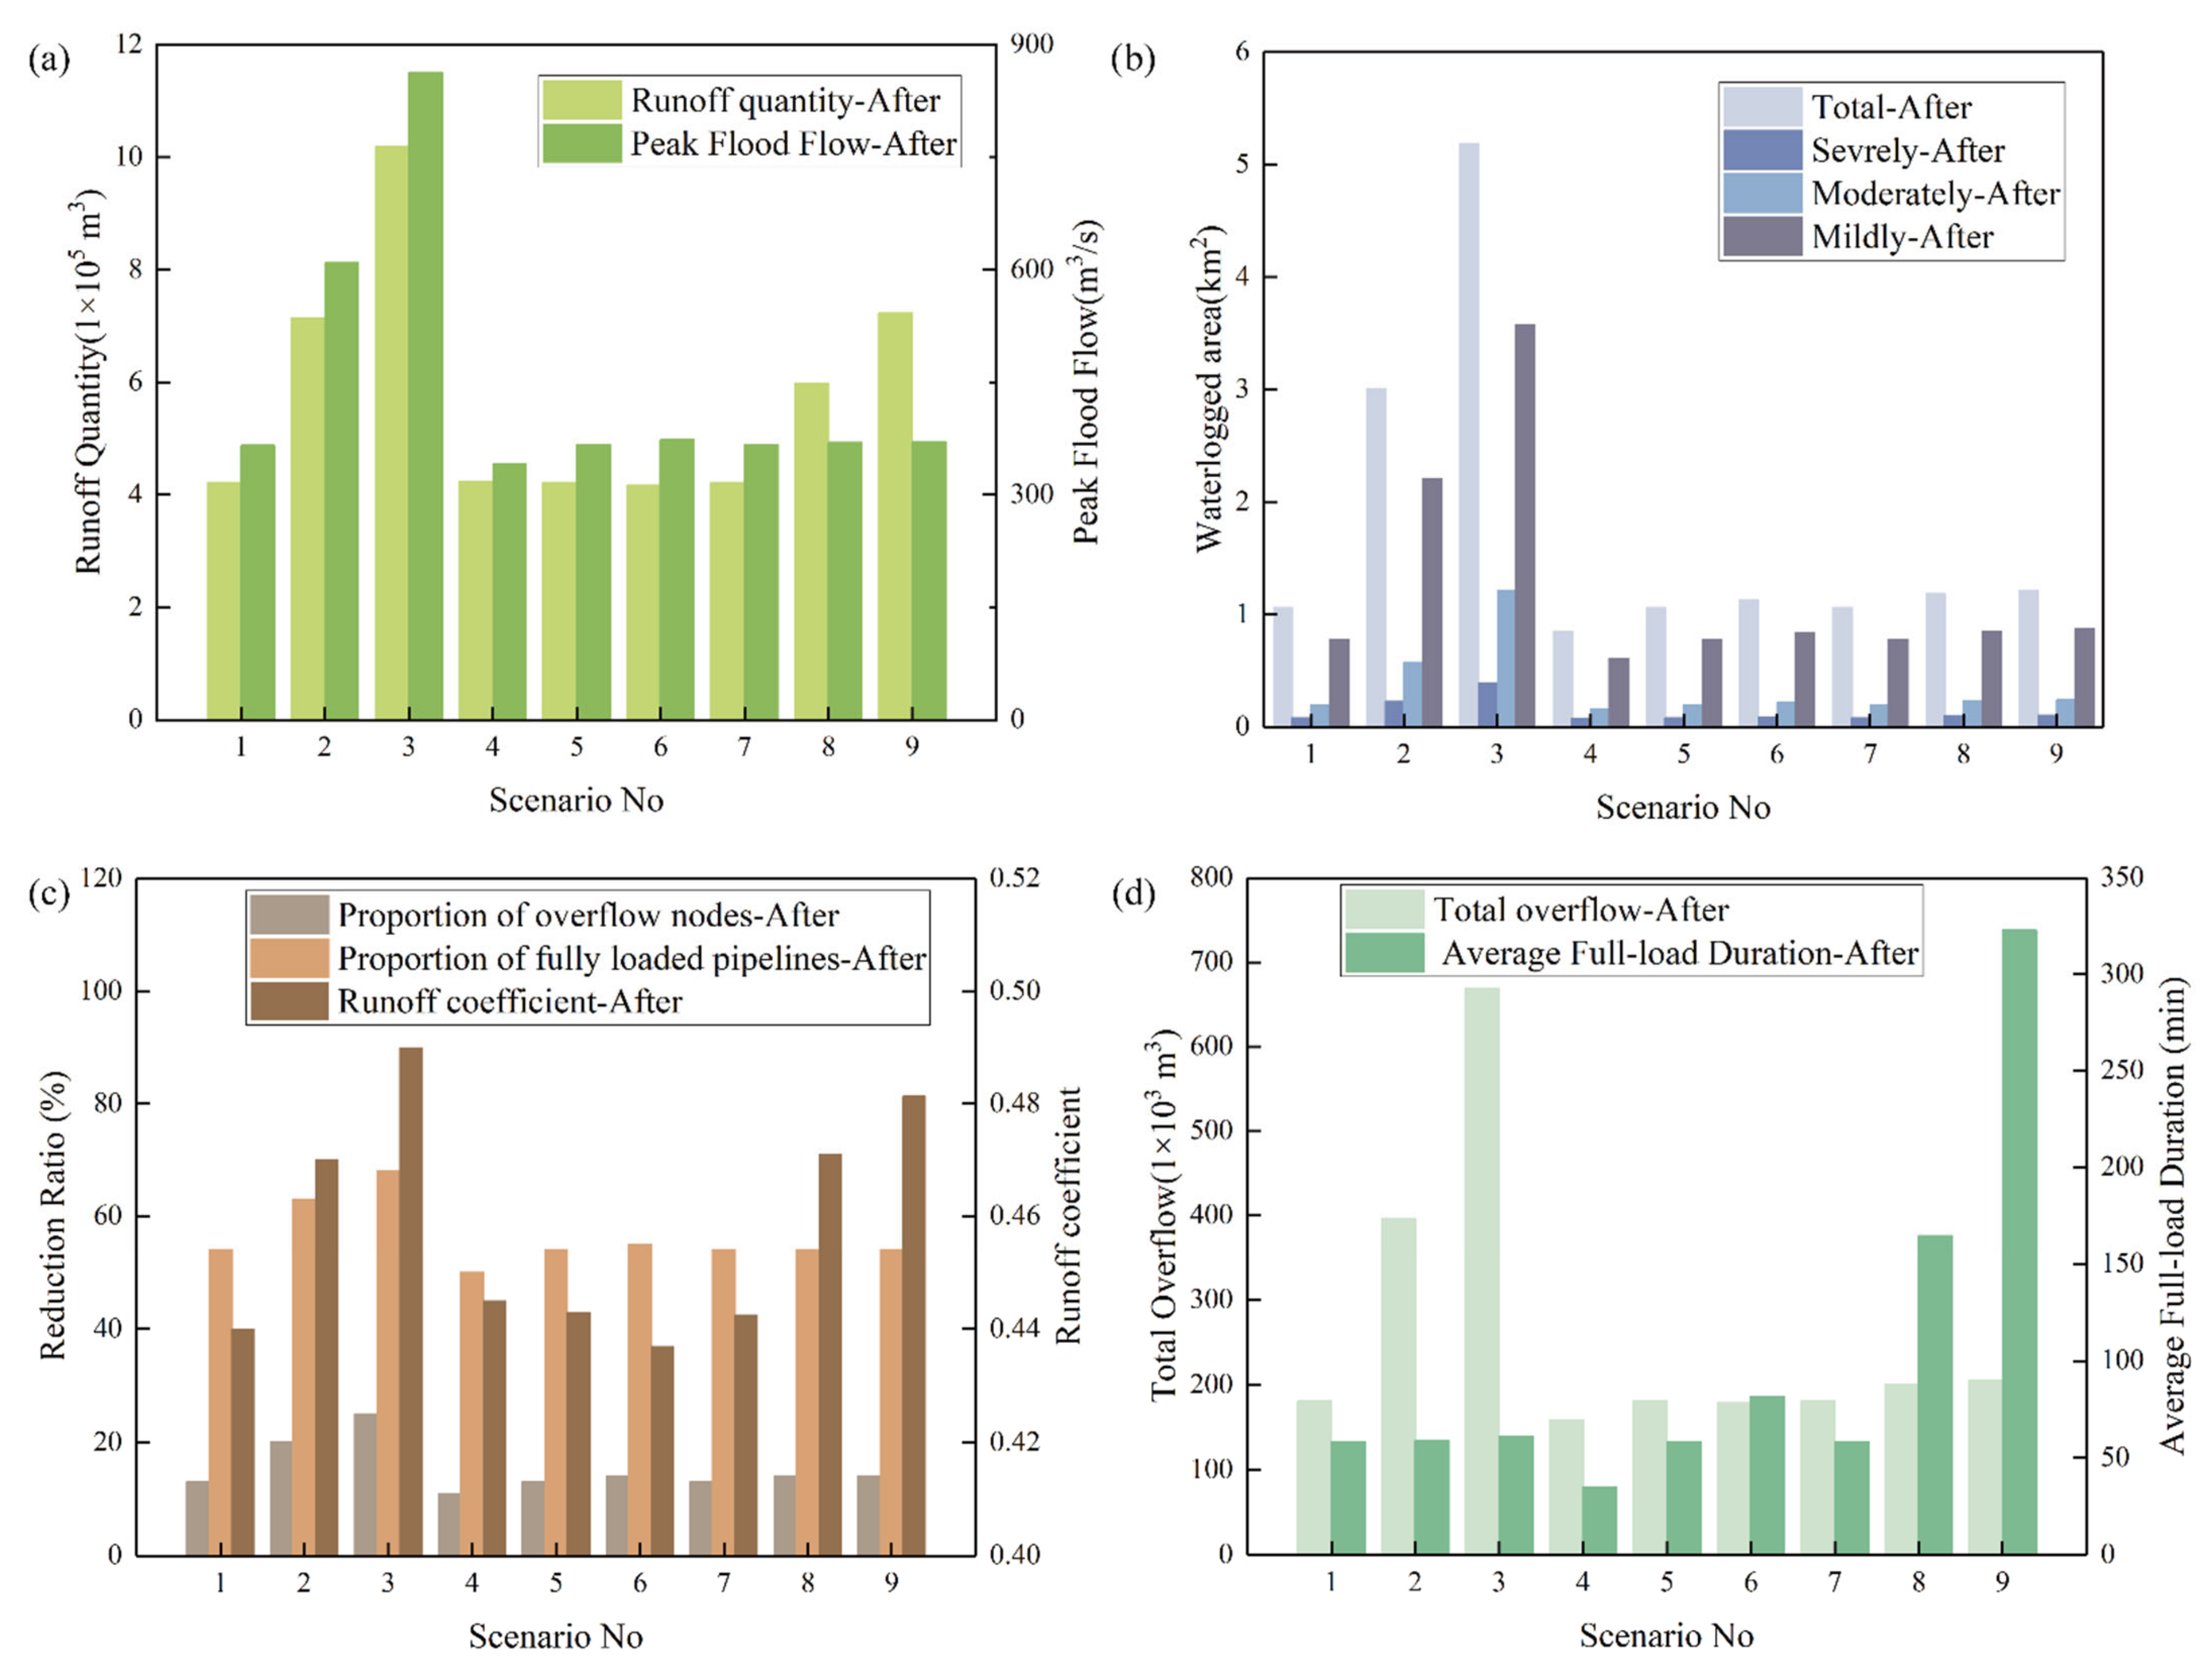
The nine scenarios are shown in Table 2. As can be observed from the change in the surface runoff, waterlogged area, and drainage network indicators in the nine scenarios (Figure 11), the rainfall return period has a great impact on surface runoff, waterlogged area, and drainage network indicators. With LID facilities in place, the total surface runoff increased from 4.22 × 10⁵ m3 in rainstorms that occur once every 2 years to 10.19 × 10⁵ m3 in rainstorms that occur once every 50 years; an increase of about 1.4 times. The most affected area is the mildly waterlogged area, which increased from 0.778 km2 in rainstorms that occur once every 2 years to 3.575 km2 in rainstorms that occur once every 50 years.
The rainfall peak position has little impact on the total runoff, peak flood flow, or total overflow quantity. However, it has a large impact on the proportion of the indicators of pipelines, such as the runoff coefficient, total overflows, and the average full-load duration. When the rainfall peak coefficient went up from 0.25 to 0.75, the total overflows and the average full-load duration increased by 12.6% and 133.7%, respectively.
The duration of the rainstorm has little impact on the peak flood flow, waterlogged area, proportion of overflow nodes, proportion of full-load pipelines, or the total overflow, but it has a larger impact on the total runoff quantity, runoff coefficient, and average full-load duration. As the rainfall duration went up from 2 h to 12 h, the total runoff quantity and runoff coefficient increased by 71.3% and 8.6%, respectively. The average full-load duration increased the most by 454.8%.
4. Conclusions
The main conclusions are as follows:
- (1)
- The coupled 1D and 2D hydrodynamic model is suitable for evaluating the effects of LID facilities on the degree of waterlogging and the drainage capacity of pipelines. The infiltration parameters of the hydrodynamic model in the collapsible loess area are relatively high, as compared with other cities in humid regions.
- (2)
- After due measures are taken in the collapsible loess area, the total runoff quantity, peak flood flow, waterlogged area, runoff coefficient, and drainage pipeline pressure have all decreased under different rainfall patterns. As the rainfall return period goes up, the waterlogging reduction effect and improvement of drainage capacity of the sponge city measures were gradually weakened. The reduction rates of waterlogged area in the case of rainstorms that occur once in every 2 years, 10 years and 50 years were 19.9%, 14.9% and 12.2%, respectively.
- (3)
- The implementation of LID measures has the more significant effect on the reduction in moderate waterlogged areas, as compared with the reduction in severely and mildly waterlogged area. For smaller storms, with LID measures in place, when the rainfall peak comes later, there would be larger amount of pre-peak stormwater infiltration and retention, resulting in slightly lower runoff coefficient.
- (4)
- The rainfall return period has a great impact on the indicators of surface runoff, waterlogged area, and drainage capacity; the position of rainfall peak has a relatively big impact on the proportion of overflow nodes, proportion of fully loaded pipelines, and average full-load duration; the rainfall duration has relatively big impact on the total runoff quantity, runoff coefficient, and average full-load duration.
The findings of this model-based research can serve as the foundation for future studies. A dynamic simulation system can be developed to provide early risk warnings for waterlogging in sponge cities. In addition, by targeting sponge city measures in collapsible loess areas, studies on the evaluation of the waterlogging reduction effect of single measure by model and calibrated parameters can be conducted, which will provide a reference for better design, planning, and optimization of sponge city construction in the future.
Supplementary Materials
The following supporting information can be downloaded at: https://www.mdpi.com/article/10.3390/w14233880/s1, Figure S1: Framework diagram of the model; Figure S2: Model interface; Figure S3: Dynamic simulation diagram of the model; Figure S4: Diagram of flow interaction; Figure S5: River network and two-dimensional surface coupling model of a district in Chengdu; Figure S6: River network and two-dimensional surface coupling model of a district in Zhengzhou; Figure S7: River network and two-dimensional surface coupling model of a district in Jinan; Figure S8: Overview of technical research approach; Figure S9: The sub-catchment area; Figure S10: Slope gradient; Figure S11: The coupled 1D and 2D hydrodynamic model of the study area.
Author Contributions
Conceptualization, J.M.; methodology, J.M. and H.Y.; validation, J.M. and X.C.; data curation, M.H.; writing—original draft preparation, J.M.; writing—review and editing, X.H. and B.W. All authors have read and agreed to the published version of the manuscript.
Funding
This research was funded by the National Key Research and Development Program of China (2021YFC3001404), the National Natural Science Foundation of China (52009147) and Research Program for Technologies of Sponge City Construction and Management in Guyuan City (SCHM-2018).
Institutional Review Board Statement
Not applicable.
Informed Consent Statement
Not applicable.
Data Availability Statement
The data presented in this study are available on request from the corresponding author.
Acknowledgments
The authors are thankful to the Ningxia Capital Sponge City Construction and Development Co. LTD for providing research data.
Conflicts of Interest
The authors declare no conflict of interest.
References
- Na, L.I.; Yuting, M.; Jing, W.; Qian, Y.U.; Nianqiang, Z. Effect of low impact development measures on inundation reduction—Taking Jinan pilot area as example. J. Hydraul. Eng. 2018, 49, 1489–1502. [Google Scholar]
- National Statistics Bureau. The Statistical Bulletin on National Economic and Social Development; China Statistics Press: China, Beijing, 2021. [Google Scholar]
- You, Q.; Kang, S.; Aguilar, E.; Pepin, N.; Flügel, W.; Yan, Y.; Xu, Y.; Zhang, Y.; Jie, H. Changes in daily climate extremes in China and their connection to the large scale atmospheric circulation during 1961–2003. Clim. Dyn. 2011, 36, 2399–2417. [Google Scholar] [CrossRef]
- Mahmoud, S.H.; Gan, T.Y. Urbanization and climate change implications in flood risk management: Developing an efficient decision support system for flood susceptibility mapping. Sci. Total Environ. 2018, 636, 152–167. [Google Scholar] [CrossRef]
- Ning, Y.-F.; Dong, W.-Y.; Lin, L.-S.; Zhang, Q. Analyzing the causes of urban waterlogging and sponge city technology in China. IOP Conf. Series Earth Environ. Sci. 2017, 59, 012047. [Google Scholar] [CrossRef]
- Zhang, J.; Wang, Y.; Hu, Q.; He, R. Discussion and views on some issues of the sponge city construction in China. Adv. Water Sci. 2016, 27, 793–799. [Google Scholar]
- Technical Guidelines for Sponge City Construction-Construction of Stormwater System with Low Impact Development (Trial); Ministry of Housing and Urban-Rural Development of the People’s Republic of China; China Architecture & Building Press: Beijing, China, 2014.
- State Council of the People’s Republic of China. Guidance on Promoting the Construction of Sponge Cities; State Council of the People’s Republic of China: Beijing, China, 2015.
- Li, H.; Ding, L.; Ren, M.; Li, C.; Wang, H. Sponge city construction in China: A survey of the challenges and opportunities. Water 2017, 9, 594. [Google Scholar] [CrossRef] [Green Version]
- Liu, H.; Jia, Y.; Niu, C. “Sponge city” concept helps solve China’s urban water problems. Environ. Earth Sci. 2017, 76, 473. [Google Scholar] [CrossRef]
- Wang, H.; Mei, C.; Liu, J.H.; Shao, W.W. A new strategy for integrated urban water management in China: Sponge city. Sci. China Technol. Sci. 2018, 61, 317–329. [Google Scholar] [CrossRef]
- Zhou, M.; Köster, S.; Zuo, J.; Wu, C.; Wang, X. Cross-Boundary Evolution of Urban Planning and Urban Drainage Towards the Water Sensitive “Sponge City”: Technical and Institutional Aspects from Chinese and German Perspective. In Urban Water Management for Future Cities; Springer: Cham, Switzerland, 2019. [Google Scholar]
- Chang, N.-B.; Lu, J.-W.; Chui, T.F.M.; Hartshorn, N. Global policy analysis of low impact development for stormwater management in urban regions. Land Use Policy 2018, 70, 368–383. [Google Scholar] [CrossRef]
- Fiori, A.; Volpi, E. On the effectiveness of LID infrastructures for the attenuation of urban flooding at the catchment scale. Water Resour. Res. 2020, 56, e2020WR027121. [Google Scholar] [CrossRef]
- Behrouz, M.S.; Zhu, Z.; Matott, L.S.; Rabideau, A.J. A new tool for automatic calibration of the Storm Water Management Model (SWMM). J. Hydrol. 2020, 581, 124436. [Google Scholar] [CrossRef]
- Kang, Z.; Guo, Q.; Lian, J.; Cheng, L. Advances in simulation models for whole-life-cycle effectiveness of sponge city construction. J. Hydroelectr. Eng. 2017, 36, 82–93. [Google Scholar]
- Wei, D.; Urich, C.; Liu, S.; Gu, S. Application of CityDrain3 in flood simulation of sponge polders: A case study of Kunshan, China. Water 2018, 10, 507. [Google Scholar] [CrossRef]
- Chen, Q. Systematically Design of Sponge City Road Based on the SWMM Model. In Proceedings of the Sixth International Forum on Decision Sciences; Springer: Cham, Switzerland, 2020; pp. 29–34. [Google Scholar]
- Peng, J.; Yu, L.; Zhong, X.; Dong, T. Study on Runoff Control Effect of Different Drainage Schemes in Sponge Airport. Water Resour. Manag. 2022, 36, 1043–1055. [Google Scholar] [CrossRef]
- Sin, J.; Jun, C.; Zhu, J.; Yoo, C. Evaluation of flood runoff reduction effect of LID (Low Impact Development) based on the decrease in CN: Case studies from Gimcheon Pyeonghwa district, Korea. Procedia Eng. 2014, 70, 1531–1538. [Google Scholar] [CrossRef] [Green Version]
- Yuan, Y.; Gan, Y.; Xu, Y.; Xie, Q.; Shen, Y.; Yin, Y.J.W. SWMM-Based Assessment of Urban Mountain Stormwater Management Effects under Different LID Scenarios. Water 2022, 14, 78. [Google Scholar] [CrossRef]
- Lee, S.; Kim, D.; Maeng, S.; Azam, M.; Lee, B. Runoff Reduction Effects at Installation of LID Facilities under Different Climate Change Scenarios. Water 2022, 14, 1301. [Google Scholar] [CrossRef]
- Huang, C.-L.; Hsu, N.-S.; Liu, H.-J.; Huang, Y.-H. Optimization of low impact development layout designs for megacity flood mitigation. J. Hydrol. 2018, 564, 542–558. [Google Scholar] [CrossRef]
- Cui, T.; Long, Y.; Wang, Y. Choosing the LID for urban storm management in the south of taiyuan basin by comparing the storm water reduction efficiency. Water 2019, 11, 2583. [Google Scholar] [CrossRef] [Green Version]
- Mei, C.; Liu, J.; Wang, H.; Li, Z.; Yang, Z.; Shao, W.; Ding, X.; Weng, B.; Yu, Y.; Yan, D. Urban flood inundation and damage assessment based on numerical simulations of design rainstorms with different characteristics. Sci. China Technol. Sci. 2020, 63, 2292–2304. [Google Scholar] [CrossRef]
- Chen, W.; Huang, G.; Zhang, H.; Wang, W. Urban inundation response to rainstorm patterns with a coupled hydrodynamic model: A case study in Haidian Island, China. J. Hydrol. 2018, 564, 1022–1035. [Google Scholar] [CrossRef]
- Liu, Z.; Li, W.; Wang, L.; Li, L.; Xu, B. The scenario simulations and several problems of the Sponge City construction in semi-arid loess region, Northwest China. Landsc. Ecol. Eng. 2022, 18, 95–108. [Google Scholar] [CrossRef]
- Jia, L.; Xu, G.; Huang, M.; Li, Z.; Li, P.; Zhang, Z.; Wang, B.; Zhang, Y.; Zhang, J.; Cheng, Y. Effects of Sponge City Development on Soil Moisture and Water Quality in a Typical City in the Loess Plateau in China. Front. Earth Sci. 2020, 8, 125. [Google Scholar] [CrossRef] [Green Version]
- Huang, M.; Yang, S.; Qi, W.; Hou, J.; Zhang, Y. Numerical simulation of urban waterlogging reduction effect in Guyuan sponge city. Water Resour. Prot. 2019, 35, 13–18. [Google Scholar]
- Shao, Y.; Shao, D. A New Generation of Urban Rainstorm Intensity Formula in China; China Architecture & Building Press: Beijing, China, 2014. [Google Scholar]
- Yu, H.; Ma, J.; Zhang, D.; Mu, J. Application of IFMS Urban software in the preparation of urban flood risk maps. China Flood Drought Manag. 2018, 28, 13–17. [Google Scholar] [CrossRef]
- Ma, J.; Yu, H.; Zhang, D.; Zhang, H.; Wu, B.; Mu, J. Adoption of evaluation software in flood risk map drawing. China Water Resour. 2017, 5, 17–20. [Google Scholar]
- Yu, H.; Fan, Y.; Ma, J.; Wu, B.; Mu, J.; Zhang, D.; Cao, D.; Zhang, H. A 2D Flood Simulation Method Based on High-Precision Terrain Generalization; CNIPA: Beijing, China, 2019. [Google Scholar]
- Ma, J.; Wang, C.; Zhang, D.; Yu, H.; Zhang, H.; Wu, B.; Mu, J.; Ma, T.; Zeng, X.; Nie, W.; et al. An Object-Oriented Approach to Element Management in Hydrodynamic Modeling; CNIPA: Beijing, China, 2017. [Google Scholar]
- Yu, H.; Fan, Y.; Ma, J.; Wu, B.; Mu, J.; Zhang, D.; Cao, D.; Zhang, H. A Simulation Method of Urban Surface Building Hydrodynamics Based on Area Correction Rate; CNIPA: Beijing, China, 2019. [Google Scholar]
- Zhang, H.; Ma, J.; Yu, H.; Zhang, D.; Mu, J.; Wu, B.; Wang, C.; Zeng, X.; Cao, D.; Nie, W.; et al. A Hydrodynamic Coupling Method for Surface Two-Dimensional Underground Pipe Network Based on Spatial Topology; CNIPA: Beijing, China, 2018. [Google Scholar]
- Ma, J.; Yu, H.; Zhang, H.; Wang, C.; Zhang, D.; Mu, J.; Wu, B.; Zeng, X.; Cao, D.; Nie, W.; et al. The Utility Model Relates to a Risk Warning Method for Urban Rainstorm Waterlogging and Waterlogging; CNIPA: Beijing, China, 2018. [Google Scholar]
- Yu, H.; Huang, G.; Wu, C. Efficient finite-volume model for shallow-water flows using an implicit dual time-stepping method. J. Hydraul. Eng. 2015, 141, 04015004. [Google Scholar] [CrossRef]
- Zhang, D.; Quan, J.; Wang, Z.; Zhang, H.; Ma, J. Numerical Simulation of Overland Flows Using Godunov Scheme Based on Finite Volume Method. EPiC Ser. Eng. 2018, 3, 2425–2432. [Google Scholar]
- Fan, Y.; Ao, T.; Yu, H.; Huang, G.; Li, X. A coupled 1D-2D hydrodynamic model for urban flood inundation. Adv. Meteorol. 2017, 2017, 1–12. [Google Scholar] [CrossRef] [Green Version]
- Krebs, G.; Kokkonen, T.; Valtanen, M.; Koivusalo, H.; Setälä, H. A high-resolution application of a stormwater management model (SWMM) using genetic parameter optimization. Urban Water J. 2013, 10, 394–410. [Google Scholar] [CrossRef]
Figure 1.
The pilot sponge cities in the loess region.

Figure 2.
The specific location and range of the study area.

Figure 3.
Basic data used in this study. (a) Land use types; (b) DEM data (m).

Figure 4.
The sub-catchment area. (a) All sub-catchment areas; (b) local sub-catchment area.

Figure 5.
The coupled 1D and 2D hydrodynamic model of the study area.

Figure 6.
The size of LIDs in the study area. (a) Sunken green space; (b) vegetative swale; (c) rainwater garden.
Figure 6.
The size of LIDs in the study area. (a) Sunken green space; (b) vegetative swale; (c) rainwater garden.

Figure 7.
Diagram of model. (a) Framework diagram of the model; (b) overflow and backflow; (c) no flow interaction.
Figure 7.
Diagram of model. (a) Framework diagram of the model; (b) overflow and backflow; (c) no flow interaction.

Figure 8.
Comparison of simulated and observed water depths; (a) 20170727 rainstorm; (b) 20180821 rainstorm.
Figure 8.
Comparison of simulated and observed water depths; (a) 20170727 rainstorm; (b) 20180821 rainstorm.


Figure 9.
The distribution of waterlogged points under different rainfall return periods. (a) 2 years; (b) 10 years; (c) 50 years.
Figure 9.
The distribution of waterlogged points under different rainfall return periods. (a) 2 years; (b) 10 years; (c) 50 years.

Figure 10.
The distribution of drainage capacity under different rainfall return periods. (a) 2 years; (b) 10 years; (c) 50 years.
Figure 10.
The distribution of drainage capacity under different rainfall return periods. (a) 2 years; (b) 10 years; (c) 50 years.

Figure 11.
Change in the surface runoff, waterlogged area, and drainage network indicators under different rainfall patterns. (a) flow indicators (runoff quantity, peak flood flow); (b) waterlogged area indicators; (c) drainage network indicators (proportion of overflow nodes, proportion of fully loaded pipelines, runoff coefficient); (d) drainage network indicators (total overflow quantity, average full-load duration).


Table 1.
The statistical values of the two observed rainstorms.
| Rain Gauge | Maximum Rainfall Intensity (mm/h) | 6 h Cumulative Rainfall (mm) | 24 h Cumulative Rainfall (mm) | |||
|---|---|---|---|---|---|---|
| Rainfall events | 20170727 | 20180821 | 20170727 | 20180821 | 20170727 | 20180821 |
| 1 | 7.1 | 17.3 | 19.3 | 35.5 | 25.5 | 57.9 |
| 2 | 10.2 | 21.6 | 32.9 | 38 | 33.9 | 76 |
| 3 | 12.6 | 17.5 | 41.1 | 31.8 | 49.6 | 59.7 |
| 4 | 4.4 | 14.9 | 14.8 | 19.6 | 23.7 | 48.8 |
| 5 | 10.7 | 10.5 | 38.2 | 39.4 | 44.6 | 68 |
| 6 | 6.3 | 12.5 | 22.7 | 36.5 | 30.3 | 67.9 |
Table 2.
Scenarios with different rainfall patterns.
| Scenario No. | 1 | 2 | 3 | 4 | 5 | 6 | 7 | 8 | 9 |
|---|---|---|---|---|---|---|---|---|---|
| Return period | 2 | 10 | 50 | 2 | 2 | 2 | 2 | 2 | 2 |
| Peak Position Coefficient | 0.5 | 0.5 | 0.5 | 0.25 | 0.5 | 0.75 | 0.5 | 0.5 | 0.5 |
| Duration | 2 h | 2 h | 2 h | 2 h | 2 h | 2 h | 2 h | 6 h | 12 h |
Table 3.
Implementation area of sponge city measures in Guyuan.
| Sponge City Measures | Rainwater Garden (km2) | Vegetative Swale (km) | Rain Barrel (m3) | Sunken Green Space (km2) |
|---|---|---|---|---|
| Scale | 0.2 | 5.51 | 17,585.00 | 2.60 |
Table 4.
The parameters of the LID facilities in a residential community.
| Layer | Parameter | Sunken Green Space | Vegetative Swale | Rain Barrel | Rainwater Garden |
|---|---|---|---|---|---|
| Surface | Berm height (mm) | 200 | 200 | 300 | |
| Vegetation volume fraction | 0.2 | 0.2 | 0.2 | ||
| Surface roughness | 0.15 | 0.15 | 0.15 | ||
| Surface slope (%) | 1 | 1 | 1 | ||
| Swale side slope | 5 | ||||
| Soil | Thickness (mm) | 500 | 500 | ||
| Porosity | 0.45 | 0.45 | |||
| Field capacity | 0.2 | 0.2 | |||
| Wilting point | 0.2 | 0.2 | |||
| Conductivity (mm/h) | 100 | 100 | |||
| Conductivity slope | 10 | 10 | |||
| Suction head (mm) | 90 | 90 | |||
| Storage | Thickness (mm) | 300 | 900 | ||
| Void ratio (voids/solids) | 0.75 | ||||
| Seepage rate (mm/h) | 250 | ||||
| Clogging factor | 0 |
Table 5.
The calibrated parameters.
| Parameter | Type | Value |
|---|---|---|
| Infiltration parameter | Maximum rate | 120 mm/h |
| Minimum rate | 5 mm/h | |
| Decay constant | 3/h | |
| Drying time | 7 days | |
| Manning coefficient | River | 0.03 s/m1/3 |
| Pipe | 0.013 s/m1/3 | |
| Grassland | 0.2 s/m1/3 | |
| Residential area | 0.015 s/m1/3 | |
| Street | 0.015 s/m1/3 | |
| Depression storage depth | Impervious | 2.0 mm |
| Previous | 4.5 mm |
Table 6.
Surface runoff analysis under different return periods.
| Rainfall Return Period | Amount of Rainfall /mm | Runoff Quantity (1 × 10⁵ m3) | Peak Flood Flow (m3/s) | ||||
|---|---|---|---|---|---|---|---|
| Before Measure | After Measure | Reduction Rate | Before Measure | After Measure | Reduction Rate | ||
| 2-yr | 20.266 | 4.70 | 4.22 | 10.2% | 408.20 | 366.10 | 10.3% |
| 10-yr | 32.263 | 7.90 | 7.14 | 9.6% | 678.20 | 609.10 | 10.2% |
| 50-yr | 44.261 | 11.24 | 10.19 | 9.3% | 956.90 | 863.10 | 9.8% |
Table 7.
Statistics analysis on waterlogging reduction effect under different return periods (km2).
| Rainfall Return Period | Severely Waterlogged Area | Moderately Waterlogged Area | Mildly Waterlogged Area | Total Waterlogged Area | ||||||||
|---|---|---|---|---|---|---|---|---|---|---|---|---|
| Before Measure | After Measure | Reduction Rate | Before Measure | After Measure | Reduction Rate | Before Measure | After Measure | Reduction Rate | Before Measure | After Measure | Reduction Rate | |
| 2-yr | 0.101 | 0.082 | 18.5% | 0.271 | 0.201 | 25.9% | 0.952 | 0.778 | 18.3% | 1.325 | 1.06 | 19.9% |
| 10-yr | 0.261 | 0.226 | 13.6% | 0.719 | 0.577 | 19.8% | 2.557 | 2.208 | 13.7% | 3.537 | 3.01 | 14.9% |
| 50-yr | 0.484 | 0.394 | 18.7% | 1.415 | 1.211 | 14.4% | 3.999 | 3.575 | 10.6% | 5.898 | 5.18 | 12.2% |
Table 8.
Statistics analysis on the drainage capacity under different return periods.
| Rainfall Return Periods | Runoff Coefficient | Proportion of Overflow Nodes | Total Overflow Quantity (1 × 10³m3) | Proportion of Fully Loaded Pipelines | ||||
|---|---|---|---|---|---|---|---|---|
| Before Measure | After Measure | Before Measure | After Measure | Before Measure | After Measure | Before Measure | After Measure | |
| 2-yr | 0.49 | 0.44 | 15% | 13% | 218.69 | 181.02 | 57% | 54% |
| 10-yr | 0.52 | 0.47 | 22% | 20% | 472.26 | 395.70 | 65% | 63% |
| 50-yr | 0.54 | 0.49 | 27% | 25% | 766.02 | 669.24 | 71% | 68% |
Table 9.
Analysis on surface runoff under different rainfall peak coefficient.
| Rainfall Return Period | Rainfall Peak Coefficient | Runoff Quantity (1 × 10⁵ m3) | Peak Flood Flow (m3/s) | ||||
|---|---|---|---|---|---|---|---|
| Before Measure | After Measure | Reduction Rate | Before Measure | After Measure | Reduction Rate | ||
| 2-yr | 0.25 | 4.73 | 4.24 | 10.4% | 375.10 | 341.00 | 9.1% |
| 2-yr | 0.50 | 4.70 | 4.22 | 10.2% | 408.20 | 366.40 | 10.2% |
| 2-yr | 0.75 | 4.64 | 4.17 | 10.1% | 410.10 | 373.40 | 8.9% |
Table 10.
Statistical analysis on the waterlogged area reduction effect under different rainfall peak coefficient (km2).
Table 10.
Statistical analysis on the waterlogged area reduction effect under different rainfall peak coefficient (km2).
| Rainfall Peak Coefficient | Severely Waterlogged Area | Moderately Waterlogged Area | Mildly Waterlogged Area | Total Waterlogged Area | ||||||||
|---|---|---|---|---|---|---|---|---|---|---|---|---|
| Before Measure | After Measure | Reduction Rate | Before Measure | After Measure | Reduction Rate | Before Measure | After Measure | Reduction Rate | Before Measure | After Measure | Reduction Rate | |
| 0.25 | 0.093 | 0.076 | 18.5% | 0.204 | 0.162 | 20.9% | 0.725 | 0.610 | 15.9% | 1.023 | 0.848 | 17.1% |
| 0.50 | 0.101 | 0.082 | 18.5% | 0.271 | 0.201 | 25.9% | 0.952 | 0.778 | 18.3% | 1.325 | 1.062 | 19.9% |
| 0.75 | 0.098 | 0.083 | 15.3% | 0.292 | 0.215 | 26.2% | 1.033 | 0.836 | 19.1% | 1.423 | 1.134 | 20.3% |
Table 11.
Statistical analysis on the drainage capacity under different rainfall peak coefficient.
| Rainfall Peak Coefficient | Runoff Coefficient | Proportion of Overflow Nodes | Total Runoff Quantity (1 × 10³ m3) | Proportion of Fully Loaded Pipelines | Average Full-Load Duration (min) | |||||
|---|---|---|---|---|---|---|---|---|---|---|
| Before Measure | After Measure | Before Measure | After Measure | Before Measure | After Measure | Before Measure | After Measure | Before Measure | After Measure | |
| 0.25 | 0.495 | 0.445 | 13% | 11% | 193.25 | 159.11 | 53% | 50% | 35.34 | 34.91 |
| 0.50 | 0.493 | 0.443 | 15% | 13% | 218.69 | 181.02 | 57% | 54% | 58.72 | 58.20 |
| 0.75 | 0.486 | 0.437 | 15% | 14% | 213.90 | 179.19 | 57% | 55% | 81.73 | 81.60 |
Table 12.
Analysis on surface runoff under different rainfall duration.
| Rainfall Return Period | Rainfall Duration/h | Total Runoff Quantity (1 × 10⁵ m3) | Peak Flood Flow (m3/s) | ||||
|---|---|---|---|---|---|---|---|
| Before Measure | After Measure | Reduction Rate | Before Measure | After Measure | Reduction Rate | ||
| 2-yr | 2 | 4.70 | 4.22 | 10.2% | 408.20 | 366.40 | 10.2% |
| 2-yr | 6 | 6.66 | 5.98 | 10.2% | 411.6 | 369.57 | 10.2% |
| 2-yr | 12 | 8.04 | 7.23 | 10.1% | 412.56 | 370.78 | 10.1% |
Table 13.
Statistical analysis on waterlogged area reduction effect under different rainstorm duration (km2).
Table 13.
Statistical analysis on waterlogged area reduction effect under different rainstorm duration (km2).
| Rainfall Return Period | Rainstorm Duration/h | Severely Waterlogged Area | Moderately Waterlogged Area | Mildly Waterlogged Area | Total Waterlogged Area | ||||||||
|---|---|---|---|---|---|---|---|---|---|---|---|---|---|
| Before Measure | After Measure | Reduction Rate | Before Measure | After Measure | Reduction Rate | Before Measure | After Measure | Reduction Rate | Before Measure | After Measure | Reduction Rate | ||
| 2-yr | 2 | 0.101 | 0.082 | 18.5% | 0.271 | 0.201 | 25.9% | 0.952 | 0.778 | 18.3% | 1.325 | 1.062 | 19.9% |
| 2-yr | 6 | 0.123 | 0.100 | 18.3% | 0.311 | 0.234 | 24.7% | 1.054 | 0.848 | 19.6% | 1.488 | 1.182 | 20.6% |
| 2-yr | 12 | 0.125 | 0.103 | 17.4% | 0.318 | 0.239 | 25.0% | 1.060 | 0.870 | 17.9% | 1.503 | 1.212 | 19.4% |
Table 14.
Statistical analysis on drainage capacity under different rainfall duration.
| Rainfall Duration/h | Runoff Coefficient | Proportion of Overflow Nodes | Total Overflow Quantity (1 × 10³ m3) | Proportion of Fully Loaded Pipelines | Average Full-Load Duration (min) | |||||
|---|---|---|---|---|---|---|---|---|---|---|
| Before Measure | After Measure | Before Measure | After Measure | Before Measure | After Measure | Before Measure | After Measure | Before Measure | After Measure | |
| 2 | 0.493 | 0.443 | 15% | 13% | 218.69 | 181.02 | 57% | 54% | 58.72 | 58.20 |
| 6 | 0.524 | 0.471 | 15% | 14% | 241.15 | 201.35 | 57% | 54% | 165.92 | 164.40 |
| 12 | 0.535 | 0.481 | 15% | 14% | 245.28 | 205.33 | 57% | 54% | 324.890 | 322.87 |
Publisher’s Note: MDPI stays neutral with regard to jurisdictional claims in published maps and institutional affiliations. |
© 2022 by the authors. Licensee MDPI, Basel, Switzerland. This article is an open access article distributed under the terms and conditions of the Creative Commons Attribution (CC BY) license (https://creativecommons.org/licenses/by/4.0/).
Share and Cite
MDPI and ACS Style
Mu, J.; Huang, M.; Hao, X.; Chen, X.; Yu, H.; Wu, B. Study on Waterlogging Reduction Effect of LID Facilities in Collapsible Loess Area Based on Coupled 1D and 2D Hydrodynamic Model. Water 2022, 14, 3880. https://doi.org/10.3390/w14233880
AMA Style
Mu J, Huang M, Hao X, Chen X, Yu H, Wu B. Study on Waterlogging Reduction Effect of LID Facilities in Collapsible Loess Area Based on Coupled 1D and 2D Hydrodynamic Model. Water. 2022; 14(23):3880. https://doi.org/10.3390/w14233880
Chicago/Turabian StyleMu, Jie, Miansong Huang, Xiaoli Hao, Xiaolan Chen, Haijun Yu, and Binbin Wu. 2022. "Study on Waterlogging Reduction Effect of LID Facilities in Collapsible Loess Area Based on Coupled 1D and 2D Hydrodynamic Model" Water 14, no. 23: 3880. https://doi.org/10.3390/w14233880
Note that from the first issue of 2016, this journal uses article numbers instead of page numbers. See further details here.