
Quality Assessment of Groundwater Based on Geochemical Modelling and Water Quality Index (WQI)

 , ,
, ,  ,
,  ,
, 
Abstract
:1. Introduction
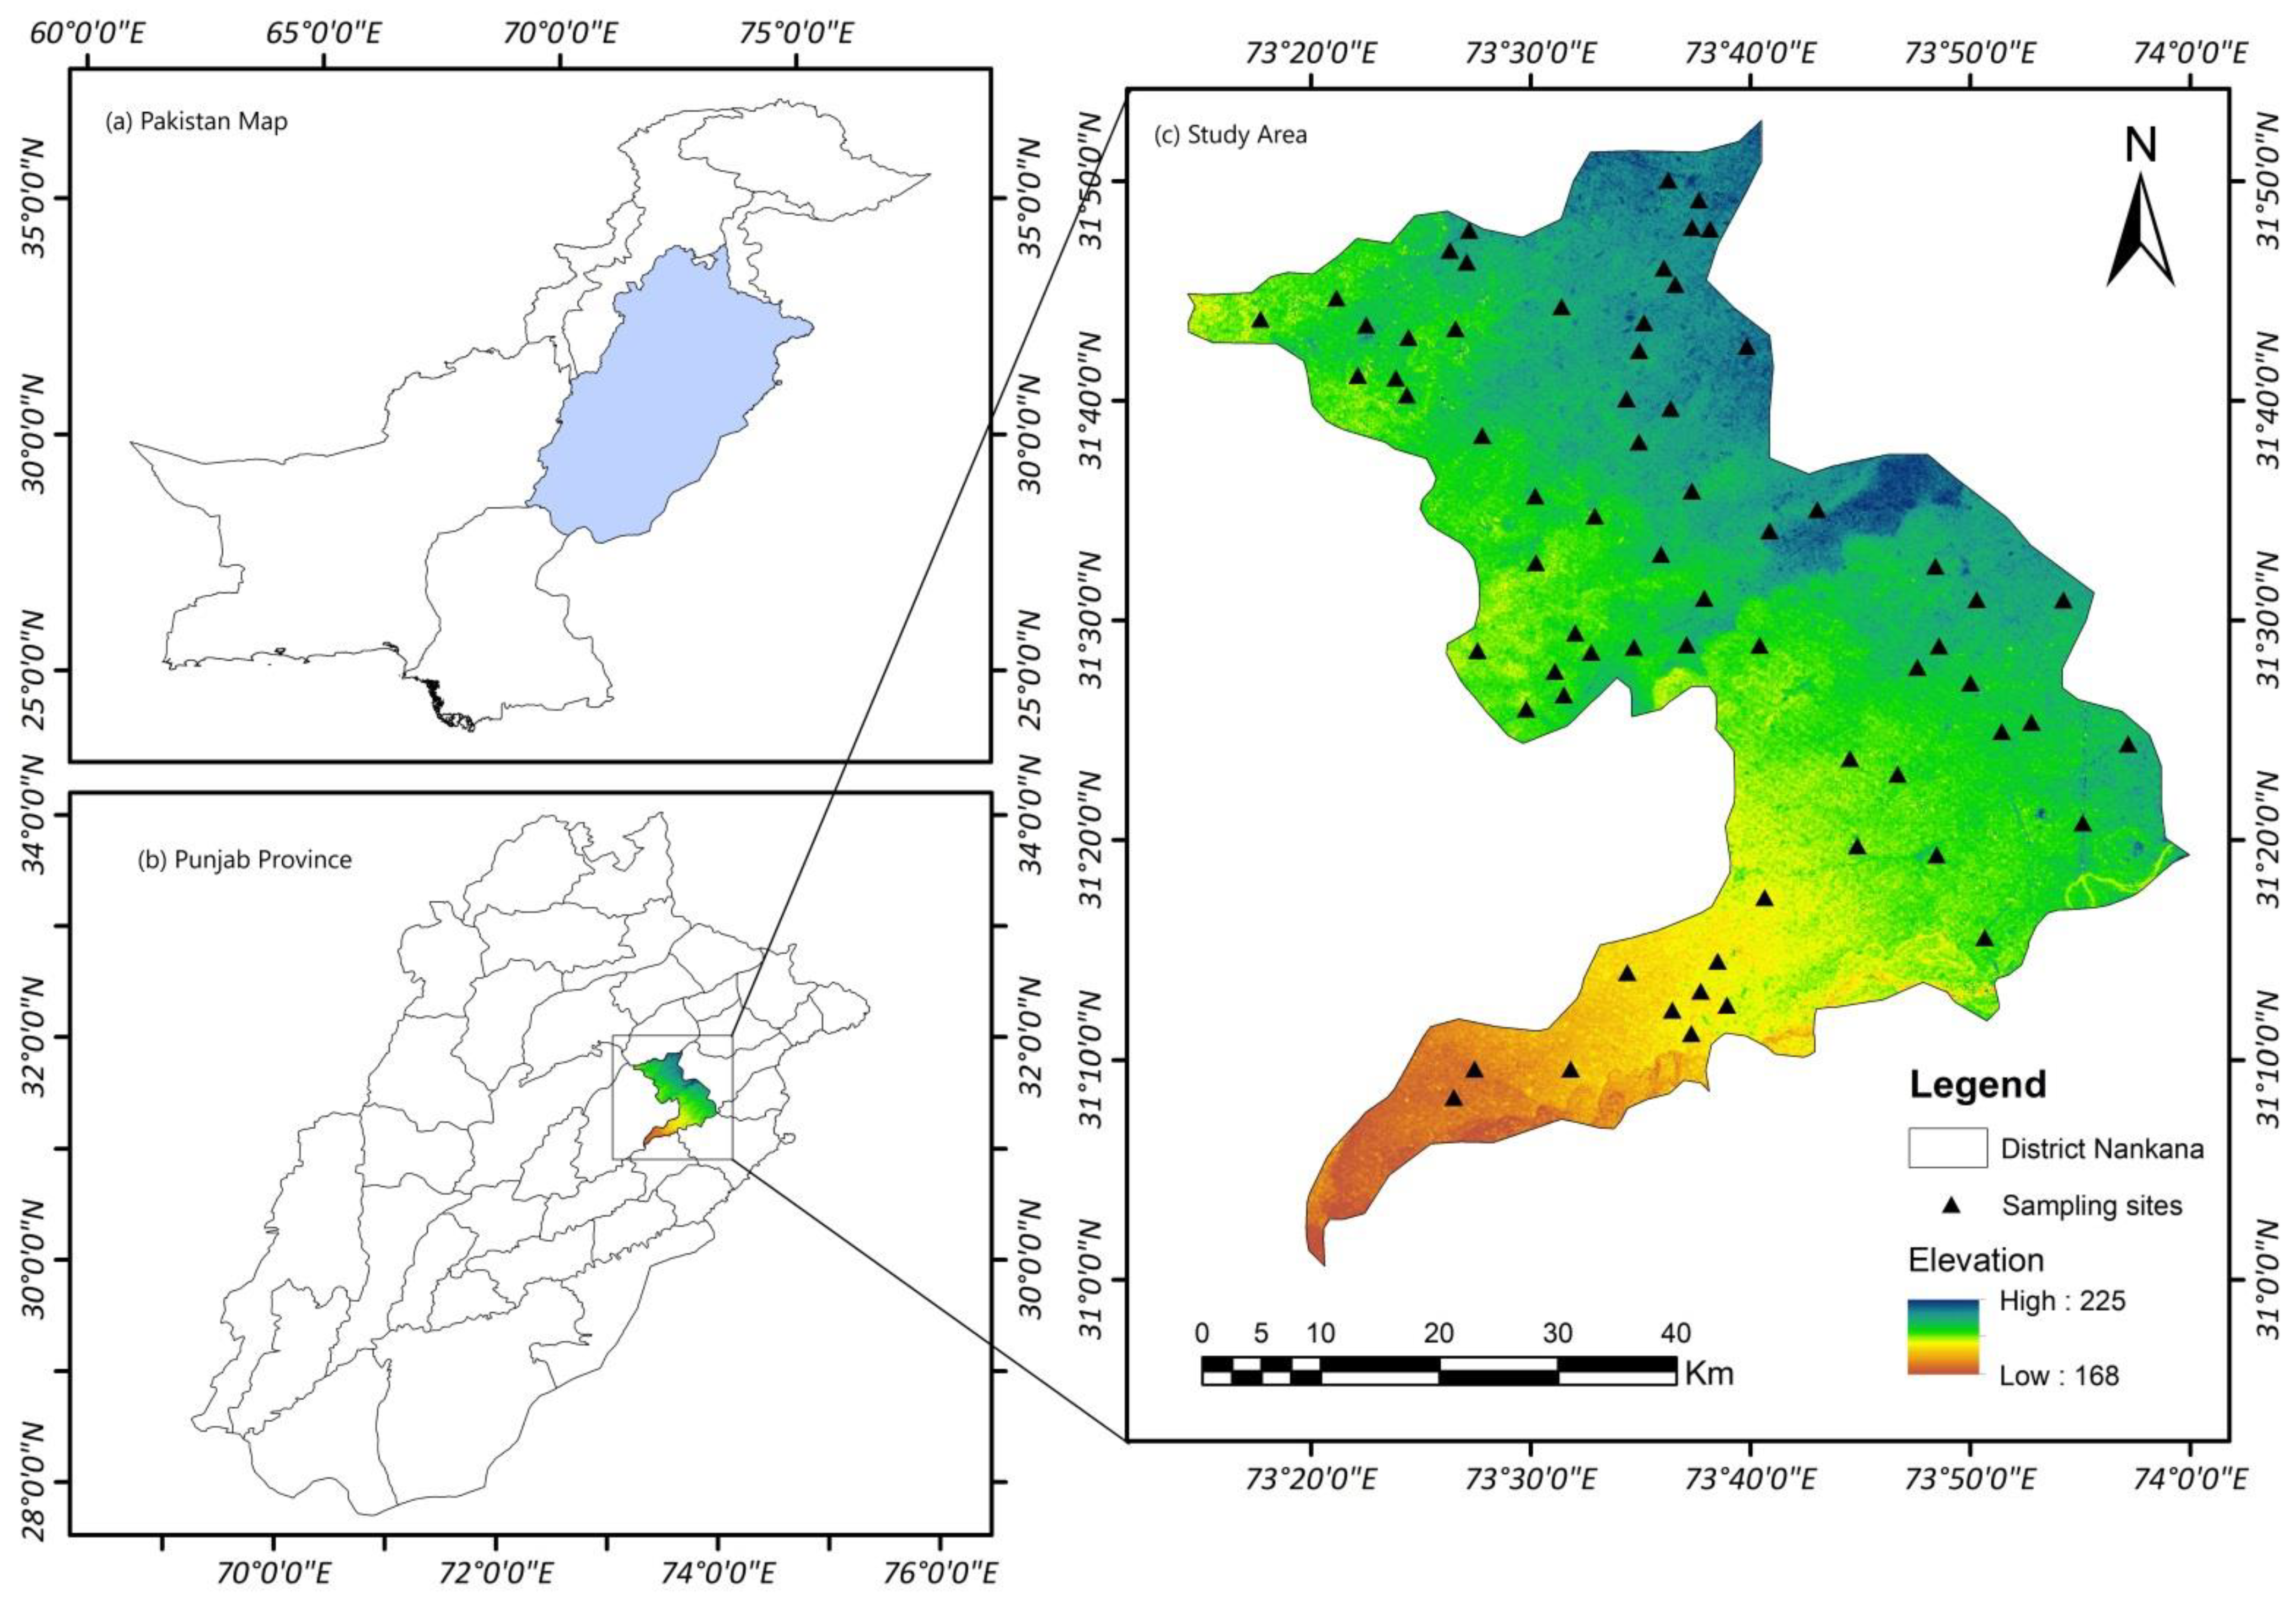
2. Area and Physiography
Geology and Hydrogeology
3. Methodology
3.1. Sampling and Analysis
3.2. Multivariate Statistical Analysis
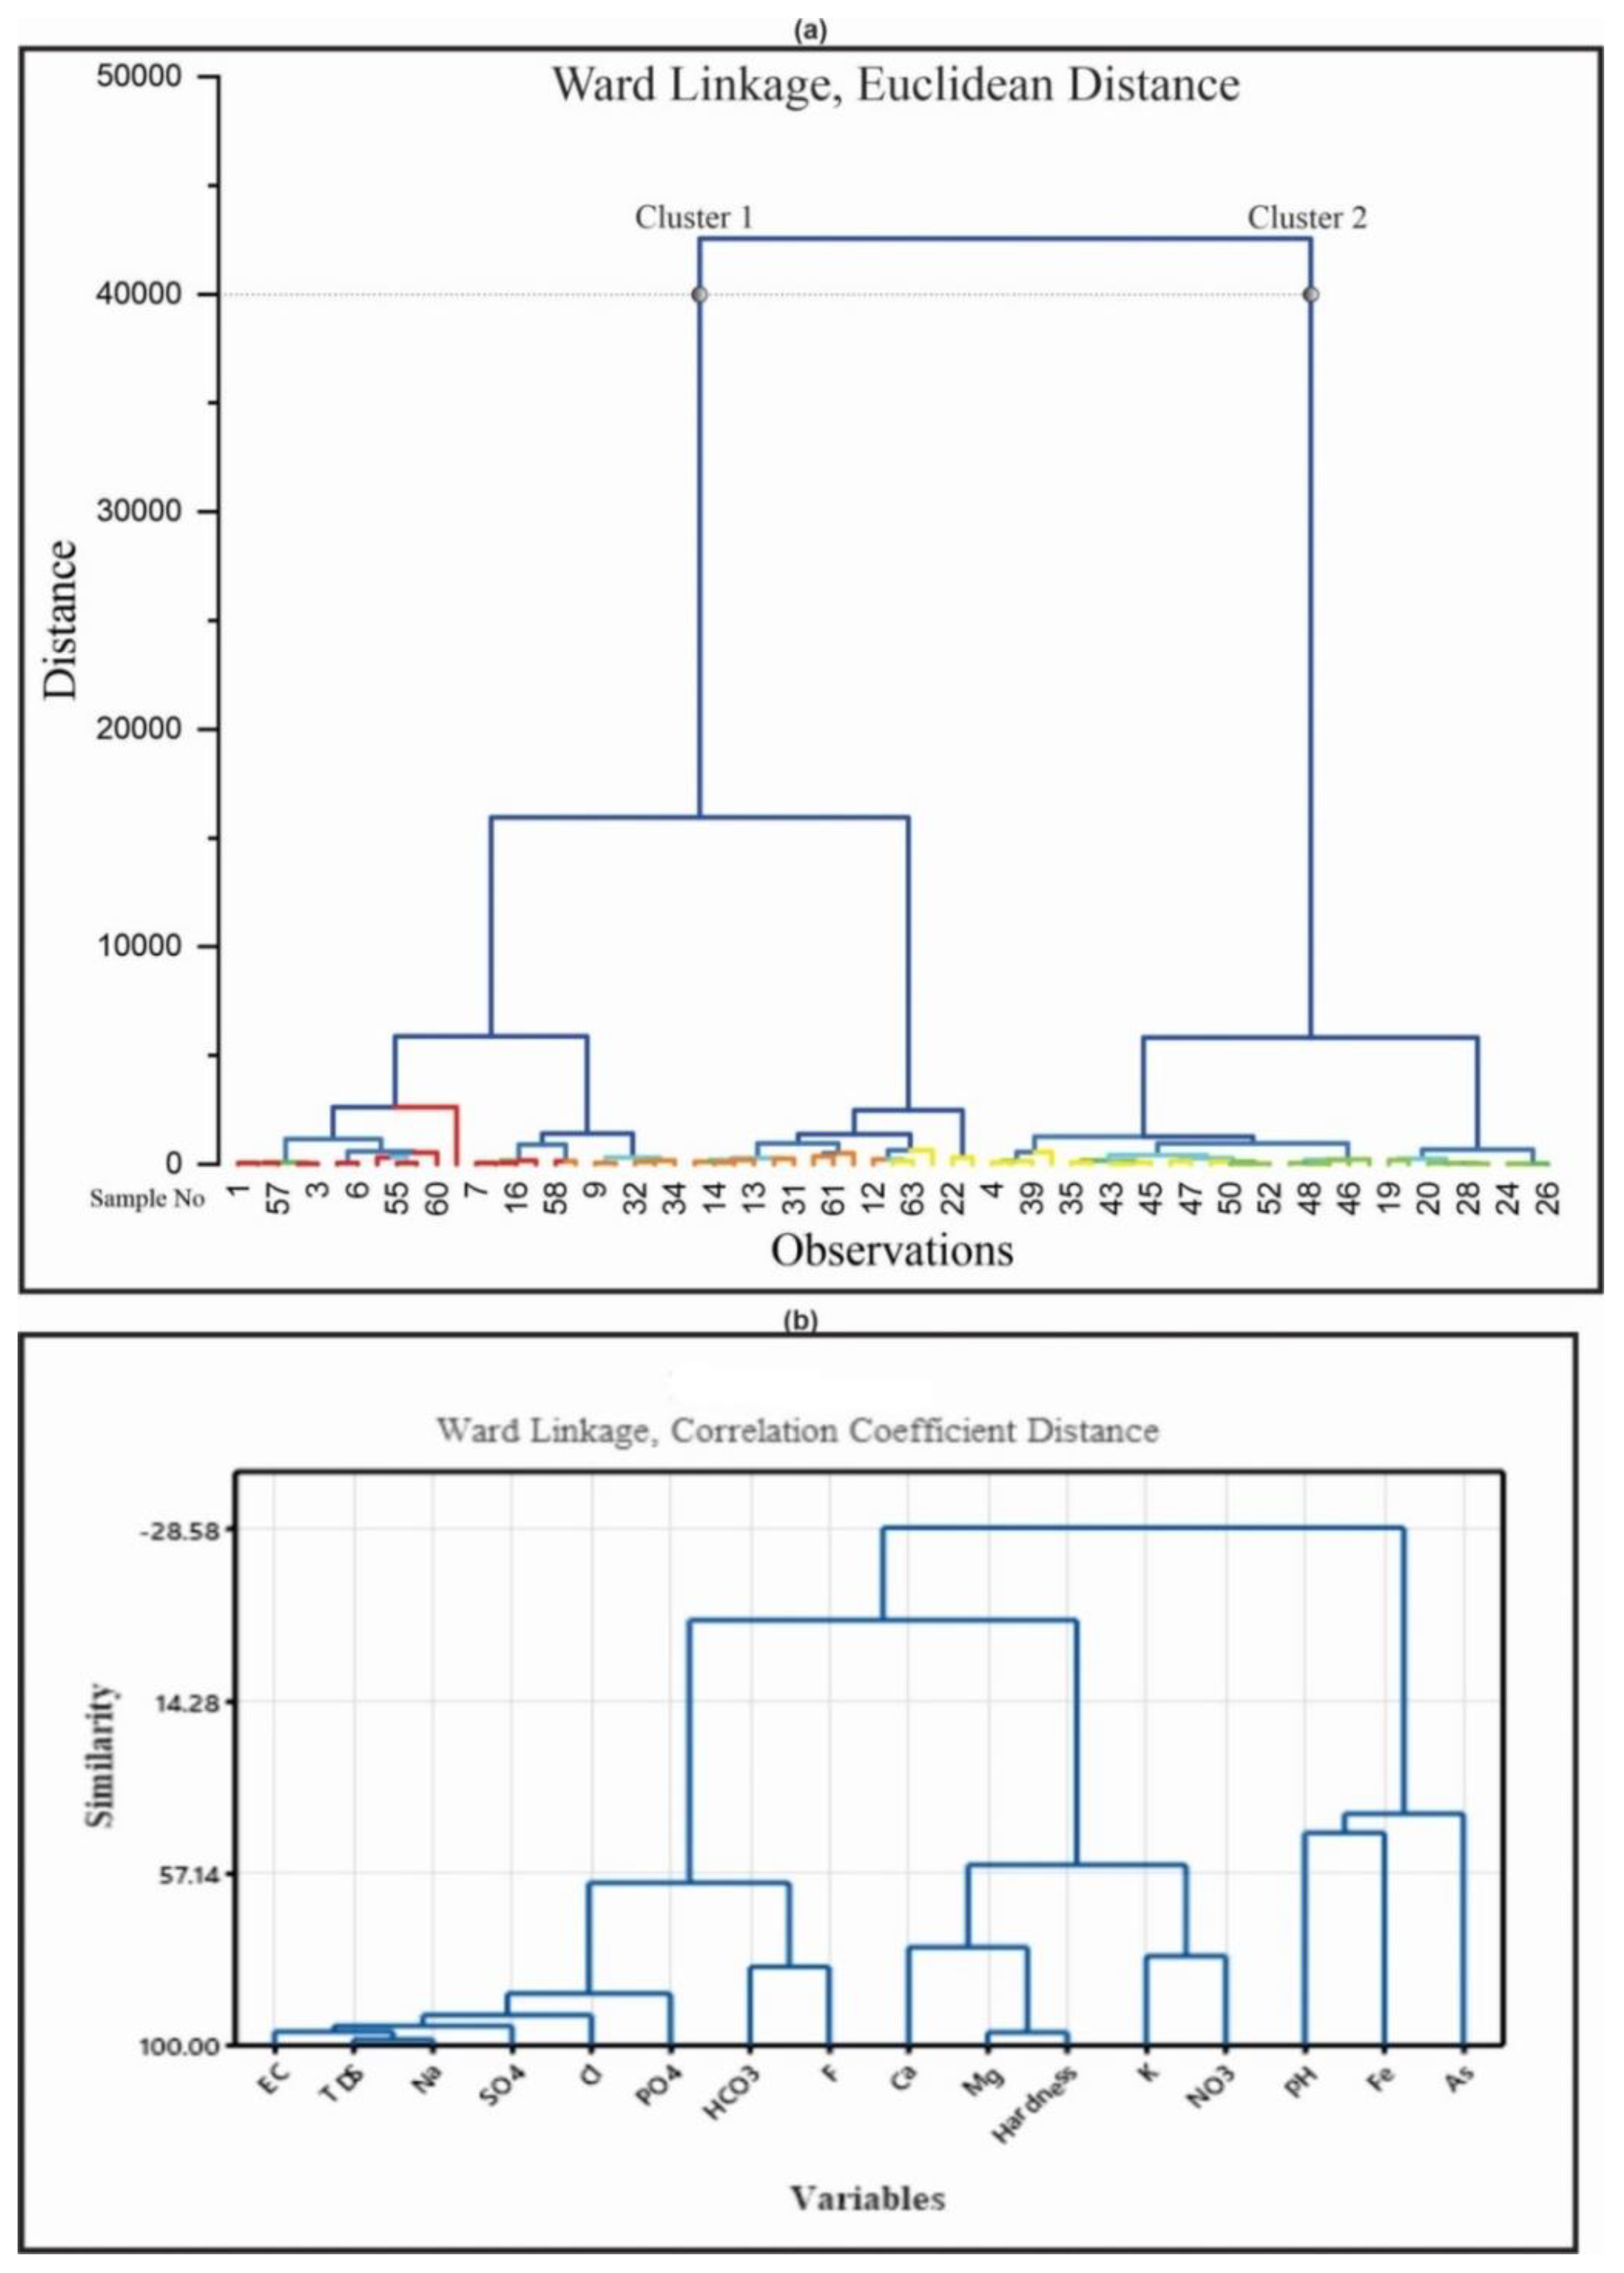
3.2.1. Correlation Analysis
3.2.2. Hierarchical Cluster Analysis (HCA)
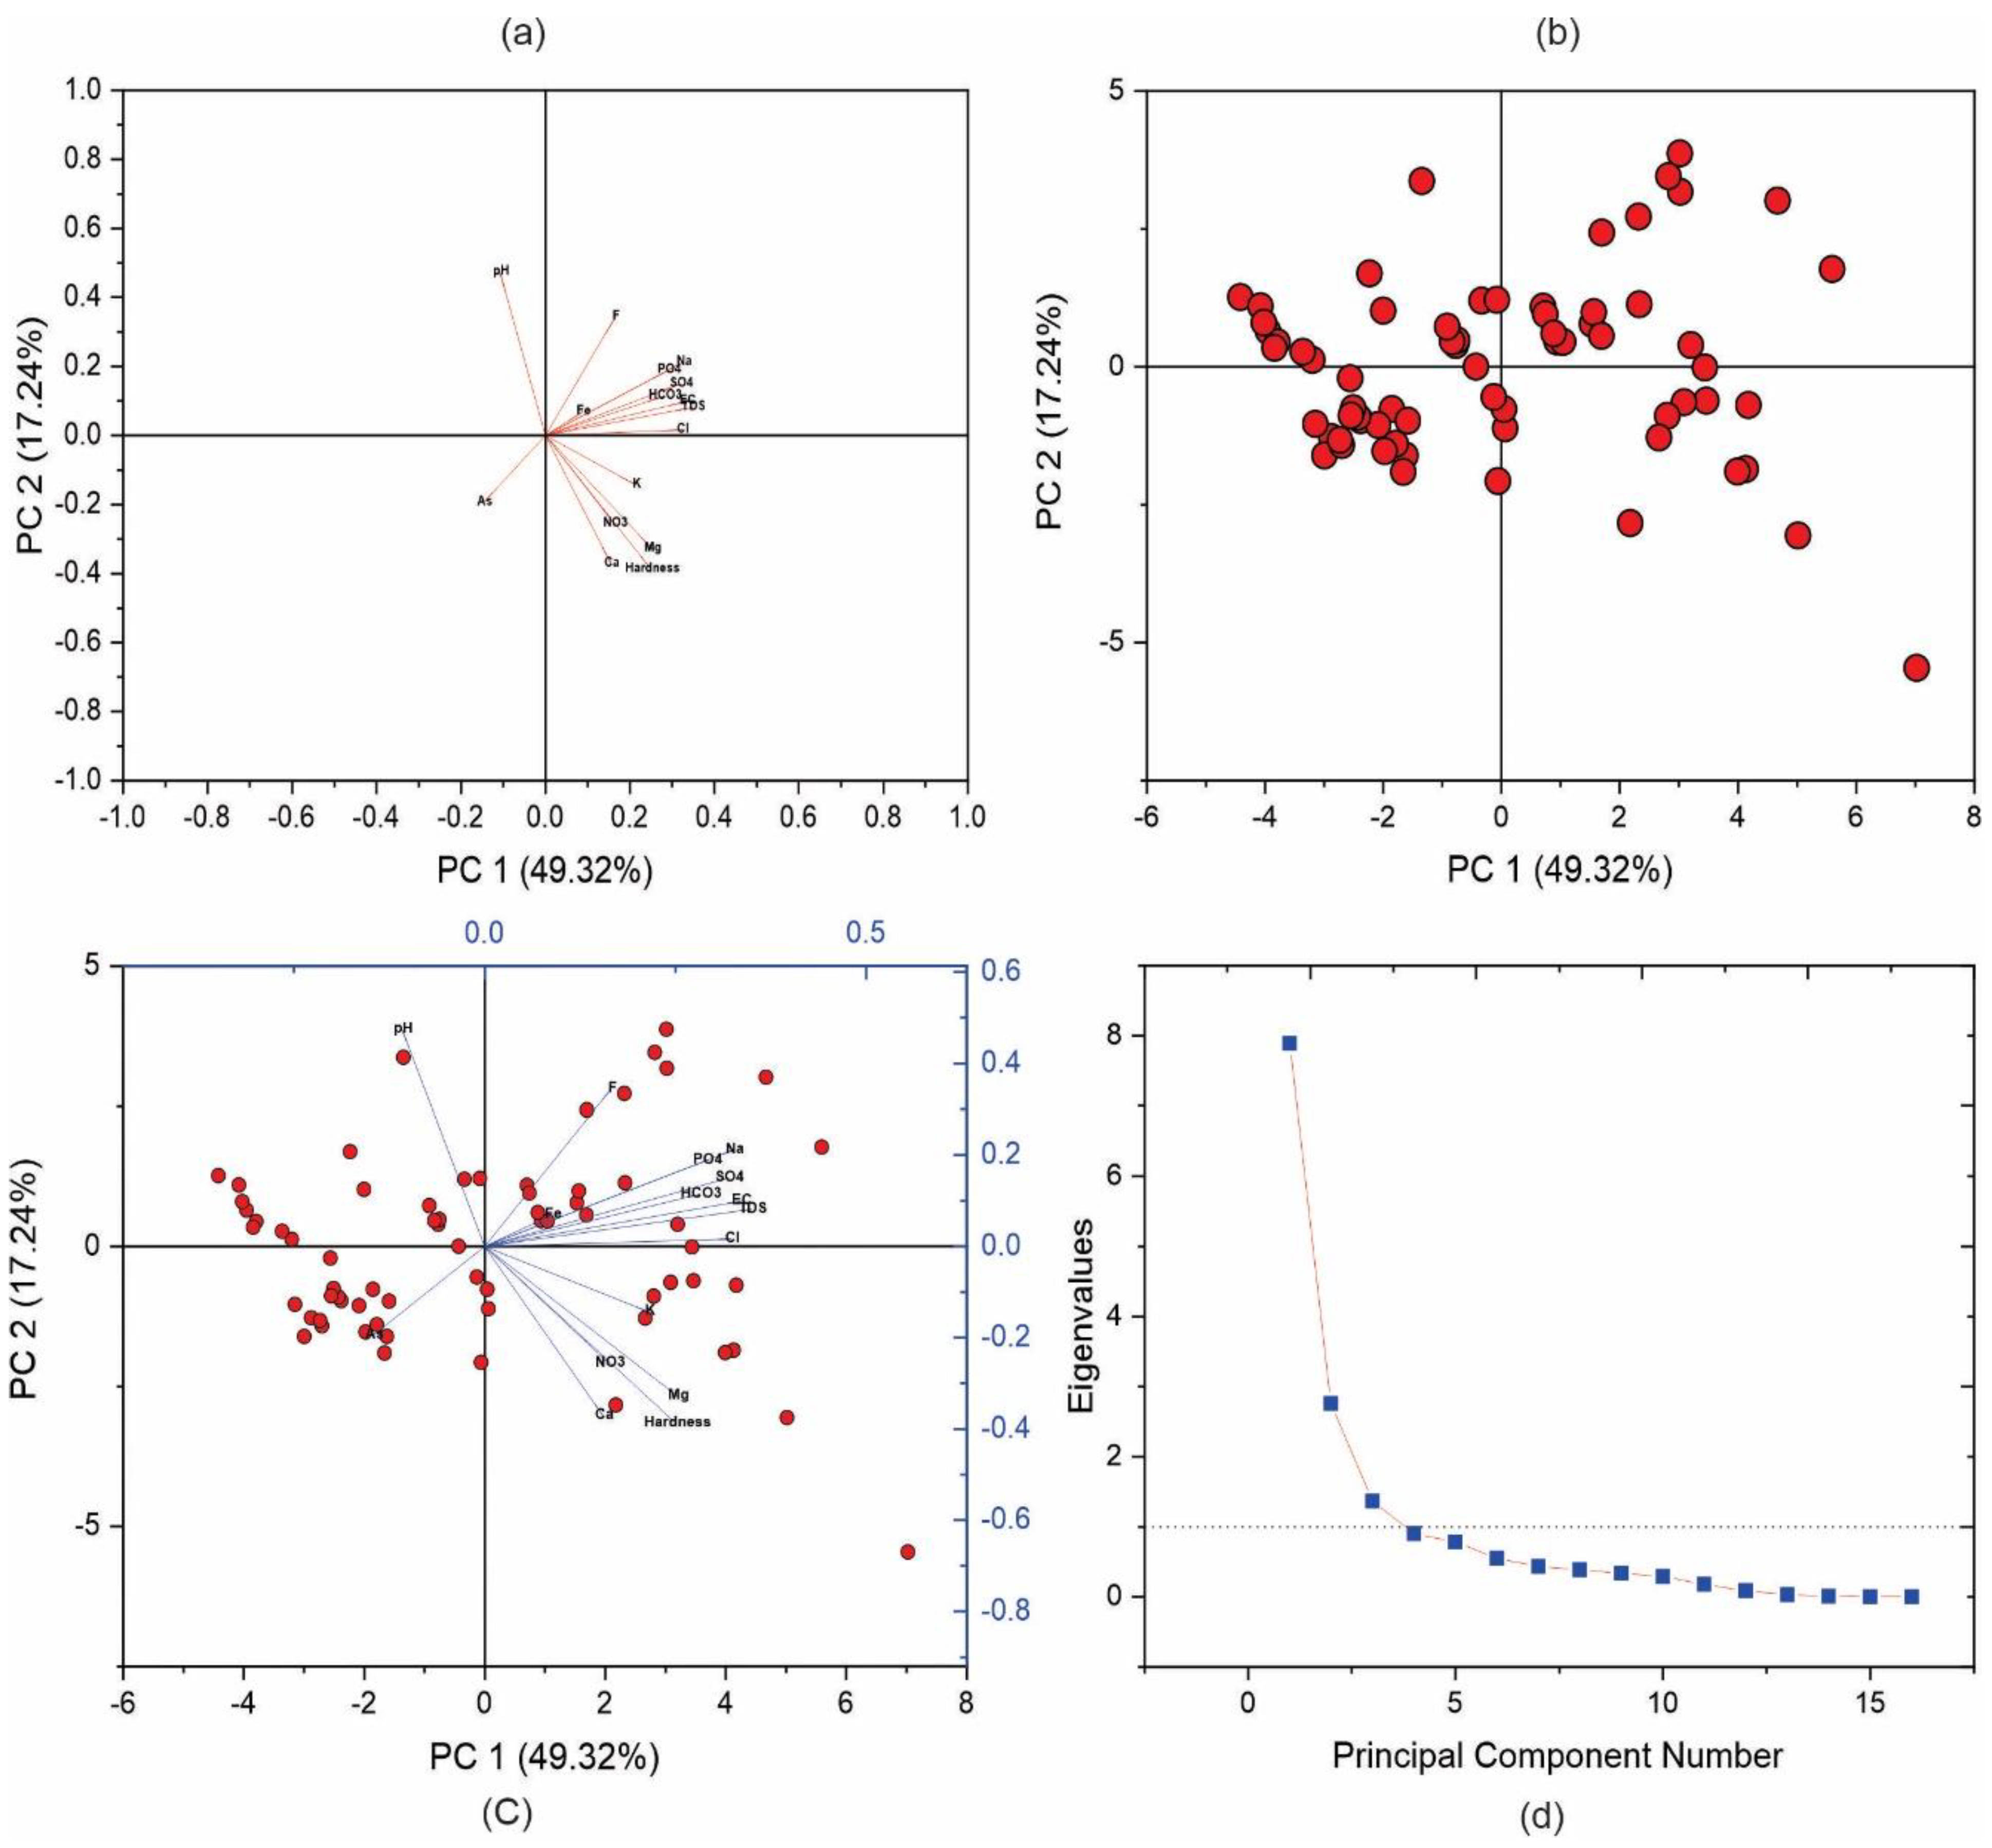
3.2.3. Principle Component Analysis (PCA)
3.3. Groundwater Type and Classification
3.4. Geochemical Modeling
3.5. Water Quality Index (WQI)
3.6. Heath Risk Assessment
4. Result and Discussion
4.1. Groundwater Hydrochemical Properties
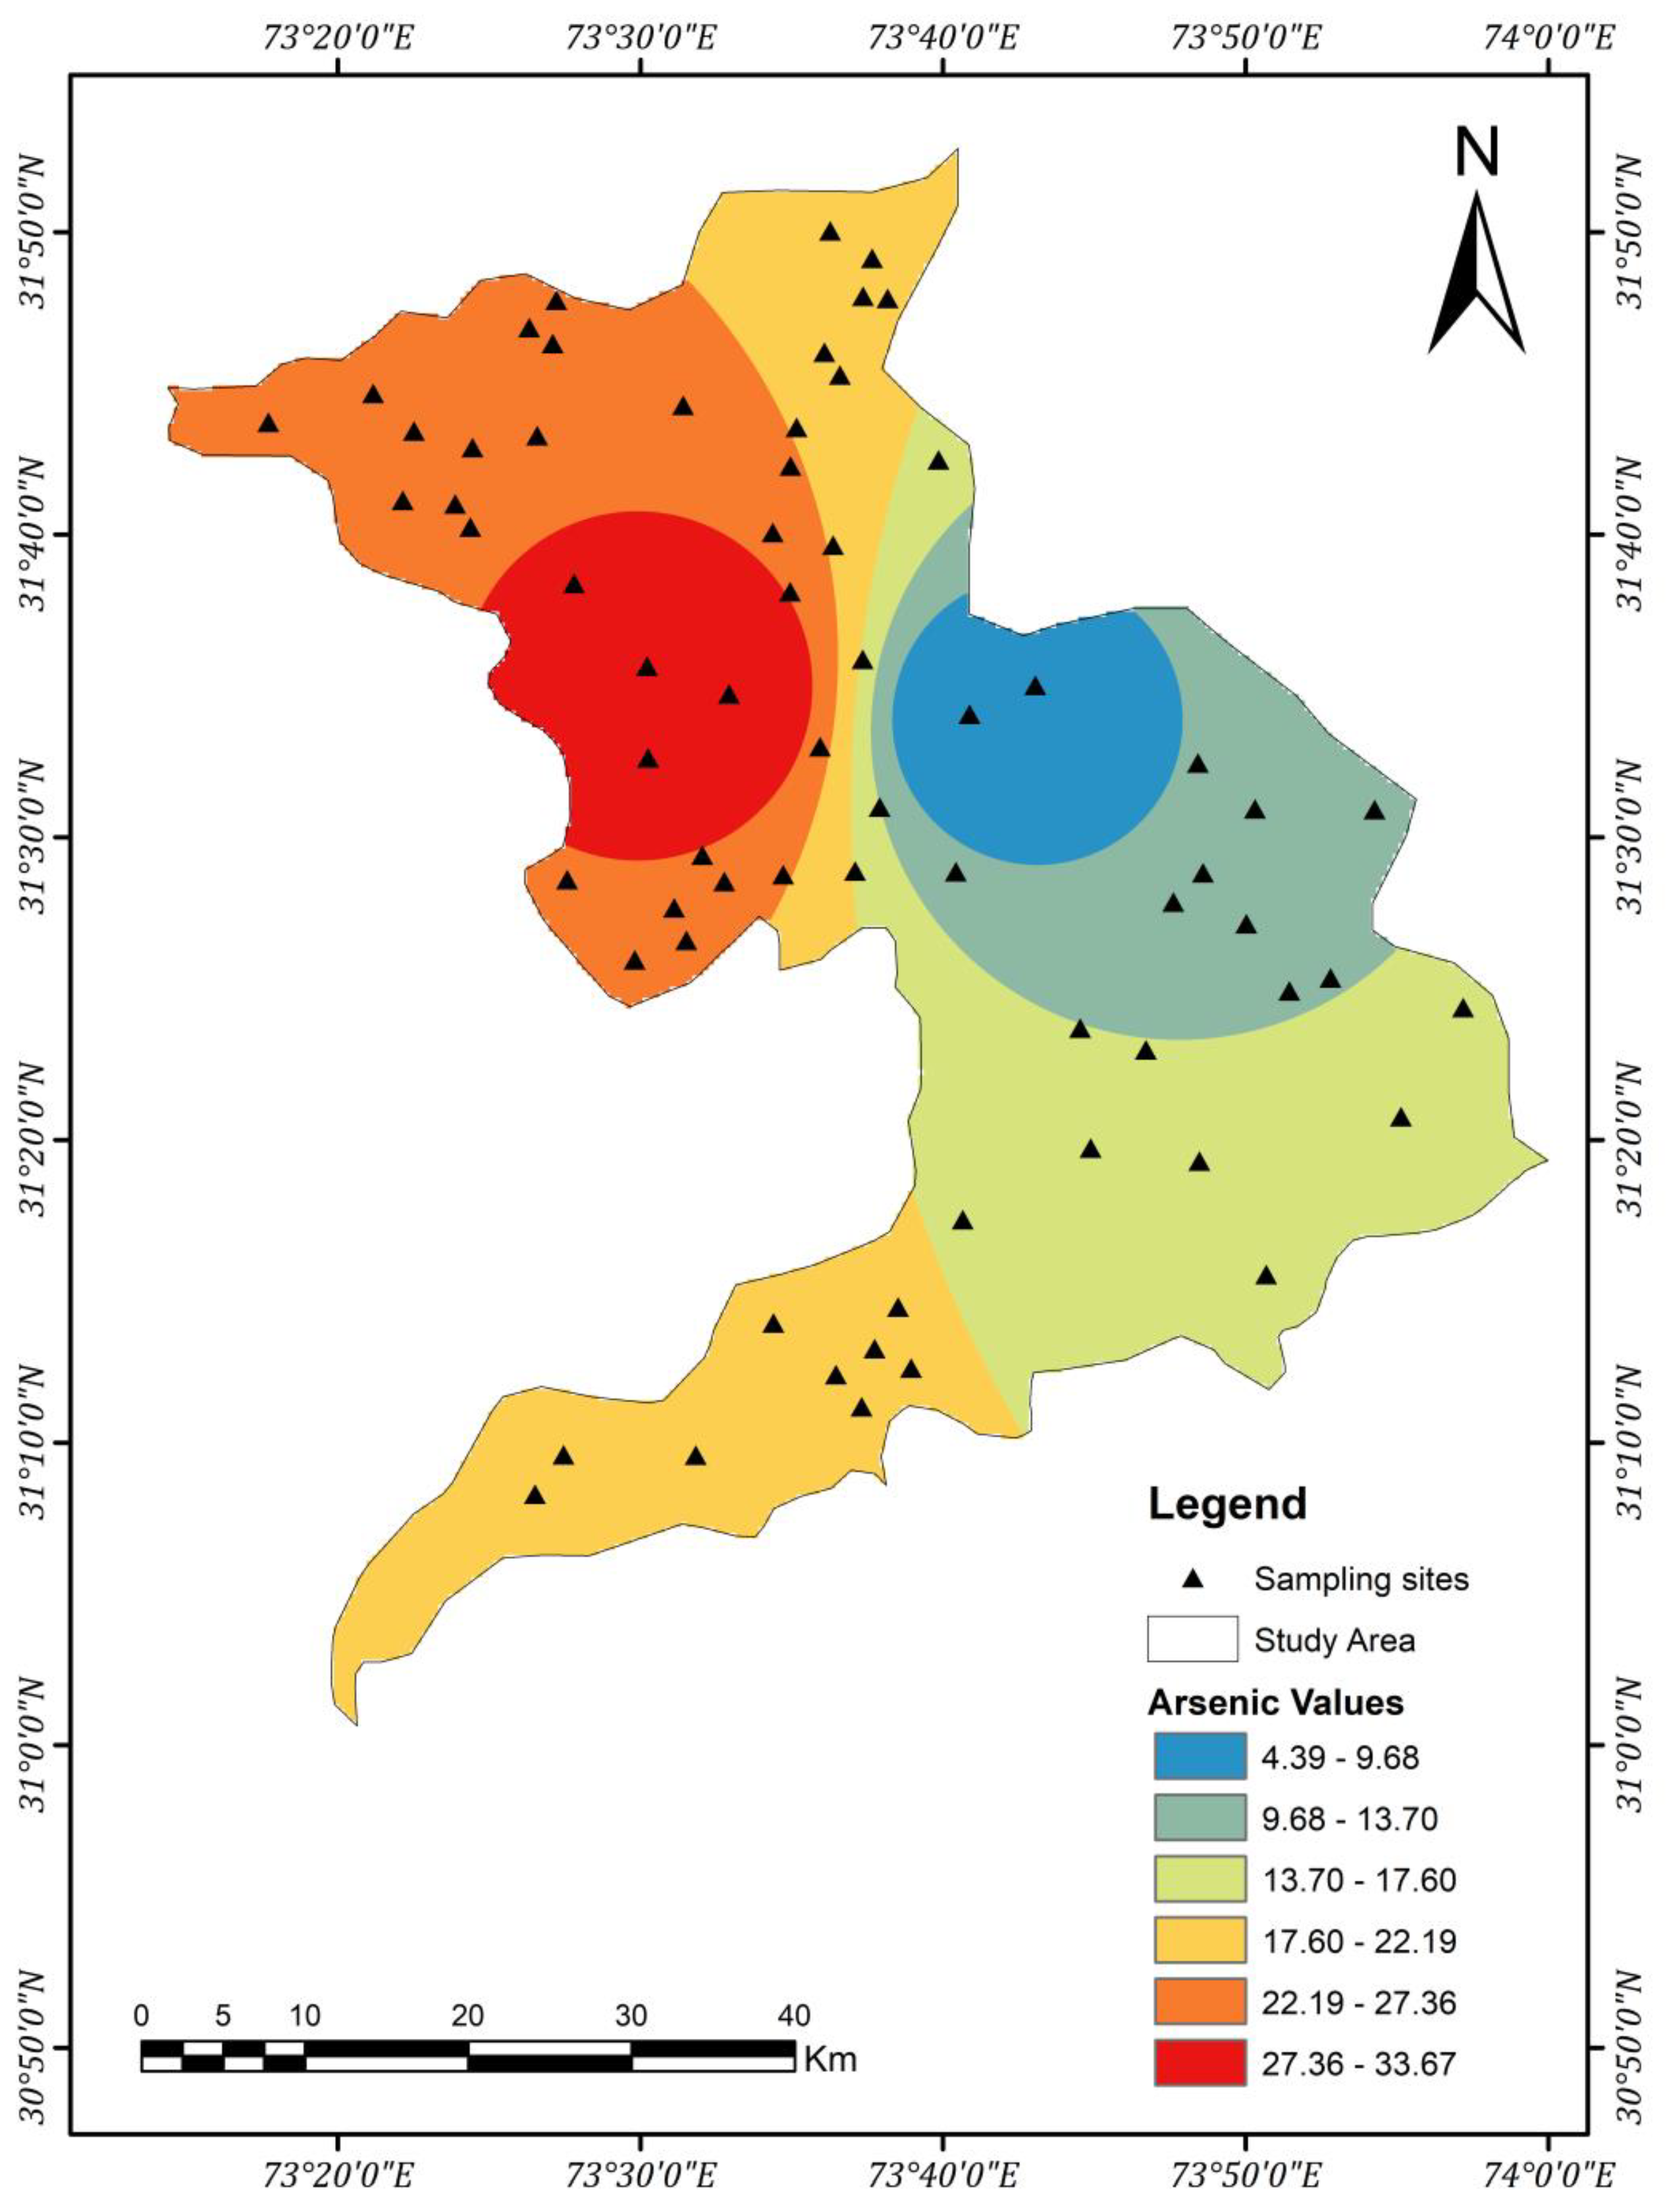
4.2. Arsenic Occurrence and Distribution
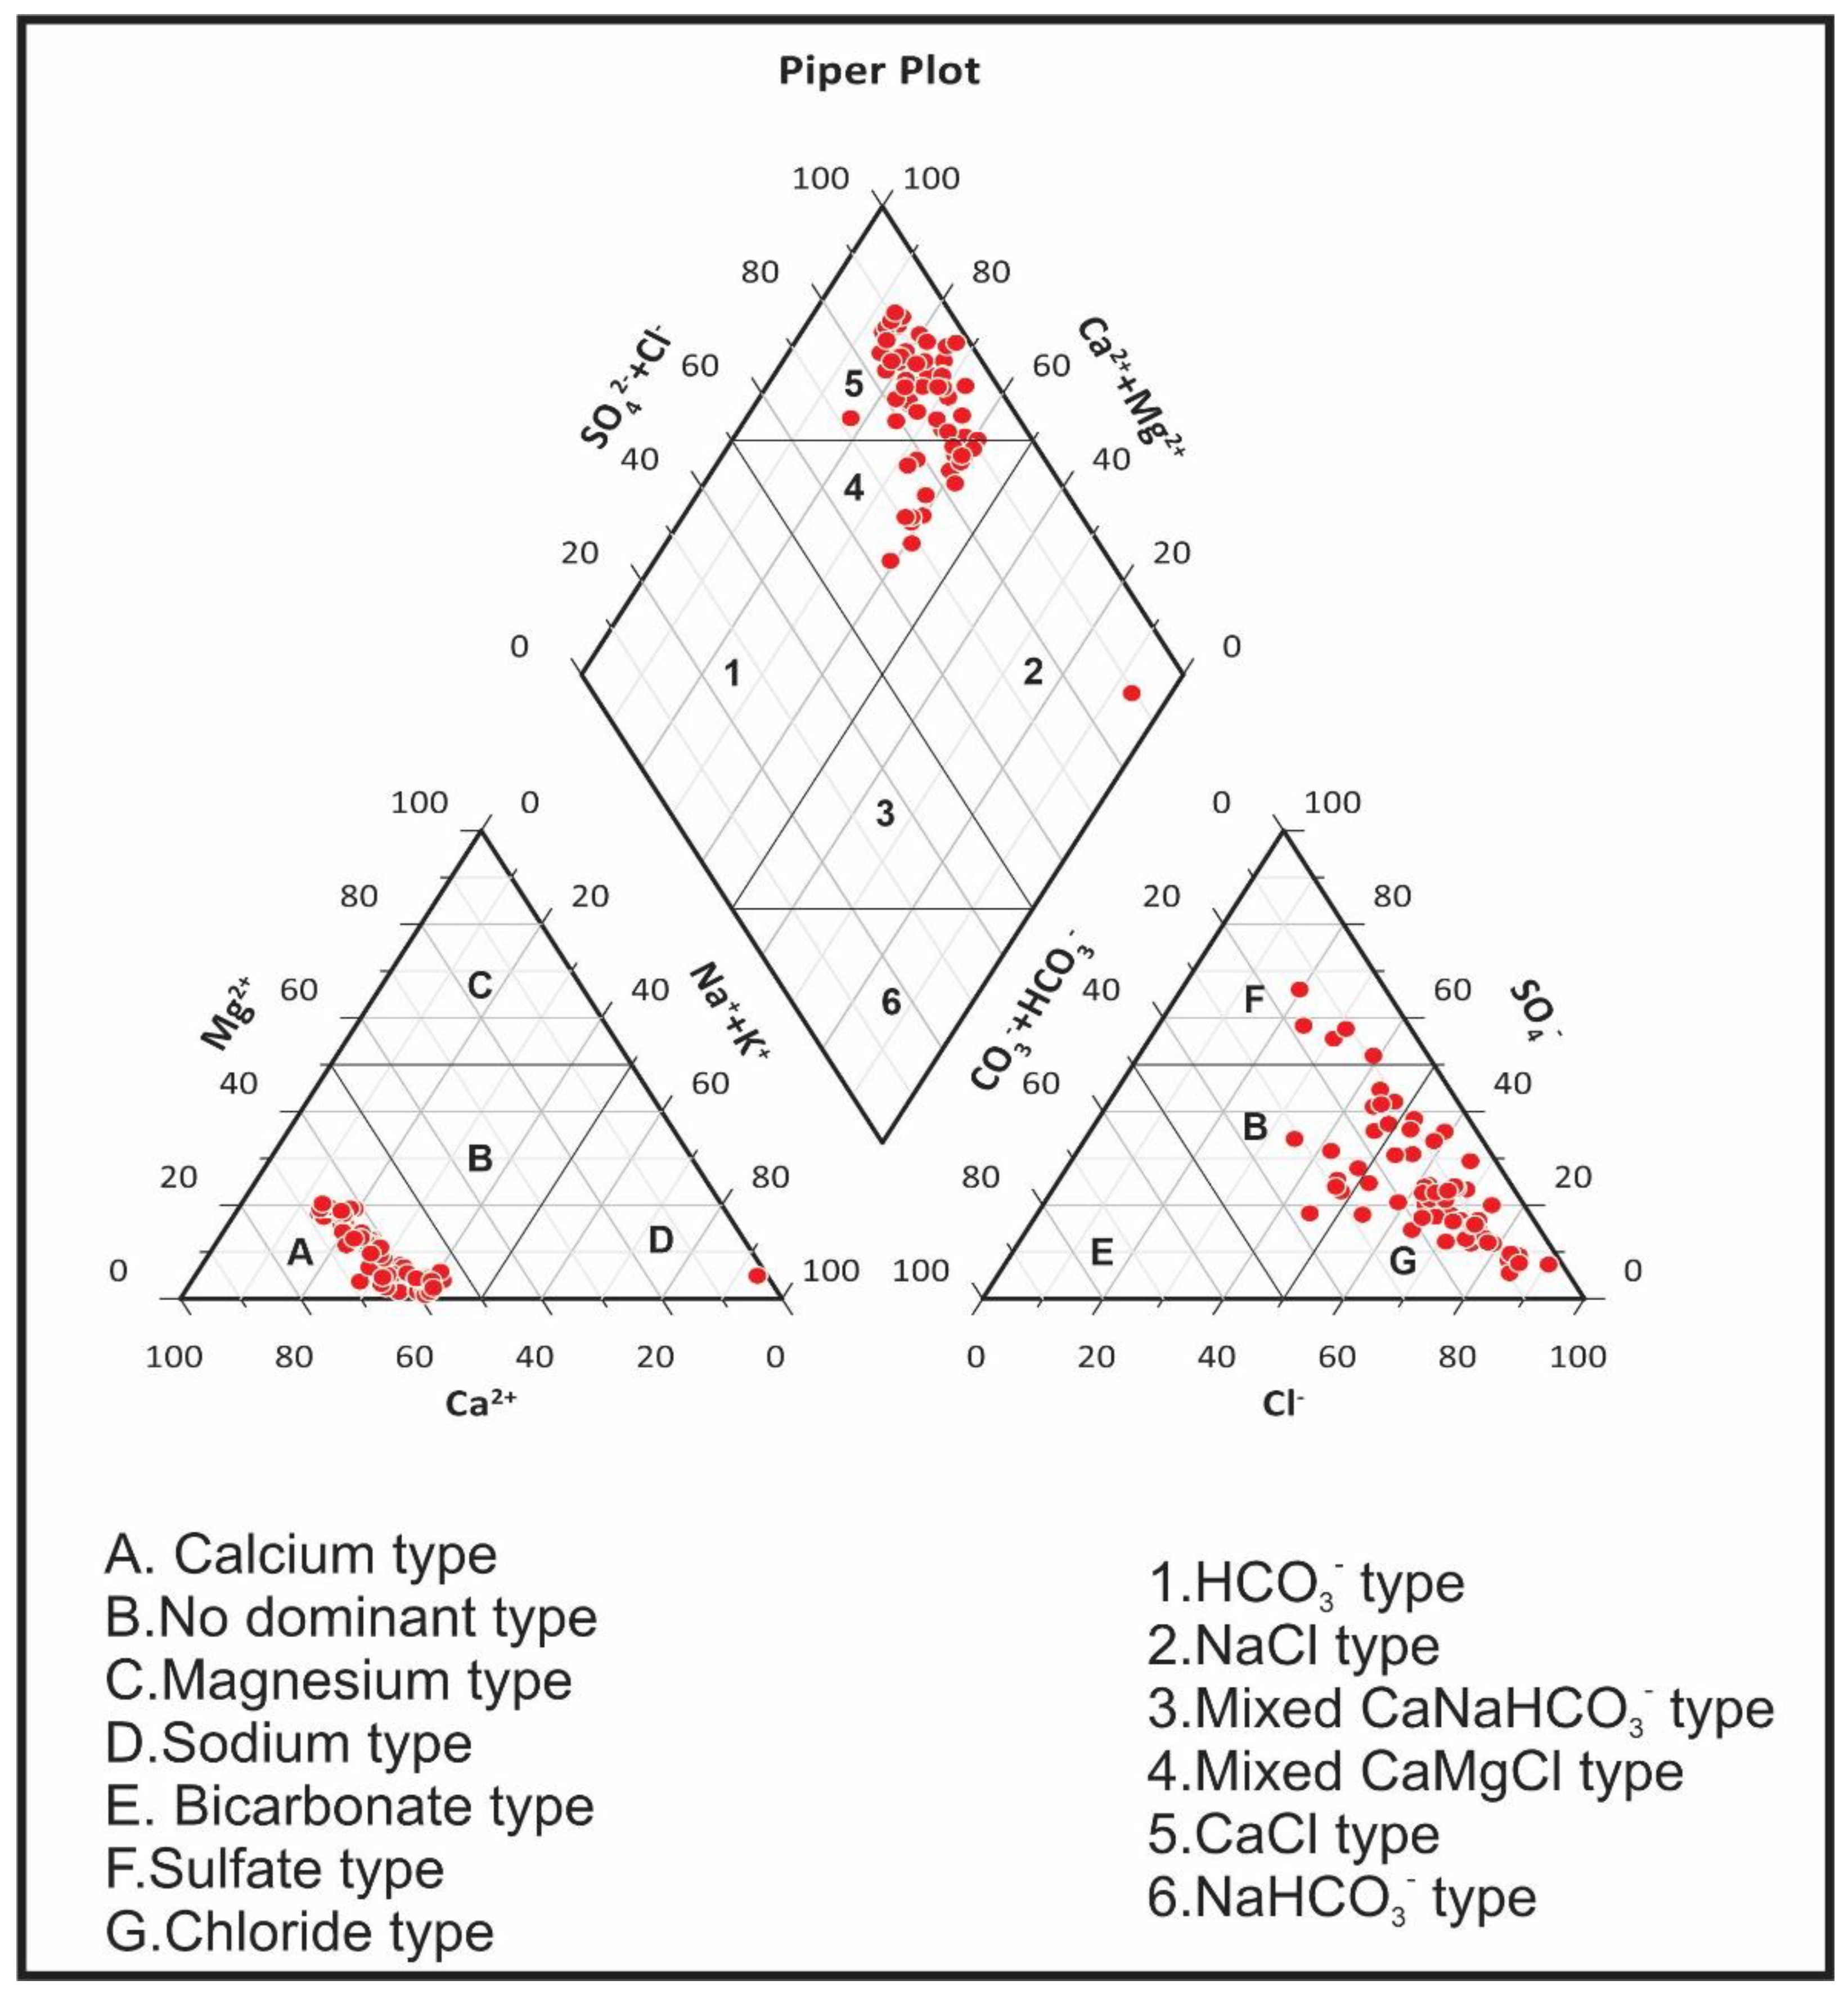
4.2.1. Groundwater Type
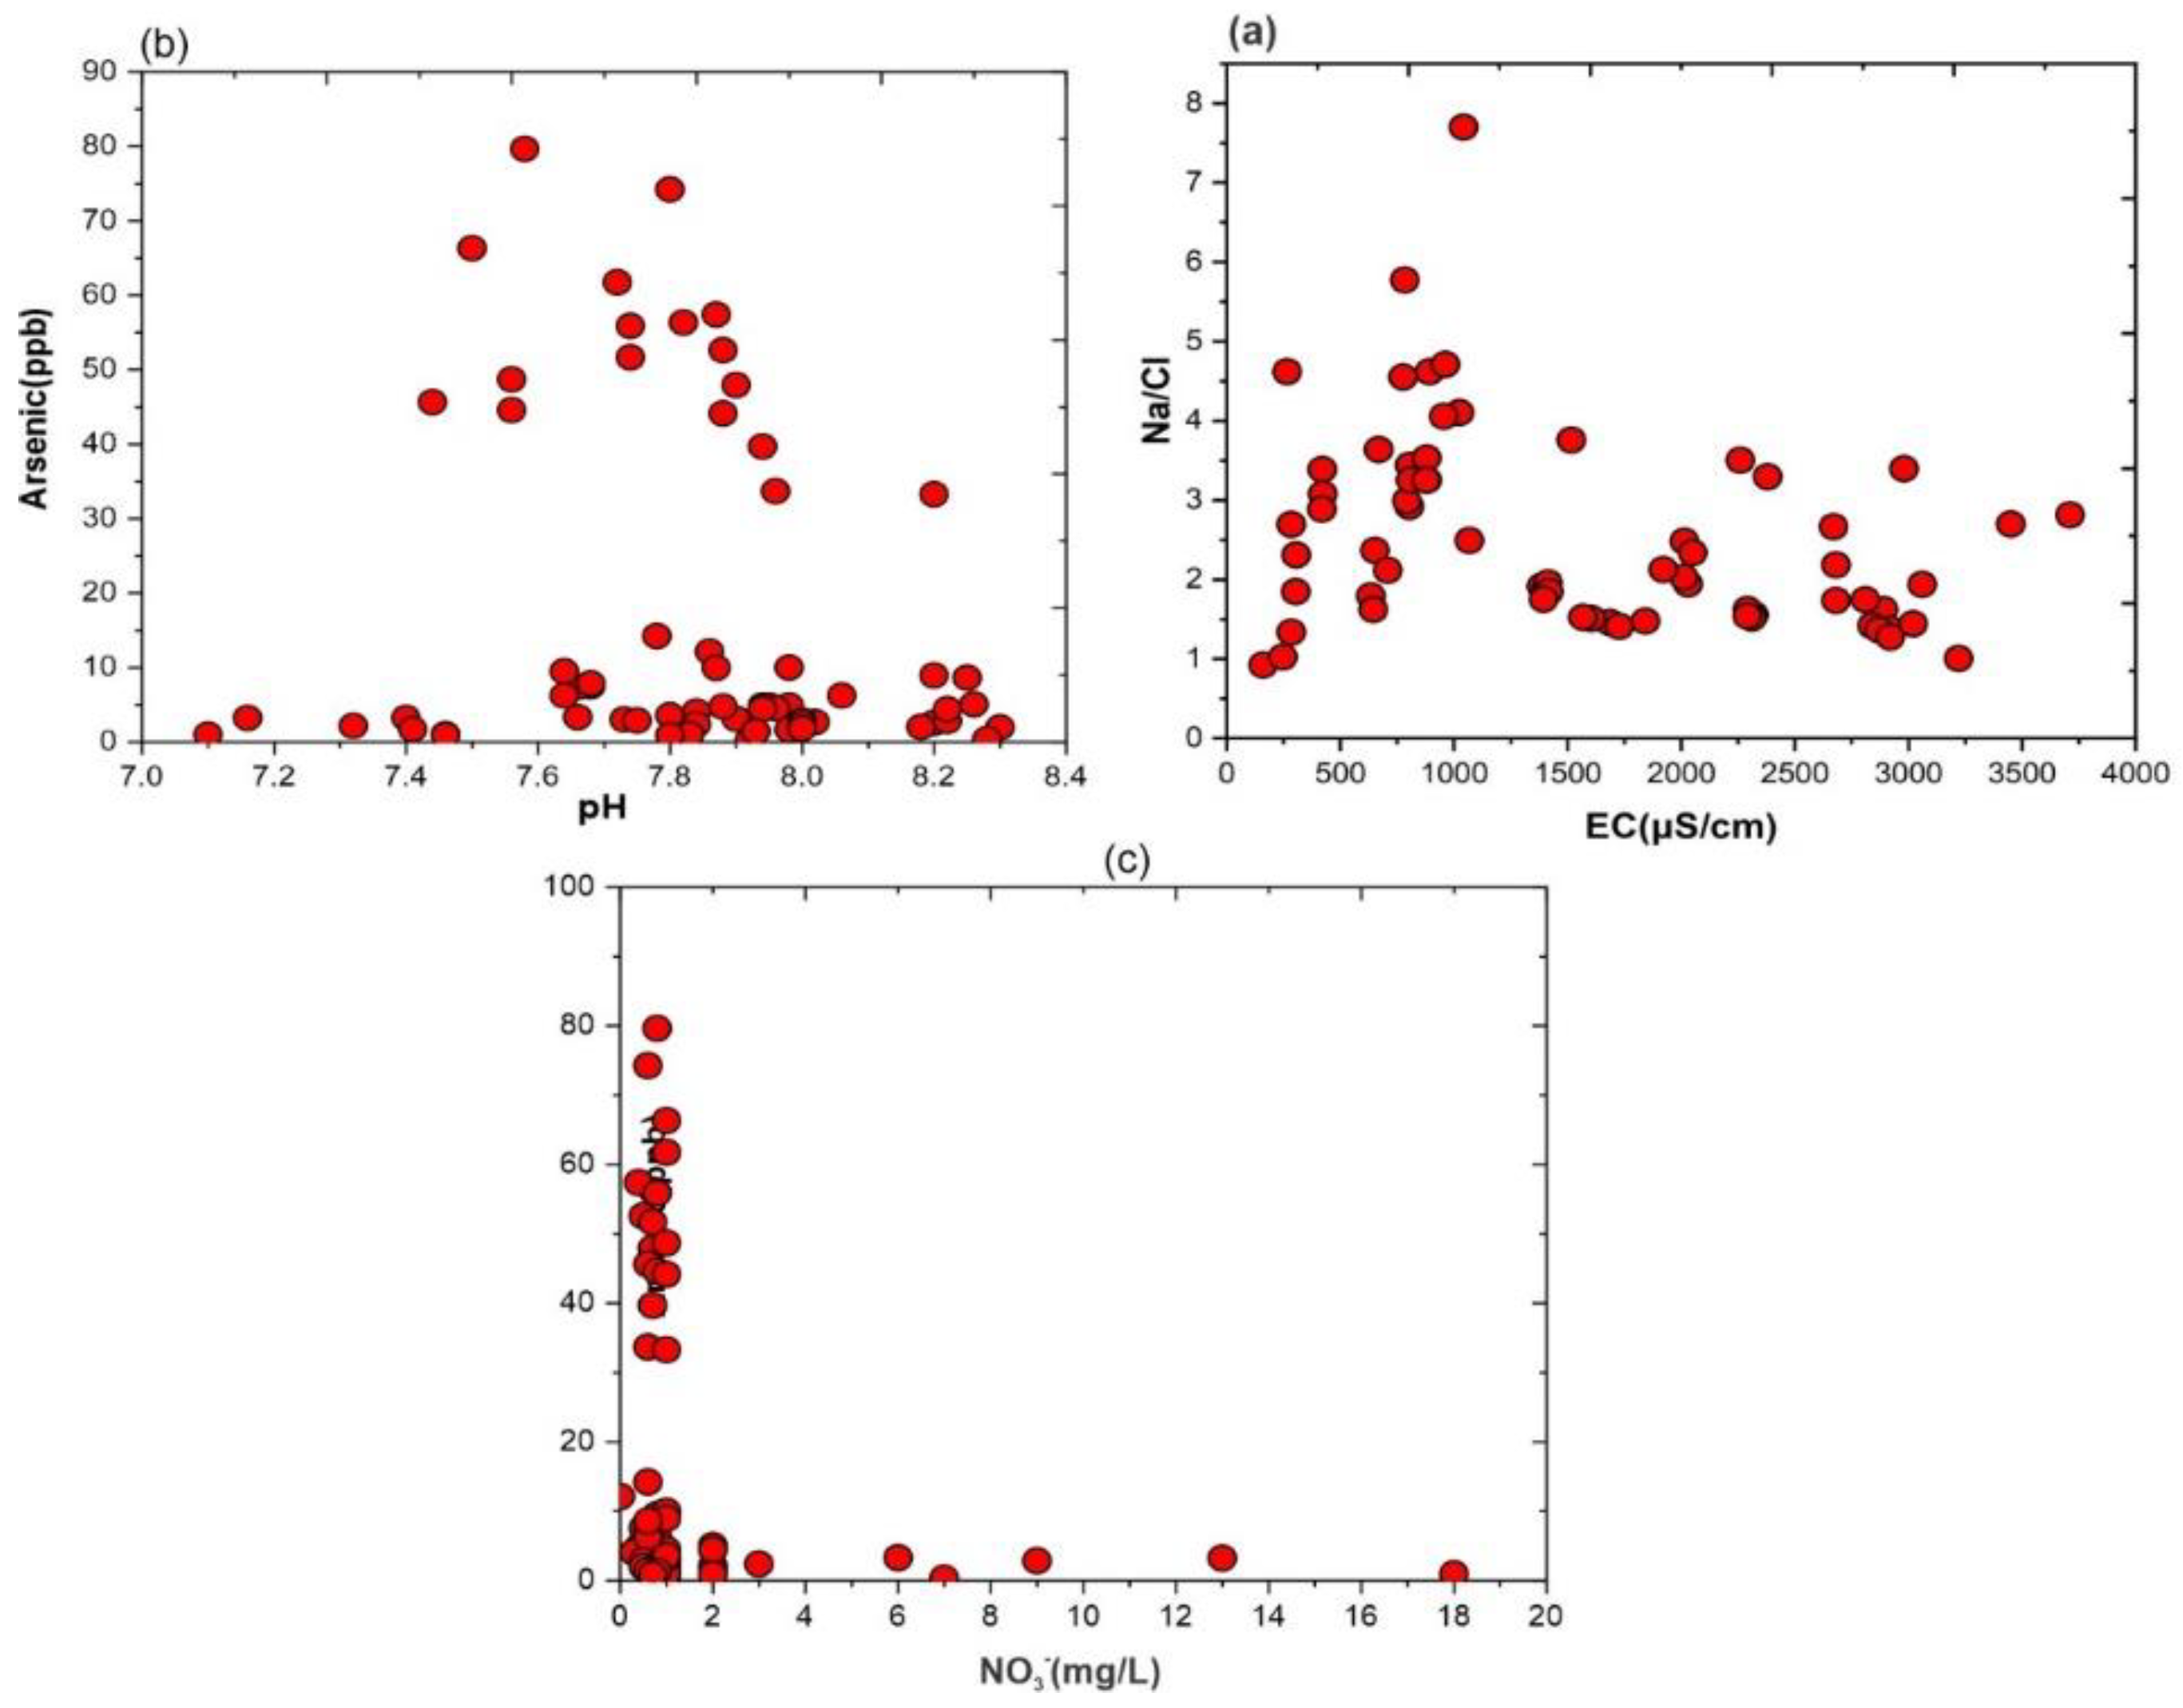
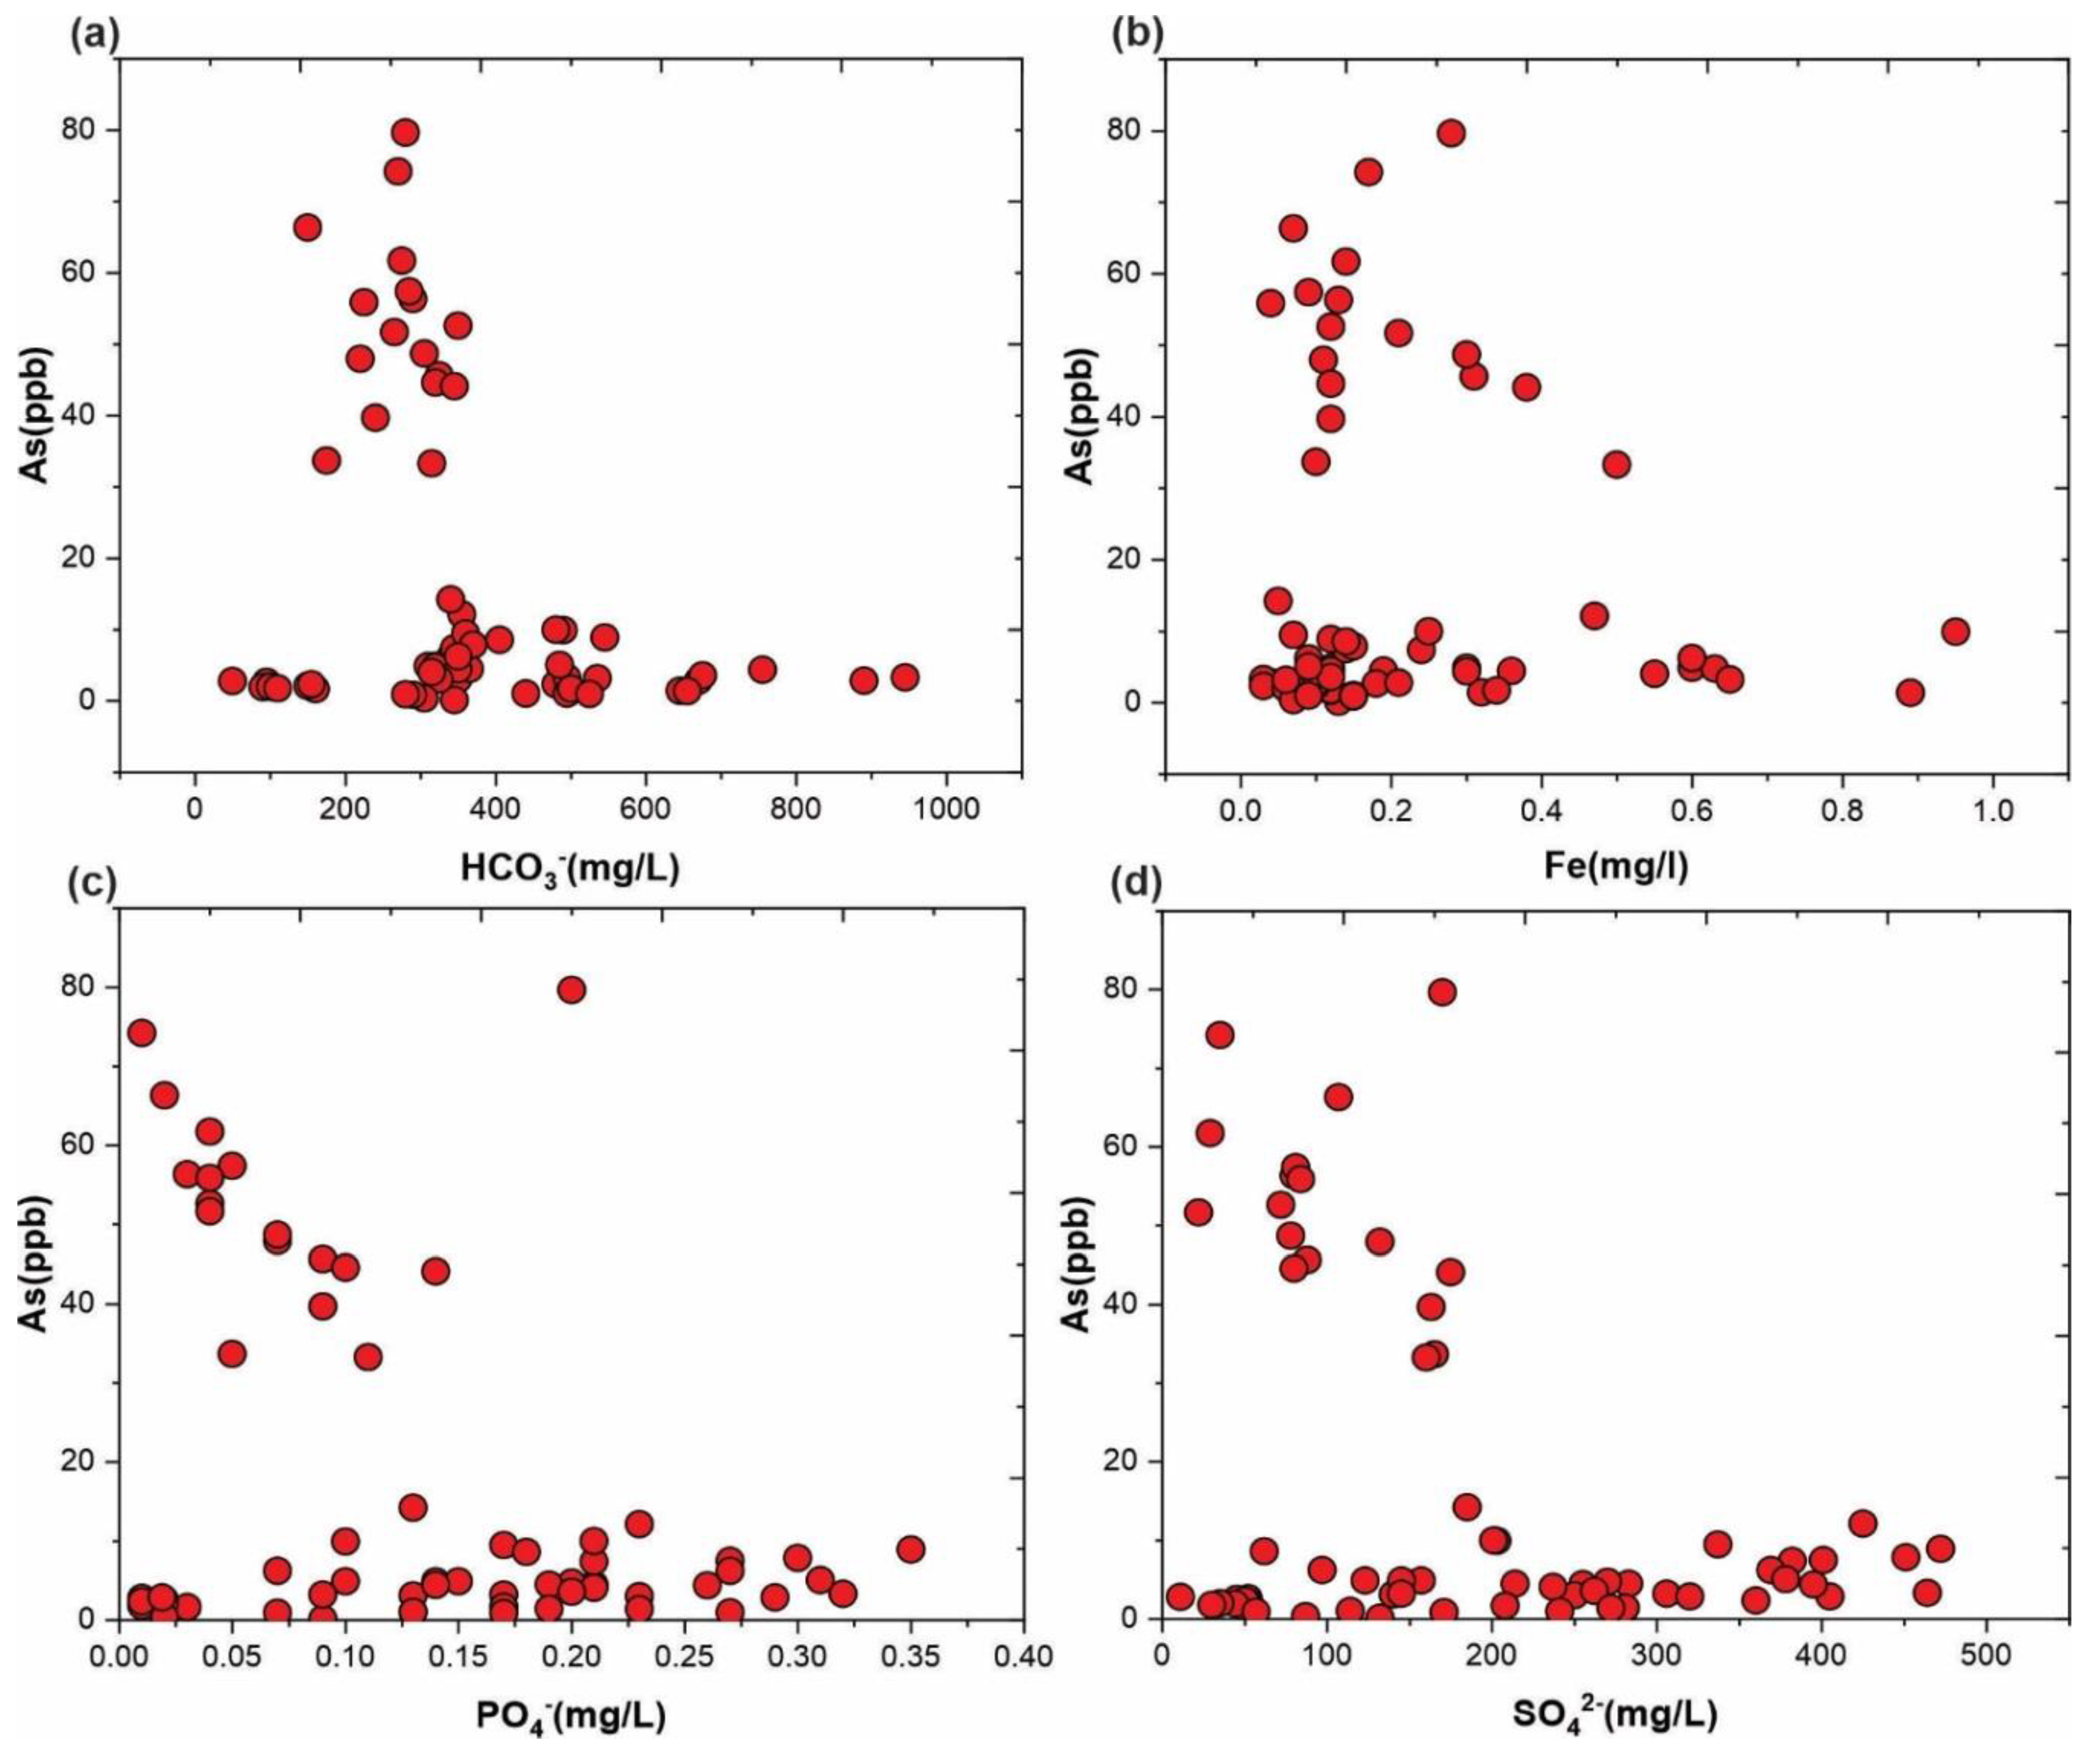
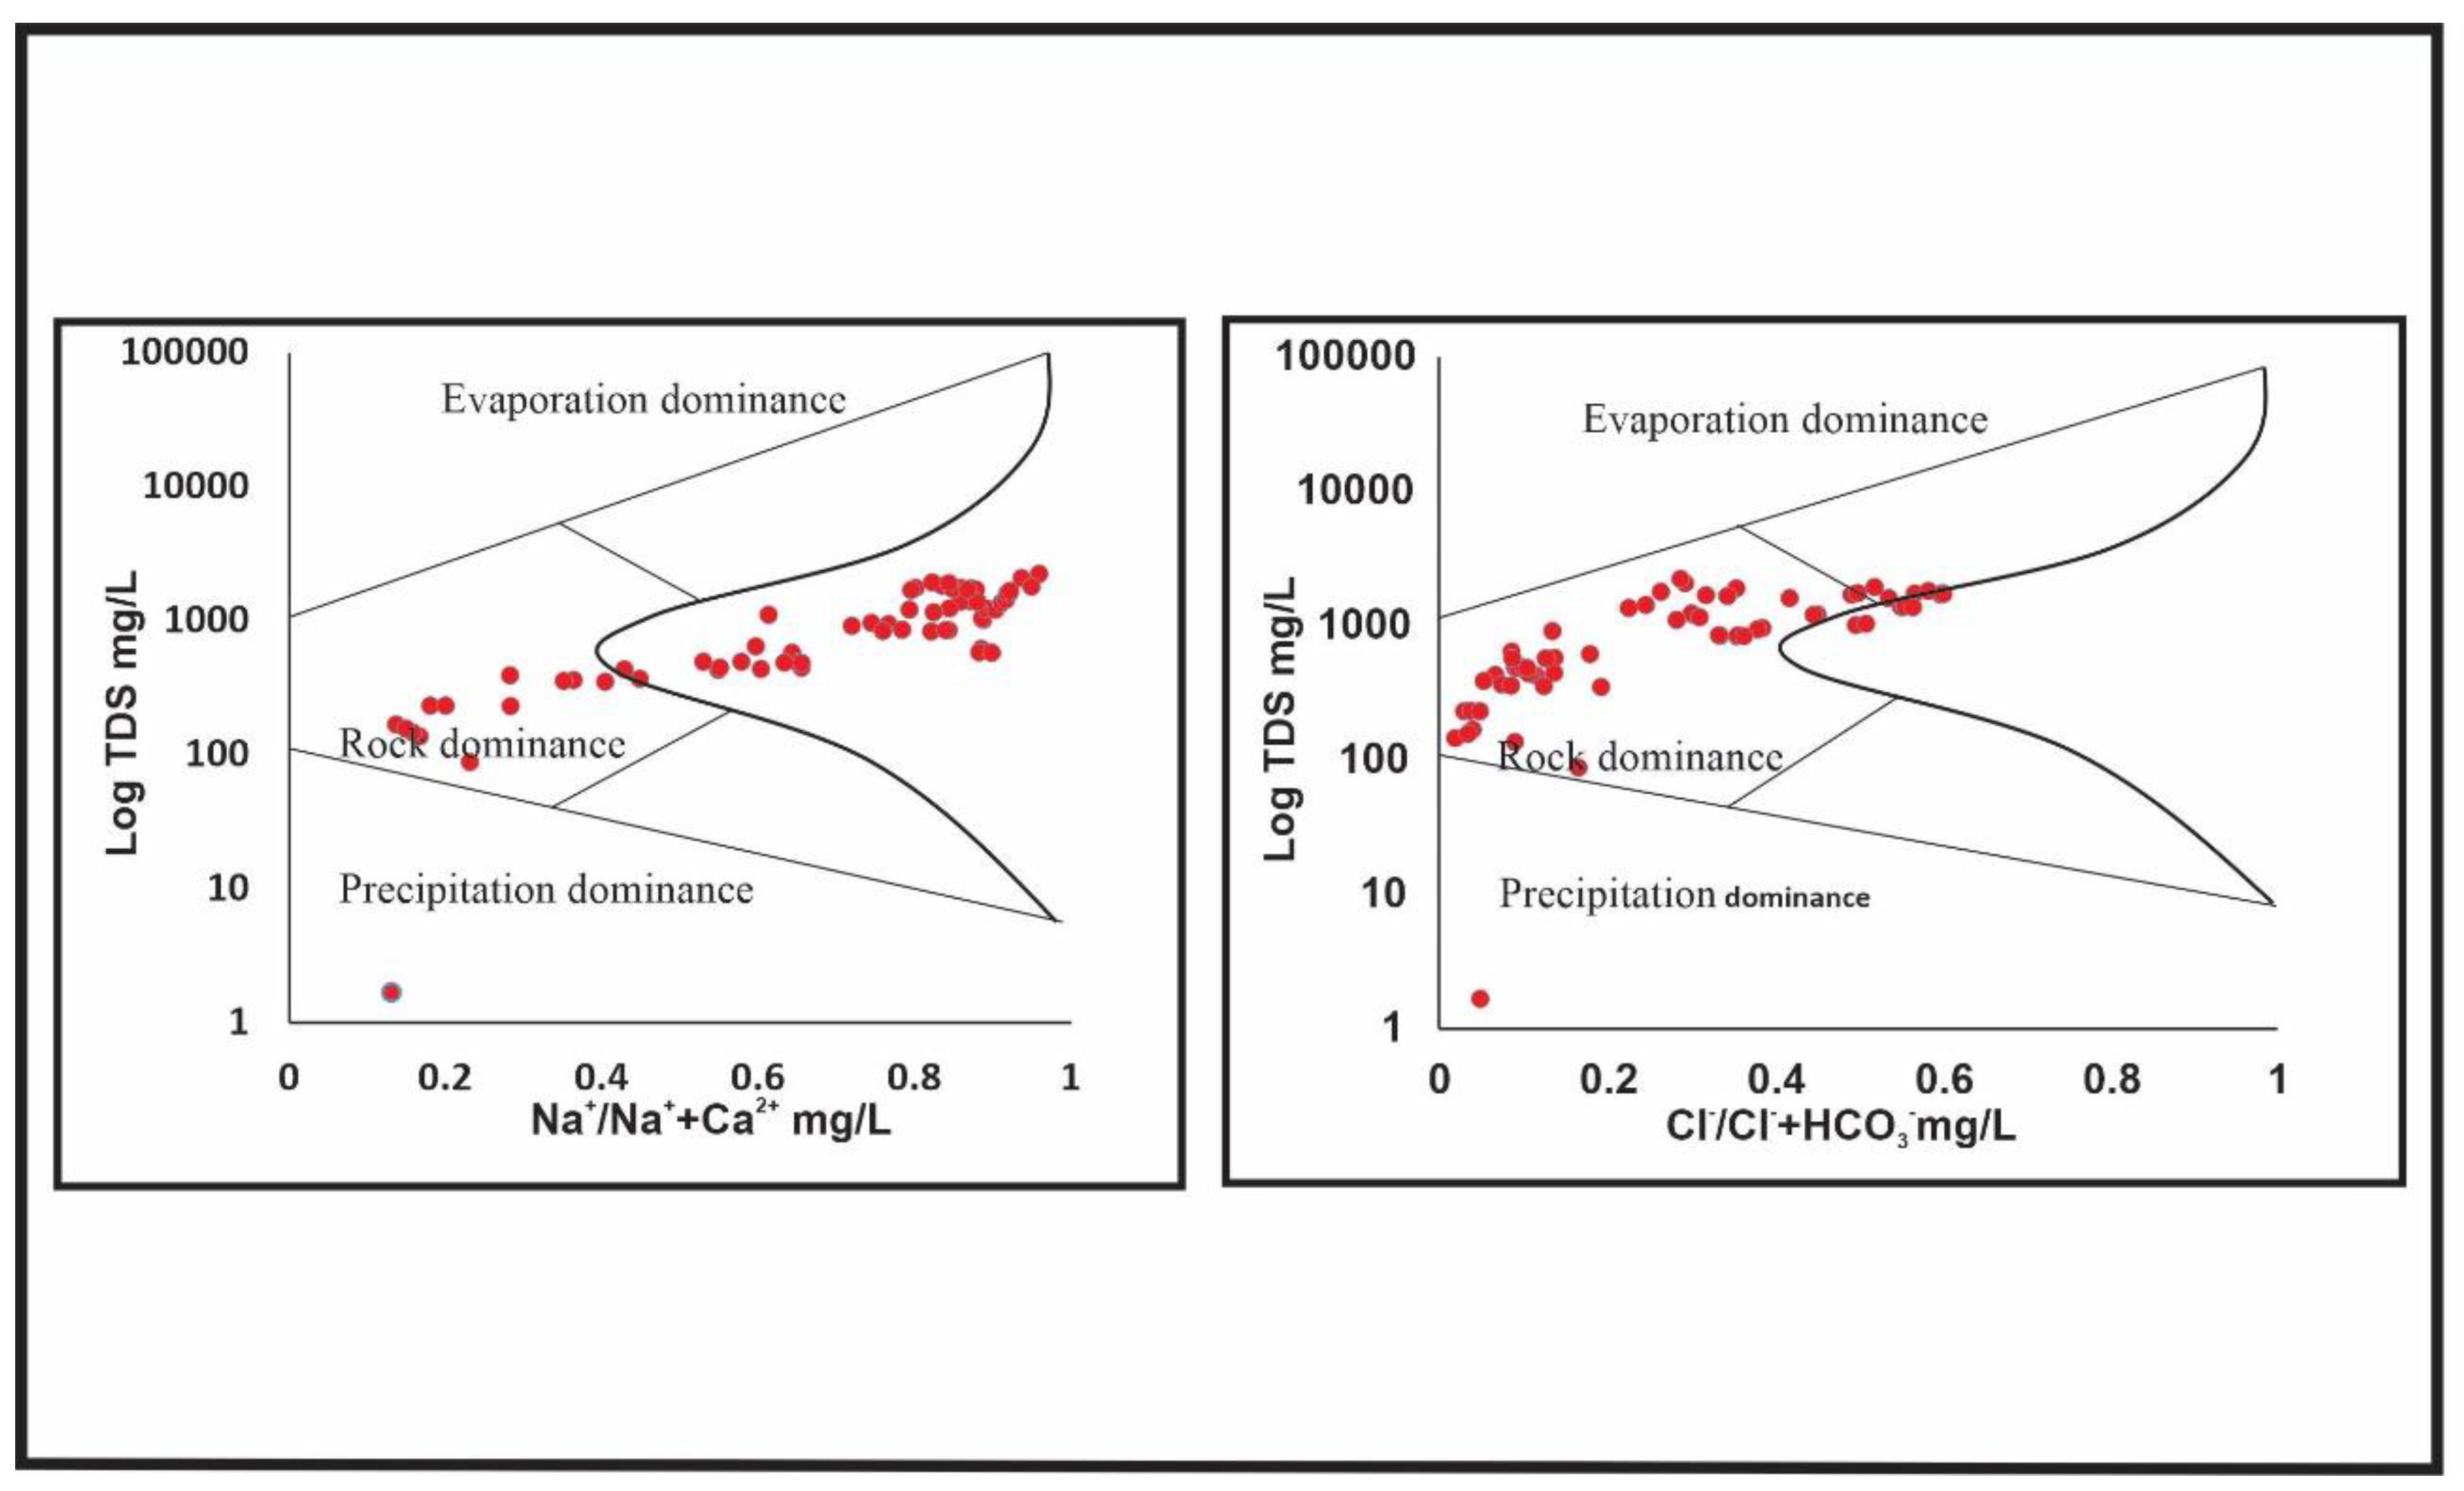
4.2.2. Groundwater Chemistry Controlling Mechanisms
- (1)
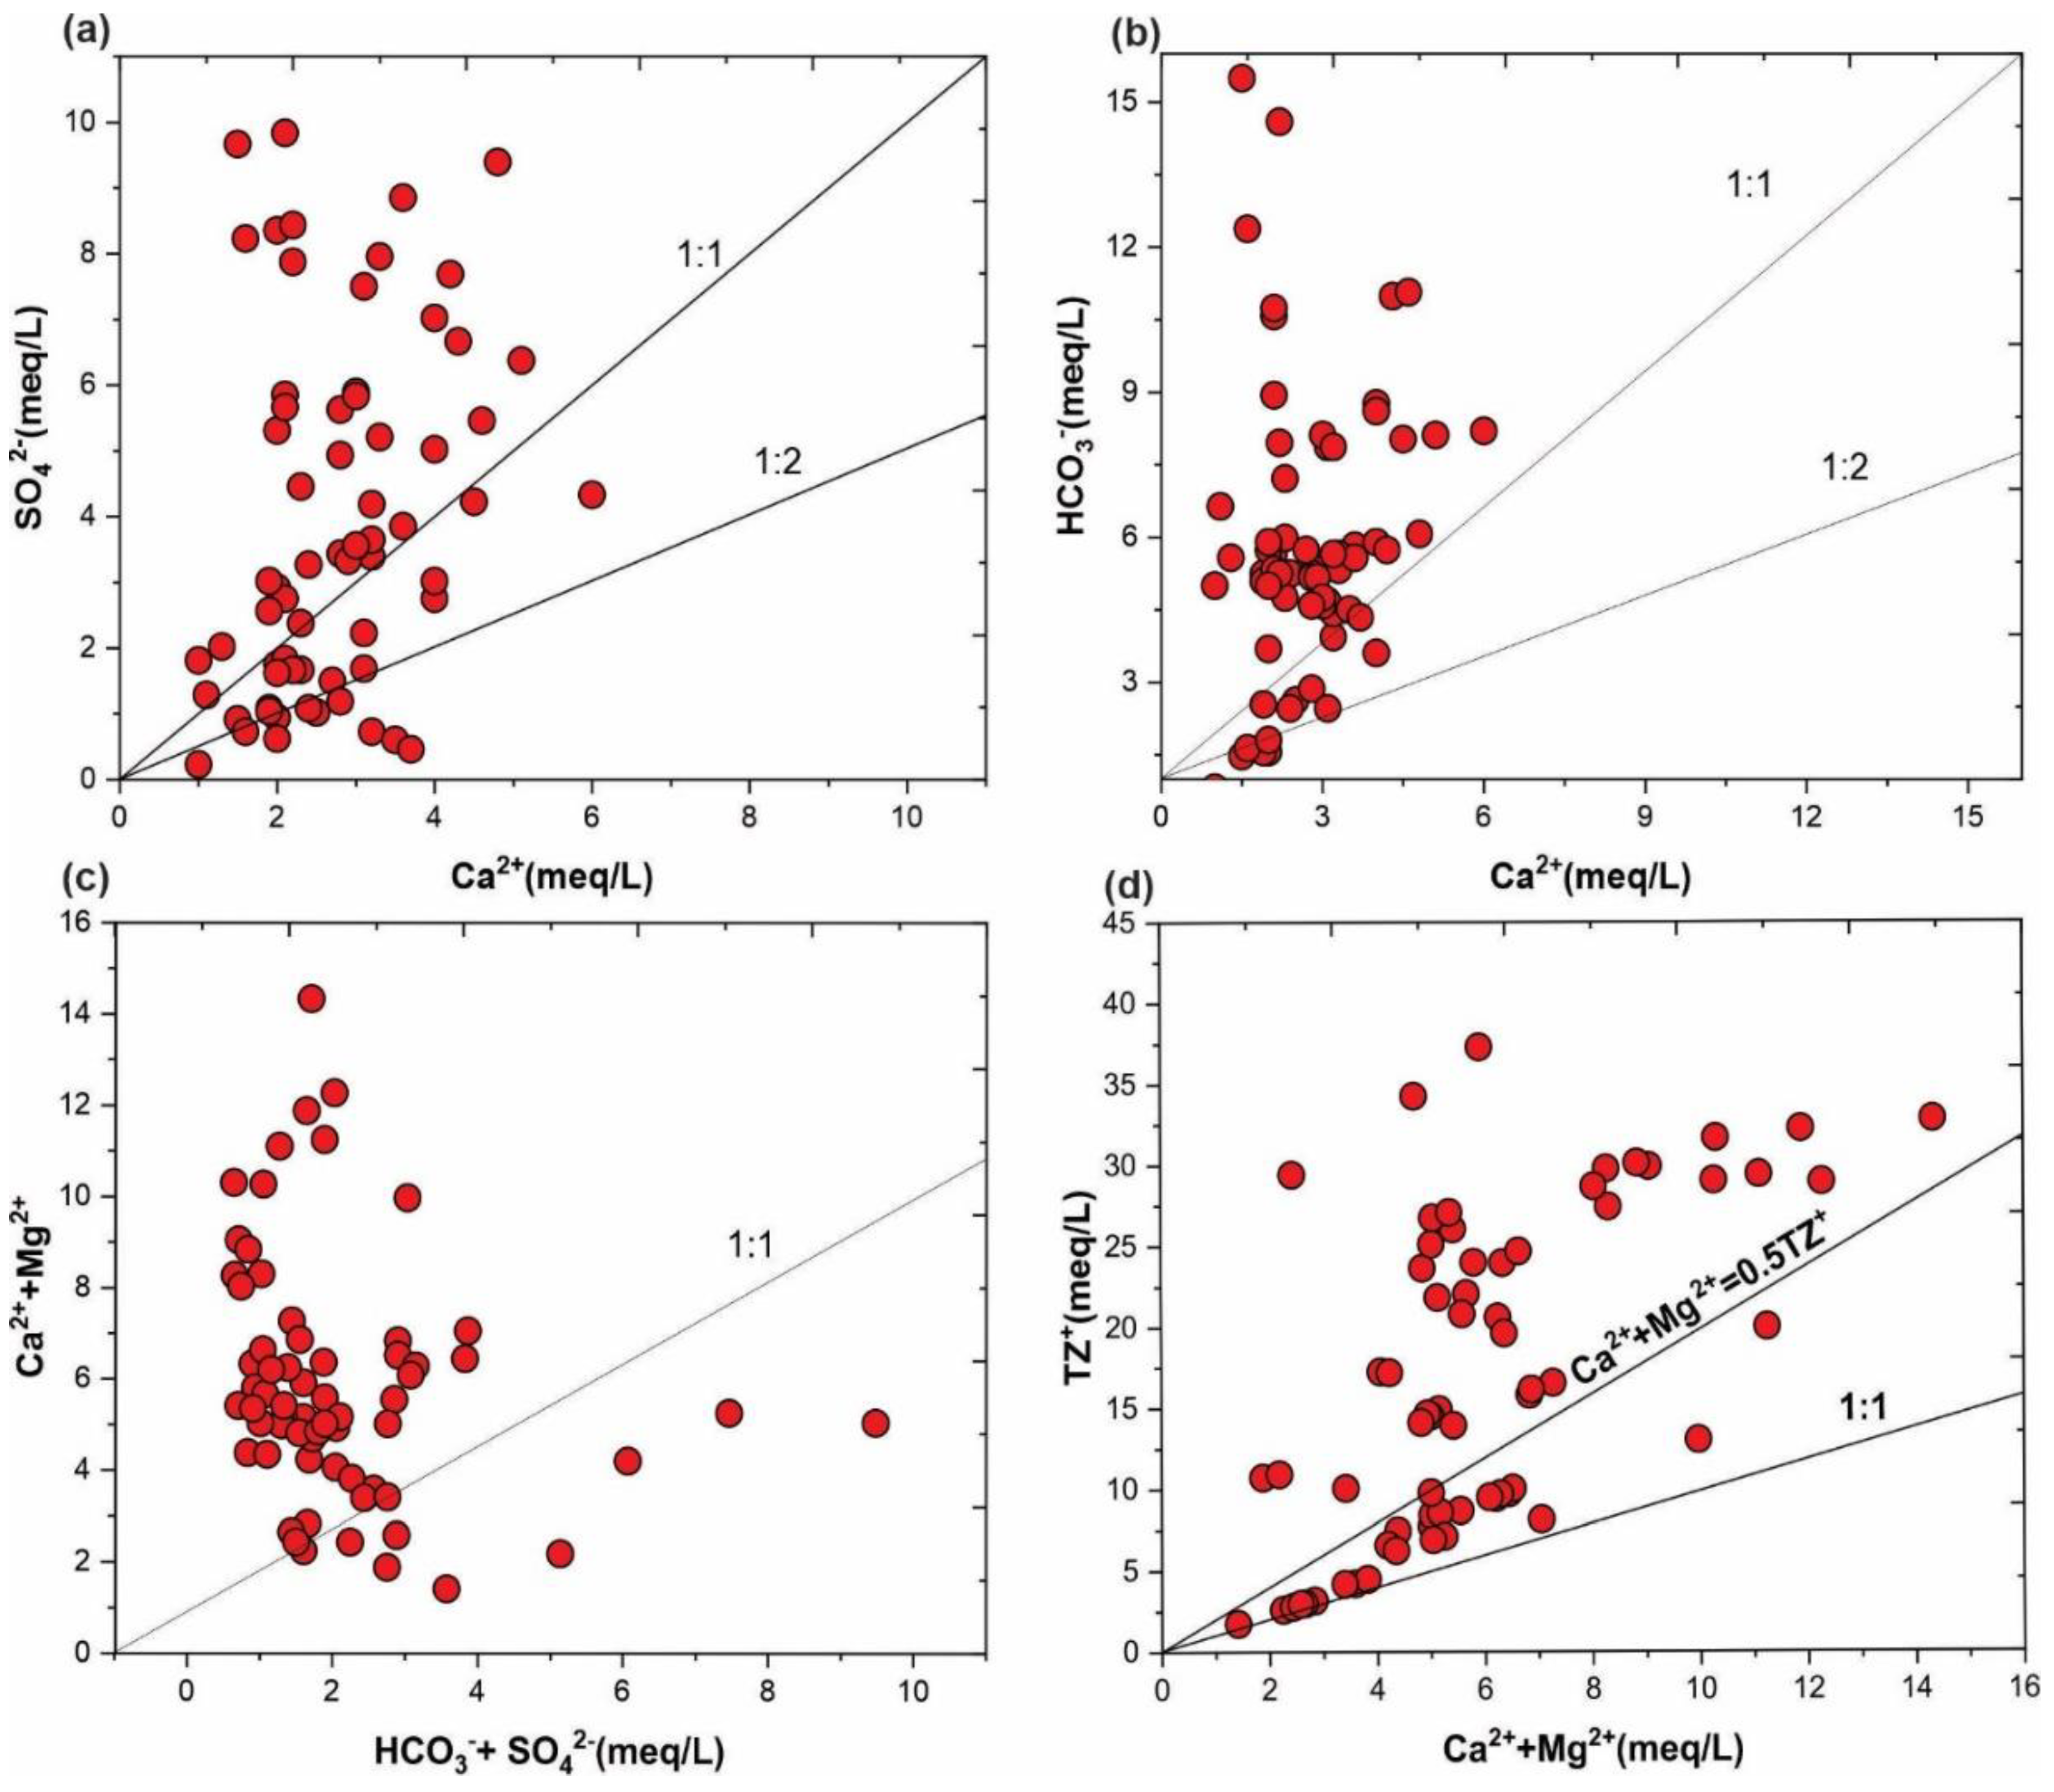
- Silicate Weathering
- (2)
- Carbonate Weathering and Dissolution
- (3)
- Evaporation
5. Multivariate Statistical Analysis
5.1. Pearson’s Correlation Analysis
5.2. Principal Component Analysis
5.3. Hierarchical Cluster Analysis (HCA)
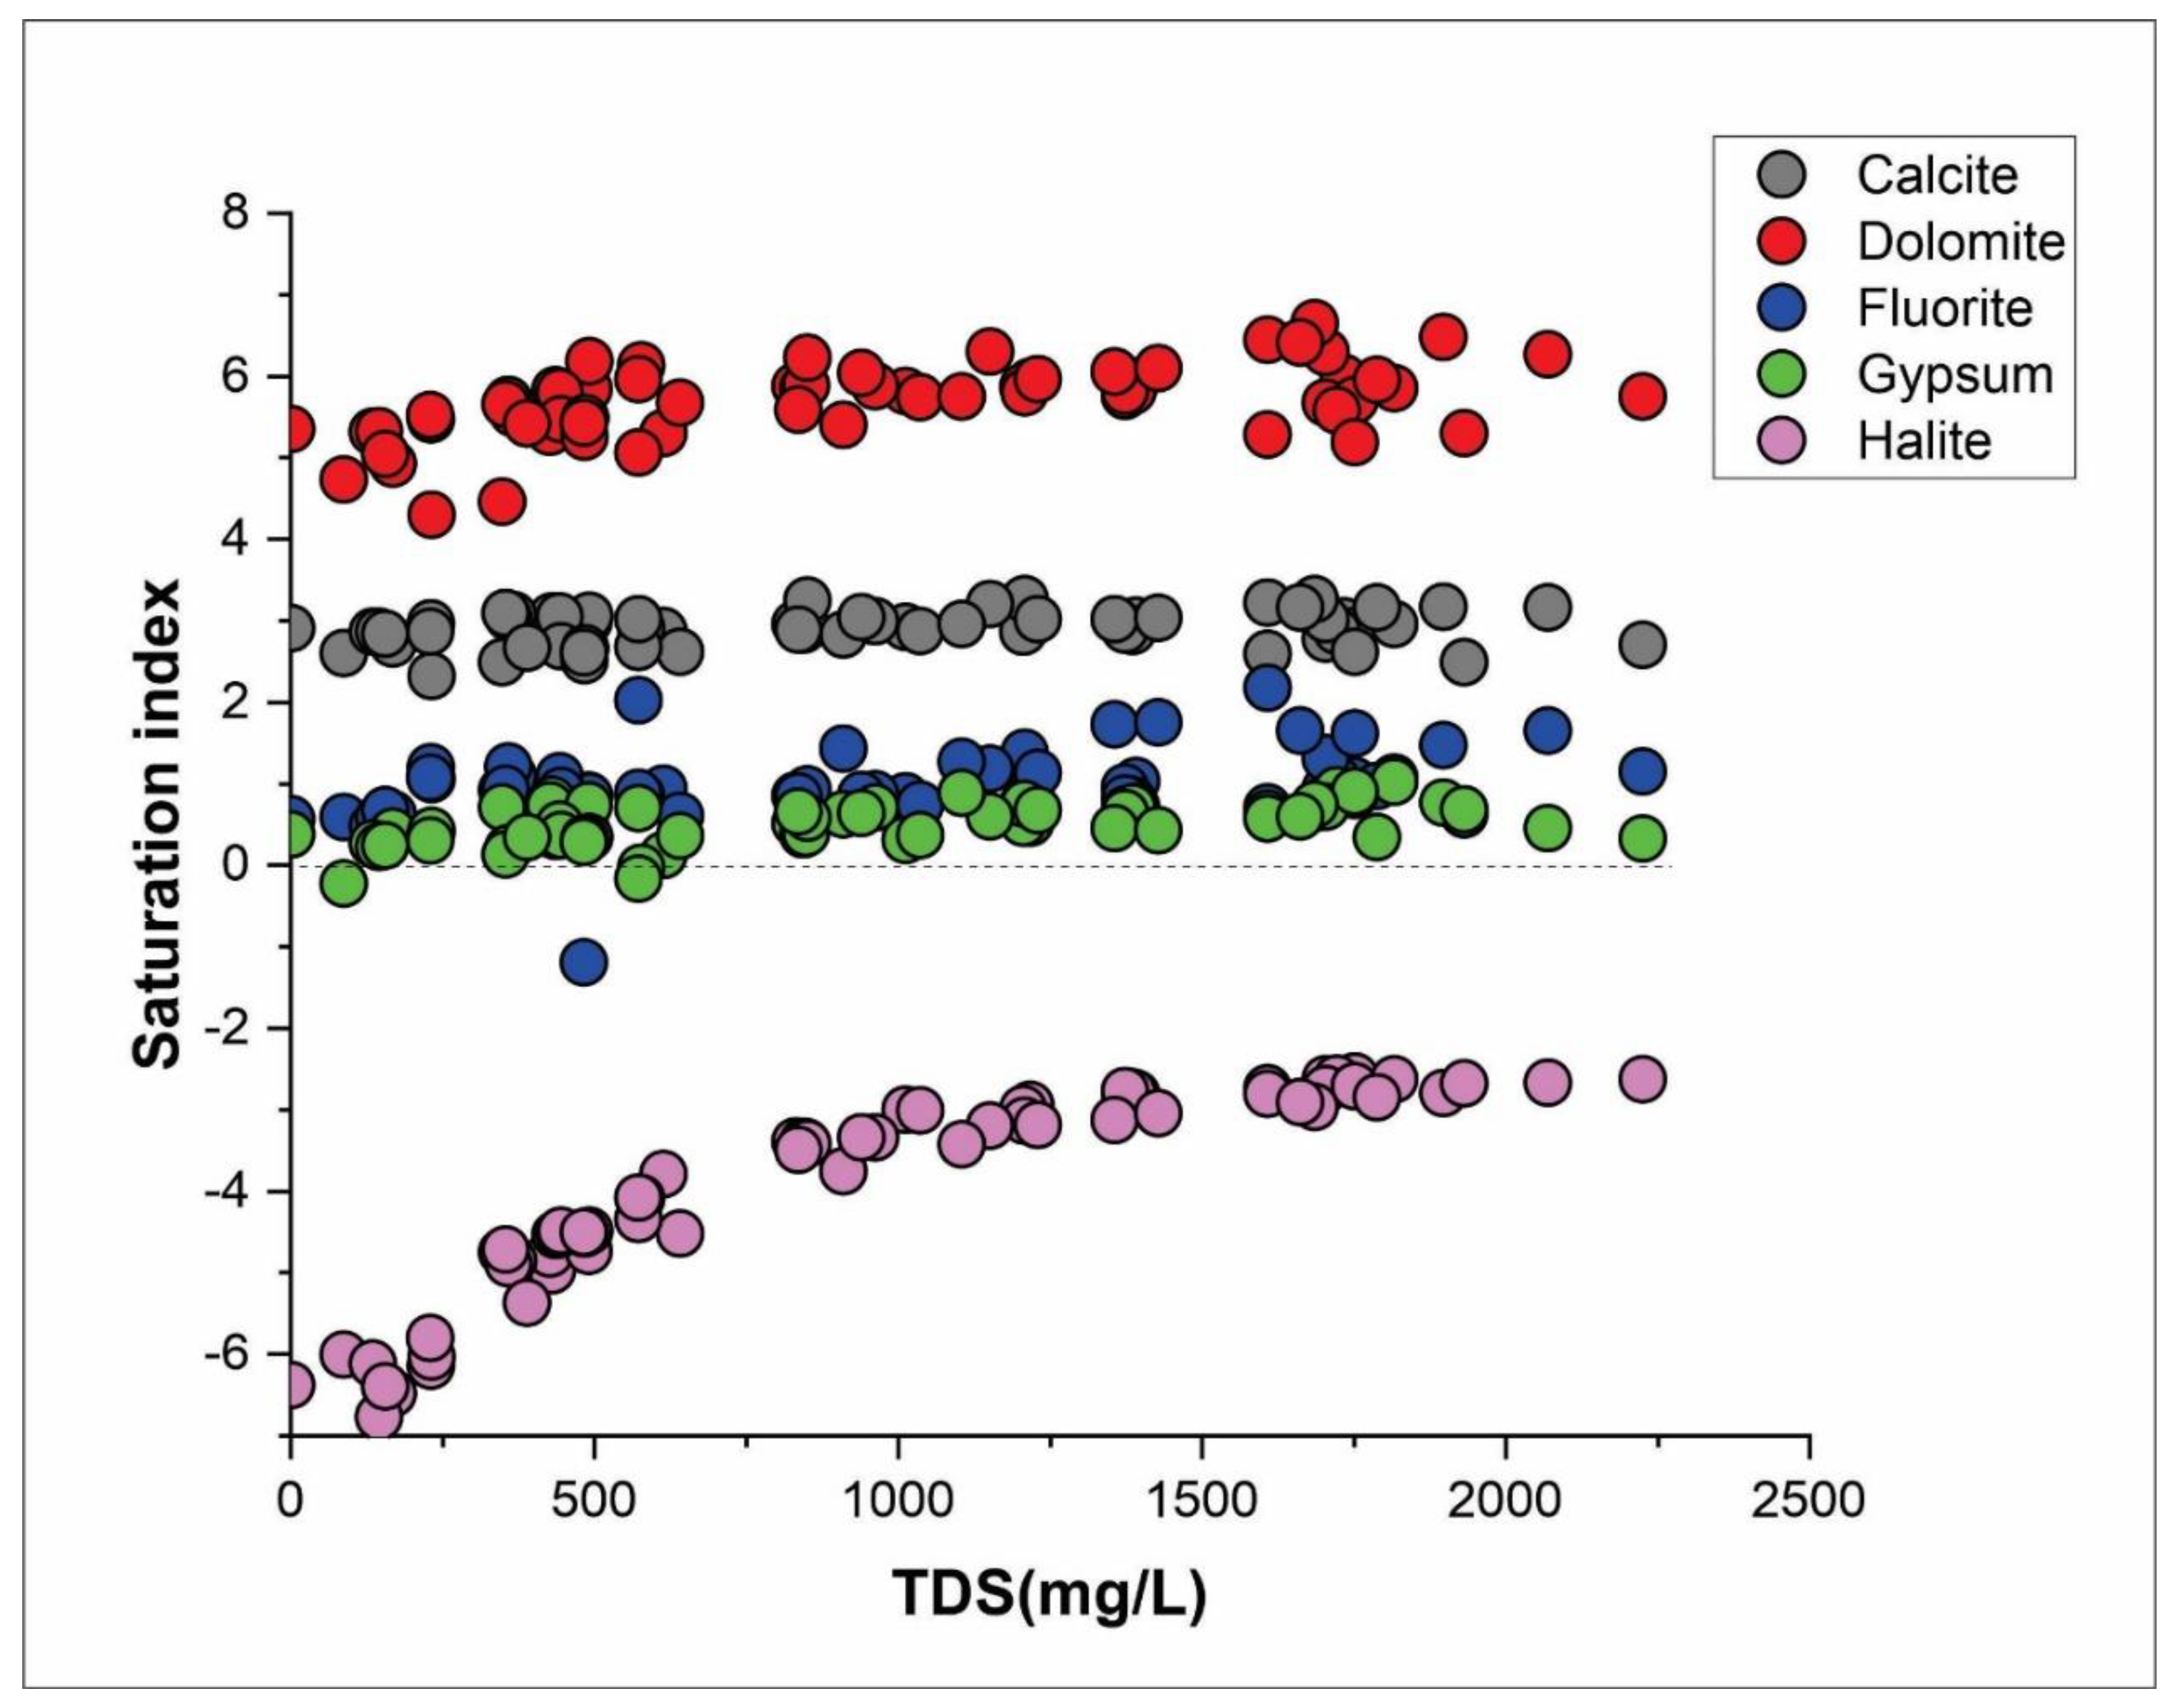
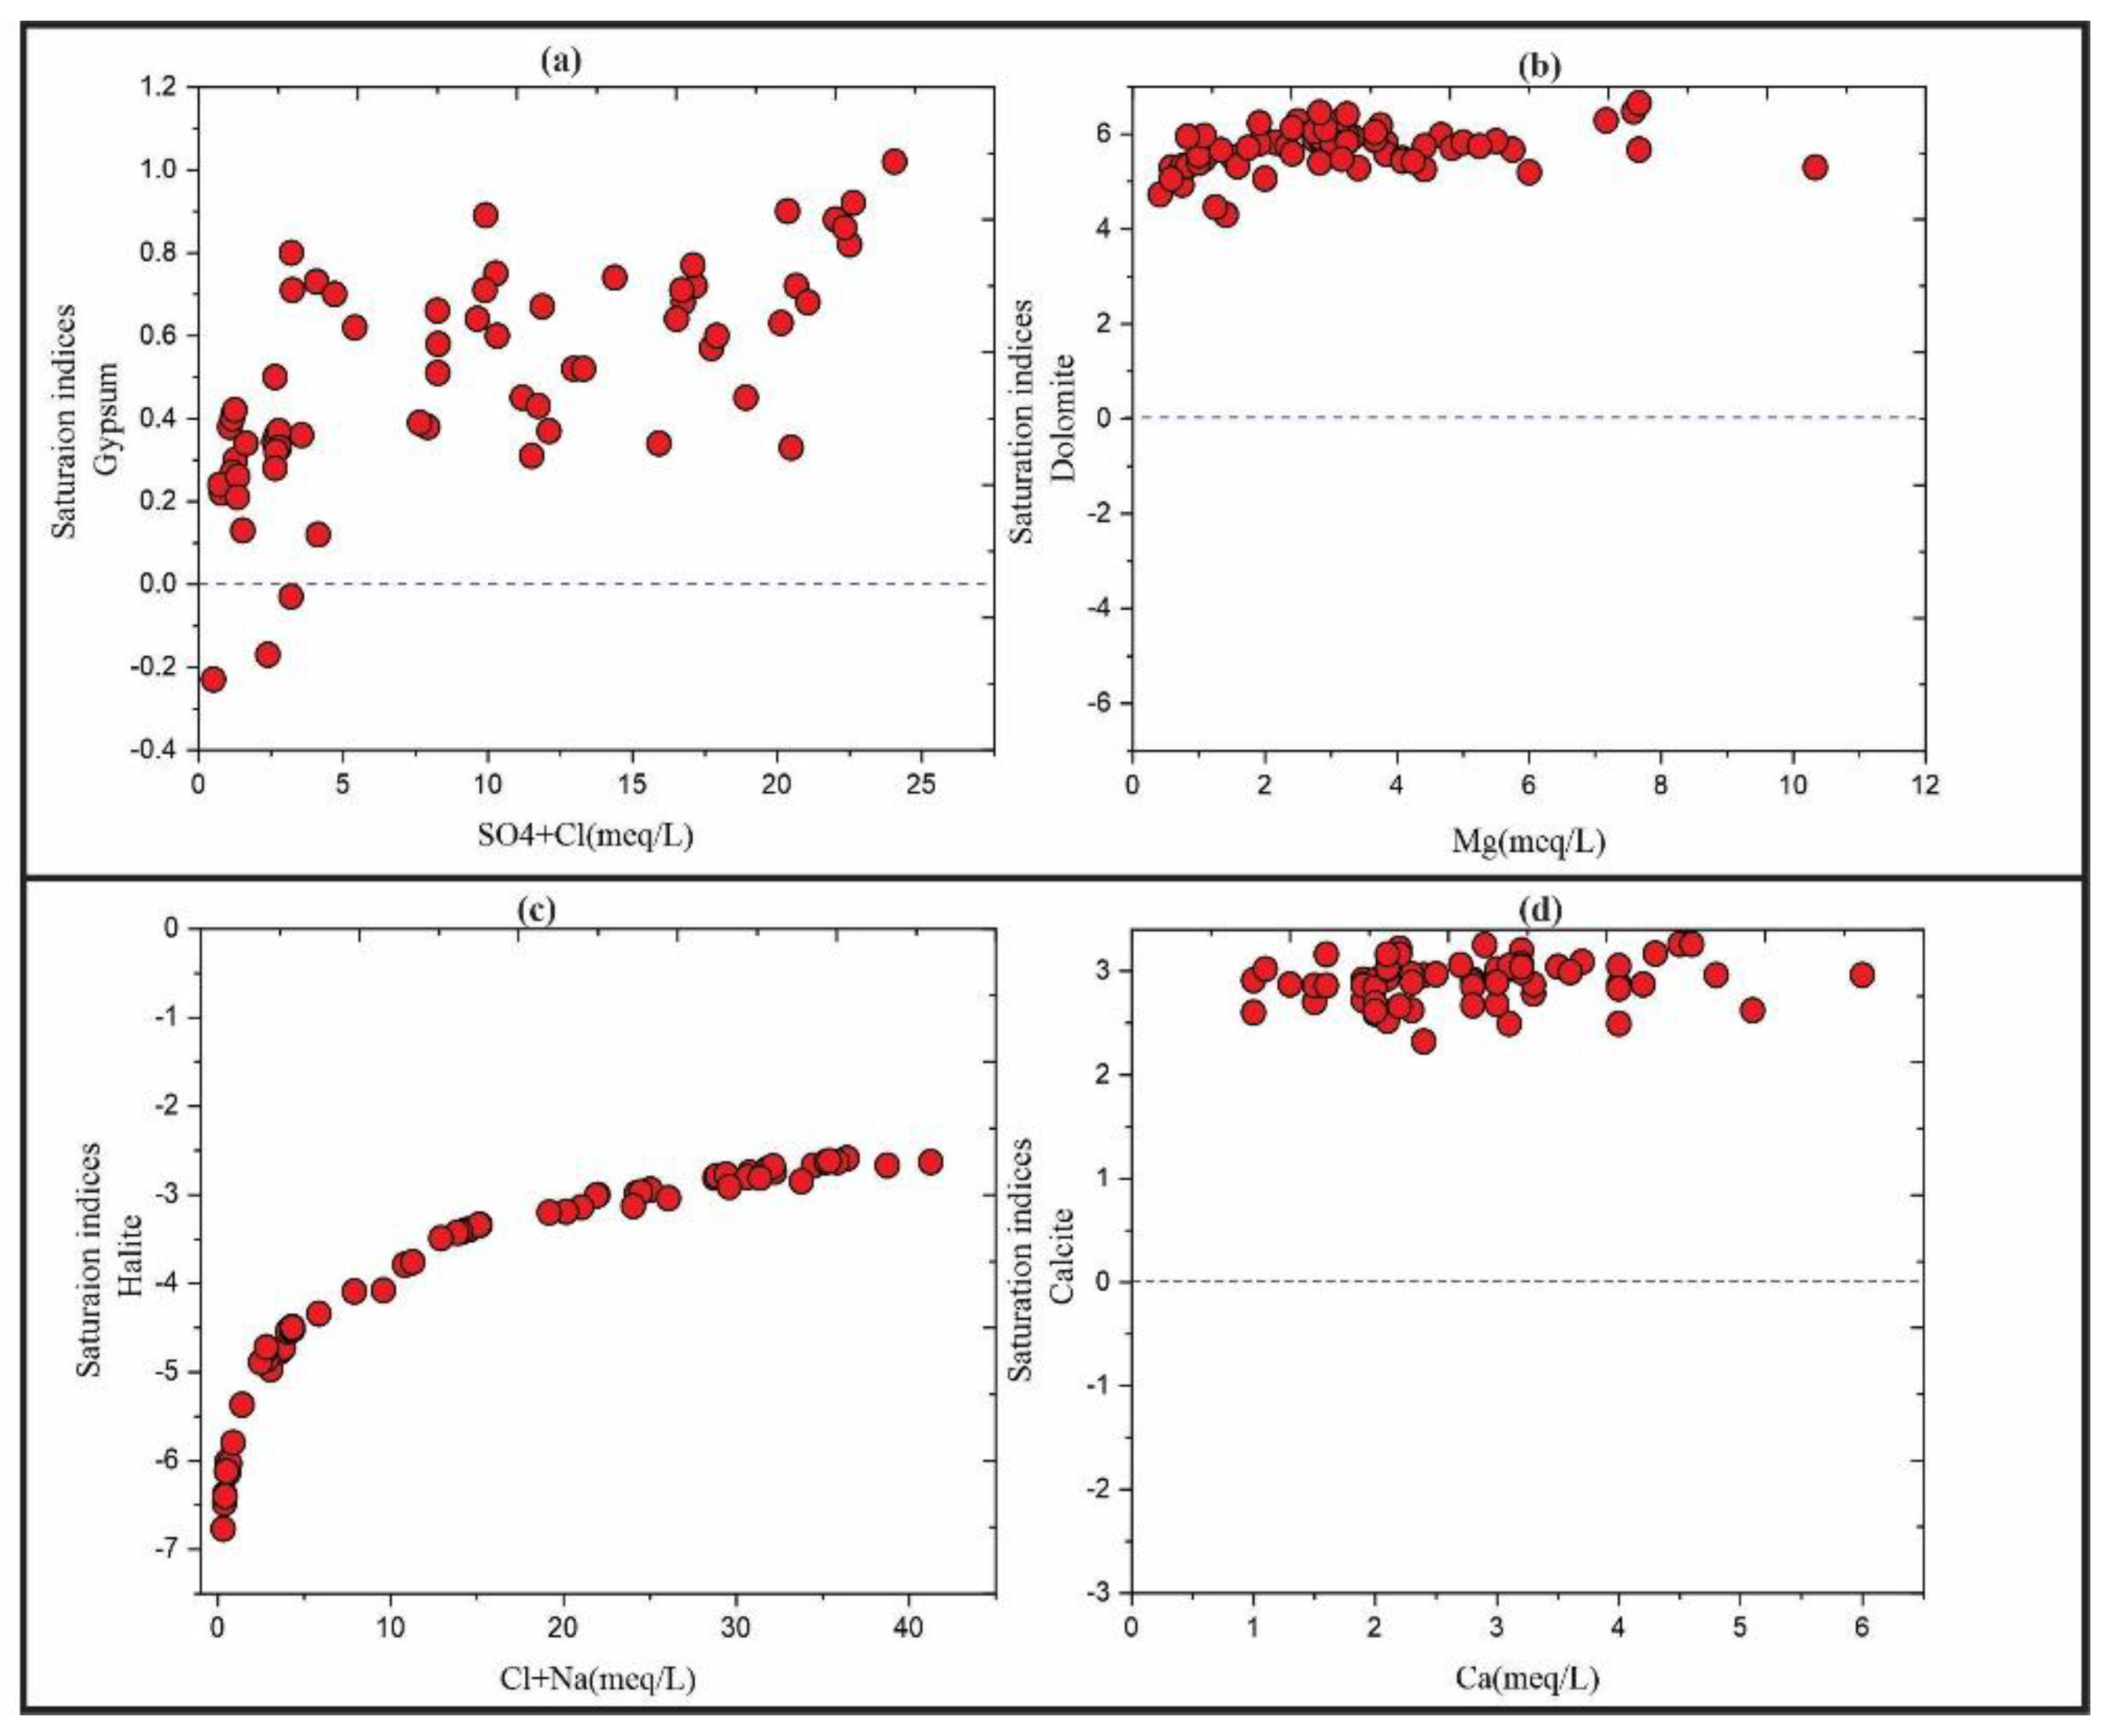
6. Geochemical Modeling
6.1. Mineral Saturation Index
6.2. Ion Exchange
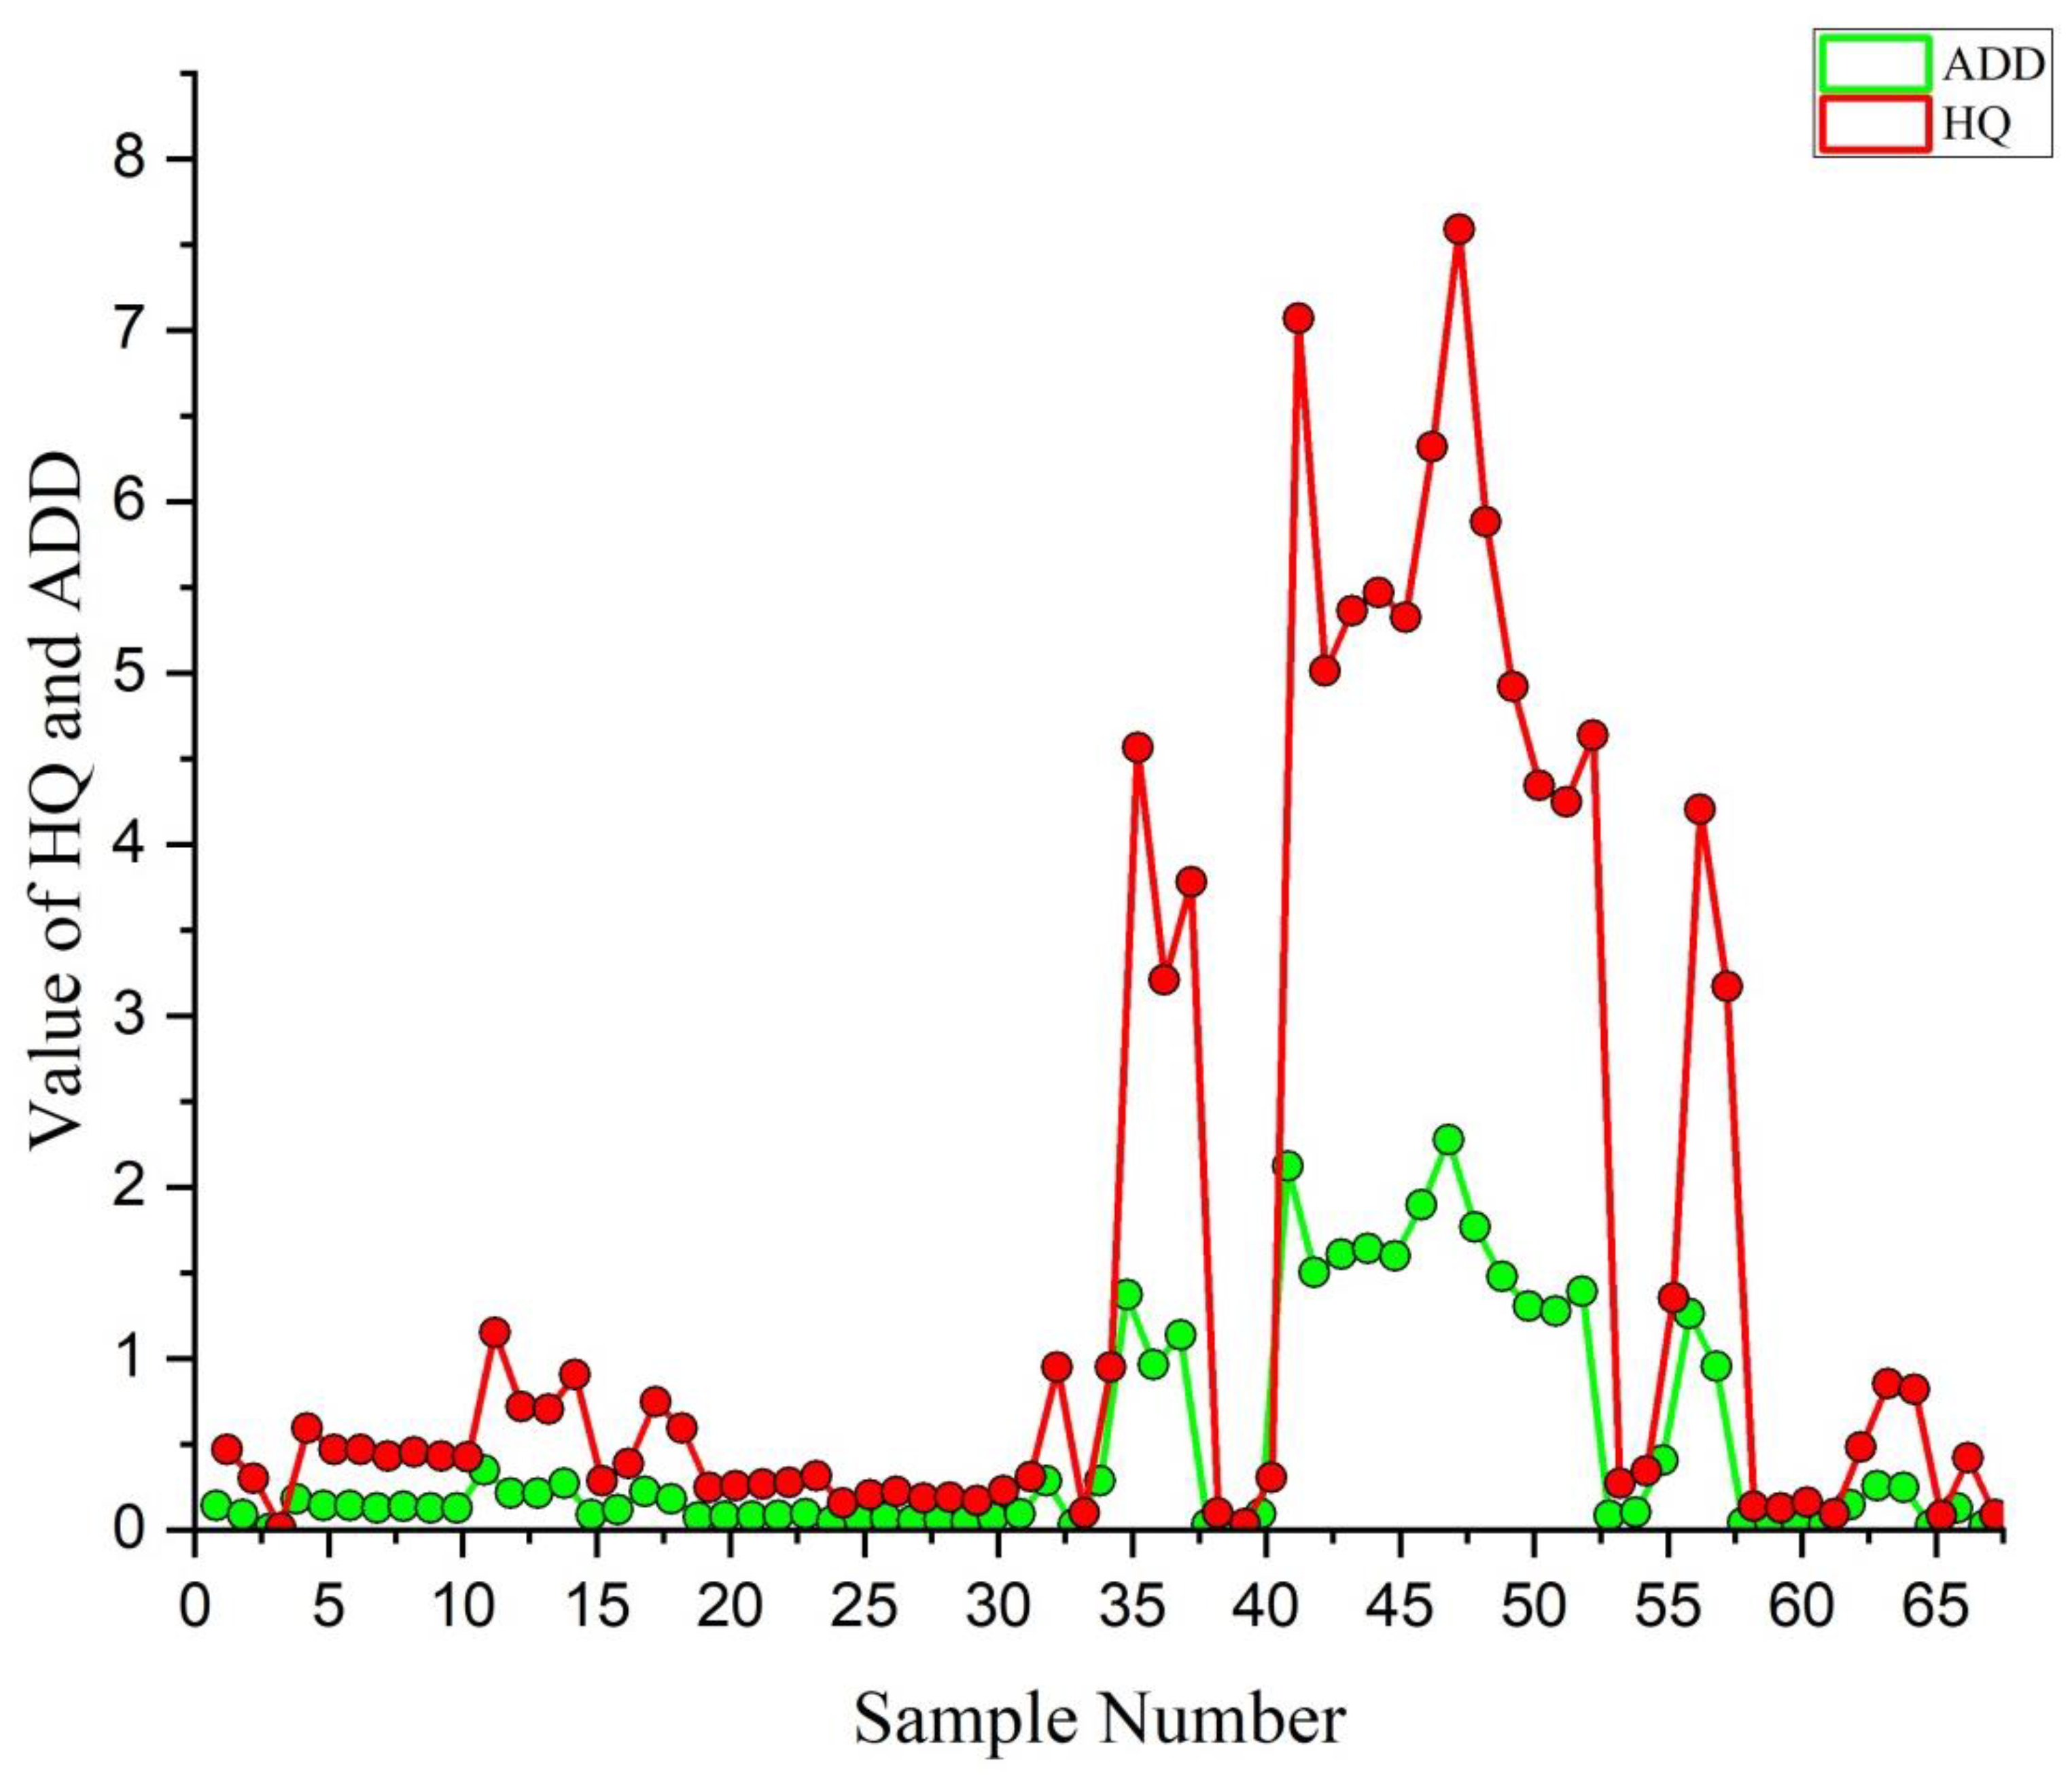
7. Health Risk Assessment
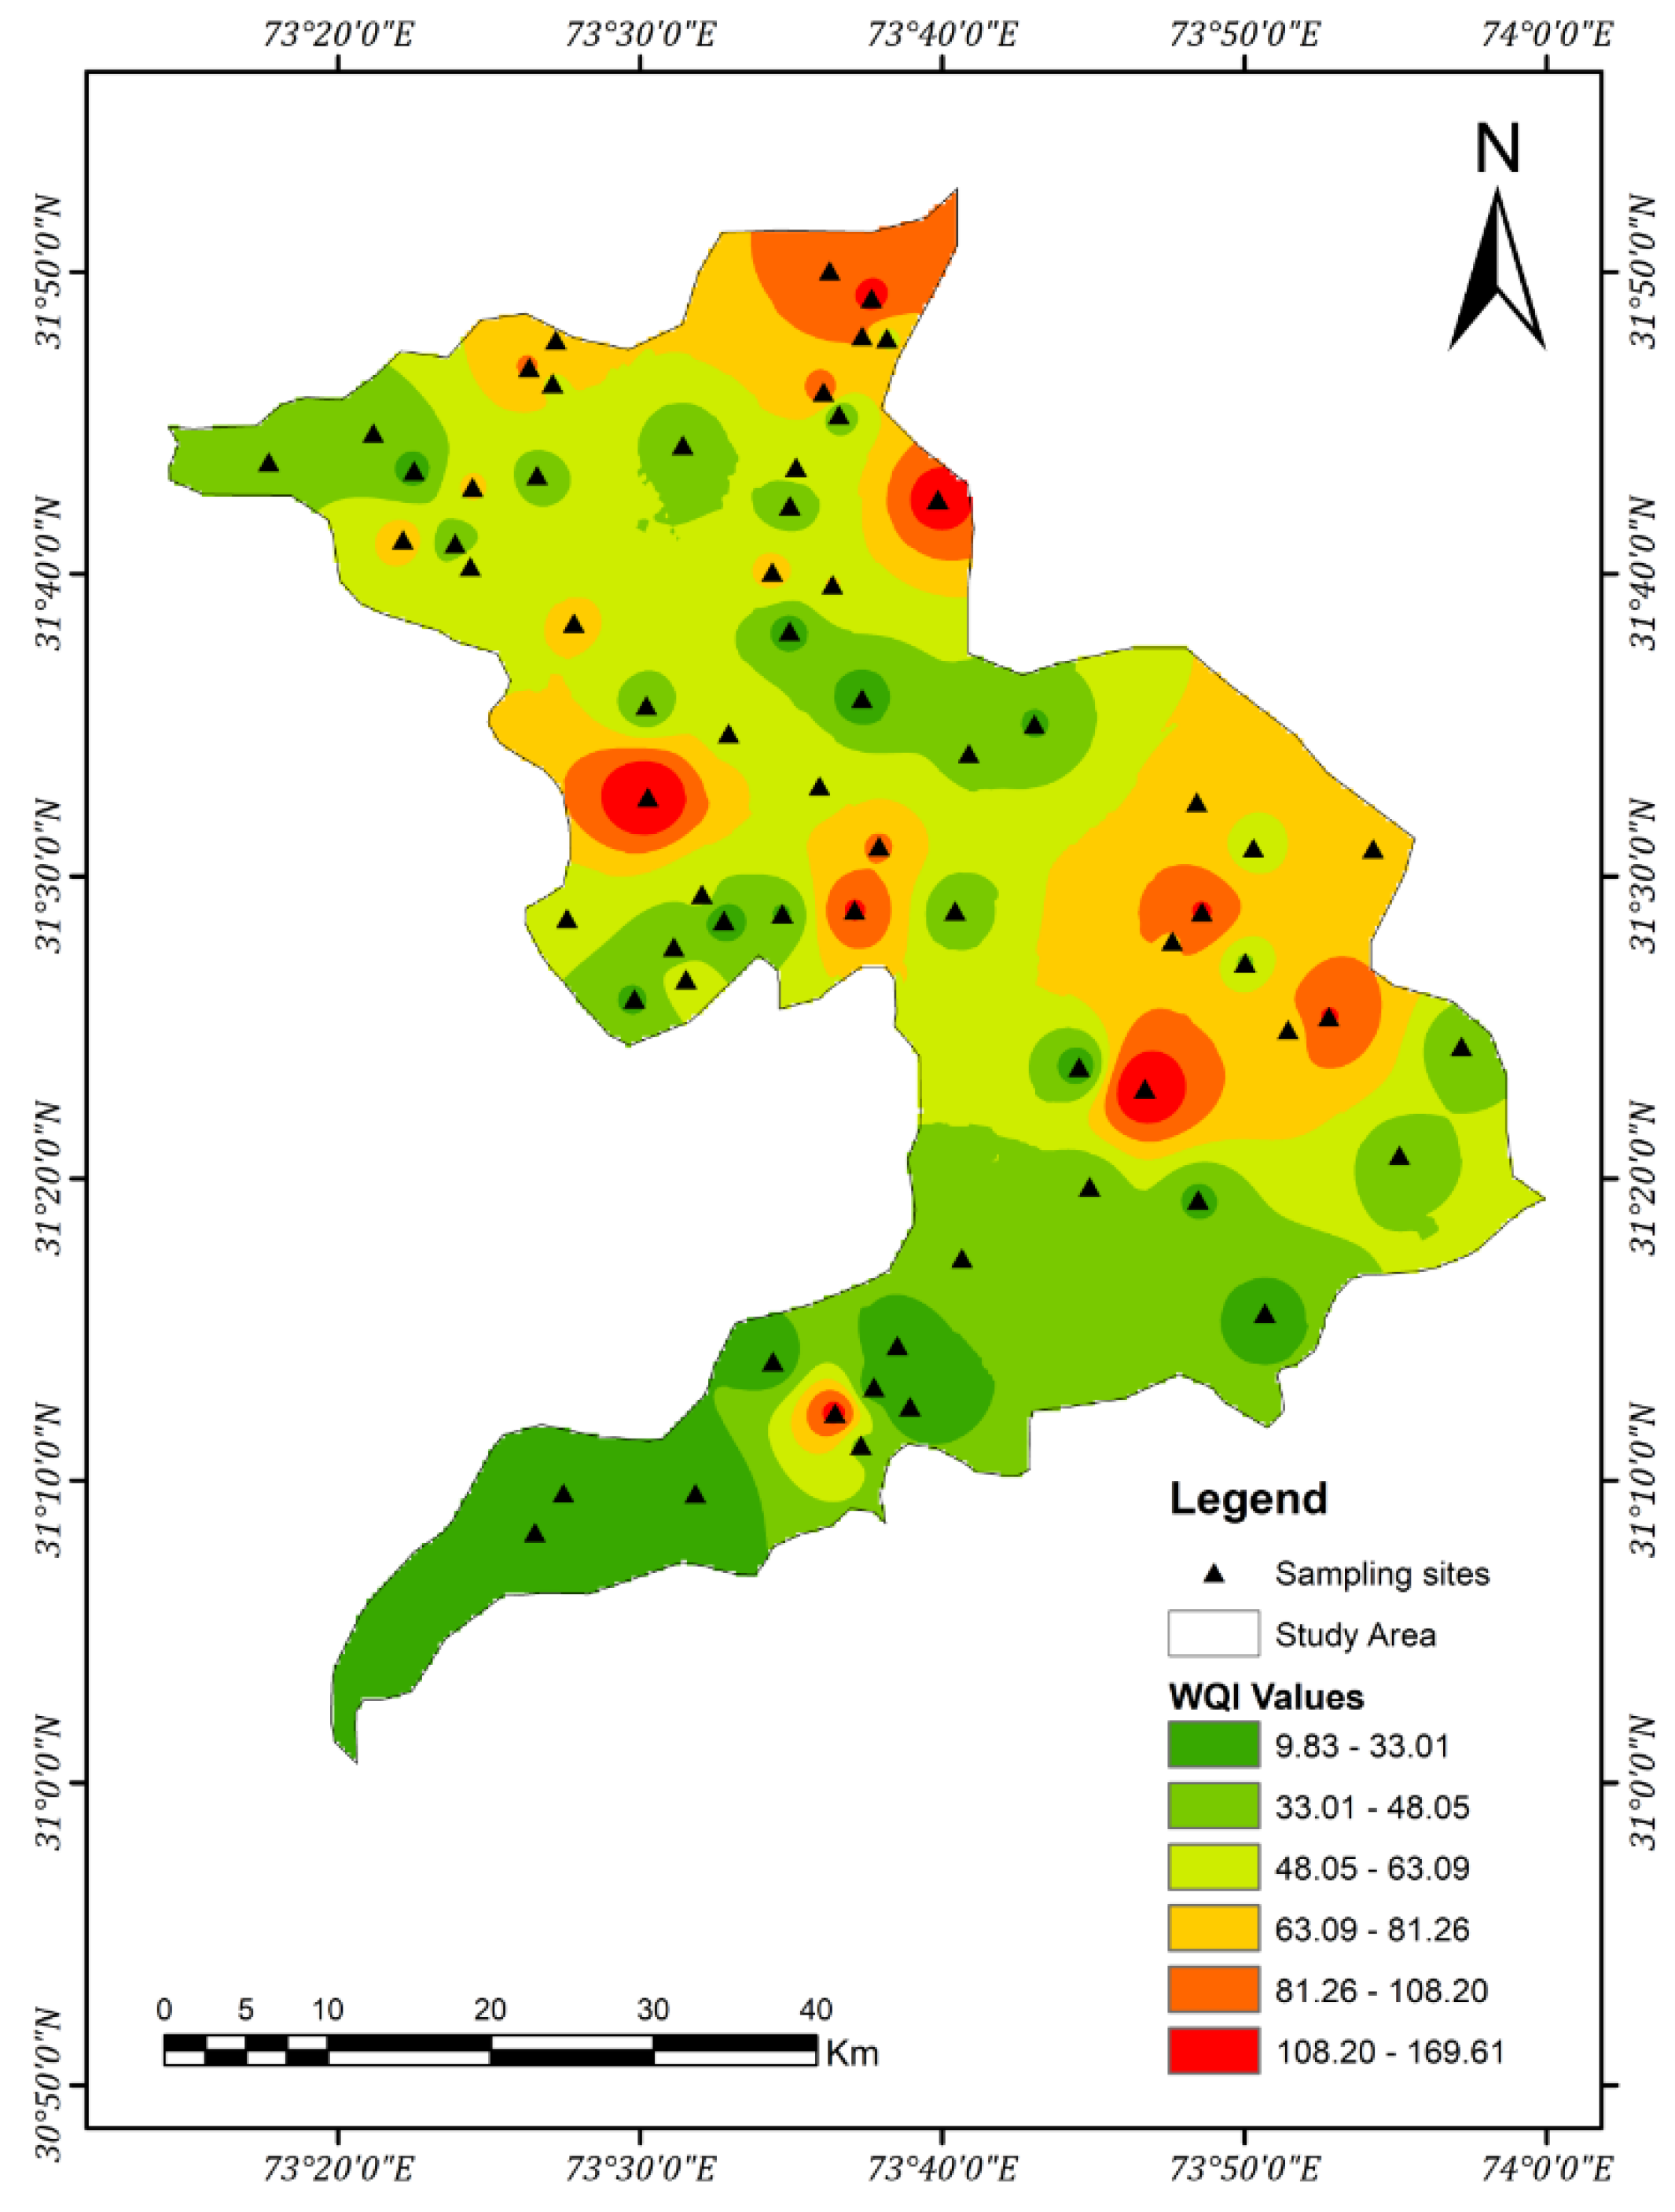
8. Water Quality Index
9. Conclusions
Author Contributions
Funding
Data Availability Statement
Acknowledgments
Conflicts of Interest
References
- Barbier, E. A Global Crisis in Water Management. In The Water Paradox; Yale University Press: New Haven, CT, USA, 2019; pp. 89–109. [Google Scholar]
- Anderson, M.P.; Cherry, J.A. Using models to simulate the movement of contaminants through groundwater flow systems. Crit. Rev. Environ. Sci. Technol. 1979, 9, 97–156. [Google Scholar] [CrossRef]
- Medici, G.; West, L.J. Groundwater flow velocities in karst aquifers; importance of spatial observation scale and hydraulic testing for contaminant transport prediction. Environ. Sci. Pollut. Res. 2021, 28, 43050–43063. [Google Scholar] [CrossRef]
- Mackay, D.M.; Cherry, J.A. Groundwater contamination: Pump-and-treat remediation. Environ. Sci. Technol. 1989, 23, 630–636. [Google Scholar] [CrossRef]
- Bodrud-Doza, M.; Bhuiyan, M.A.H.; Islam, S.D.-U.; Rahman, M.S.; Haque, M.M.; Fatema, K.J.; Ahmed, N.; Rakib, M.; Rahman, M.A. Hydrogeochemical investigation of groundwater in Dhaka City of Bangladesh using GIS and multivariate statistical techniques. Groundw. Sustain. Dev. 2019, 8, 226–244. [Google Scholar] [CrossRef]
- Chen, Y.N.; Ding, L.C.; Liu, C.H. Review of the treatment of water containing arsenic. Appl. Mech. Mater. 2013, 260–261, 1162–1166. [Google Scholar] [CrossRef]
- Tapia, J.; Schneider, B.; Inostroza, M.; Álvarez-Amado, F.; Luque, J.; Aguilera, F.; Parra, S.; Bravo, M. Naturally elevated arsenic in the Altiplano-Puna, Chile and the link to recent (Mio-Pliocene to Quaternary) volcanic activity, high crustal thicknesses, and geological structures. J. S. Am. Earth Sci. 2021, 105, 102905. [Google Scholar] [CrossRef]
- Mukherjee, A.; Bhattacharya, P.; Shi, F.; Fryar, A.E.; Mukherjee, A.B.; Xie, Z.M.; Jacks, G.; Bundschuh, J. Chemical evolution in the high arsenic groundwater of the Huhhot basin (Inner Mongolia, PR China) and its difference from the western Bengal basin (India). Appl. Geochem. 2009, 24, 1835–1851. [Google Scholar] [CrossRef]
- Sohrabi, N.; Kalantari, N.; Amiri, V.; Saha, N.; Berndtsson, R.; Bhattacharya, P.; Ahmad, A. A probabilistic-deterministic analysis of human health risk related to the exposure to potentially toxic elements in groundwater of Urmia coastal aquifer (NW of Iran) with a special focus on arsenic speciation and temporal variation. Stoch. Environ. Res. Risk Assess. 2021, 35, 1509–1528. [Google Scholar] [CrossRef]
- Ahmad, A.; Bhattacharya, P. Arsenic in drinking water: Is 10 μg/L a safe limit? Curr. Pollut. Rep. 2019, 5, 1–3. [Google Scholar] [CrossRef] [Green Version]
- Mandal, B.K.; Suzuki, K.T. Arsenic round the world: A review. Talanta 2002, 58, 201–235. [Google Scholar] [CrossRef] [PubMed]
- Skála, J.; Vácha, R.; Čechmánková, J. Evaluation of arsenic occurrence in agricultural soils of the Bohemian Forest region. Silva Gabreta 2011, 17, 55–67. [Google Scholar]
- Saha, S.; Reza, A.; Roy, M.K. Arsenic geochemistry of the sediments of the shallow aquifer and its correlation with the groundwater, Rangpur, Bangladesh. Appl. Water Sci. 2021, 11, 166. [Google Scholar] [CrossRef]
- Smedley, P.L.; Kinniburgh, D.G. A review of the source, behaviour and distribution of arsenic in natural waters. Appl. Geochem. 2002, 17, 517–568. [Google Scholar] [CrossRef] [Green Version]
- Iqbal, J.; Su, C.; Rashid, A.; Yang, N.; Baloch, M.Y.J.; Talpur, S.A.; Ullah, Z.; Rahman, G.; Rahman, N.U.; Sajjad, M.M. Hydrogeochemical assessment of groundwater and suitability analysis for domestic and agricultural utility in Southern Punjab, Pakistan. Water 2021, 13, 3589. [Google Scholar] [CrossRef]
- Jat Baloch, M.Y.; Zhang, W.; Zhang, D.; Al Shoumik, B.A.; Iqbal, J.; Li, S.; Chai, J.; Farooq, M.A.; Parkash, A. Evolution Mechanism of Arsenic Enrichment in Groundwater and Associated Health Risks in Southern Punjab, Pakistan. Int. J. Environ. Res. Public Health 2022, 19, 13325. [Google Scholar] [CrossRef] [PubMed]
- Shahid, M.; Niazi, N.K.; Dumat, C.; Naidu, R.; Khalid, S.; Rahman, M.M.; Bibi, I. A meta-analysis of the distribution, sources and health risks of arsenic-contaminated groundwater in Pakistan. Environ. Pollut. 2018, 242, 307–319. [Google Scholar] [CrossRef]
- Fatima, S.; Hussain, I.; Rasool, A.; Xiao, T.; Farooqi, A. Comparison of two alluvial aquifers shows the probable role of river sediments on the release of arsenic in the groundwater of district Vehari, Punjab, Pakistan. Environ. Earth Sci. 2018, 77, 382. [Google Scholar] [CrossRef]
- Ullah, Z.; Rashid, A.; Ghani, J.; Talib, M.A.; Shahab, A.; Lun, L. Arsenic Contamination, Water Toxicity, Source Apportionment, and Potential Health Risk in Groundwater of Jhelum Basin, Punjab, Pakistan. Biol. Trace Elem. Res. 2022, M78, 1–11. [Google Scholar] [CrossRef] [PubMed]
- Memon, M.; Soomro, M.S.; Akhtar, M.S.; Memon, K.S. Drinking water quality assessment in Southern Sindh (Pakistan). Environ. Monit. Assess. 2011, 177, 39–50. [Google Scholar] [CrossRef] [PubMed]
- Mushtaq, N.; Younas, A.; Mashiatullah, A.; Javed, T.; Ahmad, A.; Farooqi, A. Hydrogeochemical and isotopic evaluation of groundwater with elevated arsenic in alkaline aquifers in Eastern Punjab, Pakistan. Chemosphere 2018, 200, 576–586. [Google Scholar] [CrossRef] [PubMed]
- Ullah, Z.; Xu, Y.; Zeng, X.-C.; Rashid, A.; Ali, A.; Iqbal, J.; Almutairi, M.H.; Aleya, L.; Abdel-Daim, M.M.; Shah, M. Non-Carcinogenic Health Risk Evaluation of Elevated Fluoride in Groundwater and Its Suitability Assessment for Drinking Purposes Based on Water Quality Index. Int. J. Environ. Res. Public Health 2022, 19, 9071. [Google Scholar] [CrossRef] [PubMed]
- Shakoor, M.B.; Bibi, I.; Niazi, N.K.; Shahid, M.; Nawaz, M.F.; Farooqi, A.; Naidu, R.; Rahman, M.M.; Murtaza, G.; Lüttge, A. The evaluation of arsenic contamination potential, speciation and hydrogeochemical behaviour in aquifers of Punjab, Pakistan. Chemosphere 2018, 199, 737–746. [Google Scholar] [CrossRef] [PubMed]
- Shabbir, H.; Butt, N.A.; Zafar, A.; Mir, M.K. Role of electrical resistivity method to identify fresh water aquifers in Nankana Sahib, Punjab, Pakistan. J. Himal. Earth Sci. 2020, 53, 52–59. [Google Scholar]
- Nawaz, A.; Farooq, M.; Lal, R.; Rehman, A. Comparison of conventional and conservation rice-wheat systems in Punjab, Pakistan. Soil Tillage Res. 2017, 169, 35–43. [Google Scholar] [CrossRef]
- Ali, A.; Shahbaz, B.; Ashraf, I.; Maqsood, M. A Mixed Method Research to Analyze Fertilizer Sources and Application Methods in Nutrient Stewardship Perspective at Farm Level in Rice-Wheat Cropping Zone of Punjab, Pakistan. J. Agric. Food 2022, 3, 73–84. [Google Scholar]
- Shah, S.H.I.A.; Jianguo, Y.; Jahangir, Z.; Tariq, A.; Aslam, B. Integrated geophysical technique for groundwater salinity delineation, an approach to agriculture sustainability for Nankana Sahib Area, Pakistan. Geomat. Nat. Hazards Risk 2022, 13, 1043–1064. [Google Scholar] [CrossRef]
- Shah, S. Stratigraphy of Pakistan (memoirs of the geological survey of Pakistan). Geol. Surv. Pak. 2009, M 79, 22. [Google Scholar]
- Aftab, S.M.; Maqsood, T.; Hassan, S.; Hannan, A.; Zaidi, A.R.; Tahir, R. Hypothetical geological model affecting groundwater quality in doabs of Indus Basin, Punjab, Pakistan. Int. J. Econ. Environ. Geol. 2018, 9, 1–11. [Google Scholar]
- Shroder, J. Himalaya to the Sea. In Geology, Geomorphology and the Quaternary; Routledge: London, UK, 1993. [Google Scholar]
- Akhter, G.; Ge, Y.; Hasan, M.; Shang, Y. Estimation of Hydrogeological Parameters by Using Pumping, Laboratory Data, Surface Resistivity and Thiessen Technique in Lower Bari Doab (Indus Basin), Pakistan. Appl. Sci. 2022, 12, 3055. [Google Scholar] [CrossRef]
- Greenman, D.W.; Bennett, G.D.; Swarzenski, W.V. Ground-Water Hydrology of the Punjab, West. Pakistan, with Emphasis on Problems Caused by Canal Irrigation; US Government Printing Office: Washington, DC, USA, 1967; Volume 1. [Google Scholar]
- Ghani, J.; Ullah, Z.; Nawab, J.; Iqbal, J.; Waqas, M.; Ali, A.; Almutairi, M.; Peluso, I.; Mohamed, H.; Shah, M. Hydrogeochemical characterization, and suitability assessment of drinking groundwater: Application of geostatistical approach and geographic information system. Front. Environ. Sci. 2022, 10, 874464. [Google Scholar] [CrossRef]
- Ullah, Z.; Rashid, A.; Ghani, J.; Nawab, J.; Zeng, X.-C. Groundwater Contamination through Potentially Harmful Metals and Its Implications in Groundwater Management. Front. Environ. Sci. 2022, 10, 1021596. [Google Scholar] [CrossRef]
- Domenico, P.A.; Schwartz, F.W. Physical and Chemical Hydrogeology; Wiley: New York, NY, USA, 1998; Volume 506. [Google Scholar]
- Nawab, J.; Rahman, A.; Khan, S.; Ghani, J.; Ullah, Z.; Khan, H.; Waqas, M. Drinking Water Quality Assessment of Government, Non-Government and Self-Based Schemes in the Disaster Affected Areas of Khyber Pakhtunkhwa, Pakistan. Expo. Health 2022, M 80, 1–17. [Google Scholar] [CrossRef]
- Valder, J.F.; Long, A.J.; Davis, A.D.; Kenner, S.J. Multivariate statistical approach to estimate mixing proportions for unknown end members. J. Hydrol. 2012, 460, 65–76. [Google Scholar] [CrossRef]
- Rashid, A.; Ayub, M.; Khan, S.; Ullah, Z.; Ali, L.; Gao, X.; Li, C.; El-Serehy, H.A.; Kaushik, P.; Rasool, A. Hydrogeochemical assessment of carcinogenic and non-carcinogenic health risks of potentially toxic elements in aquifers of the Hindukush ranges, Pakistan: Insights from groundwater pollution indexing, GIS-based, and multivariate statistical approaches. Environ. Sci. Pollut. Res. 2022, 29, 75744–75768. [Google Scholar] [CrossRef] [PubMed]
- Boonkaewwan, S.; Sonthiphand, P.; Chotpantarat, S. Mechanisms of arsenic contamination associated with hydrochemical characteristics in coastal alluvial aquifers using multivariate statistical technique and hydrogeochemical modeling: A case study in Rayong province, eastern Thailand. Environ. Geochem. Health 2021, 43, 537–566. [Google Scholar] [CrossRef] [PubMed]
- Rashid, A.; Ayub, M.; Javed, A.; Khan, S.; Gao, X.; Li, C.; Ullah, Z.; Sardar, T.; Muhammad, J.; Nazneen, S. Potentially harmful metals, and health risk evaluation in groundwater of Mardan, Pakistan: Application of geostatistical approach and geographic information system. Geosci. Front. 2021, 12, 101128. [Google Scholar] [CrossRef]
- Parkhurst, D.L.; Appelo, C. User’s guide to PHREEQC (Version 2): A computer program for speciation, batch-reaction, one-dimensional transport, and inverse geochemical calculations. Water-Resour. Investig. Rep. 1999, 99, 312. [Google Scholar]
- Rashid, A.; Ayub, M.; Ullah, Z.; Ali, A.; Khattak, S.A.; Ali, L.; Gao, X.; Li, C.; Khan, S.; El-Serehy, H.A.; et al. Geochemical Modeling Source Provenance, Public Health Exposure, and Evaluating Potentially Harmful Elements in Groundwater: Statistical and Human Health Risk Assessment (HHRA). Int. J. Environ. Res. Public Health 2022, 19, 6472. [Google Scholar] [CrossRef]
- Brown, R.M.; McClelland, N.I.; Deininger, R.A.; O’Connor, M.F. A water quality index—Crashing the psychological barrier. In Indicators of Environmental Quality; Springer: Berlin/Heidelberg, Germany, 1972; pp. 173–182. [Google Scholar]
- Abeer, N.; Khan, S.A.; Muhammad, S.; Rasool, A.; Ahmad, I. Health risk assessment and provenance of arsenic and heavy metal in drinking water in Islamabad, Pakistan. Environ. Technol. Innov. 2020, 20, 101171. [Google Scholar] [CrossRef]
- Rehman, F.; Cheema, T.; Azeem, T.; Naseem, A.A.; Khan, I.; Iqbal, N.; Shaheen, A. Groundwater quality and potential health risks caused by arsenic (As) in Bhakkar, Pakistan. Environ. Earth Sci. 2020, 79, 529. [Google Scholar] [CrossRef]
- US-EPA. Guidelines for Carcinogen Risk Assessment; Risk Assesment Forum; US-EPA: Washington, DC, USA, 2005. [Google Scholar]
- WHO. Guidelines for Drinking-Water Quality; World Health Organization: Geneva, Switzerland, 2011; Volume 216, pp. 303–304. [Google Scholar]
- Adelekan, B.; Ogunde, O. Quality of water from dug wells and the lagoon in Lagos Nigeria and associated health risks. Sci. Res. Essays 2012, 7, 1195–1211. [Google Scholar] [CrossRef]
- Ghalib, H.B. Groundwater chemistry evaluation for drinking and irrigation utilities in east Wasit province, Central Iraq. Appl. Water Sci. 2017, 7, 3447–3467. [Google Scholar] [CrossRef] [Green Version]
- Kumar, M.; Ramanathan, A.; Rao, M.S.; Kumar, B. Identification and evaluation of hydrogeochemical processes in the groundwater environment of Delhi, India. Environ. Geol. 2006, 50, 1025–1039. [Google Scholar] [CrossRef]
- Roy, A.; Keesari, T.; Mohokar, H.; Sinha, U.K.; Bitra, S. Assessment of groundwater quality in hard rock aquifer of central Telangana state for drinking and agriculture purposes. Appl. Water Sci. 2018, 8, 124. [Google Scholar] [CrossRef] [Green Version]
- Javed, T.; Sarwar, T.; Ullah, I.; Ahmad, S.; Rashid, S. Evaluation of groundwater quality in district Karak Khyber Pakhtunkhwa, Pakistan. Water Sci. 2019, 33, 1–9. [Google Scholar] [CrossRef] [Green Version]
- Khashogji, M.S.; El Maghraby, M.M. Evaluation of groundwater resources for drinking and agricultural purposes, Abar Al Mashi area, south Al Madinah Al Munawarah City, Saudi Arabia. Arab. J. Geosci. 2013, 6, 3929–3942. [Google Scholar] [CrossRef]
- Kozul, C.D.; Hampton, T.H.; Davey, J.C.; Gosse, J.A.; Nomikos, A.P.; Eisenhauer, P.L.; Weiss, D.J.; Thorpe, J.E.; Ihnat, M.A.; Hamilton, J.W. Chronic exposure to arsenic in the drinking water alters the expression of immune response genes in mouse lung. Environ. Health Perspect. 2009, 117, 1108–1115. [Google Scholar] [CrossRef]
- Shahid, S.U.; Iqbal, J.; Hasnain, G. Groundwater quality assessment and its correlation with gastroenteritis using GIS: A case study of Rawal Town, Rawalpindi, Pakistan. Environ. Monit. Assess. 2014, 186, 7525–7537. [Google Scholar] [CrossRef] [PubMed]
- Shahid, S.U.; Iqbal, J. Groundwater Quality Assessment Using Averaged Water Quality Index: A Case Study of Lahore City, Punjab, Pakistan; IOP Conference Series: Earth and Environmental Science; IOP Publishing: Bristol, UK, 2016; p. 042031. [Google Scholar]
- Adnan, S.; Iqbal, J. Spatial analysis of the groundwater quality in the Peshawar District, Pakistan. Procedia Eng. 2014, 70, 14–22. [Google Scholar] [CrossRef] [Green Version]
- Smedley, P.L. Sources and distribution of arsenic in groundwater and aquifers. In Arsenic in Groundwater: A World Problem; International Association of Hydrogeologists Publication: Utrecht, The Netherlands, 2008. [Google Scholar]
- Kim, S.-H.; Kim, K.; Ko, K.-S.; Kim, Y.; Lee, K.-S. Co-contamination of arsenic and fluoride in the groundwater of unconsolidated aquifers under reducing environments. Chemosphere 2012, 87, 851–856. [Google Scholar] [CrossRef] [PubMed]
- Kim, M.-J.; Nriagu, J.; Haack, S. Carbonate ions and arsenic dissolution by groundwater. Environ. Sci. Technol. 2000, 34, 3094–3100. [Google Scholar] [CrossRef]
- Chen, X.; Zeng, X.-C.; Kawa, Y.K.; Wu, W.; Zhu, X.; Ullah, Z.; Wang, Y. Microbial reactions and environmental factors affecting the dissolution and release of arsenic in the severely contaminated soils under anaerobic or aerobic conditions. Ecotoxicol. Environ. Saf. 2020, 189, 109946. [Google Scholar] [CrossRef] [PubMed]
- He, X.; Li, P.; Wu, J.; Wei, M.; Ren, X.; Wang, D. Poor groundwater quality and high potential health risks in the Datong Basin, northern China: Research from published data. Environ. Geochem. Health 2021, 43, 791–812. [Google Scholar] [CrossRef] [PubMed]
- Bhattacharya, P.; Jacks, G.; Jana, J.; Sracek, A.; Gustafsson, J.; Chatterjee, D. Geochemistry of the Holocene alluvial sediments of Bengal Delta Plain from West Bengal, India: Implications on arsenic contamination in groundwater. Groundw. Arsen. Contam. Bengal Delta Plain Bangladesh 2001, 3084, 21–40. [Google Scholar]
- Reza, A.S.; Jean, J.-S.; Lee, M.-K.; Yang, H.-J.; Liu, C.-C. Arsenic enrichment and mobilization in the Holocene alluvial aquifers of the Chapai-Nawabganj district, Bangladesh: A geochemical and statistical study. Appl. Geochem. 2010, 25, 1280–1289. [Google Scholar] [CrossRef]
- Lee, M.K.; Griffin, J.; Saunders, J.; Wang, Y.; Jean, J.S. Reactive transport of trace elements and isotopes in the Eutaw coastal plain aquifer, Alabama. J. Geophys. Res. Biogeosci. 2007, 112. [Google Scholar] [CrossRef] [Green Version]
- Bhattacharya, P.; Chatterjee, D.; Jacks, G. Occurrence of arsenic-contaminatedGroundwater in alluvial aquifers from Delta plains, eastern India: Options for safe drinking water supply. Int. J. Water Resour. Dev. 1997, 13, 79–92. [Google Scholar] [CrossRef]
- Kumar, M.; Ramanathan, A.; Mukherjee, A.; Verma, S.; Rahman, M.M.; Naidu, R. Hydrogeo-morphological influences for arsenic release and fate in the central Gangetic Basin, India. Environ. Technol. Innov. 2018, 12, 243–260. [Google Scholar] [CrossRef]
- Piper, A.M. A graphic procedure in the geochemical interpretation of water-analyses. Eos Trans. Am. Geophys. Union 1944, 25, 914–928. [Google Scholar] [CrossRef]
- Kumar, P.S. Interpretation of groundwater chemistry using piper and Chadha’s diagrams: A comparative study from Perambalur Taluk. Elixir Geosci. 2013, 54, 12208–12211. [Google Scholar]
- Saha, S.; Reza, A.S.; Roy, M.K. Hydrochemical evaluation of groundwater quality of the Tista floodplain, Rangpur, Bangladesh. Appl. Water Sci. 2019, 9, 198. [Google Scholar] [CrossRef] [Green Version]
- Nag, S. Quality of groundwater in parts of ARSA block, Purulia District, West Bengal. Bhu-Jal 2009, 4, 58–64. [Google Scholar]
- Sajil Kumar, P.; James, E. Identification of hydrogeochemical processes in the Coimbatore district, Tamil Nadu, India. Hydrol. Sci. J. 2016, 61, 719–731. [Google Scholar] [CrossRef]
- Gibbs, R.J. Mechanisms controlling world water chemistry. Science 1970, 170, 1088–1090. [Google Scholar] [CrossRef]
- Mattos, J.B.; Cruz, M.J.M.; De Paula, F.C.F.; Sales, E.F. Spatio-seasonal changes in the hydrogeochemistry of groundwaters in a highland tropical zone. J. S. Am. Earth Sci. 2018, 88, 275–286. [Google Scholar] [CrossRef]
- Zhang, X.; Zhao, R.; Wu, X.; Mu, W. Hydrogeochemistry, identification of hydrogeochemical evolution mechanisms, and assessment of groundwater quality in the southwestern Ordos Basin, China. Environ. Sci. Pollut. Res. 2021, 29, 901–921. [Google Scholar] [CrossRef] [PubMed]
- Khattak, S.A.; Rashid, A.; Tariq, M.; Ali, L.; Gao, X.; Ayub, M.; Javed, A. Potential risk and source distribution of groundwater contamination by mercury in district Swabi, Pakistan: Application of multivariate study. Environ. Dev. Sustain. 2021, 23, 2279–2297. [Google Scholar] [CrossRef]
- Li, X.; Wu, H.; Qian, H.; Gao, Y. Groundwater chemistry regulated by hydrochemical processes and geological structures: A case study in Tongchuan, China. Water 2018, 10, 338. [Google Scholar] [CrossRef] [Green Version]
- Das, N.; Patel, A.K.; Deka, G.; Das, A.; Sarma, K.P.; Kumar, M. Geochemical controls and future perspective of arsenic mobilization for sustainable groundwater management: A study from Northeast India. Groundw. Sustain. Dev. 2015, 1, 92–104. [Google Scholar] [CrossRef]
- Noor, S.; Rashid, A.; Javed, A.; Khattak, J.A.; Farooqi, A. Hydrogeological properties, sources provenance, and health risk exposure of fluoride in the groundwater of Batkhela, Pakistan. Environ. Technol. Innov. 2022, 25, 102239. [Google Scholar]
- Kumar, M.; Kumari, K.; Singh, U.K.; Ramanathan, A. Hydrogeochemical processes in the groundwater environment of Muktsar, Punjab: Conventional graphical and multivariate statistical approach. Environ. Geol. 2009, 57, 873–884. [Google Scholar] [CrossRef]
- Datta, P.; Bhattacharya, S.; Tyagi, S. 18O studies on recharge of phreatic aquifers and groundwater flow-paths of mixing in the Delhi area. J. Hydrol. 1996, 176, 25–36. [Google Scholar] [CrossRef]
- Rashid, A.; Khattak, S.A.; Ali, L.; Zaib, M.; Jehan, S.; Ayub, M.; Ullah, S. Geochemical profile and source identification of surface and groundwater pollution of District Chitral, Northern Pakistan. Microchem. J. 2019, 145, 1058–1065. [Google Scholar] [CrossRef]
- Chotpantarat, S.; Amasvata, C. Influences of pH on transport of arsenate (As5+) through different reactive media using column experiments and transport modeling. Sci. Rep. 2020, 10, 1–13. [Google Scholar] [CrossRef] [PubMed] [Green Version]
- Li, P.; Qian, H.; Wu, J.; Zhang, Y.; Zhang, H. Major ion chemistry of shallow groundwater in the Dongsheng Coalfield, Ordos Basin, China. Mine Water Environ. 2013, 32, 195–206. [Google Scholar] [CrossRef]
- Rashid, A.; Guan, D.-X.; Farooqi, A.; Khan, S.; Zahir, S.; Jehan, S.; Khattak, S.A.; Khan, M.S.; Khan, R. Fluoride prevalence in groundwater around a fluorite mining area in the flood plain of the River Swat, Pakistan. Sci. Total Environ. 2018, 635, 203–215. [Google Scholar] [CrossRef] [Green Version]
- Rashid, A.; Khan, S.; Ayub, M.; Sardar, T.; Jehan, S.; Zahir, S.; Khan, M.S.; Muhammad, J.; Khan, R.; Ali, A. Mapping human health risk from exposure to potential toxic metal contamination in groundwater of Lower Dir, Pakistan: Application of multivariate and geographical information system. Chemosphere 2019, 225, 785–795. [Google Scholar] [CrossRef]
- Zhang, Y.; He, Z.; Tian, H.; Huang, X.; Zhang, Z.; Liu, Y.; Xiao, Y.; Li, R. Hydrochemistry appraisal, quality assessment and health risk evaluation of shallow groundwater in the Mianyang area of Sichuan Basin, southwestern China. Environ. Earth Sci. 2021, 80, 1–16. [Google Scholar] [CrossRef]
- Rashid, A.; Farooqi, A.; Gao, X.; Zahir, S.; Noor, S.; Khattak, J.A. Geochemical modeling, source apportionment, health risk exposure and control of higher fluoride in groundwater of sub-district Dargai, Pakistan. Chemosphere 2020, 243, 125409. [Google Scholar] [CrossRef]
- Liu, G.; Ma, F.; Liu, G.; Guo, J.; Duan, X.; Gu, H. Quantification of water sources in a coastal gold mine through an end-member mixing analysis combining multivariate statistical methods. Water 2020, 12, 580. [Google Scholar] [CrossRef]
- Bhatti, Z.I.; Ishtiaq, M.; Khan, S.A.; Nawab, J.; Ghani, J.; Ullah, Z.; Khan, S.; Baig, S.A.; Muhammad, I.; Din, Z.U. Contamination level, source identification and health risk assessment of potentially toxic elements in drinking water sources of mining and non-mining areas of Khyber Pakhtunkhwa, Pakistan. J. Water Health 2022, 20, 1343–1363. [Google Scholar] [CrossRef]
- Agoubi, B.; Kharroubi, A.; Abida, H. Geochemical assessment of environmental impact on groundwater quality in coastal arid area, south eastern Tunisia. J. Env. Sci. Eng. Technol. 2014, 2, 35–46. [Google Scholar] [CrossRef]
- Kumar, A.; Singh, C.K. Characterization of hydrogeochemical processes and fluoride enrichment in groundwater of south-western Punjab. Water Qual. Expo. Health 2015, 7, 373–387. [Google Scholar] [CrossRef]
- Heydarirad, L.; Mosaferi, M.; Pourakbar, M.; Esmailzadeh, N.; Maleki, S. Groundwater salinity and quality assessment using multivariate statistical and hydrogeochemical analysis along the Urmia Lake coastal in Azarshahr plain, North West of Iran. Environ. Earth Sci. 2019, 78, 1–16. [Google Scholar] [CrossRef]
- Abu-Alnaeem, M.F.; Yusoff, I.; Ng, T.F.; Alias, Y.; Raksmey, M. Assessment of groundwater salinity and quality in Gaza coastal aquifer, Gaza Strip, Palestine: An integrated statistical, geostatistical and hydrogeochemical approaches study. Sci. Total. Environ. 2018, 615, 972–989. [Google Scholar] [CrossRef] [PubMed]
- EPA, Risk Based Screening Table. Composite Table: Summary Tab 0615, 2015. Available online: http:/www2.epa.gov/risk/riskbasedscreeningtablegeneric%0Atables (accessed on 18 October 2022).
- Ram, A.; Tiwari, S.; Pandey, H.; Chaurasia, A.K.; Singh, S.; Singh, Y. Groundwater quality assessment using water quality index (WQI) under GIS framework. Appl. Water Sci. 2021, 11, 1–20. [Google Scholar] [CrossRef]


| Chemical Parameters | W.H.O Standards | Minimum | Maximum | Mean | St. Deviation | Samples E.P.L | % Of Samples E.P. L |
|---|---|---|---|---|---|---|---|
| pH | 6.5–8.5 | 7.1 | 8.3 | 7.8 | 0.263 | 0 | 0% |
| EC (μS/cm) | <1000 | 160 | 3710 | 1572.03 | 974.329 | 40 | 59% |
| TDS (mg/L) | <1000 | 1.67 | 2226 | 954.70 | 600.374 | 30 | 44% |
| Total hardness (mg/L) | 100–500 | 70 | 710 | 294.78 | 134.199 | 8 | 11% |
| HCO3− (mg/L) | 150–300 | 50 | 945 | 359.55 | 179.818 | 43 | 64% |
| Ca2+ (mg/L) | 75 | 20 | S120 | 55.19403 | 20.594 | 11 | 16% |
| F− (mg/L) | 0.6–1.5 | 0.04 | 2.5 | 0.54 | 0.444 | 4 | 5% |
| Mg2+ (mg/L) | 30–150 | 5 | 124 | 37.61 | 24.074 | 0 | 0% |
| Na+ (mg/L) | 50–200 | 6 | 700 | 242.49 | 191.389 | 36 | 53% |
| K+ (mg/L) | 30–200 | 2.3 | 95 | 10.96 | 16.303 | 0 | 0 |
| Cl− (mg/L) | 250 | 2 | 568 | 195.10 | 177.986 | 24 | 35% |
| NO3(N) | 45 | 0.01 | 18 | 1.59 | 2.888 | 0 | 0% |
| PO4−3 (mg/L) | 0.1 | 0.01 | 0.35 | 0.13 | 0.095 | 34 | 50% |
| SO42− (mg/L) | 250 | 11 | 472 | 188.45 | 129.385 | 21 | 31% |
| Fe (mg/L) | 1.5 | 0.03 | 0.95 | 0.22 | 0.198 | 0 | 0% |
| As (ppb) | 10 | 0.13 | 79.65 | 16.5 | 22.276 | 19 | 28% |
| Turbidity (NTU) | <5 | 0.01 | 15.61 | 1.15 | 2.681 | 2 | 2% |
| Parameters | EC | pH | Turbidity | TDS | Alkalinity | HCO3− | Cl− | SO42− | Ca2+ | Mg2+ | Hardness | Na+ | K+ | NO3− | PO4− | F− | Fe | As |
|---|---|---|---|---|---|---|---|---|---|---|---|---|---|---|---|---|---|---|
| EC | 1 | |||||||||||||||||
| pH | −0.18 | 1 | ||||||||||||||||
| Turbidity | 0.21 | 0.12 | 1 | |||||||||||||||
| TDS | 0.95 | −0.18 | 0.20 | 1 | ||||||||||||||
| Alkalinity | 0.76 | −0.14 | 0.17 | 0.79 | 1 | |||||||||||||
| HCO3− | 0.76 | −0.14 | 0.17 | 0.79 | 1.00 | 1 | ||||||||||||
| Cl− | 0.86 | −0.21 | 0.12 | 0.92 | 0.52 | 0.52 | 1 | |||||||||||
| SO42− | 0.88 | −0.08 | 0.28 | 0.94 | 0.69 | 0.69 | 0.85 | 1 | ||||||||||
| Ca2+ | 0.34 | −0.56 | −0.01 | 0.36 | 0.19 | 0.19 | 0.40 | 0.29 | 1 | |||||||||
| Mg2+ | 0.53 | −0.58 | 0.01 | 0.61 | 0.47 | 0.47 | 0.61 | 0.48 | 0.48 | 1 | ||||||||
| Hardness | 0.54 | −0.65 | 0.00 | 0.60 | 0.42 | 0.42 | 0.62 | 0.49 | 0.75 | 0.94 | 1 | |||||||
| Na+ | 0.93 | −0.01 | 0.21 | 0.97 | 0.78 | 0.78 | 0.88 | 0.94 | 0.19 | 0.43 | 0.40 | 1 | ||||||
| K+ | 0.45 | −0.27 | 0.10 | 0.53 | 0.48 | 0.48 | 0.50 | 0.38 | 0.22 | 0.55 | 0.49 | 0.44 | 1 | |||||
| NO3− | 0.34 | −0.41 | −0.09 | 0.36 | 0.33 | 0.33 | 0.34 | 0.19 | 0.25 | 0.54 | 0.49 | 0.23 | 0.56 | 1 | ||||
| PO4− | 0.86 | −0.09 | 0.25 | 0.81 | 0.64 | 0.64 | 0.73 | 0.82 | 0.17 | 0.38 | 0.36 | 0.83 | 0.41 | 0.12 | 1 | |||
| F− | 0.46 | 0.26 | −0.02 | 0.48 | 0.61 | 0.61 | 0.29 | 0.49 | −0.13 | 0.06 | −0.01 | 0.56 | 0.14 | 0.13 | 0.52 | 1 | ||
| Fe | 0.28 | −0.06 | 0.10 | 0.25 | 0.15 | 0.15 | 0.29 | 0.20 | 0.22 | 0.00 | 0.09 | 0.28 | −0.11 | −0.01 | 0.24 | 0.08 | 1 | |
| As | −0.38 | −0.17 | 0.01 | −0.41 | −0.26 | −0.27 | −0.43 | −0.35 | 0.10 | −0.19 | −0.10 | −0.44 | −0.25 | −0.19 | −0.31 | −0.27 | −0.08 | 1 |
| Variable | PC1 | PC2 | PC3 | PC4 | PC5 |
|---|---|---|---|---|---|
| EC (μS/cm) | 0.33 | 0.10 | 0.09 | 0.03 | −0.04 |
| pH | −0.11 | 0.47 | −0.09 | −0.12 | −0.12 |
| TDS (mg/L) | 0.35 | 0.08 | 0.04 | 0.00 | −0.06 |
| HCO3 (mg/L) | 0.28 | 0.11 | −0.11 | 0.33 | 0.25 |
| Cl (mg/L) | 0.32 | 0.02 | 0.10 | −0.23 | −0.19 |
| SO4 (mg/L) | 0.32 | 0.15 | 0.11 | 0.08 | −0.22 |
| Ca (mg/L) | 0.15 | −0.37 | 0.35 | 0.06 | −0.04 |
| Mg (mg/L) | 0.25 | −0.33 | −0.13 | −0.03 | −0.10 |
| Hardness (mg/L) | 0.25 | −0.39 | 0.05 | 0.00 | −0.11 |
| Na (mg/L) | 0.33 | 0.21 | 0.06 | 0.00 | −0.06 |
| K (mg/L) | 0.21 | −0.14 | −0.43 | −0.03 | 0.03 |
| NO3 (N)(mg/L) | 0.16 | −0.26 | −0.41 | −0.14 | 0.53 |
| PO4 (mg/L) | 0.29 | 0.19 | 0.10 | 0.13 | −0.11 |
| F (mg/L) | 0.17 | 0.34 | −0.15 | 0.36 | 0.37 |
| Fe (mg/L) | 0.09 | 0.07 | 0.59 | −0.35 | 0.61 |
| As (PPb) | −0.15 | −0.19 | 0.26 | 0.72 | 0.07 |
| Eigenvalue | 7.89 | 2.75 | 1.36 | 0.90 | 0.78 |
| % variance | 49.32% | 17.24% | 8.55% | 5.65% | 4.90% |
| Cumulative | 49.32% | 66.56% | 75.11% | 80.75% | 85.65% |
| Sample | As (ppb) | ADD | HQ | CR |
|---|---|---|---|---|
| 1 | 4.9 | 0.14 | 0.47 | 2.1 × 10⁻¹ |
| 2 | 3.1 | 0.09 | 0.30 | 1.32 × 10⁻¹ |
| 3 | 0.13 | 0.00 | 0.01 | 5.57 × 10⁻³ |
| 4 | 6.21 | 0.18 | 0.59 | 2.66 × 10⁻¹ |
| 5 | 4.91 | 0.14 | 0.47 | 2.10 × 10⁻¹ |
| 6 | 4.91 | 0.14 | 0.47 | 2.10 × 10⁻¹ |
| 7 | 4.5 | 0.13 | 0.43 | 1.92 × 10⁻¹ |
| 8 | 4.76 | 0.14 | 0.45 | 2.0 × 10⁻¹ |
| 9 | 4.49 | 0.13 | 0.43 | 1.92 × 10⁻¹ |
| 10 | 4.45 | 0.13 | 0.42 | 1.90 × 10⁻¹ |
| 11 | 12.1 | 0.35 | 1.15 | 5.2 × 10⁻¹ |
| 12 | 7.51 | 0.21 | 0.72 | 3.21 × 10⁻¹ |
| 13 | 7.38 | 0.21 | 0.70 | 3.16 × 10⁻¹ |
| 14 | 9.48 | 0.27 | 0.90 | 4.06 × 10⁻¹ |
| 15 | 3.01 | 0.09 | 0.29 | 1.29 × 10⁻¹ |
| 16 | 4.06 | 0.12 | 0.39 | 1.74 × 10⁻¹ |
| 17 | 7.86 | 0.22 | 0.75 | 3.33 × 10⁻¹ |
| 18 | 6.22 | 0.18 | 0.59 | 2.66 × 10⁻¹ |
| 19 | 2.57 | 0.07 | 0.24 | 1.11 × 10⁻¹ |
| 20 | 2.67 | 0.08 | 0.25 | 1.11 × 10⁻¹ |
| 21 | 2.81 | 0.08 | 0.27 | 1.20 × 10⁻¹ |
| 22 | 2.87 | 0.08 | 0.27 | 1.23 × 10⁻¹ |
| 23 | 3.3 | 0.09 | 0.31 | 1.41 × 10⁻¹ |
| 24 | 1.65 | 0.05 | 0.16 | 7.07 × 10⁻² |
| 25 | 2.12 | 0.06 | 0.20 | 9.08 × 10⁻² |
| 26 | 2.35 | 0.07 | 0.22 | 1.07 × 10⁻¹ |
| 27 | 1.94 | 0.06 | 0.18 | 8.31 × 10⁻² |
| 28 | 1.98 | 0.06 | 0.19 | 8.48 × 10⁻² |
| 29 | 1.78 | 0.05 | 0.17 | 7.62 × 10⁻² |
| 30 | 2.36 | 0.07 | 0.22 | 1.01 × 10⁻¹ |
| 31 | 3.23 | 0.09 | 0.31 | 1.38 × 10⁻¹ |
| 32 | 9.94 | 0.28 | 0.95 | 4.26 × 10⁻¹ |
| 33 | 1.03 | 0.03 | 0.10 | 4.41 × 10⁻² |
| 34 | 9.96 | 0.28 | 0.95 | 4.26 × 10⁻¹ |
| 35 | 47.94 | 1.37 | 4.57 | 2.05 × 100 |
| 36 | 33.68 | 0.96 | 3.21 | 1.44 × 100 |
| 37 | 39.67 | 1.13 | 3.78 | 1.7 × 100 |
| 38 | 1.03 | 0.03 | 0.10 | 4.0 × 10⁻² |
| 39 | 0.36 | 0.01 | 0.03 | 1.54 × 10⁻² |
| 40 | 3.21 | 0.09 | 0.31 | 1.37 × 10⁻² |
| 41 | 74.23 | 2.12 | 7.07 | 3.18 × 100 |
| 42 | 52.59 | 1.50 | 5.01 | 2.25 × 100 |
| 43 | 56.31 | 1.61 | 5.36 | 2.41 × 100 |
| 44 | 57.41 | 1.64 | 5.47 | 2.46 × 100 |
| 45 | 55.87 | 1.60 | 5.32 | 2.39 × 100 |
| 46 | 66.34 | 1.90 | 6.32 | 2.84 × 100 |
| 47 | 79.65 | 2.28 | 7.59 | 3.41 × 100 |
| 48 | 61.73 | 1.76 | 5.88 | 2.56 × 100 |
| 49 | 51.66 | 1.48 | 4.92 | 2.21 × 100 |
| 50 | 45.62 | 1.30 | 4.34 | 1.96 × 100 |
| 51 | 44.59 | 1.27 | 4.25 | 1.96 × 100 |
| 52 | 48.67 | 1.39 | 4.64 | 2.09 × 100 |
| 53 | 2.84 | 0.08 | 0.27 | 1.21 × 10⁻¹ |
| 54 | 3.59 | 0.10 | 0.34 | 1.53 × 10⁻¹ |
| 55 | 14.2 | 0.41 | 1.35 | 6.08 × 10⁻¹ |
| 56 | 44.12 | 1.26 | 4.20 | 1.89 × 100 |
| 57 | 33.28 | 0.95 | 3.17 | 1.43 × 100 |
| 58 | 1.43 | 0.04 | 0.14 | 6.12 × 10⁻² |
| 59 | 1.35 | 0.04 | 0.13 | 5.78 × 10⁻² |
| 60 | 1.69 | 0.05 | 0.16 | 7.24 × 10⁻² |
| 61 | 0.97 | 0.03 | 0.09 | 4.15 × 10⁻² |
| 62 | 5.04 | 0.14 | 0.48 | 2.16 × 10⁻¹ |
| 63 | 8.93 | 0.26 | 0.85 | 3.82 × 10⁻¹ |
| 64 | 8.59 | 0.25 | 0.82 | 3.68 × 10⁻¹ |
| 65 | 0.86 | 0.02 | 0.08 | 3.68 × 10⁻² |
| 66 | 4.39 | 0.13 | 0.42 | 1.88 × 10⁻¹ |
| 67 | 0.9 | 0.03 | 0.09 | 3.85 × 10⁻² |
| Category | WQI | Water Quality | Water Sample |
|---|---|---|---|
| A | 0–25 | Excellent | 19% |
| B | 25–50 | Good | 32% |
| C | 51–75 | Poor | 22% |
| D | 76–100 | Very poor | 10% |
| E | >100 | Not suitable | 11% |
Publisher’s Note: MDPI stays neutral with regard to jurisdictional claims in published maps and institutional affiliations. |
© 2022 by the authors. Licensee MDPI, Basel, Switzerland. This article is an open access article distributed under the terms and conditions of the Creative Commons Attribution (CC BY) license (https://creativecommons.org/licenses/by/4.0/).
Share and Cite
Arifullah; Changsheng, H.; Akram, W.; Rashid, A.; Ullah, Z.; Shah, M.; Alrefaei, A.F.; Kamel, M.; Aleya, L.; Abdel-Daim, M.M. Quality Assessment of Groundwater Based on Geochemical Modelling and Water Quality Index (WQI). Water 2022, 14, 3888. https://doi.org/10.3390/w14233888
Arifullah, Changsheng H, Akram W, Rashid A, Ullah Z, Shah M, Alrefaei AF, Kamel M, Aleya L, Abdel-Daim MM. Quality Assessment of Groundwater Based on Geochemical Modelling and Water Quality Index (WQI). Water. 2022; 14(23):3888. https://doi.org/10.3390/w14233888
Chicago/Turabian StyleArifullah, Huang Changsheng, Waseem Akram, Abdur Rashid, Zahid Ullah, Muddaser Shah, Abdulwahed Fahad Alrefaei, Mohamed Kamel, Lotfi Aleya, and Mohamed M. Abdel-Daim. 2022. "Quality Assessment of Groundwater Based on Geochemical Modelling and Water Quality Index (WQI)" Water 14, no. 23: 3888. https://doi.org/10.3390/w14233888