Article

Response of Algal–Bacterial Regrowth Characteristics to the Hypochlorite in Landscape Ponds Replenished with Reclaimed Water

1
School of Environmental Science and Engineering, Tianjin University, Tianjin 300350, China
2
National Engineering Research Center for Urban Water and Wastewater, Tianjin 300074, China
*
Author to whom correspondence should be addressed.
Water 2022, 14(23), 3893; https://doi.org/10.3390/w14233893
Submission received: 20 September 2022 / Revised: 19 November 2022 / Accepted: 23 November 2022 / Published: 29 November 2022

Abstract

:
Sodium hypochlorite was widely used as a supplementary disinfectant in reclaimed water (RW) production during the COVID-19 epidemic. It is well known that the chlorination of RW results in a relatively high bacterial regrowth potential in pipeline systems. However, the algal growth and algal–bacterial interactions would be another concern in RW-replenished surface water with light irradiation. In this study, microcosmic experiments were used to explore the impact of hypochlorite on the algae–bacteria community, including the influence of hypochlorite on algal–bacterial regrowth, microbial community structure, and the specific bacteria that can survive chlorination. Results demonstrated that algal growth potential could be promoted after chlorination of the RW, and bacteria abundance increased along with an increase in algal density, which is probably related to DOM decomposition by chlorine oxidation. Additionally, the characteristics of the bacterial community were altered. It is more likely that phytospheric bacteria will survive chlorination. It was discovered that the secondary risks of chlorine disinfection include the growth of algae in addition to bacterial regeneration, which is an extension of the common perception. As a consequence, when chlorinated reclaimed water is used as a supplement for urban landscape ponds, particular attention should be paid to controlling bio-available organic matter induced by reactive chlorine, as well as the algal bloom, to decrease the risk of pathogen transmission.

1. Introduction

Reclaimed water (RW) replenishing of landscape ponds is a promising and economical way to improve urban landscape quality and reduce regional pressure on water resources. However, since the outbreak of the COVID-19 epidemic, sodium hypochlorite (NaClO) disinfection has been widely supplemented at the end of RW production in many wastewater treatment plants (WWTPs). Investigations have shown that the concentrations of residual chlorine in WWTP effluents in China during the epidemic were 0.09 to 8.5 mg/L with an average value of 1.12 mg/L, and the majority form of which was free chlorine [1,2]. Residual chlorine entered the landscape water system [3,4], which may potentially impact microbial ecology and induce uncertain ecological risks.
Chlorine disinfection could lead to an increase in assimilable organic carbons (AOC) in RW, and probably exacerbate the regrowth the pathogenic bacteria [5,6,7]. On the other hand, active chlorine could oxidize the residual organic matters in reclaimed water, which theoretically could alter the growth of algae due to mixotrophy mechanisms [8,9]. Consequently, the characteristics of microbial community may be affected due to algae–bacteria interactions [10,11]. Thus, compared with the dark systems (e.g., the water distribution system and cooling water system), which primarily focus on bacterial regrowth, the light systems (e.g., landscape water) need to consider more about algae–bacteria interactions and algal mixotrophy mechanisms, especially when using chlorinated RW for water replenishment.
However, much less was known about the characteristics of the microbial community structure in such situations. The identification of their characteristics in the chlorinated RW replenished aquatic ecosystem would be fundamental for further research on the deeper mechanisms of the chlorinated RW’s impact on the microbial community structure and pathogenic bacteria risks in landscape ponds. Therefore, a microcosmic system was established for a 42-day observation, with the aim of assessing the influence of hypochlorite on algal growth, the characteristics of the bacterial regrowth potential, the microbial community structure, and the specific bacteria that could survive chlorination. It was hoped that would illustrate the characteristics of algal–bacterial regrowth and reveal the uncertain ecological risks in the urban landscape ponds replenished by chlorinated RW when the algal bloom problem is involved.

2. Materials and Methods

2.1. The Basic Information of the Water for Experiments

RW was collected from a WWTP after tertiary treatment, which met the city’s class-A water quality standard (DB12/599-2015). The WWTP is located at the northeast corner of the Binhai New Area in Tianjin. Its tertiary effluent was discharged into a nearby landscape pond with a flow rate of ~60,000 m3/d and then went downstream. However, there was a short flow between the upstream and downstream of the pond, which resulted in a large area of hydraulic dead zone. For the dead zone of the pond, the hydraulic retention time would be over weeks, which had potential ecological risks because of long retention. Landscape water (LW) was collected from different sites of the pond and mixed. Water qualities of the RW and the LW are shown in Table S1. The corresponding water quality standard of the RW is also presented in Table S1.

2.2. Microcosmic Experiment

Microcosmic experiment were useful for intractable ecology problems, such as the responses of ecosystem community and function to environmental factors [12]. The experiment for the microbial regrowth was performed in a set of 250 mL Erlenmeyer flasks. In order to simulate the RW in replenishing landscape water, 20% RW was added to the LW, with a small amount of sterile water with different nitrate and phosphate concentrations to adjust the nutrients’ level, marked as N1~N6. They were set as control groups in order to compare the effects of nutrient and chlorine on the downstream microbial ecology. A blank, marked as “NC”, was also prepared with totally distilled water.
Then, the mixtures with a specific nutrients’ level (i.e., TN was about 10 mg/L, while TP was about 0.3 mg/L) were treated with 1% NaClO solution to final chlorine concentrations of 0.1, 0.5, 1.0, 3.0, and 5.0 mg-Cl/L, respectively, and marked as D1~D5. The chlorine dosage referred to the recommendation of CRB evaluation by Luo et al. [13] This level of nutrient was adopted because it most closely corresponded to the water quality of the effluent outlet on site. The detailed experimental grouping and conditions are shown in Table 1. The setting of nutrient levels in the experiments was to simulate the characteristic of relatively high nutrients in landscape water replenished by RW.
All the mixtures of different conditions were prepared in triplicate to ensure the reliability of the results. The mixtures were placed in a light incubator (Boxun, shanghai, China) at 28 ± 1 °C and a 14:10 h light–dark cycle with 6000 lux illumination, equal to photosynthetically active radiation of ca. 95 μmol·(m2·s)−1. The mixtures were shaken twice a day to ensure their uniformity.

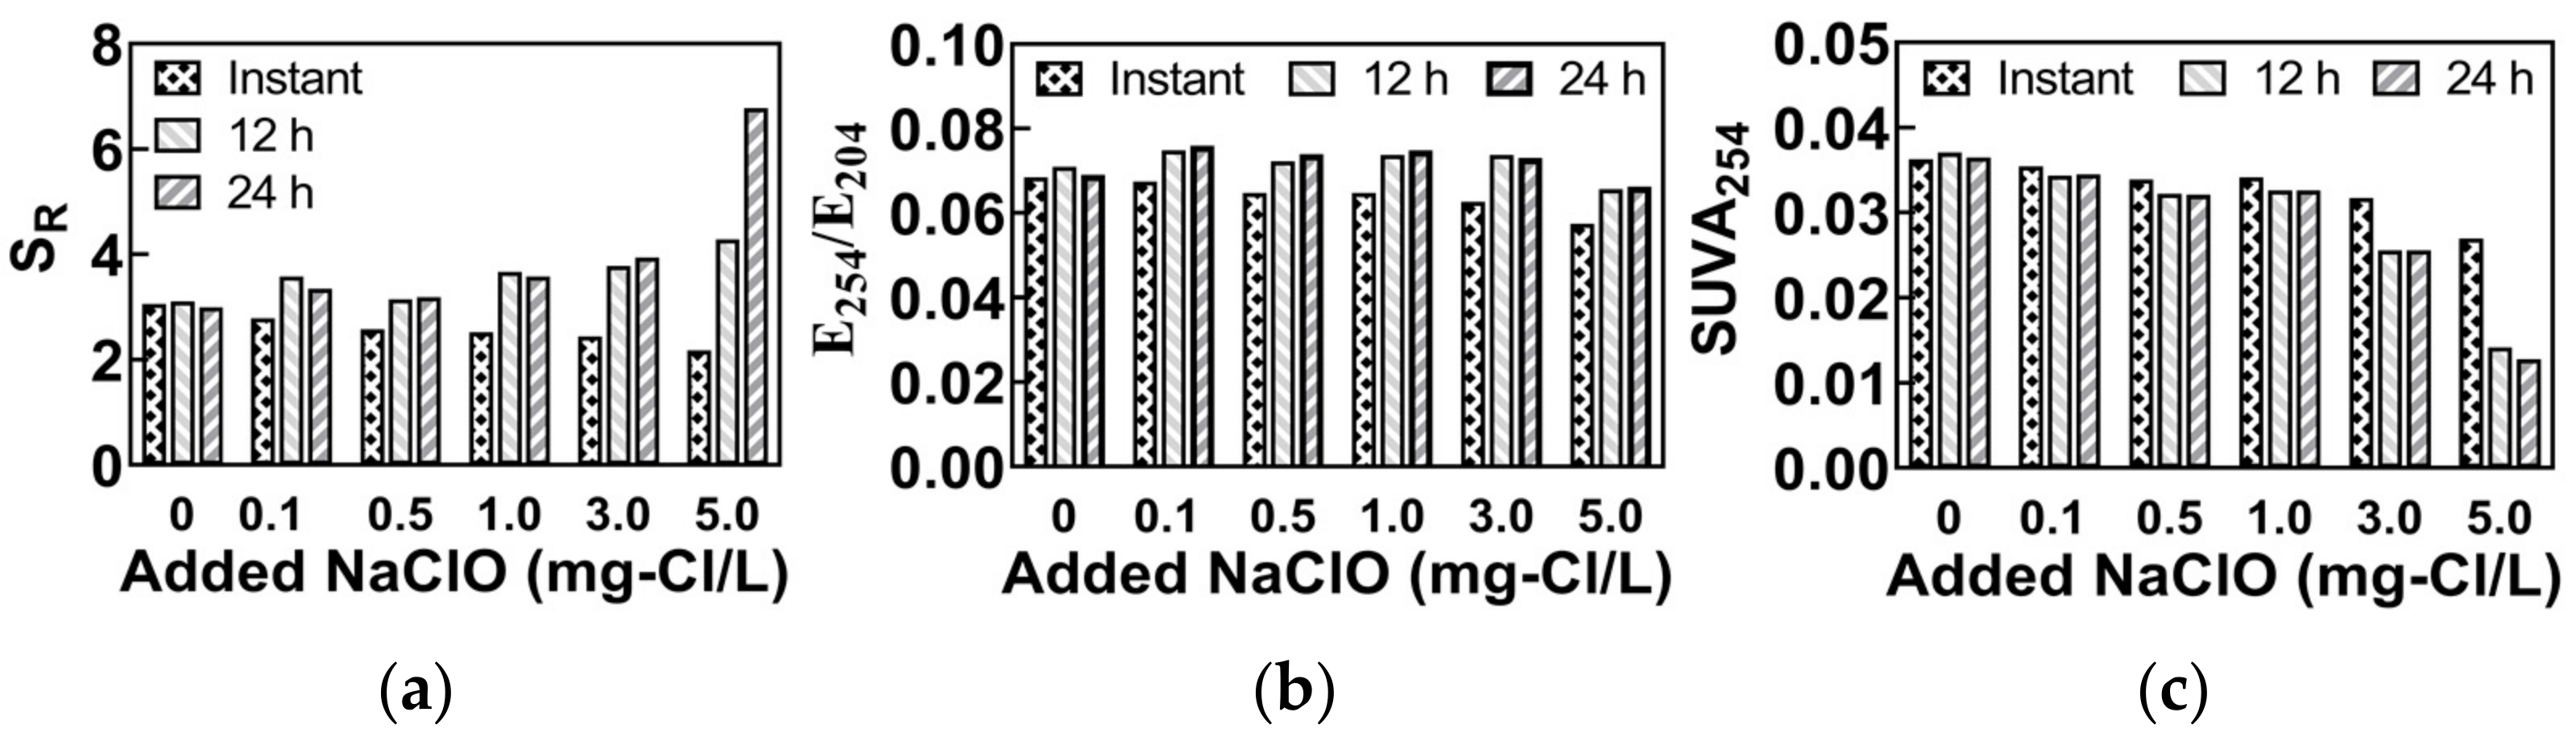
2.3. Chemical Analysis

The characteristics of dissolved organic matters (DOM) under chlorine oxidation were determined using a series of indicators, including SUVA254, E254/E204 and SR, detected by the ultraviolet-visible spectrophotometer (Hach DR 6000, Ames, OH, USA). The method and description of these indicators were listed in Table 2. Residual chlorine was analyzed following the DPD method [14].

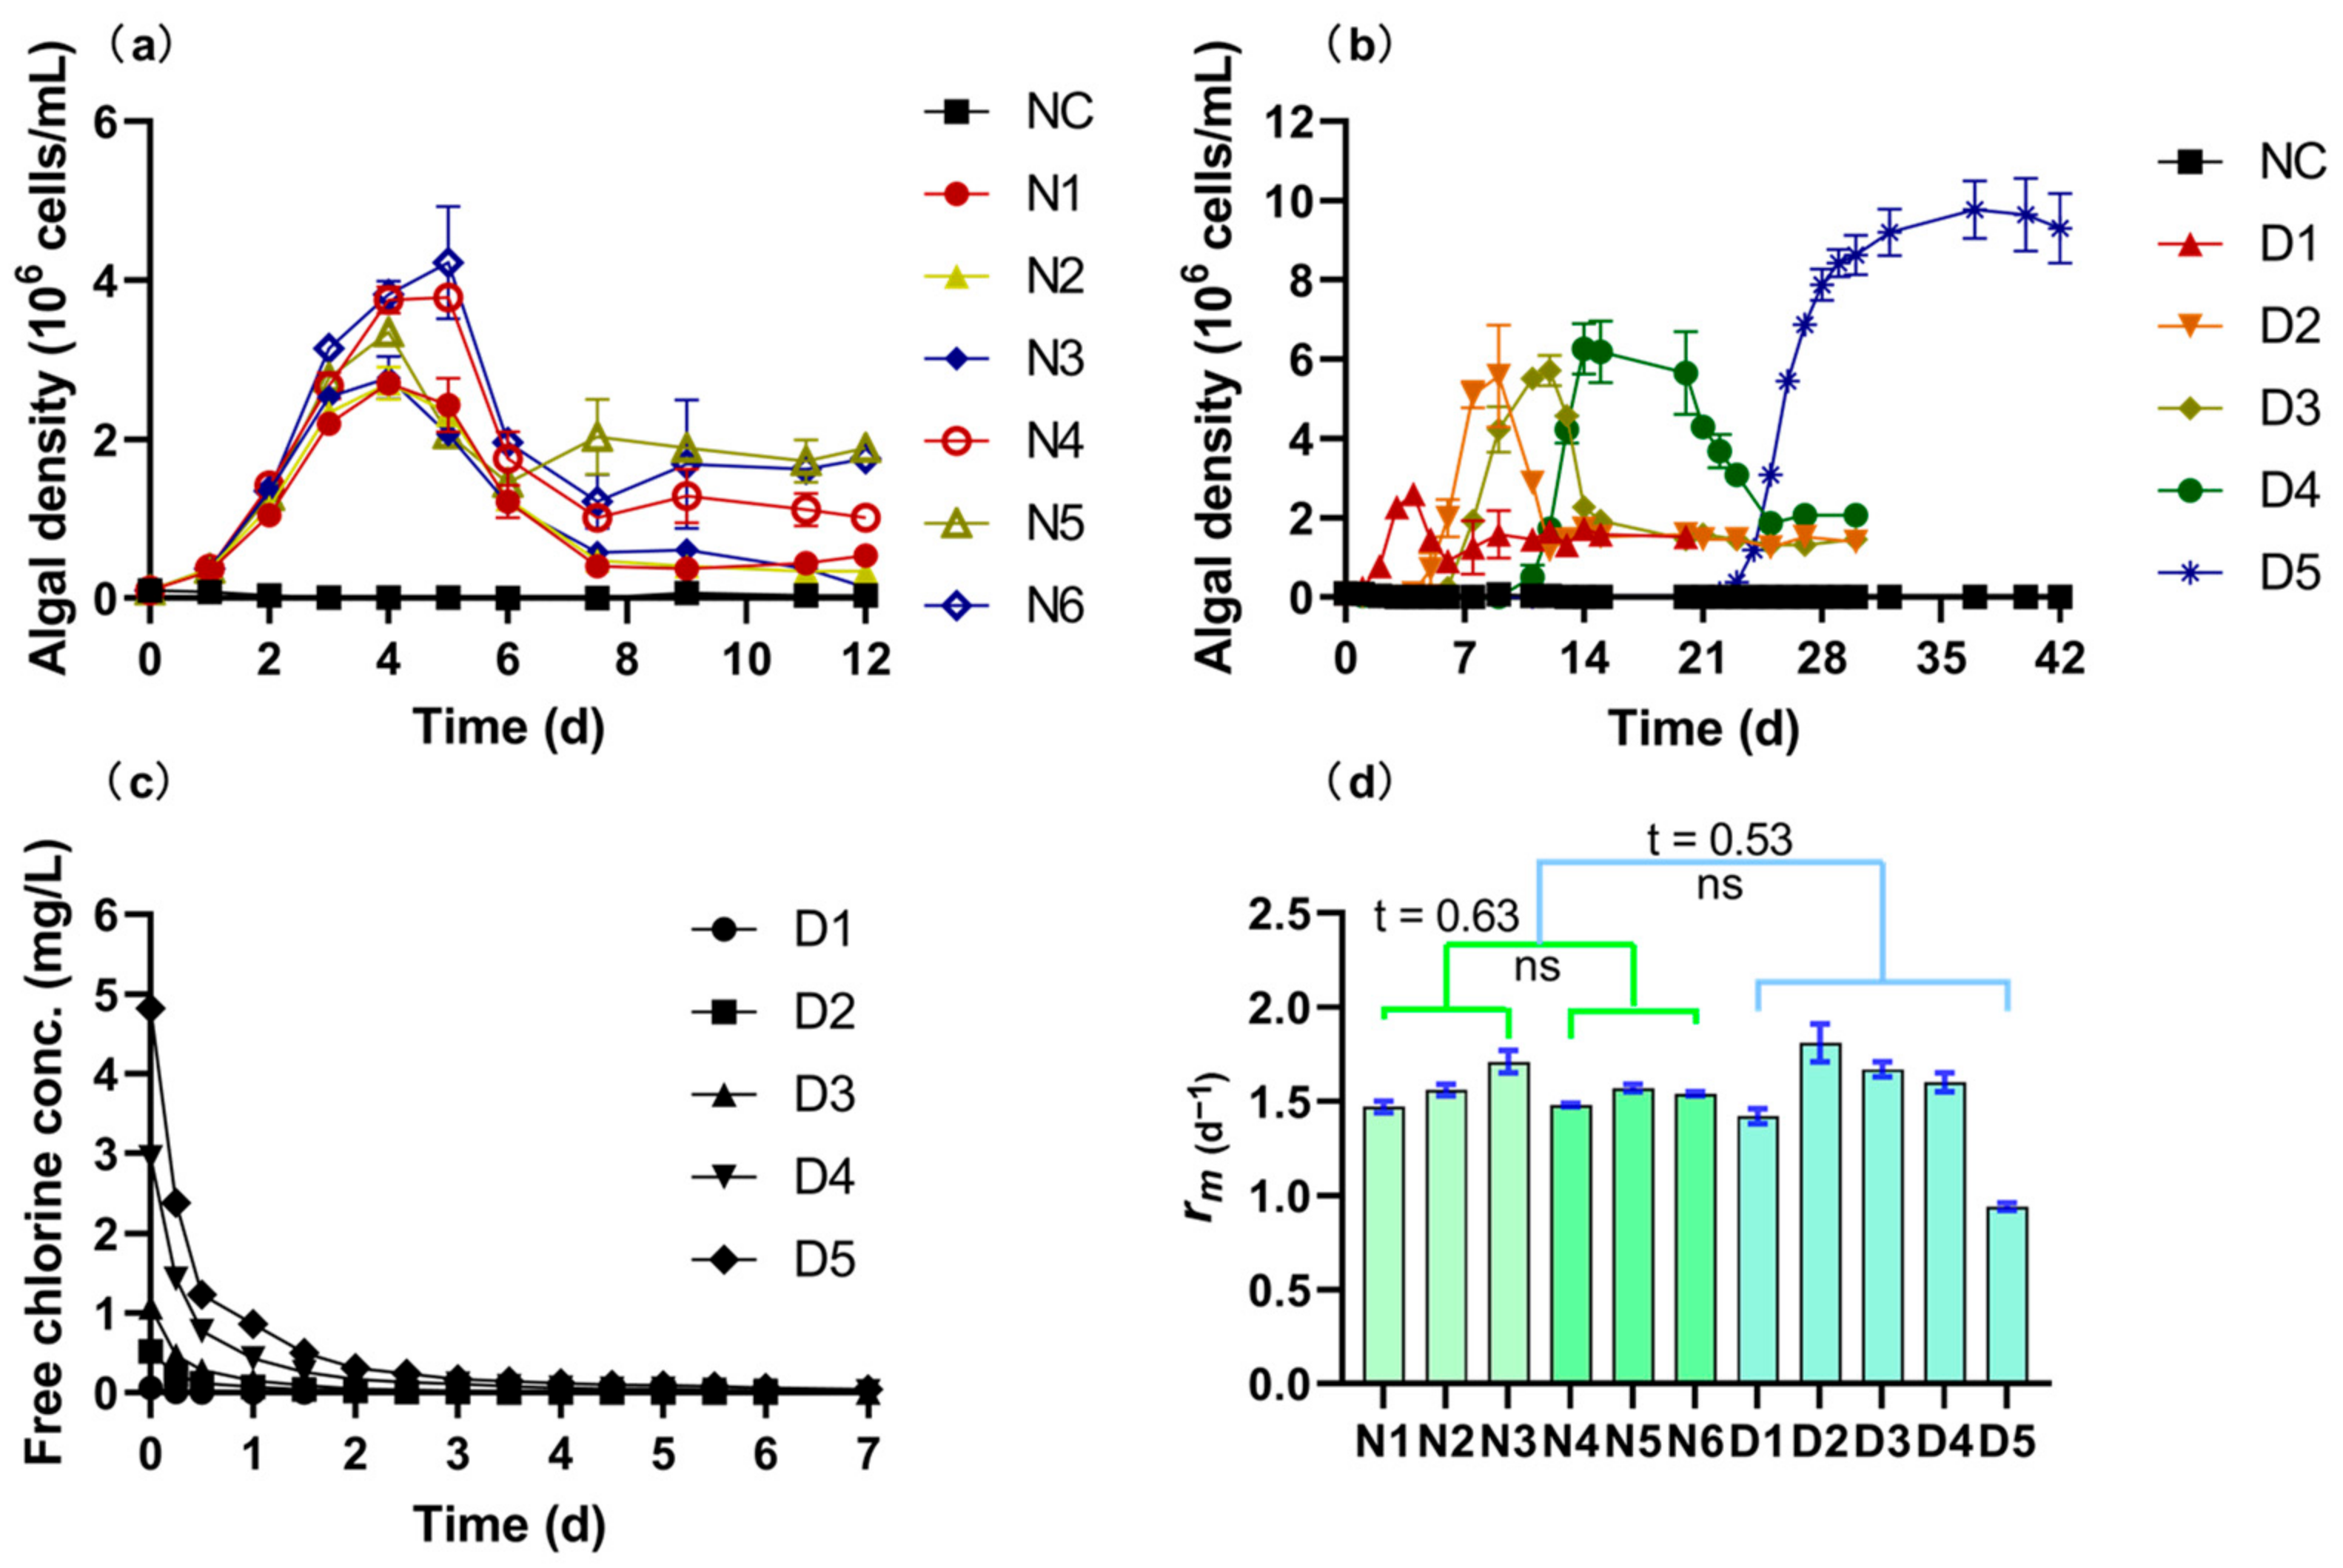
2.4. Monitoring of the Algal Growth

The algal density was measured by spectrophotometry using OD685, calibrated by algal cell counting. The method detection limit (MDL) and the sensitivity (S) were evaluated before tests (Figure S1). The maximum algal density (Nmax) and the specific growth rate of algae (rm) were calculated based on fitting by the logistic growth model. The algal density data during the decline phase was rejected in the fitting process to reduce its interference with the parameter calculation.
d N d t = r m × N × N m a x N N m a x
where, N represents the algal density at different sampling time, Nmax and rm are the parameters of the algal growth characteristics, which have been described above.

2.5. Analysis of Microbial Community

2.5.1. Sample Preparation

At the post-stationary phase of algae growth, which means the time algal density had reached to the top but not declined yet, a sample of 115 mL (35 mL from each replicate) was collected in each group. Samples were treated by low-tensity ultrasonic concussion (40 W, 5 min) to disperse the bacteria. Because chloroplast could produce garbage data in the sequencing process [19], algae cells were then removed by a 3 μm membrane (HainingYibo, Jiaxing, China) [20]. Bacteria in the filtrate were collected on 0.22 μm membrane (MF-Millipore, US). The membranes were placed into the sterile tubes individually, briefly stored in a −20 °C environment and sent to undergo sequencing processing.

2.5.2. 16S rDNA Sequencing and Data Processing

The bacterial DNA was extracted from the membrane using a TransStart® TopTaqDNA Polymerase kit (Transgen, Beijing, China) according to the manufacturer’s instructions. Primers 341F (5′-CCTACGGGNGGCWGCAG-3′) and 805R (5′-GACTACHVGGGTATCTAATCC-3′) were applied to amplify the bacterial 16S rRNA gene by PCR targeting the V3–V4 region.
The spike-in standards, nine synthetic sequences, were added to the sample DNA pools for the quantitative analysis of bacterial abundance based on the internal standard method [21]. They were amplified along with the extracted DNA. Then, the sequencing was performed on an Illumina MiSeq PE250 sequencer. The data processing followed the specifications of a previous study [22]. Taxonomy assignment was performed using the RDP database (version 11.5) using the classify-sklearn method.

2.5.3. Downstream Analysis

The absolute abundance of bacteria in each sample, indicated by the amplicon sequence variant (ASV) numbers, was counted based on a standard curve of read counts versus spike-in DNA copy numbers.
A non-metric multidimensional scaling (NMDS) method was employed to compare the similarity of microbial communities among the groups. The NMDS results were generated using the software R (version 4.0.5) based on genera-level data, with the Anosim (analysis of similarity) method used to investigate the statistical significance among the groups.
The interaction networks were established based on pairwise correlation analysis using Pearson’s method. The data of relative abundance at the class level were adopted in this part. Data of bacteria abundance within each class were filtered to ensure that above 60% of the data within all groups were non-zero values. The correlation matrix and p-values were then obtained using the function “rcorr” in RStudio. Data visualization was achieved by Cytoscape 3.8.2.

3. Results

3.1. Raw Water for the Experiment

The characteristics of algal growth under different chlorination conditions were compared, and the non-chlorinated groups with different nutrient levels were set as the controls (Figure 1). Maximum algal density (Nmax) was largely influenced by total phosphorus within tested nutrient levels, whereas nitrate concentrations had little effect on Nmax (Figure 1a). N1~N3 (TP was ~0.15 mg/L) had an average Nmax of 2.74 ± 0.05 106 cells/mL, whereas N4~N6 (TP was ~0.3 mg/L) had an average value of 3.91 ± 0.04 106 cells/mL.
Algal growth was not completely inhibited by NaClO (Figure 1b). NaClO prolonged the lag phase of algae growth, and as the dosage of NaClO increased from 0.1 to 5.0 mg-Cl/L, the occurrence of algal bloom was delayed from the 4th to the 28th day. The variations in free chlorine concentrations suggested that the delayed algal growth was probably associated with chlorine decay (Figure 1c). Additionally, the Nmax was also increased as NaClO dosage was increased. The Nmax of D1 was 2.92 ± 0.09 106 cells/mL, comparable to N1~N6. In comparison, Nmax values of D2~D4 were 5.83 × 10⁶~6.72 × 10⁶ cells/mL, and Nmax of D5 reached 9.60 × 10⁶ cells/mL.
By microscopy through morphology comparison with standard images in the global algal database (www.algaebase.org, accessed on 13 June 2022), most of the regrown algae among the groups were identified as Chlorococcales and Sphaeropleales in phylum Chlorophyta. The specific growth rates of algae (rm) in these groups showed minor differences (Figure 1d), which implied that chlorination had no significant effect on the cell reproduction rate of algae but indirectly influenced the environmental capacity for algal density.
Nutrients level failed to explain the remarkable increase in algal density seen in this study. Additionally, the biotoxicity was probably not the main cause, since it had a greater effect on the growth rate [23,24], which was not significantly changed in this test (Figure 1d). We then characterized the change in DOM under the oxidation pressure of hypochlorite (Figure 2). The results showed that the average molecular weight and aromaticity of DOM, indicated by SR and SUVA254, were significantly lowered after 12 h contact. The amount of hydrotropic substance was also slightly decreased. Thus, it could be inferred that the addition of hypochlorite induced aromatic ring cleavage and other degradation reactions. The formation of these low-molecular substances, rather than the nutrients or biotoxic effects, would be a strong explanation for the blooming of algal density, based on the heterotrophic algal growth mechanism [25,26].

3.2. Microbial Community

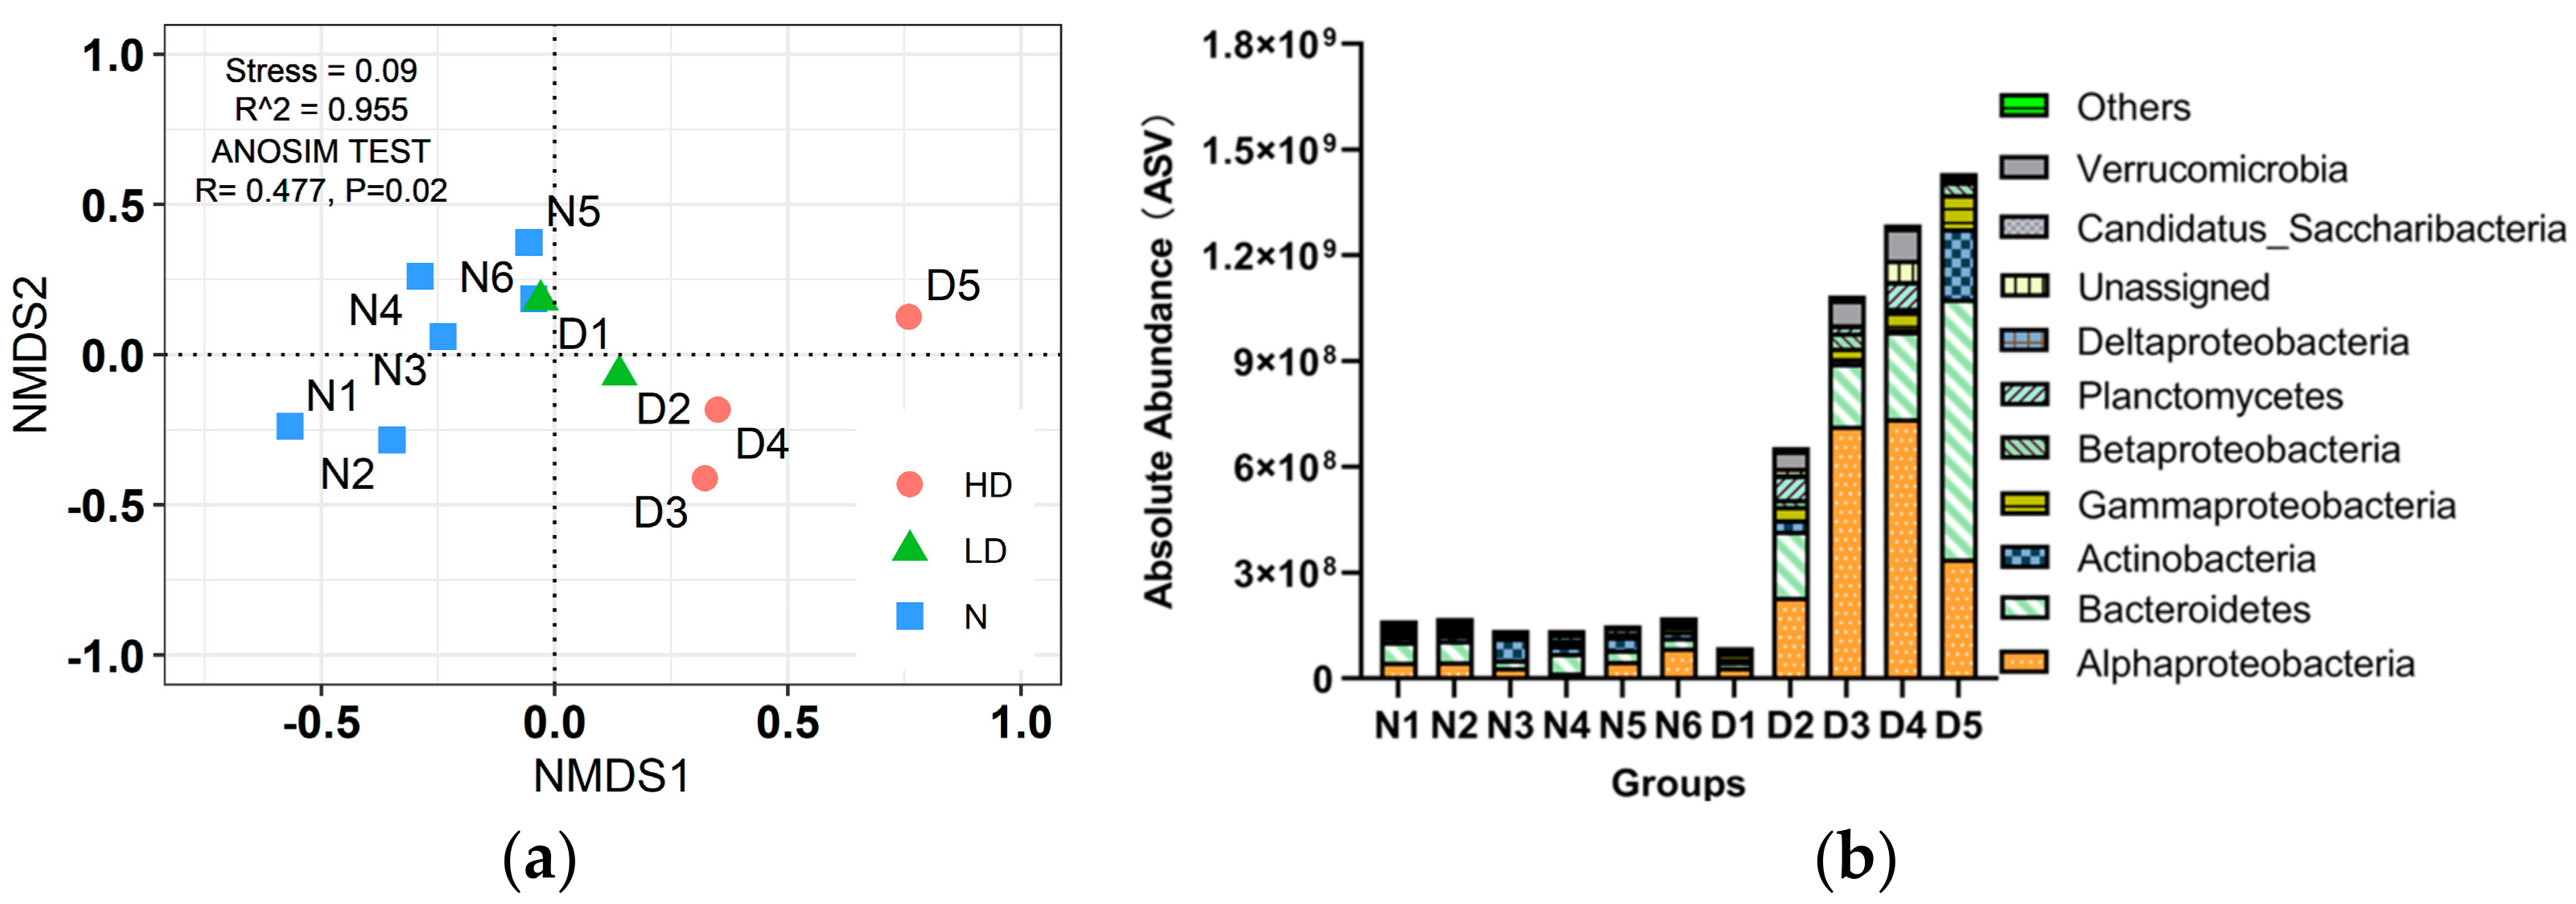
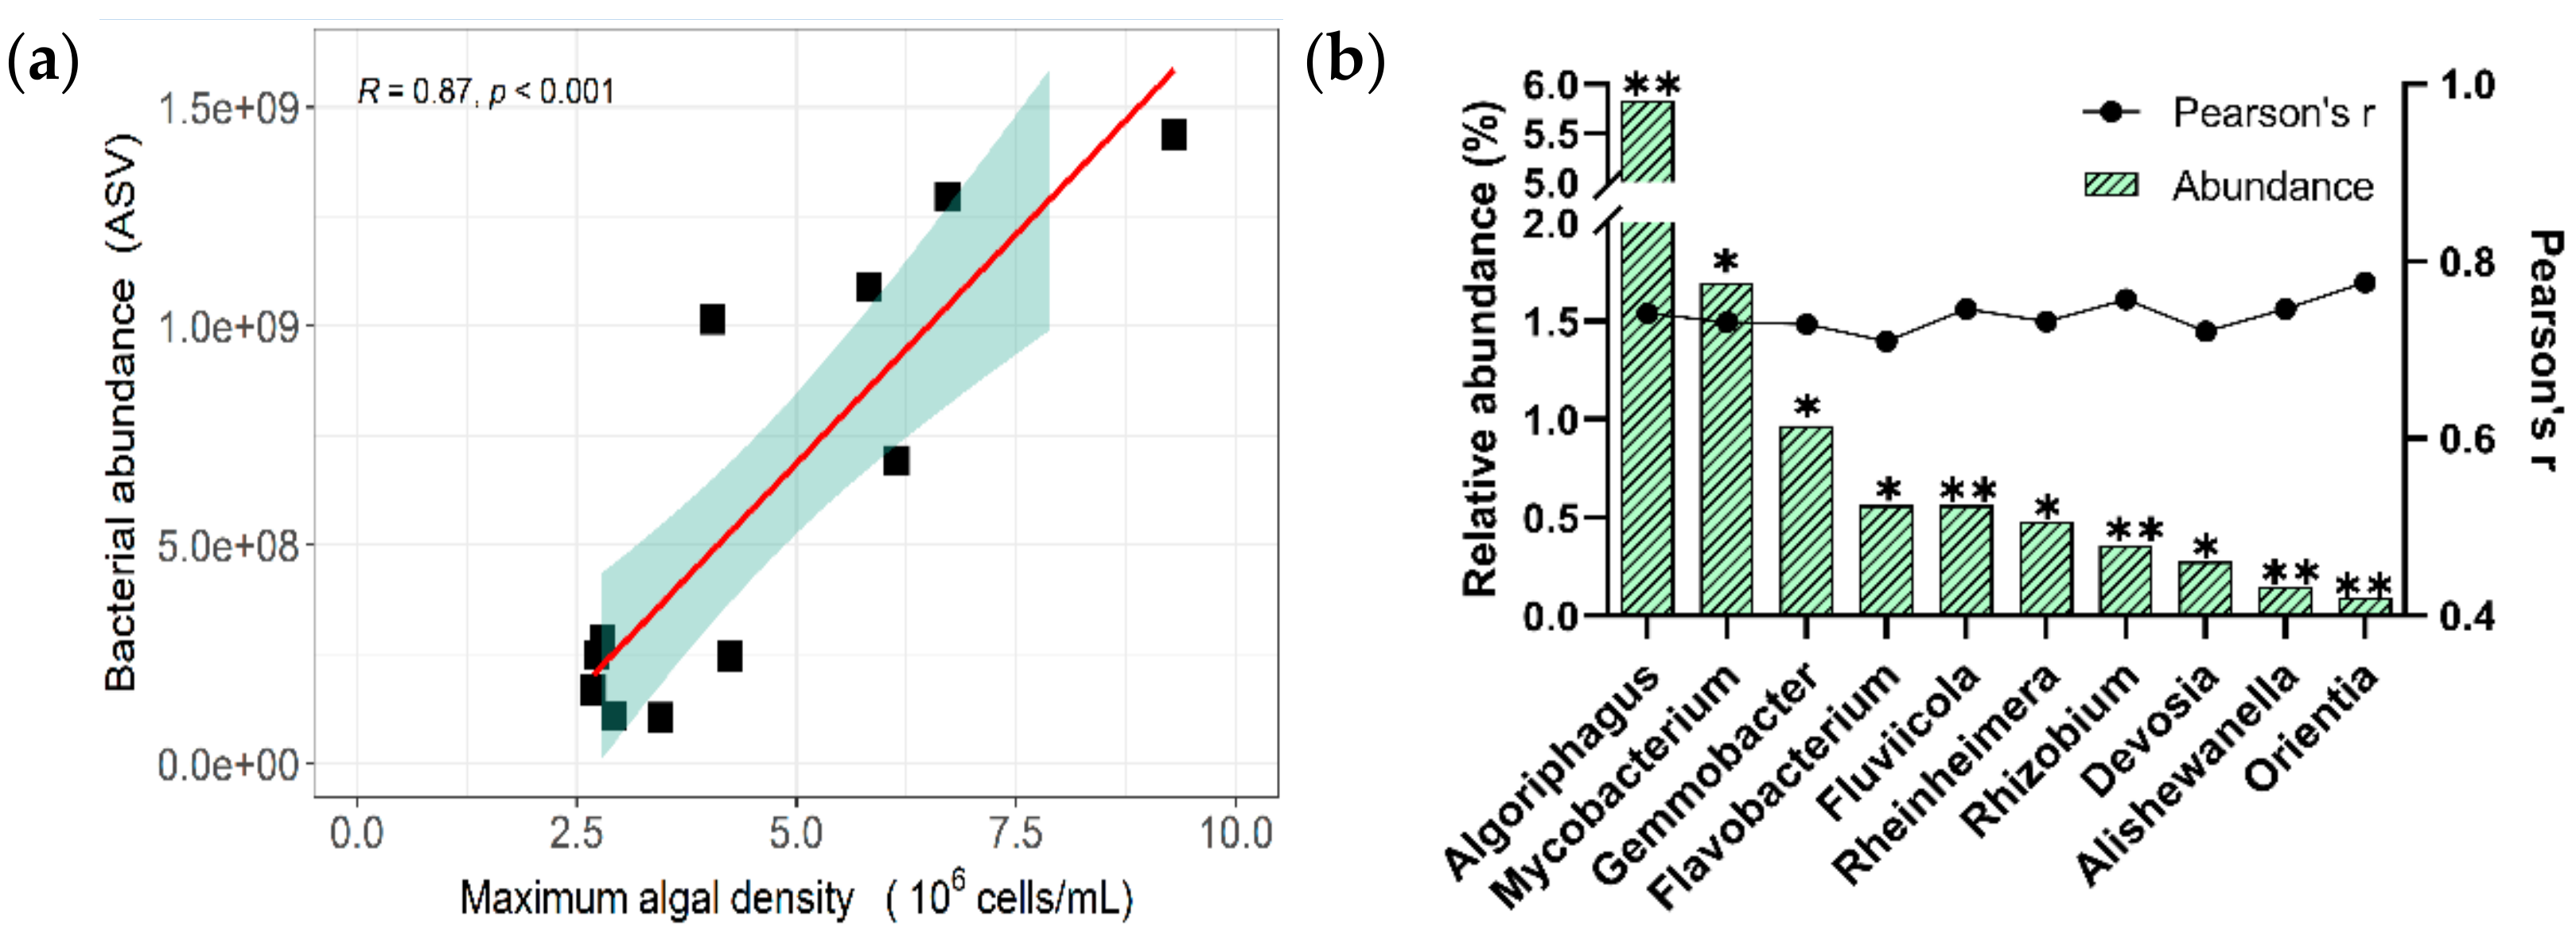
3.2.1. The Characteristics of Bacterial Composition and Abundance

As the algae outbreak period often represents the most unfavorable ecological period, microbial characteristics during this period play a key role in understanding ecological function and risk. Therefore, sequencing analysis was performed on samples at the algal bloom period (i.e., the post-stationary phase) under different experimental conditions. The composition of microbial communities in different conditions could be divided into three gradients based on NMDS analysis (Figure 3a). The low dosage of chlorine (D1 and D2, less than or equal to 0.5 mg-Cl/L) induced little shift in the composition of bacteria compared to those with no chlorine addition (N1 ~ N6). When chlorine usage was larger than 0.5 mg-Cl/L (D3~D5), a clear division in the composition of microbial communities emerged.
In addition to the composition, the absolute abundance of bacteria increased after contact with increased chlorine dosages (Figure 3b). The absolute abundances of bacteria in N1~N6 were similar, with an average abundance of 2.02 × 10⁸ ASV/mL. In contrast, the absolute abundances of bacteria in D1~D5 were changed from 1.08 × 10⁸ to 1.43 × 10⁹ ASV/mL, indicating that the bacteria regrowth potential was remarkably increased after chlorination.
Additionally, a supplementary test was performed to investigate whether the effect of chlorine on organic compounds in RW or the symbiosis between algae and bacteria promoted the regrowth of bacteria (Figure S2). The results showed that the bacteria did not regrow to the above levels after being contacted with chlorine in the dark environment, suggesting that algal growth plays a more significant role in bacterial regrowth potential as algae provided a pleasant symbiotic environment. Therefore, it could be inferred that a high bacteria abundance was indirectly influenced by RW chlorination through algal growth promotion.

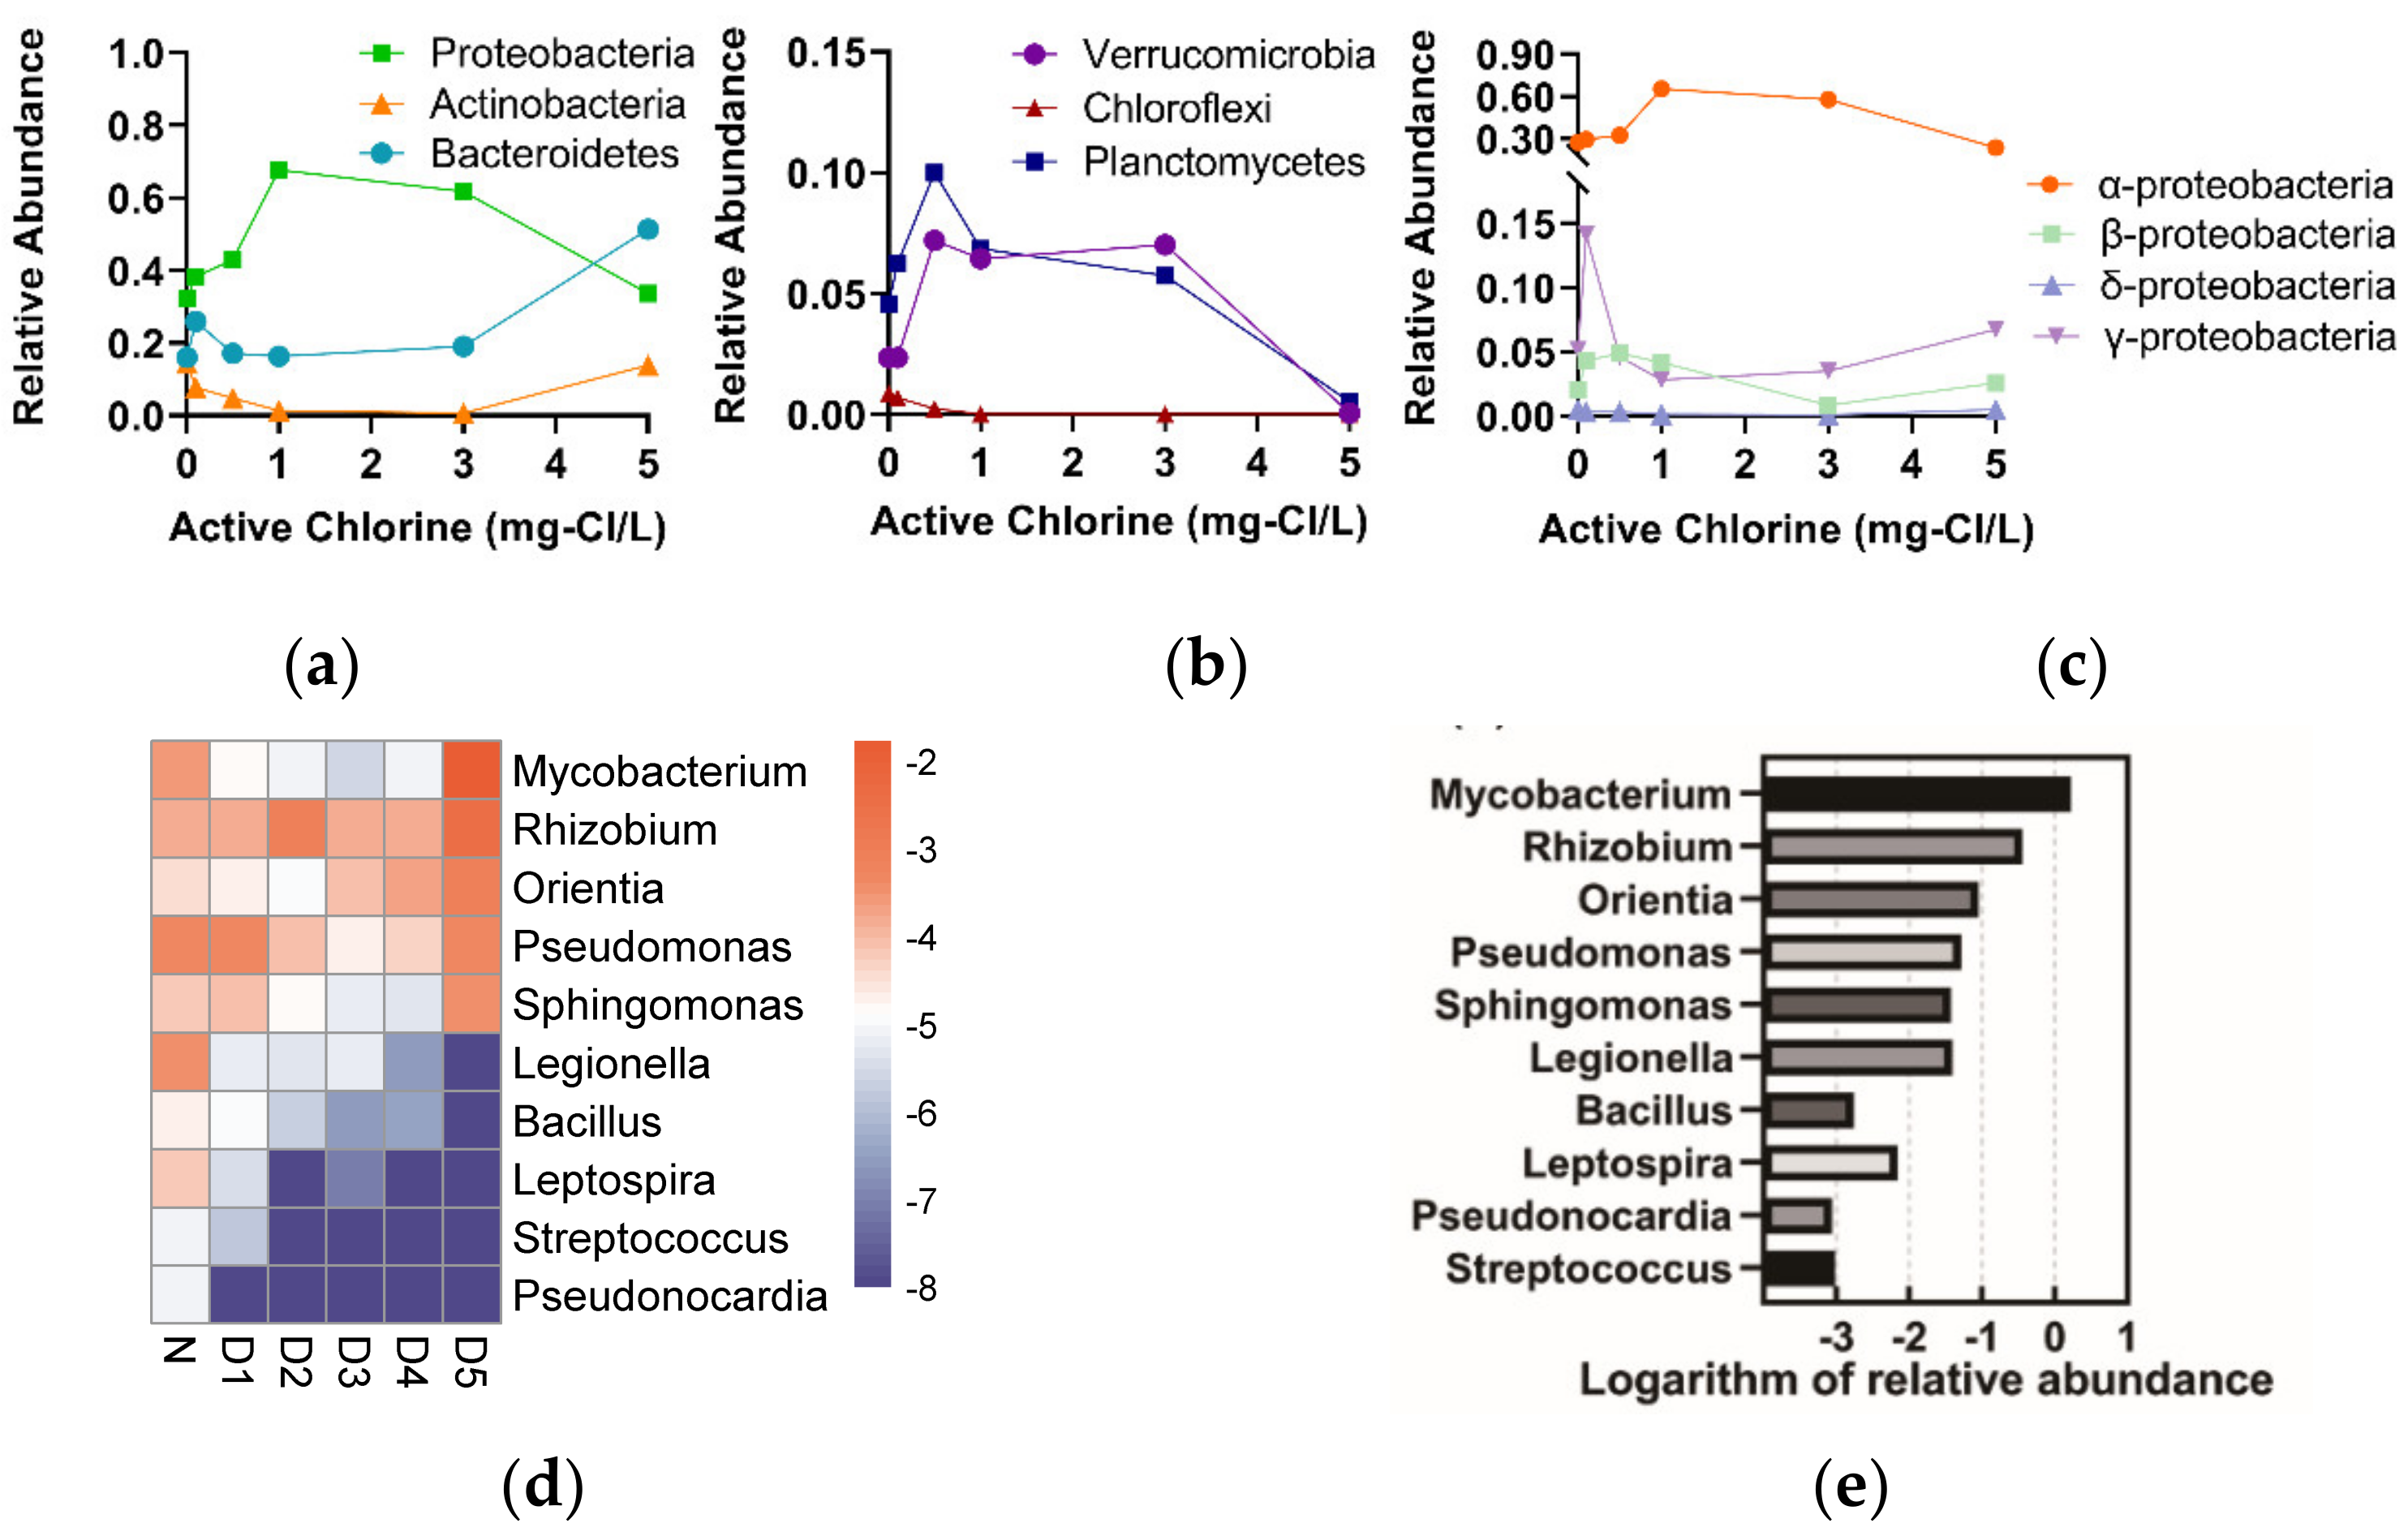
3.2.2. The Responses of Microbial Community to the Chlorine Concentrations

Alphaproteobacteria and Bacteroidetes contributed to the largest increment of the bacterial abundance in the chlorinated groups (Figure 3b). Additionally, a difference in dominant bacteria was found in groups treated with different concentrations of chlorine (Figure 4). The abundance of Alphaproteobacteria in D1 to D4 were 3.16 × 10⁷, 2.31 × 10⁸, 7.17 × 10⁸, and 7.39 × 10⁸ ASV/mL, respectively. It dropped to 3.40 × 10⁸ ASV/mL in D5. At the same time, Bacteroidetes became dominant in D5, with an abundance of 7.38 × 10⁸ ASV/mL.
The responses of relative abundance at phyla (or class) levels to the chlorine dosage were different (Figure 4). They could be roughly divided into three patterns, (1) one that survived with initial chlorine ≤ 0.5 mg/L but was remarkably inhibited or eliminated under high concentrations of chlorine, such as Chloroflexi and Betaproteobacteria; (2) one that obtained its maximum relative abundance under a chlorine concentration of 0.5~3 mg/L, while relative abundance got lower or even zero when the chlorine concentration was out of this range, such as Alphaproteobacteria, Verrucomicrobia, and Planctomycetes; and (3) one that became abundant after contact with a high concentration of chlorine (5.0 mg/L), such as Bacteroidetes and Actinobacteria.
Some opportunistic pathogens had a higher occurrence potential in commensal niches [27], which implies extra attention would be required to the occurrence of these potentially pathogenic bacteria (PPB) in algal bloom circumstances.
The PPB were picked out based on the reference lists [28,29]. The characteristics of identified PPB are shown in Figure 4d,e. Results showed that PPB, such as Bacillus, Legionella, and Leptospira, were inhibited or eliminated in the chlorine-treated groups. However, PPB, such as Mycobacterium, Rhizobium, Pseudomonas, and Sphingomonas, maintained high relative abundance or even higher (Figure 4d). The genus Mycobacterium showed proliferation in relative abundance (from 0.028% to 1.69%). It became the most dominant PPB, while the genus Pseudomonas and Legionella were the dominant genera (0.042% and 0.040%, respectively) under non-chlorinated conditions.
The interaction network of bacterial communities revealed that the complexity of microbial communities was reduced after chlorination compared with that in non-chlorination conditions (Figure S3). The average number of neighbors (Avg. N) of bacteria at class level was 18.0 in chlorinated conditions, while it was 23.0 in non-chlorinated conditions. The number of edges in the network of chlorinated conditions was 171, significantly lower than 276, calculated in the network of non-chlorinated conditions. Thus, the stability of microbial community was probably decreased by chlorination due to a reduction in network complexity [30].

3.3. Microbial Community

Figure 5a shows the relation between the total bacterial abundance and the Nmax of algae. The bacterial abundance was positively correlated with the algal density (r = 0.87, p < 0.001, n = 18). Combining this result with the bacterial regrowth characteristics under dark-culture conditions (Figure S2), it is reasonable to infer that algal symbiosis was the main driving factor for the remarkable increase in bacterial abundance.
Figure 5b shows the genus that has a significantly correlated with algal density. Eleven genera were selected following the certain rules (Pearson’s r > 0.6, p < 0.05, and the relative abundance > 0.1%). Their functions are shown in Table 3. Bacteria in genera Algoriphagus and Flavobacterium were chemoorganotrophs, often found in the phycosphere [31,32,33], which means that they could live on the algal cells. Flavobacterium and Rhizobium were known to stimulate the growth of algae [34,35]. Gemmobacter was potentially involved in symbiosis with algae [36]. Some genera, such as Fluviicola, were poorly understood in the context of environmental microbial functions. Alishewanella and Rheinheimera belong to the family Chromatiaceae of purple sulfur bacteria, which were found to be symbionts with algae [37]. According to their properties, the bacteria within these genera could probably benefit from the algae through multiple pathways. This may be an important reason these bacteria could regrow in large numbers after being affected by a high chlorine concentration.

4. Discussion

4.1. The Algal and Bacterial Regrowth Potential with Chlorinated RW

The result revealed a significant increase in algal regrowth following the addition of NaClO to RW-replenished landscape water (Figure 1a). However, the underlying mechanism remains unclear. Most studies relating to chlorine and algae were focused on investigating chlorine’s short-term removal of algae cells, elimination of algal toxins, and the specific disinfection byproducts, but little attention was paid to the algae regrowth after disinfection and the characteristics of algae in water [38,39,40,41]. Probable mechanisms could be oxidization of inhibitory chemicals or chemical exchanges with the remaining bacteria, which would need to go further using analytical chemistry methods to elucidate the mutualistic interactions between microalgae and bacteria under chlorine stress.
Bacterial regrowth was promoted as the algal density increased (Figure 3a). Several mechanisms have been proposed to explain why the abundance of bacteria was higher with higher algae biomass in aquatic environments. The presence of high algae biomass has been found to protect bacteria from UV radiation [42]. However, the illuminant in this study produces a negligible amount of UV radiation. Therefore, UV radiation cannot be responsible for the difference in bacterial regrowth. As an alternative, it was also suggested that algae could support the population of specific functional bacteria through oxygen supply or syntrophism (i.e., “cross-feeding”) [43,44].
Consequently, the regrowth potential of chlorinated RW, characterized by the maximum algal density and the absolute bacterial abundance, were 2.5-times and 10-times higher, respectively, compared with that of non-chlorinated RW. In the practice of replenishing landscape water with reclaimed water, this phenomenon should be taken into account.

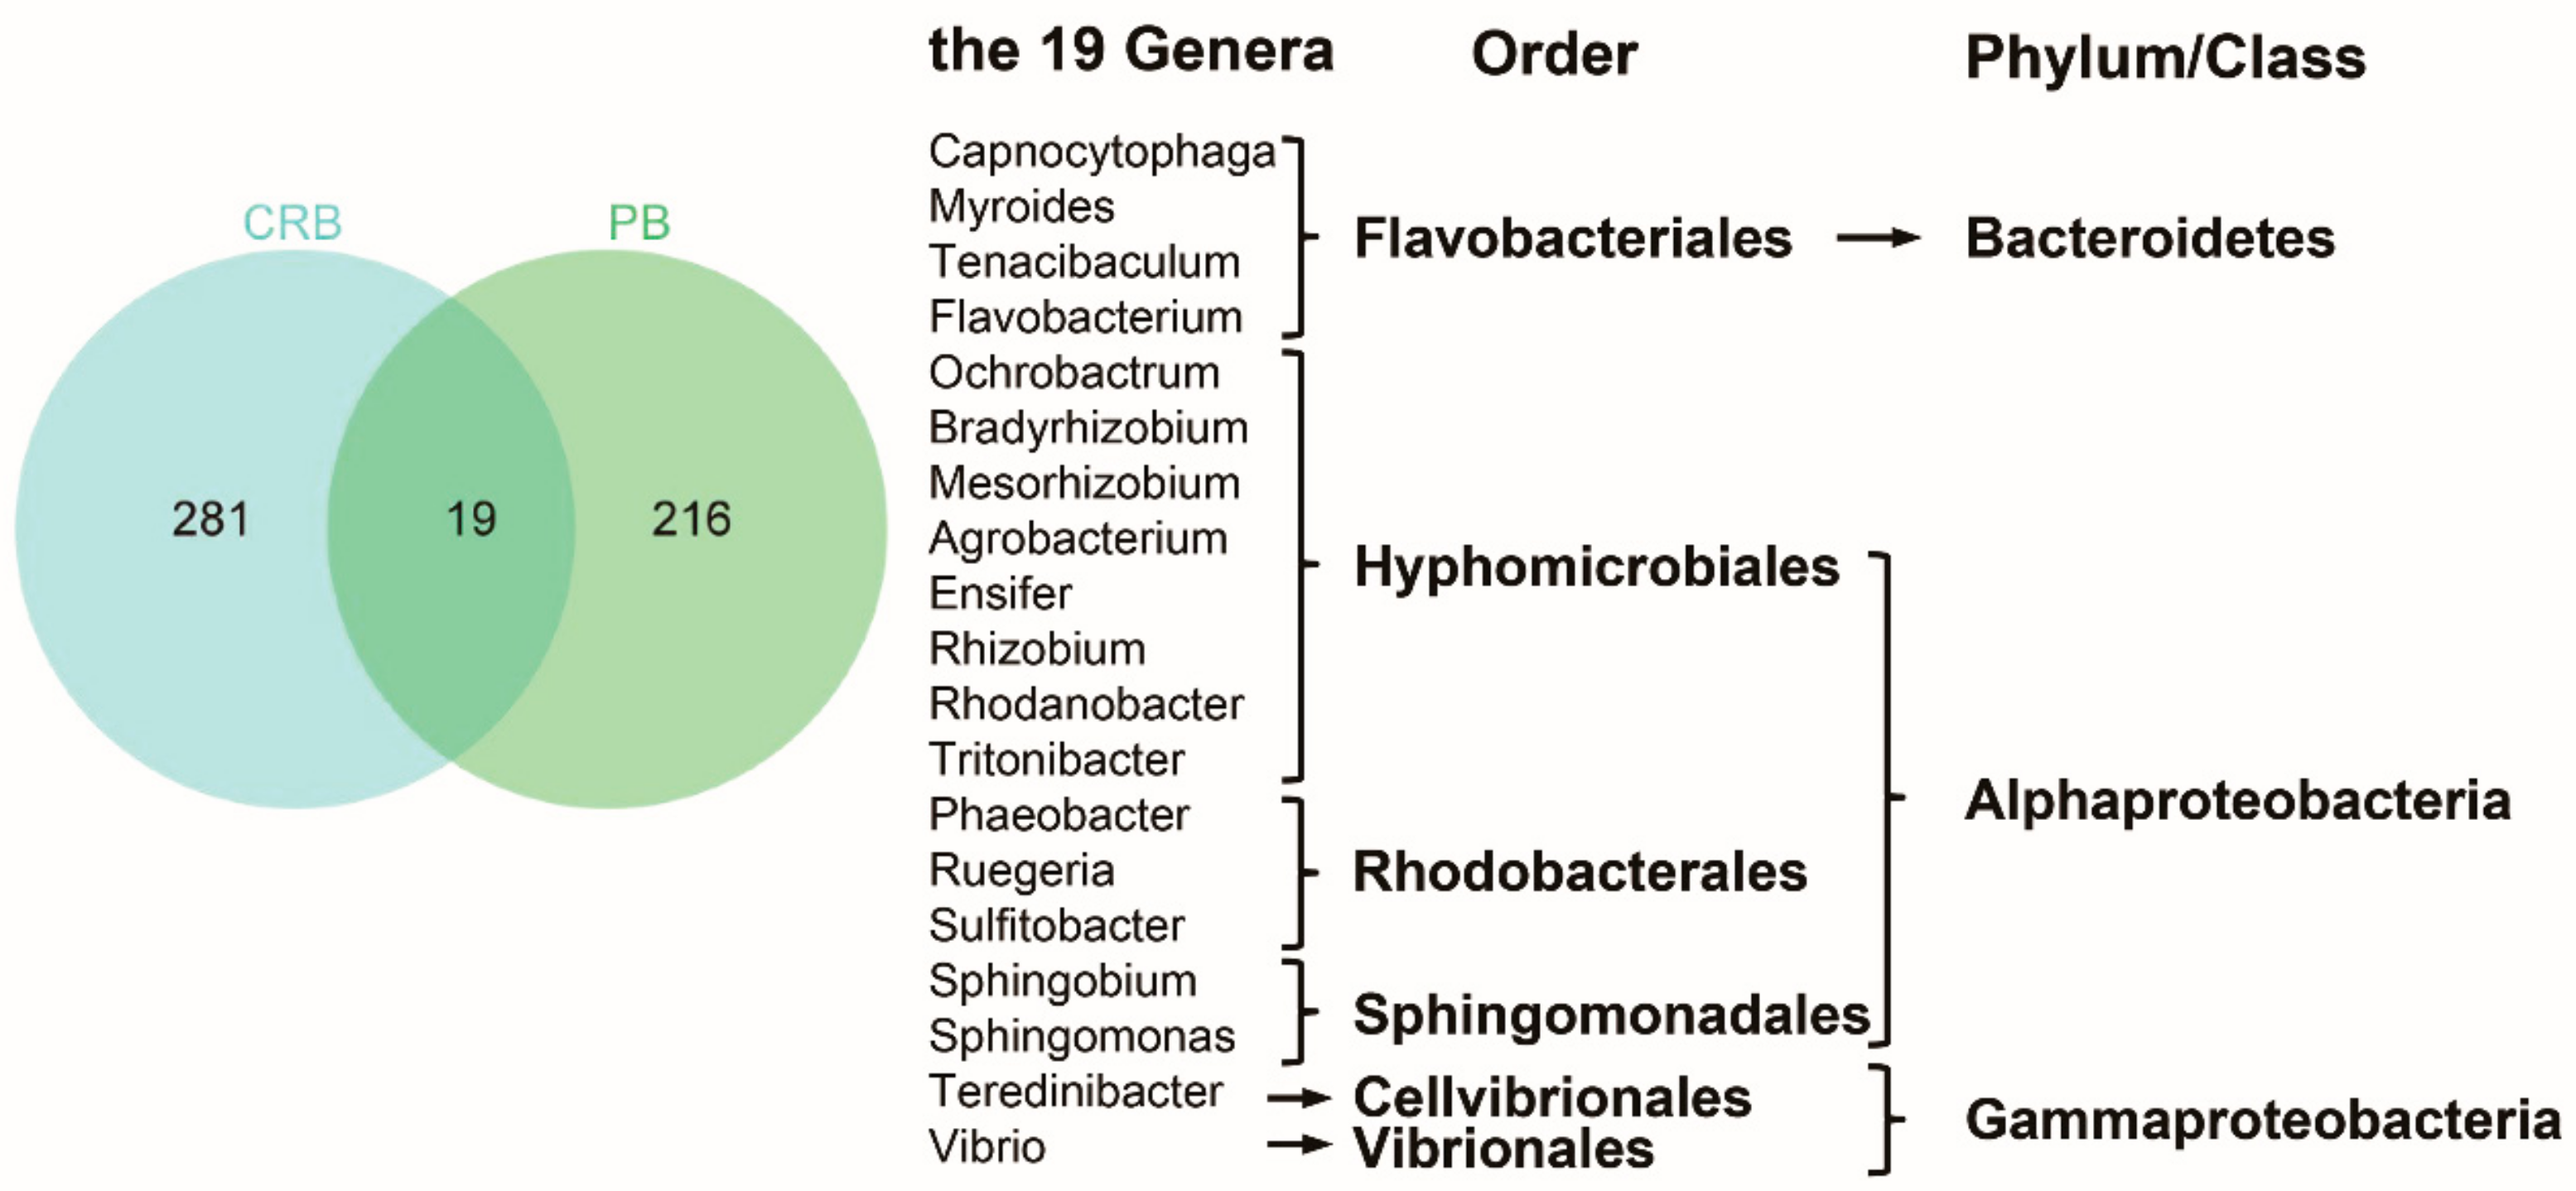
4.2. The Characteristics of Bacteria Regrew within Chlorinated RW

According to the current research and review, bacteria in the phyla of Bacteroidetes, Firmicutes, as well as alpha-, beta-, and gamma-Proteobacteria, were often presented as the dominant bacteria under chlorination disinfection process [45,46]. Acharya et al. [45] reported that beta- and gamma-proteobacteria were the predominant bacteria when the initial dose of chlorine was up to 3 mg-Cl/L, while the predominant bacteria changed to alphaproteobacteria at a higher chlorine dose of 5 mg-Cl/L. Luo et al. [13] reported tens of typical genera of CRB, including Pseudomonas, Bacillus, Mycobacterium, Legionella, Aeromonas, Sphingomonas, Acinetobacter, etc.
In comparison, the bacteria that were symbiotic with algae were identified as primarily belonging to the orders Cytophagales, Flavobacteriales, Rhodobacterales, Hyphomicrobiales (syn. Rhizobiales), and Sphingomonadales within class Alphaproteobacteria and phylum Bacteroidetes (Table S2). These bacteria were commonly reported to survive by exchanging infochemicals or nutrients with algae, and decomposing algal debris [47]. Here, we are not attempting to discuss the biochemical mechanisms deeply but to analyze the phylogenetic overlap between the chlorine-resistant bacteria (CRB) and the phycospheric bacteria (PB), revealing the relationship between the microbial functions and the assembly of the bacterial community.
Based on the summary of putative CRB and PB (Table S2), the bacteria that were both chlorine-resistant and symbiotic with algae (i.e., the overlapping region) are shown in Figure 6. The typical genera included Flavobacterium, Rhizobium, Bradyrhizobium, Agrobacterium, Sphingomonas and Vibrio, which partially occurred in our results. The bacteria in the overlapping region may probably have a higher occurrence rate of regrowth in chlorinated RW coupled with algal bloom. However, some genera in the results, for example, Mycobacterium, were less reported. Considering that the diversities of CRB and PB have not been extensively identified and summarized, with insufficient data from globally diverse environments and a lack of functional gene identification, the bacteria that can survive from chlorination and regrowth with algae bloom could be underestimated. Therefore, the bacteria involved in this study with unknown mechanisms deserve further attention, including Devosia, Orientia, Rheinheimera, and Alishewanella (Figure 5).

4.3. Ecological Risks Associated with Pathogenic Bacteria in Chlorinated RW

Opportunistic pathogens are microorganisms that do not normally cause disease but can become pathogenic following a perturbation to their host (e.g., disease, wound, medication, prior infection, immunodeficiency, and aging) [48]. Some opportunistic pathogens, which are facultative parasites called “environmental opportunists”, persist and grow in the outside host environment, and opportunistically invade host individuals. Thus, they were often affected by environmental variations [49,50].
As we discussed above, chlorination promoted the algal density and further supported a higher bacterial population, which may also raise the risk of exposure to some “environmental opportunists”. The combined effect of chlorination and algal bloom probably would reshape the characteristics of the pathogenic bacteria community. The results indicated that the bacteria within the genus of Mycobacterium, Rhizobium, Pseudomonas, and Sphingomonas survived chlorination. These bacteria were basically in the category of “environmental opportunists” [49], and most of them were also reported as phycospheric bacteria (Table S3). Many of these bacteria could exhibit a particle-attached life state and live in a symbiotic way to obtain nutrient resources from algae [51]. Therefore, they have a higher chance of surviving chlorination. In contrast, the bacteria within the genus Legionella, Bacillus, Leptospira, Streptococcus, and Pseudonocardia were remarkably inhibited after chlorination and algae regrowth. They were usually commensal with humans or other higher animals rather than algae. Due to a lack of protection and nutrient supply, they were more susceptible to being eliminated by the active chlorine in the aquatic environment.

5. Conclusions

This study focused on the algal–bacterial community in landscape water replenished with chlorinated RW. Results indicated that the algal growth was significantly promoted after the chlorination of reclaimed water. The most powerful explanation for this phenomenon was the formation of low-molecular substances from DOM oxidized by active chlorine. The total abundance of bacteria was also increased along with algal blooms. Algae supported phycospheric bacteria survival against chlorine disinfection, which resulted in a transmission risk of pathogens that could live in phycosphere. These results suggest that the secondary risks of chlorine disinfection include not only the bacteria regeneration, as most researchers have known, but also the promotion of algal growth. Therefore, when chlorinated reclaimed water is used for supplementing urban landscape ponds, attempts should be made to reduce the risk of pathogen transmission by controlling the bio-available organic carbons formed by reactive chlorine oxidation as well as the algal blooms.

Supplementary Materials

The following supporting information can be downloaded at: https://www.mdpi.com/article/10.3390/w14233893/s1. Figure S1: Method evaluation for spectrophotometric determination of algal density; Figure S2: The effect of sodium hypochlorite on bacterial regrowth in reclaimed water in the dark experiment. Figure S3: The interaction network of bacteria community at the class level under (a) chlorination and (b) non-chlorination conditions; Table S1: The water quality of RW and LW; Table S2: The dominant symbiotic bacteria taxa reported in previous studies; Table S3: The lifestyle of the potentially pathogenic bacteria in this study. References [52,53,54,55,56,57,58,59,60,61,62,63,64] are cited in Supplementary Materials.

Author Contributions

Conceptualization, M.L.; methodology, M.L.; software, M.L. and C.Z.; resources, P.L., J.S. and Y.S.; data curation, J.L. and C.Z.; writing—original draft preparation, M.L.; writing—review and editing, J.W., P.L. and J.S.; Project administration, J.W.; funding acquisition, M.L. and J.W. All authors have read and agreed to the published version of the manuscript.

Funding

This research was funded by [The Science and Technology Plan Project of the Ministry of Housing and Urban-rural Development of the People’s Republic of China] grant number [2021-K-128].

Data Availability Statement

The data presented in this study are available on request from the corresponding author.

Acknowledgments

The authors gratefully thank the support of The Science and Technology Plan Project of the Ministry of Housing and Urban-rural Development of the People’s Republic of China (2021-K-128).

Conflicts of Interest

The authors declare no conflict of interest. The funders had no role in the design of the study; in the collection, analyses, or interpretation of data; in the writing of the manuscript; or in the decision to publish the results.

References

  1. Li, J.; Wang, Y.; Xiong, H.; Tan, Z.; Lv, Z.; Zheng, K.; Zou, L.; Luo, G.; Ye, L.; Zhang, Z.; et al. Investigation and Optimization Strategies on the Operation of Disinfection Facilities in Municipal WWTPs. China Water Wastewater 2020, 36, 7–19. (In Chinese) [Google Scholar]
  2. Zhang, T.; Wei, H.; Yao, J.; Chen, G.; Xu, B. Comparison of Disinfection Efficiency of Different UV/Chlorination Combined Processes in Wastewater Treatment Plant. China Water Wastewater 2021, 37, 19–24. (In Chinese) [Google Scholar]
  3. Li, Z.; Song, G.; Bi, Y.; Gao, W.; He, A.; Lu, Y.; Wang, Y.; Jiang, G. Occurrence and Distribution of Disinfection Byproducts in Domestic Wastewater Effluent, Tap Water, and Surface Water during the SARS-CoV-2 Pandemic in China. Environ. Sci. Technol. 2021, 55, 4103–4114. [Google Scholar] [CrossRef]
  4. Wang, L.; Zhang, X.; Chen, S.; Meng, F.; Zhang, D.; Liu, Y.; Li, M.; Liu, X.; Huang, X.; Qu, J.H. Spatial variation of dissolved organic nitrogen in Wuhan surface waters: Correlation with the occurrence of disinfection byproducts during the COVID-19 pandemic. Water Res. 2021, 198, 117138. [Google Scholar] [CrossRef]
  5. Huang, G.; Ng, T.W.; Chen, H.; Chow, A.T.; Liu, S.; Wong, P.K. Formation of assimilable organic carbon (AOC) during drinking water disinfection: A microbiological prospect of disinfection byproducts. Environ. Int. 2020, 135, 105389. [Google Scholar] [CrossRef]
  6. Chen, Z.; Yu, T.; Ngo, H.H.; Lu, Y.; Li, G.; Wu, Q.; Li, K.; Bai, Y.; Liu, S.; Hu, H.Y. Assimilable organic carbon (AOC) variation in reclaimed water: Insight on biological stability evaluation and control for sustainable water reuse. Bioresour. Technol. 2018, 254, 290–299. [Google Scholar] [CrossRef] [PubMed]
  7. Elhadidy, A.M.; Van Dyke, M.I.; Peldszus, S.; Huck, P.M. Application of flow cytometry to monitor assimilable organic carbon (AOC) and microbial community changes in water. J. Microbiol. Methods 2016, 130, 154–163. [Google Scholar] [CrossRef]
  8. Munoz-Marin, M.C.; Gomez-Baena, G.; Lopez-Lozano, A.; Moreno-Cabezuelo, J.A.; Diez, J.; Garcia-Fernandez, J.M. Mixotrophy in marine picocyanobacteria: Use of organic compounds by Prochlorococcus and Synechococcus. ISME J. 2020, 14, 1065–1073. [Google Scholar] [CrossRef]
  9. Subashchandrabose, S.R.; Ramakrishnan, B.; Megharaj, M.; Venkateswarlu, K.; Naidu, R. Mixotrophic cyanobacteria and microalgae as distinctive biological agents for organic pollutant degradation. Environ. Int. 2013, 51, 59–72. [Google Scholar] [CrossRef]
  10. Ramanan, R.; Kim, B.H.; Cho, D.H.; Oh, H.M.; Kim, H.S. Algae-bacteria interactions: Evolution, ecology and emerging applications. Biotechnol. Adv. 2016, 34, 14–29. [Google Scholar] [CrossRef] [Green Version]
  11. Kazamia, E.; Helliwell, K.E.; Purton, S.; Smith, A.G. How mutualisms arise in phytoplankton communities: Building eco-evolutionary principles for aquatic microbes. Ecol. Lett. 2016, 19, 810–822. [Google Scholar] [CrossRef] [PubMed] [Green Version]
  12. Benton, T.G.; Solan, M.; Travis, J.M.; Sait, S.M. Microcosm experiments can inform global ecological problems. TRENDS Ecol. Evol. 2007, 22, 516–521. [Google Scholar] [CrossRef] [PubMed]
  13. Luo, L.W.; Wu, Y.H.; Yu, T.; Wang, Y.H.; Chen, G.Q.; Tong, X.; Bai, Y.; Xu, C.; Wang, H.B.; Ikuno, N.; et al. Evaluating method and potential risks of chlorine-resistant bacteria (CRB): A review. Water Res. 2021, 188, 116474. [Google Scholar] [CrossRef] [PubMed]
  14. American Public Health Association. 4500-Cl chlorine (residual). In Standard Methods For the Examination of Water and Wastewater; APHA Press: Washington, DC, USA, 2018. [Google Scholar]
  15. Fichot, C.G.; Benner, R. The spectral slope coefficient of chromophoric dissolved organic matter (S275–295) as a tracer of terrigenous dissolved organic carbon in river-influenced ocean margins. Limnol. Oceanogr. 2012, 57, 1453–1466. [Google Scholar] [CrossRef] [Green Version]
  16. Helms, J.R.; Stubbins, A.; Ritchie, J.D.; Minor, E.C.; Kieber, D.J.; Mopper, K. Absorption spectral slopes and slope ratios as indicators of molecular weight, source, and photobleaching of chromophoric dissolved organic matter. Limnol. Oceanogr. 2008, 53, 955–969. [Google Scholar] [CrossRef] [Green Version]
  17. Al-Juboori, R.A.; Yusaf, T.; Pittaway, P.A. Exploring the correlations between common UV measurements and chemical fractionation for natural waters. Desalination Water Treat. 2015, 57, 16324–16335. [Google Scholar] [CrossRef]
  18. Weishaar, J.L.; Aiken, G.R.; Bergamaschi, B.A.; Fram, M.S.; Fujii, R.; Mopper, K. Evaluation of Specific Ultraviolet Absorbance as an Indicator of the Chemical Composition and Reactivity of Dissolved Organic Carbon. Environ. Sci. Technol. 2003, 37, 4702–4708. [Google Scholar] [CrossRef]
  19. Fadeev, E.; Cardozo-Mino, M.G.; Rapp, J.Z.; Bienhold, C.; Salter, I.; Salman-Carvalho, V.; Molari, M.; Tegetmeyer, H.E.; Buttigieg, P.L.; Boetius, A. Comparison of Two 16S rRNA Primers (V3-V4 and V4-V5) for Studies of Arctic Microbial Communities. Front. Microbiol. 2021, 12, 637526. [Google Scholar] [CrossRef]
  20. Ueda, H.; Otsuka, S.; Senoo, K. Bacterial Communities Constructed in Artificial Consortia of Bacteria and Chlorella vulgaris. Microbes Environ. 2010, 25, 36–40. [Google Scholar] [CrossRef] [Green Version]
  21. Gao, Y.X.; Li, X.; Zhao, J.R.; Zhang, Z.X.; Fan, X.Y. Response of microbial communities based on full-scale classification and antibiotic resistance genes to azithromycin and copper combined pollution in activated sludge nitrification laboratory mesocosms at low temperature. Bioresour. Technol. 2021, 341, 125859. [Google Scholar] [CrossRef]
  22. Wei, M.; Li, C.; Dai, Y.; Zhou, H.; Cui, Y.; Zeng, Y.; Huang, Q.; Wang, Q. High-Throughput Absolute Quantification Sequencing Revealed Osteoporosis- Related Gut Microbiota Alterations in Han Chinese Elderly. Front. Cell Infect. Microbiol. 2021, 11, 630372. [Google Scholar] [CrossRef]
  23. Nyholm, N. Response variable in algal growth inhibition tests—Biomass or growth rate? Water Research 1985, 19, 273–279. [Google Scholar] [CrossRef]
  24. Shi, Z.; Xu, H.; Wang, Z.; Du, H.; Fu, X. Effects of co-exposure to copper and humic acids on microalga Chlorella vulgaris: Growth inhibition, oxidative stress, and extracellular secretion. Environ. Pollut. Bioavailab. 2021, 33, 415–424. [Google Scholar] [CrossRef]
  25. Zheng, Y.; Chi, Z.; Lucker, B.; Chen, S. Two-stage heterotrophic and phototrophic culture strategy for algal biomass and lipid production. Bioresour. Technol. 2012, 103, 484–488. [Google Scholar] [CrossRef]
  26. Lee, Y.-K. Algal Nutrition—Heterotrophic Carbon Nutrition. In Handbook of Microalgal Culture: Biotechnology and Applied Phycology; Richmond, A., Ed.; Blackwell Publishing Ltd.: Oxford, UK, 2004. [Google Scholar]
  27. Sheppard, S.K. Strain wars and the evolution of opportunistic pathogens. Curr. Opin. Microbiol. 2022, 67, 102138. [Google Scholar] [CrossRef] [PubMed]
  28. Wu, G.; Yang, J.; Jiang, H.; Deng, Y.; Lear, G. Distribution of potentially pathogenic bacteria in the groundwater of the Jianghan Plain, central China. Int. Biodeterior. Biodegrad. 2019, 143, 104711. [Google Scholar] [CrossRef]
  29. Fan, C.; Li, Y.; Liu, P.; Mu, F.; Xie, Z.; Lu, R.; Qi, Y.; Wang, B.; Jin, C. Characteristics of airborne opportunistic pathogenic bacteria during autumn and winter in Xi’an, China. Sci. Total Environ. 2019, 672, 834–845. [Google Scholar] [CrossRef] [PubMed]
  30. Landi, P.; Minoarivelo, H.O.; Brännström, Å.; Hui, C.; Dieckmann, U. Complexity and stability of ecological networks: A review of the theory. Popul. Ecol. 2018, 60, 319–345. [Google Scholar] [CrossRef]
  31. Zabel, R.A.; Morrell, J.J. Wood Microbiology (Second Edition)-Decay and Its Prevention; Academic Press: Cambridge, MA, USA, 2020. [Google Scholar]
  32. Ramanan, R.; Kang, Z.; Kim, B.H.; Cho, D.H.; Jin, L.; Oh, H.M.; Kim, H.S. Phycosphere bacterial diversity in green algae reveals an apparent similarity across habitats. Algal Res. Biomass Biofuels Bioprod. 2015, 8, 140–144. [Google Scholar] [CrossRef]
  33. Gomez-Pereira, P.R.; Fuchs, B.M.; Alonso, C.; Oliver, M.J.; Van Beusekom, J.E.E.; Amann, R. Distinct flavobacterial communities in contrasting water masses of the North Atlantic Ocean. Isme J. 2010, 4, 472–487. [Google Scholar] [CrossRef]
  34. Kim, B.H.; Ramanan, R.; Cho, D.H.; Oh, H.M.; Kim, H.S. Role of Rhizobium, a plant growth promoting bacterium, in enhancing algal biomass through mutualistic interaction. Biomass Bioenergy 2014, 69, 95–105. [Google Scholar] [CrossRef]
  35. Cho, D.H.; Ramanan, R.; Heo, J.; Lee, J.; Kim, B.H.; Oh, H.M.; Kim, H.S. Enhancing microalgal biomass productivity by engineering a microalgal-bacterial community. Bioresour. Technol. 2015, 175, 578–585. [Google Scholar] [CrossRef]
  36. Shi, M.; Li, J.; Zhou, Q.; Wang, G.; Zhang, W.; Zhang, Z.; Gao, Y.; Yan, S. Interactions between elevated CO2 levels and floating aquatic plants on the alteration of bacterial function in carbon assimilation and decomposition in eutrophic waters. Water Res. 2020, 171, 115398. [Google Scholar] [CrossRef]
  37. Munoz-Gomez, S.A.; Kreutz, M.; Hess, S. A microbial eukaryote with a unique combination of purple bacteria and green algae as endosymbionts. Sci. Adv. 2021, 7, eabg4102. [Google Scholar] [CrossRef]
  38. Garoma, T.; Yazdi, R.E. Investigation of the disruption of algal biomass with chlorine. BMC Plant Biol. 2019, 19, 18. [Google Scholar] [CrossRef]
  39. Liu, C.; Shin, Y.H.; Wei, X.; Ersan, M.S.; Wagner, E.; Plewa, M.J.; Amy, G.; Karanfil, T. Preferential Halogenation of Algal Organic Matter by Iodine over Chlorine and Bromine: Formation of Disinfection Byproducts and Correlation with Toxicity of Disinfected Waters. Environ. Sci. Technol. 2022, 56, 1244–1256. [Google Scholar] [CrossRef] [PubMed]
  40. Sathasivam, R.; Ebenezer, V.; Guo, R.Y.; Ki, J.S. Physiological and biochemical responses of the freshwater green algae Closterium ehrenbergii to the common disinfectant chlorine. Ecotoxicol. Environ. Saf. 2016, 133, 501–508. [Google Scholar] [CrossRef] [PubMed]
  41. Gad, A.a.M.; El-Tawel, S. Effect of pre-oxidation by chlorine/permanganate on surface water characteristics and algal toxins. Desalin. Water Treat. 2016, 57, 17922–17934. [Google Scholar] [CrossRef]
  42. Chen, R.; Ao, D.; Ji, J.Y.; Wang, X.C.C.; Li, Y.Y.; Huang, Y.; Xue, T.; Guo, H.B.; Wang, N.; Zhang, L. Insight into the risk of replenishing urban landscape ponds with reclaimed wastewater. J. Hazard. Mater. 2017, 324, 573–582. [Google Scholar] [CrossRef] [PubMed]
  43. Lin, Y.; Wang, L.; Xu, K.; Huang, H.; Ren, H. Algae Biofilm Reduces Microbe-Derived Dissolved Organic Nitrogen Discharges: Performance and Mechanisms. Environ. Sci. Technol. 2021, 55, 6227–6238. [Google Scholar] [CrossRef] [PubMed]
  44. Bankston, E.; Wang, Q.; Higgins, B.T. Algae support populations of heterotrophic, nitrifying, and phosphate-accumulating bacteria in the treatment of poultry litter anaerobic digestate. Chem. Eng. J. 2020, 398, 122550. [Google Scholar] [CrossRef]
  45. Acharya, S.M.; Kurisu, F.; Kasuga, I.; Furumai, H. Chlorine Dose Determines Bacterial Community Structure of Subsequent Regrowth in Reclaimed Water. J. Water Environ. Technol. 2016, 14, 15–24. [Google Scholar] [CrossRef]
  46. Wang, H.; Wu, Y.; Luo, L.; Yu, T.; Xu, A.; Xue, S.; Chen, G.; Ni, X.-Y.; Peng, L.; Chen, Z.; et al. Risks, characteristics, and control strategies of disinfection-residual-bacteria (DRB) from the perspective of microbial community structure. Water Res. 2021, 204, 117606. [Google Scholar] [CrossRef] [PubMed]
  47. Zhou, J.; Lyu, Y.H.; Richlen, M.L.; Anderson, D.M.; Cai, Z.H. Quorum Sensing Is a Language of Chemical Signals and Plays an Ecological Role in Algal-Bacterial Interactions. Crit. Rev. Plant Sci. 2016, 35, 81–105. [Google Scholar] [CrossRef] [PubMed]
  48. Smith, R.; Russo, J.; Fiegel, J.; Brogden, N. Antibiotic Delivery Strategies to Treat Skin Infections When Innate Antimicrobial Defense Fails. Antibiotics 2020, 9, 56. [Google Scholar] [CrossRef] [Green Version]
  49. Brown, S.P.; Cornforth, D.M.; Mideo, N. Evolution of virulence in opportunistic pathogens: Generalism, plasticity, and control. Trends Microbiol. 2012, 20, 336–342. [Google Scholar] [CrossRef] [PubMed] [Green Version]
  50. Anttila, J.; Kaitala, V.; Laakso, J.; Ruokolainen, L. Environmental Variation Generates Environmental Opportunist Pathogen Outbreaks. PLoS ONE 2015, 10, e0145511. [Google Scholar] [CrossRef]
  51. Fang, T.; Cui, Q.; Huang, Y.; Dong, P.; Wang, H.; Liu, W.T.; Ye, Q. Distribution comparison and risk assessment of free-floating and particle-attached bacterial pathogens in urban recreational water: Implications for water quality management. Sci. Total Environ. 2018, 613–614, 428–438. [Google Scholar] [CrossRef]
  52. Gueretz, J.S.; Da Silva, F.A.; Simionatto, E.L.; Ferard, J.F.; Radetski, C.M.; Somensi, C.A. A multi-parametric study of the interaction between the Parati river and Babitonga Bay in terms of water quality. J. Env. Sci. Health B 2020, 55, 257–264. [Google Scholar] [CrossRef]
  53. Park, B.S.; Choi, W.J.; Guo, R.Y.; Kim, H.; Ki, J.S. Changes in Free-Living and Particle-Associated Bacterial Communities Depending on the Growth Phases of Marine Green Algae, Tetraselmis suecica. J. Mar. Sci. Eng. 2021, 9, 171. [Google Scholar] [CrossRef]
  54. Qi, F.; Jia, Y.T.; Mu, R.M.; Ma, G.X.; Guo, Q.Y.; Meng, Q.Y.; Yu, G.J.; Xie, J. Convergent community structure of algal-bacterial consortia and its effects on advanced wastewater treatment and biomass production. Sci. Rep. 2021, 11, 21118. [Google Scholar] [CrossRef] [PubMed]
  55. Hattenrath-Lehmann, T.K.; Gobler, C.J. Identification of unique microbiomes associated with harmful algal blooms caused by Alexandrium fundyense and Dinophysis acuminata. Harmful Algae 2017, 68, 17–30. [Google Scholar] [CrossRef] [PubMed]
  56. Yang, C.; Li, Y.; Zhou, Y.; Zheng, W.; Tian, Y.; Zheng, T. Bacterial community dynamics during a bloom caused by Akashiwo sanguinea in the Xiamen sea area, China. Harmful Algae 2012, 20, 132–141. [Google Scholar] [CrossRef]
  57. Fulbright, S.P.; Robbins-Pianka, A.; Berg-Lyons, D.; Knight, R.; Reardon, K.F.; Chisholm, S.T. Bacterial community changes in an industrial algae production system. Algal Res. Biomass Biofuels Bioprod. 2018, 31, 147–156. [Google Scholar] [CrossRef] [PubMed]
  58. Cantera, S.; Fischer, P.Q.; Sanchez-Andrea, I.; Marin, D.; Sousa, D.Z.; Munoz, R. Impact of the algal-bacterial community structure, physio-types and biological and environmental interactions on the performance of a high rate algal pond treating biogas and wastewater. Fuel 2021, 302, 121148. [Google Scholar] [CrossRef]
  59. Kruger, K.; Chafee, M.; Ben Francis, T.; Glavina Del Rio, T.; Becher, D.; Schweder, T.; Amann, R.I.; Teeling, H. In marine Bacteroidetes the bulk of glycan degradation during algae blooms is mediated by few clades using a restricted set of genes. ISME J. 2019, 13, 2800–2816. [Google Scholar] [CrossRef] [PubMed] [Green Version]
  60. Francis, T.B.; Kruger, K.; Fuchs, B.M.; Teeling, H.; Amann, R.I. Candidatus Prosiliicoccus vernus, a spring phytoplankton bloom associated member of the Flavobacteriaceae. Syst. Appl. Microbiol. 2019, 42, 41–53. [Google Scholar] [CrossRef]
  61. Balleza, D.; Quinto, C.; Elias, D.; Gomez-Lagunas, F. A high-conductance cation channel from the inner membrane of the free-living soil bacteria Rhizobium etli. Arch. Microbiol. 2010, 192, 595–602. [Google Scholar] [CrossRef]
  62. Shao, K.Q.; Zhang, L.; Wang, Y.P.; Yao, X.; Tang, X.M.; Qin, B.Q.; Gao, G. The responses of the taxa composition of particle-attached bacterial community to the decomposition of Microcystis blooms. Sci. Total Environ. 2014, 488, 236–242. [Google Scholar] [CrossRef]
  63. Chakraborty, D.; Sharma, G.D.; Deb, B. Diversity of Free Living Nitrogen Fixing Bacteria in Sugarcane Rhizosphere of Barak Valley, Assam. J. Pure Appl. Microbiol. 2012, 6, 1351–1355. [Google Scholar]
  64. Islam, M.R.; Madhaiyan, M.; Boruah, H.P.D.; Yim, W.; Lee, G.; Saravanan, V.S.; Fu, Q.L.; Hu, H.Q.; Sa, T. Characterization of Plant Growth-Promoting Traits of Free-Living Diazotrophic Bacteria and Their Inoculation Effects on Growth and Nitrogen Uptake of Crop Plants. J. Microbiol. Biotechnol. 2009, 19, 1213–1222. [Google Scholar] [CrossRef] [PubMed]
Figure 1. Characteristics of algal growth and chlorine decay. (a) Algal density in non-chlorinated groups, (b) algal density in chlorinated groups, (c) concentrations of free chlorine, and (d) the specific growth rate (rm) of algae, the "ns" indicates no significant change.
Water 14 03893 g001
Figure 2. The characteristics of DOM under chlorine oxidation. (a) The change of average molecular weight of DOM (SR Value). (b) The hydrophobicity of DOM (E254/E204 value). (c) The aromaticity of DOM (SUVA254).
Water 14 03893 g002
Figure 3. (a) Non-metric multidimensional scaling (NMDS) ordination of bacterial communities of all taxa, showing the differences of bacterial communities among 11 experimental treatments, which could be divided into three categories: “N” represents groups with different nutrient levels (i.e., N1~N6), “LD” represents groups with low dosages of NaClO (i.e., D1 and D2), “HD” presents groups with high dosages of NaClO (i.e., D3~D5). (b) Changes in the abundance of dominant phyla (>0.5%) among 11 treatments. The phylum Proteobacteria was subdivided into the class level.
Water 14 03893 g003
Figure 4. Relation between the chlorine addition and the bacterial response. (a) Dominant bacteria at phyla level, (b) rare bacteria at phyla level, and (c) bacteria in phylum Proteobacteria. (d) Heatmap analysis of the relative abundance of potentially pathogenic bacteria identified in the experiment under different conditions. The raw data were processed with logarithmic transformation. (e) The relative abundance of the potentially pathogenic bacteria, and the values represent the maximum abundance among groups.
Water 14 03893 g004
Figure 5. The relation of algae and bacteria in the systems. (a) Pearson correlation between Nmax of algae and absolute abundance of bacteria. (b) Typical bacteria that were positively related to algal growth. The star mark (*) means p < 0.05 and the double star mark (**) means p < 0.01.
Water 14 03893 g005
Figure 6. The characteristics of overlapping regions of the putative chlorine-resistant bacteria (CRB) and phycospheric bacteria (PB) and the typical genera.
Water 14 03893 g006
Table 1. The initial conditions and grouping of the experiments.
GroupsIndex
TN a
(mg/L)
N O 3 −N a
(mg/L)
N H 4 + −N
(mg/L)
TP a
(mg/L)
SRP b
(mg/L)
CODcr
(mg/L)
Chlorine
(mg-Cl/L)
pHTDS
(mg/L)
ORP
(mV)
NC2.13 ± 0.042.04 ± 0.02<0.1<0.01<0.01N.D.07.5~7.81200~1400195~215
N15.91 ± 0.104.43 ± 0.050.61 ± 0.110.15 ± 0.010.05 ± 0.0121.3 ± 1.0
N210.6 ± 0.139.33 ± 0.09
N314.3 ± 0.2213.1 ± 0.11
N45.79 ± 0.084.52 ± 0.070.30 ± 0.020.18 ± 0.02
N510.3 ± 0.159.55 ± 0.09
N614.2 ± 0.2812.9 ± 0.15
D110.4 ± 0.209.43 ± 0.110.61 ± 0.110.30 ± 0.020.18 ± 0.0219.2 ± 1.50.1
D20.5
D31.0
D43.0
D55.0
Notes: a Concentration gradients of TN and nitrate were achieved by adding sodium nitrate; TP gradients was adjusted by adding monopotassium phosphate. The ammonia concentration remained as it was. b SRP: Soluble reactive phosphorus. N.D.: Not detectable.
Table 2. The method and description of DOM indicators.
IndicatorsQuantification MethodsEnvironmental MeaningsReference
SRThe ratio of spectral slopes in the band of 275~295 nm and 350~400 nm.To characterize the molecular weight of DOM; A higher value indicates a smaller molecular weight.[15,16]
E254/E204The ratio of α254 to α204; α254 and α204 are the absorption coefficients of the sample at 254 nm and 204 nm, respectively.To characterize the hydrophobic property of DOM; A higher value indicates a higher hydrophobicity.[17]
SUVA254The ratio of α254 to DOC; α254 is the absorption coefficients of the sample at 254 nm, and the DOC is the concentration of dissolved organic carbons.To characterize the aromaticity of DOM; A higher value indicates a higher aromaticity.[18]
Table 3. The taxonomic and putative functions of the bacteria associated with algae.
GenusTaxonomic AnnotationPutative Eco-Functions
OrderClassPhylum
AlgoriphagusCytophagalesCytophagiaBacteroidetesDegradation of high molecular organic matters
MycobacteriumCorynebacterialesActinomycetiaActinobacteriaUnclear
GemmobacterRhodobacteralesAlphaproteobacteriaProteobacteriaDissimilatory nitrate reduction
FlavobacteriumFlavobacterialesFlavobacteriiaBacteroidetesDegradation of complex organic matters
FluviicolaFlavobacterialesFlavobacteriiaBacteroidetes
RhizobiumHyphomicrobialesAlphaproteobacteriaProteobacterialysis of algal cells and its toxin degradation
DevosiaHyphomicrobialesAlphaproteobacteriaProteobacteriaUnclear.
Probably Nitrogen-fixing
RheinheimeraChromatialesGammaproteobacteriaProteobacteriaAnoxygenic photosynthesis and symbionts with algae
AlishewanellaChromatialesGammaproteobacteriaProteobacteria
OrientiaRickettsialesAlphaproteobacteriaProteobacteriaUnclear
Publisher’s Note: MDPI stays neutral with regard to jurisdictional claims in published maps and institutional affiliations.

