Article

Coupling Hydrochemistry and Stable Isotopes (δ2H, δ18O and 87Sr/86Sr) to Identify the Major Factors Affecting the Hydrochemical Process of Groundwater and Surface Water in the Lower Reaches of the Yarlung-Zangbo River, Southern Tibet, Southwestern China

1
Key Laboratory of Geological Survey and Evaluation of Ministry of Education, China University of Geosciences, Wuhan 430074, China
2
Research Center of Applied Geology of China Geological Survey, Chengdu 610036, China
3
Faculty of Geosciences and Environmental Engineering, Southwest Jiaotong University, Chengdu 611756, China
4
Yibin Research Institute, Southwest Jiaotong University, Yibin 644000, China
5
Chengdu Centre, China Geological Survey, Chengdu 610081, China
*
Author to whom correspondence should be addressed.
Water 2022, 14(23), 3906; https://doi.org/10.3390/w14233906
Submission received: 5 November 2022 / Revised: 19 November 2022 / Accepted: 21 November 2022 / Published: 1 December 2022
(This article belongs to the Topic Groundwater Pollution Control and Groundwater Management)

Abstract

:
In Tibet, water resource has been less studied due to remote and harsh conditions. In this study, hydrochemistry and stable isotopes (δ2H, δ18O and 87Sr/86Sr) were employed to investigate the major factors affecting the hydrochemical process of groundwater and surface water in the lower reaches of the Yarlung-Zangbo River, southern Tibet. Groundwater and surface water were weakly alkaline and very soft to moderately hard water. The hydrochemical type of surface water is mainly Ca-HCO3 (mainstream) and Ca-SO4-HCO3 (tributary), while the hydrochemical type of groundwater was mainly Ca-SO4-HCO3. Multivariate statistical analysis and Gibbs analysis proposed hydrochemical components were dominated by water-rock interaction. Ion ratio, saturation index, and Sr isotope revealed calcite dissolution and silicate weathering with local sulfide oxidation were involved in water–rock interaction. D-O isotopes indicated the recharge source was mainly derived from atmosphere precipitation. The entropy-weighted water quality index indicated surface water and groundwater reach the standard of drinking purpose in the lower reaches of the Yarlung-Zangbo River. The hydrochemical type varied regularly along the Yarlung-Zangbo River. The dissolution of carbonate rocks and local silicate weather and evaporate dissolution are the primary hydrochemical process along the Yarlung-Zangbo River. This study would provide a preliminary insight for hydrochemical process in the Yarlung-Zangbo River.

1. Introduction

Water resources are of great significance to human existence. In decades, water resources are becoming scarce, resulting in a shortage of water due to rapid economic development and explosive population growth worldwide. Sustainable water resource exploitation has become an urgent issue that is yet to be resolved [1,2,3]. Of note, water resources fail to meet the drinking standard due to various natural processes (e.g., water-rock interaction, climate change) and human activities (e.g., municipal sewage and agricultural irrigation). Water quality is determined by the chemical compositions related to water genesis. So far, a large number of research have concentrated on the hydrochemical genesis and quality of water resource in basin and plain areas [4,5,6,7,8]. In contrast, less studies have concentrated on water resource in the alpine area due to remote location and severe condition. Water resource in the alpine area (e.g., Tibet, Alps, etc.,) are important with regard to the origin of regional rivers such as Yangtze River, Rhine River, and etc. Therefore, the study of water resource in the alpine area will provide unique insights that will be helpful for sustainable water management.
The Qinghai-Tibet Plateau, with an average elevation of over 4000 m, is the highest alpine area on earth. It is rich in water resources and thus is known as the “Asia’s Water Tower”, feeding more than ten famous Asian rivers such as the Yangtze, Yellow, Yarlung-Zangbo, etc. The water volume of 9 × 10⁸ m3 has been investigated in the Qinghai-Tibet Plateau, feeding a population of 30 × 108 in the world. Due to the harsh geo-environment, only a few studies on water resource have been conducted in the Qinghai-Tibet Plateau. More knowledge on water resource in the Qinghai-Tibet Plateau is yet to be achieved for sustainable development.
The Yarlung-Zangbo River is located in the southern part of the Tibetan Plateau, with an average elevation of more than 3000 m, making it one of the highest rivers in the world. It originates from the Jemayangtse glacier at the northern foot of the Himalayas, traverses southern Tibet from west to east, and finally flows out of the Chinese into India. Millions of populations are living along the Yarlung-Zangbo River. Previous studies mainly focused on the upper and middle reaches of the Yarlung-Zangbo River. Mao et al., found the spatiotemporal variability of heavy metals and identify the source in the Lhasa River of the Yarlung-Zangbo River [9]. Li et al., investigated the heavy metal distribution along the Yarlung-Zangbo River [10]. Tan et al., analyzed the recharge sources and flow paths of groundwater by O and H isotopes, major ions, and 222Rn concentrations in the middle reaches of the Yarlung-Zangbo River [11]. Shi et al., uncovered the water–rock interaction mechanisms of seasonal river–groundwater circulation using major ions and isotopes (2H, 3H, 18O, and Sr) in the middle reaches of the Yarlungzangbo River [12]. So far, less attention has been paid to the lower reaches of the Yarlung-Zangbo River, hampering the comprehensive understanding of water resource in the Yarlung-Zangbo River.
In this study, surface water and groundwater samples were collected for hydrochemical and D-O-Sr isotopic analyses in the lower reaches of the Yarlung-Zangbo River. This study aims to (1) identify the hydrochemical characteristics of groundwater and surface water; (2) recognize the factors controlling the hydrochemical components; (3) assess the quality of groundwater and surface water; (4) provide a comprehensive understanding for hydrochemical process along the whole Yarlung-Zangbo River. The achievements will immensely contribute to the sustainable exploitation of water resource in the Yarlung-Zangbo River.

2. Materials and Methods

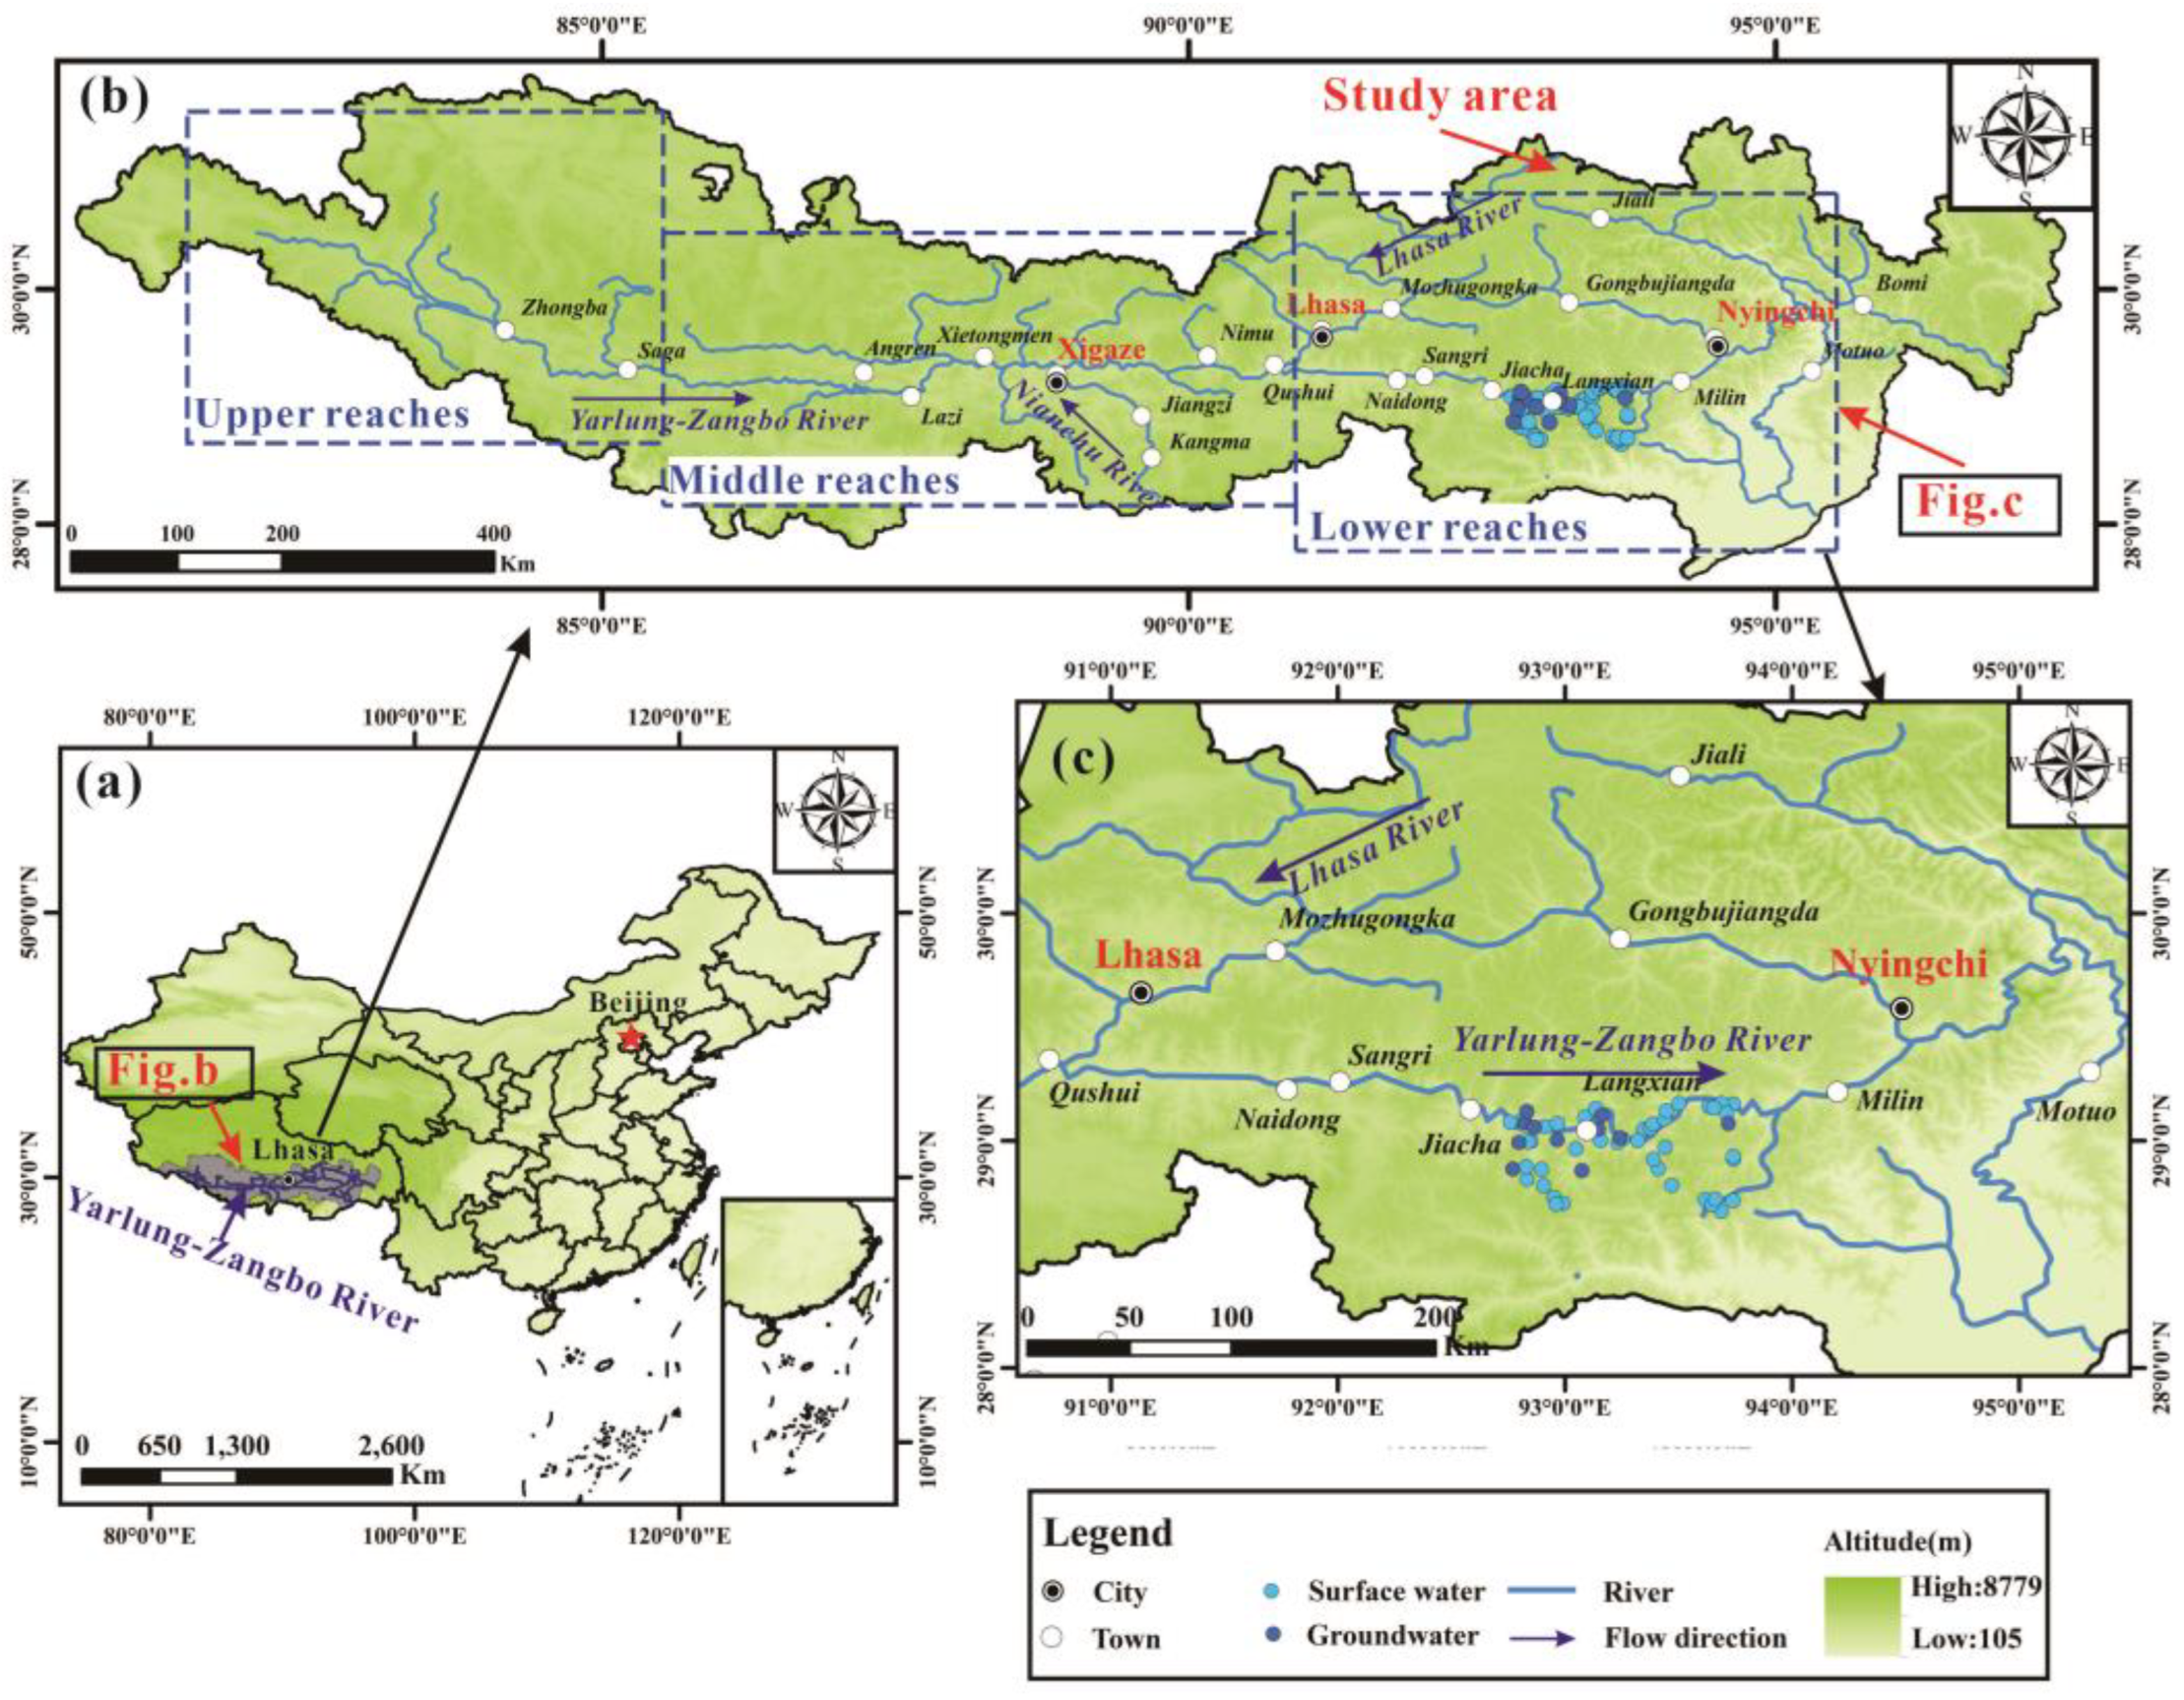
2.1. Description of the Study Area

The Yarlung-Zangbo River traverses in the southern Tibet of southwestern China. The study area is located in the lower reaches of the Yarlung-Zangbo River (Figure 1), between the latitude (N) 92.7–93.8° and longitude (E) 28.6–29.2°. The average altitude of the lower reaches of the river is about 3100 m. The lower reaches is about 496.3 km in length, accounting for 24% in total. And the catchment area is about 49,959 km2, accounting for 21% in total watershed area. The lower reaches of the Yarlung-Zangbo River is located in a humid subtropical climate zone, with an average annual temperature of 8–10 °C. It is dry in winter and spring and rainy in summer and autumn, influenced by the warm and humid Indian Ocean monsoon. The average annual precipitation is higher than 2000 mm and is mainly concentrated in July to September. The annual runoff is mainly recharged by atmospheric precipitation, glacial meltwater, and groundwater.
The lower reaches of the Yangtze River are located at the intersection of the Himalayas, the Nyingchi-Tanggula Range and the Hengduan Mountains, near the Eastern Himalayan Syntaxis where the Eurasian and Indian plates collide [13,14,15]. The types of strata are various in the study area. In the Gacha County, the strata are mainly composed of Triassic slate (carbonaceous), microphyllite, and metamorphic sandstone. In the Lang County, the strata mainly consist of pre-Quakotanian strata, with lithology dominated by granulite, marble, and plagiogneiss. In the Milin County, the strata are comprised of the Cretaceous diorite granite and mica amphibolite. Groundwater is recharged by atmosphere precipitation on the mountain top. Afterwards, it flows along the extensional faults and fractures and finally exposes as springs in the valley. The flow of springs is 0.2 to 1 L/s.

2.2. Field Samples and Laboratory Analysis

Field observations and sampling were carried out in July–August of 2019. pH and total dissolved solids (TDS) were measured in situ by a portable multi-meter device (WTW multi 3400i). Before bottling, three-time rinsing was conducted by sampling water. A total of 43 surface water and 11 groundwater samples were collected in this study. All water samples were transported to the laboratory under 3 °C within a week. The experimental analysis was done in the Beijing Createch Testing Technology Co., Ltd., Beijing, China. K+, Na+, Ca2+, Mg2+, Cl, SO42−, NO3, and F were measured by ion chromatography. HCO3 was measured by titration with HNO3. The charge balance error (CBE) was examined by the error within 5% (Equation (1)). Sr and Sr isotope were analyzed using Element XR ICP-MS. D-O isotopes were determined by Finnigan MAT253 mass spectrometer according to the VSMOW standard.
CBE ( % ) = ( Mg 2 + + Ca 2 + + Na + + K + ) ( HCO 3 + SO 4 2 + NO 3 + Cl + F ) ( Mg 2 + + Ca 2 + + Na + + K + ) + ( HCO 3 + SO 4 2 + NO 3 + Cl + F ) × 100
Calculation of saturation index (SI) using Phreeqc 3.0 based on MINTEQ database. As Formula (2):
SI = log (IAP/K)
where IAP is the product of ion activity and K is the equilibrium constant. A mineral with SI > 0 is supersaturated and precipitates, while a mineral with SI < 0 is unsaturated and dissolves.

3. Results

3.1. Statistical Results of Hydrochemical Parameters

Statistical analysis is usually used to analyze general hydrogeochemical characteristics [16]. In Table 1 and Figure 2, the pH values of surface water and groundwater had a small range from 7.20 to 9.20 and from 7.90 to 8.90, with mean values of 8.35 and 8.47. pH values showed that surface water and groundwater were weakly alkaline. The total hardness (TH) of surface water and groundwater varied from 9.00 to 343.00 mg/L and 54.00 to 259.00 mg/L, with mean values of 92.77 mg/L and 158.18 mg/L. In general, the TH value is subdivided into five degrees, including very soft (0–75 mg/L), soft (75–150 mg/L), medium hard (150–300 mg/L), hard (300–450 mg/L), and very hard (>450 mg/L). In Figure 3a, most of the surface water and groundwater belonged to very soft to moderately hard water. The total dissolved solids (TDS) content of surface water and groundwater varied from 11.00 to 470.00 mg/L and 67.00 to 357.00 mg/L with mean values of 118.42 mg/L and 196.91 mg/L. Both surface water and groundwater were typical of freshwater (Figure 3a). Overall groundwater samples had the higher TH and TDS than those of surface water samples.
In terms of ion components, the major cations in surface water ranked as Ca2+ > Mg2+ > Na+ > K+, with an average of 28.28, 7.31, 1.62, and 0.48 mg/L. The dominant cations were Ca2+ and Mg2+, accounting for 75.03% and 19.40% in total, respectively. The main cations in groundwater had the same order as those in surface water. But groundwater samples possessed slightly higher average concentrations of Ca2+ (51.91 mg/L), Mg2+ (9.35 mg/L), Na+ (6.27 mg/L), and K+ (1.46 mg/L). The dominant cations of groundwater were Ca2+ and Mg2+, accounting for 75.24% and 13.55% in total, respectively. Major anion concentrations in surface water were SO42− > HCO3 > Cl > F > NO3, with average concentrations of 67.52, 43.08, 0.39, 0.14, and 0.12 mg/L. The anions were mainly SO42− and HCO3, accounting for 60.69% and 38.72% in total, respectively. The main anion concentrations in groundwater were HCO3 > SO42− > Cl > NO3 > F, with average concentrations of 117.19, 80.07, 1.59, 0.68, and 0.009 mg/L. The anions were mainly HCO3 and SO42−, accounting for 58.71% and 40.11% in total, respectively.
In statistics, variation coefficient is used to evaluate the variability and stability for each variable. In statistics, standard deviation is used to evaluate the dispersion of data. Table 1 shows that the standard deviation of Ca2+, Mg2+, SO42−, and HCO3 in surface water and groundwater in the study area was relatively large, indicating the large dispersion of these ions. Hence, the contents of these ions in different downstream areas were obviously different. variation coefficient is used to evaluate the variability and stability for each variable. Variation coefficient has a positive relationship with variability and negative relationship with variable stability, respectively. Lower variation coefficients indicate less factors influencing hydrochemical evolution. As shown in Table 1, the coefficients variation of pH, K+, and HCO3 in surface water and pH and HCO3 in groundwater were small, reflecting their relatively constant concentrations in the region. And HCO3 concentration in surface water and groundwater was constantly high. In contrast, the coefficients of variation of Mg2+, Cl, SO42−, and F in surface water and Na+, Cl, and NO3 in groundwater were large, indicating that their concentrations vary highly and are susceptible to the influence of hydro-meteorological conditions, topography, aquifer media, and human activities. The skewness and kurtosis values of surface and groundwater samples were small, indicating that the statistics of each ionic parameter in surface and groundwater samples were close to normal distribution.
The concentrations of major ions in the lower reaches of the Yarlung-Zangbo River were compared with those in the whole Yarlung-Zangbo River and in the global rivers (Table 2). In Table 2, the concentrations of Ca2+, Mg2+, HCO3, and SO42− in the whole Yarlung-Zangbo River during the wet period were about two to three times higher than the global river mean. In the Yarlung-Zangbo River, all ion concentrations in the middle reaches were lower than those in the lower reaches. The phenomenon is probably due to abundant precipitation leading to stronger dilution and lower ion concentrations in the lower reaches. It is noted that Na+ concentrations in the upper reaches were 10.91 times higher than those in the lower reaches. The higher Na+ concentrations were induced by silicate weathering existing in igneous rocks of the upper reaches. Ca2+, Mg2+, and SO42− concentrations were higher in the lower reaches, especially SO42− ion concentration is 3.28 times higher than in the upper reaches of the river. It is presumably due to the effect of oxidative dissolution of Ca and Mg sulfides.

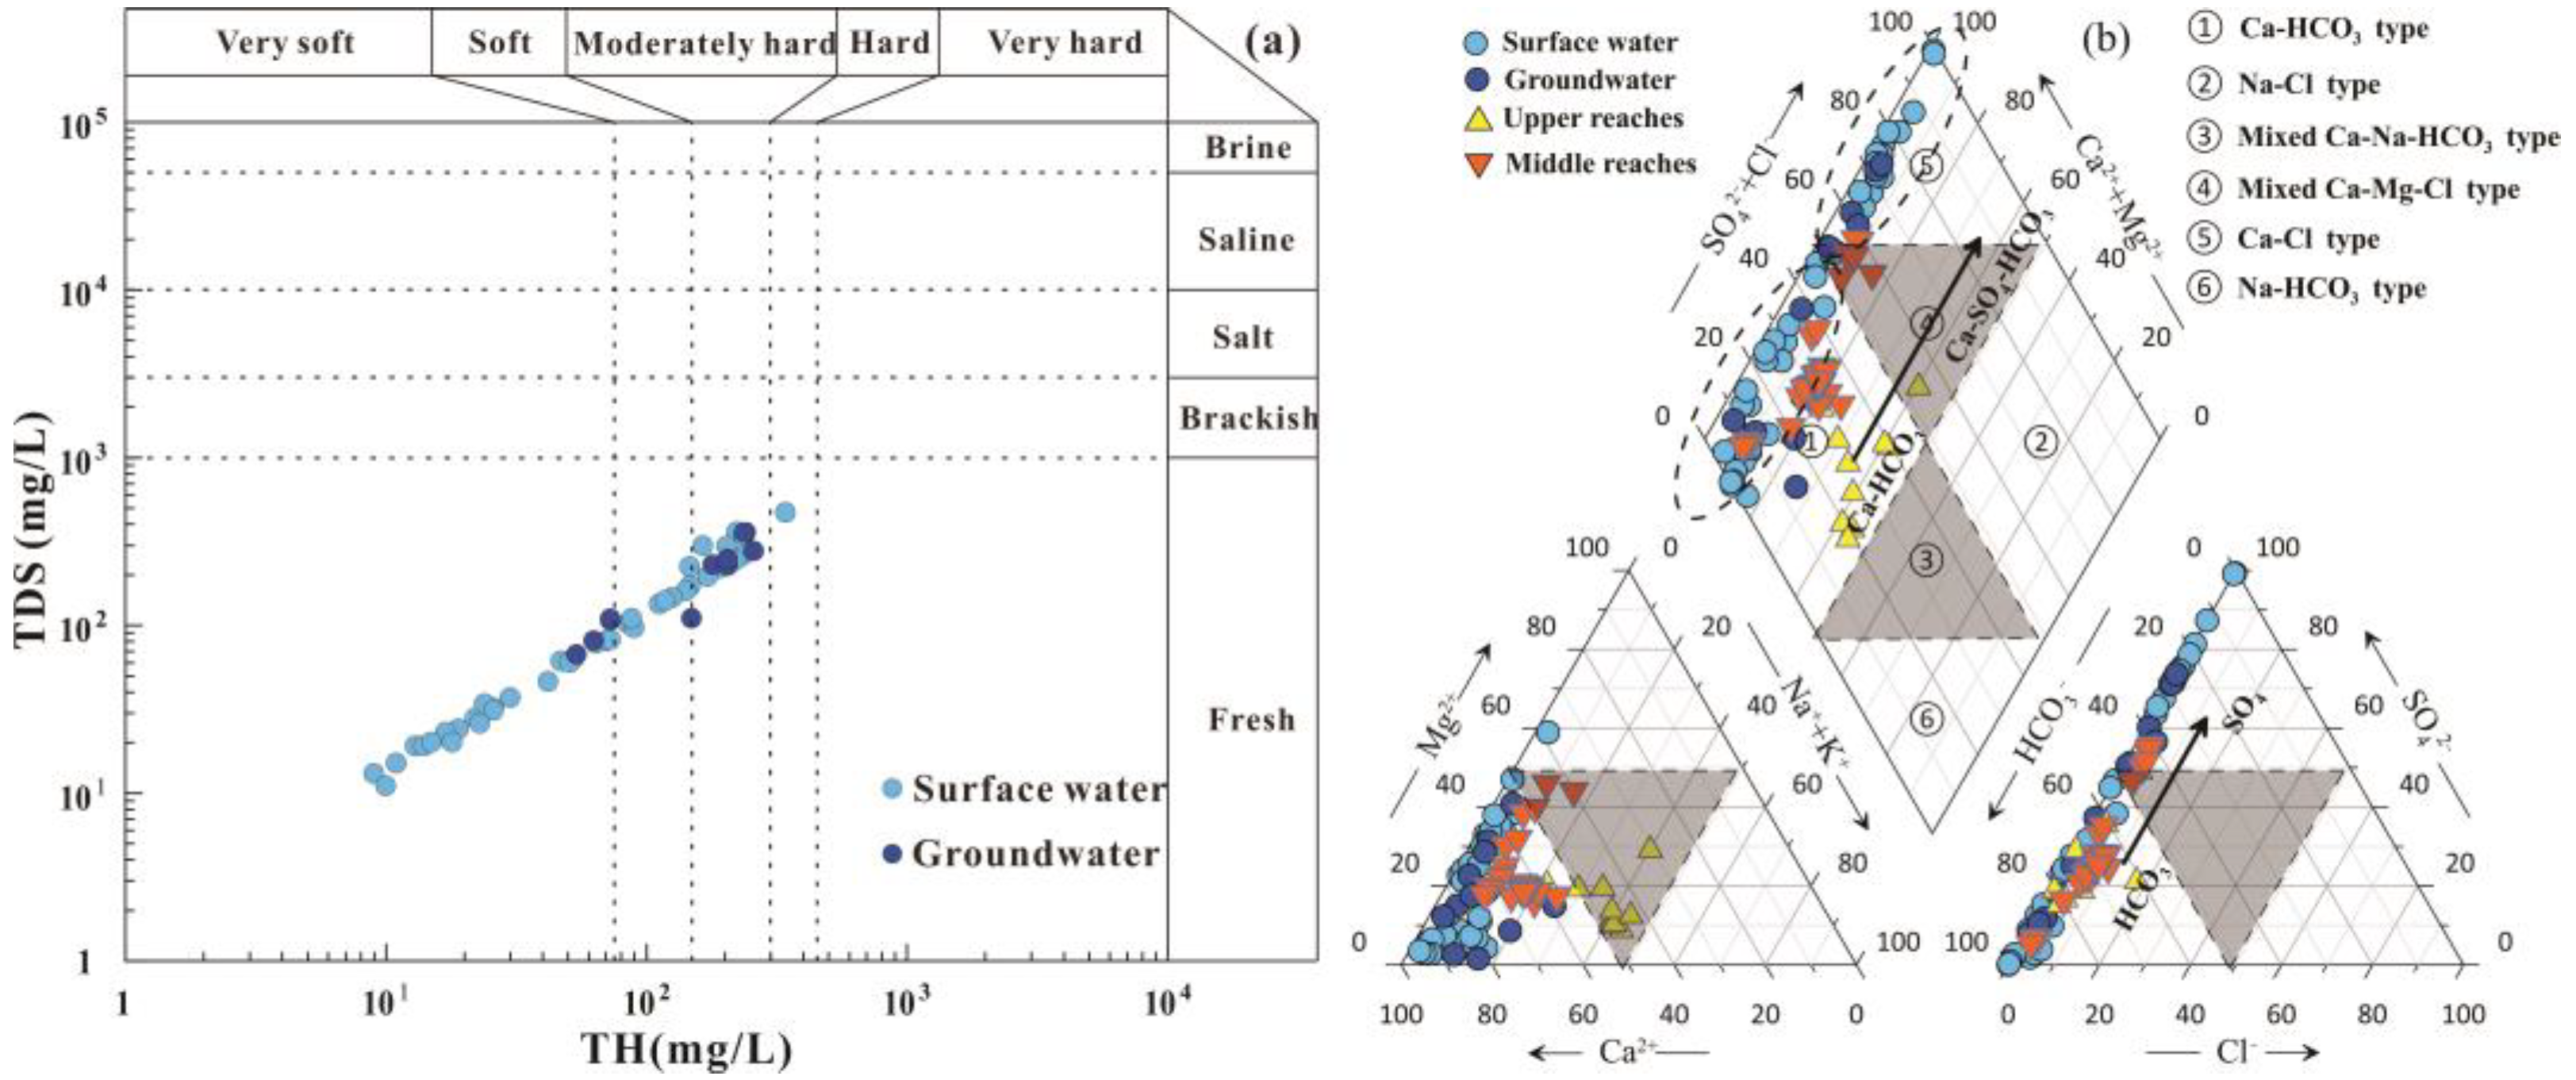
3.2. Hydrochemical Type

Piper trilinear diagram was used to analyze the hydrochemical types of surface water and groundwater in the lower reaches of the Yarlung-Zangbo River. As shown in Figure 3b, the cations of surface water and groundwater basically fell near the Ca2+ axis in the trilinear diagram, and the anions were near the HCO3 axis in the trilinear diagram. This indicated that the dominant cations of surface water and groundwater were Ca2+, and the dominant anions were HCO3 and SO42−. The hydrochemical type of surface water was mainly Ca-HCO3 (mainstream) and Ca-SO4-HCO3 (tributary), and the hydrochemical type of groundwater is mainly Ca-SO4-HCO3. The hydrochemical type of surface water in the lower reaches of Yarlung-Zangbo River showed a gradual transition from Ca-SO4-HCO3 type to Ca-HCO3 type water from tributary to mainstream area. The hydrochemical type of groundwater was similar to that of surface water in tributary. In Figure 3b, the hydrochemical types of the middle and lower reaches were both Ca-Mg-HCO3-SO4 and that of the upper reaches of the river is Ca-Na-HCO3-SO4. It indicated that the hydrochemical type of the lower reaches is similar to that of the middle reaches but is different from that of the upper reaches. This is due to the fact that the upstream is more influenced by silicate dissolution, while the cations and anions in the lower reaches are mainly Ca2+, HCO3, and SO42−. The hydrochemical type in the lower reaches may be controlled by dissolution of carbonates (calcite, dolomite) and other sulfides oxidation.

3.3. Hydrogen and Oxygen Isotopes

The δ18O contents of surface water samples in the lower reaches of the Yarlung-Zangbo River varied from −17.55‰ to −17.55‰, with an average value of −15.59‰. δD contents varied from −131.82‰ to −97.12‰, with an average value of −112.43‰. δ18O contents of groundwater varied from −17.33‰ to −14.73‰, with an average value of −16.21‰ The variation of δD contents ranged from −132.04‰ to −108.65‰, and the average value was −122.53‰ (Table 1).

3.4. Sr Concentration and Sr Isotope

The Sr content of surface water samples in the lower reaches of the Yarlung-Zangbo River varied from 0.02 to 0.72 mg/L, with a mean value of 0.17 mg/L. The 87Sr/86Sr ratio varied from 0.70555 to 0.72082, with a mean value of 0.71007. The Sr content of groundwater samples varied from 0.04 to 0.71 mg/L, with a mean value of 0.27 mg/L The variation of 87Sr/86Sr ratio ranged from 0.70724 to 0.71620, and the average value was 0.71128 (Table 1).

4. Discussion

4.1. Multivariate Statistical Analysis

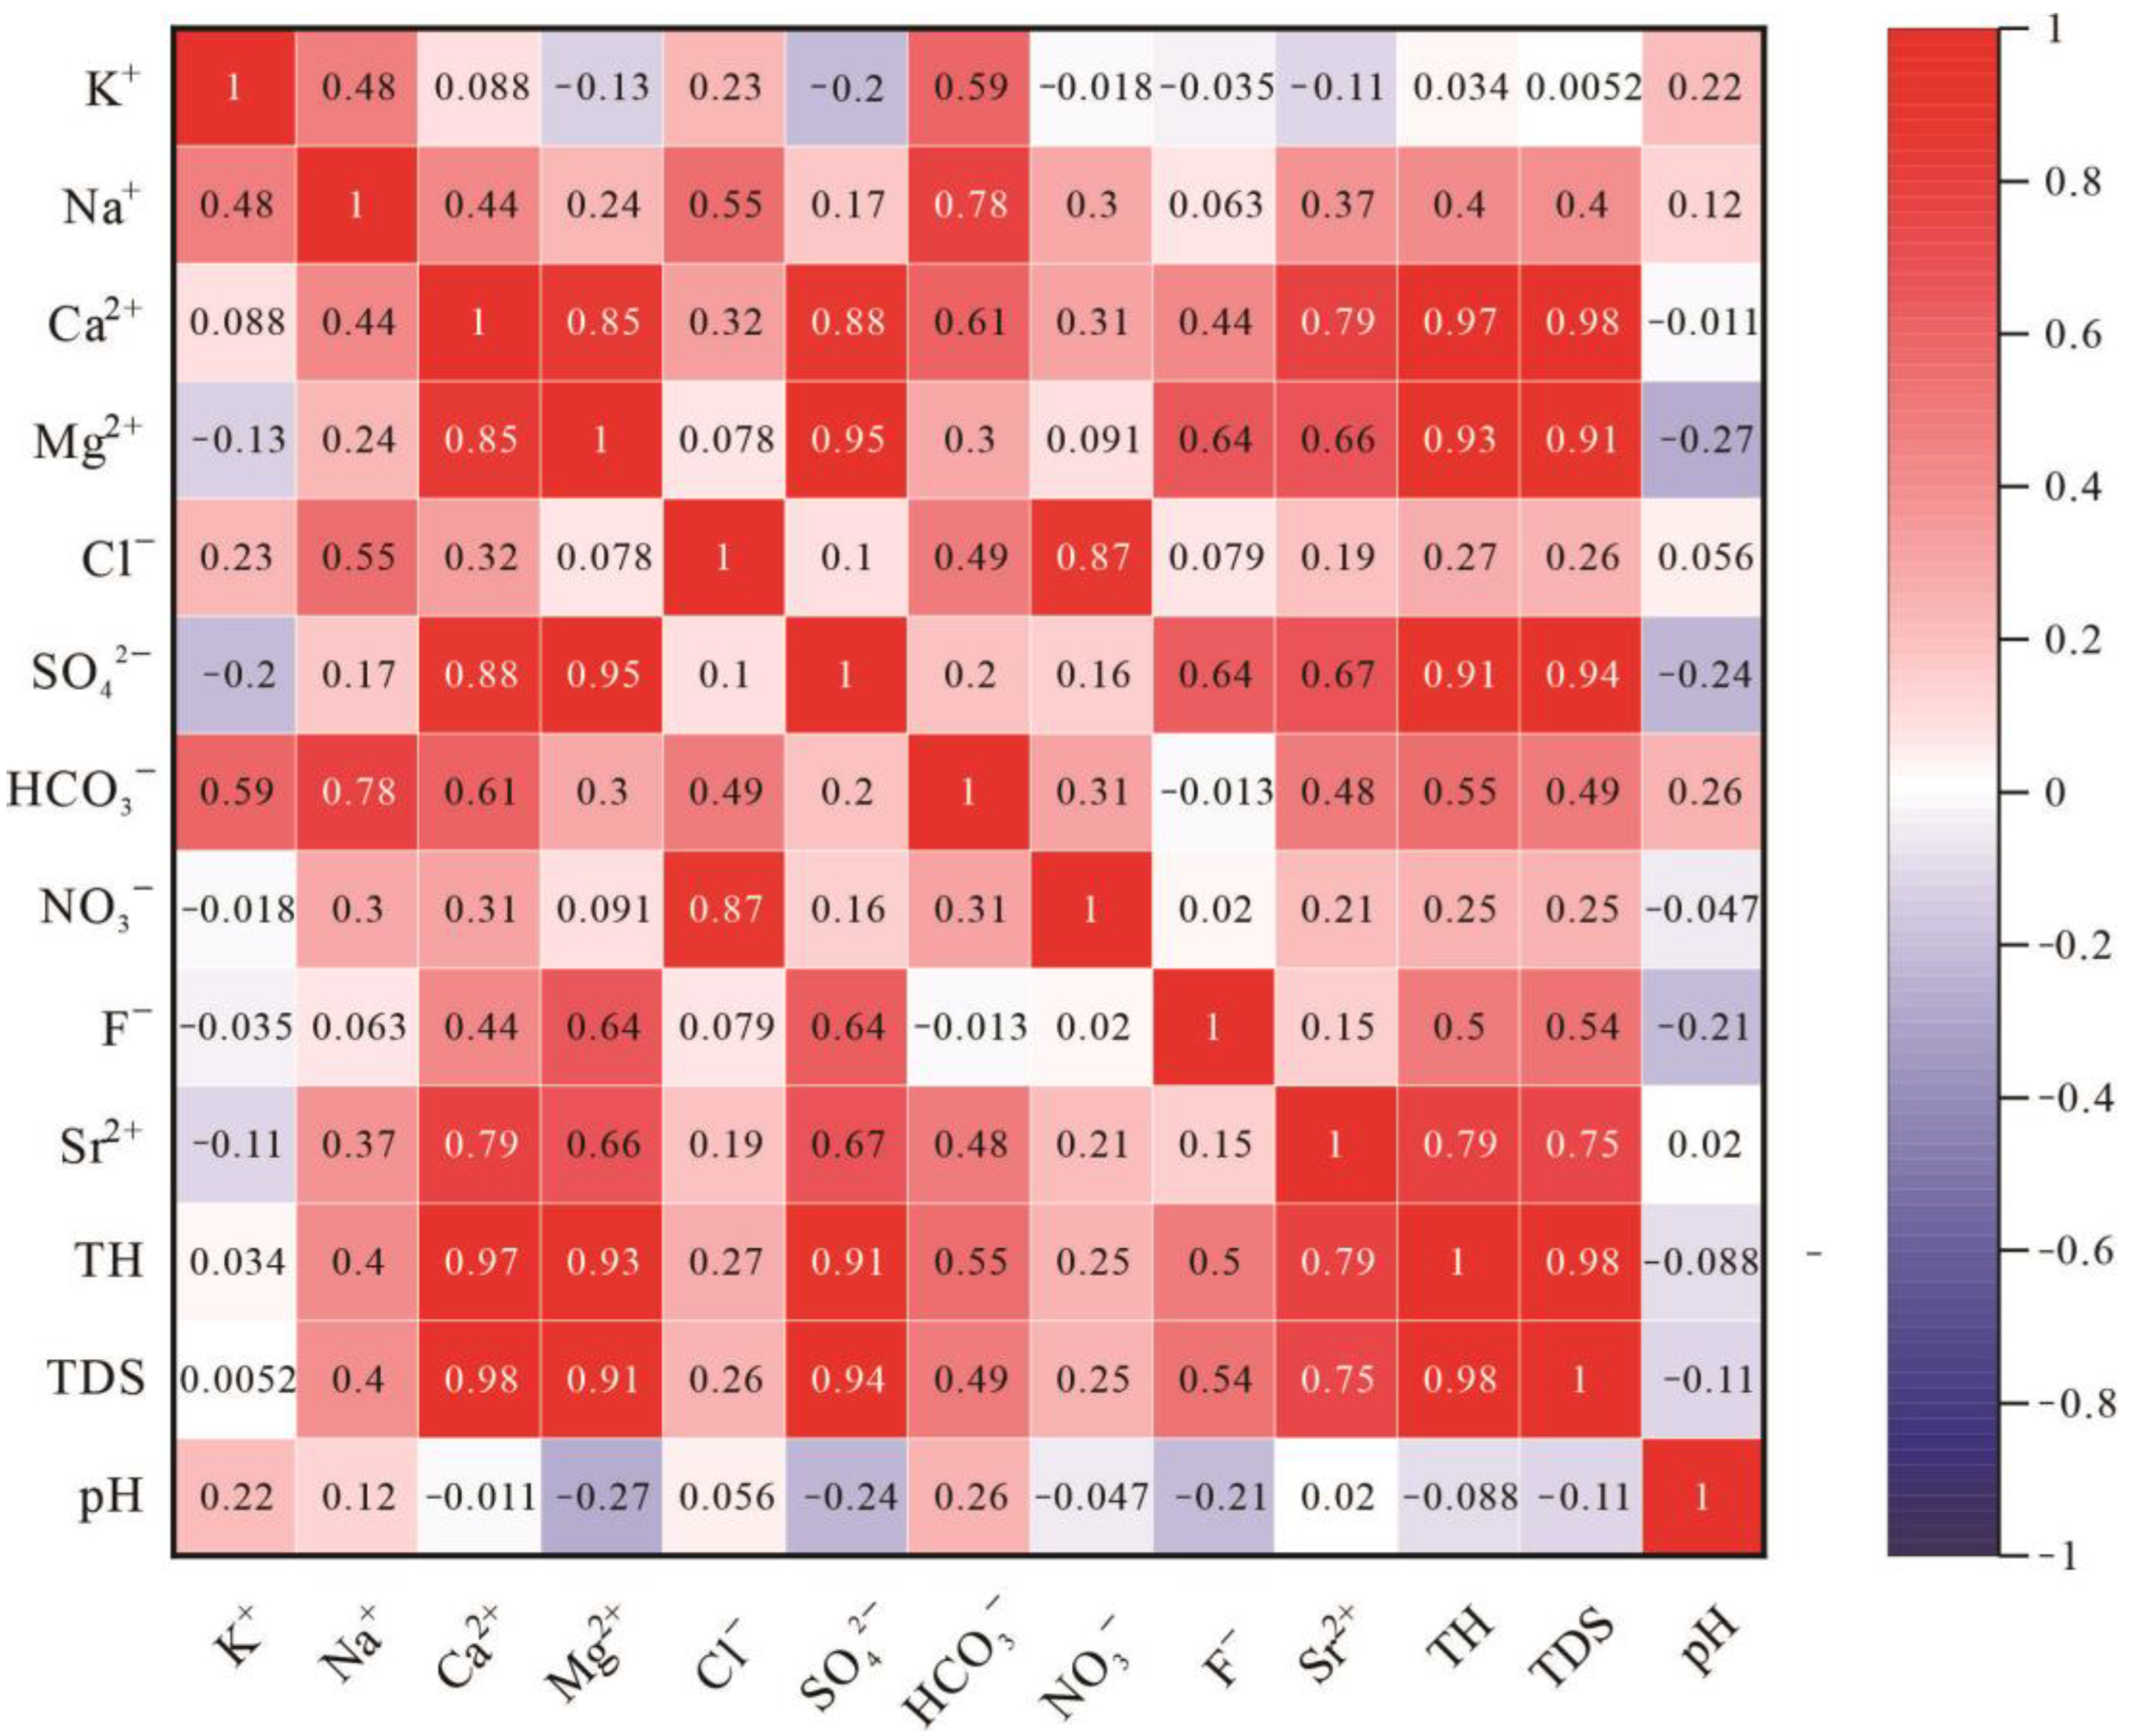
4.1.1. Correlation Analysis

Correlation analysis can be used to reveal the source relationship of ions by the correlation between the different factors on the concentration of ions [22,23,24]. In this study, SPSS 25 software was used to calculate the correlation coefficient matrix of the sample indicators. In Figure 4, there was a good correlation between the TDS, TH, and each ion, indicating a possible common source. The TDS and TH had the highest positive correlation (greater than 0.9) with Ca2+, Mg2+, and SO42−, indicating that Ca2+, Mg2+, and SO42− were important sources of TDS and TH. In addition, Na+, Ca2+, Mg2+ and Cl, SO42− and HCO3 also showed significant positive correlations, indicating that the TDS and TH were mainly controlled by Na+, Ca2+, Mg2+, Cl, SO42−, and HCO3. Sr showed better correlations with Ca2+, Mg2+, and SO42−, indicating that the water–rock reaction was stronger in the lower reaches of the Yarlung-Zangbo River. Ca2+ had a high correlation with SO42− (0.868), indicating that the dissolution of gypsum contributed to Ca2+ concentration. The correlation of Ca2+, Mg2+, and HCO3 indicated that the dissolutions of calcite and dolomite contribute to hydrochemical compositions of surface water and groundwater. The correlation between Cl and NO3 is relatively well correlated with correlation coefficient of 0.866, indicating the influence of anthropogenic activities. But the influence of anthropogenic factors was limited due to the low concentration of NO3. Cl showed a positive correlation with K+ and Na+ with a correlation coefficient of 0.559, indicating the local presence of evaporite dissolution. The comprehensive analysis of various ion correlations can be concluded that the hydrochemical types of surface water and groundwater in the lower reaches of the Yarlung-Zangbo were mainly influenced by water-rock reaction, with less involvements of anthropogenic activities.

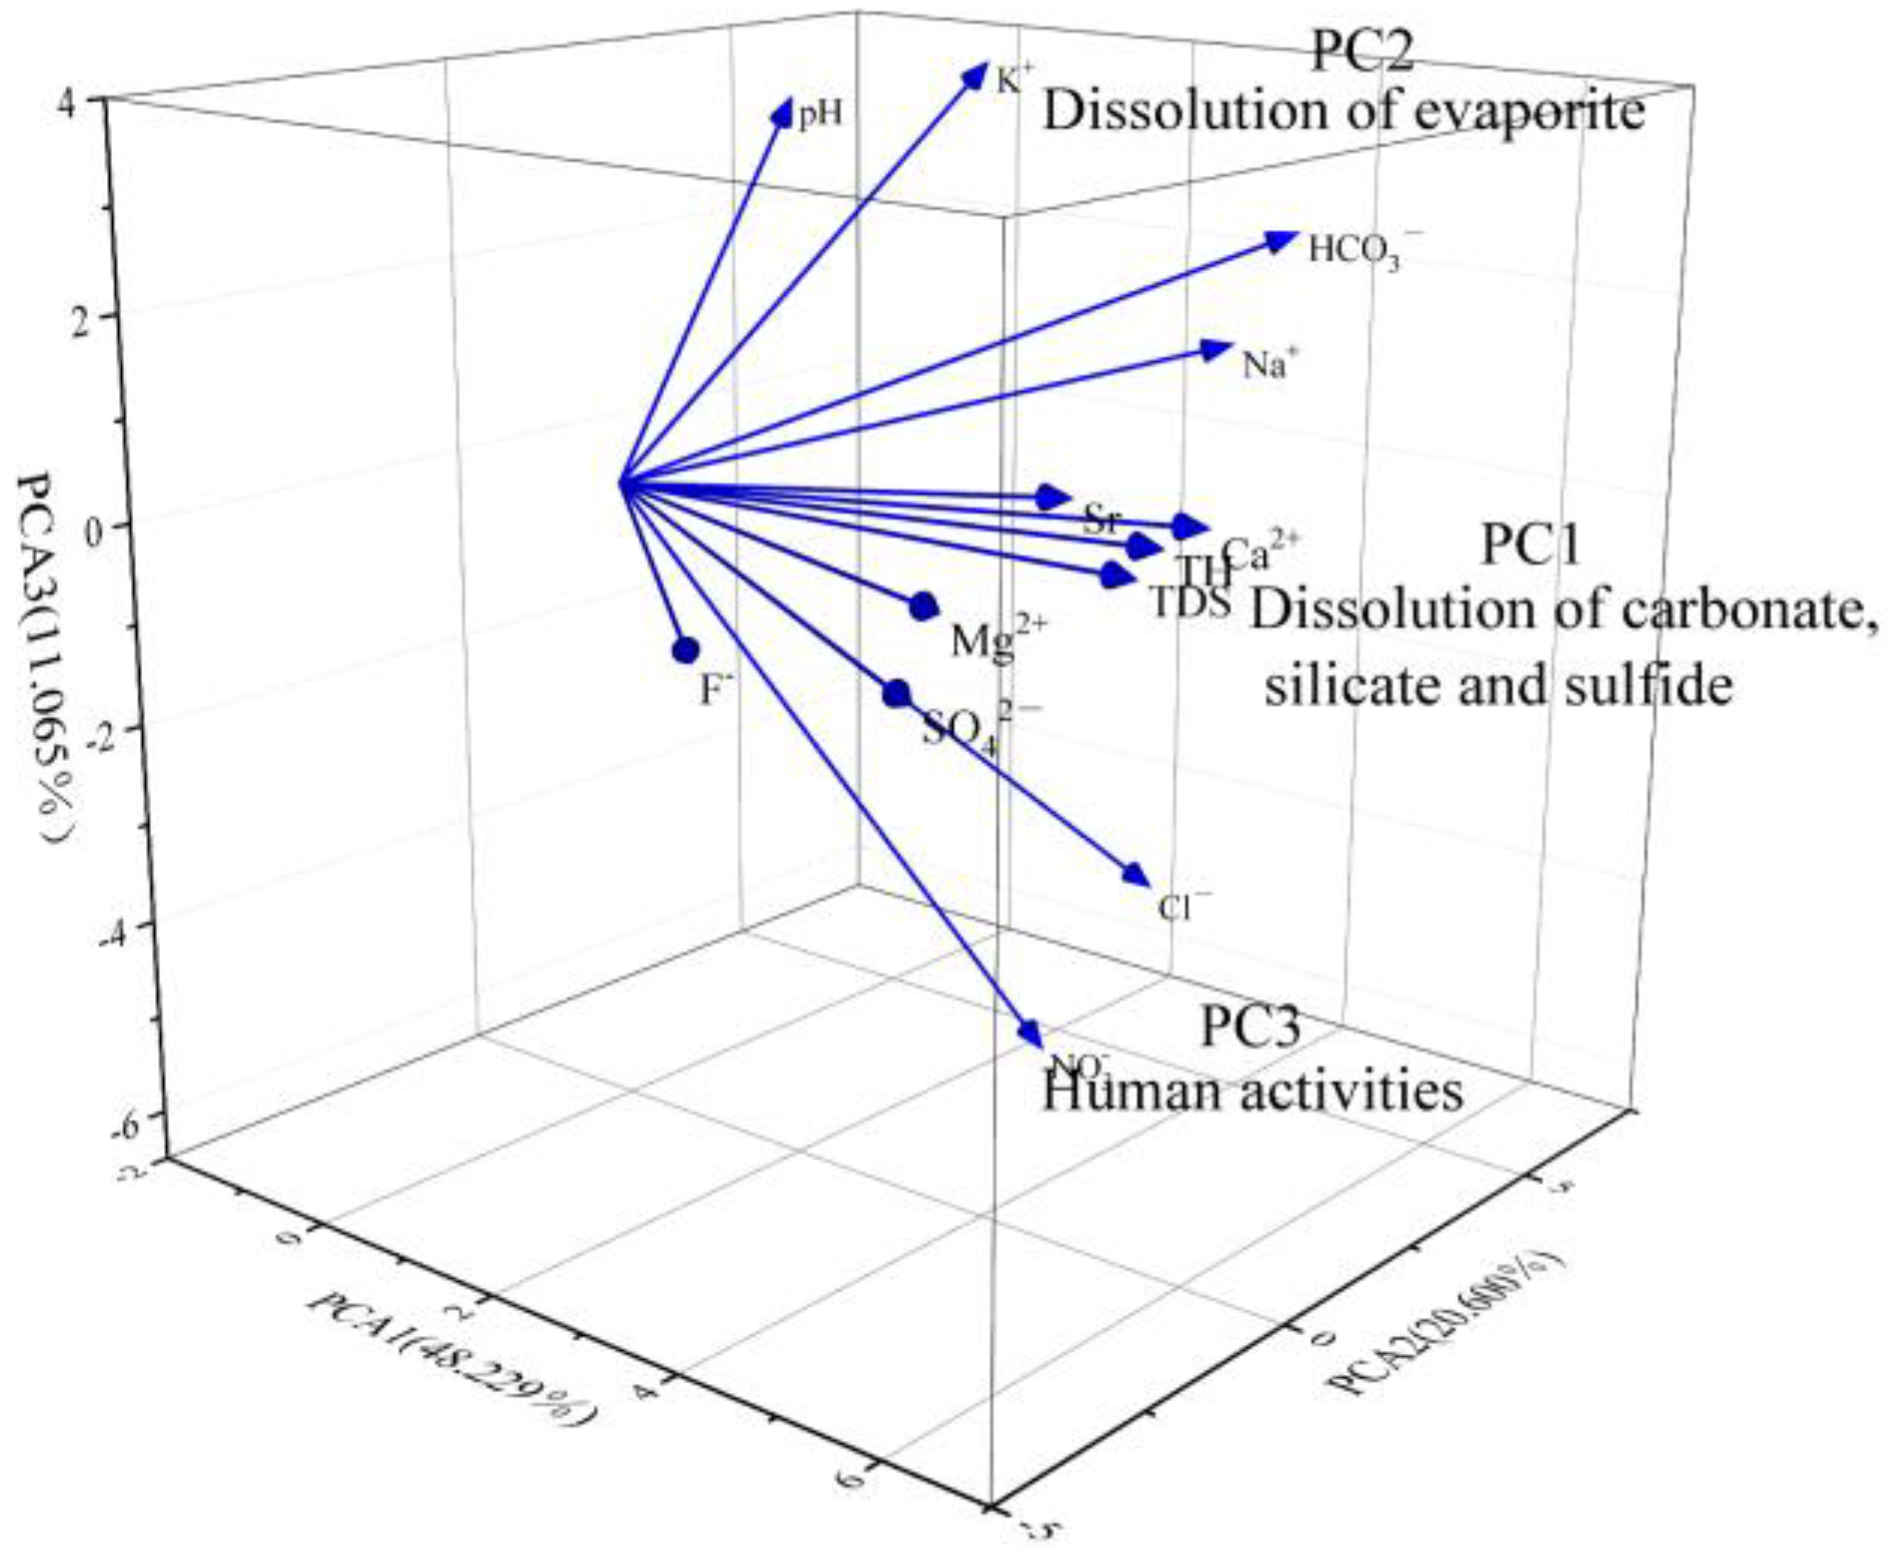
4.1.2. Principal Component Analysis

The principal component analysis (PCA) aims to use the dimensionality reduction to transform multiple indicators into a few composite indicators (i.e., principal components). Each principal component is extracted to explain the information of the raw data variables. The principal component contribution scores can explain the geospatial distribution and temporal variation characteristics of the raw hydrochemical data [25,26,27].
To further investigate the relationship between major ions and geological background, principal component analysis was performed in this study. The data were first subjected to the KMO and Bartlett’s sphere tests to determine whether factor analysis could be performed. The KOM value was 0.656 (>0.6) and the significant probability of Bartlett’s sphere test was 0 (the confidence level of <0.05). The results indicated that the variables had high correlation with each other and were suitable for the PCA. According to the Kaiser–Harris criterion, it is recommended to keep the principal components with eigenvalues greater than 1. In this study, a total of four principal components were extracted to determine the output (Table 3). The three-dimensional spatial plots between the indicators of the first three principal components were derived (Figure 5). In Table 3, the eigenvalues, cumulative contribution of the four principal component factors is 81.662%. The PC1 variance contribution was 48.229%, mainly including seven indicators of the TH, TDS, Ca2+, Mg2+, SO42−, Sr, and HCO3. The PC1 represented the carbonate dissolution, silicate weathering, and the oxidative dissolution of sulfides. The variance contribution of PC2 was 20.600%, which mainly includes four indicators of Na+, K+, Cl, and HCO3. Evaporite dissolution will increase Na+, K+, and Cl concentrations. Since the main anion is HCO3, and the concentration of Cl is very low, and there are various hydrochemical types in the lower reaches of the Yarlung-Zangbo River from the previous paper, HCO3 is classified as the PC2. The variance contribution of PC3 was 11.065%, mainly including two indicators of NO3 and Cl. There are residential gathering points near the lower reaches of the Yarlung-Zangbo River, which may cause water pollution during human living, and have a greater impact on NO3 and Cl ions. Therefore, PC3 represents the pollution effect of anthropogenic activities, which has less influence due to the low concentration of NO3. PC4 variance contribution is 7.75%, which mainly includes one indicator of F. Two surface water samples in Ladin Snow Village had F ion concentrations of 1.62 mg/L and 2.02 mg/L, indicating that the area may suffer from F pollution. Thus, PC4 also represents the pollution by local anthropogenic activities.

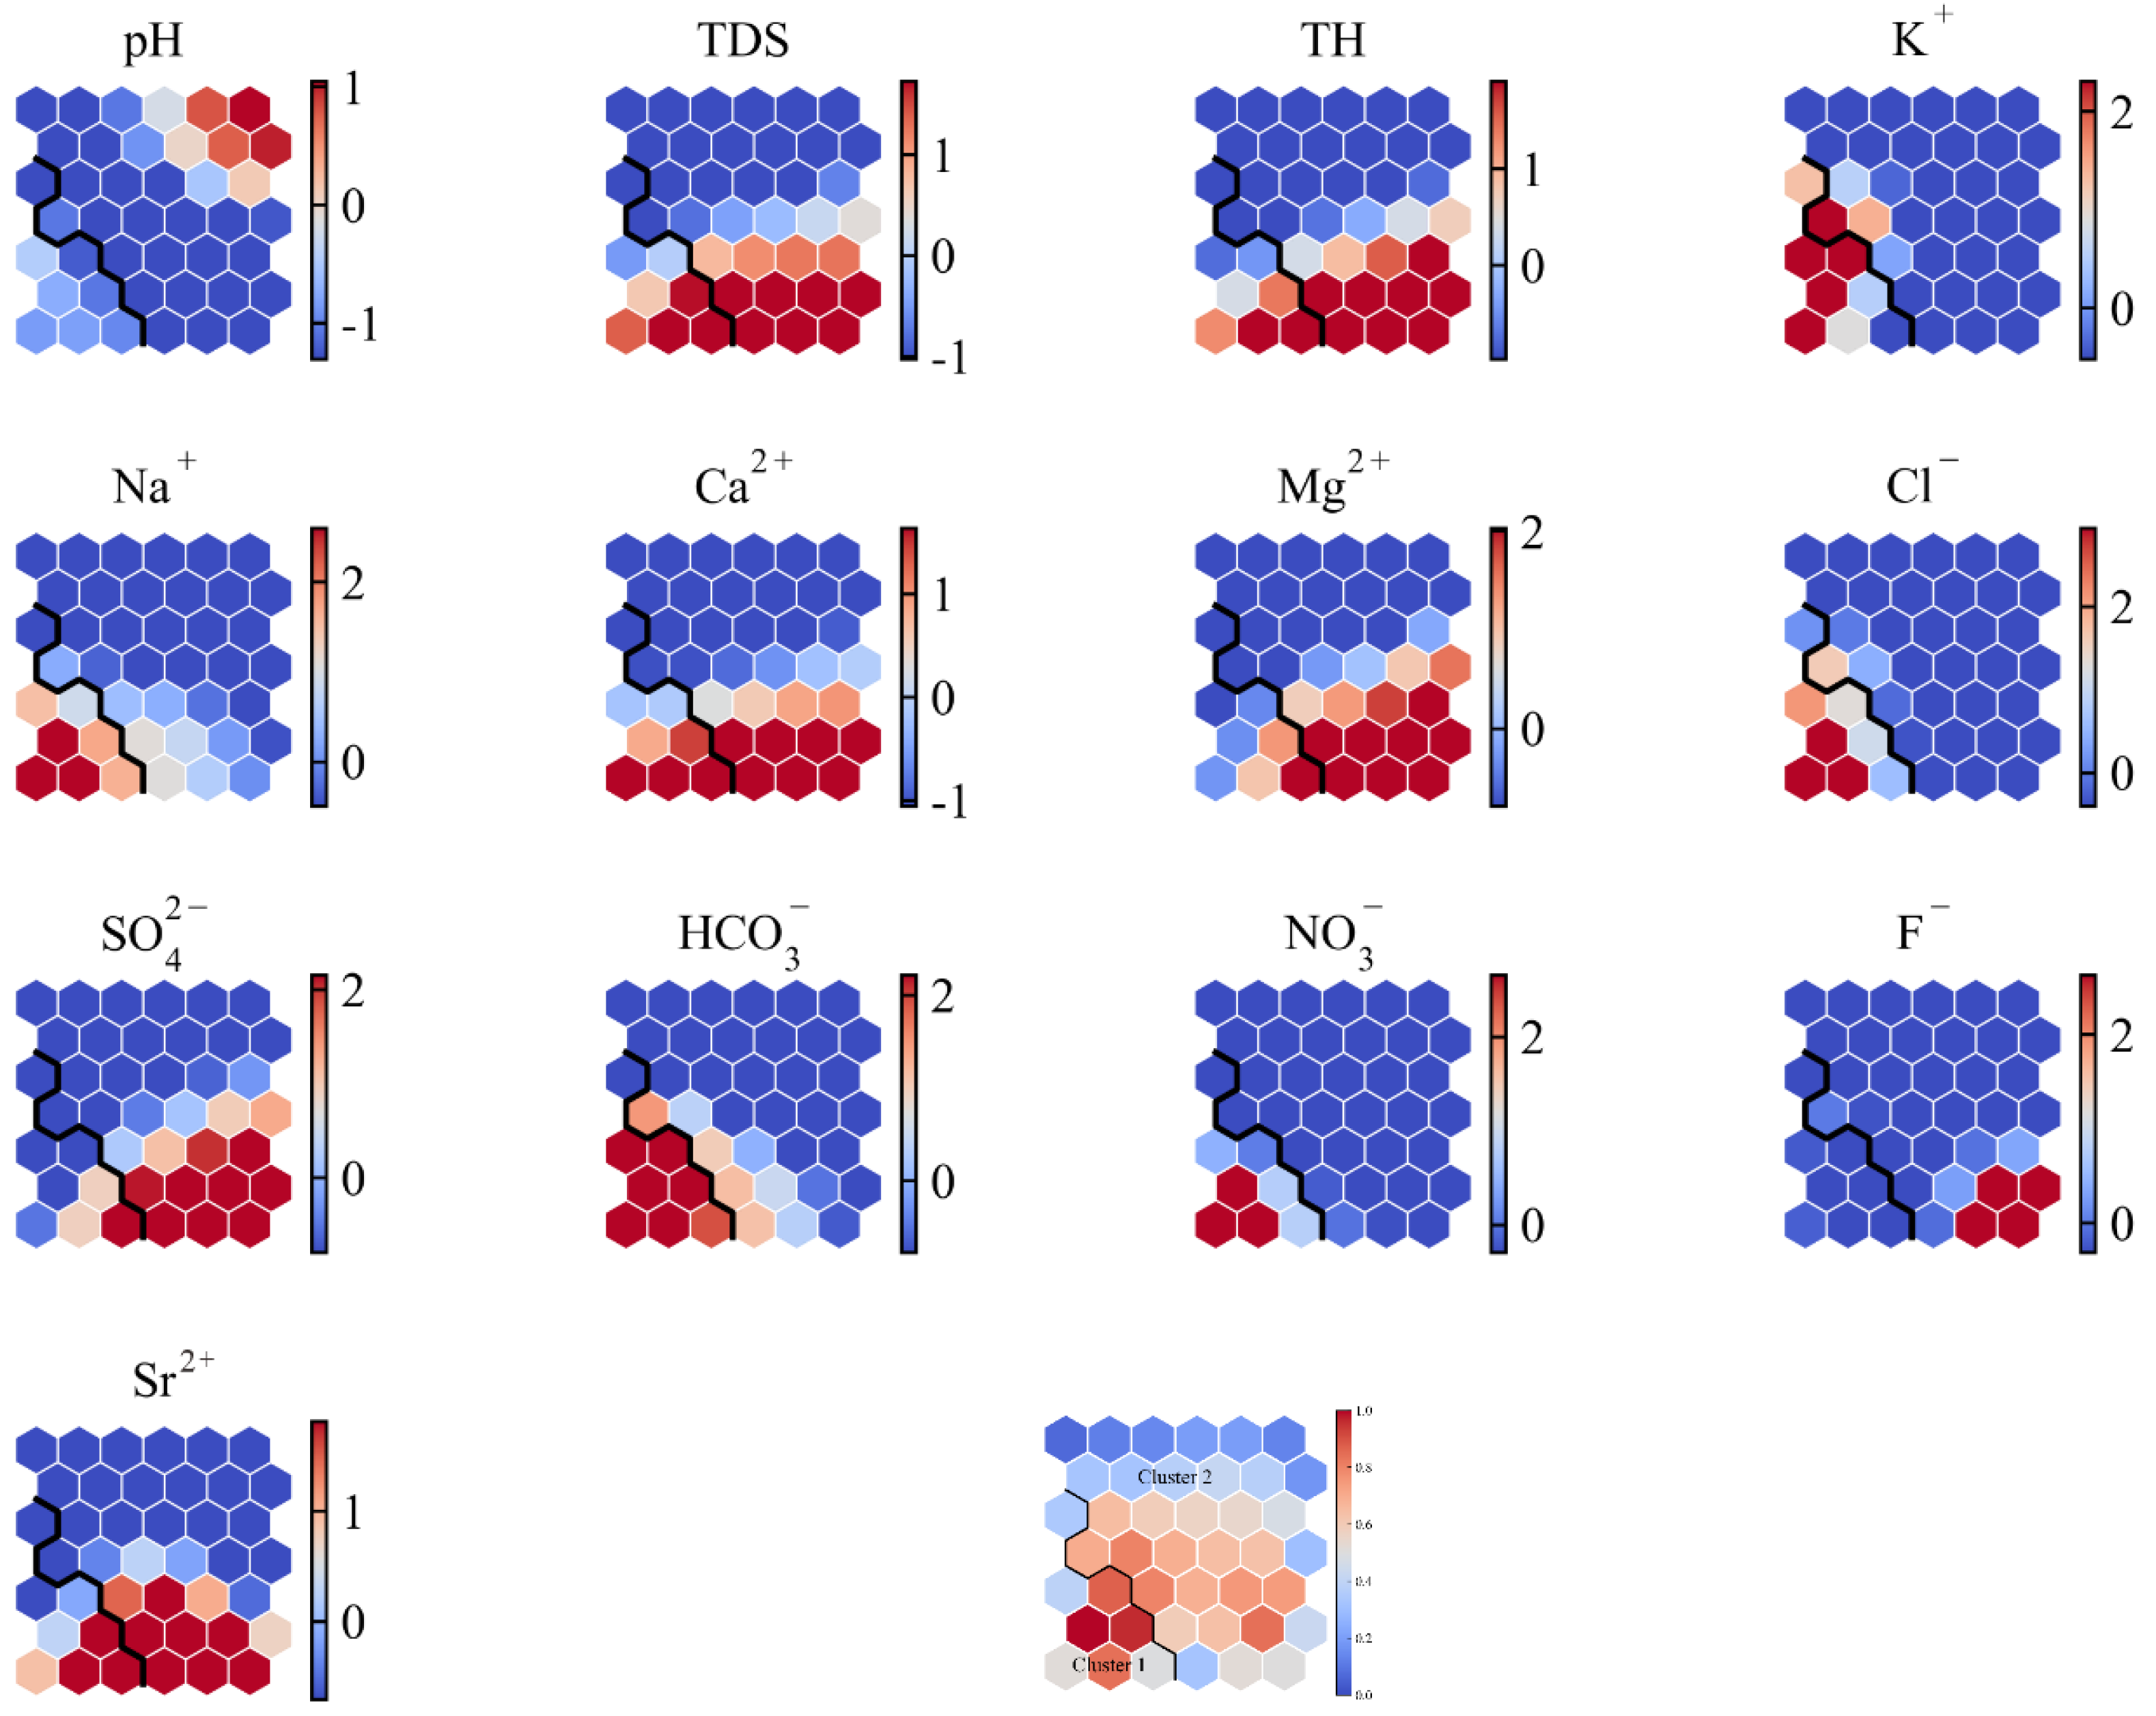
4.1.3. Self-Organizing Map

Self-organizing map (SOM) is a network based on competitive learning and consists of an input layer, an output layer, and weight vectors, where the neurons in the output layer are arranged in a matrix in a one- or two-dimensional space. They compete with each other for opportunity to adjust the weight vectors based on the input vectors. Finally, the neurons in the output layer are presented in the output space in a meaningful topology based on the features of the input vectors [28,29,30].
All the parameters of surface and groundwater sample were mapped onto neurons by the SOM, and the correlations between indicators were compared based on the feature images formed by the neurons (Figure 6). First, all samples were divided into two categories: surface water (group 1) and groundwater (group 2). The feature images were analyzed by establishing a right-angle coordinate system with the image orthocenter as the origin, and the activation positions of neurons are the same, which indicates positive correlation [31]. In Figure 6, the high correlation between Na+, K+, Cl, HCO3, and NO3 and the characteristic images of surface water and groundwater groupings indicated that these ions aggregated to a similar extent in surface water and groundwater. And it is speculated that there may be direct mixing between surface water and groundwater. As shown in Figure 6, the group of the TDS, TH, Ca2+, Mg2+, SO42−, and Sr2+ were highly correlated with group of K+, Na+, Cl, and HCO3. The SOM result proposed that these may have a common origin of water–rock interaction between surface water and groundwater. It was consistent with the Pearson correlation coefficient matrix analysis and principal component PCA classification. NO3 and Cl are closely related, indicating the source of local anthropogenic activities.

4.2. Governing Factors of Hydrochemical Compositions

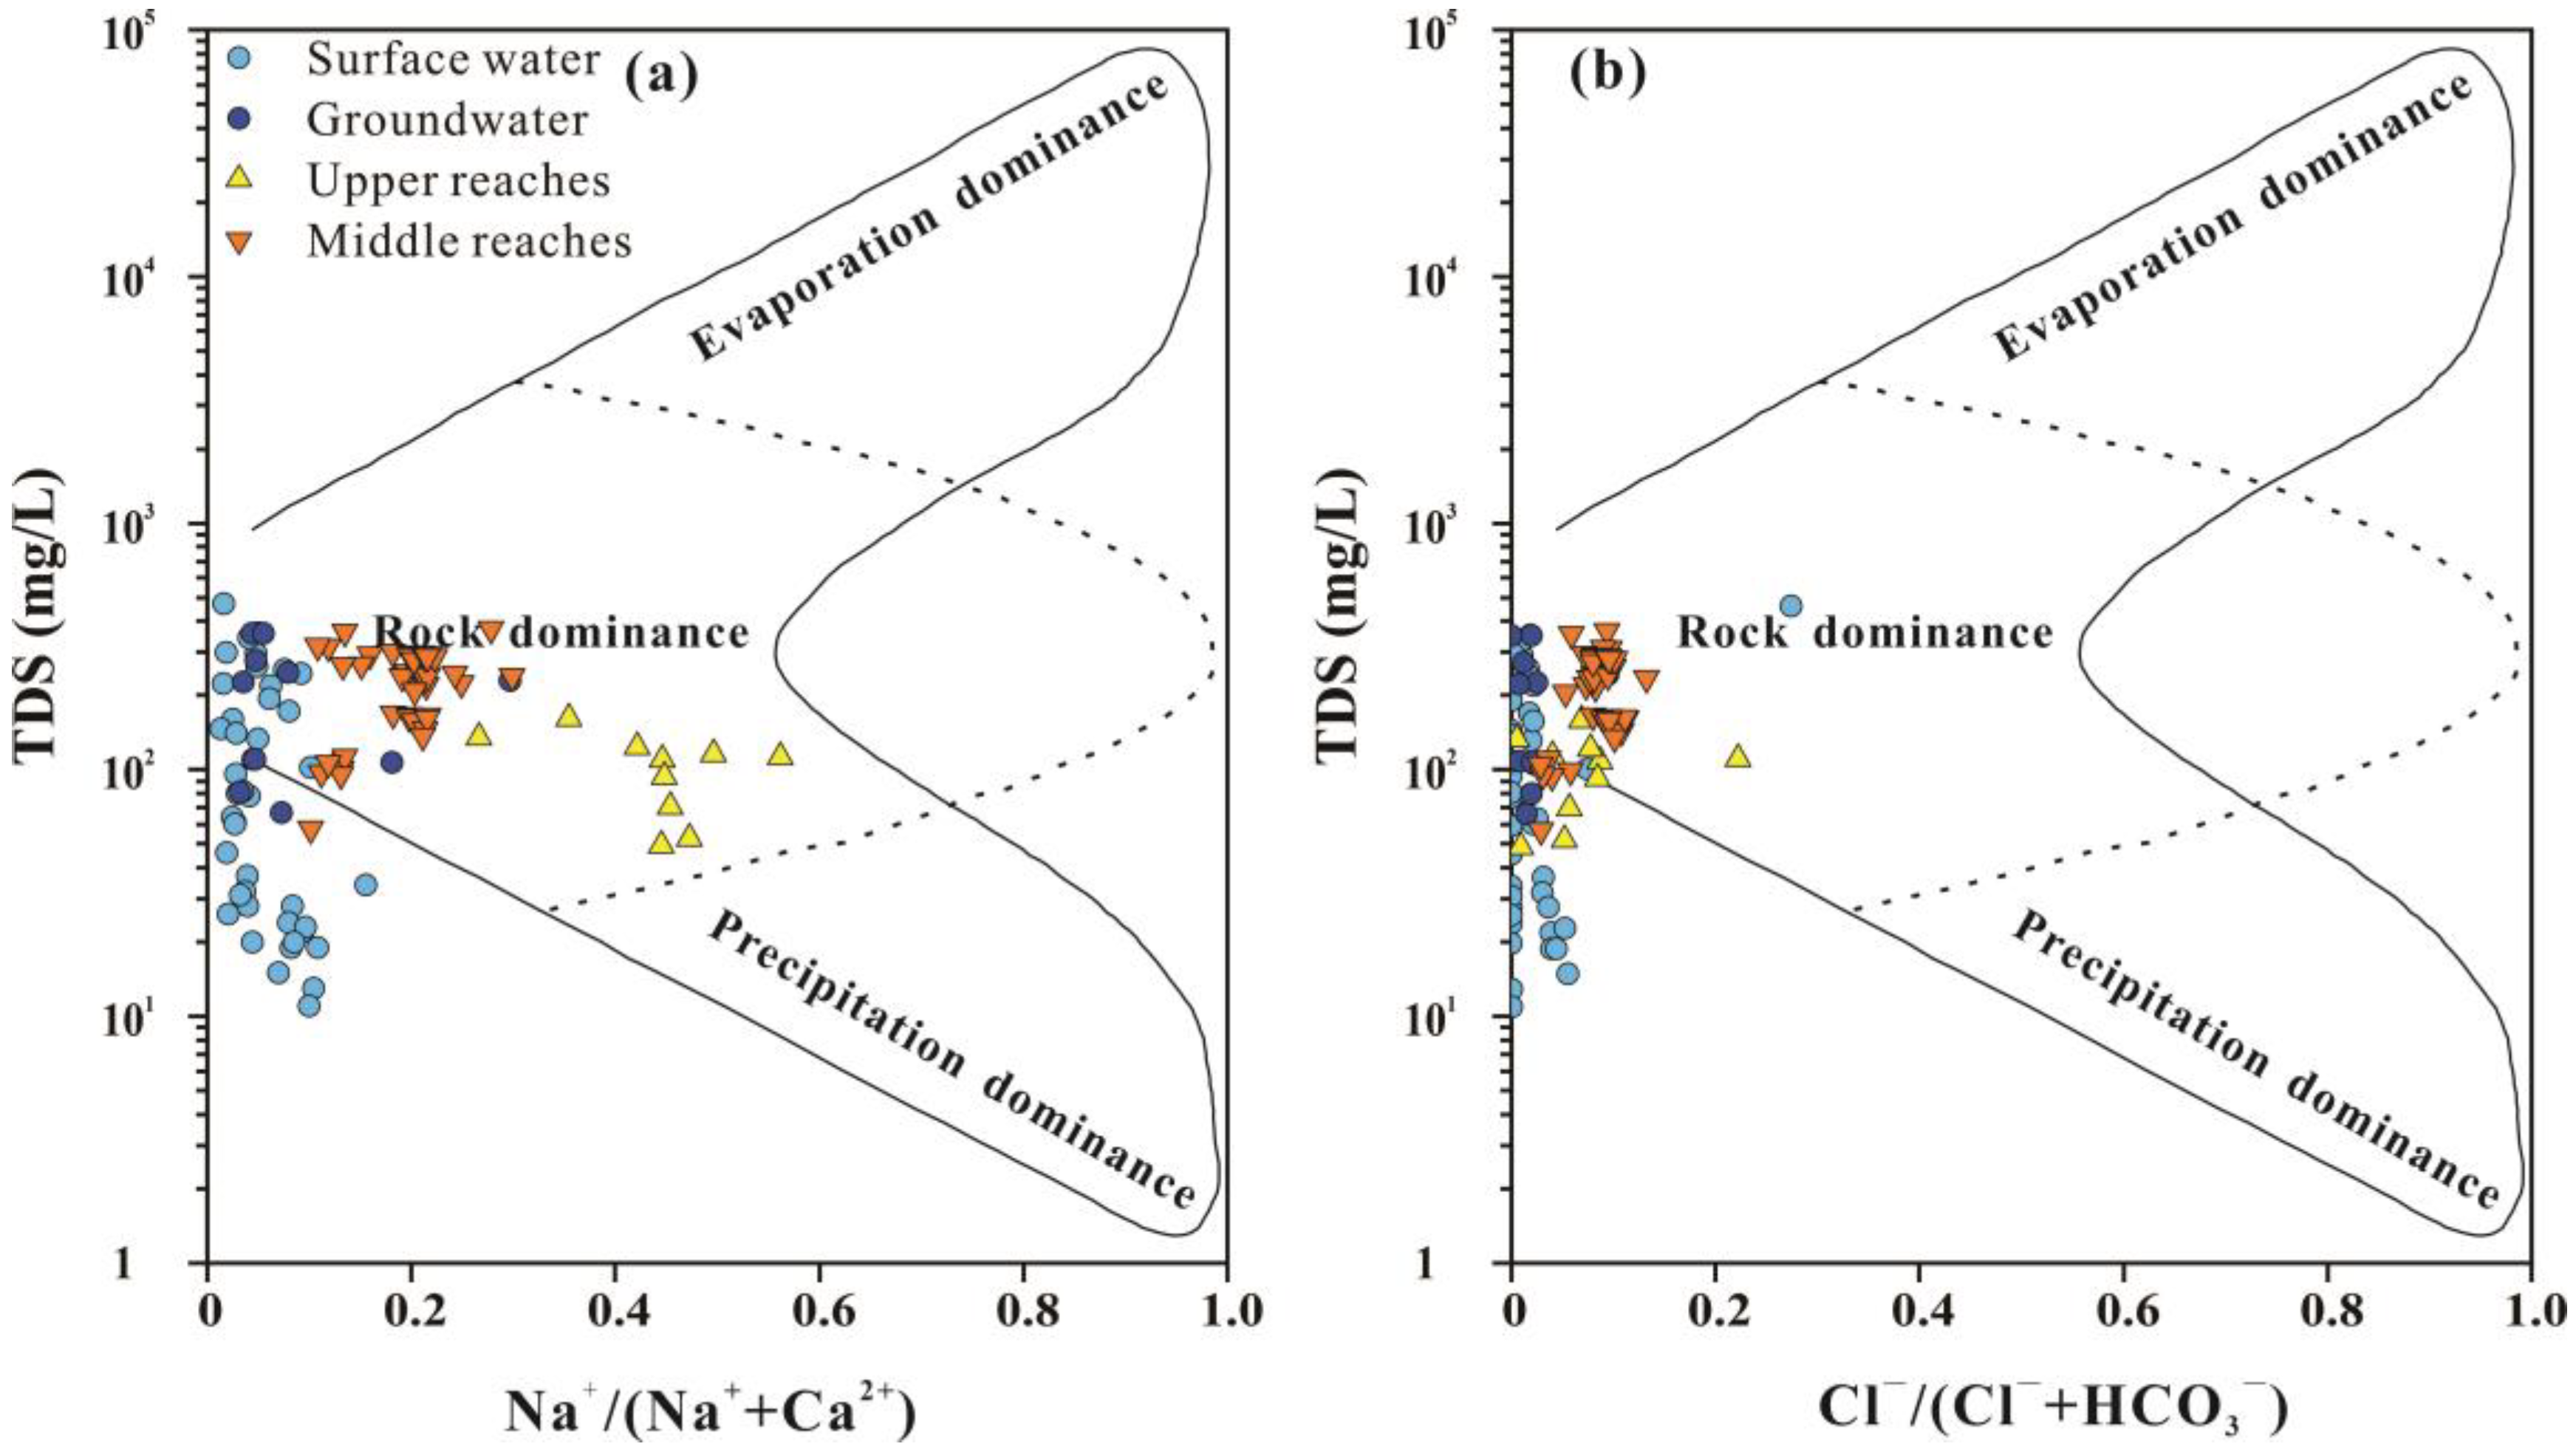
4.2.1. Gibbs Analysis

The Gibbs diagram was used to classify the mechanisms controlling the chemical fraction of groundwater into three types: precipitation, water–rock interaction, and evapotranspiration [32]. The Gibbs ratio was obtained by the ratio of Na+/(Na+ + K+) and Cl/(Cl + HCO3) to the total dissolved solid (TDS) to visualize the different controlling factors on hydrogeochemical compositions. In Figure 7, surface water samples and groundwater samples in the lower reaches of the Yarlung-Zangbo River, as well as sample sites in the middle and upper reaches of the Yarlung-Zangbo River, were distributed in the area of rock dominance, indicating water–rock interaction is the main factor affecting hydrochemical compositions.

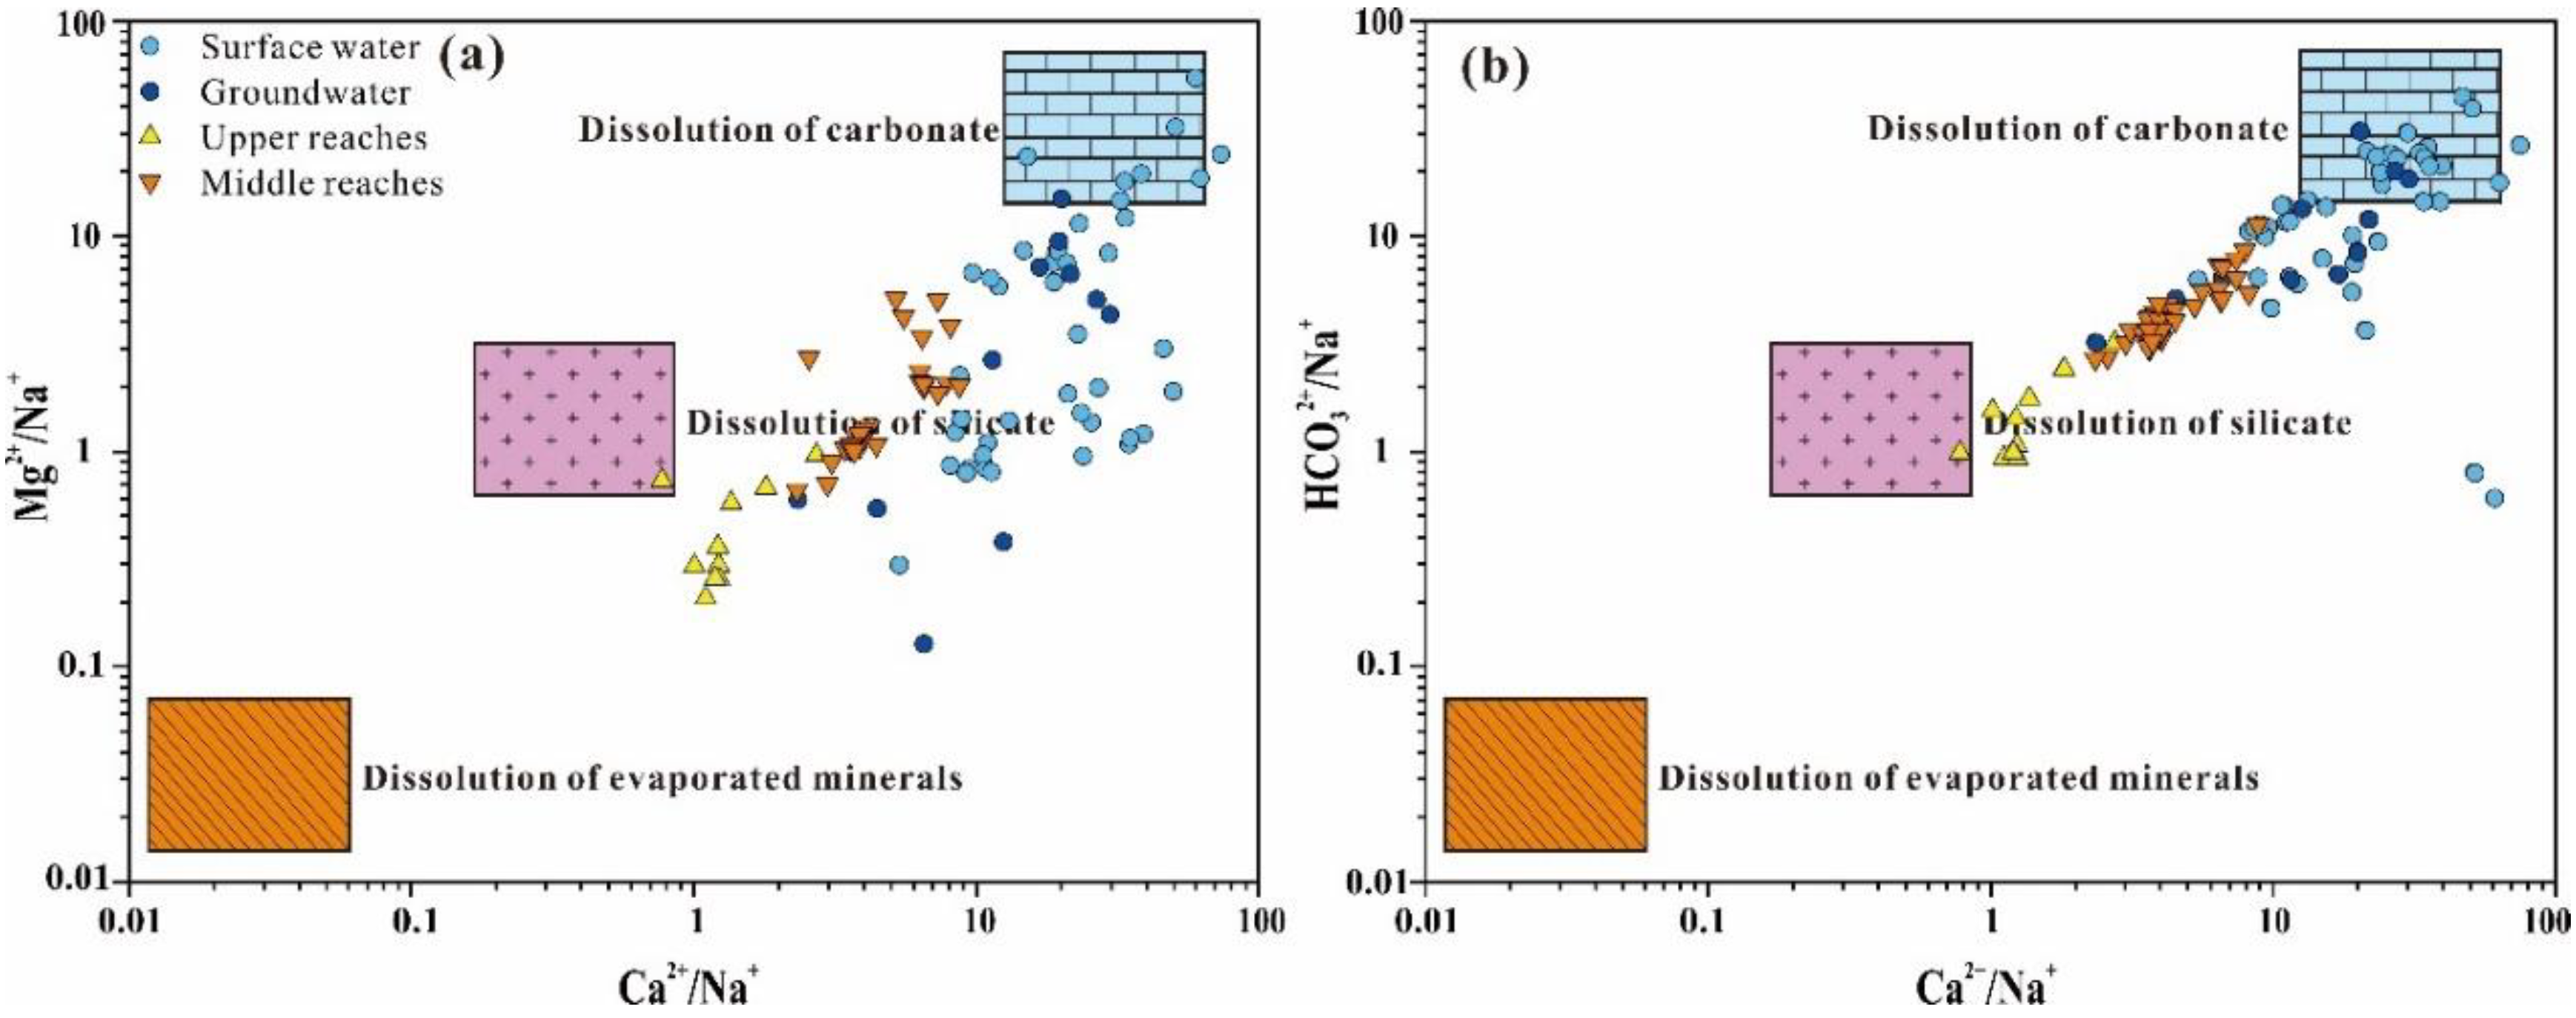
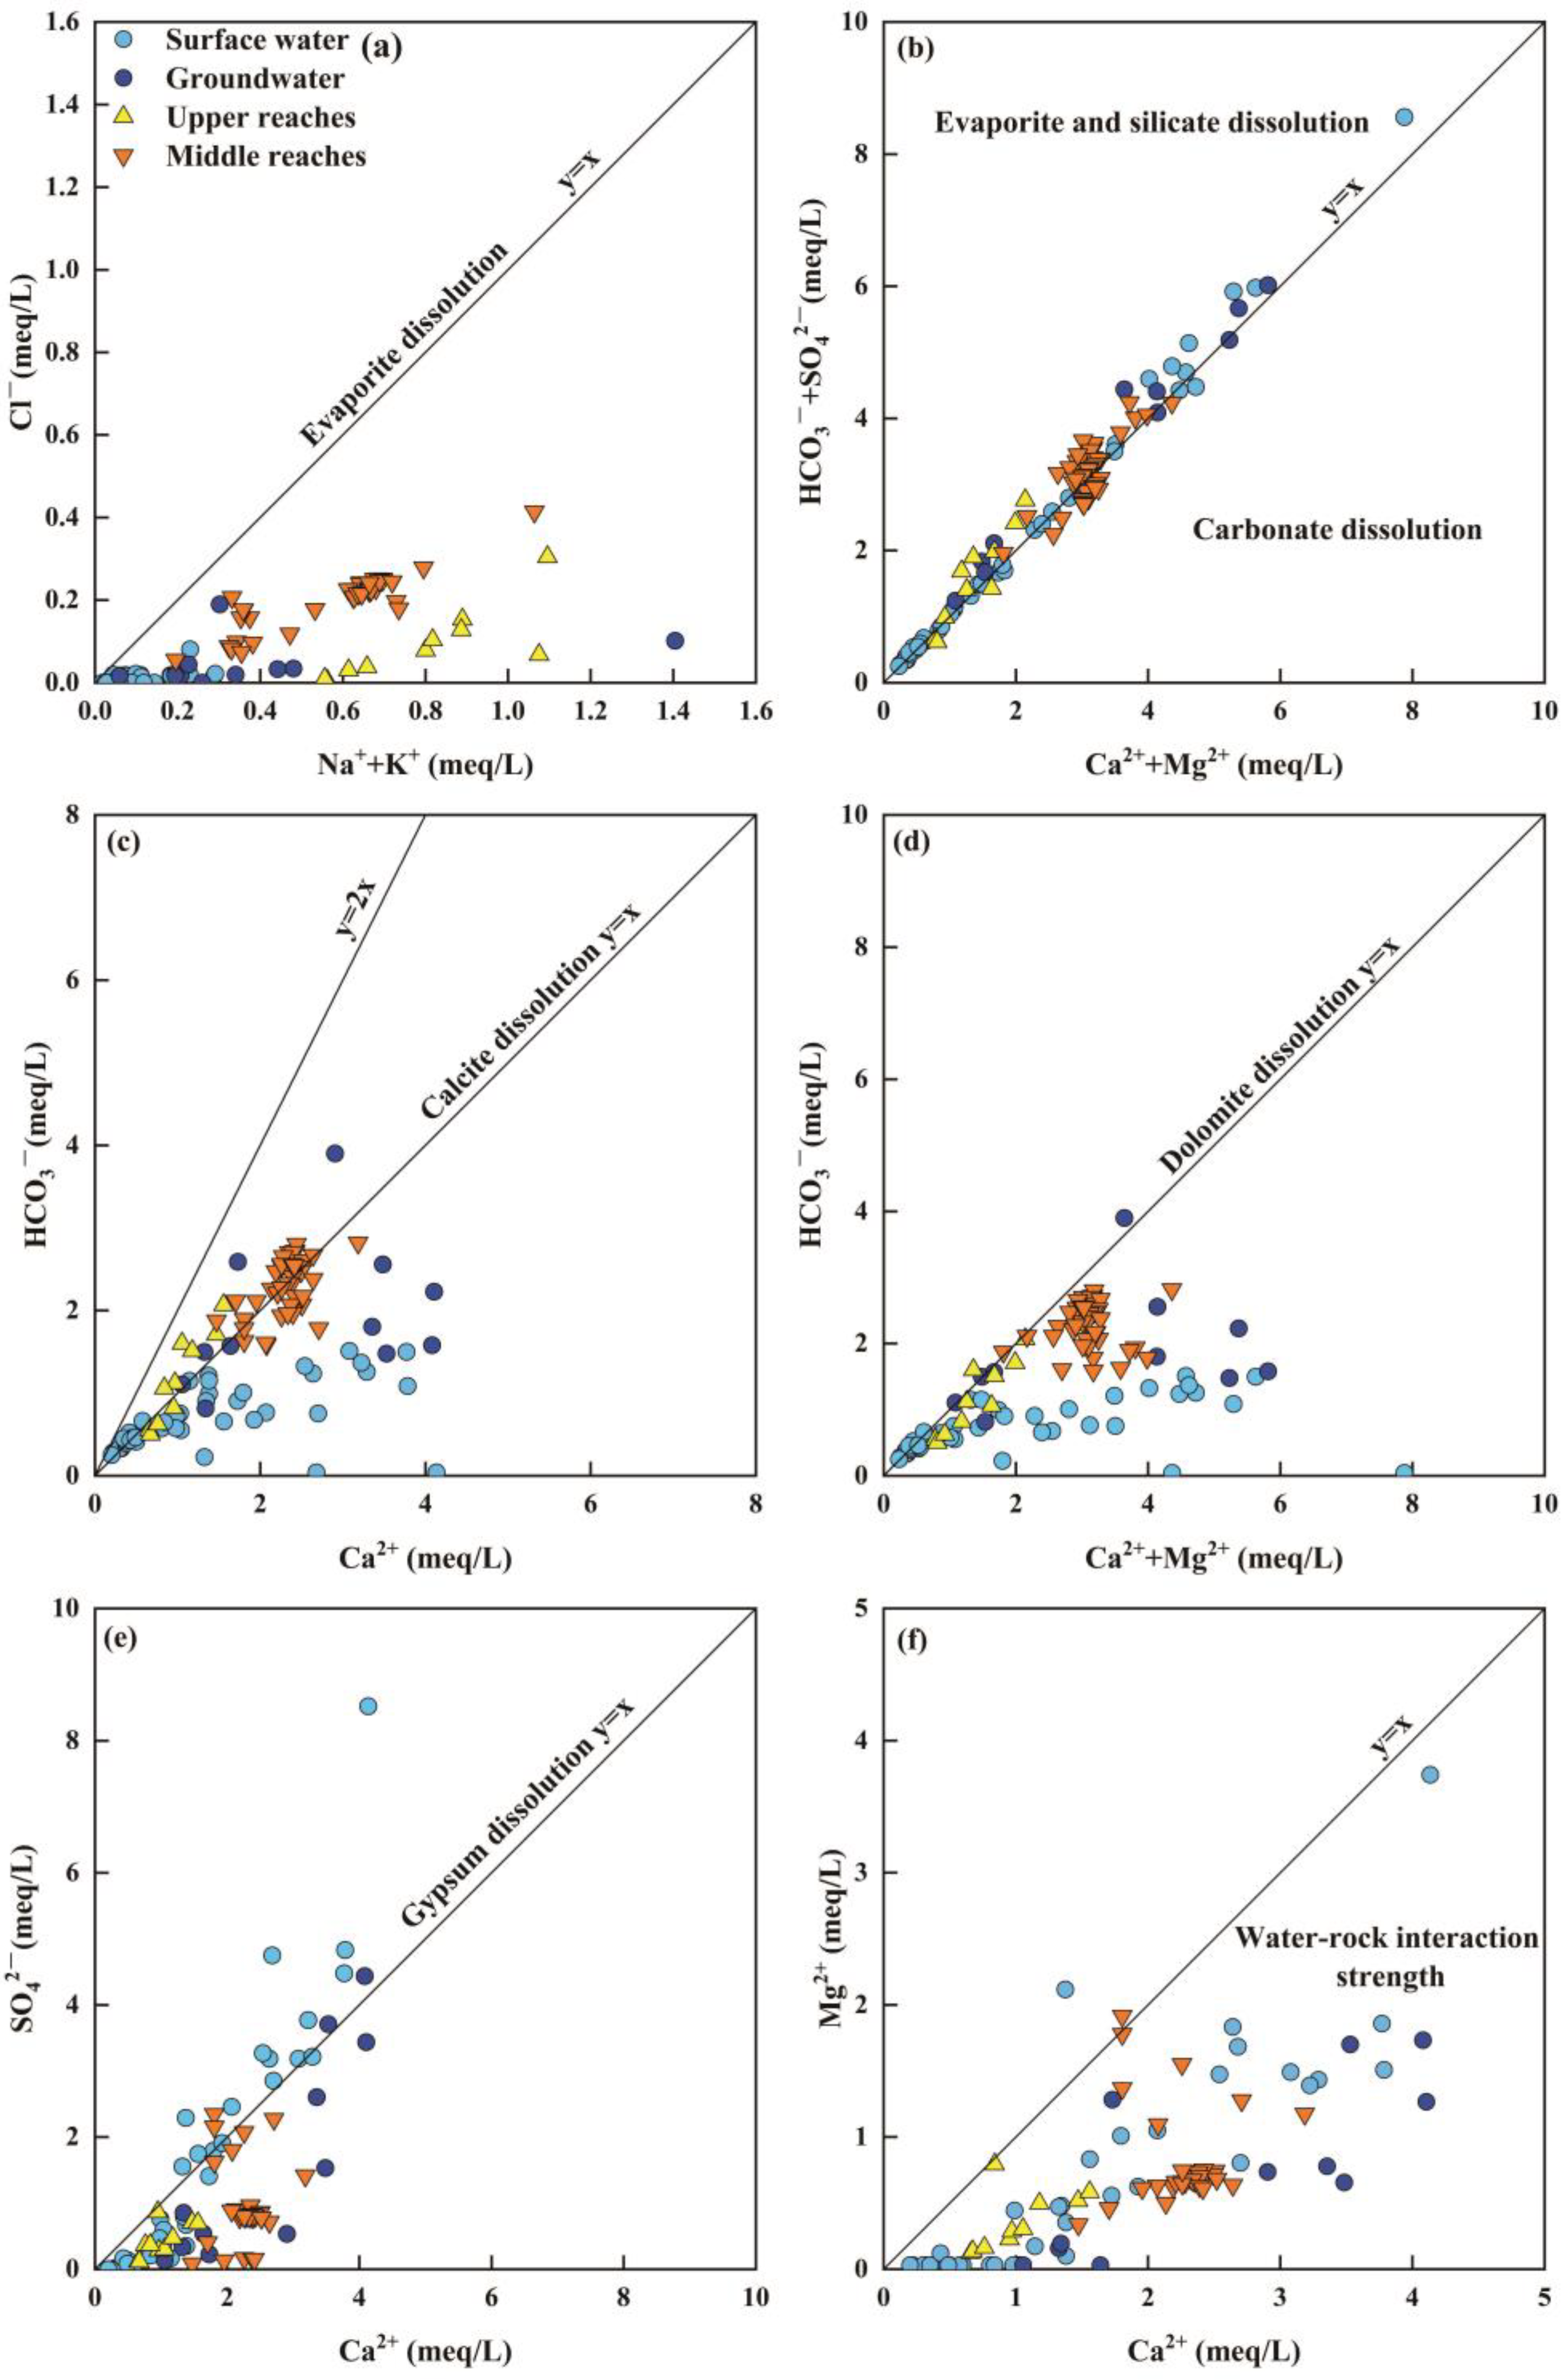
4.2.2. Ion Ratio Analysis
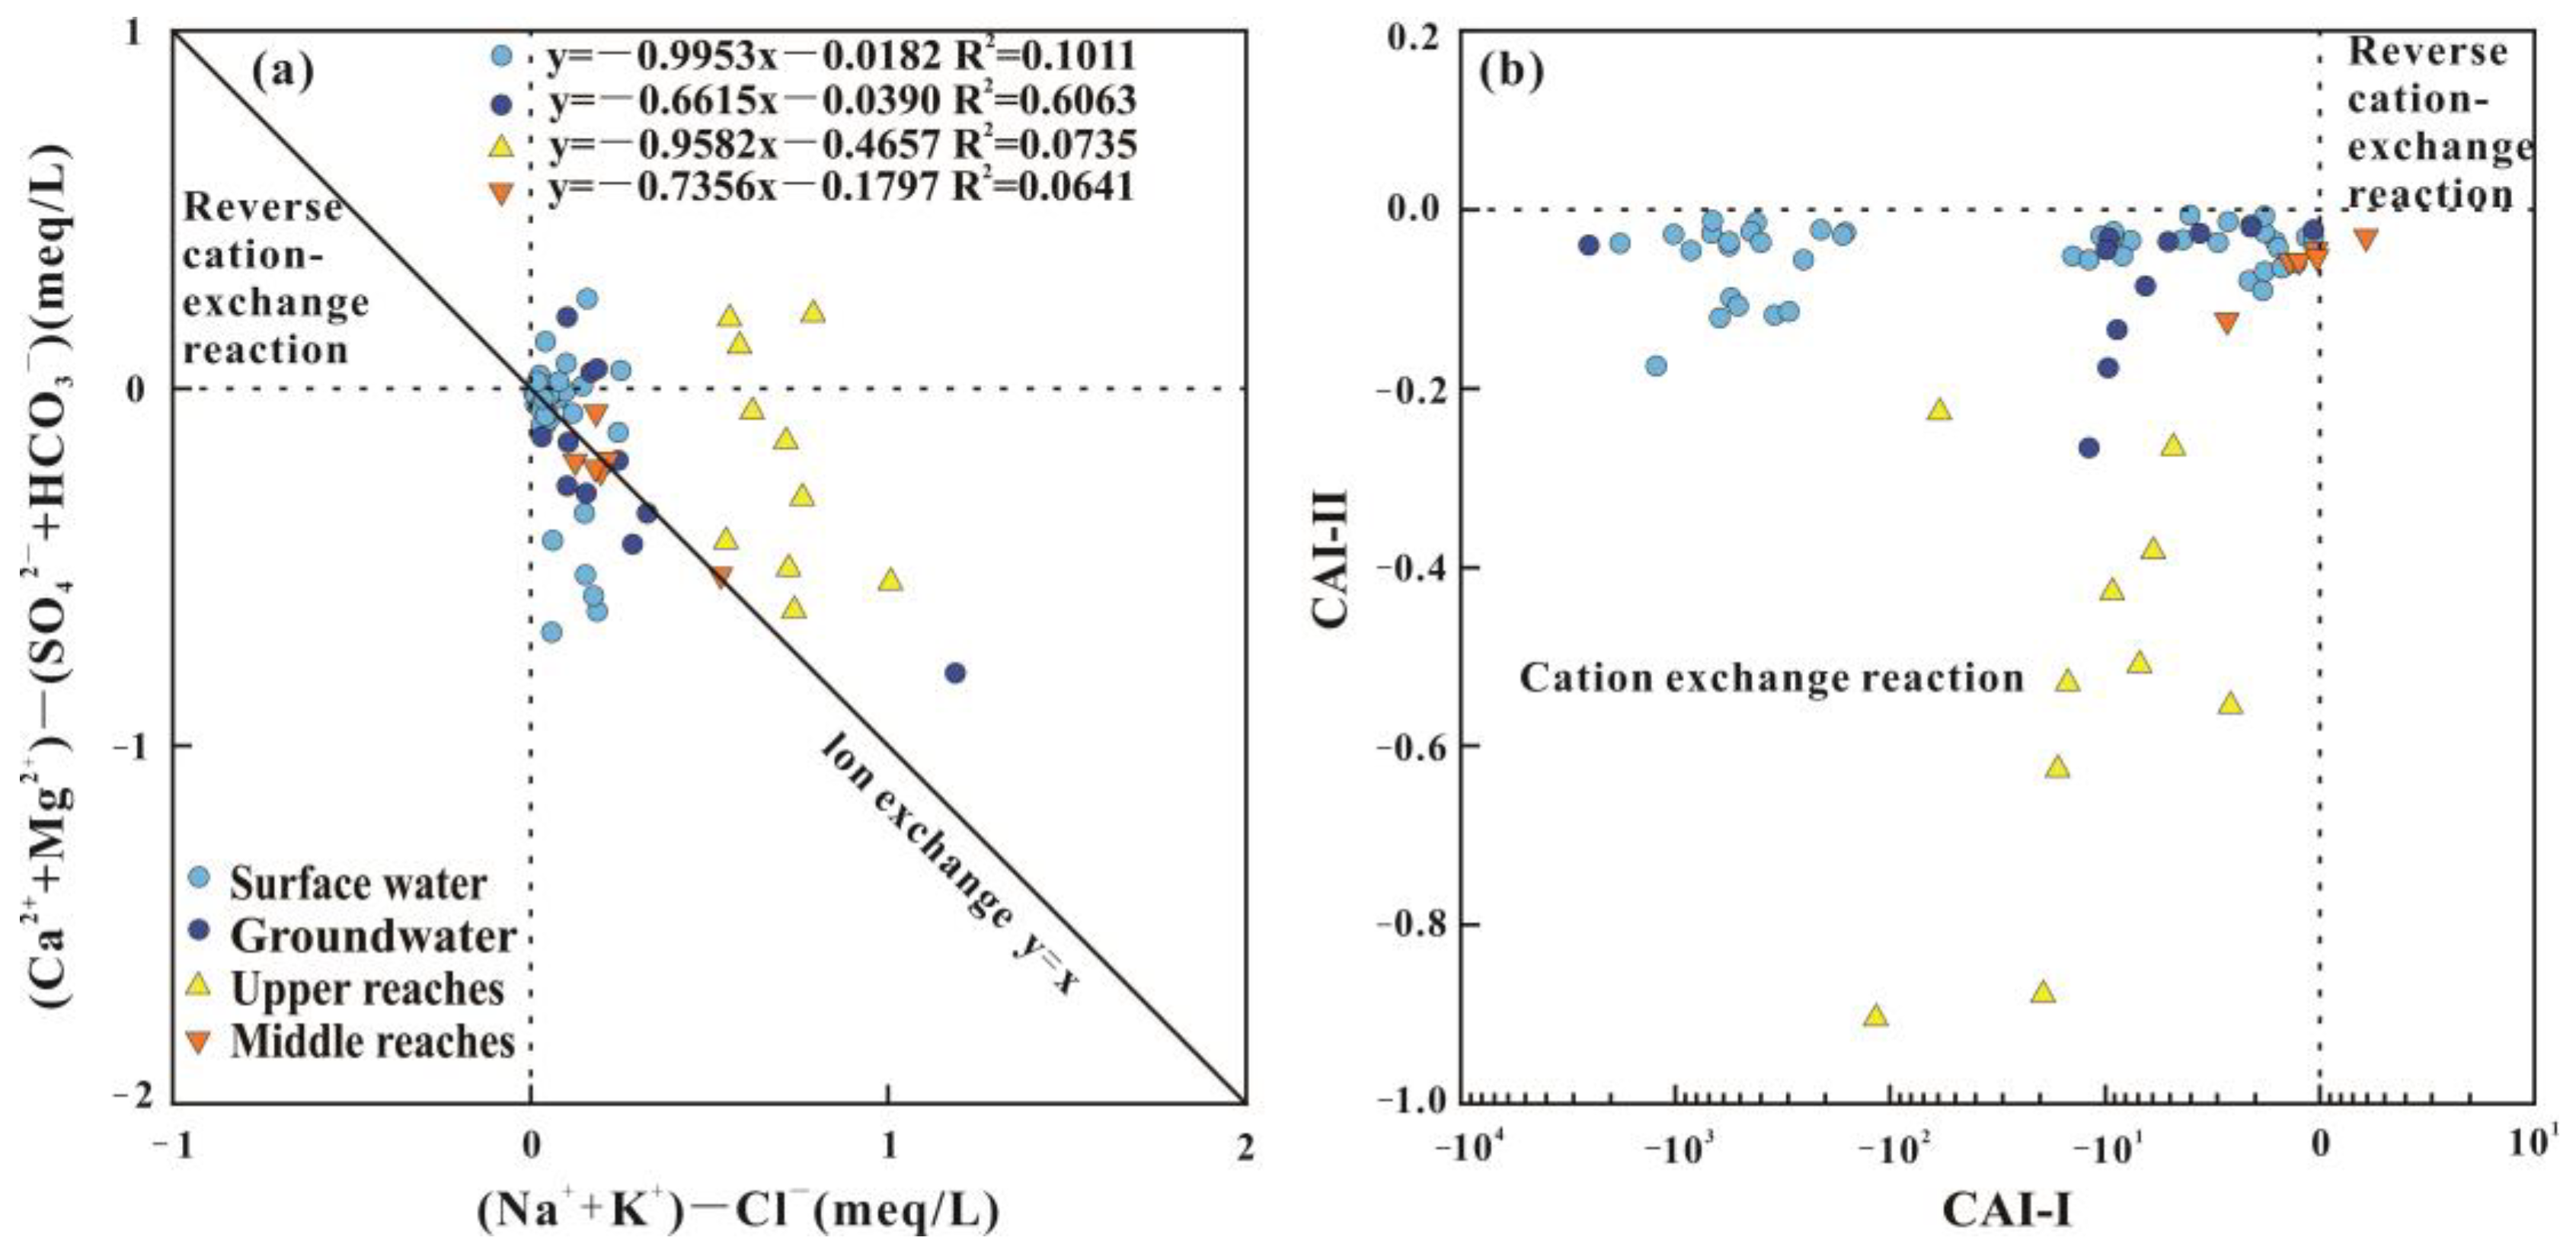
The ratio coefficients between various hydrochemical components have been used to determine the hydrochemical process [33,34]. The ion ratios of each component in the lower, middle, and upper reaches of the Yarlung-Zangbo River were also compared and analyzed as a way to further understand the characteristics of hydrochemical changes along the whole Yarlung-Zangbo River.
Silicate weathering, carbonate, and evaporative mineral dissolution can be determined by the correlation ratios of Ca2+, Mg2+, Na+, and HCO3 [17]. All samples in the upper, middle, and lower reaches of the Yarlung-Zangbo River were located in the silicate and carbonate dominating zones (Figure 8), indicating that silicate weathering and carbonate dissolution were the main types of water–rock interaction. Figure 8 also showed that from the upper to lower reaches of the Yarlung-Zangbo River, the dominated type of water-rock interaction displayed a gradual transition from silicate dissolution to carbonate dissolution.
The molar ratio relationship between (K+ + Na+) and Cl can reflect the sources of Na+ and K+ [33]. As shown in Figure 9a, both surface water and groundwater in the lower reaches of the Yarlung-Zangbo River fell below the y = x line and close to the K+ + Na+ axis, indicating the occurrence of silicate weathering. Since the Cl concentration is not sufficient to balance Na+ + K+, it indicated that there are other minerals dissolved to provide Na+ and K+ concentrations, such as dissolution of silicate minerals (sodium, potassium feldspar, etc.,). In addition, excess Na+ and K+ concentrations existed in the upper and middle reaches, indicating the silicate weathering.
Ca2+ and Mg2+ concentrations in groundwater mainly come from dissolution of carbonates or silicates and evaporites, so the molar ratio between (Ca2+ + Mg2+)/(HCO3 + SO42−) can be used to determine the main source of Ca2+ and Mg2+ [35]. When the ratio is close to 1, it indicates that carbonates (calcite, dolomite) dissolution and silicates weathering are the main source of Ca2+ and Mg2+. When this ratio is much greater than 1, it indicates that dissolution of carbonate minerals is the main source of Ca2+ and Mg2+. When this ratio is much less than 1, it indicates that evaporite dissolution and silicate weathering are the main source of Ca2+ and Mg2+. As shown in Figure 9b, most of the surface water and groundwater are located near the y = x line. Hence, Ca2+ and Mg2+ in surface water and groundwater in the lower reaches of the Yarlung-Zangbo River mainly originated from the dissolution and weathering of carbonate and silicate minerals, as well as those in the middle and upper reaches of the Yarlung-Zangbo River.
The molar ratios of Ca2+ and (Ca2+ + Mg2+) against HCO3 can determine the dissolution of carbonate rocks [33]. As shown in Figure 9c,d, some points fell on the y = x line and the remaining more points fall on the Ca2+ and Ca2+ + Mg2+ side, indicating calcite dissolution dominated the water–rock interaction in the lower reaches of the Yarlung-Zangbo River. The excess Ca2+ and Mg2+ were presumed to be derived from the dissolution of Ca- and Mg- bearing silicate minerals. The Ca2+/HCO3 and (Ca2+ + Mg2+)/HCO3 ratios of water samples in the middle and upper reaches of the Yarlung-Zangbo River showed the dissolution and weathering of carbonate and silicate minerals.
Molar ratio of Ca2+ and SO42− equal to 1:1 would indicate that Ca2+ and SO42− concentrations originated from the dissolution of gypsum [27]. As shown in Figure 9e, some surface water samples were located on the y = x line, from which it can be judged that a small portion of Ca2+ and SO42− in surface water also originates from the dissolution of gypsum. While most of surface water and groundwater samples fell above or below the y = x line. And the cause of this phenomenon may be cation exchange process. The sample points in the middle reaches of the Yarlung-Zangbo River mainly fell on the y = x line, indicating that gypsum dissolution also exists in the middle reaches. The sample points in the upper reaches fell below the 1:1 line, which may also be influenced by the cation exchange process.
The molar ratio between Ca2+ and Mg2+ is called the calcium–magnesium coefficient. Calcium-containing minerals are more insoluble than magnesium-containing minerals. When the water–rock interaction is very strong, the insoluble ions mainly exist in water. The ratio coefficient of Ca2+/Mg2+ is positively correlated with the degree of water–rock interaction. As shown in Figure 9f, both surface water and groundwater samples were biased toward the Ca2+ axis, indicating that obvious water–rock interaction occurs in surface water and groundwater.

4.2.3. Ion Exchange

Ion exchange process can be verified by the relationship between the (Ca2+ + Mg2+) − (SO42− + HCO3) and (Na+ + K+− Cl) [30]. As shown in Figure 10a, the surface water and groundwater samples, and mid- and upstream water samples in the lower reaches of the Yarlung-Zangbo River all fell near the straight line with a slope of −1. The slope of the linear distribution of the surface water samples is −0.9953 and R2 is 0.1011; the slope of the linear distribution of the groundwater samples is −0.6615 and R2 is 0.6063; the slope of the linear distribution of the upstream water samples is −0.9582 and R2 is 0.0. The results showed that the cation exchange is an important factor affecting water chemistry in the Yarlung-Zangbo River.
Cation exchange interaction can also be analyzed using the choroalkaline index [36]. Where the indices CAI-I (=(Cl − (Na+ + K+))/Cl) and CAI-II (=(Cl − (Na+ + K+))/(HCO3 + SO42− + CO32− + NO3)) are positive, it indicates that Na+ and K+ in water have been exchanged by Ca2+ and Mg2+ in the surrounding rocks, while negative values indicate the presence of reverse exchange, and the absolute value The larger the value, the stronger the ion-exchange interaction, and if the value is equal to 0, it means that there is no ion-exchange interaction in the water chemistry process. Figure 10b shows the CAI-I and CAI-II relationships of surface water, groundwater, and water samples from the lower reaches of the Yarlung-Zangbo River and the middle and upper reaches of the Yarlung-Zangbo River, and it can be seen that the vast majority of water samples are less than 0, indicating that Ca2+ and Mg2+ in surface water, groundwater, and water samples from the middle and upper reaches of the Yarlung-Zangbo River have been exchanged by Na+ and K+ in the surrounding rocks.

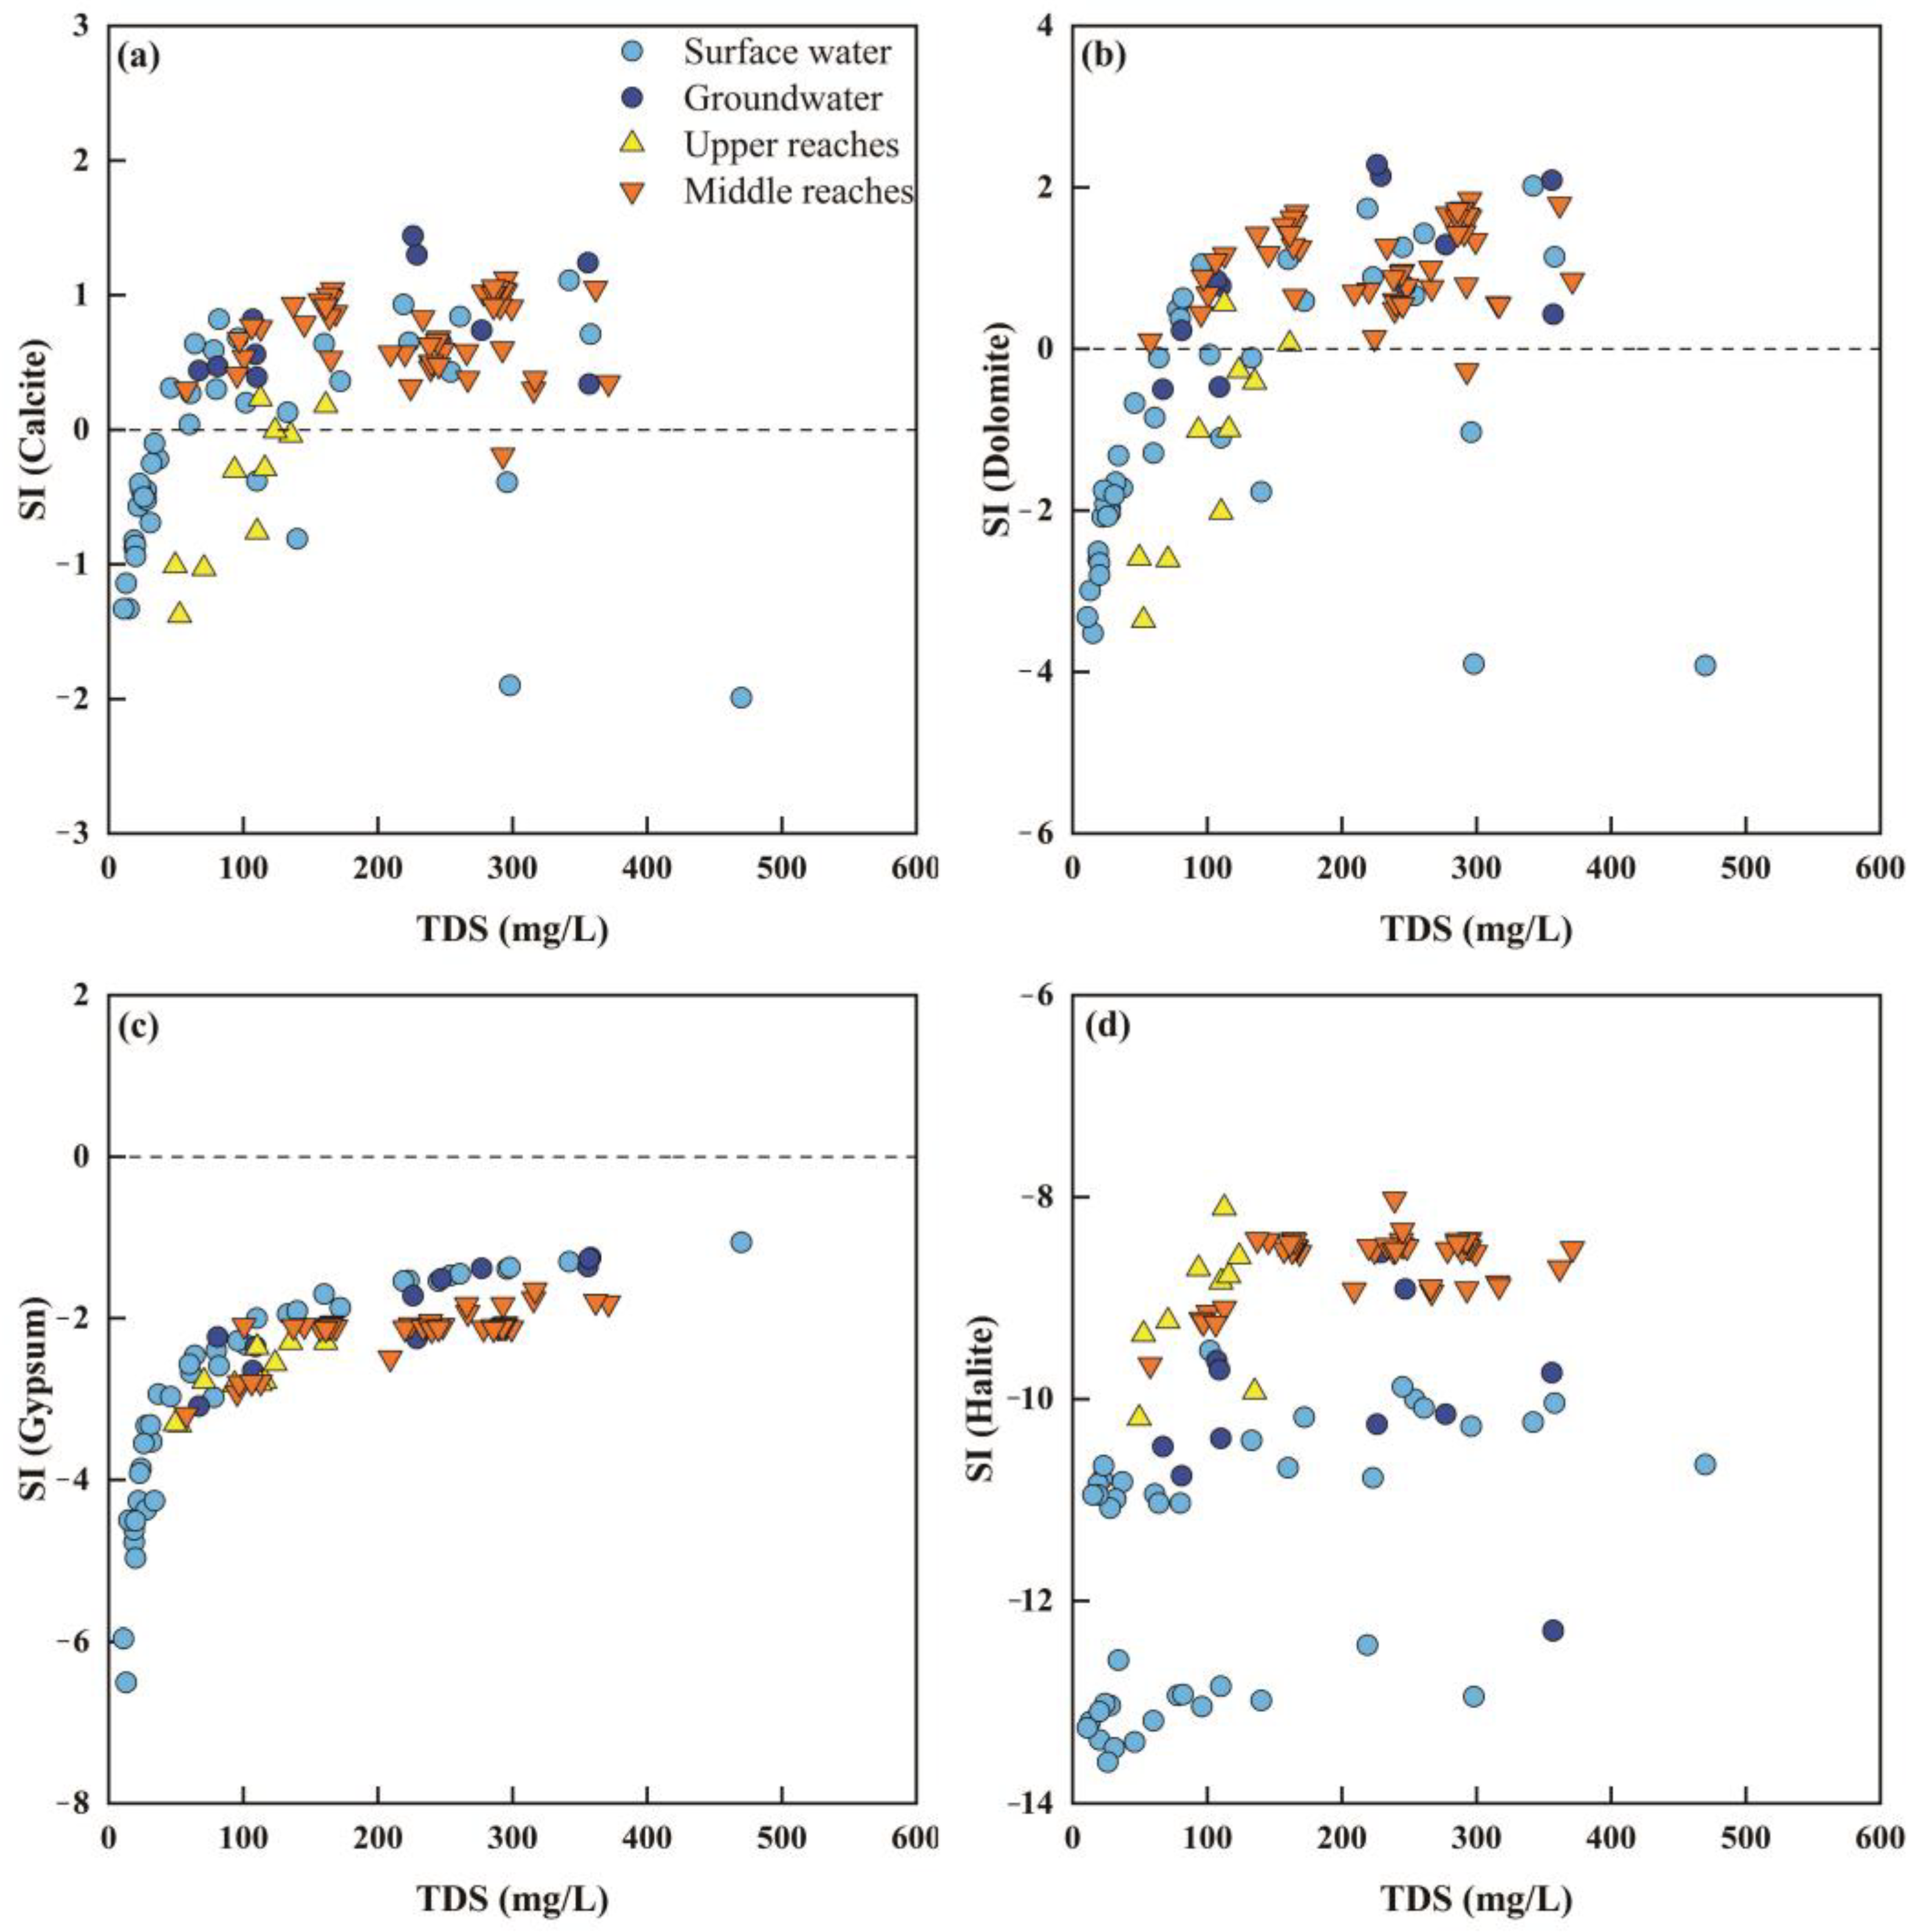
4.2.4. Saturation Index Analysis

The saturation index (SI) calculated by Phreeqc 3.0 is used to assess the equilibrium state of various minerals in water [37]. In this study, SI values of calcite, dolomite, gypsum, and halite were calculated for surface water and groundwater samples (Figure 11). The results showed that the SI of calcite, dolomite, gypsum, and halite were all less than 0 and thus were undersaturated. The SI values of calcite, dolomite, gypsum, and halite had the order as SI halite < SI gypsum < SI dolomite < SI calcite. Therefore, calcite dissolution is the predominant process in surface water and groundwater. It was consistent with the results of ion ratio analysis.

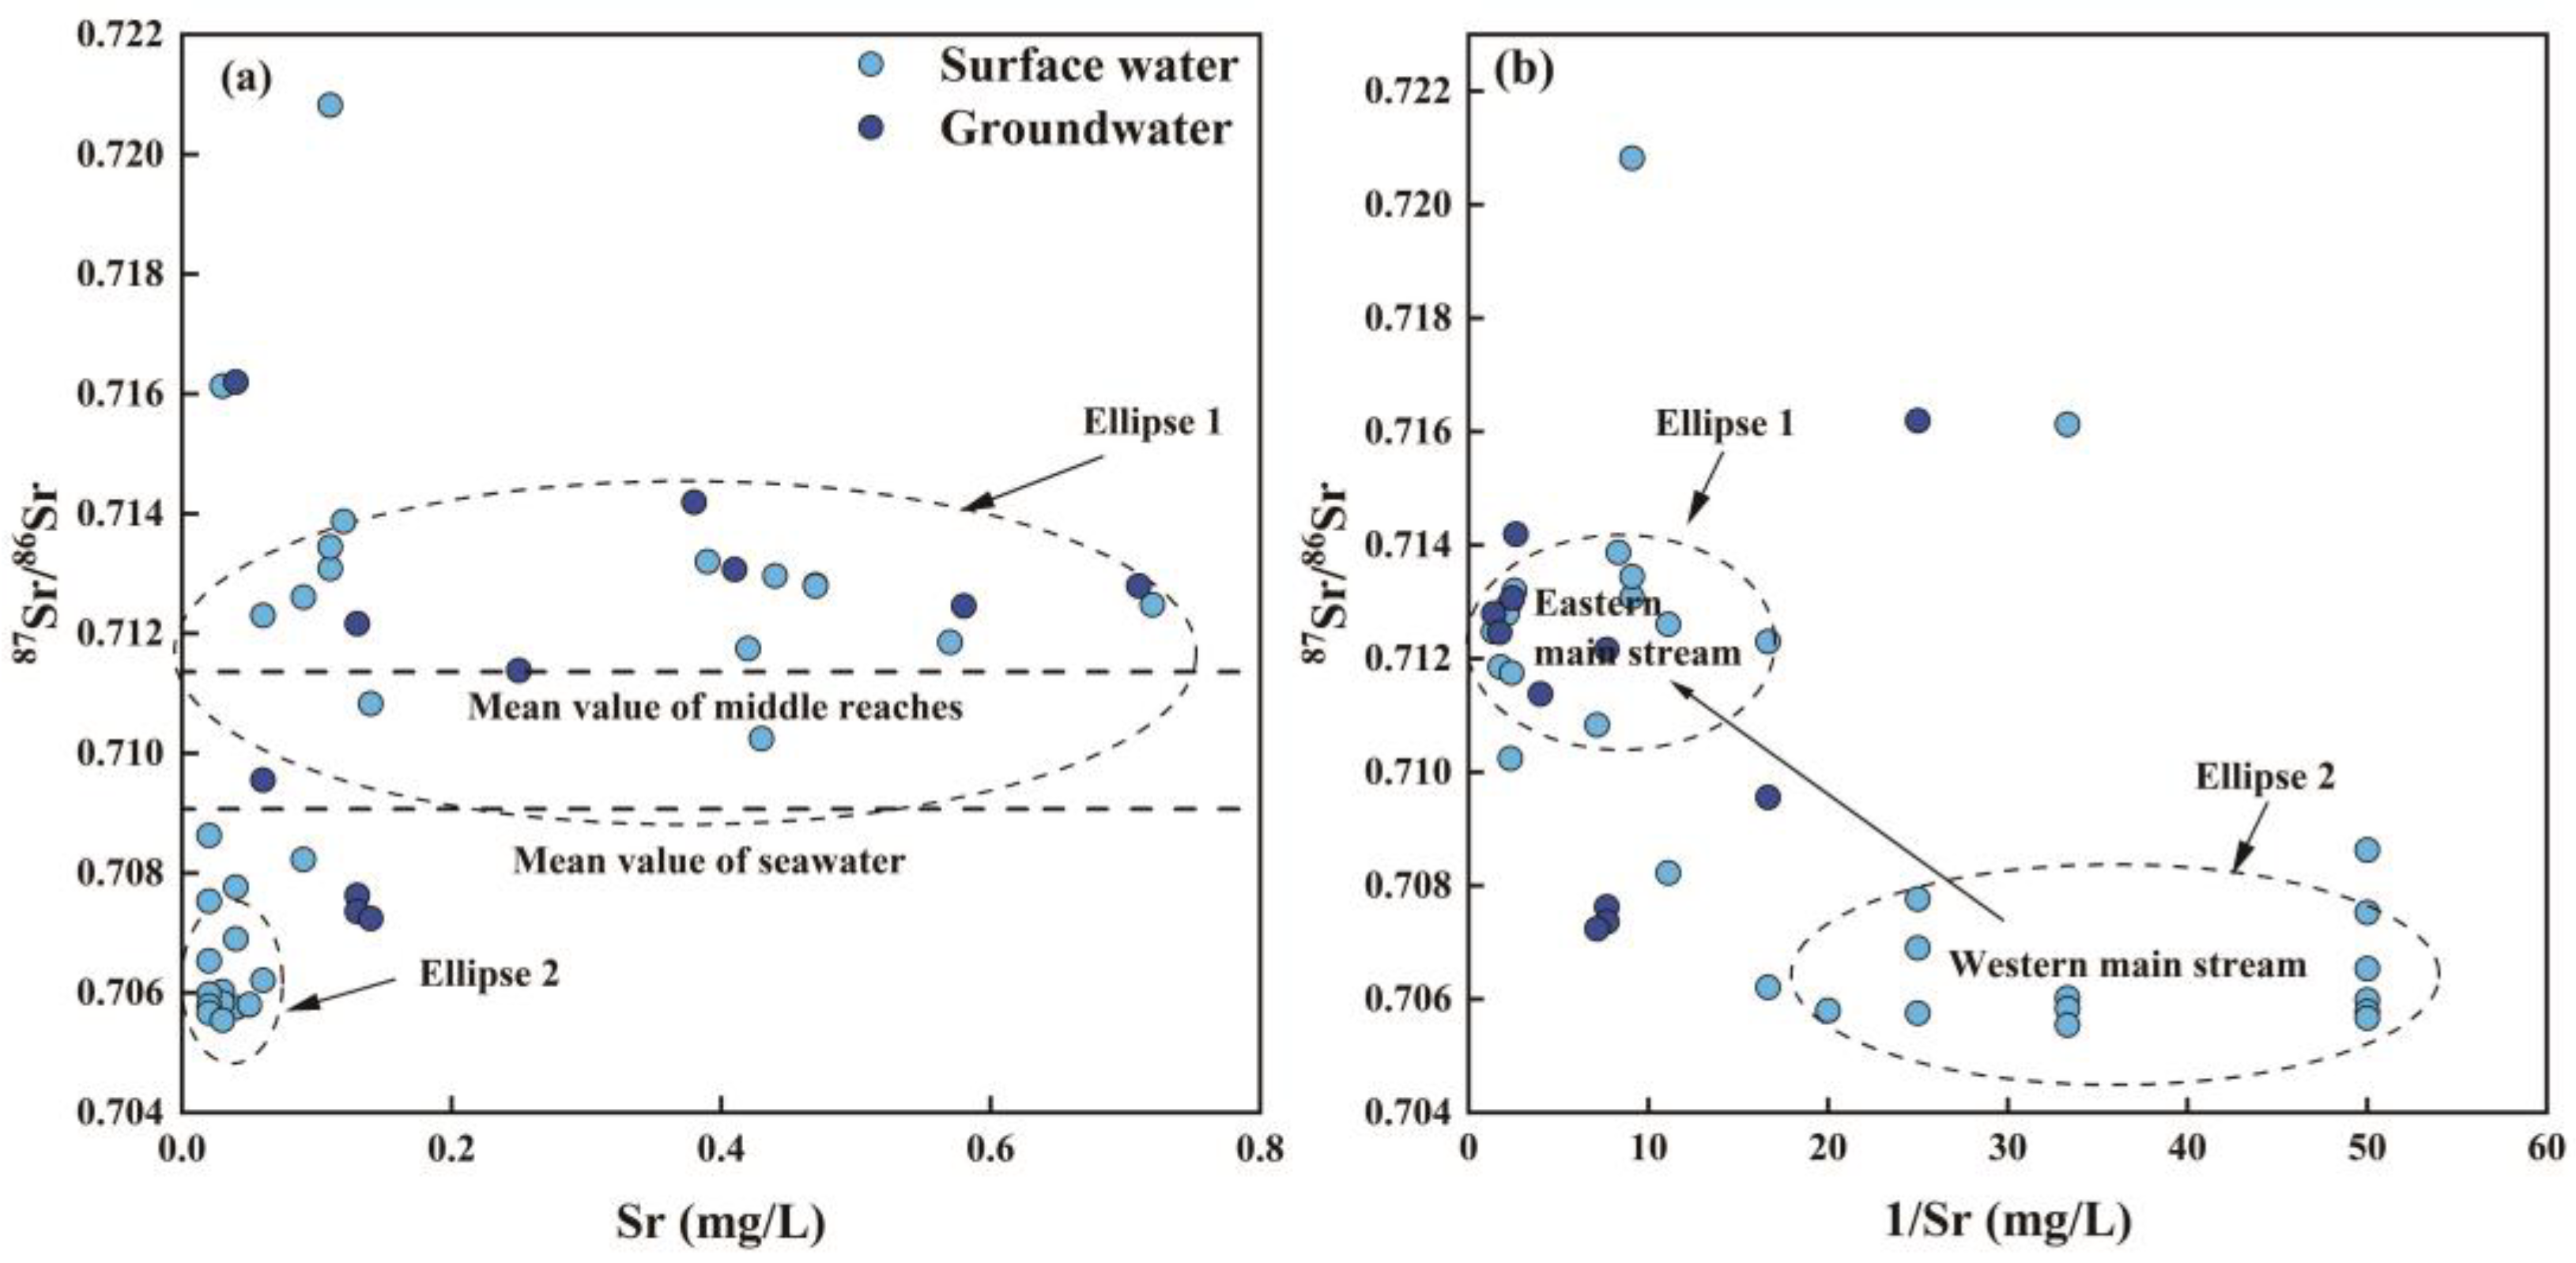
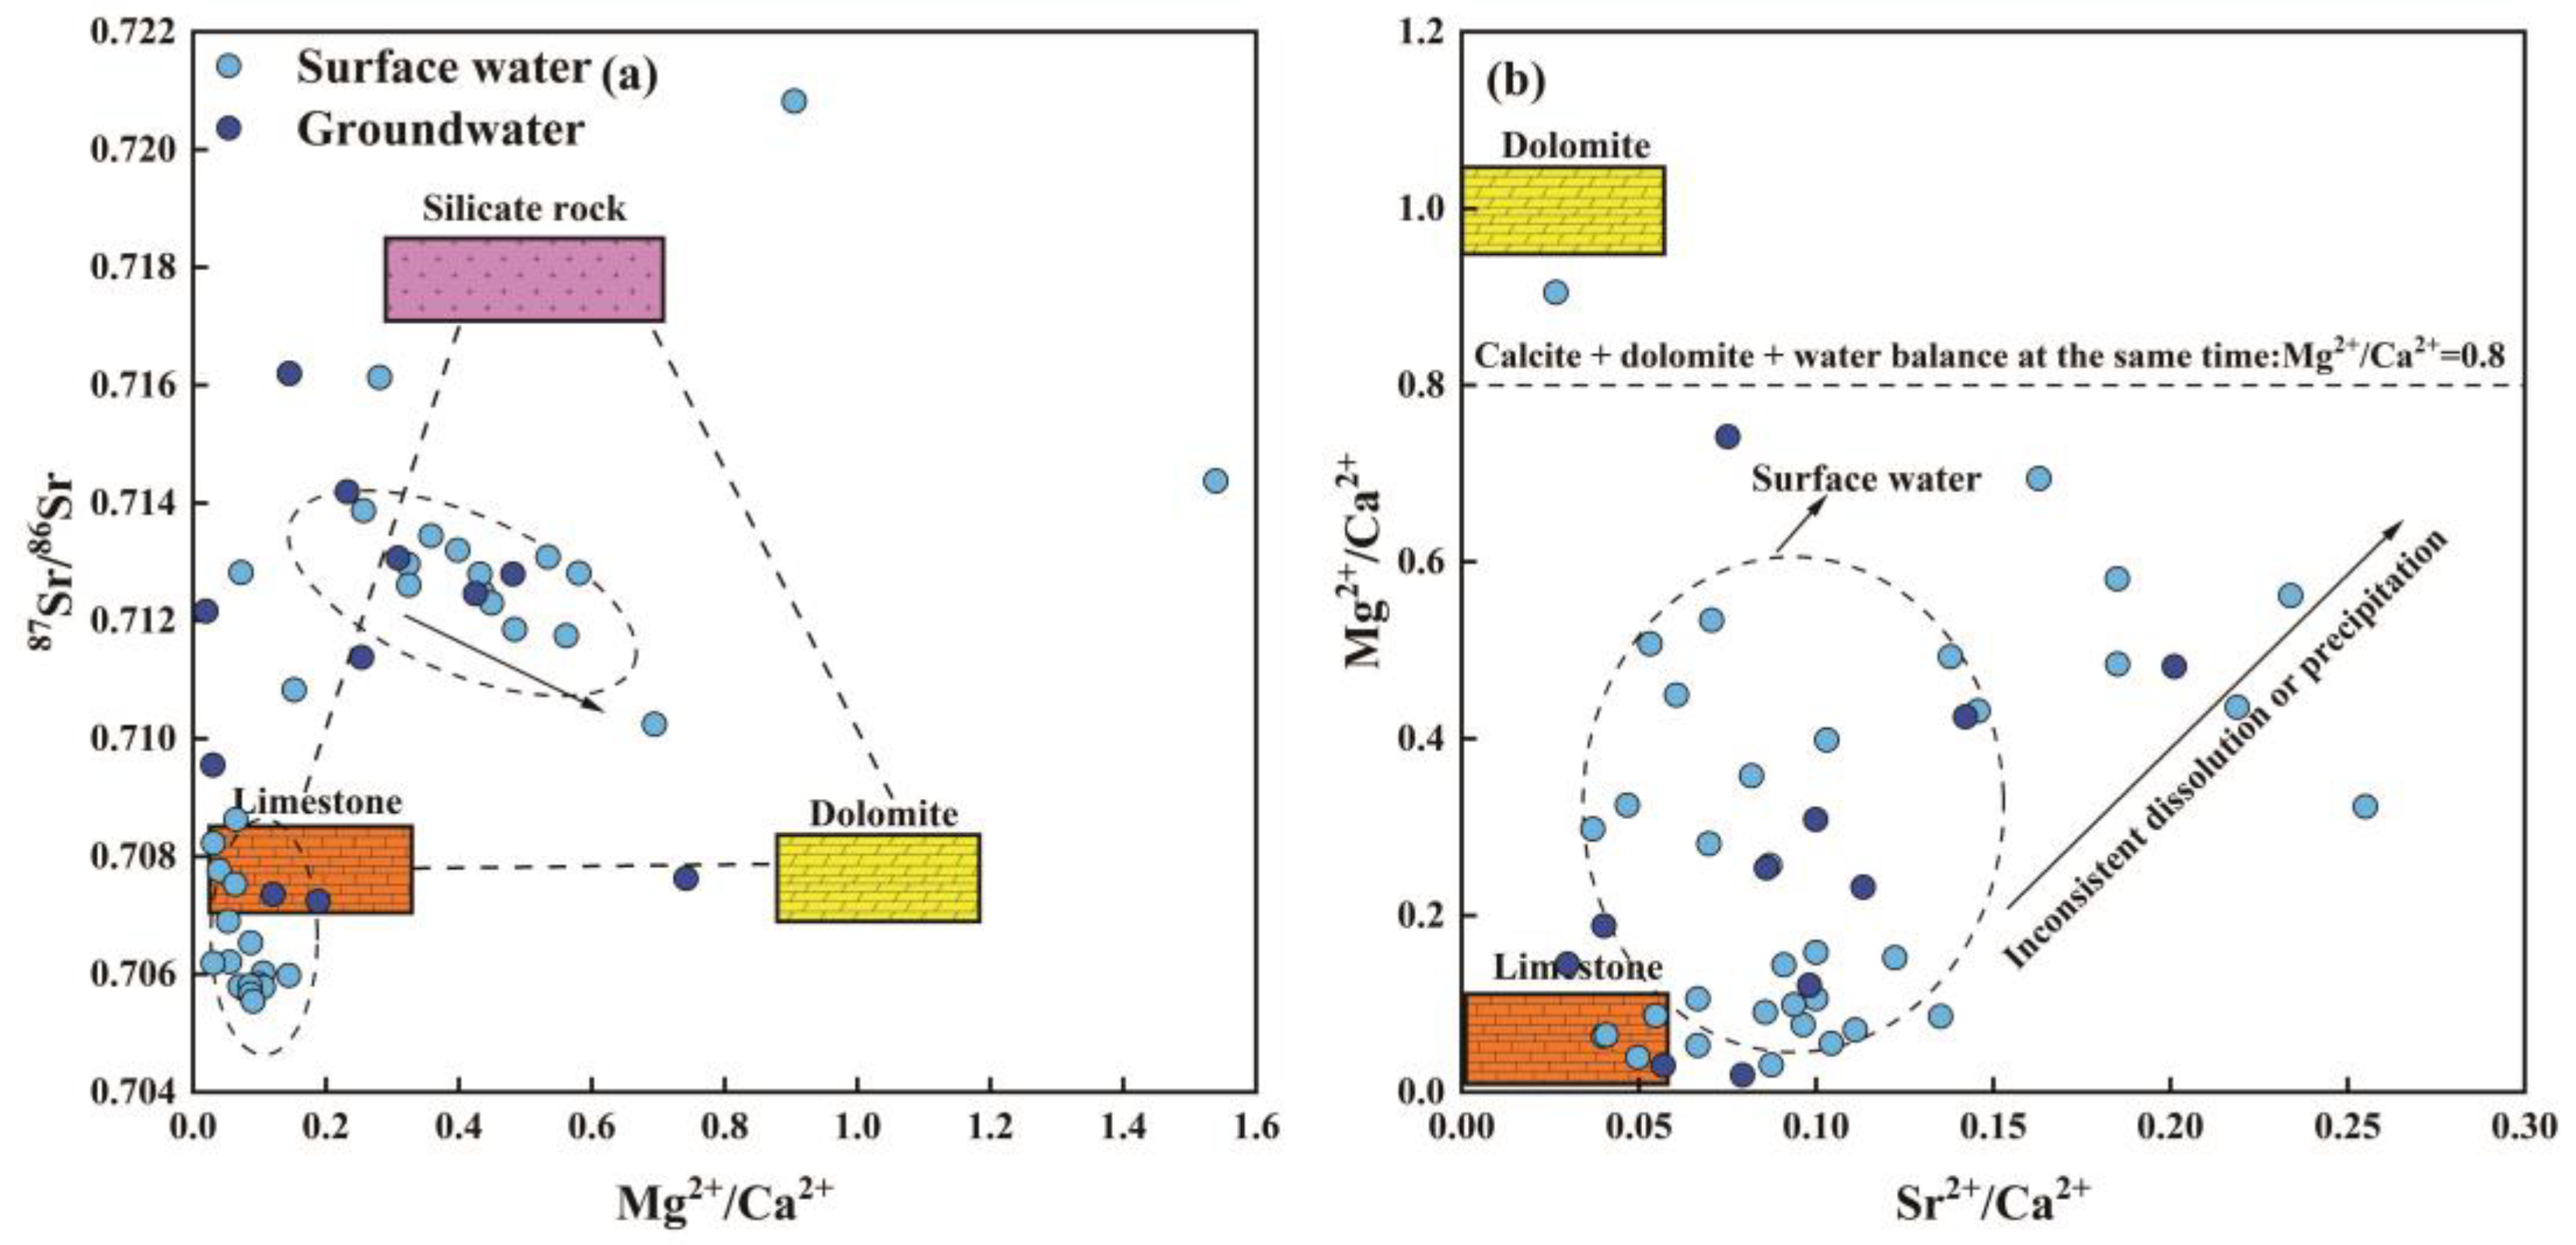
4.2.5. Water–Rock Interaction Implied by Sr Isotope

The variation of strontium concentration and strontium isotope of surface and groundwater can be used to identify the main water-rock interaction [38,39,40]. The mean values of Sr content and 87Sr/86Sr ratio of groundwater were higher than those of surface water in the lower reaches of the Yarlung-Zangbo River. Most of the 87Sr/86Sr ratios of surface water and groundwater samples in the lower reaches of the Yarlung-Zangbo River were greater than the mean value of modern seawater (0.70907) and the mean value of the middle reaches of the Yarlung-Zangbo River (0.71136) [12], respectively (Figure 12a). It indicated that a large amount of Sr2+ was dissolved from the rocks during the runoff. Meanwhile, the surface water and groundwater in the lower reaches experienced water–rock interaction, and then increased 87Sr/86Sr ratio in surface water and groundwater (Figure 12b). This indicates that the 87Sr/86Sr ratios in surface and groundwater in the lower reaches of the Yarlung-Zangbo River are influenced by water–rock interaction. The 87Sr/86Sr ratios of most surface water and groundwater samples in the lower reaches of the Yarlung-Zangbo River lied in the source field between carbonate rock (0.708–0.709) and silicate rock (0.716–0.720), indicating that Sr content in surface water and groundwater in the lower reaches of the Yarlung-Zangbo River is dominated by carbonate rock and silicate rock weathering. In terms of regional distribution (Figure 12b), the 87Sr/86Sr ratios in surface water and groundwater are higher in the eastern mainstem of the lower reaches of the Yarlung-Zangbo River and lower in the western mainstem, with an overall trend of increasing along the river runoff path. The southwestern and southeastern tributaries show higher 87Sr/86Sr ratios, which may be due to the tributary areas being more influenced by silicate rock weathering.
It was shown that the strontium isotopic compositions in different minerals are significantly different, and the 87Sr/86Sr average ratio of 0.7075 and lower Mg2+/Ca2+ ratio (~0.1) can be considered as the end member of dissolved limestone; 87Sr/86Sr average ratio of 0.7093 and higher Mg2+/Ca2+ values (~1.05) as the end member of dissolved dolomite. 87Sr/86Sr mean ratio of 0.7200 and moderate Mg2+/Ca2+ values (~0.7) are used as end members of dissolved silicate rocks [41]. As can be seen in Figure 13a, most of the surface water and a small portion of the groundwater sample points were concentrated around the limestone end member, indicating that they are mainly affected by calcite dissolution. The remaining portion of the surface water and most of the groundwater sample points were distributed near the limestone and silicate rock mixing line. This indicated that the surface water and groundwater samples in this part are mainly controlled by calcite dissolution and silicate weathering.
During the dissolution of carbonate minerals, Sr behaves similarly to Mg. Ca2+ and Mg2+ in groundwater correlate well with the variation of Sr, indicating that alkaline earth metals have similar origin. Therefore, the ratios of Mg2+/Ca2+ and Sr2+/Ca2+ can be used to trace the water–rock reaction [42]. As shown in Figure 13b, most samples of surface water and groundwater were more concentrated and can also be analyzed with an approximate three-terminal member mixture, i.e., a mixture of limestone aquifer water, dolomite aquifer water, and surface water. It indicated the direct mixing of surface water with groundwater, which affects the chemical composition of surface water. Only a few water samples in Figure 8b had high Mg2+/Ca2+ and Sr2+/Ca2+ ratios, indicating a small effect of non-conformable dissolution/precipitation of carbonate rocks. Non-conformable dissolution/precipitation will elevate the Mg2+ content in water, does not result in significantly larger Mg2+/Ca2+ ratios in surface and groundwater than the water in which calcite and dolomite are in simultaneous equilibrium Mg2+/Ca2+ ratio (0.8).

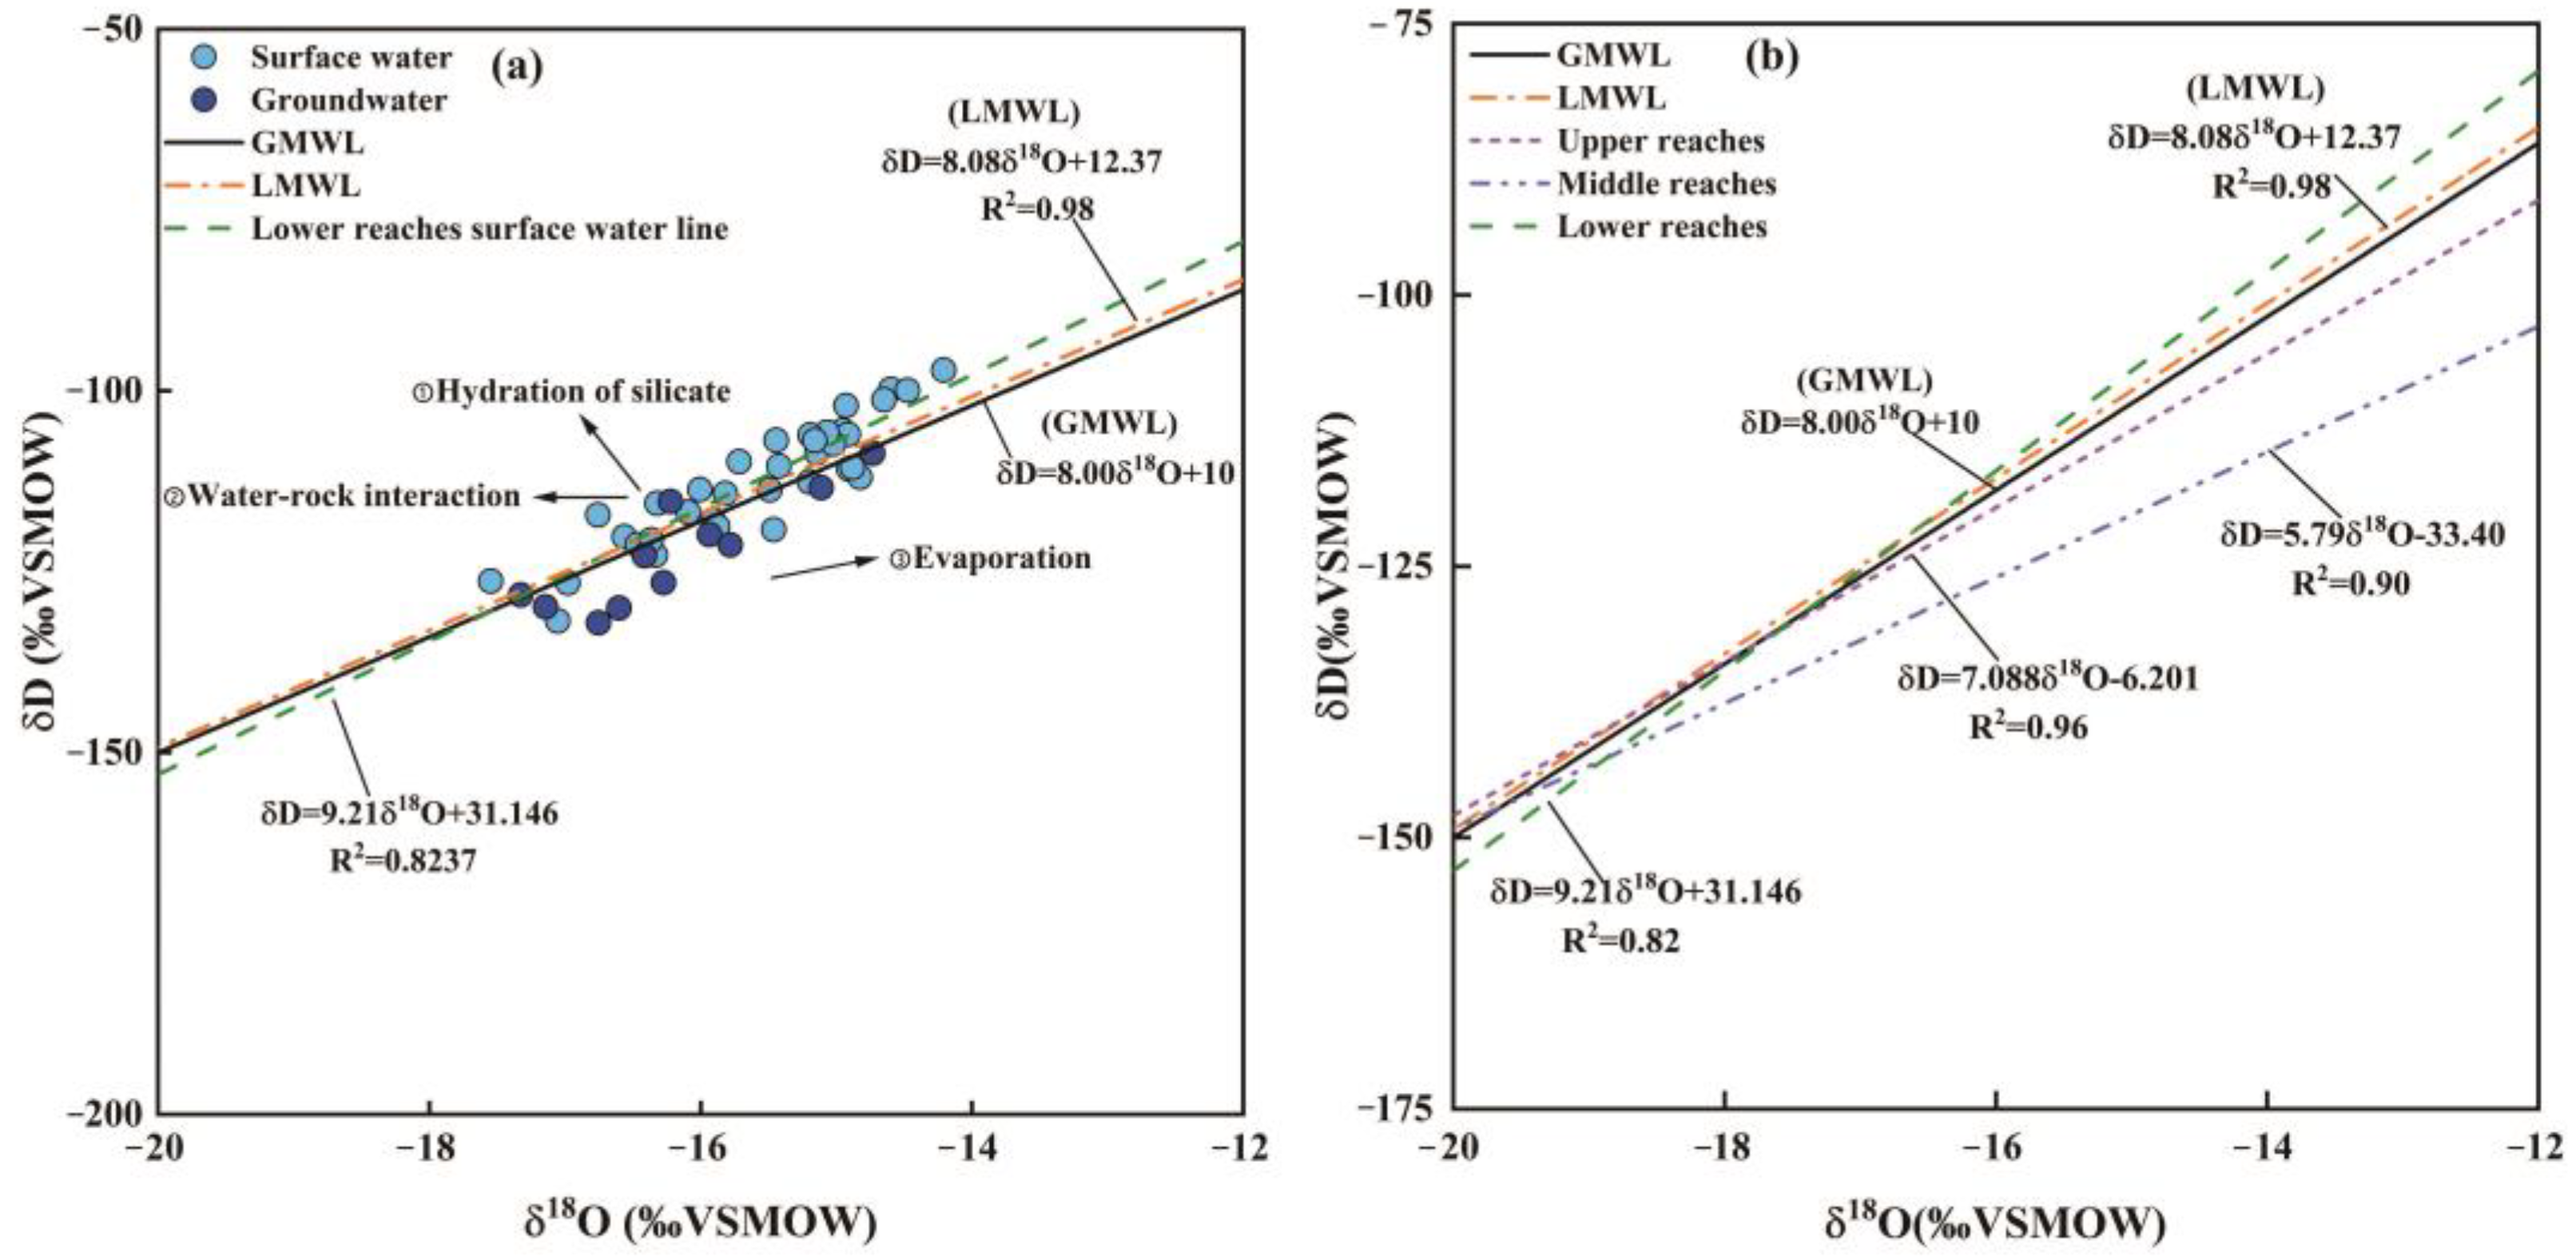
4.2.6. Recharge Sources Determined by D-O Isotopes

Using δD and δ18O data of rainfall precipitation, surface water, and groundwater, δD-δ18O scatter diagrams can be plotted, and by comparison with global meteoric water line (GMWL) or regional atmospheric precipitation lines, the fractionation effect of δD and δ18O in water bodies can be analyzed in depth to reveal the occurrence process and driving mechanism and provide a tracer for hydrogeological studies.
In the δD-δ18O scatter plotting diagram (Figure 14a), it can be seen that both surface water and groundwater samples were close to the local atmospheric precipitation line (LMWL) [43] and the global atmospheric precipitation line (GMWL) [44]. The results indicated that surface water and groundwater were derived from local atmospheric precipitation. A small portion of surface water samples in the lower reaches of the Yarlung-Zangbo River were located to the right of the atmospheric precipitation line and the GMWL, indicating that surface water was less influenced by evapotranspiration. The slope of the surface water line in the lower reaches of the Yarlung-Zangbo River was 9.21, close to the local atmospheric precipitation line of 8.08, while the intercept (31.146) is higher than the local atmospheric precipitation line (12.37). The results were due to the water hydration with silicate minerals during runoff, resulting in the δ18O depletion and slight δD enrichment in surface water. And the strong oxygen isotope exchange caused δ18O loss and kinetic fractionation during ice melt, which can have an impact on δD and δ18O balance. Therefore, most of the surface water samples were located to the left of the atmospheric precipitation line and global meteoric water line (GMWL) in the lower reaches of the Yarlung-Zangbo River. Moreover, surface water mainly originates from the middle and upper reaches of mainstream and tributary water atmospheric precipitation and ice melt. The δD and δ18O values of most groundwater samples were located below the atmospheric precipitation line in the lower reaches of the Yarlung-Zangbo River and the global atmospheric precipitation line. It may be influenced by the isotope elevation effect and kinetic fractionation, resulting in lower δD and δ18O values in groundwater. Groundwater was mainly recharged from atmospheric precipitation, ice and snow melt water, whose recharge elevation was higher than that of surface water. A comparative analysis of the surface water lines of the Yarlung-Zangbo River (Figure 14b) showed that the deviation was greatest in the middle and lower reaches (slope of 5.79) and less in the upper reaches (slope of 7.088 and 9.21). It indicated that the middle reaches of the Yarlung-Zangbo River was subject to stronger evaporation and the upper reaches and lower reaches of the Yarlung-Zangbo River were subject to weaker evaporation.

4.3. Assessment of Groundwater Quality Based on EWQI

The entropy-weighted water quality index (EWQI) method has been widely used to assess the combined impact of water chemistry parameters on overall water quality [45,46,47]. When the EWQI value is below 100, it means that the water quality reaches the permit limit for drinking water. Twelve surface and groundwater parameters were selected for EWQI calculations, including pH, TH, TDS, K+, Na+, Ca2+, Mg2+, Cl, SO42−, HCO3, NO3, and F. The procedure was described as Zhang et al. [48]. The results showed that the EWQI values of surface water varied from 1.84 to 81.34 with a mean value of 11.93, and the EWQI values of groundwater varied from 7.14 to 21.77 with a mean value of 16.13. The EWQI values of groundwater were slightly higher than those of surface water. The surface water and groundwater quality can be classified into five classes according to EWQI. In Figure 15, it showed that most of the surface water and all groundwater samples belonged to excellent water of class 1. Only 2 surface water samples were good water of class 2 and also meet the WHO drinking standards. The two surface water samples exceeded the fluoride standard of 1.62 mg/L and 2.02 mg/L, respectively, and may have been affected by contamination from human activities. Figure 15 also shows a better linear trend of EWQI and TDS for surface water and groundwater samples.

4.4. Hydrochemical Conceptual Model of the Yarlung-Zangbo River

As shown in Table 2, the pH values increased from the upper to the lower reaches of the Yarlung-Zangbo River and was weakly alkaline. The TDS and most of the ion concentrations in the upper and lower reaches of the river were lower than those in the middle reaches of the river, which is mainly due to the relatively strong evaporation in the middle reaches of the river and the dilution effect of snow melting in the upper reaches and increasing rainfall recharge in the lower reaches. Hydrochemical type was Ca-Na-HCO3-SO4 in the upper reaches of the Yarlung-Zangbo River, whose hydrochemical compositions were determined by silicate weathering and carbonate dissolution. Hydrochemical type was Ca-HCO3 and Ca-HCO3-SO4 in the middle reaches of the Yarlung-Zangbo River, and the main ions were derived from carbonate and evaporite dissolution. Hydrochemical type was Ca-HCO3 and Ca-SO4-HCO3 in the lower reaches of the Yarlung-Zangbo River, and the main ions were derived from carbonate and evaporite dissolution. Therefore, it can be concluded that the whole basin of the Yarlung-Zangbo River is controlled by the dissolution of carbonate rocks (Figure 16). Combined with Figure 10a,b, it shows that from the upstream to the lower reaches of the river, the controlling factor of water chemistry changes from water–rock action to water–rock action and atmospheric precipitation, and the main form of water–rock action shows a trend of transition from silicate weathering and dissolution to carbonate weathering and dissolution. Considering the low concentration of Cl and NO3, anthropogenic activities were weak in the whole basin of the Yarlung-Zangbo River (Table 4).

5. Conclusions

Hydrochemistry and stable isotopes (δ2H, δ18O and 87Sr/86Sr) were integrated to identify the major factors affecting the hydrochemical process of groundwater and surface water in the lower reaches of the Yarlung-Zangbo River, southern Tibet. The hydrochemical compositions were further analyzed to reveal the spatial characteristics of water–rock interaction along the Yarlung-Zangbo River. Four main conclusions were achieved as follows:
(1)
Surface water and groundwater were weakly alkaline and belonged to very soft to moderately hard fresh water. Major cations in surface water and groundwater ranked as Ca2+ > Mg2+ > Na+ > K+. Major anion concentrations in surface water were SO42− > HCO3 > Cl > F > NO3, and major anion concentrations in groundwater were HCO3 > SO42− > Cl > NO3 > F, respectively. The hydrochemical type of surface water is mainly Ca-HCO3 (mainstream) and Ca-SO4-HCO3 (tributary), while the hydrochemical type of groundwater was mainly Ca-SO4-HCO3.
(2)
Hydrochemical compositions of surface water and groundwater were mainly affected by water–rock interaction. Silicate weathering, calcite dissolution, and cation exchange were involved in water–rock interaction of surface water and groundwater. Evaporite dissolution locally occurred in the tributary area. Surface water and groundwater were recharged by atmosphere precipitation and local snow melting. Stronger evaporation occurred in the middle reaches than that in the upper reaches and lower reaches of the Yarlung-Zangbo River.
(3)
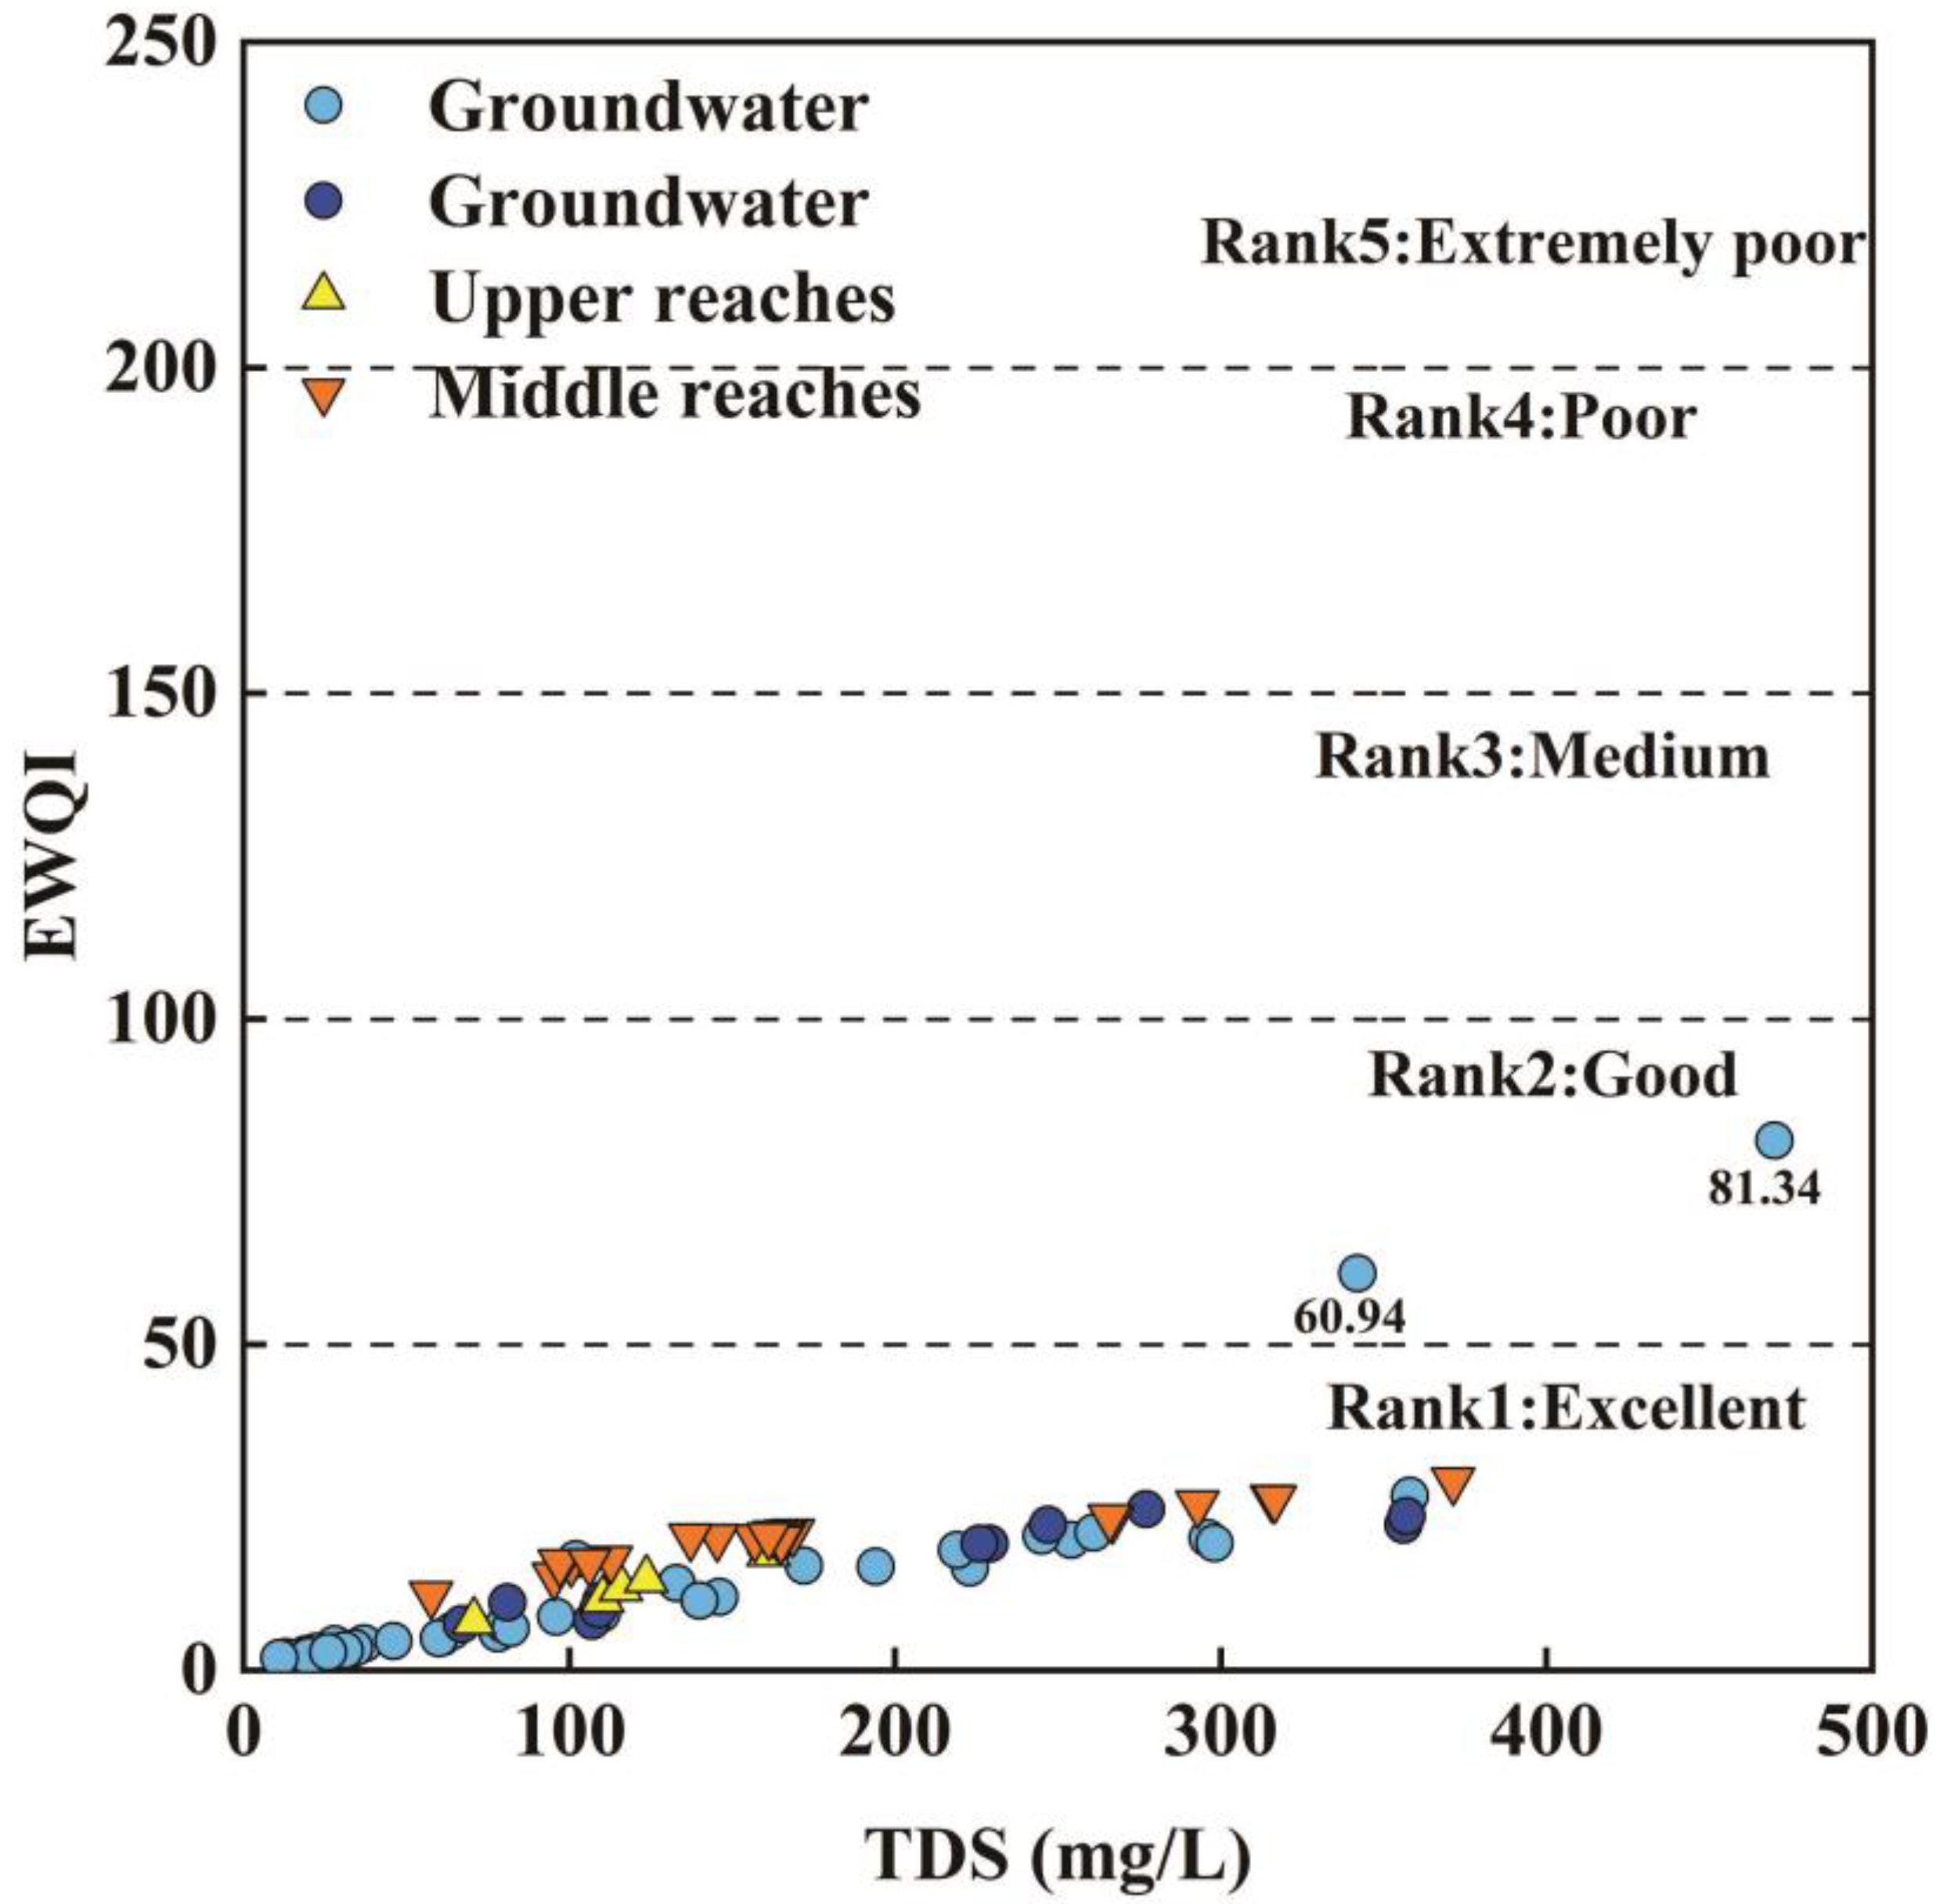
The EWQI values indicated most of the surface water and all groundwater samples belonged to excellent water of class 1. Only 2 surface water samples, having higher fluoride concentrations of 1.62 mg/L and 2.02 mg/L, were good water of class 2. Therefore, surface water and groundwater reach the standard of drinking purpose in the lower reaches of the Yarlung-Zangbo River.
(4)
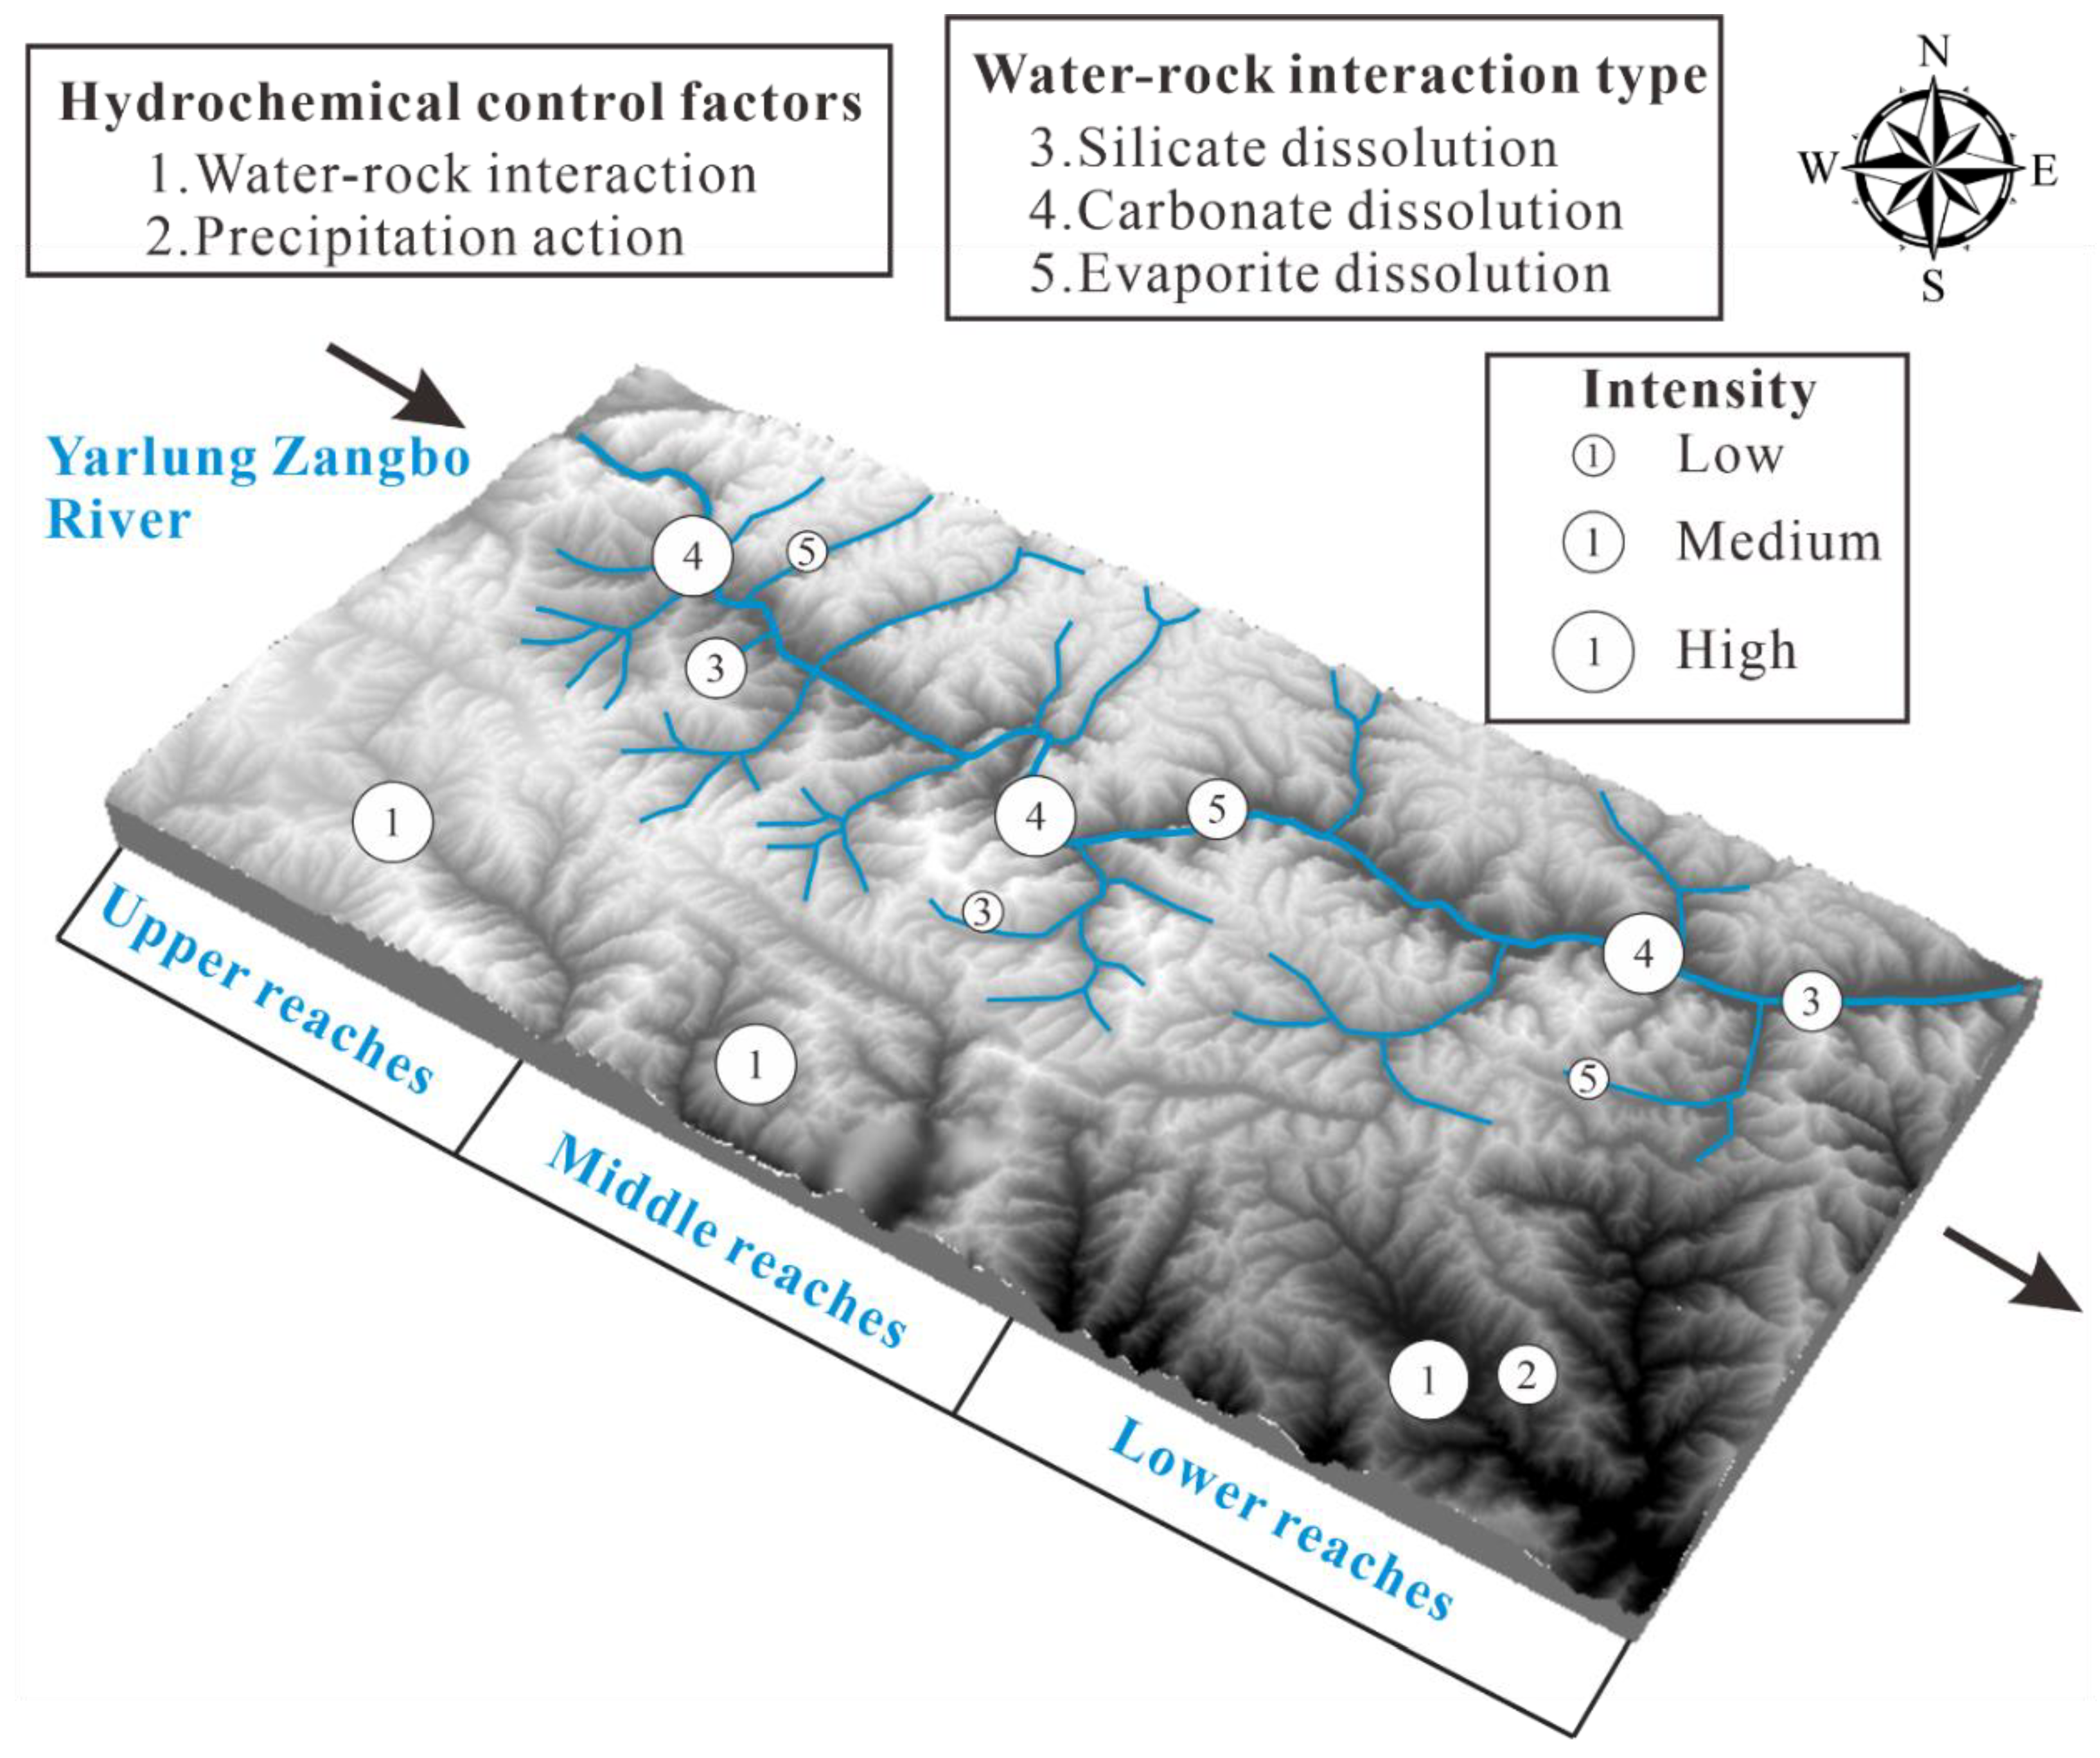
Hydrochemical process displayed a changing trend along the Yarlung-Zangbo River. Hydrochemical type was Ca-Na-HCO3-SO4 in the upper reaches of the Yarlung-Zangbo River, whose hydrochemical compositions were determined by silicate weathering and carbonate dissolution. Hydrochemical type was Ca-HCO3 and Ca-HCO3-SO4 in the middle reaches of the Yarlung-Zangbo River, and the main ions were derived from carbonate and evaporite dissolution. Hydrochemical type was Ca-HCO3 and Ca-SO4-HCO3 in the lower reaches of the Yarlung-Zangbo River, and the main ions were derived from carbonate and evaporite dissolution. Therefore, the Yarlung-Zangbo River is controlled by the dissolution of carbonate rocks and local silicate weather and evaporate dissolution. In this study, a hydrochemical-type transition of Ca-Na-HCO3-SO4 → Ca-HCO3 and Ca-HCO3-SO4 → Ca-HCO3 and Ca-SO4-HCO3 has been identified along the Yarlung-Zangbo River. The different hydrochemical types would be produced by relevant water-rock interactions. The achievements would be helpful for understanding the hydrochemical processes in the catchment of the Yarlung-Zangbo River, providing a vital reference for water resource management.

Author Contributions

Data curation, X.Y. (Xingcheng Yuan) and H.H.; formal analysis, Z.G. and T.L.; funding acquisition, X.Y. (Xiao Yu); investigation, X.Y. (Xiao Yu), Y.Z., H.C. and T.L.; methodology, H.G.; software, X.Y. (Xingcheng Yuan) and H.G.; supervision, Y.Z.; writing—original draft, X.Y. (Xiao Yu) and X.Y. (Xingcheng Yuan); writing—review and editing, H.G. and Y.Z. All authors have read and agreed to the published version of the manuscript.

Funding

This research was funded by National Natural Science Foundation of China grant number 42072313. And The APC was funded by Research Center of Applied Geology of China Geological Survey.

Data Availability Statement

The data presented in this study are available on request from the corresponding author.

Acknowledgments

We thank two anonymous reviewers for their constructive suggestions which improved our manuscript.

Conflicts of Interest

The authors declare that they have no known competing financial interests or personal relationships that could have appeared to influence the work reported in this paper.

References

  1. Li, C.; Gao, X.; Li, S.; Bundschuh, J. A review of the distribution, sources, genesis, and environmental concerns of salinity in groundwater. Environ. Sci. Pollut. Res. 2020, 27, 41157–41174. [Google Scholar] [CrossRef] [PubMed]
  2. Li, P. To Make the Water Safer. Expo. Health 2020, 12, 337–342. [Google Scholar] [CrossRef] [PubMed]
  3. Uddin, M.G.; Nash, S.; Olbert, A.I. A review of water quality index models and their use for assessing surface water quality. Ecol. Indic. 2021, 122, 107218. [Google Scholar] [CrossRef]
  4. Elshall, A.S.; Arik, A.D.; El-Kadi, A.I.; Pierce, S.; Ye, M.; Burnett, K.M.; Wada, C.A.; Bremer, L.L.; Chun, G. Groundwater sustainability: A review of the interactions between science and policy. Environ. Res. Lett. 2020, 15, 093004. [Google Scholar] [CrossRef]
  5. Medici, G.; Langman, J.B. Pathways and Estimate of Aquifer Recharge in a Flood Basalt Terrain; A Review from the South Fork Palouse River Basin (Columbia River Plateau, USA). Sustainability 2022, 14, 11349. [Google Scholar] [CrossRef]
  6. Qu, S.; Duan, L.; Shi, Z.; Liang, X.; Lv, S.; Wang, G.; Liu, T.; Yu, R. Hydrochemical assessments and driving forces of groundwater quality and potential health risks of sulfate in a coalfield, northern Ordos Basin, China. Sci. Total Environ. 2022, 835, 155519. [Google Scholar] [CrossRef]
  7. Subba Rao, N.; Dinakar, A.; Sun, L. Estimation of groundwater pollution levels and specific ionic sources in the groundwater, using a comprehensive approach of geochemical ratios, pollution index of groundwater, unmix model and land use/land cover—A case study. J. Contam. Hydrol. 2022, 248, 103990. [Google Scholar] [CrossRef]
  8. Zhang, Y.; Hou, K.; Qian, H.; Gao, Y.; Fang, Y.; Xiao, S.; Tang, S.; Zhang, Q.; Qu, W.; Ren, W. Characterization of soil salinization and its driving factors in a typical irrigation area of Northwest China. Sci. Total Environ. 2022, 837, 155808. [Google Scholar] [CrossRef]
  9. Mao, G.; Zhao, Y.; Zhang, F.; Liu, J.; Huang, X. Spatiotemporal variability of heavy metals and identification of potential source tracers in the surface water of the Lhasa River basin. Environ. Sci. Pollut. Res. 2019, 26, 7442–7452. [Google Scholar] [CrossRef]
  10. Li, Z.; Liu, J.; Chen, H.; Li, Q.; Yu, C.; Huang, X.; Guo, H. Water environment in the Tibetan Plateau: Heavy metal distribution analysis of surface sediments in the Yarlung Tsangpo River Basin. Environ. Geochem. Health 2020, 42, 2451–2469. [Google Scholar] [CrossRef]
  11. Tan, H.; Chen, X.; Shi, D.; Rao, W.; Liu, J.; Liu, J.; Eastoe, C.J.; Wang, J. Base flow in the Yarlungzangbo River, Tibet, maintained by the isotopically—depleted precipitation and groundwater discharge. Sci. Total Environ. 2021, 759, 143510. [Google Scholar] [CrossRef]
  12. Shi, D.; Tan, H.; Chen, X.; Rao, W.; Basang, R. Uncovering the mechanisms of seasonal river–groundwater circulation using isotopes and water chemistry in the middle reaches of the Yarlungzangbo River, Tibet. J. Hydrol. 2021, 603, 127010. [Google Scholar] [CrossRef]
  13. Cao, H.-W.; Pei, Q.-M.; Santosh, M.; Li, G.-M.; Zhang, L.-K.; Zhang, X.-F.; Zhang, Y.-H.; Zou, H.; Dai, Z.-W.; Lin, B.; et al. Himalayan leucogranites: A review of geochemical and isotopic characteristics, timing of formation, genesis, and rare metal mineralization. Earth. Sci. Rev. 2022, 234, 104229. [Google Scholar] [CrossRef]
  14. Zhang, Y.-h.; Cao, H.-w.; Hollis, S.P.; Tang, L.; Xu, M.; Jiang, J.-s.; Gao, S.-b.; Wang, Y.-s. Geochronology, geochemistry and Sr-Nd-Pb-Hf isotopes of the Early Paleogene gabbro and granite from Central Lhasa, southern Tibet: Petrogenesis and tectonic implications. Int. Geol. Rev. 2019, 61, 868–894. [Google Scholar] [CrossRef]
  15. Zhang, Y.-H.; Yao, R.-W.; Wang, Y.; Duo, J.; Cao, H.-W. Zircon U–Pb and sericite Ar–Ar geochronology, geochemistry and S–Pb–Hf isotopes of the Zebuxia Pb–Zn deposit, Tibet, southwestern China. Ore. Geol. Rev. 2022, 148, 104999. [Google Scholar] [CrossRef]
  16. Yan, J.; Chen, J.; Zhang, W. Impact of land use and cover on shallow groundwater quality in Songyuan city, China: A multivariate statistical analysis. Environ. Pollut. 2022, 307, 119532. [Google Scholar] [CrossRef]
  17. Gaillardet, J.; Dupré, B.; Louvat, P.; Allègre, C.J. Global silicate weathering and CO2 consumption rates deduced from the chemistry of large rivers. Chem. Geol. 1999, 159, 3–30. [Google Scholar] [CrossRef]
  18. Yan, Y.P.; Niu, F.X.; Liu, J.; Liu, X.T.; Li, Y.; Peng, H.; Yan, D.H.; Xiao, S.B. Hydrochemical characteristics and sources of the upper Yarlung Zangbo River in summer. China Environ. Sci. 2022, 42, 815–825, (In Chinese and English Abstract). [Google Scholar]
  19. Chen, W. Hydrochemical Characteristics in the Upper Reaches of the Yarlung Zangbo River in Summer. Master’s Thesis, China Three Gorges University, Yichang, China, 2021. (In Chinese and English Abstract). [Google Scholar]
  20. Liu, J.; Li, Y.; Gao, Z.; Wang, M.; Ma, Y.; Shi, M.; Zhang, H. Ionic composition characteristics and their controlling factors in the main stream of the Yarlung Zangbo River. J. Glaciol. Geocryol. 2019, 41, 697–708, (In Chinese and English Abstract). [Google Scholar]
  21. Li, Y.Z.; Gao, Z.J.; Liu, J.T.; Wang, M.; Han, C. Hydrogeochemical and isotopic characteristics of spring water in the Yarlung Zangbo River Basin, Qinghai-Tibet Plateau, Southwest China. J. Mt. Sci. 2021, 18, 2061–2078. [Google Scholar] [CrossRef]
  22. Duan, R.; Li, P.; Wang, L.; He, X.; Zhang, L. Hydrochemical characteristics, hydrochemical processes and recharge sources of the geothermal systems in Lanzhou City, northwestern China. Urban Clim. 2022, 43, 101152. [Google Scholar] [CrossRef]
  23. Li, P.; He, X.; Guo, W. Spatial groundwater quality and potential health risks due to nitrate ingestion through drinking water: A case study in Yan’an City on the Loess Plateau of northwest China. Hum. Ecol. Risk Assess. Int. J. 2019, 25, 11–31. [Google Scholar] [CrossRef]
  24. Zhang, L.; Li, P.; He, X. Interactions between surface water and groundwater in selected tributaries of the Wei River (China) revealed by hydrochemistry and stable isotopes. Hum. Ecol. Risk Assess. Int. J. 2021, 28, 79–99. [Google Scholar] [CrossRef]
  25. Seyedrahimi-Niaraq, M.; Mahdiyanfar, H.; Mokhtari, A.R. Integrating principal component analysis and U-statistics for mapping polluted areas in mining districts. J. Geochem. Explor. 2022, 234, 106924. [Google Scholar] [CrossRef]
  26. Zeinalzadeh, K.; Rezaei, E. Determining spatial and temporal changes of surface water quality using principal component analysis. J. Hydrol. Reg. Stud. 2017, 13, 1–10. [Google Scholar] [CrossRef]
  27. Zhang, Y.; Xu, M.; Li, X.; Qi, J.; Zhang, Q.; Guo, J.; Yu, L.; Zhao, R. Hydrochemical Characteristics and Multivariate Statistical Analysis of Natural Water System: A Case Study in Kangding County, Southwestern China. Water 2018, 10, 80. [Google Scholar] [CrossRef] [Green Version]
  28. Bigdeli, A.; Maghsoudi, A.; Ghezelbash, R. Application of self-organizing map (SOM) and K-means clustering algorithms for portraying geochemical anomaly patterns in Moalleman district, NE Iran. J. Geochem. Explor. 2022, 233, 106923. [Google Scholar] [CrossRef]
  29. Qu, S.; Shi, Z.; Liang, X.; Wang, G.; Han, J. Multiple factors control groundwater chemistry and quality of multi-layer groundwater system in Northwest China coalfield— Using self-organizing maps (SOM). J. Geochem. Explor. 2021, 227, 106795. [Google Scholar] [CrossRef]
  30. Yao, R.; Yan, Y.; Wei, C.; Luo, M.; Xiao, Y.; Zhang, Y. Hydrochemical Characteristics and Groundwater Quality Assessment Using an Integrated Approach of the PCA, SOM, and Fuzzy c-Means Clustering: A Case Study in the Northern Sichuan Basin. Front. Environ. Sci. 2022, 10, 648. [Google Scholar] [CrossRef]
  31. Yu, J.; Tian, Y.; Wang, X.; Zheng, C. Using machine learning to reveal spatiotemporal complexity and driving forces of water quality changes in Hong Kong marine water. J. Hydrol. 2021, 603, 126841. [Google Scholar] [CrossRef]
  32. Gibbs, R.J. Mechanisms controlling world water chemistry. Science 1970, 170, 1088–1090. [Google Scholar] [CrossRef]
  33. Li, C.; Gao, X.; Liu, Y.; Wang, Y. Impact of anthropogenic activities on the enrichment of fluoride and salinity in groundwater in the Yuncheng Basin constrained by Cl/Br ratio, δ18O, δ2H, δ13C and δ7Li isotopes. J. Hydrol. 2019, 579, 124211. [Google Scholar] [CrossRef]
  34. Subba Rao, N.; Sunitha, B.; Sun, L.; Deepthi Spandana, B.; Chaudhary, M. Mechanisms controlling groundwater chemistry and assessment of potential health risk: A case study from South India. Geochemistry 2020, 80, 125568. [Google Scholar] [CrossRef]
  35. Gao, X.; Li, X.; Wang, W.; Li, C. Human Activity and Hydrogeochemical Processes Relating to Groundwater Quality Degradation in the Yuncheng Basin, Northern China. Int. J. Environ. Res. Public Health 2020, 17, 867. [Google Scholar] [CrossRef] [PubMed] [Green Version]
  36. Xiao, Y.; Hao, Q.; Zhang, Y.; Zhu, Y.; Yin, S.; Qin, L.; Li, X. Investigating sources, driving forces and potential health risks of nitrate and fluoride in groundwater of a typical alluvial fan plain. Sci. Total Environ. 2022, 802, 149909. [Google Scholar] [CrossRef]
  37. Xiao, Y.; Liu, K.; Hao, Q.; Xiao, D.; Zhu, Y.; Yin, S.; Zhang, Y. Hydrogeochemical insights into the signatures, genesis and sustainable perspective of nitrate enriched groundwater in the piedmont of Hutuo watershed, China. Catena 2022, 212, 106020. [Google Scholar] [CrossRef]
  38. Shoedarto, R.M.; Tada, Y.; Kashiwaya, K.; Koike, K.; Iskandar, I.; Malik, D.; Bratakusuma, B. Investigation of meteoric water and parent fluid mixing in a two-phase geothermal reservoir system using strontium isotope analysis: A case study from Southern Bandung, West Java, Indonesia. Geothermics 2021, 94, 102096. [Google Scholar] [CrossRef]
  39. Temizel, E.H.; Gültekin, F.; Ersoy, A.F.; Gülbay, R.K. Multi-isotopic (O, H, C, S, Sr, B, Li) characterization of waters in a low-enthalpy geothermal system in Havza (Samsun), Turkey. Geothermics 2021, 97, 102240. [Google Scholar] [CrossRef]
  40. Yan, Y.; Zhou, X.; Liao, L.; Tian, J.; Li, Y.; Shi, Z.; Liu, F.; Ouyang, S. Hydrogeochemical Characteristic of Geothermal Water and Precursory Anomalies along the Xianshuihe Fault Zone, Southwestern China. Water 2022, 14, 550. [Google Scholar] [CrossRef]
  41. Cherchali, M.E.H.; Liégeois, J.P.; Mesbah, M.; Daas, N.; Amrous, K.; Ouarezki, S.A. Central Hoggar groundwaters and the role of shear zones: 87Sr/86Sr, δ18O, δ2H and 14C isotopes, geochemistry and water-rock interactions. Appl. Geochem. 2021, 137, 105179. [Google Scholar] [CrossRef]
  42. Fantong, W.Y.; Kamtchueng, B.T.; Ishizaki, Y.; Fru, E.C.; Fantong, E.B.; Wirmvem, M.J.; Aka, F.T.; Nlend, B.; Harman, D.; Ueda, A.; et al. Major ions, δ18O, δ13C and 87Sr/86Sr compositions of water and precipitates from springs along the Cameroon volcanic line (Cameroon, west Africa): Implications for provenance and volcanic hazards. J. Afr. Earth Sci. 2019, 150, 12–22. [Google Scholar] [CrossRef]
  43. Song, H.W.; Meng, Y.C.; Jiang, F.T.; Li, L.X.; Li, Y.Q.; Du, C.H. Isotope characteristics of surface water and groundwater in the middle reaches of Yarlung Zangbo river and their indicators. J. Arid Land Resour. Environ. 2021, 35, 122–128, (In Chinese and English Abstract). [Google Scholar]
  44. Craig, H. Isotopic variations in meteoric waters. Science 1961, 133, 1702–1703. [Google Scholar] [CrossRef]
  45. Adimalla, N. Application of the Entropy Weighted Water Quality Index (EWQI) and the Pollution Index of Groundwater (PIG) to Assess Groundwater Quality for Drinking Purposes: A Case Study in a Rural Area of Telangana State, India. Arch. Environ. Contam. Toxicol. 2021, 80, 31–40. [Google Scholar] [CrossRef]
  46. Amiri, V.; Rezaei, M.; Sohrabi, N. Groundwater quality assessment using entropy weighted water quality index (EWQI) in Lenjanat, Iran. Environ. Earth Sci. 2014, 72, 3479–3490. [Google Scholar] [CrossRef]
  47. Unigwe, C.O.; Egbueri, J.C. Drinking water quality assessment based on statistical analysis and three water quality indices (MWQI, IWQI and EWQI): A case study. Environ. Dev. Sustain. 2022, 1–22. [Google Scholar] [CrossRef]
  48. Zhang, Y.; Dai, Y.; Wang, Y.; Huang, X.; Xiao, Y.; Pei, Q. Hydrochemistry, quality and potential health risk appraisal of nitrate enriched groundwater in the Nanchong area, southwestern China. Sci. Total Environ. 2021, 784, 147186. [Google Scholar] [CrossRef]
Figure 1. (a) Location of the Yarlung Zangbo River in China; (b) spatial characteristic of the Yarlung Zangbo River; (c) distribution of surface water and groundwater sampling points in the lower reaches of the Yarlung Zangbo River.
Water 14 03906 g001
Figure 2. Box diagram of hydrochemical parameters of surface water and groundwater in the lower reaches of Yarlung Zangbo River. Data are from Table 1.
Water 14 03906 g002
Figure 3. TDS and TH scatter diagram (a) and Piper trilinear diagram (b) of surface water and groundwater in the Lower reaches of Yarlung Zangbo River. Data are from Table 1 and Table 2.
Water 14 03906 g003
Figure 4. Pearson correlation coefficient matrix for each ion content of surface water and groundwater in the Lower reaches of Yarlung Zangbo River. Data are from Table 1.
Water 14 03906 g004
Figure 5. Principal component 3D spatial map of surface water and groundwater in the middle and lower reaches of Yarlung Zangbo River. Data are from Table 1.
Water 14 03906 g005
Figure 6. Characteristic map of main indicators of surface water and groundwater in the lower reaches of Yarlung Zangbo River mapped to SOM. Data are from Table 1.
Water 14 03906 g006
Figure 7. (a,b) Gibbs diagram of the water resource in the Yarlung-Zangbo River. Data are from Table 1 and Table 2.
Water 14 03906 g007
Figure 8. Ratio diagram of Ca2+/Na+ − Mg2+/Na+ (a) and Ca2+/Na+ − HCO3/Na+ (b). Data are from Table 1 and Table 2.
Water 14 03906 g008
Figure 9. Molar ratio diagram of ion combination. Data were from Table 1 and Table 2. (a) (K+ + Na+)/Cl; (b) (Ca2+ + Mg2+)/(HCO3 + SO42−); (c) Ca2+/HCO3; (d) (Ca2+ + Mg2+)/HCO3; (e) Ca2+/SO42−; (f) Ca2+/SO42−.
Water 14 03906 g009
Figure 10. Ion combination ratio diagram of ion exchange. Data are from Table 1 and Table 2.
Water 14 03906 g010
Figure 11. Relationship between saturation index (SI) of different minerals in surface water and groundwater and total dissolved solids (TDS). (a) SI (calcite); (b) SI (dolomite); (c) SI (gypsum), and (d) SI (halite). Data are from Table 1 and Table 2.
Water 14 03906 g011
Figure 12. 87Sr/86Sr vs. Sr (a) and87Sr/86Sr vs. 1/Sr (b) of surface water and groundwater samples in the lower reaches of the Yarlung Zangbo River. Data were from Table 1 and Table 2.
Water 14 03906 g012
Figure 13. 87Sr/86Sr vs. Mg2+/Ca2+ (a) and Mg2+/Ca2+ vs. Sr2+/Ca2+ (b) of surface water and groundwater samples in the lower reaches of the Yarlung Zangbo River. Data are from Table 1.
Water 14 03906 g013
Figure 14. Relationship between surface water and groundwater δD and δ18O in the middle and lower reaches of the Yarlung Zangbo River (a) and comparison of surface water lines in the middle and lower reaches, middle and upper reaches of the Yarlung Zangbo River (b). Data are from Table 1 and Table 2.
Water 14 03906 g014
Figure 15. Relationship between surface water and groundwater EWQI and TDS.
Water 14 03906 g015
Figure 16. Schematic diagram of hydrochemical control factors in the middle and lower reaches, middle reaches and upper reaches of Yarlung Zangbo River.
Water 14 03906 g016
Table 1. Statistical analysis of chemical parameters of surface water and groundwater in the lower reaches of Yarlung Zangbo River.
ParameterspHTHTDSK+Na+Ca2+Mg2+ClSO42−HCO3NO3FSr2+87Sr/86Srδ18OδD
Max9.20343.00470.001.246.1682.7044.902.87409.0092.100.362.020.720.721−14.21−97.12
Min7.209.0011.000.060.244.000.380.000.012.500.000.000.020.706−17.55−131.82
Mean8.3592.77118.420.481.6228.287.310.3967.5243.080.120.140.170.710−15.59−112.43
SD0.4383.86113.720.251.5222.319.660.4988.3123.480.080.420.20---
CV0.050.900.960.520.940.791.321.281.310.540.692.911.18---
Skewness−0.941.001.221.031.540.921.772.931.770.460.683.891.35---
Kurtosis1.090.230.831.161.45−0.243.8013.873.77−0.680.0214.800.49---
Max8.90259.00357.003.0728.2082.1020.806.74213.00238.004.190.190.710.716−14.73−108.65
Min7.9054.0067.000.191.0221.100.380.006.4449.700.000.000.040.707−17.33−132.04
Mean8.47158.18196.911.466.2751.919.351.5980.07117.190.680.090.270.711−16.21−122.53
SD0.3175.54102.431.117.1822.607.341.8672.7649.981.140.070.21---
CV0.040.480.520.761.140.440.781.160.910.431.670.740.79---
Skewness−0.61−0.220.300.202.91−0.040.292.250.721.203.00−0.100.98---
Kurtosis−0.69−1.81−1.42−1.939.10−1.95−1.395.14−1.201.829.42−1.64−0.14---
Note: I = surface water; II = groundwater; SD = standard deviation; CV(%) = coefficient of variation; Units of TH, TDS, K+, Na+, Ca2+, Mg2+, Cl, SO42−, HCO3, NO3, F, Sr2+ are mg/L; units of δ18O, δD are ‰VSMOW, —means no calculation.
Table 2. Statistics of major ions in the whole basin of Yarlung Tsangpo River (mg/L).
RiverpHTDSK+Na+Ca2+Mg2+ClSO42−HCO3NO3F
Global River 8.00120.002.306.3015.004.107.8011.2058.401.00-
Upper reaches 7.77102.501.0817.6720.244.373.2520.6070.480.17-
Middle reaches8.05304.821.298.8641.5317.976.3598.17107.981.80-
Lower reaches (this study)8.35118.420.481.6228.287.310.3967.5243.080.120.14
Note: Global River is after [17]. Upper reaches is after [18,19]. Middle reaches is after [11,12,20,21].—means data absence.
Table 3. Results of principal component analysis for each indicator of surface water and groundwater in the lower reaches of Yarlung Zangbo River.
IndexPC1PC2PC3PC4
TH0.981−0.0990.080−0.054
TDS0.975−0.1390.055−0.023
Ca2+0.974−0.0020.084−0.096
Mg2+0.894−0.3800.0550.082
SO42−0.889−0.420−0.0300.007
Sr2+0.790−0.0260.095−0.449
HCO30.5960.6870.2750.001
Na+0.5120.6610.1330.165
K+0.0720.6570.4470.484
Cl0.3940.656−0.5920.070
NO30.3560.462−0.770−0.097
F0.528−0.394−0.0540.542
pH−0.0970.4330.411−0.466
Eigenvalue6.2702.6781.4381.008
Variance/%48.22920.60011.0657.754
Cumulative % of variance48.22968.82979.89487.648
Table 4. Comparison of hydrochemical characteristics between the lower reaches and the middle and upper reaches of the Yarlung Zangbo River.
ReachUpper ReachesMiddle ReachesLower Reaches
Geographical positionJiema yangzongqu—Lizi sectionShigatse—Gyaca sectionGyaca—Millin section
Hydrochemical typeCa-Na-HCO3-SO4Ca-HCO3 and Ca-HCO3-SO4Ca-HCO3 and Ca-SO4-HCO3
Controlling factorsWater–rock interactionWater–rock interactionWater–rock interaction, Atmospheric precipitation
Ion sourceSilicate rock, Carbonate rock, Evaporite rockCarbonate rock, Evaporite rock, Silicate rockCarbonate rock, Silicate rock, Evaporite rock
Influence of human factorsVery lowVery lowLow
Publisher’s Note: MDPI stays neutral with regard to jurisdictional claims in published maps and institutional affiliations.

