
Spatial and Temporal Variation in Reference Evapotranspiration and Its Climatic Drivers in Northeast China

1
Faculty of Geographical Science, Beijing Normal University, Beijing 100875, China
2
State Key Laboratory of Earth Surface Process and Resource Ecology, Beijing Normal University, Beijing 100875, China
*
Author to whom correspondence should be addressed.
Water 2022, 14(23), 3911; https://doi.org/10.3390/w14233911
Submission received: 9 November 2022
/
Revised: 26 November 2022
/
Accepted: 29 November 2022
/
Published: 1 December 2022
(This article belongs to the Section Hydrology)
Abstract
:Reference evapotranspiration (ET0) is an important component of the global water cycle, and its long-term change directly influences the regional water supply and demand balance. Under the background of global change, investigating spatiotemporal trends in ET0 and its response to climate change is of great importance for the conservation and rational utilization of water resources. Based on daily climate data from 91 meteorological stations during 1960–2017 in Northeast China, this study calculated ET0 using the Penman-Monteith method and analyzed its spatiotemporal change trends and primary driving factors. The results show the following: (1) During 1960–2017, the annual ET0 in Northeast China showed a nonsignificant upward trend at a rate of 1.45 mm/10a. A mutation point of ET0 was detected in 1993. From 1960 to 1993, ET0 experienced a significant decrease (p < 0.1), while annual air temperature showed a significant upward trend (p < 0.01), which indicated the appearance of an evaporation paradox. This was because the remarkable drop in wind speed and sunshine duration played a great role in the reduction of ET0. From 1994 to 2017, the evaporation paradox disappeared. (2) ET0 trend in Northeast China was significantly and positively related to altitude. In the lower altitude regions (<500 m), ET0 generally decreased, while in the higher altitude areas (>500 m), ET0 displayed an upward trend. (3) Based on the results of multiple regression analysis, relative humidity was the primary driving factor for ET0 trends in Northeast China during 1960–2017. At diverse altitudes, the primary climatic factors influencing ET0 were different. In high-altitude areas (>500 m), the change in ET0 was mainly influenced by relative humidity, while wind speed was the primary driving factor at low altitudes (<500 m).
1. Introduction
As a key process of the hydrological cycle, evaporation is closely related to the balance of surface water and energy and is an important indicator reflecting the impact of climate change on the hydrological cycle [1,2,3]. Although actual evaporation is more helpful for understanding complex ecohydrological processes, because of the lack of observed evaporation data, reference evapotranspiration (ET0) is often used to estimate the maximum potential evaporation capacity of the free water surface [4]. The global air temperature rose 0.83 °C from 1880 to 2012 due to human activities, and global warming has become an indisputable fact. As the air temperature becomes warmer, it is expected that ET0 would increase as well. However, many studies have shown that ET0 showed downward trends with global warming, which is known as the ‘evaporation paradox‘. In recent years, the ‘evaporation paradox’ phenomenon has been found in many regions around the world, such as Turkey [5], Iran [6], India [7], the United States [8], Australia [9], the Czech Republic [10], South Africa [11], and China [12]. The causes of the ‘evaporation paradox’ have been attributed to decreases in solar radiation or sunshine duration [6,13], vapor deficit pressure [7], and wind speed [14], which may have resulted in a decrease in ET0.
The changes in ET0 are controlled by associated climatic factors. In the context of global change, climatic factors have changed significantly in different regions, which may have had an important impact on the spatiotemporal trends of ET0. In recent years, the trends of regional ET0 and its determining factors have been widely studied by scholars [15,16,17,18,19,20,21,22,23,24]. Jerin et al. [17] pointed out that in Bangladesh, a decline in ET0 during 1980–2017 was due to declines in sunshine duration and wind speed. Pour et al. [18] revealed that the increase in minimum temperature was the main driving force for the increase in ET0 in peninsular Malaysia during 1975–2014. Al-Hasani et al. [19] pointed out that the annual ET0 in Iraq showed a significant upward trend during 1981–2021, which was dominated by an increased air temperature. Jhajharia et al. [20] reported an obvious decrease in annual ET0 over the Thar Desert in India during 1967–2005, and wind speed was the main driving factor. Liu et al. [21] showed that ET0 on the Qinghai–Tibet Plateau in China showed an upward trend during 1961–2017, and air temperature had the greatest impact on ET0 changes. Zhao et al. [22] found that sunshine duration and wind speed were the primary climatic factors affecting the change in ET0 in Southwest China during 1960–2013, resulting in a nonsignificant downward trend of ET0. Li et al. [23] showed that ET0 had a significant downward trend during 1960–1990 on the Loess Plateau in China, which was mainly affected by wind speed changes, while ET0 increased dramatically during 1991–2013, mainly affected by air temperature changes. Feng et al. [24] pointed out that ET0 showed a significant increasing trend during 1961–2010 in northern China, and it was more sensitive to the change in effective precipitation and daily mean temperature. Xing et al. [15] and Wang et al. [16] analyzed the ET0 trend in the whole of China, and the results showed that there were significant differences in the ET0 trend of different regions in China. According to the above studies, the changing trends of ET0 differ obviously in different regions because the changes in climatic factors in different regions have different degrees of impact on ET0, which finally makes ET0 show different trends. Therefore, it is essential to strengthening the research on the ET0 variation trend and its driving factors at the regional scale, which will be of great significance for the rational utilization of regional water resources.
Northeast China is a considerable commodity grain production base in China, which is vital to China’s food security [25]. As a sensitive area to climate change, the air temperature in Northeast China has shown a significant upward trend in recent decades [26]. The significant increase in air temperature in Northeast China will have an important influence on the change in ET0. Previous studies on ET0 in Northeast China have mostly focused on local areas, such as the Sanjiang Plain [27], Heilongjiang Province [28], the Taoer River basin [29], and northern Northeast China [30]. There have been few studies on the systematic analysis of ET0 in Northeast China as a complete geographic unit [31,32]. In addition, the influence of altitude on ET0 trends and whether the ‘evaporation paradox’ exists in Northeast China have not been clearly analyzed. Therefore, based on daily climatic factor data from 91 meteorological stations in Northeast China during 1960–2017, this paper used the Penman-Monteith method to calculate ET0 and analyzed the spatiotemporal variation trend of annual ET0 in Northeast China and its primary driving factors. The purpose is to answer the following questions: (1) Was there a significant ET0 trend in Northeast China? (2) Was there an ‘evaporation paradox’ phenomenon in Northeast China from 1960 to 2017? (3) Did altitude affect the variation trend of ET0, and did the primary climatic factors controlling ET0 changes tend to be consistent at different altitudes?
2. Materials and Methods
2.1. Study Area
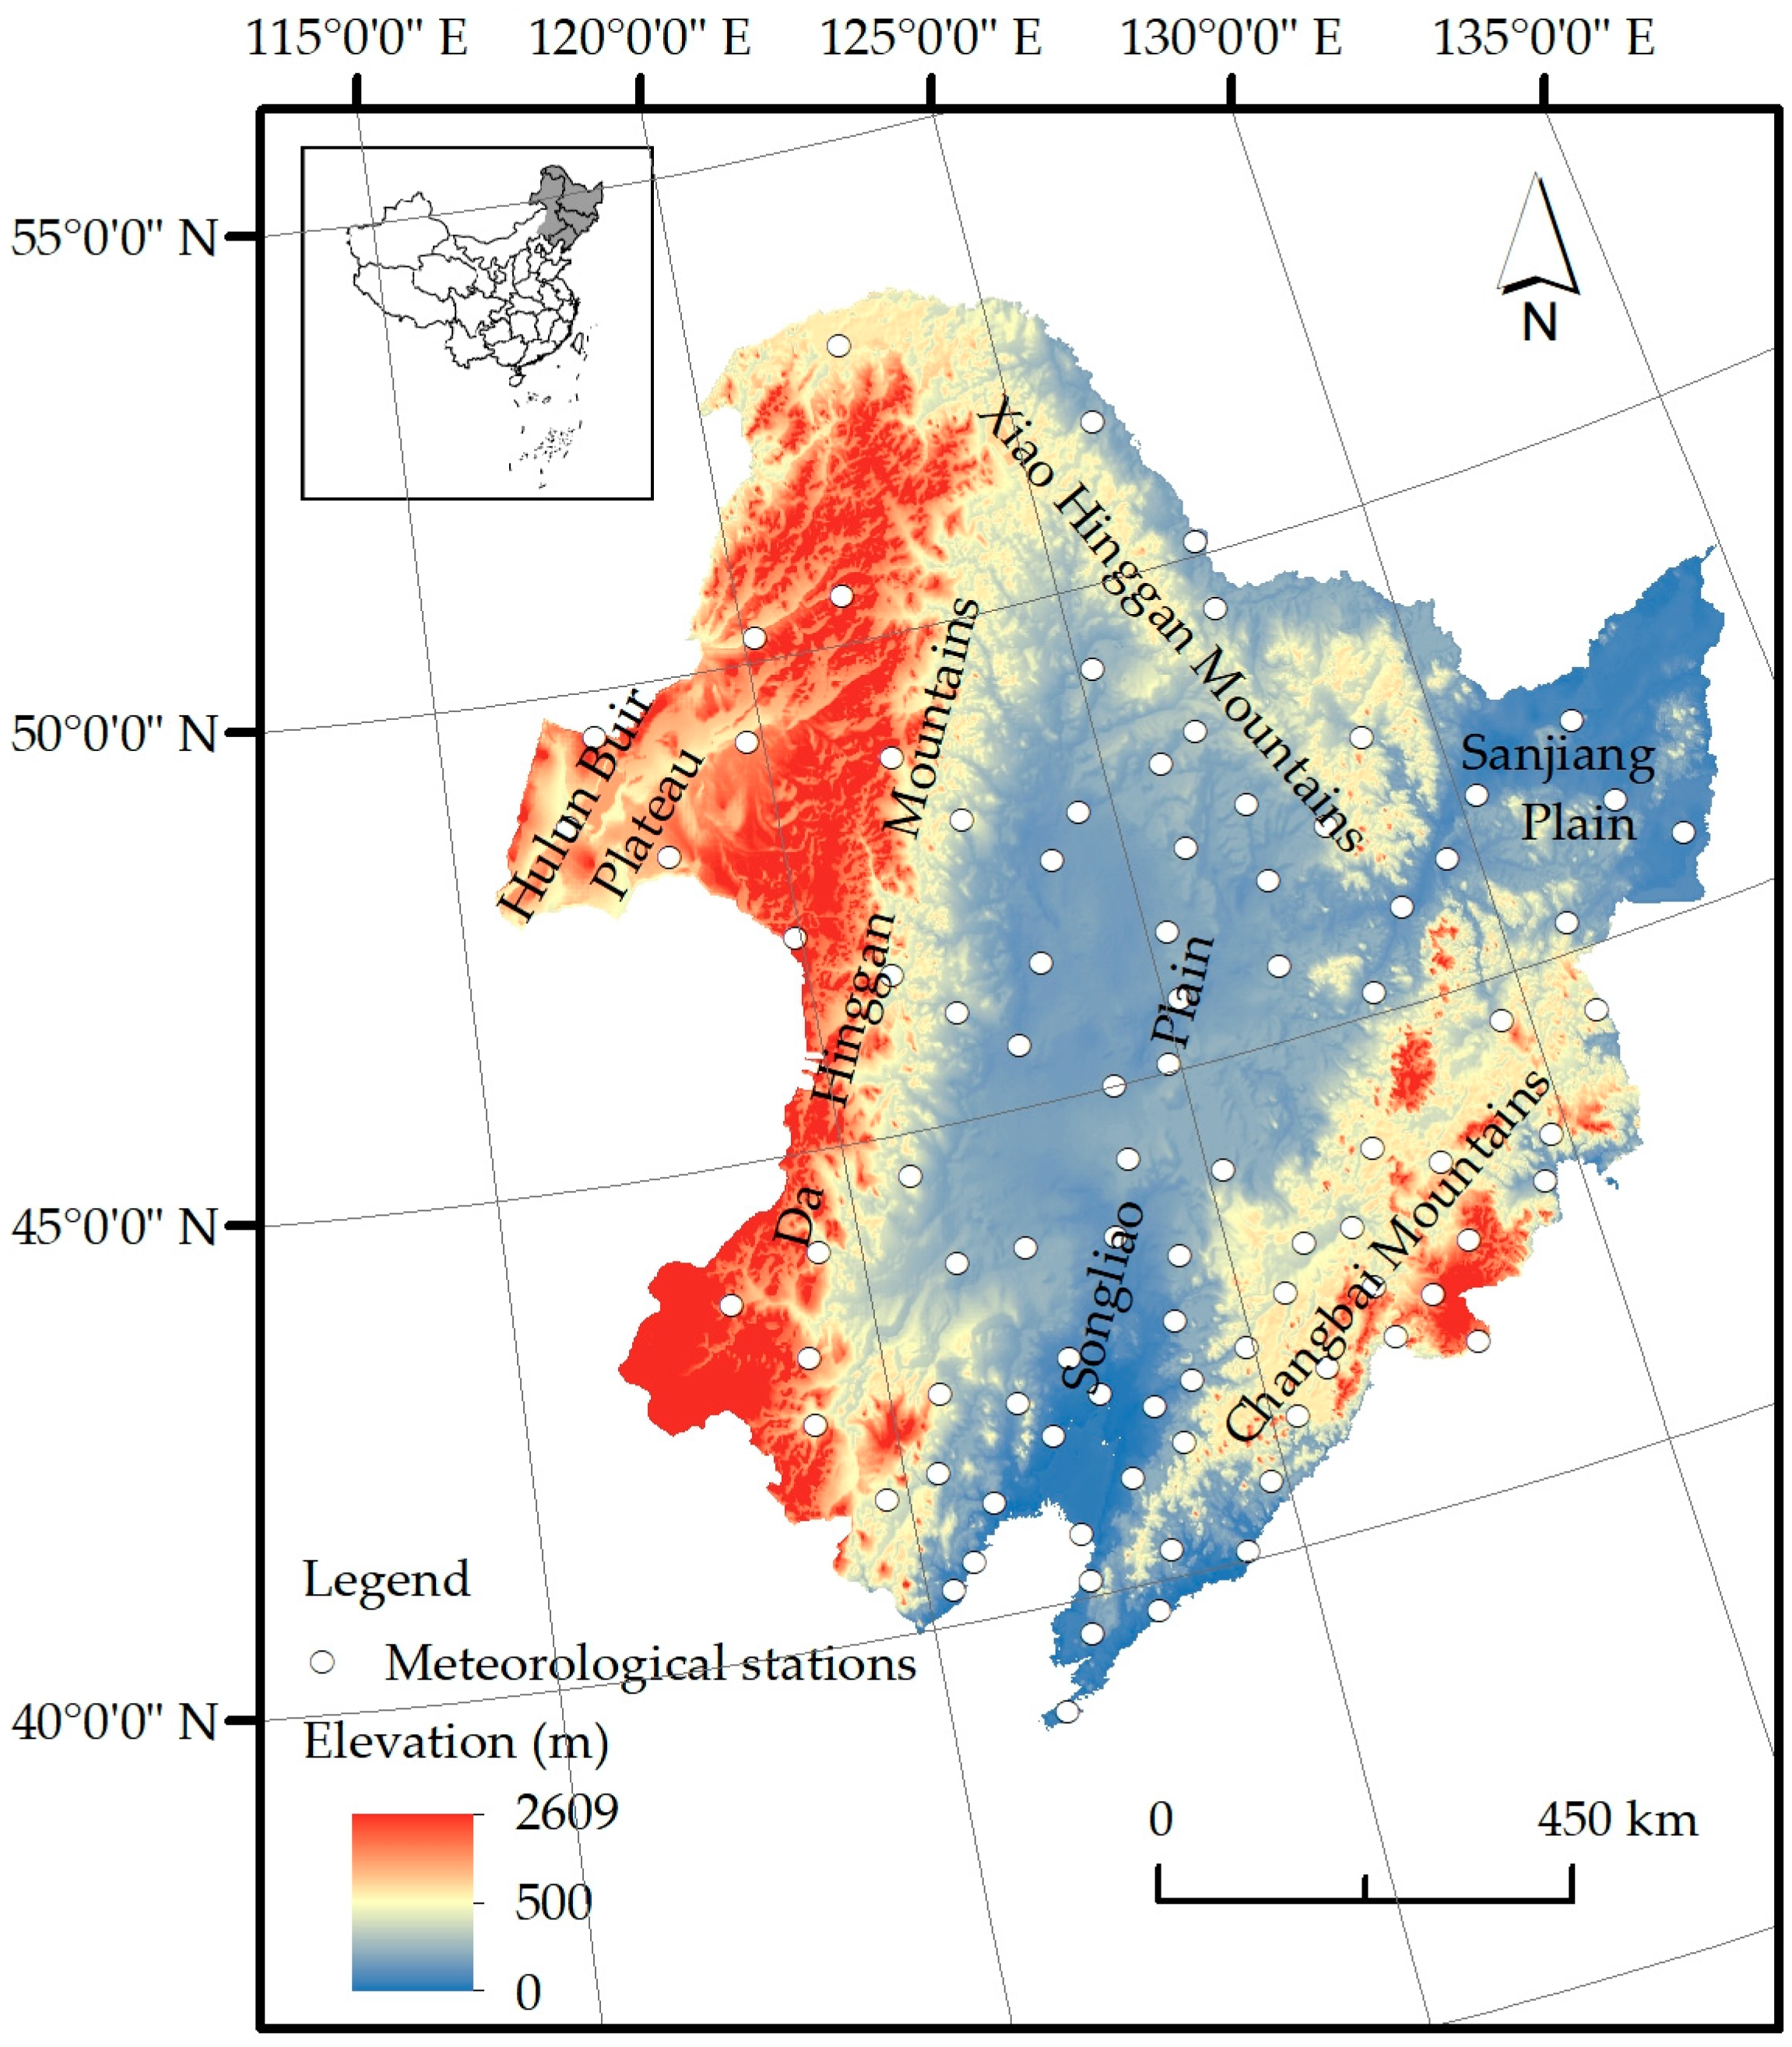
Northeast China is located at 115°05′–135°02′ E, and 38°40′ to 53°34′ N (Figure 1), with an area of 1.24 × 10⁶ km2. In administrative divisions, it includes Liaoning, Jilin, Heilongjiang, and Inner Mongolia (eastern parts) Provinces. Northeast China belongs to the temperate continental monsoon climate region. The mean annual temperature is approximately 5.6 °C, and the annual precipitation varies from 240 to 1000 mm. Most of the region is located in humid and semi-humid areas, and some areas in the west are located in semiarid areas. Its topography has large fluctuations in space. According to the physical geographical characteristics, the Northeast can be divided into six parts, namely, Songliao Plain, Sanjiang Plain, Da Hinggan Mountains, Xiao Hinggan Mountains, Changbai Mountains, and Hulun Buir Plateau [33].
2.2. Data Sources
Ninety-one meteorological stations were selected in Northeast China to calculate ET0. The climate data from 1960 to 2017, were obtained from the China Meteorological Administration (CMA), which includes air temperature (T, °C), sunshine duration (SD, h), wind speed at 10 m above the ground (WS m/s), precipitation (P, mm) and relative humidity (RH, %). Regarding the few missing data, we replaced them with data from a nearby site, which has the highest correlation coefficients.
2.3. Methods
2.3.1. Calculation of ET0
The Penman-Monteith (P–M) equation is the method recommended by FAO to calculate ET0. It is widely adopted by scholars in calculating ET0 due to its high calculation accuracy and applicability [34]. In this study, the P-M equation was applied to calculate daily ET0 and then summed to obtain annual values. The formula is defined as follows:
where refers to the reference evapotranspiration (mm/d); is the slope of vapor pressure curve (kPa/°C); the net radiation at crop surface is represented by (MJ/(m2·day)); denotes the soil heat flux density (MJ/(m2·day)); indicates the psychrometric constant (kPa/°C); the wind speed at a height of 2 m (WS) represented by (m/s); is the mean daily air temperature (°C); represents the saturated water vapor pressure difference (kPa).
was calculated based on wind speed at 10 m height, and the formula is defined as follows [35]:
where is the height of wind measurement (m) and is the corresponding wind speed (m/s).
The detailed description of variables in Formula (1) can be seen in Allen et al. (1998) [35].
2.3.2. Climate Tendency Rate
To represent the changing trend of climatic factors with time series, this paper adopted the climate tendency rate. This is achieved by simple linear regression, and the formula is defined as follows:
where represents the climatic variable, in this paper, that is, ET0, WS, RH, SD, and T; 10 × represents the tendency rate; is the time series and regression constant is . The values of and are calculated by the least square method. > 0 indicates that the climatic variable has an upward trend, and < 0 denotes a downward trend.
2.3.3. Mann-Kendall Test
The Mann-Kendall (M-K) test, as is a nonparametric method, which is a common and practical trend test method to detect whether the trend of climatic elements is significant, due to it does not require samples to follow a specific distribution. This paper used it to calculate the significance level of climatic factors over time. For time series X, the Mann–Kendall trend test is defined by statistical value S:
where and are the two sequential values at times and (1 < < < ), respectively; n is the length of the dataset; is a sign function. When ≥ 10, the statistic is considered to follow the approximately normal distribution with E() = 0, and the variance is calculated by the following formula:
where is the standardized test statistic. When value is positive, it represents an increasing trend, while a negative value represents a decreasing trend. If || ≥ , then the changing trend of the time series is significant. When || ≥ 1.65, 1.96, or 2.58, and the significance level reached 0.1, 0.05, or 0.01, respectively.
2.3.4. Cramer’s Test
Cramer’s test detects mutations by comparing the population mean of the whole period and the means of subsequences of the dataset. The accuracy can be improved by changing the length of the subsequence. The statistic is calculated by:
is the mean value of years, and is the standard deviation of the corresponding time period; is the length of the selected sample sequence, and the mean of -year is represented by . Finally, Cramer’s test method has been widely used in the abrupt change detection of hydrological and climatic series [36,37].
2.3.5. Calculation for Contributing Rate
Contribution rate analysis can quantitatively describe the contribution of climatic variables to the ET0 change by taking the relative change degree of climatic factors into account, which makes the research on the influence mechanism of climatic factors on ET0 more reasonable [37,38,39]. In this study, multiple regression analysis was used to evaluate the contribution of climatic factors to ET0 variation. Data series of climatic factors are standardized by dividing the standard deviation to avoid high values of orders of magnitude affecting the average series. The relative contribution of an independent is defined as:
where is the dependent variable; , , and are the standardized climatic variables added to the model; and , , and are the standard regression coefficients (SRC) for the meteorological variables, respectively. || directly reflects the influence degree of the independent variable on the dependent variable, and a positive or negative value represents the direction of influence on the dependent variable [40]. is the relative contribution rate, and , , , and .
3. Results
3.1. Temporal Variation in ET0 and Climatic Variables
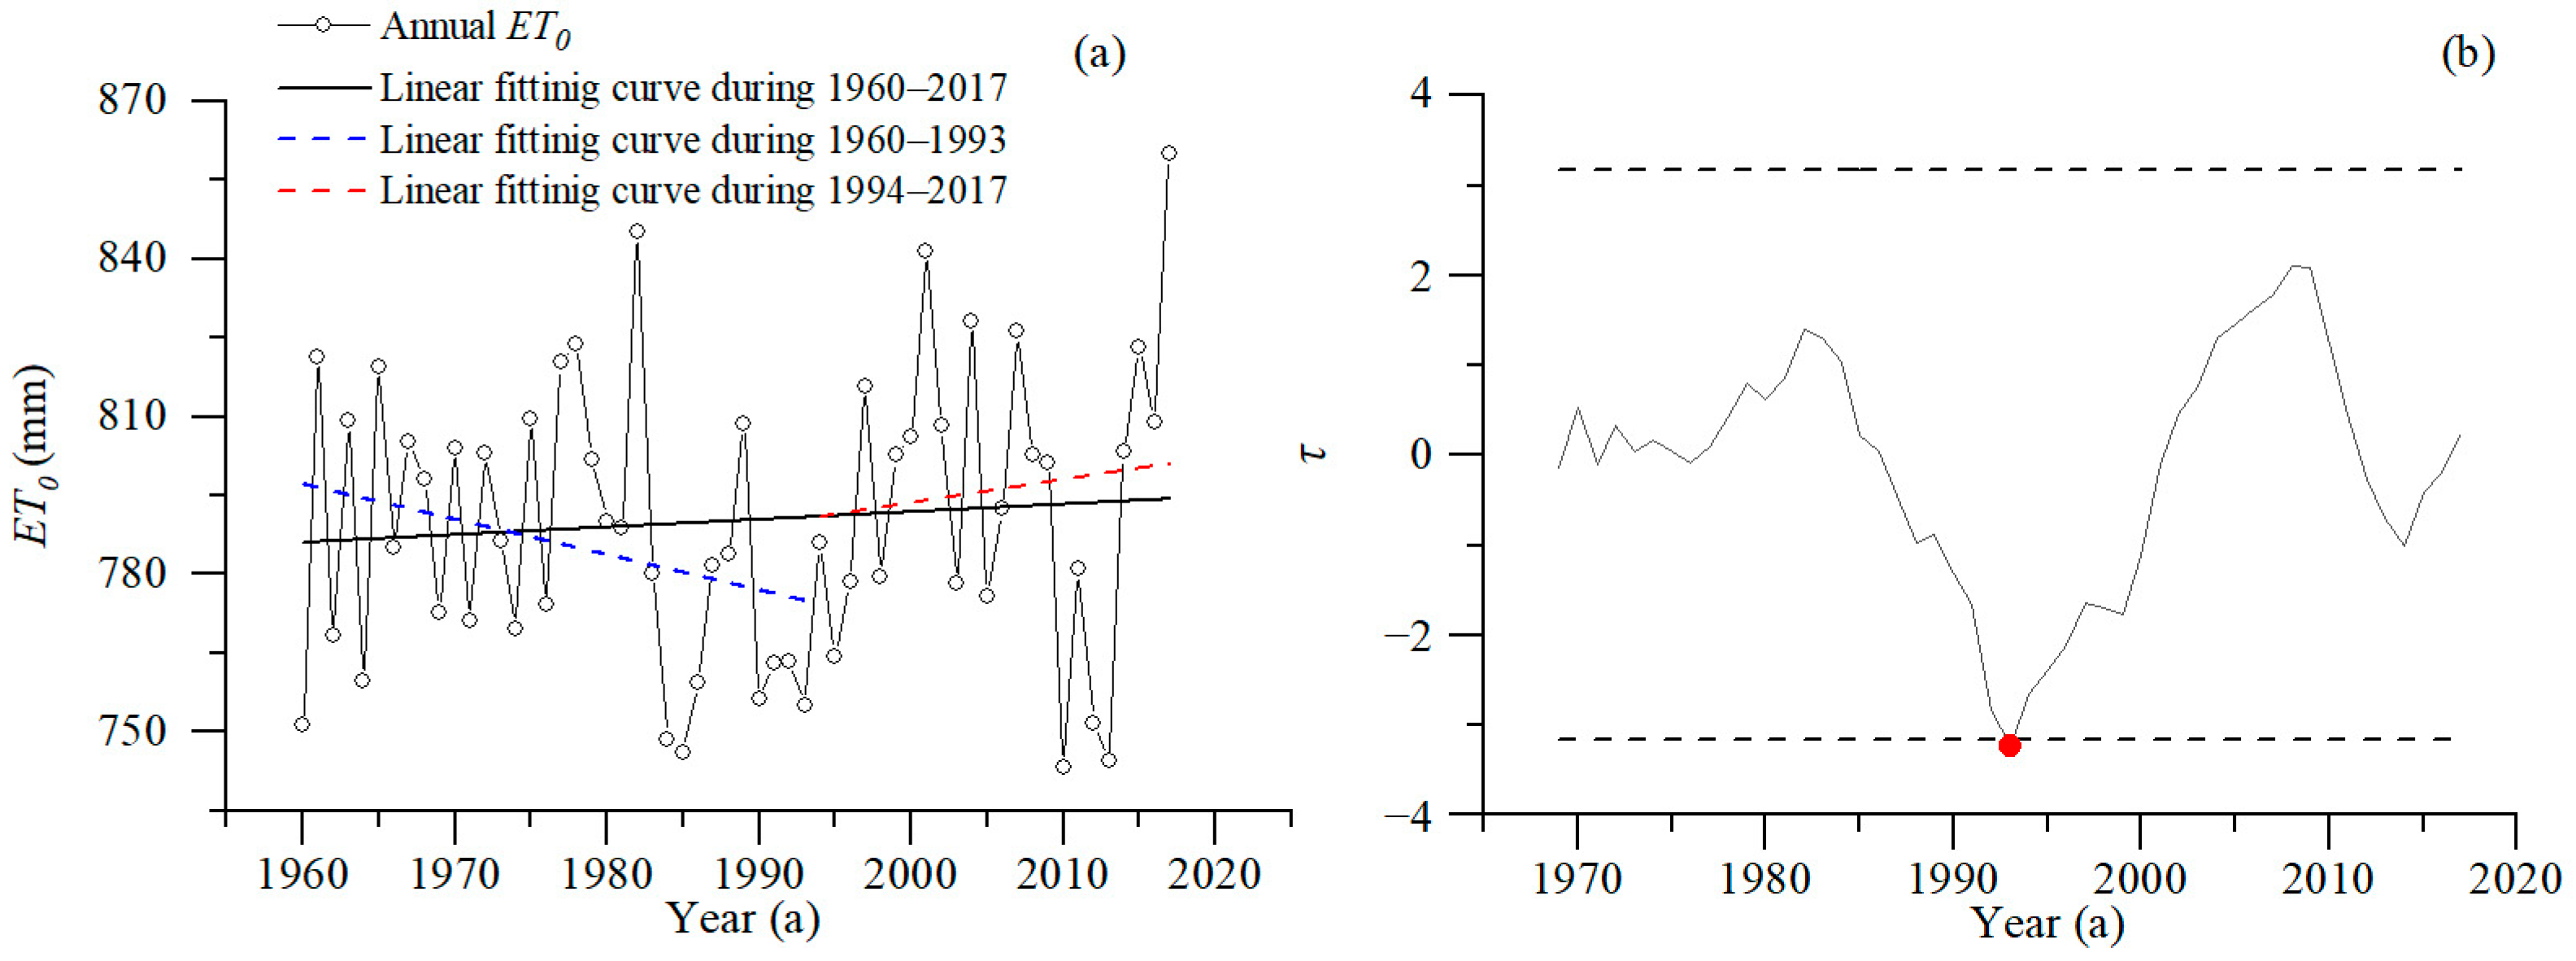
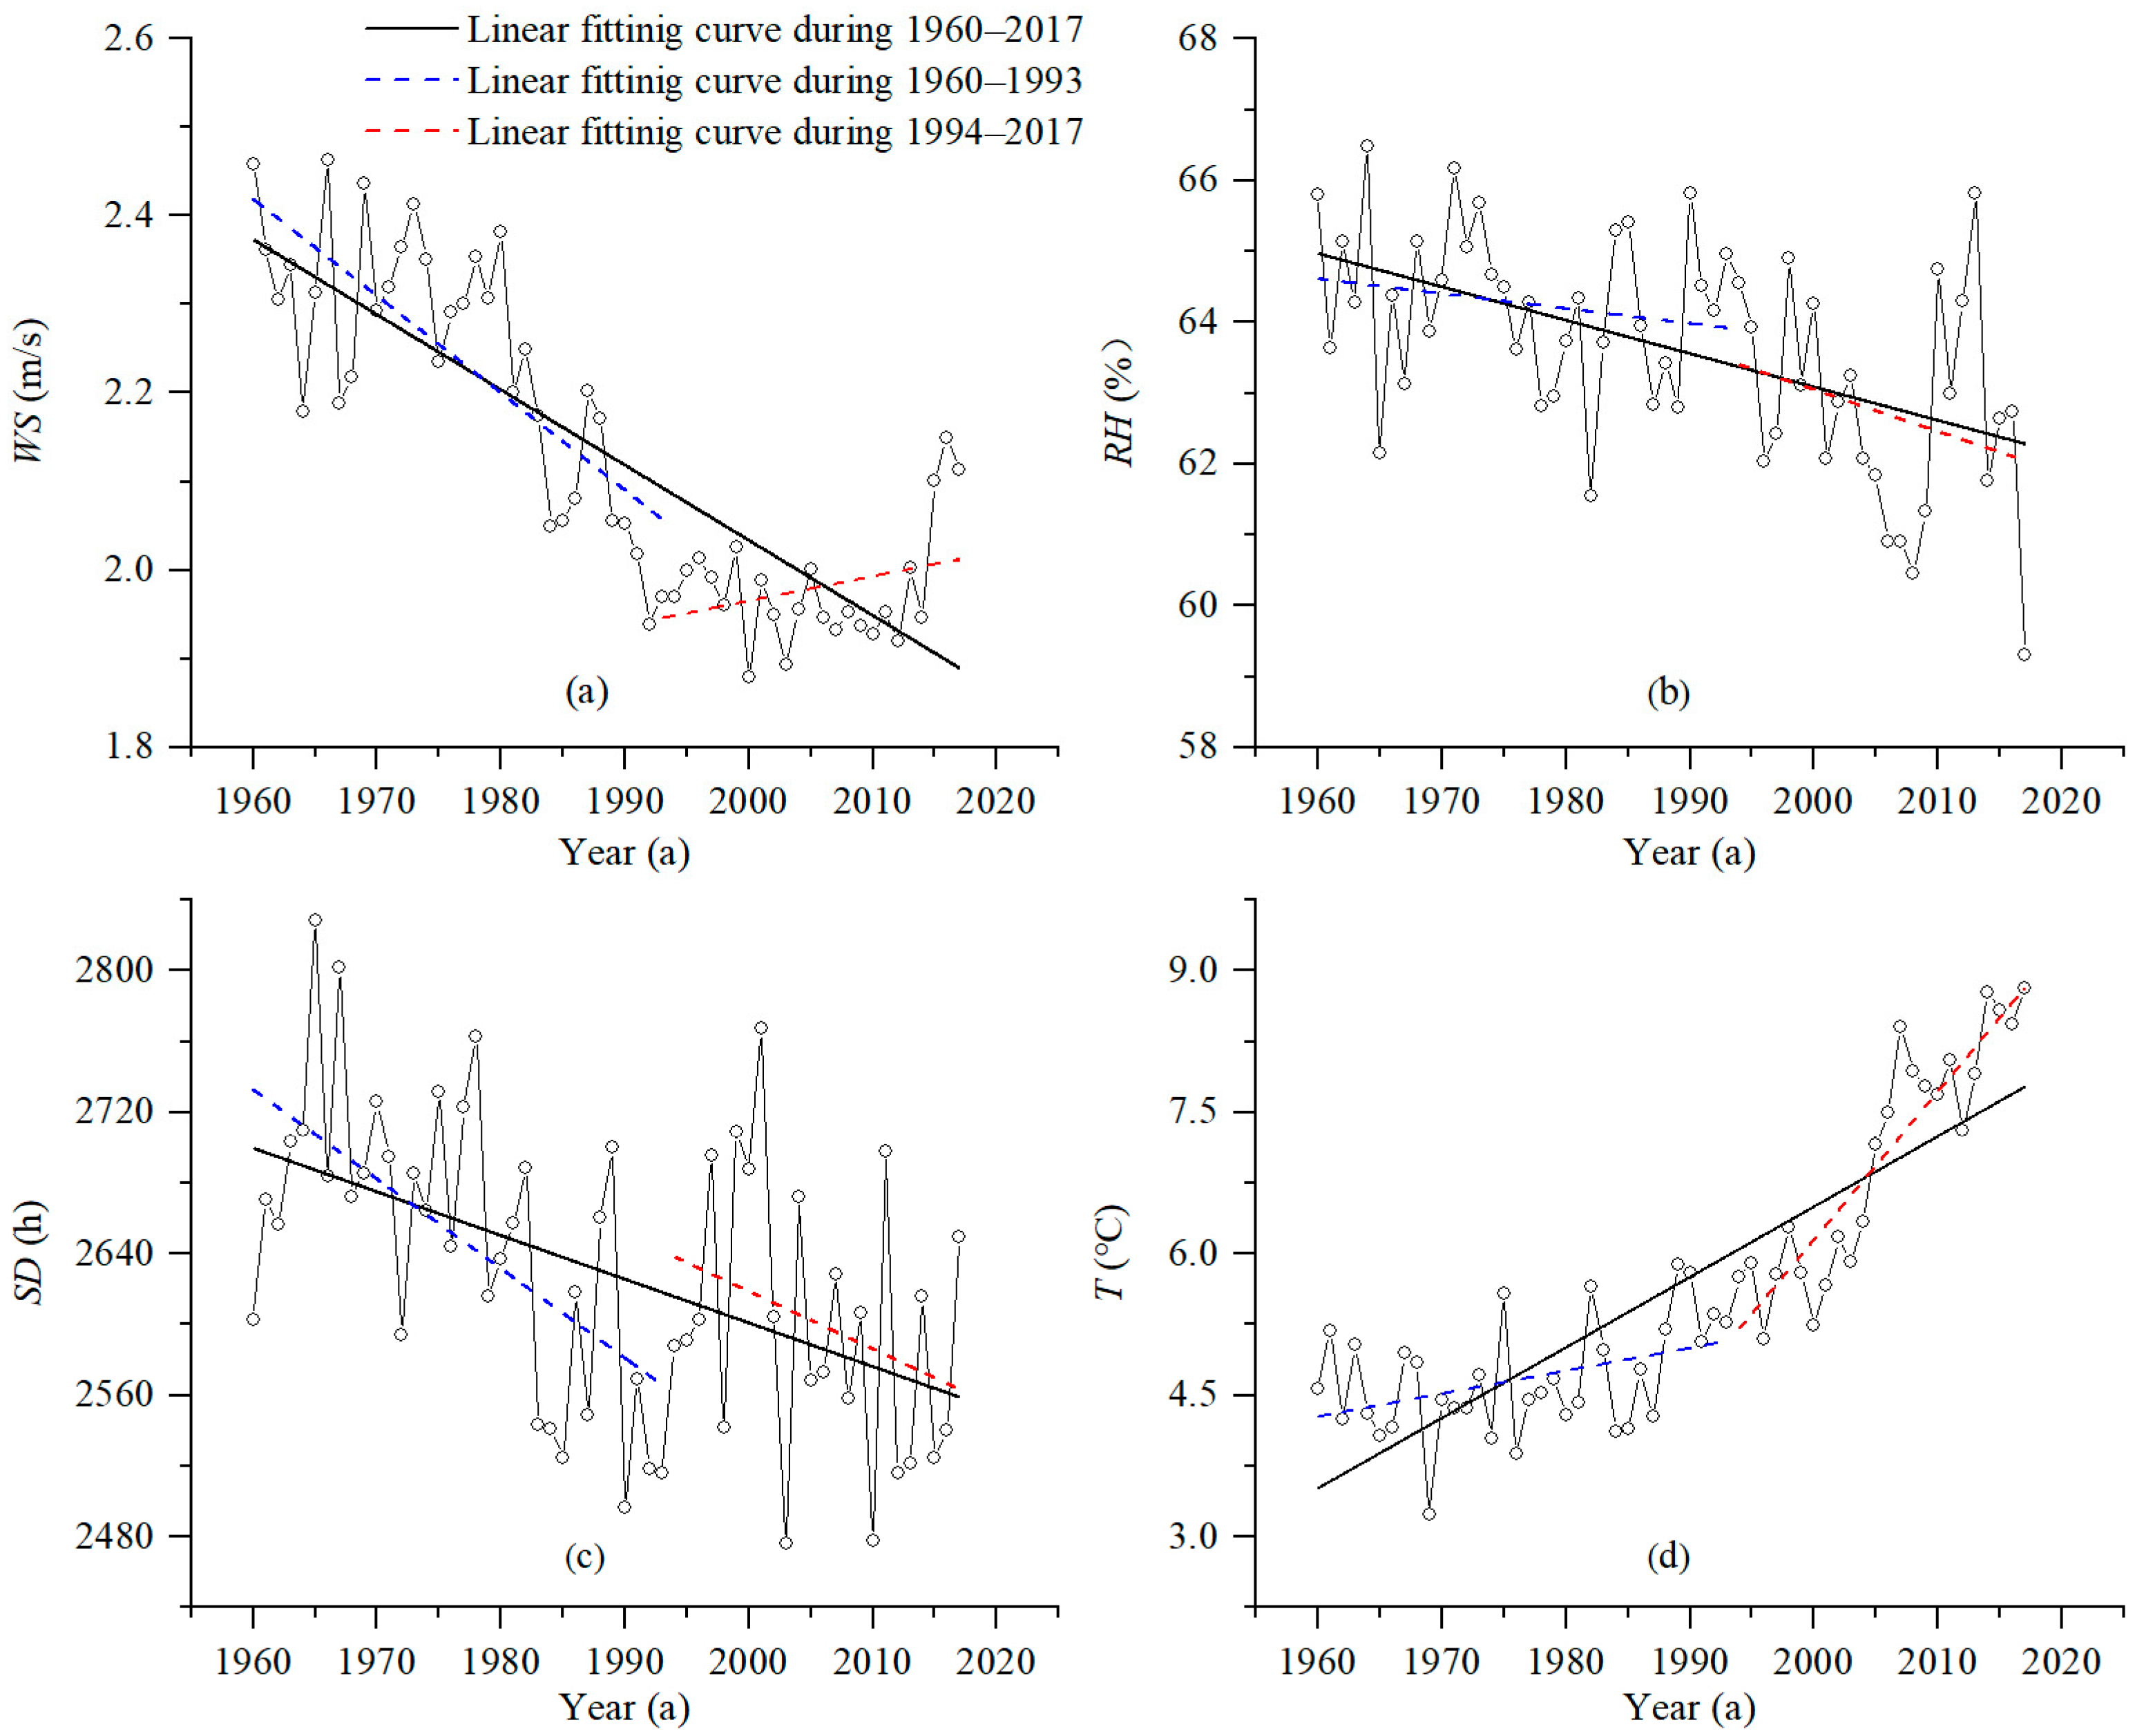
As shown in Figure 2a, the changing trends of annual ET0 in Northeast China from 1960 to 2017 were detected. During 1960–2017, the annual ET0 of the study area exhibited a nonsignificant increasing trend with a rate of 1.45 mm/10a (Table 1). The abrupt analysis results of Cramer’s test are shown in Figure 2b, which demonstrates that a breaking point of ET0 appeared in 1993. Furthermore, the annual ET0 showed an obvious downward (p < 0.1) trend with a rate of 6.71 mm/10a during 1960–1993, but insignificant increases at a rate of 4.39 mm/10a were observed between 1994 and 2017. To reveal the impact of climatic variables on ET0 trends, we also analyzed the temporal variation in climatic variables in three periods: 1960–1993, 1994–2017, and 1960–2017 (Figure 3 and Table 1). Wind speed at 2 m (WS) was found to have a significant declining trend (p < 0.01) of −0.11 m/s/10a in Northeast China from 1960 to 2017. It showed a steeper downward trend of −0.15 m/s/10a during 1960–1993 but increased insignificantly at a rate of 0.04 m/s/10a after 1993. Decreasing relative humidity (RH) trends were observed during 1960–1993, 1994–2017, and 1960–2017 at rates of −0.21%/10a, −0.59%/10a, and −0.47%/10a, respectively. Similar to RH, sunshine duration (SD) decreased during 1960–1993, 1994–2017, and 1960–2017, with reductions of −50.62 h/10a, −32.58 h/10a, and −24.72 h/10a, respectively. In both 1960–1993 and 1960–2017, the downward trend of SD reached a significance level of 0.01. As shown in Figure 3d, the temporal variation in T was opposite to that in RH and SD, showing a significant upward trend (p < 0.05) in 1960–1993, 1994–2017, and 1960–2017, with rates of 0.24 °C/10a, 1.57 °C/10a, and 0.75 °C/10a, respectively. From the above analysis, the changing trends of ET0 and T in 1994–2017 and 1960–2017 were consistent, and both showed upward trends. The increase in air temperature (T) promoted the increase in ET0. However, during 1960–1993, the obvious warming trend of T (p < 0.05) and the significant decreasing trend (p < 0.1) of ET0 demonstrated the existence of the evaporation paradox in Northeast China.
3.2. Spatial Variation of ET0 and Climatic Variables
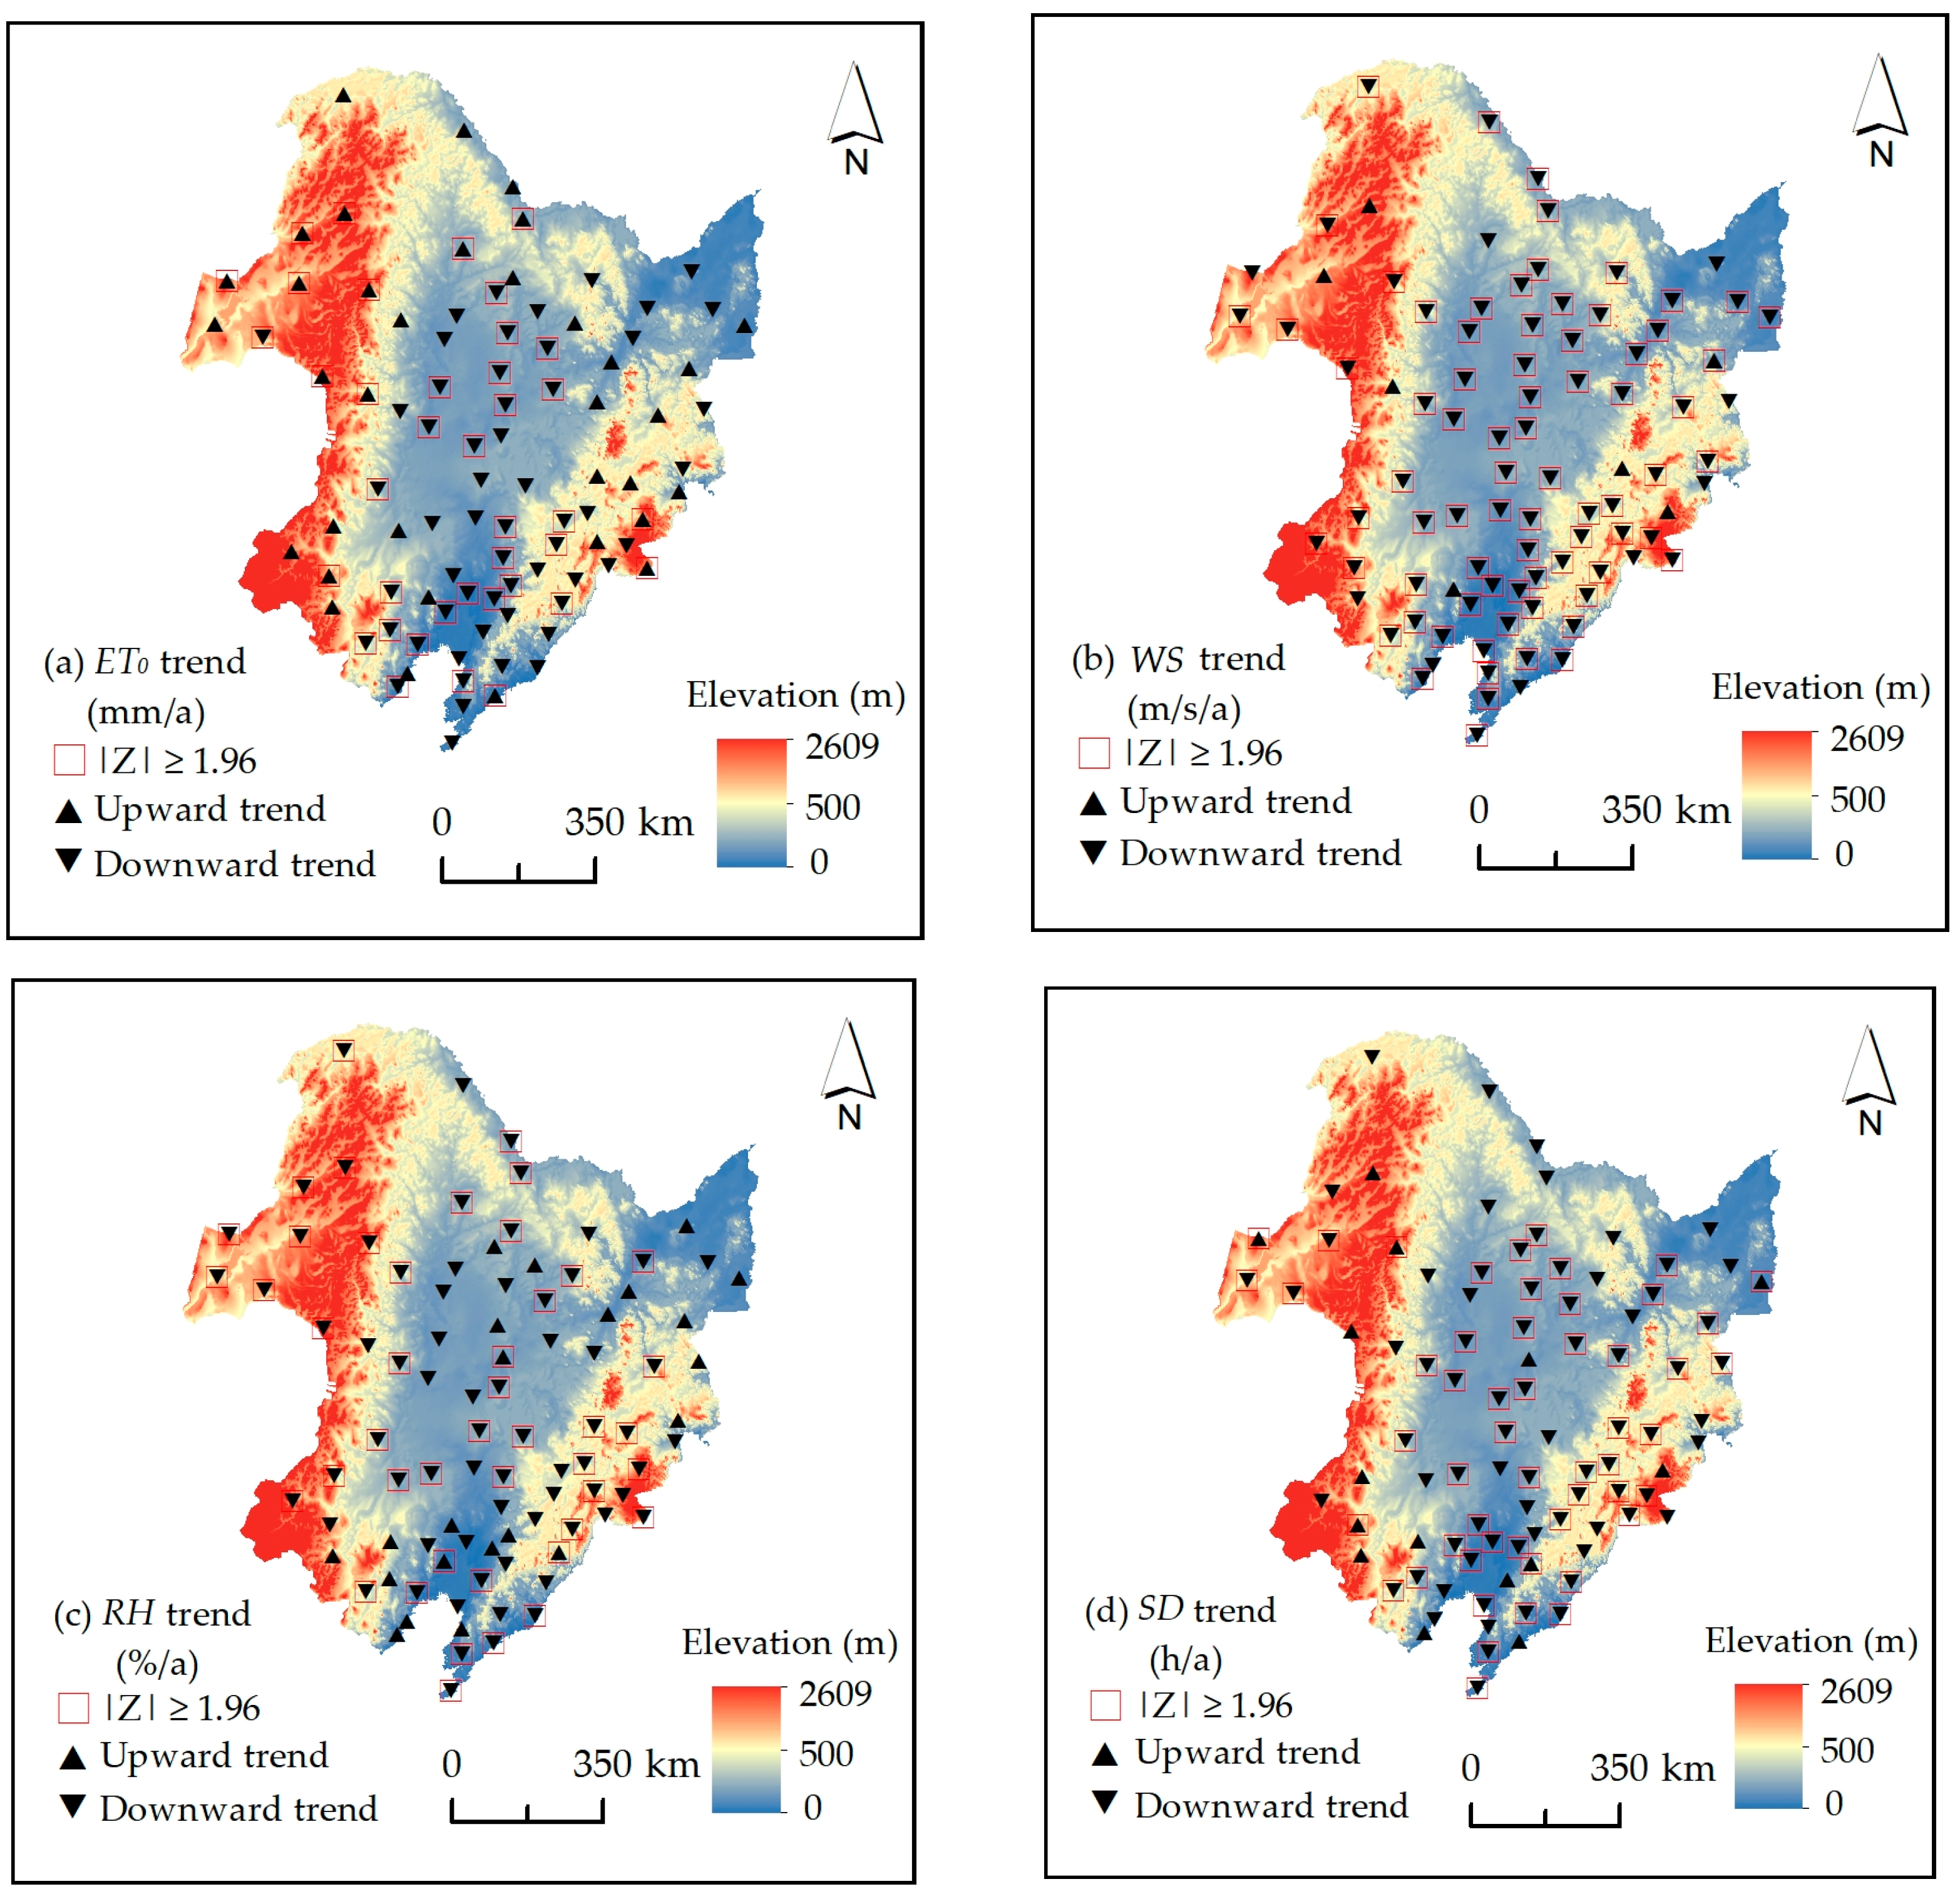
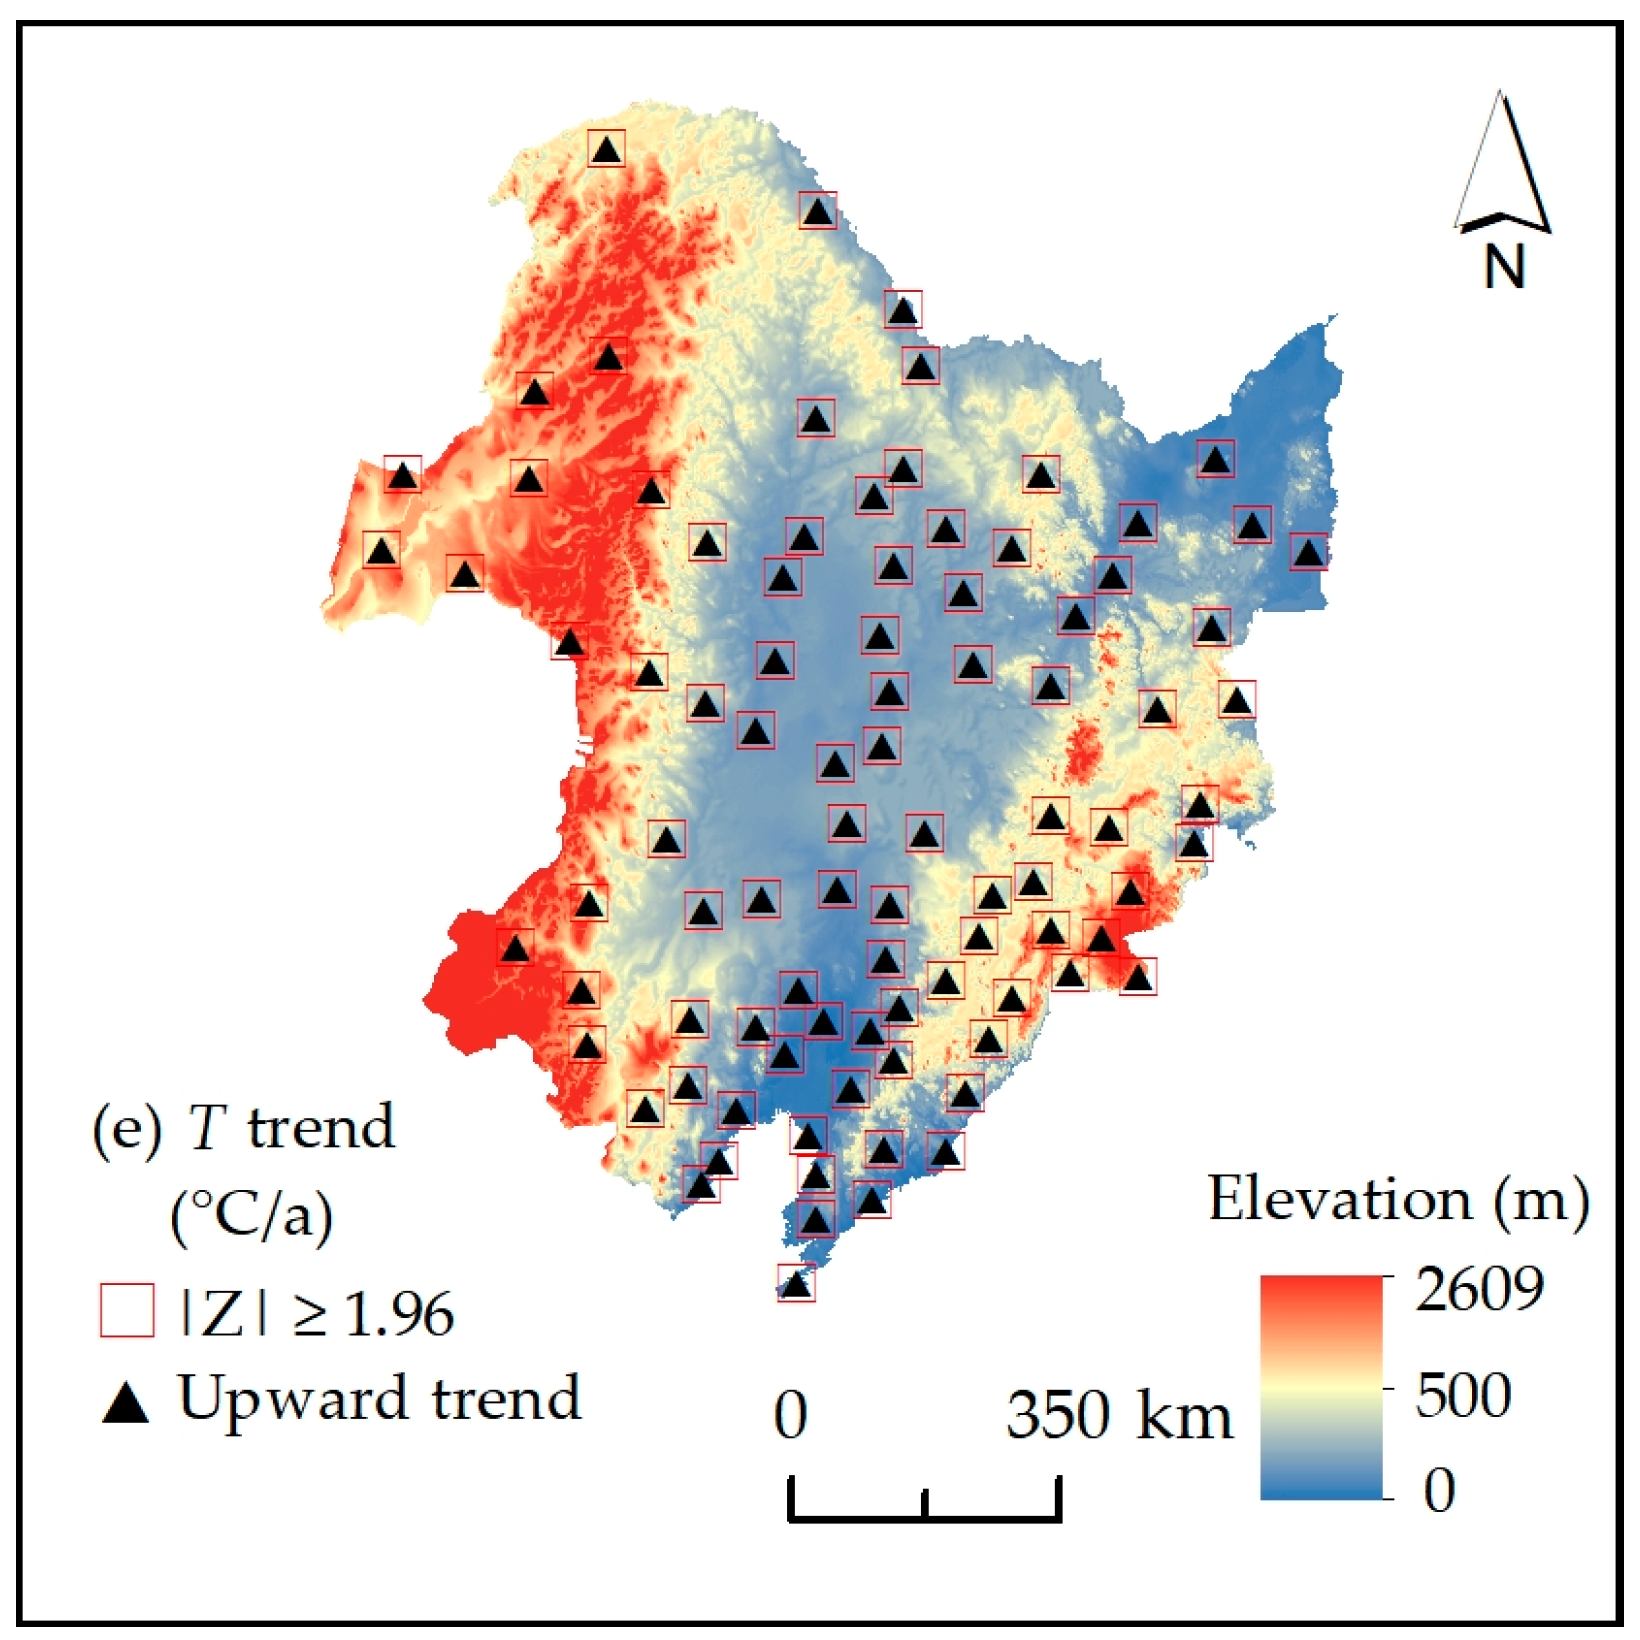
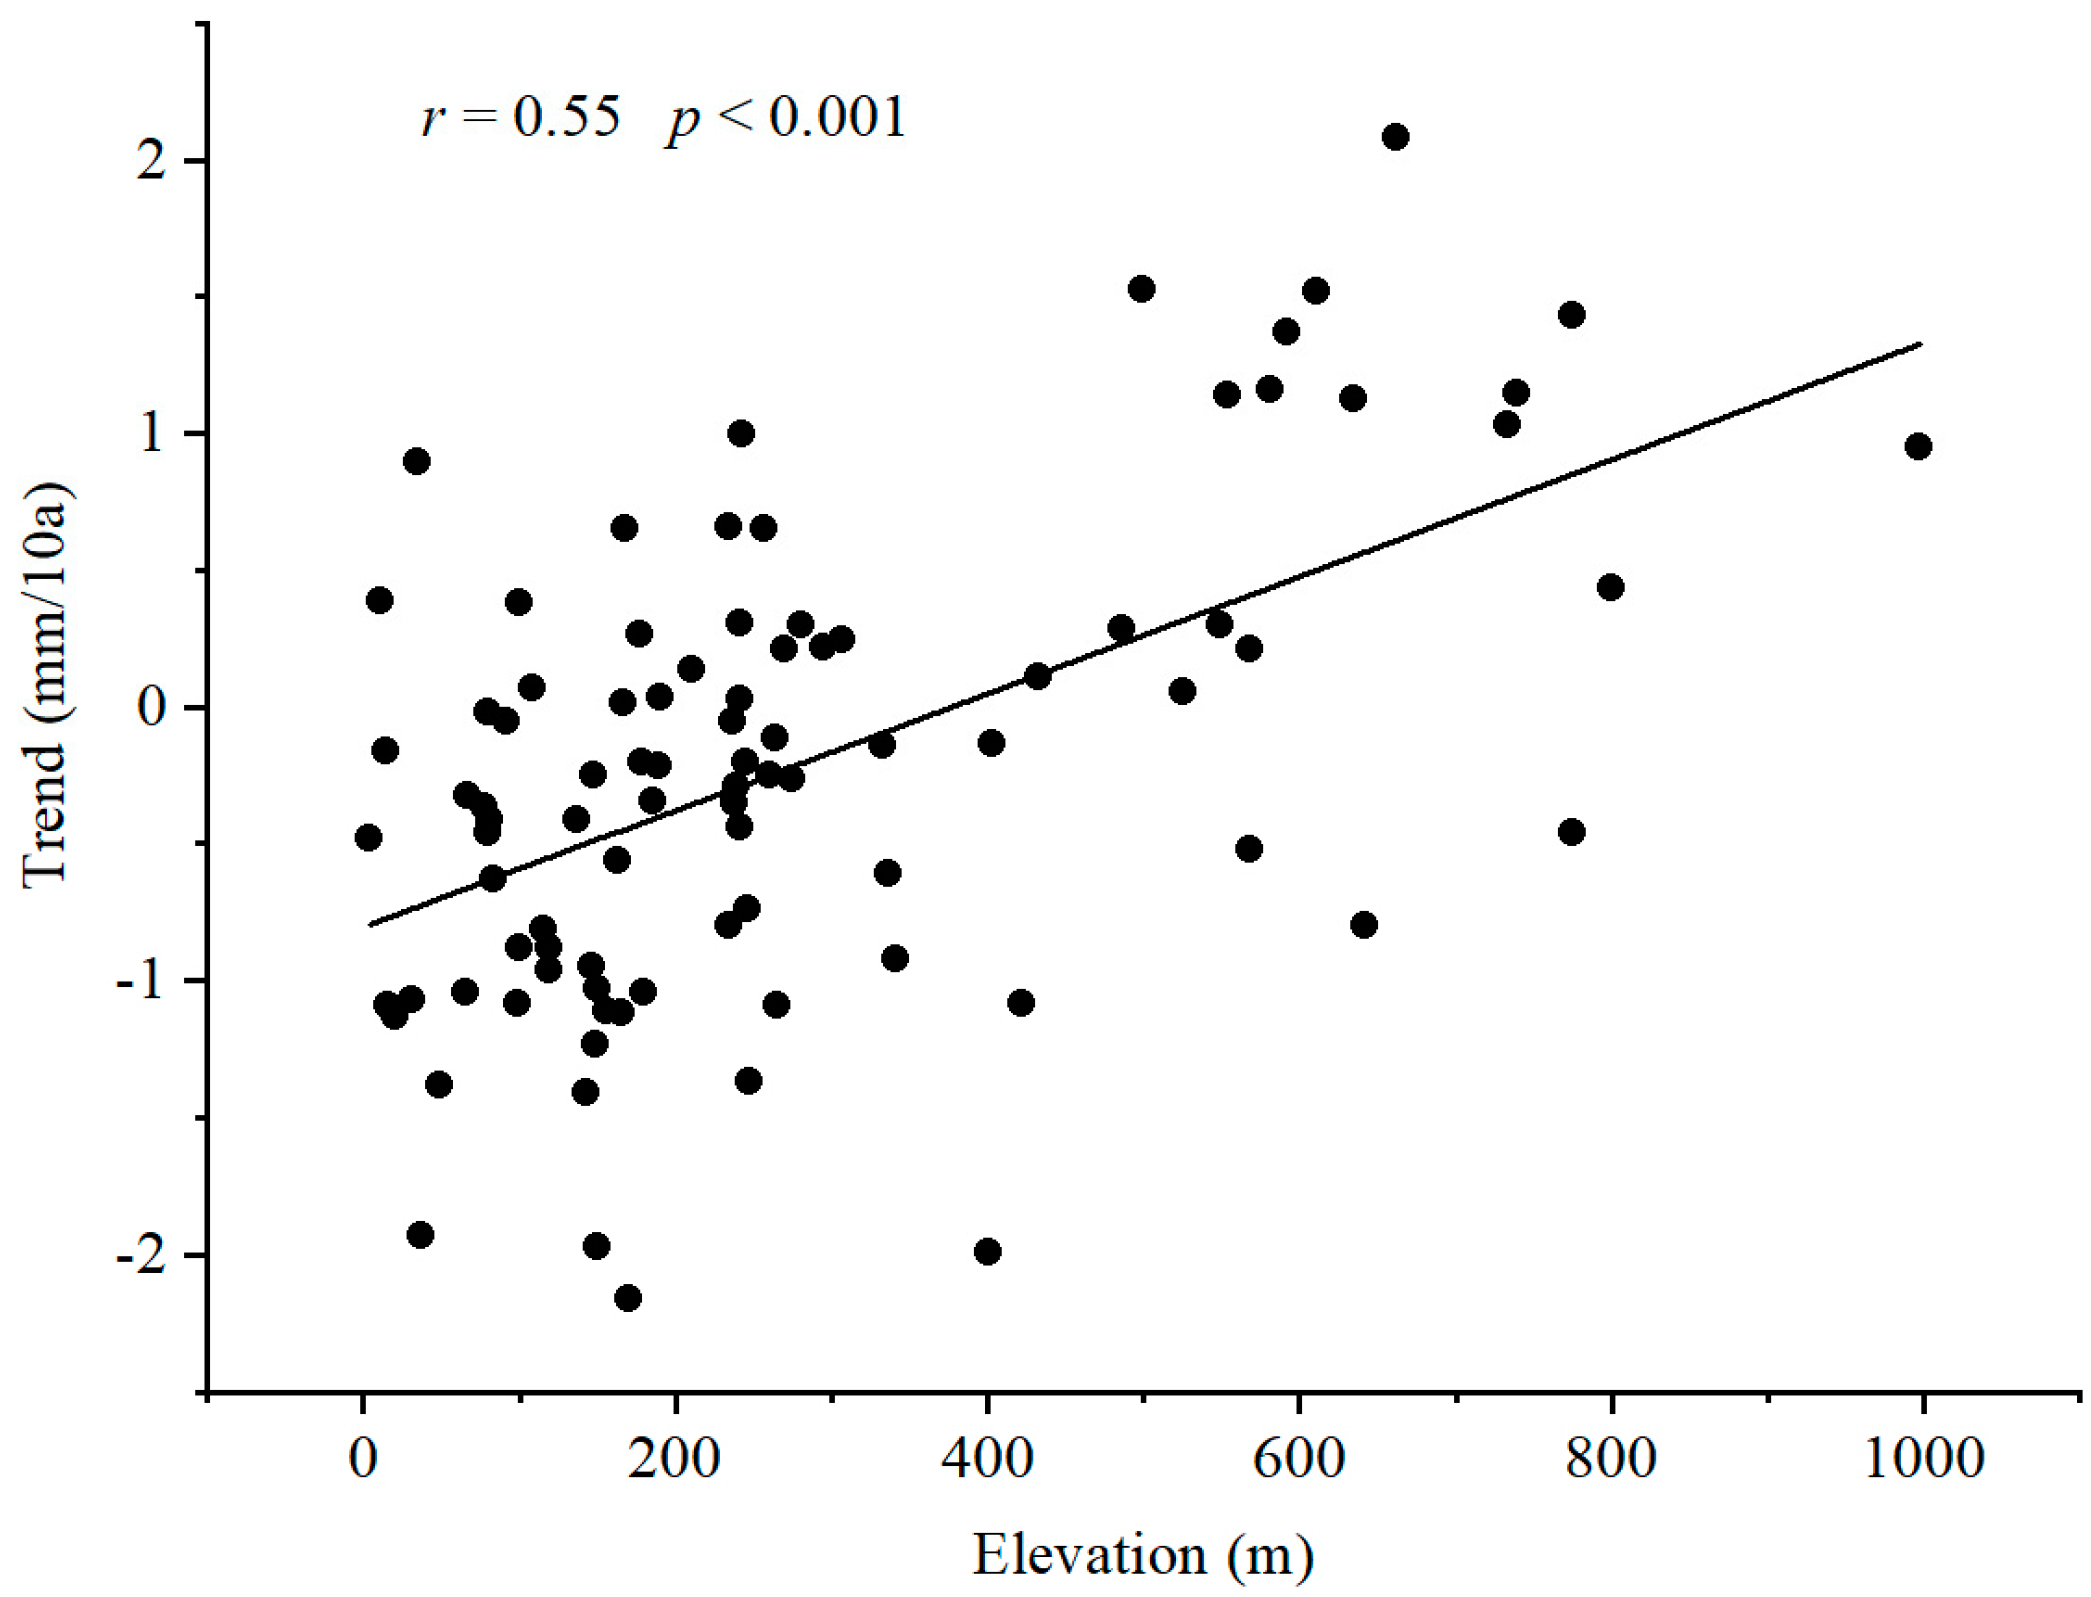
The spatial distributions of the various trends of ET0 and climatic variables in Northeast China during 1960–2017 were shown in Figure 4. The ET0 trend displayed obvious spatial heterogeneity. The meteorological stations that presented decreases were mainly located in low-altitude plain areas (<500 m), such as the Songliao Plain and Nenjiang Plain, and 74% of the stations at low elevations (<500 m) showed a negative trend, of which, 47% were significant (p < 0.05). Conversely, the stations with increasing ET0 trends were mostly distributed in high-altitude areas (>500 m), such as the Da Hinggan Mountains, Xiao Hinggan Mountains, Changbai Mountains, and Hulun Buir Plateau. Among the stations located at high altitudes (>500 m), the number of stations showing upward trends accounted for 84%, and 63% of them reached a significance level of 0.05. In summary, the variation trend of ET0 in Northeast China was affected by altitude. ET0 trend was significantly and positively related to altitude (p < 0.001) (Figure 5). From low altitude to high altitude, the changing trend of ET0 was from negative to positive, respectively. WS at most stations (92%) had downward trends in Northeast China. Furthermore, the majority of stations with stronger significant downward trends were located in low-altitude areas (<500 m), and 88% of the sites at this height level showed a significant decline in WS. In other words, there was a clear downward trend of WS at low altitudes (<500 m) in Northeast China during 1960–2017. Similar to the spatial pattern for WS, RH also displayed a downward trend integrally, with 78% of the stations showing a downward trend, of which 59% reached a significance level of 0.05. As for SD, stations with significant decreases in SD were mainly located on the Songliao Plain. Stations with an upward trend of SD were mainly located in the mountains area. T of the whole of Northeast China was on the rise, and all stations in this study area represented a significant upward trend (p < 0.05).
3.3. Influence of Climatic Variables on ET0
As the results of Section 3.1 and Section 3.2 show, the changing trend of ET0 before and after 1993 was the opposite, and the ET0 trend differed significantly at different altitudes. Low-altitude areas (<500 m) mainly displayed a downward trend, while high-altitude areas (>500 m) mostly increased. Hence, we comprehensively analyzed the impacts of climatic variables on ET0 at spatiotemporal scales. To reveal the degree of the climatic factors affecting ET0, the multiple linear regression method was used to investigate the combined impacts of the climatic variables on ET0 [37]. According to the standard regression coefficient (SRC) in Table 2, ET0 was negatively related to RH and positively related to WS, SD, and T in Northeast China. For the relative contribution rate (RCR), in 1960–1993, 1994–2017, and 1960–2017, WS dominated the ET0 trend in low-altitude areas (<500 m), contributing 30.8%, 29.5%, and 29.3%, respectively. At high altitudes and at entire altitudes, RH made the greatest contributions to the ET0 changes. Therefore, RH became the primary climatic factor affecting the variation in ET0 at high altitudes and at entire altitudes, with contributions of 34.9% and 27.8%, 52.3% and 42.9%, and 45.8% and 37.1% in 1960–1963, 1994–2017 and 1960–2017, respectively. The contributions of SD to ET0 were also relatively large in these two height ranges, and the contributions were 28.0% and 24.3%, 30.5% and 36.9%, and 28.4% and 32.7% in the three periods, respectively.
4. Discussion
4.1. Changing Trend of ET0 Related to Altitude
There were pronounced spatial differences in the ET0 trend in Northeast China from 1960 to 2017. The changing trend of ET0 was closely related to altitude. With increasing altitude, the changing trend of ET0 was from negative to positive. ET0 in low-altitude areas (<500 m) mainly showed a downward trend, while high-altitude areas (>500 m) mostly increased (Figure 4a). Zhang et al. [41] reported that ET0 had a significant downward trend in the plain regions but an upward trend in the mountainous area over the Aksu River Basin. Song et al. [27] also observed a downward ET0 trend in agricultural areas but an upward trend in the mountainous area in the Sanjiang Plain over Northeast China. The above results are consistent with our results. In addition, Liu et al. [42] found similar findings in a study of Northwest China. The ET0 trend in Northwest China during 1960–2017 was significantly and positively correlated with altitude. ET0 in low-altitude areas represented a downward trend, and an increasing ET0 trend was observed in high-altitude areas. The differences in the ET0 trend along the altitudinal gradient are caused by the different changes in climatic factors at different altitudes, which are closely related to the intensity of human activities. In low-altitude areas, human activities are relatively intense, characterized by high population density, a high level of urbanization, and rapid economic development. These social properties inevitably lead to increases in areas of construction land and agricultural land and the aggravation of air pollution. As a result, the ground surface roughness increases, consequently reducing the wind speed and sunshine hours. These changes eventually lead to a decrease in ET0 in low-altitude areas [4]. At high altitudes, the intensity of human activities is weakened, resulting in a reduced impact on climatic factors; therefore, the impacts on ET0 are relatively limited. Wang et al. [43] and Xia et al. [44] revealed that the areas of construction land and agricultural land in Northeast China have increased significantly in recent decades, and they mainly occur in the lower altitude plain areas. Han et al. [4] found that in the Beijing–Tianjin–Hebei region (North China), ET0 at natural stations in high-altitude mountainous areas represented a significant increasing trend, while ET0 at urban and farmland stations at low altitudes showed a downward trend. Chong et al. [45] pointed out that the increasing air pollution in Northeast China increased from 1981 to 2010, leading to fewer sunshine hours. From 1960 to 2017, WS and SD in the low-altitude area (<500 m) of Northeast China showed a downward trend, and most of them reached a 0.05 significance level (Figure 4). The decrease in WS and SD contributed to a decrease in ET0.
4.2. Primary Climatic Factors Affecting ET0 Variation in Northeast China
The spatiotemporal variation trend of ET0 in Northeast China was the result of the comprehensive effects of climatic factors. The contribution rate of climatic variables to the ET0 trend in Northeast China was showed in Table 2. For Northeast China as a whole, RH was the primary climatic factor influencing the ET0 trend from 1960 to 2017, with the largest contribution of 37.1%. Consistent with the entire time period, RH was also the primary climatic factor affecting ET0 changes in two subperiods, 1960–1993 and 1994–2017, with maximum contributions of 27.8% and 42.9%, respectively. The primary climatic factors affecting ET0 changes were different at different altitudes. In low-altitude areas (<500 m), the contribution rate of WS to ET0 changes was the highest (>29%) in three periods, 1960–2017, 1960–1993, and 1960–2017, indicating that WS was the primary climatic factor affecting ET0 changes in low-altitude areas. In higher altitude areas (>500 m), the largest contributions to the ET0 trend in three periods, 1960–2017, 1960–1993, and 1960–2017, were all from RH. Liu et al. [46] and Liu et al. [47] concluded that RH was the most important factor controlling the ET0 trend on the Huang-Huai-Hai Plain (China) and North China Plain. Moreover, Qi et al. [28] found that ET0 changes were mainly due to RH changes in Heilongjiang Province, China. The above reports from other humid and semi-humid regions concur with the findings of this study. However, different results were obtained in arid and semiarid areas at the same latitude as Northeast China. In Northwest China, RH and SD had little effect on ET0, and the ET0 trend was mainly affected by T and WS changes [48,49,50]. T was the primary climatic factor affecting ET0 change over the Loess Plateau of China [51,52]. The above results are inconsistent with this paper, which may be related to the diverse climatic types in different study areas. In different climatic regions, the sensitivities of ET0 to climatic factors are nonuniform. ET0 trends were dominated by different climatic factors in different climatic regions of China [36,53]. Wang et al. [54] pointed out that such a mechanism existed on a global scale. From the perspective of altitude gradient, different altitudes lead to differences in the changing trends and magnitudes for various climatic factors, which have different effects on ET0 variation [55]. Li et al. [56] pointed out that due to different urbanization levels, the wind speed in low-altitude areas with higher urbanization levels decreased obviously, significantly higher than the reduction in high-altitude areas. The rapid urbanization of low-altitude areas in Northeast China and the substantial increase in agricultural land [43,44] resulted in a significant decrease in wind speed at low altitudes (Figure 4), which led to a reduction in ET0. Then, WS became the primary climatic factor affecting ET0 changes in low-altitude areas. Similar to our results, Kang et al. [13] found that ET0 was mainly affected by RH at high altitudes and WS at low altitudes in the Taihang Mountains. A study in the Aksu River Basin also concluded that RH was the primary climatic factor affecting the ET0 trend at high elevations, but WS was the primary climatic factor at low elevations [41].
4.3. Evaporation Paradox in Northeast China
The annual ET0 in Northeast China showed a nonsignificant upward trend during 1960–2017, and there was a remarkable mutation in approximately 1993. During 1960–1993, ET0 represented a significant downward trend (p < 0.1), with a changing rate of −6.71 mm/10a, and an insignificant upward trend was detected during 1994–2017. T showed a significant upward trend (p < 0.05) during 1960–1993, contrary to the ET0 trend in the same period, which demonstrated the existence of the “evaporation paradox”. From 1994 to 2017, ET0 increased significantly with temperature warming, suggesting that the evaporation paradox disappeared. Based on research by Liu [57], in this paper, an index was used to characterize the impact of different climatic factors on the changing amplitude of ET0 in Northeast China from 1960 to 1993, which is the product of the changing rate of WS, SD, T and RH during 1960–1993 (Table 1) and their regression coefficients according to the results of multiple regression analysis by taking ET0 as the dependent variable and the four climatic variables (WS, SD, T, and RH) as the independent variables. The changing rates and regression coefficients of WS, SD, T, and RH were −0.15 m/10a, −50.62 h/10a, 0.24 °C/10a, and −0.21%/10a, and 47.98 mm/m/s (WS), 0.12 mm/h (SD), 17.3 mm/°C (T), and −9.78 mm/% (RH), respectively. The significant decreases in WS and SD result in decreases in ET0 of −7.20 mm/10a and −6.07 mm/10a, respectively. The insignificant decrease in RH increased ET0, with an amplitude of 2.05 mm/10a. A nonsignificant increase in T caused a synchronous increase in ET0 of 4.15 mm/10a. Under the comprehensive functions of the above four climatic factors, the variation in ET0 was −7.07 mm/10a. The significant decrease in WS and SD offset the effects of the obvious increase in T and the insignificant decrease in RH, resulting in the reduction in ET0, and the evaporation paradox appeared. The increasing T and decreasing RH both lead to the increase of vapor pressure deficit (VPD), thus increasing ET0. High VPD values act like a ‘Water Pump’ in the air which absorbs water from the land surface (soil and vegetation) [58]. It increases the water loss of bare soil and the transpiration of plants. WS and SD were the primary factors leading to the decrease in ET0. Fu et al. [59] pointed out that wind speed in Northeast China showed a significant decreasing trend from the 1960s to the mid-1990s, which is closely related to interdecadal pacific oscillation (IPO). The sharp reduction of wind speed caused ET0 to decrease. Luo et al. [60] reported that aerosol optical depth (AOD) in Northeast China showed an increasing trend during 1961–1990. In other words, atmospheric particulate matter concentration in Northeast China increased during 1961–1990, which reduced the surface incident radiation and then decreased the ET0. Similar to the results of this paper, Dong et al. [61] pointed out that the evaporation paradox appeared in Xinjiang from 1961 to 1993, the decrease in ET0 was attributed to the significant decrease in WS, and the evaporation paradox disappeared after 1993. Kang et al. [13] pointed out that the evaporation paradox that occurred in the Taihang Mountains from 1973 to 1990 was caused by a significant decrease in SD. Many studies have found that the decreased WS offset the increase in ET0 caused by the increased T, which led to the existence of an evaporation paradox [14,57,62]. The periods of the evaporation paradox that appeared in the above studies are different from those in this paper because the research periods selected by different studies are inconsistent.
5. Conclusions
Based on daily climate data from 91 stations over Northeast China during 1960–2017, ET0 was calculated using the Penman-Monteith method. Furthermore, the spatiotemporal variations in the annual ET0 and the driving factors were analyzed. The climate tendency rate and M-K test were adopted to reveal the temporal variation characteristics of the annual ET0. The mutation point in the annual ET0 series during 1960–2017 was identified by Cramer’s test. Multiple regression analysis was used to determine the primary climatic factors for ET0 changes at different altitudes. The main results of this paper are as follows:
- (1)
- The annual ET0 in Northeast China showed a nonsignificant increase during 1960–2017, and it changed abruptly in approximately 1993. Before that mutation point, ET0 showed a significant downward trend (p < 0.1), and afterward, the trend went insignificantly upward. During 1960–1993, the evaporation paradox appeared in Northeast China, mainly because the dramatic decrease in WS and SD played a great role in the decrease in ET0, and after 1993, the evaporation paradox disappeared.
- (2)
- The trends of ET0 in Northeast China during 1960–2017 showed obvious spatial heterogeneity. The changing trend of ET0 was significantly and positively related to altitude (p < 0.001). At low altitudes (<500 m), ET0 generally showed a downward trend, while at high altitudes (>500 m), it showed an upward trend.
- (3)
- The change in ET0 over Northeast China in three periods: 1960–1993, 1994–2017, and 1960–2017 were mainly affected by RH. At different altitudes, the main driving factors of ET0 were nonuniform. At low altitudes (<500 m), WS was the primary climatic factor affecting ET0 changes, while RH was the primary climatic factor at high altitudes.
In order to make the results of this study more effective and accurate in guiding the water resources management in Northeast China, the accuracy and error of ET0 calculated based on the Penman-Monteith method need to be further evaluated in the future, which can be carried out in the following two ways. On the one hand, it is compared with the measured data of ET0 by lysimeters and eddy covariance systems; On the other hand, it is compared with the calculation results of other ET0 evaluation models.
Author Contributions
Conceptualization, M.D.; Methodology, X.L. (Xiaoshuang Liu) and C.L. (Cheng Li); Software, M.D. and C.L. (Cheng Li); Original draft preparation writing, M.D., X.L. (Xiaoshuang Liu), C.L. (Chenxi Liu), X.L. (Xiaoyu Liu) and L.C.; Review and Editing M.D., X.L. (Xiaoshuang Liu) and C.L. (Chenxi Liu). All authors have read and agreed to the published version of the manuscript.
Funding
This research was supported by the National Natural Science Foundation of China (Grant No. 41630750).
Data Availability Statement
The weather data can be found from China Meteorological Data Sharing center (http://data.cma.cn/ (accessed on 9 November 2022)).
Acknowledgments
We would like to thank the high-performance computing support from the Center for Geodata and Analysis, Faculty of Geographical Science, Beijing Normal University [https://gda.bnu.edu.cn/] (accessed on 9 November 2022).
Conflicts of Interest
The authors declare no conflict of interest.
References
- Milly, P.C.D.; Dunne, K.A. Potential evapotranspiration and continental drying. Nat. Clim. Chang. 2016, 6, 946–949. [Google Scholar] [CrossRef]
- Xiang, K.Y.; Li, Y.; Horton, R.; Feng, H. Similarity and difference of potential evapotranspiration and reference crop evapotranspiration—A review. Agric. Water Manag. 2020, 232, 106043. [Google Scholar] [CrossRef]
- Zhang, F.J.; Liu, Z.H.; Zhangzhong, L.L.; Yu, J.X.; Shi, K.L.; Yao, L. Spatiotemporal distribution characteristics of reference evapotranspiration in Shandong Province from 1980 to 2019. Water 2020, 12, 3495. [Google Scholar] [CrossRef]
- Han, J.Y.; Zhao, Y.; Wang, J.H.; Zhang, B.; Zhu, Y.N.; Jiang, S.; Wang, L.Z. Effects of different land use types on potential evapotranspiration in the Beijing-Tianjin-Hebei region, North China. J. Geogr. Sci. 2019, 29, 922–934. [Google Scholar] [CrossRef] [Green Version]
- Yagbasan, O.; Demir, V.; Yazicigil, H. Trend analyses of meteorological variables and lake levels for two shallow lakes in central Turkey. Water 2020, 12, 414. [Google Scholar] [CrossRef] [Green Version]
- Soroush, F.; Fathian, F.; Khabisi, F.S.H.; Kahya, E. Trends in pan evaporation and climate variables in Iran. Theor. Appl. Clim. 2020, 142, 407–432. [Google Scholar] [CrossRef]
- Masanta, S.K.; Srinivas, V.V. Regionalization of evapotranspiration in India using fuzzy dynamic clustering approach. Part 2: Applications of regions. Int. J. Climatol. 2021, 41, E1371–E1395. [Google Scholar] [CrossRef]
- Hobbins, M.T.; Ramirez, J.A.; Brown, T.C. Trends in pan evaporation and actual evapotranspiration across the conterminous US: Paradoxical or complementary? Geophys. Res. Lett. 2004, 31, L13503. [Google Scholar] [CrossRef] [Green Version]
- Rayner, D.P. Wind run changes: The dominant factor affecting pan evaporation trends in Australia. J. Clim. 2007, 20, 3379–3394. [Google Scholar] [CrossRef]
- Mozny, M.; Trnka, M.; Vlach, V.; Vizina, A.; Potopova, V.; Zahradnicek, P.; Hajkova, L.; Staponites, L.; Zalud, Z. Past (1971–2018) and future (2021–2100) pan evaporation rates in the Czech Republic. J. Hydrol. 2020, 590, 125390. [Google Scholar] [CrossRef]
- Chapman, R.A.; Midgley, G.F.; Smart, K. Diverse trends in observed pan evaporation in AUTHORS: South Africa suggest multiple interacting drivers. S. Afr. J. Sci. 2021, 117, 80–86. [Google Scholar] [CrossRef] [PubMed]
- Cong, Z.T.; Yang, D.W.; Ni, G.H. Does evaporation paradox exist in China? Hydrol. Earth Syst. Sci. 2009, 13, 357–366. [Google Scholar] [CrossRef] [Green Version]
- Kang, T.T.; Li, Z.; Gao, Y.C. Spatiotemporal variations of reference evapotranspiration and its determining climatic factors in the Taihang mountains, China. Water 2021, 13, 22. [Google Scholar] [CrossRef]
- Hu, J.F.; Zhao, G.J.; Li, P.F.; Mu, X.M. Variations of pan evaporation and its attribution from 1961 to 2015 on the Loess Plateau, China. Nat. Hazards 2022, 111, 1199–1217. [Google Scholar] [CrossRef]
- Xing, W.Q.; Wang, W.G.; Shao, Q.X.; Yu, Z.B.; Yang, T.; Fu, J.Y. Periodic fluctuation of reference evapotranspiration during the past five decades: Does Evaporation Paradox really exist in China? Sci. Rep. 2016, 6, 39503. [Google Scholar] [CrossRef] [Green Version]
- Wang, Z.L.; Xie, P.W.; Lai, C.G.; Chen, X.H.; Wu, X.S.; Zeng, Z.Y.; Li, J. Spatiotemporal variability of reference evapotranspiration and contributing climatic factors in China during 1961–2013. J. Hydrol. 2017, 544, 97–108. [Google Scholar] [CrossRef]
- Jerin, J.N.; Islam, H.M.T.; Islam, A.R.M.T.; Shahid, S.; Hu, Z.; Badhan, M.A.; Chu, R.H.; Elbeltagi, A. Spatiotemporal trends in reference evapotranspiration and its driving factors in Bangladesh. Theor. Appl. Clim. 2021, 144, 793–808. [Google Scholar] [CrossRef]
- Pour, S.H.; Wahab, A.K.A.; Shahid, S.; Ismail, Z.B. Changes in reference evapotranspiration and its driving factors in peninsular Malaysia. Atmos. Res. 2020, 246, 105096. [Google Scholar] [CrossRef]
- Al-Hasani, A.A.J.; Shahid, S. Spatial distribution of the trends in potential evapotranspiration and its influencing climatic factors in Iraq. Theor. Appl. Clim. 2022, 150, 677–696. [Google Scholar] [CrossRef]
- Jhajharia, D.; Kumar, R.; Dabral, P.P.; Singh, V.P.; Choudhary, R.R.; Dinpashoh, Y. Reference evapotranspiration under changing climate over the Thar Desert in India. Meteorol. Appl. 2015, 22, 425–435. [Google Scholar] [CrossRef]
- Liu, Y.; Wang, Q.Y.; Yao, X.L.; Jiang, Q.; Yu, J.S.; Jiang, W.W. Variation in reference evapotranspiration over the Tibetan Plateau during 1961-2017: Spatiotemporal variations, future trends and links to other climatic factors. Water 2020, 12, 3178. [Google Scholar] [CrossRef]
- Zhao, Y.F.; Zou, X.Q.; Cao, L.G.; Yao, Y.L.; Fu, G.H. Spatiotemporal variations of potential evapotranspiration and aridity index in relation to influencing factors over Southwest China during 1960–2013. Theor. Appl. Clim. 2017, 133, 711–726. [Google Scholar] [CrossRef]
- Li, Y.Z.; Liang, K.; Bai, P.; Feng, A.Q.; Liu, L.F.; Dong, G.T. The spatiotemporal variation of reference evapotranspiration and the contribution of its climatic factors in the Loess Plateau, China. Environ. Earth Sci. 2016, 75, 354. [Google Scholar] [CrossRef]
- Feng, J.; Yan, D.H.; Li, C.Z.; Yu, F.L.; Zhang, C. Assessing the impact of climatic factors on potential evapotranspiration in droughts in North China. Quat. Int. 2014, 336, 6–12. [Google Scholar] [CrossRef]
- Yang, X.; Lin, E.D.; Ma, S.M.; Ju, H.; Guo, L.P.; Xiong, W.; Li, Y.; Xu, Y.L. Adaptation of agriculture to warming in Northeast China. Clim. Chang. 2007, 84, 45–58. [Google Scholar] [CrossRef]
- Li, W.H.; Tan, G.R.; Li, T. Relationship between the interannual and intraseasonal temperature variability in Northeast China. Int. J. Climatol. 2021, 42, 352–366. [Google Scholar] [CrossRef]
- Song, X.Y.; Zhu, K.; Lu, F.; Xiao, W.H. Spatial and temporal variation of reference evapotranspiration under climate change: A case study in the Sanjiang Plain, Northeast China. Hydrol. Res. 2018, 49, 251–265. [Google Scholar] [CrossRef]
- Qi, P.; Zhang, G.X.; Xu, Y.J.; Wu, Y.F.; Gao, Z.T. Spatiotemporal changes of reference evapotranspiration in the highest-latitude region of China. Water 2017, 9, 493. [Google Scholar] [CrossRef] [Green Version]
- Liang, L.Q.; Li, L.J.; Liu, Q. Temporal variation of reference evapotranspiration during 1961-2005 in the Taoer River basin of Northeast China. Agric. For. Meteorol. 2010, 150, 298–306. [Google Scholar] [CrossRef]
- Yang, Q.; Wang, J.H.; Yang, D.W.; Yan, D.Y.; Dong, Y.Y.; Yang, Z.F.; Yang, M.; Zhang, P.; Hu, P. Spatial-temporal variations of reference evapotranspiration and its driving factors in cold regions, northeast China. Environ. Sci. Pollut. Res. 2022, 29, 36951–36966. [Google Scholar] [CrossRef]
- Song, X.Y.; Lu, F.; Xiao, W.H.; Zhu, K.; Zhou, Y.Y.; Xie, Z. Performance of 12 reference evapotranspiration estimation methods compared with the Penman-Monteith method and the potential influences in northeast China. Meteorol. Appl. 2019, 26, 83–96. [Google Scholar] [CrossRef] [Green Version]
- Chen, Z.J.; Zhu, Z.C.; Jiang, H.; Sun, S.J. Estimating daily reference evapotranspiration based on limited meteorological data using deep learning and classical machine learning methods. J. Hydrol. 2020, 591, 125286. [Google Scholar] [CrossRef]
- Li, L.Y.; Ke, C.Q. Analysis of spatiotemporal snow cover variations in Northeast China based on moderate-resolution-imaging spectroradiometer data. J. Appl. Remote Sens. 2014, 8, 084695. [Google Scholar] [CrossRef]
- Ricard, S.; Anctil, F. Forcing the Penman-Montheith formulation with humidity, radiation, and wind speed taken from reanalyses, for hydrologic modeling. Water 2019, 11, 1214. [Google Scholar] [CrossRef] [Green Version]
- Allen, R.G.; Pereira, L.S.; Raes, D.; Smith, M. Crop Evapotranspiration—Guidelines for Computing Crop Water Requirements—FAO Irrigation and Drainage Paper 56; FAO: Rome, Italy, 1998; Volume 300. [Google Scholar]
- Zhang, D.; Liu, X.M.; Hong, H.Y. Assessing the effect of climate change on reference evapotranspiration in China. Stoch. Environ. Res. Risk. Assess 2013, 27, 1871–1881. [Google Scholar] [CrossRef]
- Han, J.Y.; Wang, J.H.; Zhao, Y.; Wang, Q.M.; Zhang, B.; Li, H.H.; Zhai, J.Q. Spatio-temporal variation of potential evapotranspiration and climatic drivers in the Jing-Jin-Ji region, North China. Agric. For. Meteorol. 2018, 256–257, 75–83. [Google Scholar] [CrossRef]
- Li, Z.; Chen, Y.N.; Yang, J.; Wang, Y. Potential evapotranspiration and its attribution over the past 50 years in the arid region of Northwest China. Hydrol. Process. 2014, 28, 1025–1031. [Google Scholar] [CrossRef]
- Jiang, C.; Nie, Z.; Mu, X.; Wang, F.; Liu, W. Potential evapotranspiration change and its attribution in the Qinling Mountains and surrounding area, China, during 1960–2012. J. Water Clim. Chang. 2016, 7, 526–541. [Google Scholar] [CrossRef] [Green Version]
- Jin, H.Y.; Chen, X.H.; Wang, Y.M.; Zhong, R.D.; Zhao, T.T.G.; Liu, Z.Y.; Tu, X.J. Spatio-temporal distribution of NDVI and its influencing factors in China. J. Hydrol. 2021, 603, 127129. [Google Scholar] [CrossRef]
- Zhang, S.H.; Liu, S.X.; Mo, X.G.; Shu, C.; Sun, Y.; Zhang, C. Assessing the impact of climate change on potential evapotranspiration in Aksu River Basin. J. Geogr. Sci. 2011, 21, 609–620. [Google Scholar] [CrossRef]
- Liu, W.; Yang, L.S.; Zhu, M.; Adamowski, J.F.; Barzegar, R.; Wen, X.H.; Yin, Z.L. Effect of elevation on variation in reference evapotranspiration under climate change in Northwest China. Sustainability 2021, 13, 10151. [Google Scholar] [CrossRef]
- Wang, Z.M.; Liu, Z.M.; Song, K.S.; Zhang, B.; Zhang, S.M.; Liu, D.W.; Ren, C.Y.; Yang, F. Land use changes in Northeast China driven by human activities and climatic variation. Chin. Geogr. Sci. 2009, 19, 225–330. [Google Scholar] [CrossRef]
- Xia, T.; Wu, W.B.; Zhou, Q.B.; Verburg, P.H.; Yu, Q.Y.; Yang, P.; Ye, L.M. Model-based analysis of spatio-temporal changes in land use in Northeast China. J. Geogr. Sci. 2015, 26, 171–187. [Google Scholar] [CrossRef]
- Chong, W.; Lyu, W.H.; Zhang, J.; Liang, J.; Yang, X.T.; Zhang, G.Y. Effects of air pollution on sunshine duration trends in typical Chinese cities. Atmosphere 2022, 13, 950. [Google Scholar] [CrossRef]
- Liu, Q.; Yan, C.R.; Ju, H.; Garre, S. Impact of climate change on potential evapotranspiration under a historical and future climate scenario in the Huang-Huai-Hai Plain, China. Theor. Appl. Clim. 2018, 132, 387–401. [Google Scholar] [CrossRef]
- Liu, Y.J.; Chen, J.; Pan, T. Analysis of changes in reference evapotranspiration, pan evaporation, and actual evapotranspiration and their influencing factors in the North China plain during 1998-2005. Earth Space Sci. 2019, 6, 1366–1377. [Google Scholar] [CrossRef] [Green Version]
- Zheng, C.L.; Wang, Q. Spatiotemporal variations of reference evapotranspiration in recent five decades in the arid land of Northwestern China. Hydrol. Process 2014, 28, 6124–6134. [Google Scholar] [CrossRef]
- Zhu, B.; Zhang, Q.; Yang, J.H.; Li, C.H. Response of potential evapotranspiration to warming and wetting in Northwest China. Atmosphere 2022, 13, 353. [Google Scholar] [CrossRef]
- Ning, T.T.; Feng, Q.; Li, R.L.; Yang, L.S. Interaction between wind speed and net radiation controls reference evapotranspiration variance in the inland river basin of Northwest China. Hydrol. Process 2022, 36, e14620. [Google Scholar] [CrossRef]
- Li, C.; Wu, P.T.; Li, X.L.; Zhou, T.W.; Sun, S.K.; Wang, Y.B.; Luan, X.B.; Yu, X. Spatial and temporal evolution of climatic factors and its impacts on potential evapotranspiration in Loess Plateau of Northern Shaanxi, China. Sci. Total. Environ. 2017, 589, 165–172. [Google Scholar] [CrossRef]
- Sun, C.J.; Zheng, Z.J.; Chen, W.; Wang, Y.Y. Spatial and temporal variations of potential evapotranspiration in the Loess Plateau of China during 1960–2017. Sustainability 2020, 12, 354. [Google Scholar] [CrossRef] [Green Version]
- Fan, J.L.; Wu, L.F.; Zhang, F.C.; Xiang, Y.Z.; Zheng, J. Climate change effects on reference crop evapotranspiration across different climatic zones of China during 1956–2015. J. Hydrol. 2016, 542, 923–937. [Google Scholar] [CrossRef]
- Wang, K.; Dickinson, R.E.; Wild, M.; Liang, S.L. Evidence for decadal variation in global terrestrial evapotranspiration between 1982 and 2002: 2. Results. J. Geophys. Res. 2010, 115, D20113. [Google Scholar] [CrossRef] [Green Version]
- Yang, Y.; Chen, R.S.; Song, Y.X.; Han, C.T.; Liu, J.F.; Liu, Z.W. Sensitivity of potential evapotranspiration to meteorological factors and their elevational gradients in the Qilian Mountains, northwestern China. J. Hydrol. 2019, 568, 147–159. [Google Scholar] [CrossRef]
- Li, Z.Q.; Song, L.L.; Ma, H.; Xiao, J.J.; Wang, K.; Chen, L. Observed surface wind speed declining induced by urbanization in East China. Clim. Dynam. 2017, 50, 735–749. [Google Scholar] [CrossRef]
- Liu, X.M.; Luo, Y.Z.; Zhang, D.; Zhang, M.H.; Liu, C.M. Recent changes in pan-evaporation dynamics in China. Geophys. Res. Lett. 2011, 38, L13404. [Google Scholar] [CrossRef] [Green Version]
- Li, S.J.; Wang, G.J.; Sun, S.L.; Fiifi Tawia Hagan, D.; Chen, T.; Dolman, H.; Liu, Y. Long-term changes in evapotranspiration over China and attribution to climatic drivers during 1980–2010. J. Hydrol. 2021, 595, 126037. [Google Scholar] [CrossRef]
- Fu, G.B.; Yu, J.J.; Zhang, Y.C.; Hu, S.S.; Ouyang, R.L.; Liu, W.B. Temporal variation of wind speed in China for 1961–2007. Theor. Appl. Clim. 2010, 104, 313–324. [Google Scholar] [CrossRef]
- Luo, Y.F.; Lu, D.R.; Zhou, X.J.; Li, W.L.; He, Q. Characteristics of the spatial distribution and yearly variation of aerosol optical depth over China in last 30 years. J. Geophys. Res. Atmos. 2001, 106, 14501–14514. [Google Scholar]
- Dong, Q.; Wang, W.G.; Shao, Q.X.; Xing, W.Q.; Ding, Y.M.; Fu, J.Y. The response of reference evapotranspiration to climate change in Xinjiang, China: Historical changes, driving forces, and future projections. Int. J. Climatol. 2019, 40, 235–254. [Google Scholar] [CrossRef]
- Zheng, H.X.; Liu, X.M.; Liu, C.M.; Dai, X.Q.; Zhu, R.R. Assessing contributions to panevaporation trends in Haihe River Basin, China. J. Geophys. Res. 2009, 114, D24105. [Google Scholar] [CrossRef]
Figure 1.
The location of Northeast China and the spatial distribution of the selected meteorological stations.
Figure 1.
The location of Northeast China and the spatial distribution of the selected meteorological stations.

Figure 2.
(a) Interannual variations of ET0 in Northeast China and (b) results of mutation detection in temporal variation in annual ET0 over Northeast China during 1960–2017 by Cramer’s test. The horizontal black lines are the 0.01 significance level line. The red point indicates the mutation year.

Figure 3.
Interannual variations of climatic factors in Northeast China. (a) WS, (b) RH, (c) SD, and (d) T.
Figure 3.
Interannual variations of climatic factors in Northeast China. (a) WS, (b) RH, (c) SD, and (d) T.

Figure 4.
Spatial patterns of trends in ET0 (a), WS (b), RH (c), SD (d), and T (e) over Northeast China during the period of 1961–2017. The trends in stations with red squares were significant (p < 0.05).
Figure 4.
Spatial patterns of trends in ET0 (a), WS (b), RH (c), SD (d), and T (e) over Northeast China during the period of 1961–2017. The trends in stations with red squares were significant (p < 0.05).


Figure 5.
Correlations between the ET0 trends and altitude.


Table 1.
The change trends of ET0 and climatic variables in Northeast China during 1960–2017.
| ET0 | WS | RH | SD | T | ||
|---|---|---|---|---|---|---|
| 1960–1993 | trend | −6.71 * | −0.15 *** | −0.21 | −50.62 *** | 0.24 ** |
| Z | −1.67 | −4.55 | −1.05 | −3.21 | 2.03 | |
| 1994–2017 | trend | 4.39 | 0.04 | −0.59 | −32.58 | 1.57 *** |
| Z | 0.60 | 0.05 | −1.44 | −1.09 | 5.01 | |
| 1960–2017 | trend | 1.45 | −0.11 *** | −0.47 *** | −24.72 *** | 0.75 *** |
| Z | 0.48 | −6.88 | −3.94 | −3.58 | 7.47 |
Note(s): Trend is the climate tendency rate of ET0 and climatic variables; the trend units of ET0, T, RH, SD, and WS are mm/10a, °C/10a, %/10a, h/10a, and m/s/10a, respectively; * denotes a significance level at 0.1, ** denotes a significance level at 0.05, and *** denotes a significance level at 0.01.
Table 2.
The standard regression coefficient (SRC) and relative contribution rate (RCR) to ET0 of the climatic variables.
Table 2.
The standard regression coefficient (SRC) and relative contribution rate (RCR) to ET0 of the climatic variables.
| WS | RH | SD | T | ||||||
|---|---|---|---|---|---|---|---|---|---|
| SRC | RCR (%) | SRC | RCR (%) | SRC | RCR (%) | SRC | RCR (%) | ||
| 1960–1993 | <500 m | 0.551 | 30.8 | −0.407 | 22.7 | 0.292 | 16.3 | 0.541 | 30.2 |
| >500 m | 0.233 | 16.5 | −0.494 | 34.9 | 0.397 | 28.0 | 0.293 | 20.6 | |
| Whole | 0.363 | 22.5 | −0.448 | 27.8 | 0.392 | 24.3 | 0.409 | 25.4 | |
| 1994–2017 | <500 m | 0.480 | 29.5 | −0.357 | 21.9 | 0.469 | 28.8 | 0.322 | 19.8 |
| >500 m | 0.202 | 16.9 | −0.625 | 52.3 | 0.365 | 30.5 | 0.003 | 0.3 | |
| Whole | 0.231 | 19.5 | −0.508 | 42.9 | 0.437 | 36.9 | 0.008 | 0.7 | |
| 1960–2017 | <500 m | 0.568 | 29.3 | −0.473 | 24.4 | 0.438 | 22.6 | 0.461 | 23.8 |
| >500 m | 0.092 | 7.1 | −0.589 | 45.8 | 0.366 | 28.4 | 0.240 | 18.6 | |
| Whole | 0.199 | 13.6 | −0.542 | 37.1 | 0.478 | 32.7 | 0.242 | 16.5 | |
Publisher’s Note: MDPI stays neutral with regard to jurisdictional claims in published maps and institutional affiliations. |
© 2022 by the authors. Licensee MDPI, Basel, Switzerland. This article is an open access article distributed under the terms and conditions of the Creative Commons Attribution (CC BY) license (https://creativecommons.org/licenses/by/4.0/).
Share and Cite
MDPI and ACS Style
Liu, X.; Liu, C.; Liu, X.; Li, C.; Cai, L.; Dong, M. Spatial and Temporal Variation in Reference Evapotranspiration and Its Climatic Drivers in Northeast China. Water 2022, 14, 3911. https://doi.org/10.3390/w14233911
AMA Style
Liu X, Liu C, Liu X, Li C, Cai L, Dong M. Spatial and Temporal Variation in Reference Evapotranspiration and Its Climatic Drivers in Northeast China. Water. 2022; 14(23):3911. https://doi.org/10.3390/w14233911
Chicago/Turabian StyleLiu, Xiaoshuang, Chenxi Liu, Xiaoyu Liu, Cheng Li, Linshan Cai, and Manyu Dong. 2022. "Spatial and Temporal Variation in Reference Evapotranspiration and Its Climatic Drivers in Northeast China" Water 14, no. 23: 3911. https://doi.org/10.3390/w14233911
Note that from the first issue of 2016, this journal uses article numbers instead of page numbers. See further details here.