
Towards Establishing Empirical Rainfall Thresholds for Shallow Landslides in Guangzhou, Guangdong Province, China
1
School of Civil Engineering, Guangzhou University, Guangzhou 510006, China
2
School of Transportation, Civil Engineering and Architecture, Foshan University, Foshan 528231, China
3
Guangzhou Urban Planning & Design Survey Research Institute, Guangzhou 510060, China
*
Author to whom correspondence should be addressed.
Water 2022, 14(23), 3914; https://doi.org/10.3390/w14233914
Submission received: 13 October 2022
/
Revised: 24 November 2022
/
Accepted: 27 November 2022
/
Published: 1 December 2022
(This article belongs to the Special Issue Research on Warning Models for Landslide and Debris Flow)
Abstract
:Empirical rainfall thresholds for predicting rainfall-triggered shallow landslides are proposed for Guangzhou city, which is prone to widespread geological hazards during the annual flood season due to the subtropical monsoon climate and frequent tropical storms and typhoons. In this study, the cumulated event rainfall (E, in mm), the duration of rainfall event (D, in day) (E–D) thresholds, normalized cumulated event rainfall, and the duration of rainfall event (EMAP–D) thresholds were defined. Thresholds based on five lithological units were obtained at 5%, 20%, and 50% probability levels using quantile regression methods. More than two-thirds of the landslides occurred within units of intrusive rock. The 20-day cumulative rainfall of 97 mm integrating cumulative event rainfall and the duration of rainfall events (CED) is introduced into the three-dimensional spatial threshold. The areas under the receiver operating characteristic curves for the CED threshold and E–D threshold were 0.944 and 0.914, respectively, and the true-positive rate of the CED threshold with the same probability level was slightly lower than that of the E–D threshold, but the CED threshold false-positive rate was much better than the E–D threshold, which can significantly reduce false alarm rate since many non-triggering rainfalls were filtered out.
1. Introduction
Shallow landslide is widely distributed in the world, but there is still no unified and widely accepted definition standard for a shallow landslide. Japan uses a thickness of 10 m as the defining standard for shallow landslide and deep landslides [1]. The French Geological Survey defines shallow landslides in the southern Alps as landslides with a depth of no more than 3 m [2]. The thickness of 2 m is used as the defining criterion in some studies [3]. In this paper, a shallow landslide with a thickness not exceeding 10 m is defined. Landslides are a natural phenomenon, but their annual consequences around the world are social and economic phenomena of a catastrophic nature [4]. With complex geological and geomorphological conditions and increasing human engineering and economic activities, China is one of the countries with the most frequent occurrences of various geological disasters in the world [5,6,7]. According to the China Statistics Yearbook on Environment published by the National Bureau of Statistics of China [8], 8219 geological disasters occurred in China on average each year from 2010 to 2020. Landslides, collapses, debris flows, and ground subsidence accounted for 69.51%, 20.27%, 7.57%, and 2.66% of disasters, respectively, causing direct economic losses of 3.497 billion RMB per year on average. From the perspective of the damage caused by geological hazards, the losses caused by landslides may be second only to earthquakes, but the frequency and scope of landslides far exceed those of earthquakes. Since landslides are regional and multiple in occurrence, human beings cannot have sufficient ability to carry out comprehensive engineering management of all potential landslide hazard sites [9]. Therefore, landslide hazard prediction is still an effective method for landslide hazard prevention and control. Rainfall is the main triggering factor for the occurrence of landslides, and under the background of global warming, the frequency and intensity of extreme weather will increase [10]. The chance of potential landslides will likely increase; therefore, the rainfall threshold that triggers landslides is an important research component in the field of landslide prediction.
An obvious correspondence between the deformation of the slide body and the amount of rainfall has been proven to exist [11]. Strong rainfall will form a strong slope flow on the surface, loose gravel is conducive to the infiltration of rainwater into the slope along soil pores or fissures, and rainwater erosion will remove the fine particles in the soil. The process of rainfall erosion and infiltration causes the self-weight of the slope to increase with increasing water content. On the other hand, due to the loss of suction, the shear strength and tensile strength of the soil decrease, the cohesion of the soil decreases or even disappears, and destabilization damage eventually occurs [12,13].
There are usually several methods for determining rainfall thresholds; namely, qualitative forecast, mathematical model forecast, numerical simulation forecast, and empirical equation forecast. The qualitative forecast predicts the trend of slope deformation and damage based on the monitoring results of slope parameters and various landslide damage phenomena combined with experience [14,15,16]. This method of forecasting relies on expert experience and is a qualitative approach. Mathematical model forecasting uses mathematical models to fit and extrapolate the observed slope deformation data [17,18,19]. The numerical simulation forecast analyses the process of slope instability and calculates the critical values of deformation and rainfall for the state of slope instability [13,20,21]. However, the physical parameters, such as the infiltration coefficient, cohesion, and internal friction angle, required for mathematical model forecasting and numerical simulation forecasting are difficult to determine on a large scale [22]. Due to the spatial heterogeneity of the material composition and structure of slope bodies, limited local information constrains the accuracy of risk forecasting and is more suitable for monitoring and forecasting the stability of individual potential landslide sites. Empirical equation forecasting is the study of a great number of historical landslides, expressing the basic laws of the relevant physical quantities over time with empirical mathematical formulas and applying them to the forecasting of unknown landslides. The empirical equation forecasting method is more suitable for temporal forecasting of regional landslide risk under the condition of limited monitoring means and the amount of monitoring equipment. Guzzetti, et al. [23] classified rainfall thresholds from different studies, such as rainfall intensity–duration (I–D) thresholds, cumulative rainfall event–duration (E–D) thresholds, rainfall cumulative (R) thresholds, and cumulative rainfall event–rainfall intensity (E–I) thresholds. Due to the different backgrounds of climate, stratigraphic lithology, and geomorphology in different study regions, the cumulative rainfall or rainfall intensity is normalized by mean annual precipitation (MAP) to eliminate the influence of climatic factors on rainfall thresholds in different regions [24]. At present, many countries and regions in the world have developed landslide early warning systems (LEWSs) based on rainfall thresholds and have verified the reliability of rainfall thresholds for regional landslide warnings with recent cases of rainfall–triggered shallow landslides. LEWSs reflect not only the influence of rainfall on landslide occurrence in a region but also imply the relationship between factors and regional characteristics, such as geomorphology and landslide occurrence. Maturidi, et al. [25] used the mean rainfall intensity and the maximum rainfall intensity to establish thresholds for Peninsular Malaysia. Vaz, et al. [26] used cumulative rainfall to establish regional landslide rainfall thresholds for Portugal. Similarly, rainfall thresholds have been established in Thailand [27], Korea [28], Slovenia [29], Italy [30], India [31], and other countries or regions.
In China, He, et al. [32] developed cumulative rainfall event–duration thresholds for the rainy and non-rainy seasons using 771 landslides that occurred throughout China from 1998 to 2017 and divided them into short duration (D < 48 h) and long duration (D ≥ 48 h). Gao, et al. [33] developed rainfall thresholds for 19,763 landslides and debris flow events in Hong Kong from 1984 to 2013. Jiang, et al. [34] established rainfall thresholds based on Bayesian and frequency ratio methods for the Bailong River Basin in western China, where data are scarce. However, there is still a lack of research on rainfall thresholds for the southern coastal region of mainland China, where landslides are mainly controlled by heavy rainfall and deeply weathered residual granitic soils. Currently, the most commonly used are the I–D threshold and E–D threshold, and since variables meet the following relationship: E = ID, the two threshold analysis methods are equivalent. However, from a theoretical point of view, in the case of E–D thresholds, the two variables are not dependent on each other; conversely, in the case of the I–D threshold, the rainfall mean or maximum intensity depends on the rainfall duration. Therefore, it is preferable to define E–D thresholds where the two variables measure independent quantities.
This paper aims to establish E–D and normalized EMAP–D rainfall thresholds applicable to Guangzhou city, located in southern China. The relationship between the rainfall on the day of landslide failure and the cumulative rainfall before landslide occurrence is used to reveal the influence of prior rainfall on landslide occurrence. In addition, the occurrence of landslides is a complex nonlinear system, and climatic factors are not the only cause of landslide occurrence. Stratigraphic and lithological conditions are the basis for the occurrence of geological hazards. This paper combines the geological factors in the study area to reveal the sensitivity of different types of rock to shallow landslides and the differences in rainfall thresholds of various types of rock. The empirical thresholds obtained in this study can help determine the minimum cumulative rainfall that may trigger shallow landslides in Guangzhou city and provide mechanistic support for relevant government departments to release geological hazard early warning information to the public.
2. Study Area
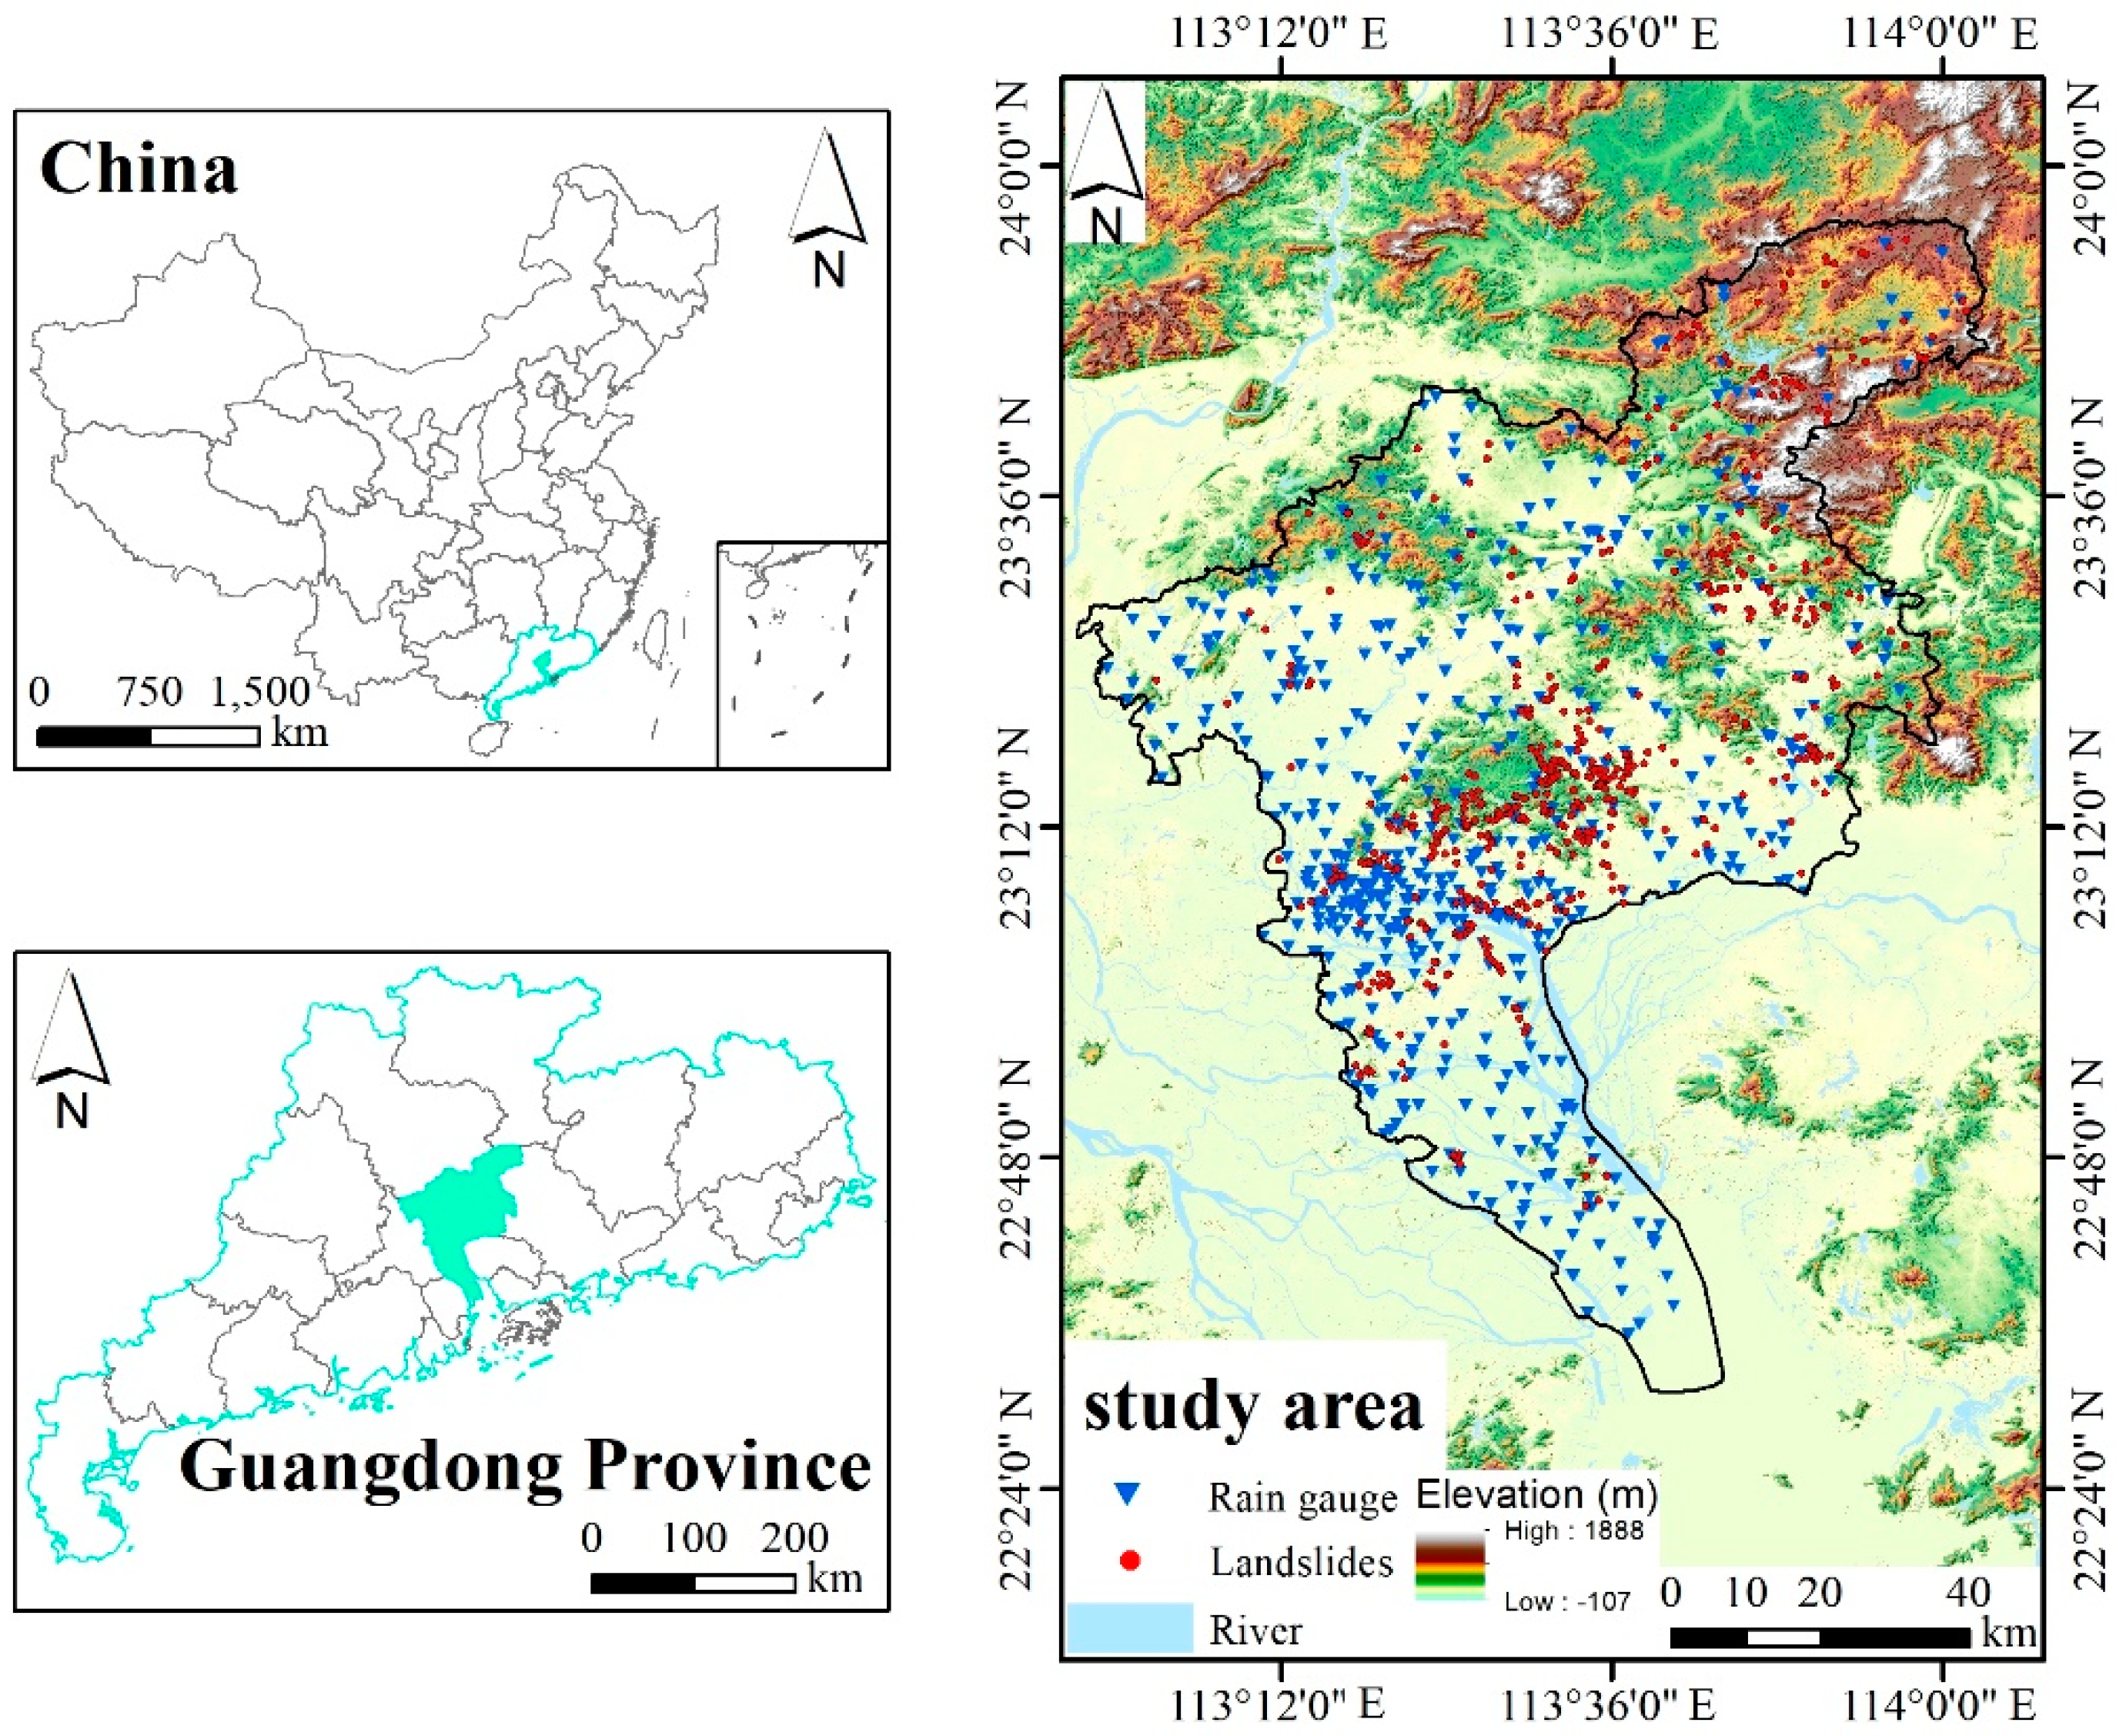
Guangzhou (7434 km2) is located in the southern part of mainland China and the southern part of central Guangdong Province, in the northern part of the Pearl River Delta, at latitude 22°26′ to 23°56′ N and longitude 112°57′ to 114°03′ E, with approximately two-thirds of the city south of the Tropic of Cancer (Figure 1). Guangzhou is one of the important central cities in China, with the fourth highest GDP among all cities in China, reaching RMB 2823.197 billion in 2021.
Guangzhou city is in the southern subtropical marine monsoon climate zone, with an annual average temperature of 21.4–21.9 °C. In summer, it is influenced by warm and humid air currents from the tropical ocean, with abundant rainfall, and the mean annual precipitation is between 1612 mm and 1909 mm. Rainfall throughout the year is mainly concentrated from April to September, accounting for approximately 80% or more of the annual rainfall. On average, 5–6 tropical storms or typhoons make landfall each year, forming localized periods of heavy rainfall, which can easily trigger large-scale geological disasters [35]. Guangzhou has a well-developed river system, and atmospheric precipitation is the most important source of recharge for surface water and groundwater. The overall terrain of Guangzhou inclines from northeast to southwest and is in a transition zone between the middle and low mountains and the Pearl River Delta, and is divided into three terrain zones: middle and low mountains, hills and tablelands, and plains. The middle and low mountains are concentrated in an area above 500 m above sea level in the northeastern part of the city, and the slope of this area is steep, generally above 20–25 degrees. The hills and terraces are mainly located in the central part of the city below 500 m on rolling hills and gentle slopes. The plains are concentrated in the southern part of the city and are composed of river alluvium or marine deposits, with low and flat terrain and deep soil layers. From the perspective of the spatial distribution of landslides, because the topography is high in the north and low in the south, the warm and humid southeastern monsoon from the ocean meets the windward slope of the remaining ridges of the South Ridge and is lifted, resulting in a distribution pattern of precipitation showing more precipitation in the north and less precipitation in the south. The landslides also show a similar distribution pattern with more cases in the north and fewer cases in the south. From the perspective of occurrence time, landslides, collapses, and debris flows mostly occur from April to September, accounting for more than 70% of the total number of geological disasters in the whole year.
In this paper, the stratigraphic and rock characteristics of Guangzhou city are divided into five categories: intrusive rock, extrusive rock, clastic rock, carbonate rock, and metamorphic rock. The proportion of landform areas consisting of granite in the study area is more than 50%. The thickness of the weathered residual granitic layer formed by chemical weathering of rocks is generally between 3 and 20 m, and the maximum thickness is up to 80 m. Weathered residual granitic soil contains sand and gravel components with large porosity, precipitation, and surface runoff that are easy to infiltrate, with the characteristics of easy softening and disintegration in water. This leads to an increase in the water content of slope soil, an increase in self-weight, and a decrease in strength, which induces shallow landslides. The fault structures of Guangzhou city are relatively developed, mainly in trending in a northeast direction, followed by an east–west direction.
3. Data and Methodology
3.1. Landslide Data
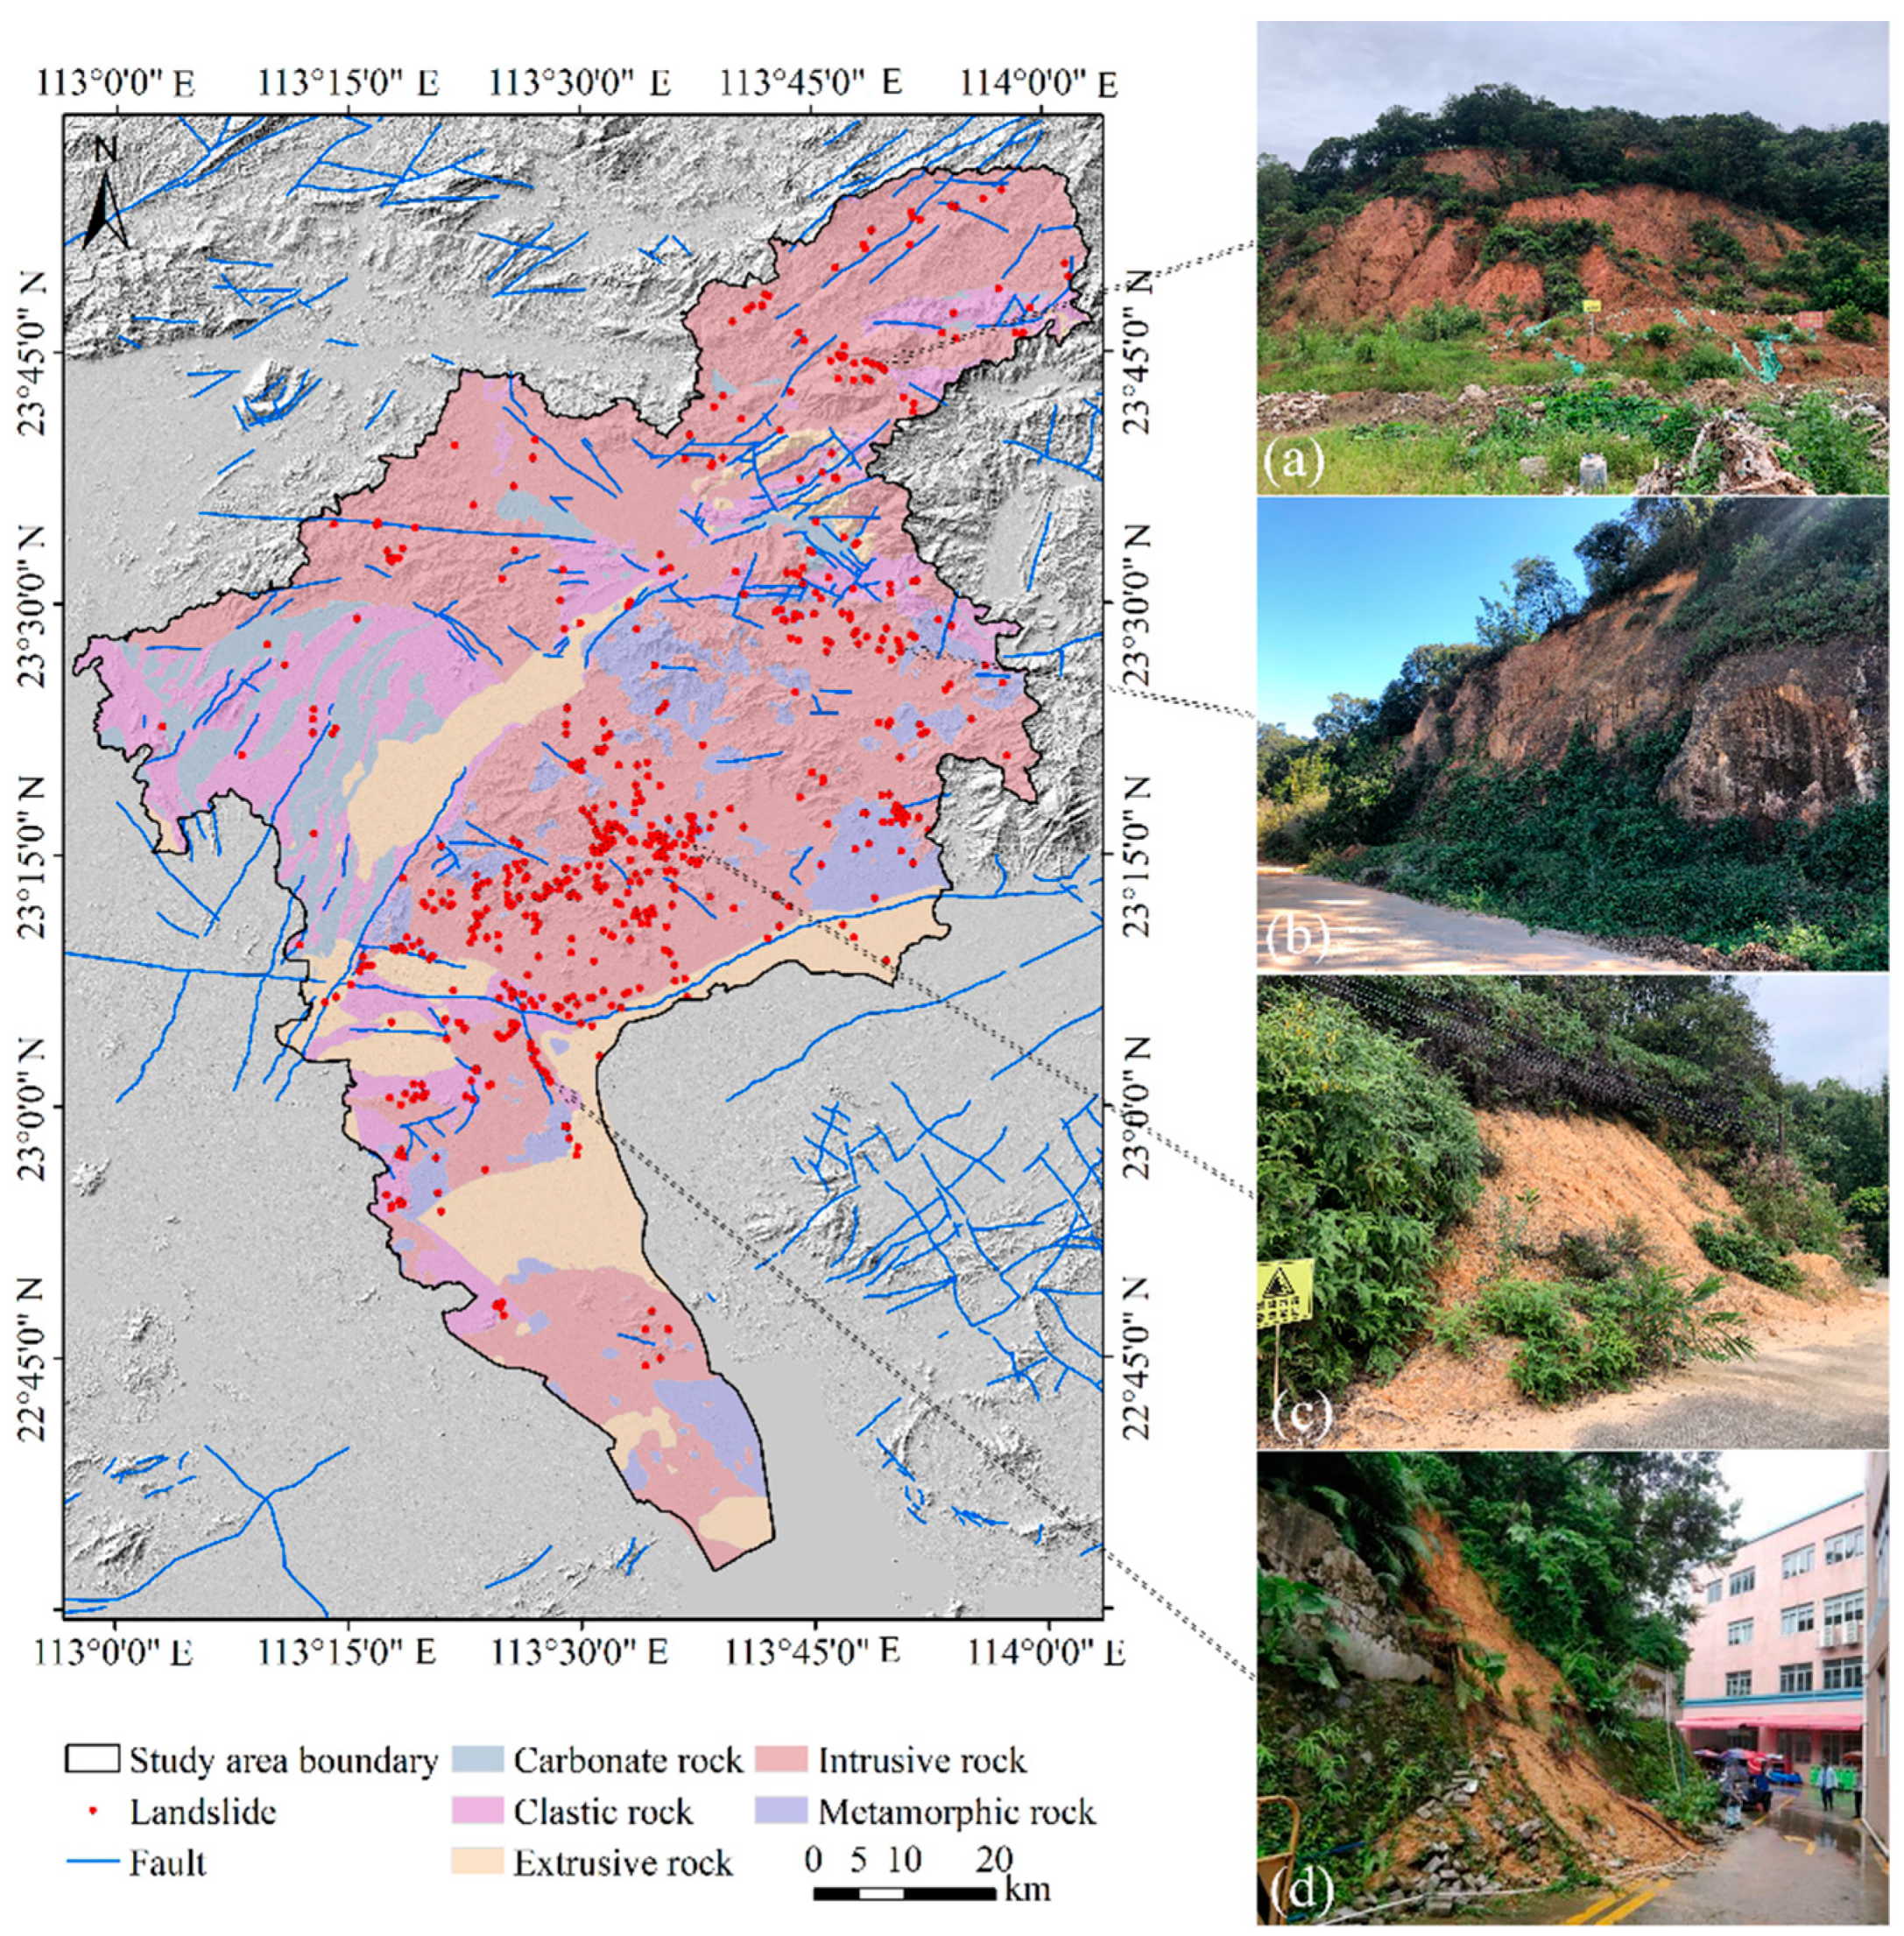
A total of 863 landslide events were recorded in the landslide database from 26 March 2010 to 23 May 2020. Landslide disaster information was reported from the town and village governments in Guangzhou proactively, and the disaster list accurately records the date, location, disaster type, disaster scale, number of casualties, and direct economic loss of the disasters in detail. Historical landslide information shows that the size of the landslides is mainly micro landslides with a volume of less than 100 m3, accounting for 96.52% of the total number of disasters. Most slopes where the landslides occurred were less than 5 m in height, accounting for 64.03% of the total number of disasters. According to the modified Varnes classification of landslide initiation movement and damage characteristics [36], the landslides in the study area were mainly rotational sliding failure (43.89%) (Figure 2a,b), planar sliding failure (20.80%) (Figure 2c), and toppling failure (35.31%) (Figure 2d). The motion form of rotational sliding failure and planar sliding failure is mainly slipping, and the former is accompanied by subsidence and bulge. The toppling failure is mainly subject to the action of the overturning moment and occurs mostly on upright slopes with vertical fracture development. The Guangzhou engineering geological map in scale 1:200,000 is obtained from the National Geological Archives of China site (https://www.ngac.cn/) (accessed on 13 August 2022).
Landslides that were not triggered by rainfall were excluded from the landslide database, and only one landslide with multiple repeated entries at the same location at the same time was retained for analysis. Some landslides with unclear locations occurring next to roads were also excluded from the analysis. In total, 96 landslides were manually removed from the landslide database, and the remaining 766 landslides were retained for further analysis.
3.2. Meteorological Data
In this study, daily rainfall data from 532 rainfall stations in the city were obtained from the Guangzhou Meteorological Bureau from 2010 to 2020 with a temporal resolution of days. The minimum distance between all rain gauge stations and the location of the nearest known landslide hazard was 0.02 km, and the farthest distance was 8.61 km. The average distance between the landslide site and the rain gauge stations was 1.81 km ± 1.25 km (mean ± standard deviation). The rain gauge stations closest to the landslide were selected for analysis, and a total of 199 rain stations were used to reproduce each landslide rainfall event. Mean annual precipitation was used to normalize the cumulative rainfall of rainfall events associated with landslide occurrence. The MAP data corresponding to each landslide were obtained from rain gauge stations that were close and had long-term observations. The rainfall data for each landslide event are approximated by the inverse distance weighting (IDW) method based on the distance to the nearest rainfall station. The IDW method, also known as the inverse distance multiplier method, assigns a larger weight to the closer landslides and a more uniform weight to the more distant landslides [37]. IDW is a reliable method for spatial interpolation, and a number of studies have reported the successful application of IDW in various regions [38,39,40].
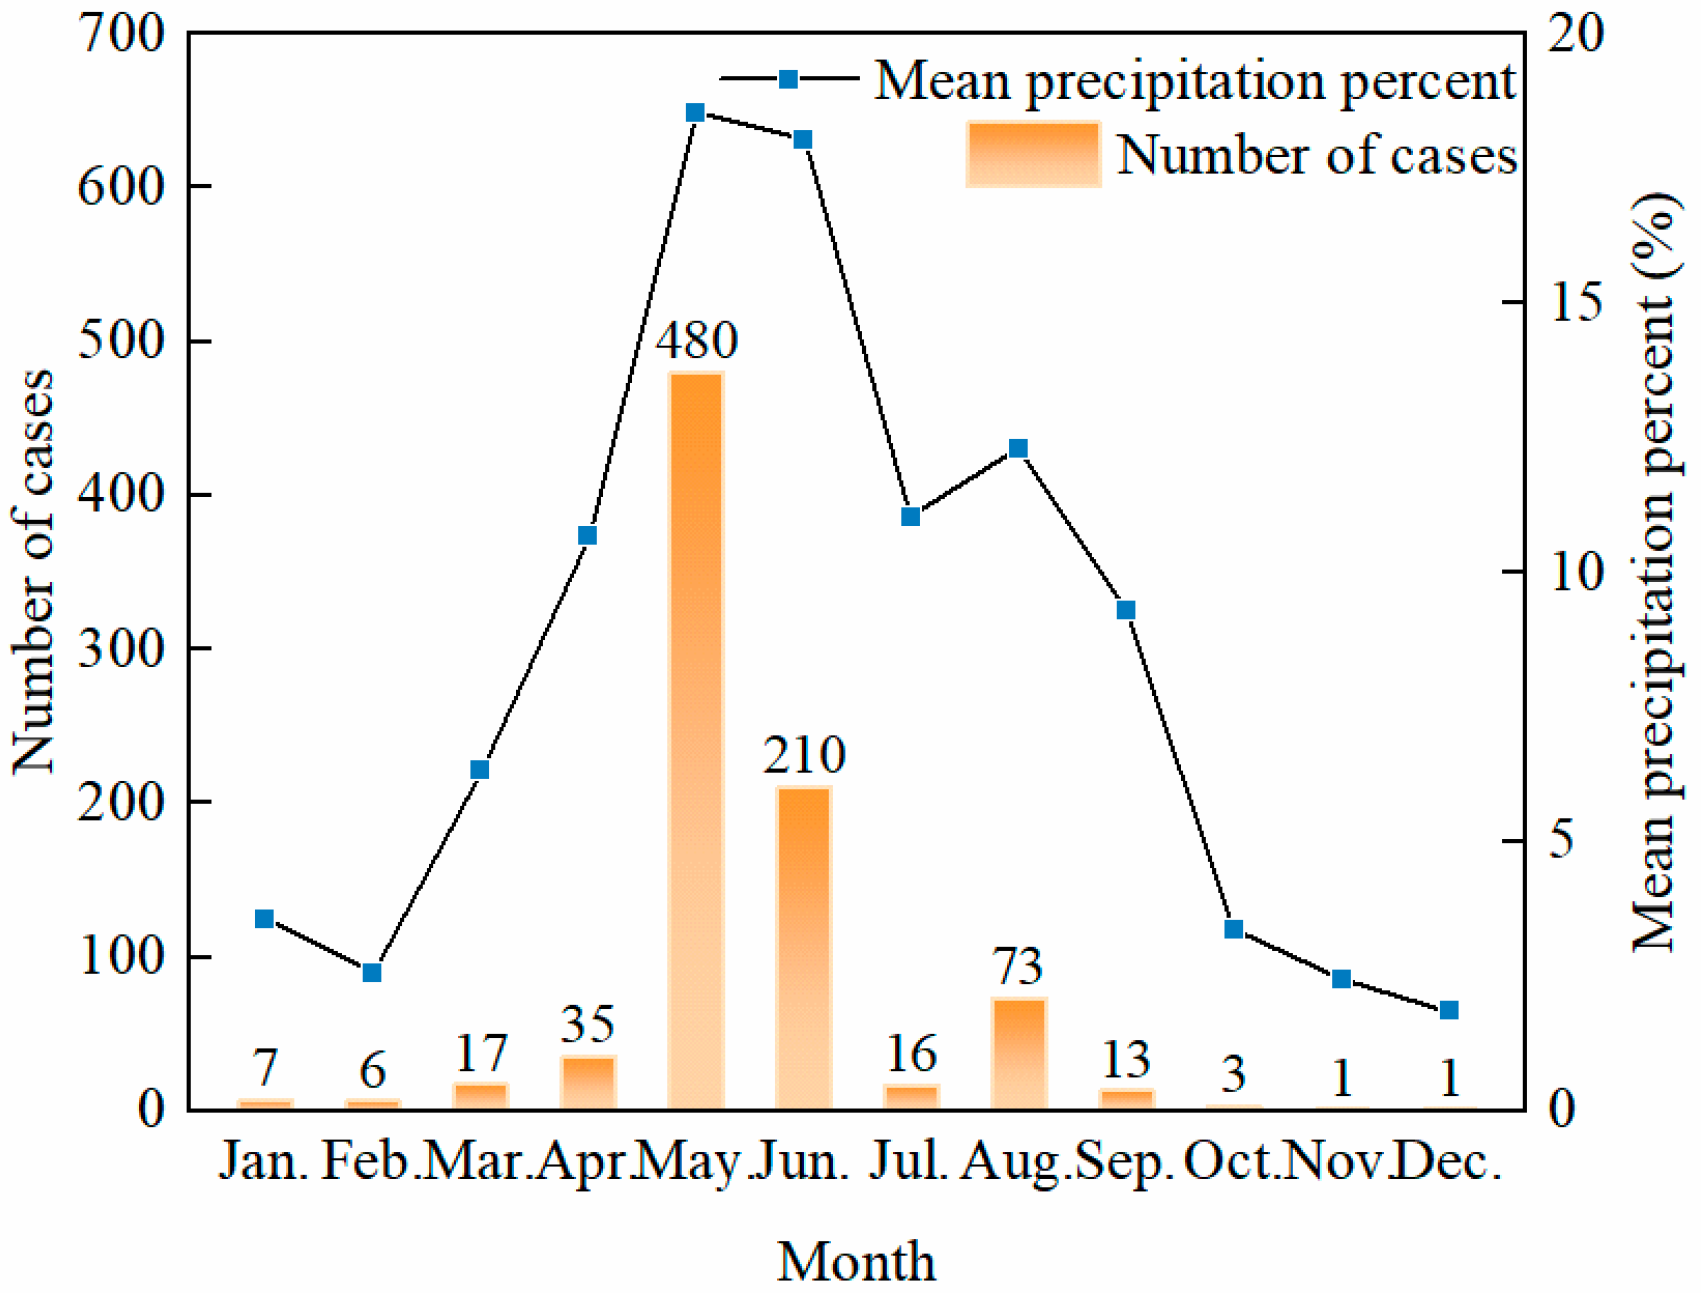
Figure 3 shows the monthly frequency of the 766 shallow landslides. The highest number of cases was found in May with 480 cases. This was followed by June and August when 210 and 73 cases were recorded respectively. Fewer landslides were detected in the remaining months, with less than 10 cases in January, February, October, November, and December. The trend in the number of landslide occurrences follows the same distribution as the average monthly rainfall for each year, and both trends display a high correlation. The frontal rainfall season from April to June and the tropical cyclone storm season from July to September each year in Guangzhou City bring large amounts of rainfall to the study area. The annual rainfall from April to September accounts for 82% of the annual rainfall, while at the same time, the number of shallow landslides accounts for 95.94% of all landslides during the same time.
3.3. Rainfall Data Analysis
3.3.1. Definition of a Landslide–Triggering Rainfall Event
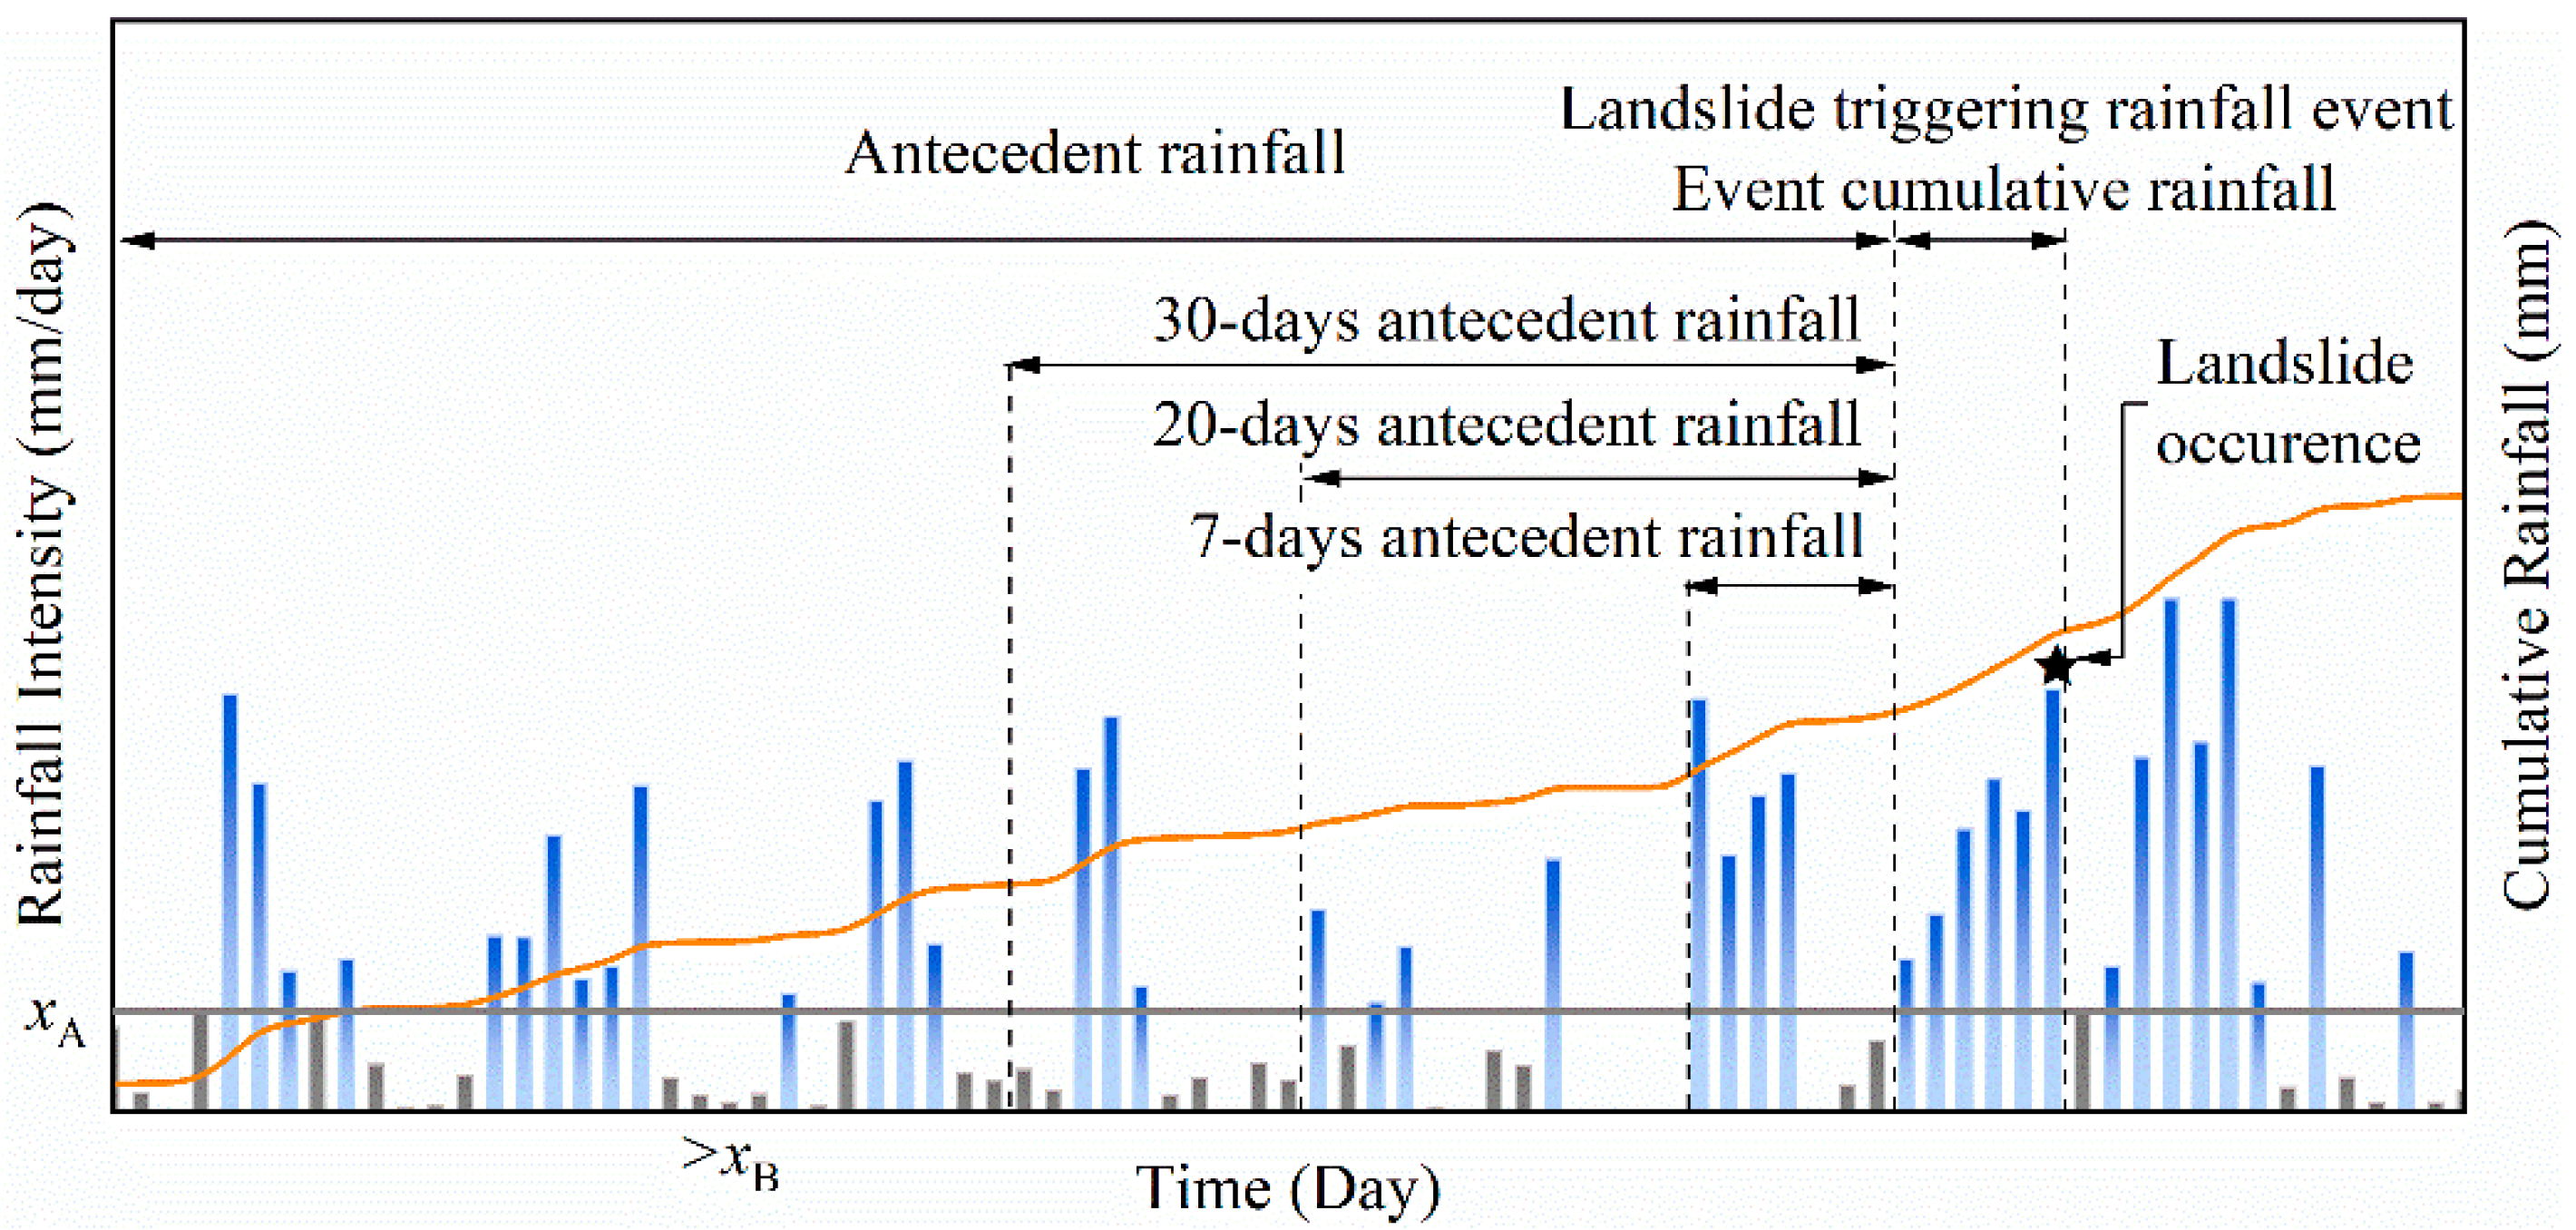
A rainfall event that triggers a landslide is defined as an independent event that occurs in a continuous process from the beginning of rainfall to the occurrence of a landslide. To study the relationship between rainfall events and landslides, it is first necessary to determine the criteria for dividing two consecutive rainfall events. The criterion used to distinguish between two consecutive rainfall events in this study is shown in Figure 4, defined by two parameters, rainfall intensity, and rainfall duration. Two consecutive rainfall events are considered to have occurred if the rainfall intensity is not greater than xA mm/day for at least xB consecutive days. Conversely, if the rainfall intensity and duration do not meet the criteria during a consecutive period, it is considered one continuous rainfall event. Determining an appropriate criterion for consecutive rainfall events is critical for establishing a rainfall threshold that triggers landslides. A larger rainfall intensity threshold xA and longer rainfall duration xB may result in some consecutive rainfall periods being rejected, while a smaller rainfall intensity threshold xA and a longer period of rainfall duration xB may make the rainfall event last too long, resulting in the defined rainfall event containing several independent rainfall events. Gariano, et al. [41] selected a continuous daily rainfall of 0 mm/day for both 48 and 96 h as a criterion for the division of dry and rainy seasons in Sicily, southern Italy, respectively [42]. Salee, et al. [27] conducted a study for a series of combinations of rainfall intensity and rainfall duration and finally selected rainfall intensity of no more than 2 mm/day and duration of not less than 1 day as the definition criteria for classifying two consecutive rainfall events in southern Thailand. Therefore, concerning the previous definitions adopted for domestic and foreign study areas [25,32], a rainfall event triggering a landslide was defined as a rainfall intensity of not more than 1 mm/day for at least 1 consecutive day. The rainfall parameters for landslide events were calculated based on the definition of rainfall events, i.e., rainfall event duration (D, in h), cumulative rainfall (E, in mm), and average rainfall intensity (I, in mm/h).
3.3.2. Rainfall Threshold Analysis
The E–D rainfall threshold equation is expressed as follows.
where D is the duration from rainfall onset to landslide occurrence, α and γ are the intercept and slope of the power function curve calculated by quantile regression, respectively, and E is the cumulative rainfall within that rainfall event. For each landslide event, Equation (1) can be logarithmically transformed into a linear equation, and the E–D curves are plotted in double logarithmic planes as follows.
E = αDγ
log10(E) = log10(α) + γ log10(D)
To calculate the E–D thresholds for landslides, quantile regression is used in this study, as well as the corresponding package, “quantreg”, which is available for R software [43]. The quantile is considered a threshold value, and the effect of different quantile regressions corresponds to the value of the random variable with the corresponding probability in the study interval. According to He, et al. [32] and Jiang, et al. [34], the landslide warning system can issue different levels of warning information based on the cumulative rainfall and the calendar time of the current rainfall event recorded at each rainfall station. The probability levels are classified as 5%, 20%, and 50%; for example, a 5% threshold curve indicates that the probability of landslides caused by rainfall events below the 5% threshold curve is less than 5%. When the 5–20% probability level is reached, “Alert” will be issued, the 20–50% probability level will issue “Warning”, and the above 50% probability level will issue “Evacuation”. In this paper, we calculated the interquartile regression lines at the 5%, 20%, and 50% levels to determine the rainfall threshold.
Due to the differences in climate, stratigraphic lithology, and geomorphology in different study areas, normalizing rainfall can describe the overall rainfall pattern in the study area and can reduce the uncertainty in the comparison of rainfall thresholds in different regions [44]. Geological, environmental, or human factors may also contribute to landslide formation, which may result in lower rainfall thresholds. Therefore, a credible normalized threshold can be developed by normalizing the rainfall intensity and cumulative rainfall of each triggering landslide rainfall event with the MAP.
The study of the relationship between landslide occurrence and preliminary rainfall is very important. Cumulative effective rainfall is the amount of rainfall that enters the geotechnical body at the preliminary stage and remains there all the time and contributes to landslide development. To evaluate the influence of the preliminary rainfall on triggering shallow landslides, we used the following formula to analyse the cumulative antecedent rainfall for 3, 5, 7, 10, 20, and 30 days before the landslide event.
where AARxn is the accumulative antecedent rainfall on the day of the landslide-triggering event xn, R1 is the daily rainfall on the day before the landslide-triggering event, and Rn is the daily rainfall of the first n day before the landslide-triggering event.
AARxn = R1 + R2+ … + Rn
4. Results and Discussion
4.1. E–D Threshold
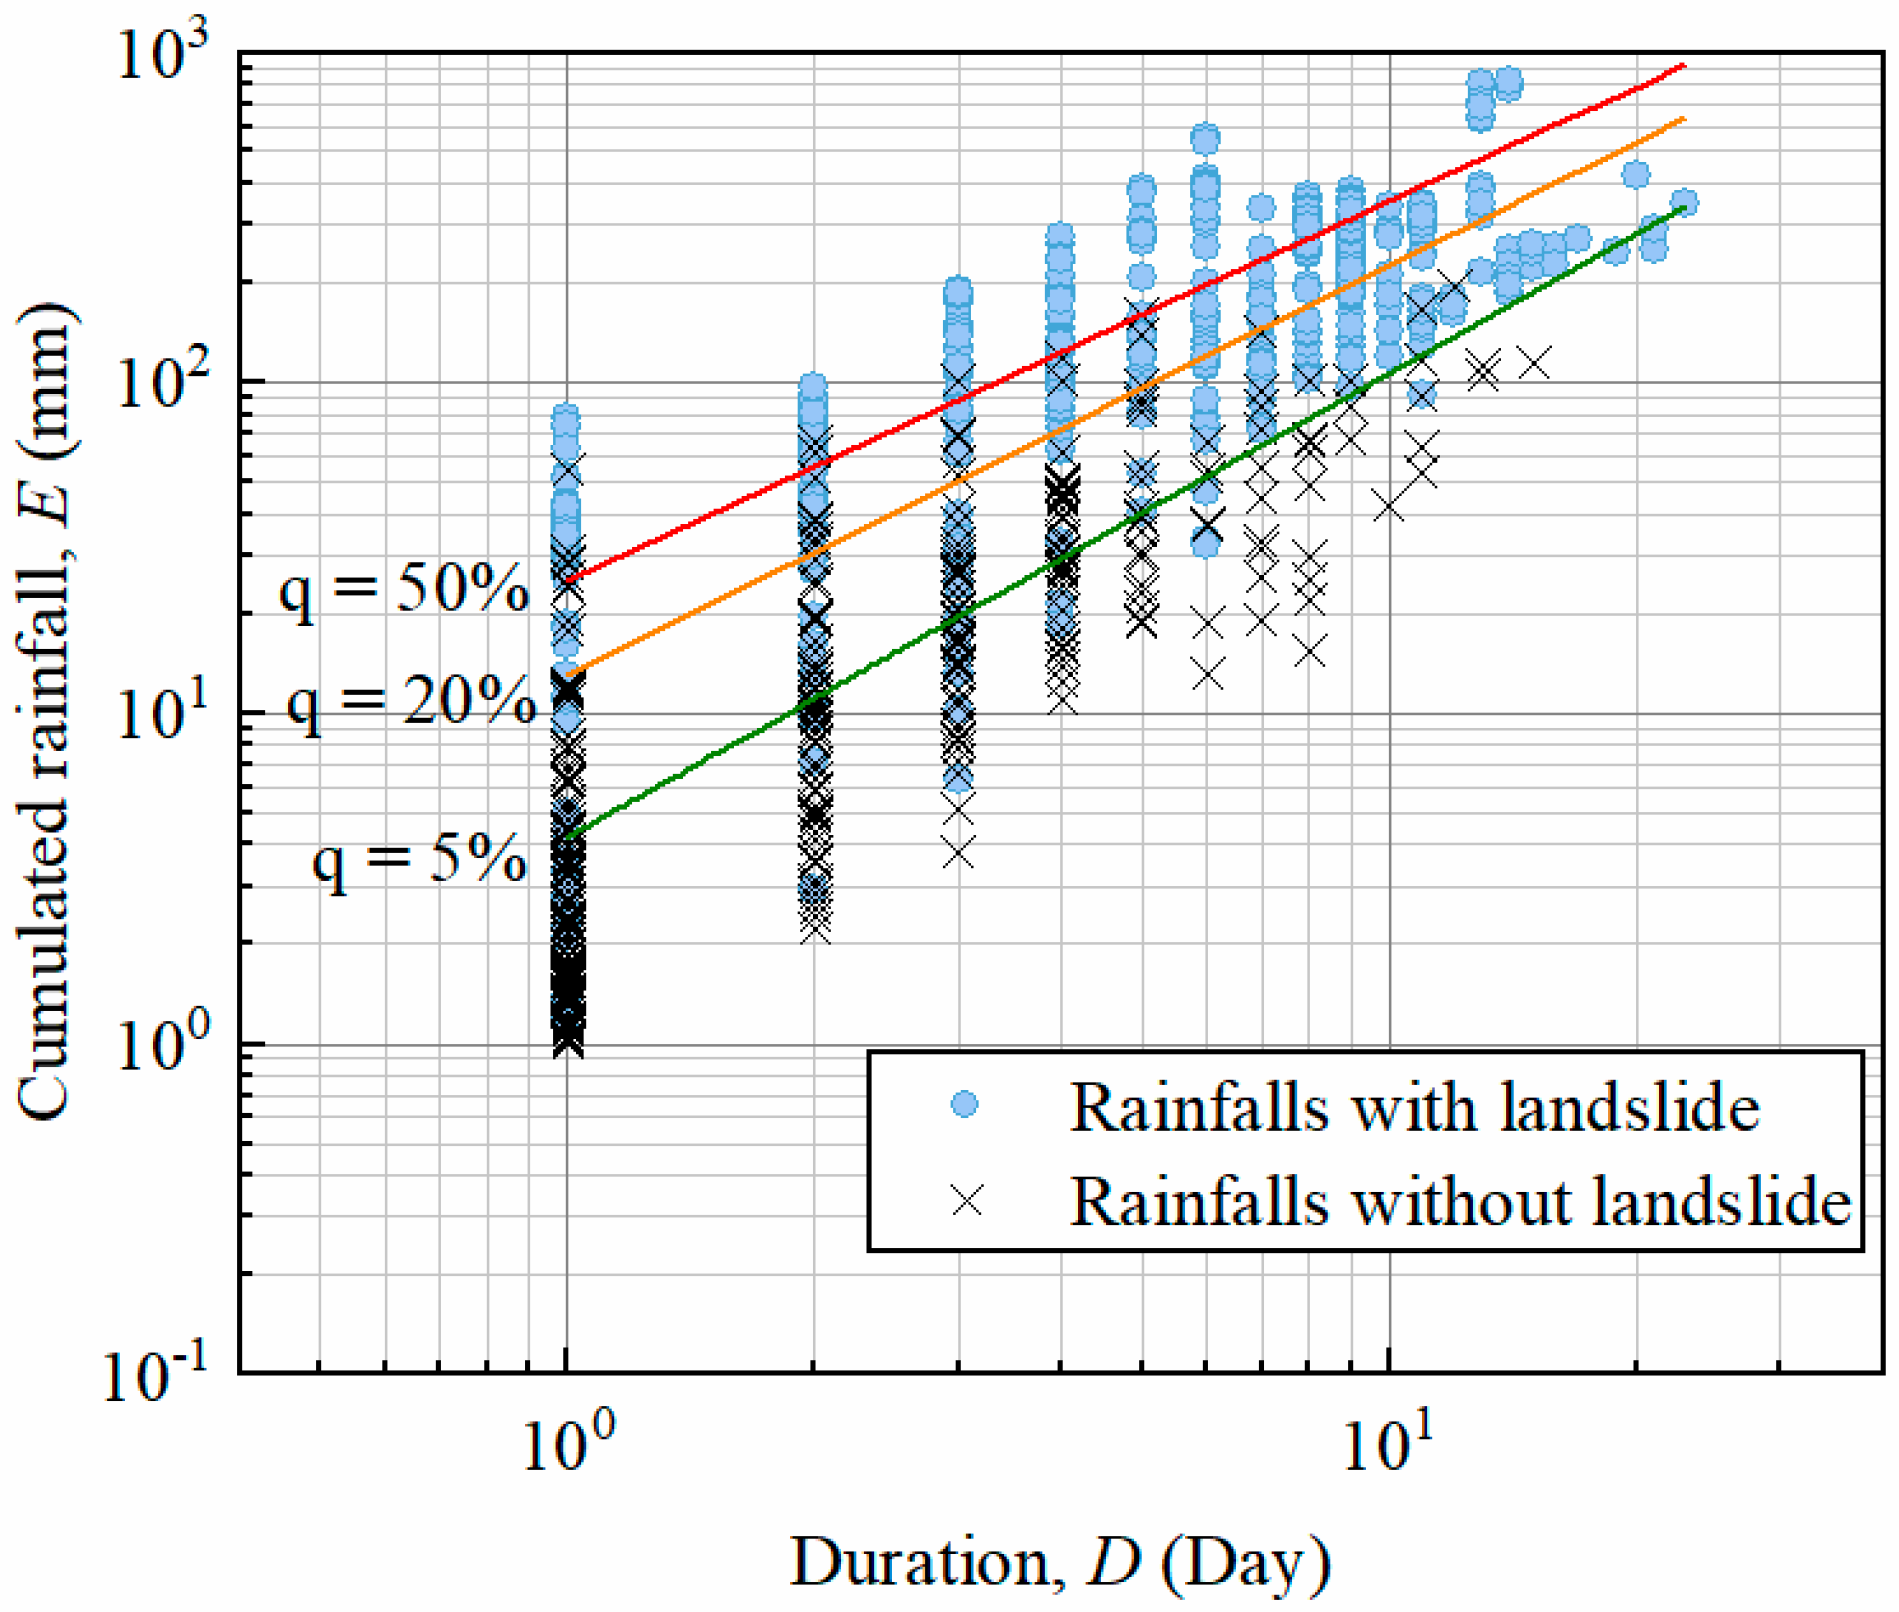
Figure 5 shows the relationship between E and D by plotting the quantile regression line between the two in a double logarithmic coordinate system, with D triggering a shallow landslide ranges from 1 to 23 days. The fitted curves determined by the 5% quantile regression for the E–D threshold are E = 4.22D1.46, the fitted curve determined by the 20% quantile regression is E = 13.11D1.25, and the fitted curve determined by the 50% quantile regression is E = 25.34D1.15.
Taking the 5% probability threshold as an example, a landslide may be triggered when the rainfall event lasts for only 1 day and the cumulative rainfall reaches 4.20 mm on that day or when the duration reaches 23 days and the cumulative rainfall reaches 338.59 mm or more.
4.2. EMAP–D Threshold
The cumulative rainfall was normalized by MAP considering the difference in MAP in Guangzhou city. Figure 6 shows the EMAP–D relationship for the historical landslide time in Guangzhou city. The fitted curves determined by the regression of the 5% quantile of the EMAP–D threshold are E = 0.0025D1.48, the fitted curves determined by the regression of the 20% quantile are E = 0.0062D1.35, and the fitted curves determined by the regression of the 50% quantile are E = 0.0121D1.25.
According to the 5% probability threshold, landslides are likely to be triggered when the cumulative daily rainfall accounts for 0.2% of the annual average rainfall or when the duration reaches 23 days and the cumulative rainfall reaches more than 20.93% of the annual average rainfall.
4.3. The Threshold for Lithological Categories
To study the sensitivity to historical landslides in different lithological areas of Guangzhou, we used the 1:200,000 geological map from the National Geological Archives of China. We reclassified 63 rock units of different formation ages and lithologies into five lithological groups (Table 1): extrusive, metamorphic, intrusive, clastic, and carbonate rocks. Figure 2 shows the location of historical landslides in relation to the five lithological groups, with the largest number of landslides occurring within the intrusive rock unit (550 of 766), 87 in the metamorphic rock unit, 76 in the clastic rock unit, 37 in the extrusive rock unit, and 16 in the carbonate rock unit. Overall, 71.8% of the landslides occurred in the intrusive rock unit area, which accounts for 55.07% of the total area of Guangzhou, with a landslide density of 13.68 landslides per 100 km2. Similarly, the landslide densities in the ejecta, metamorphic, clastic, red clastic, and carbonate rock units were 3.54, 13.43, 6.68, and 3.58 landslides per 100 km2, respectively. The maximum difference in landslide density within different lithological units is nearly 10 times, which proves that there are differences in the influence of different lithologies on landslide-triggering conditions.
Granites are very sensitive to weathering; therefore, there are numerous records of shallow landslides in weathered granites in tropical and humid regions. A large number of loose, medium, and coarse-grained granite landslides triggered by heavy rainfall in Hiroshima Prefecture, Japan, resulted in 20 casualties in 1999 [45]. Studies in peninsular Malaysia have found that 65% of historical landslides are associated with igneous rocks, of which granite is a major component [25]. Some investigations found prominent clusters of landslides in the surface zone of residual granitic soil layer slopes in the southeastern coastal provinces of China [46]. A four-day cumulative 281.3 mm rainfall event from 10–13 June 2019, in Longchuan County, Guangdong Province, China, resulted in a cluster of landslides in the residual granitic soil area [47].
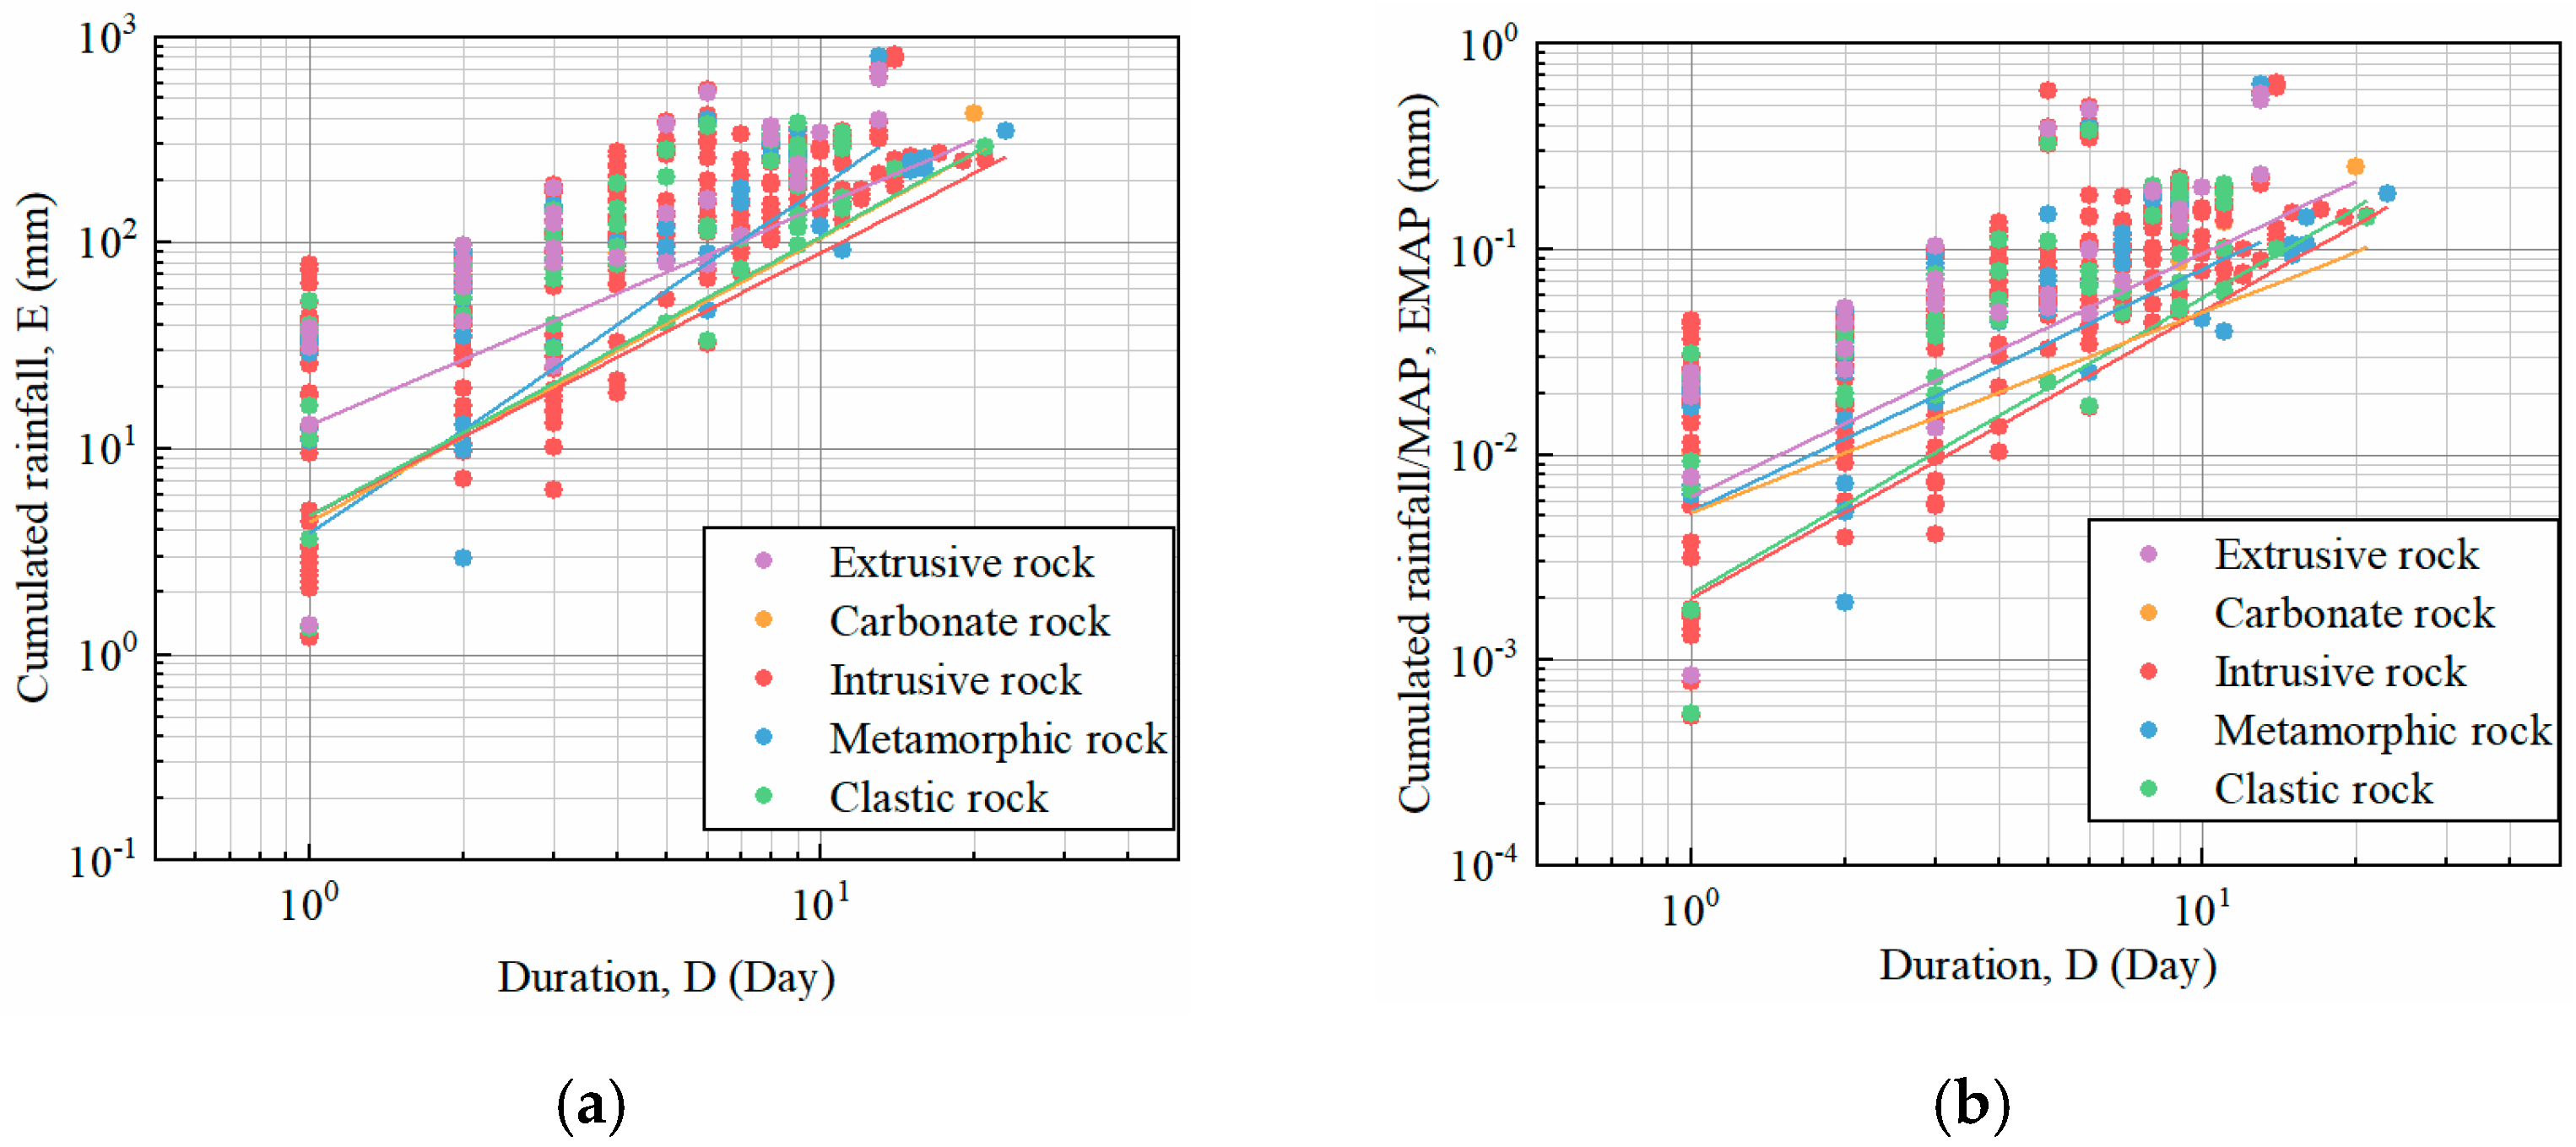
Figure 7a,b show the E–D and EMAP–D rainfall thresholds for each lithological unit at the corresponding 5% quantile in logarithmic coordinates. The shortest range of duration (D) is from 1 to 13 days for the extrusive unit, and the longest range is from 1 to 23 days for the metamorphic unit. The coefficients of intercept α and slope γ at 5% level of quantile regression lines are listed in Table 2. The results show the differences in the rainfall threshold for landslide triggering among the different lithological units, with carbonate rock having the highest threshold, followed by extrusive rock, clastic rock, and intrusive rock, and metamorphic rock having the lowest threshold. Due to the small number of landslides meeting the conditions for extrusive and carbonate rock units, the uncertainties of the fitted parameters are high, and the thresholds for these units cannot be considered significant. For a more reliable threshold, more historical landslides in these lithological regions are needed. Considering the high density of landslides occurring in granite areas and the low rainfall threshold of landslides in metamorphic rock units, landslide vigilance in intrusive rock units and metamorphic rock units should be increased to mitigate the risk of loss.
4.4. Impact of Antecedent Rainfall on Landslides
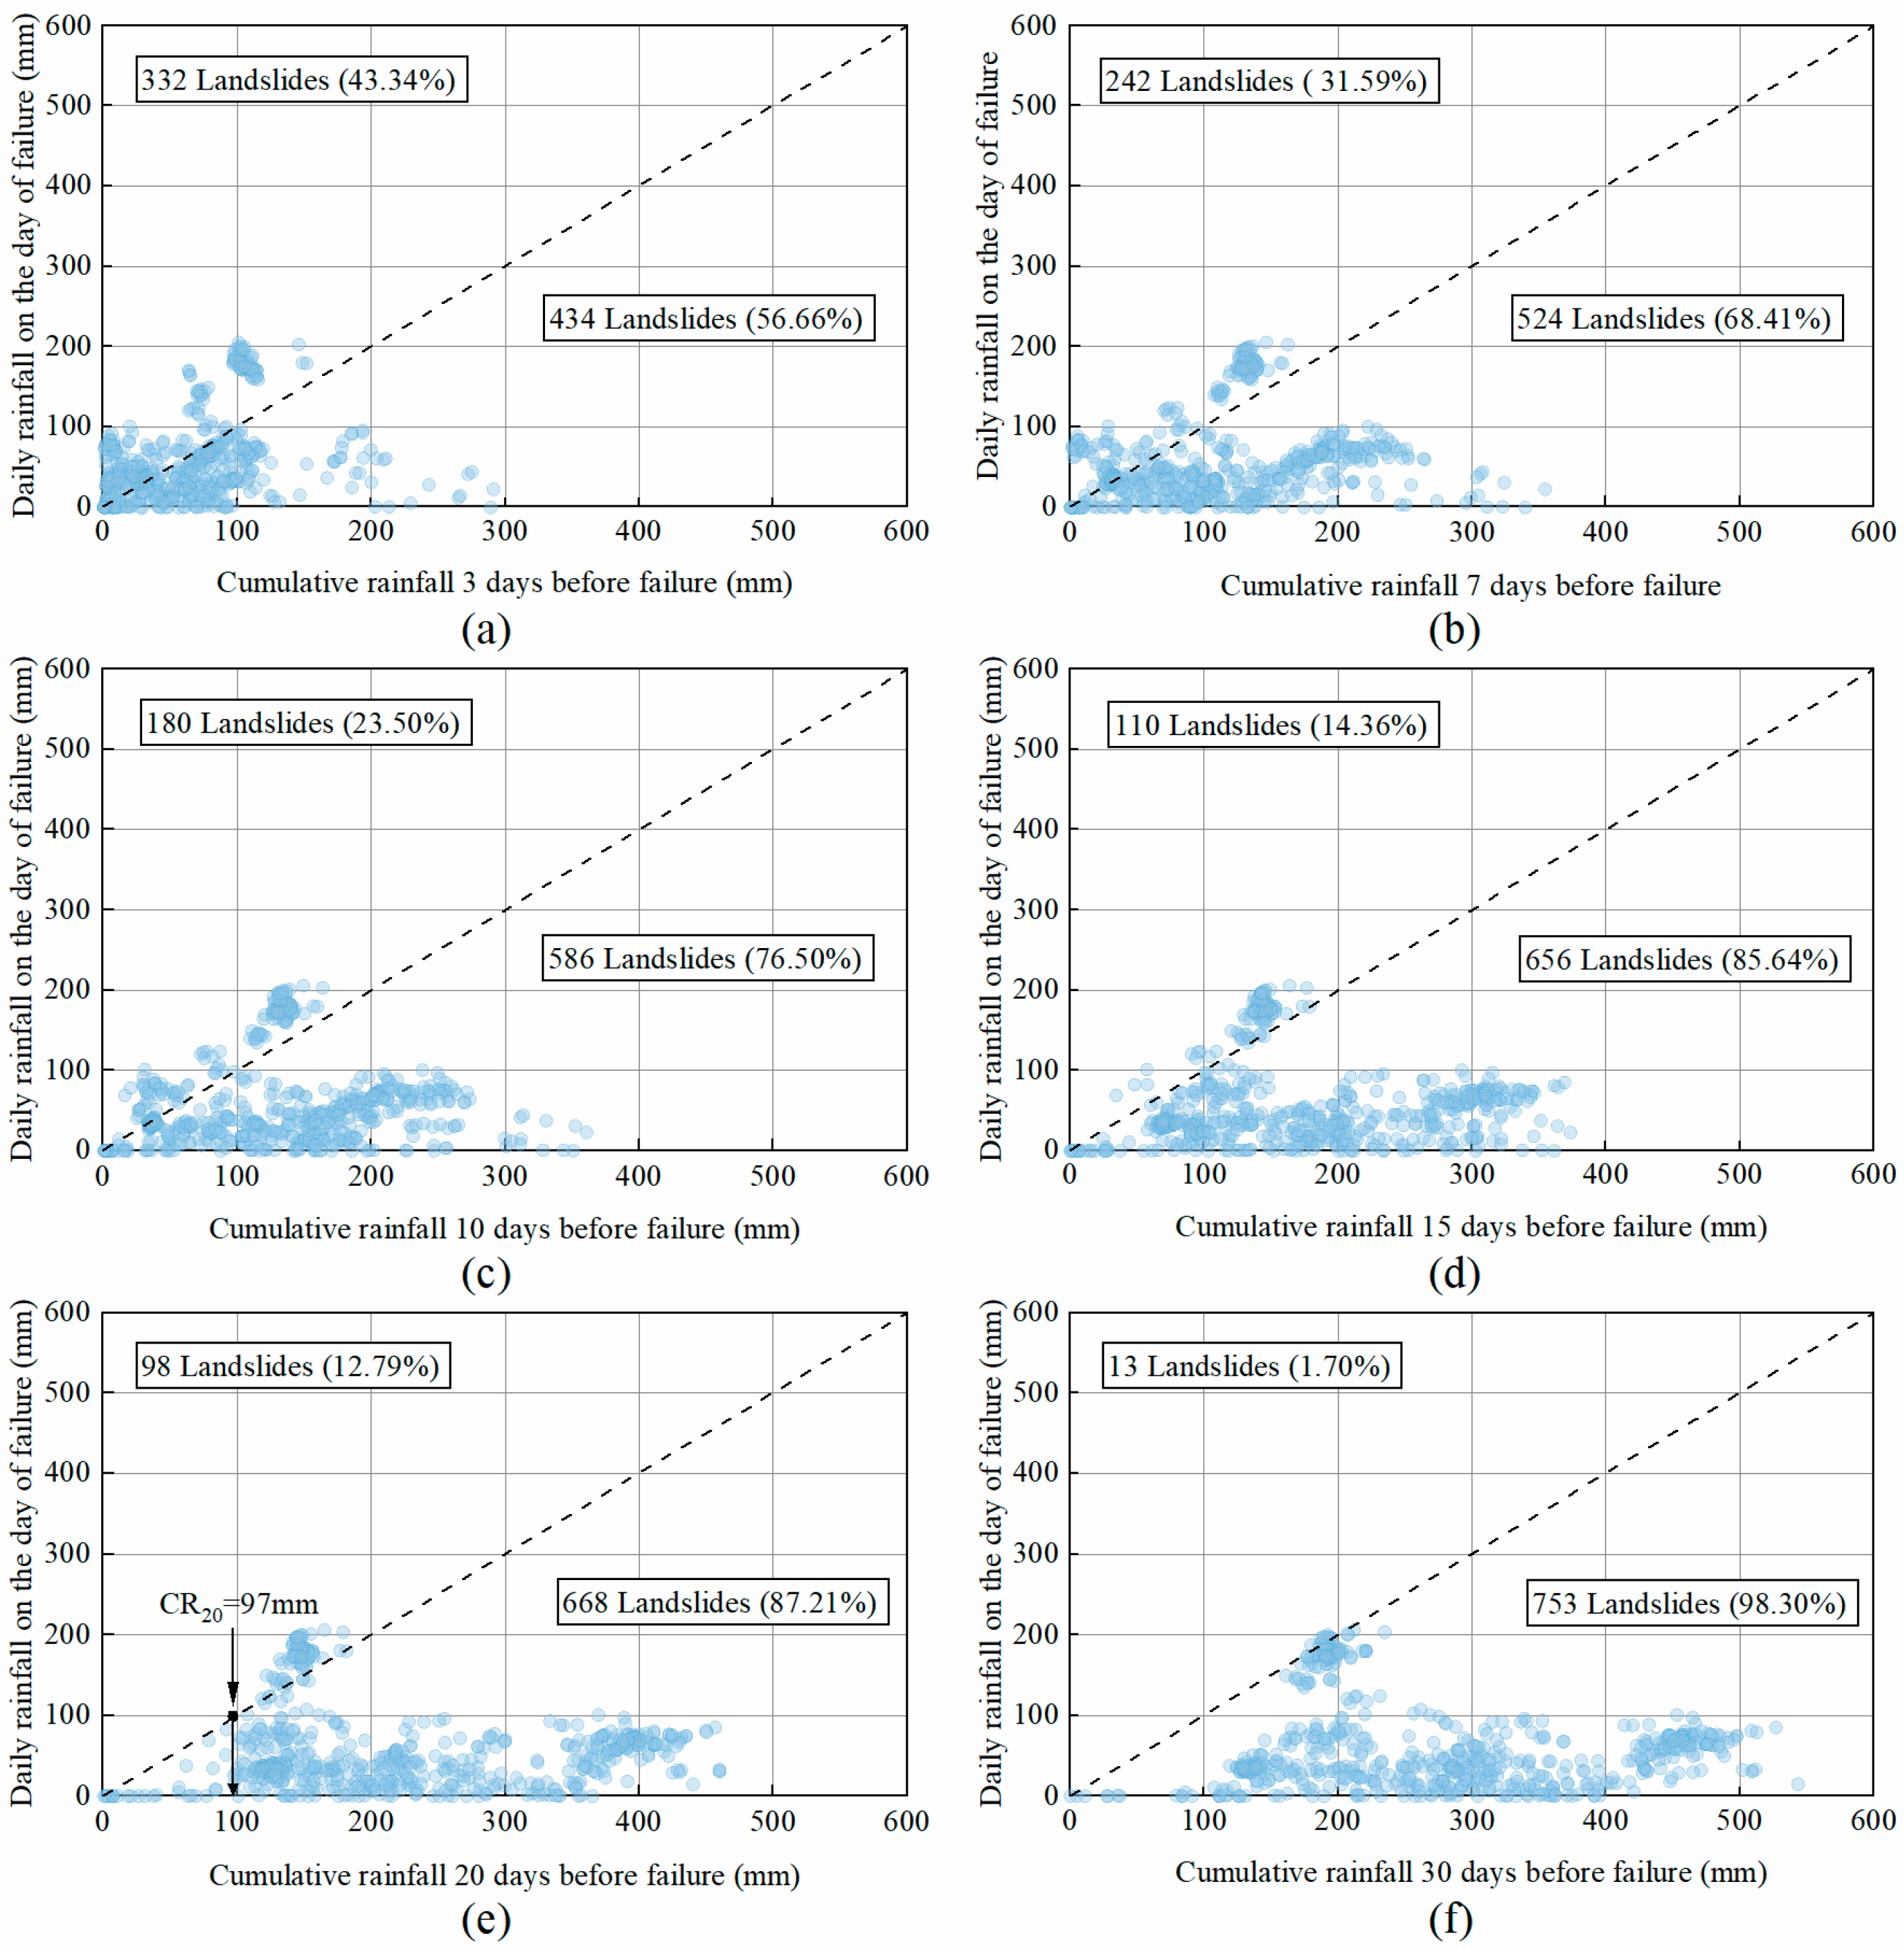
Figure 8 shows the scatter plot of daily rainfall on the day of landslide occurrence against the cumulative rainfall of various days (3, 7, 10, 15, 20, and 30 days) before a landslide to observe the impact of the antecedent rainfall. A diagonal line is used to separate the plot into two regions to distinguish the impact of rainfall on the day of the landslide event from the cumulative rainfall in the antecedent period in the scatter plot. The occurrence of landslides is more influenced by the daily rainfall if the landslide event is biased towards the y-axis; otherwise, they are assumed to occur due to the impact of antecedent rainfall if the landslide event is biasedly approaching the x-axis. According to the results shown in Figure 8a, 43.34% of the 766 landslide cases were influenced by daily rainfall, while the remaining 56.66% of the landslide events were influenced by the 3-day antecedent rainfall. Subsequently, the landslides affected by intraday rainfall gradually decreased to 31.59%, 23.50%, 14.36%, 12.79%, and 1.7% for 7, 10, 15, 20, and 30 days, respectively, while the landslides affected by antecedent rainfall in the corresponding periods gradually increased to 68.41%, 76.50%, 85.64%, 87.21%, and 98.30%, respectively. According to the results, the percentage of daily rainfall at landslide sites decreased abruptly for the 3 and 7 days before (from 43.34% to 31.59%) and for the 10 and 15 days before (from 23.50% to 14.36%). Considering the effect of daily rainfall and 20 days of antecedent rainfall, 12.79% of the historical landslides were still greatly affected by daily rainfall, which received more rainfall than the cumulative rainfall in the previous 20 days. The longer period of a 30-day antecedent rainfall was almost all biased towards the influence of the earlier precipitation on landslides. After critically analysing the relationship between rainfall patterns and triggered landslides, it can be assumed that 1 to 10 days of continuous antecedent rainfall has a significant effect on shallow landslides in Guangzhou. Therefore, both antecedent rainfall and short-term intense rainfall can mutually contribute to the occurrence of shallow landslides.
In Figure 8e, the number of landslides with 20-day cumulative rainfall greater than 97 mm accounted for 95.82% of the total, an increase of nearly 20% compared to Figure 8d, where 15-day cumulative rainfall greater than 97 mm accounted for 76.37% of the total. Moreover, the number of landslides with 30-day cumulative rainfall greater than 97 mm accounted for only an increase of less than 3% compared with 20-day cumulative rainfall. Therefore, a 20-day cumulative rainfall of 97 mm was an indicator that could potentially be used as a landslide threshold in the study area.
4.5. CED Threshold
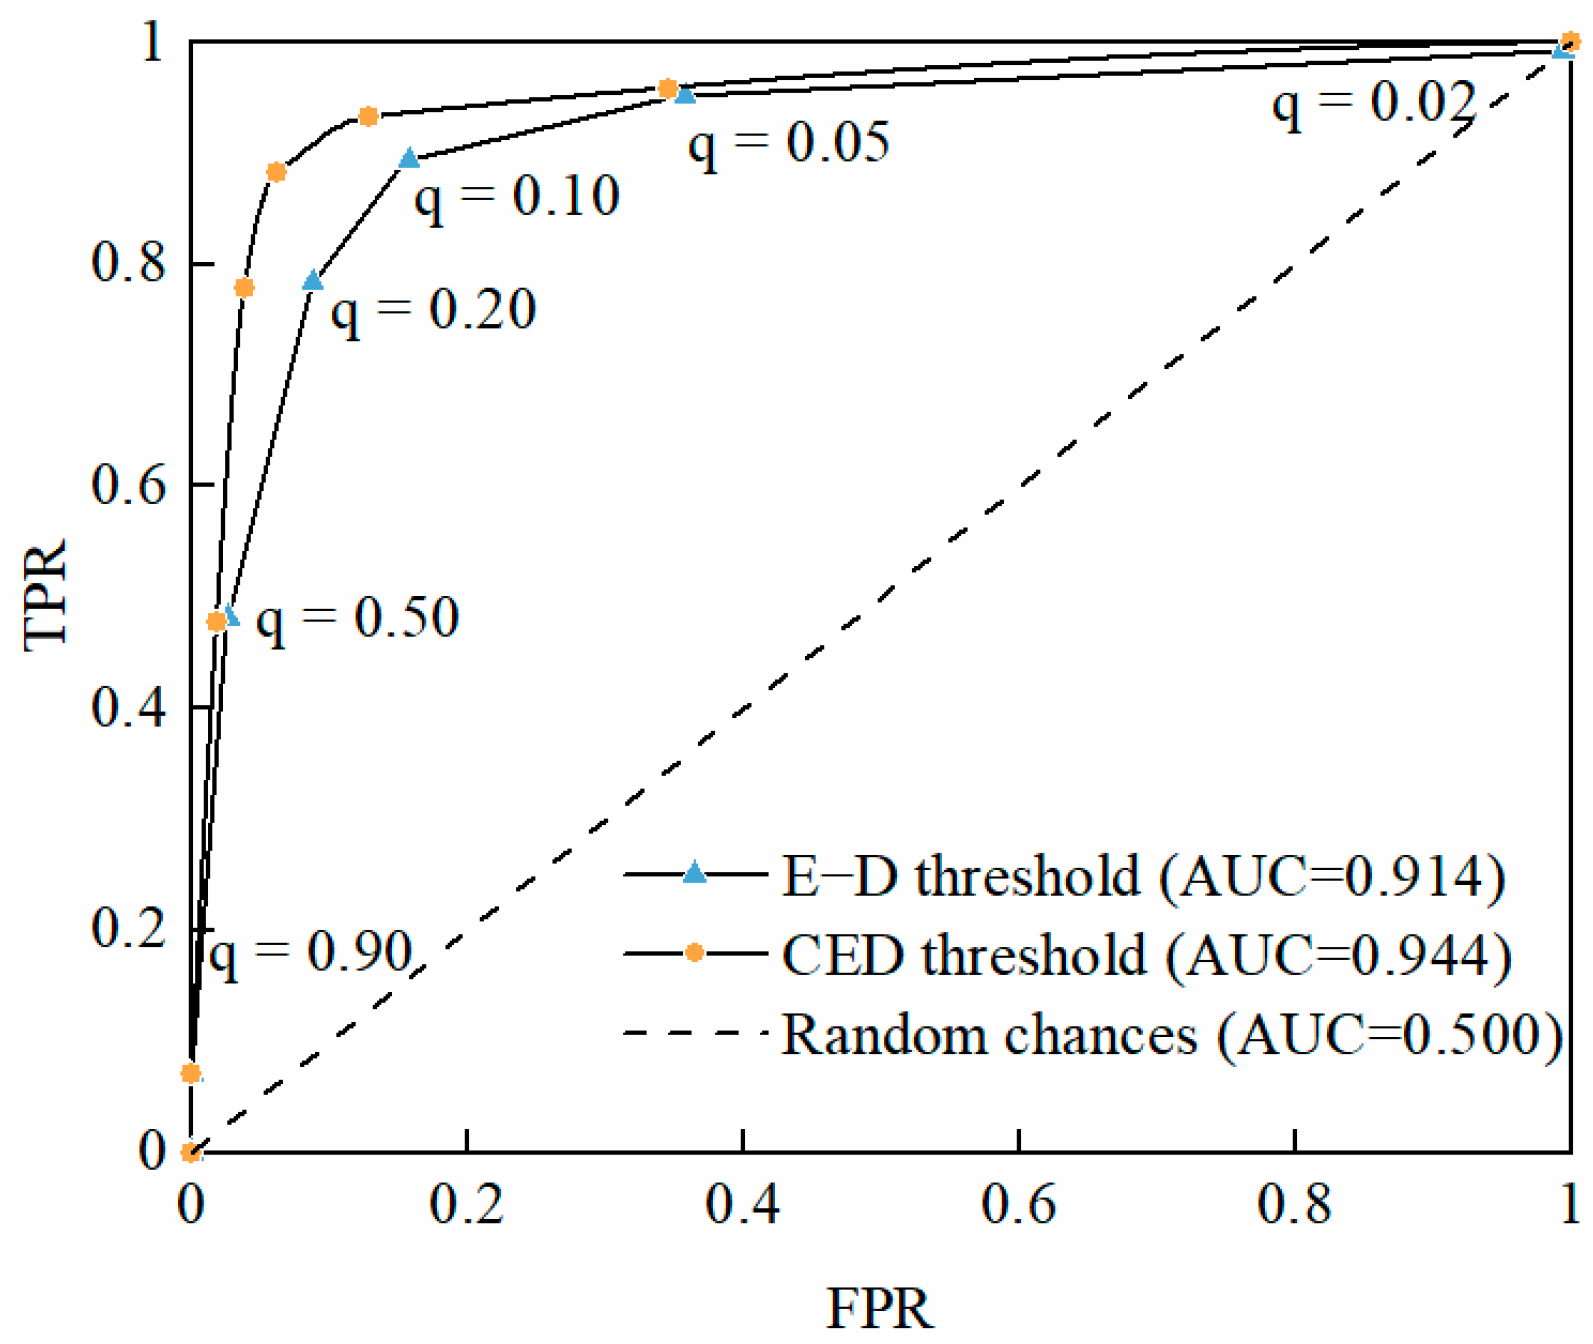
The performance of the thresholds was assessed by analysing the confusion matrix, skill scores, and receiver operating characteristic (ROC) curves. The confusion matrix consisted of four scenarios, including true-positive (TP, correctly predicted rainfall events that triggered landslides), true-negative (TN, correctly predicted rainfall events that did not trigger landslides), false-positive (FP, predicted rainfall events that could have triggered landslides but did not), and false-negative (FN, landslides occurred in the absence of a prediction). Skill scores include the true-positive rate (TPR) and false-positive rate (FPR), which are calculated according to Formulas (4) and (5), respectively. The best prediction is the one with a TPR (y-axis) of 1 and an FPR (x-axis) of 0. The closer the prediction is to the upper left, the better the threshold prediction performance at the corresponding quartile level. The ROC for different quantile-level rainfall thresholds can be plotted on the same graph. The area under the ROC curve (AUC) was calculated, and the larger the AUC was, the better the prediction ability.
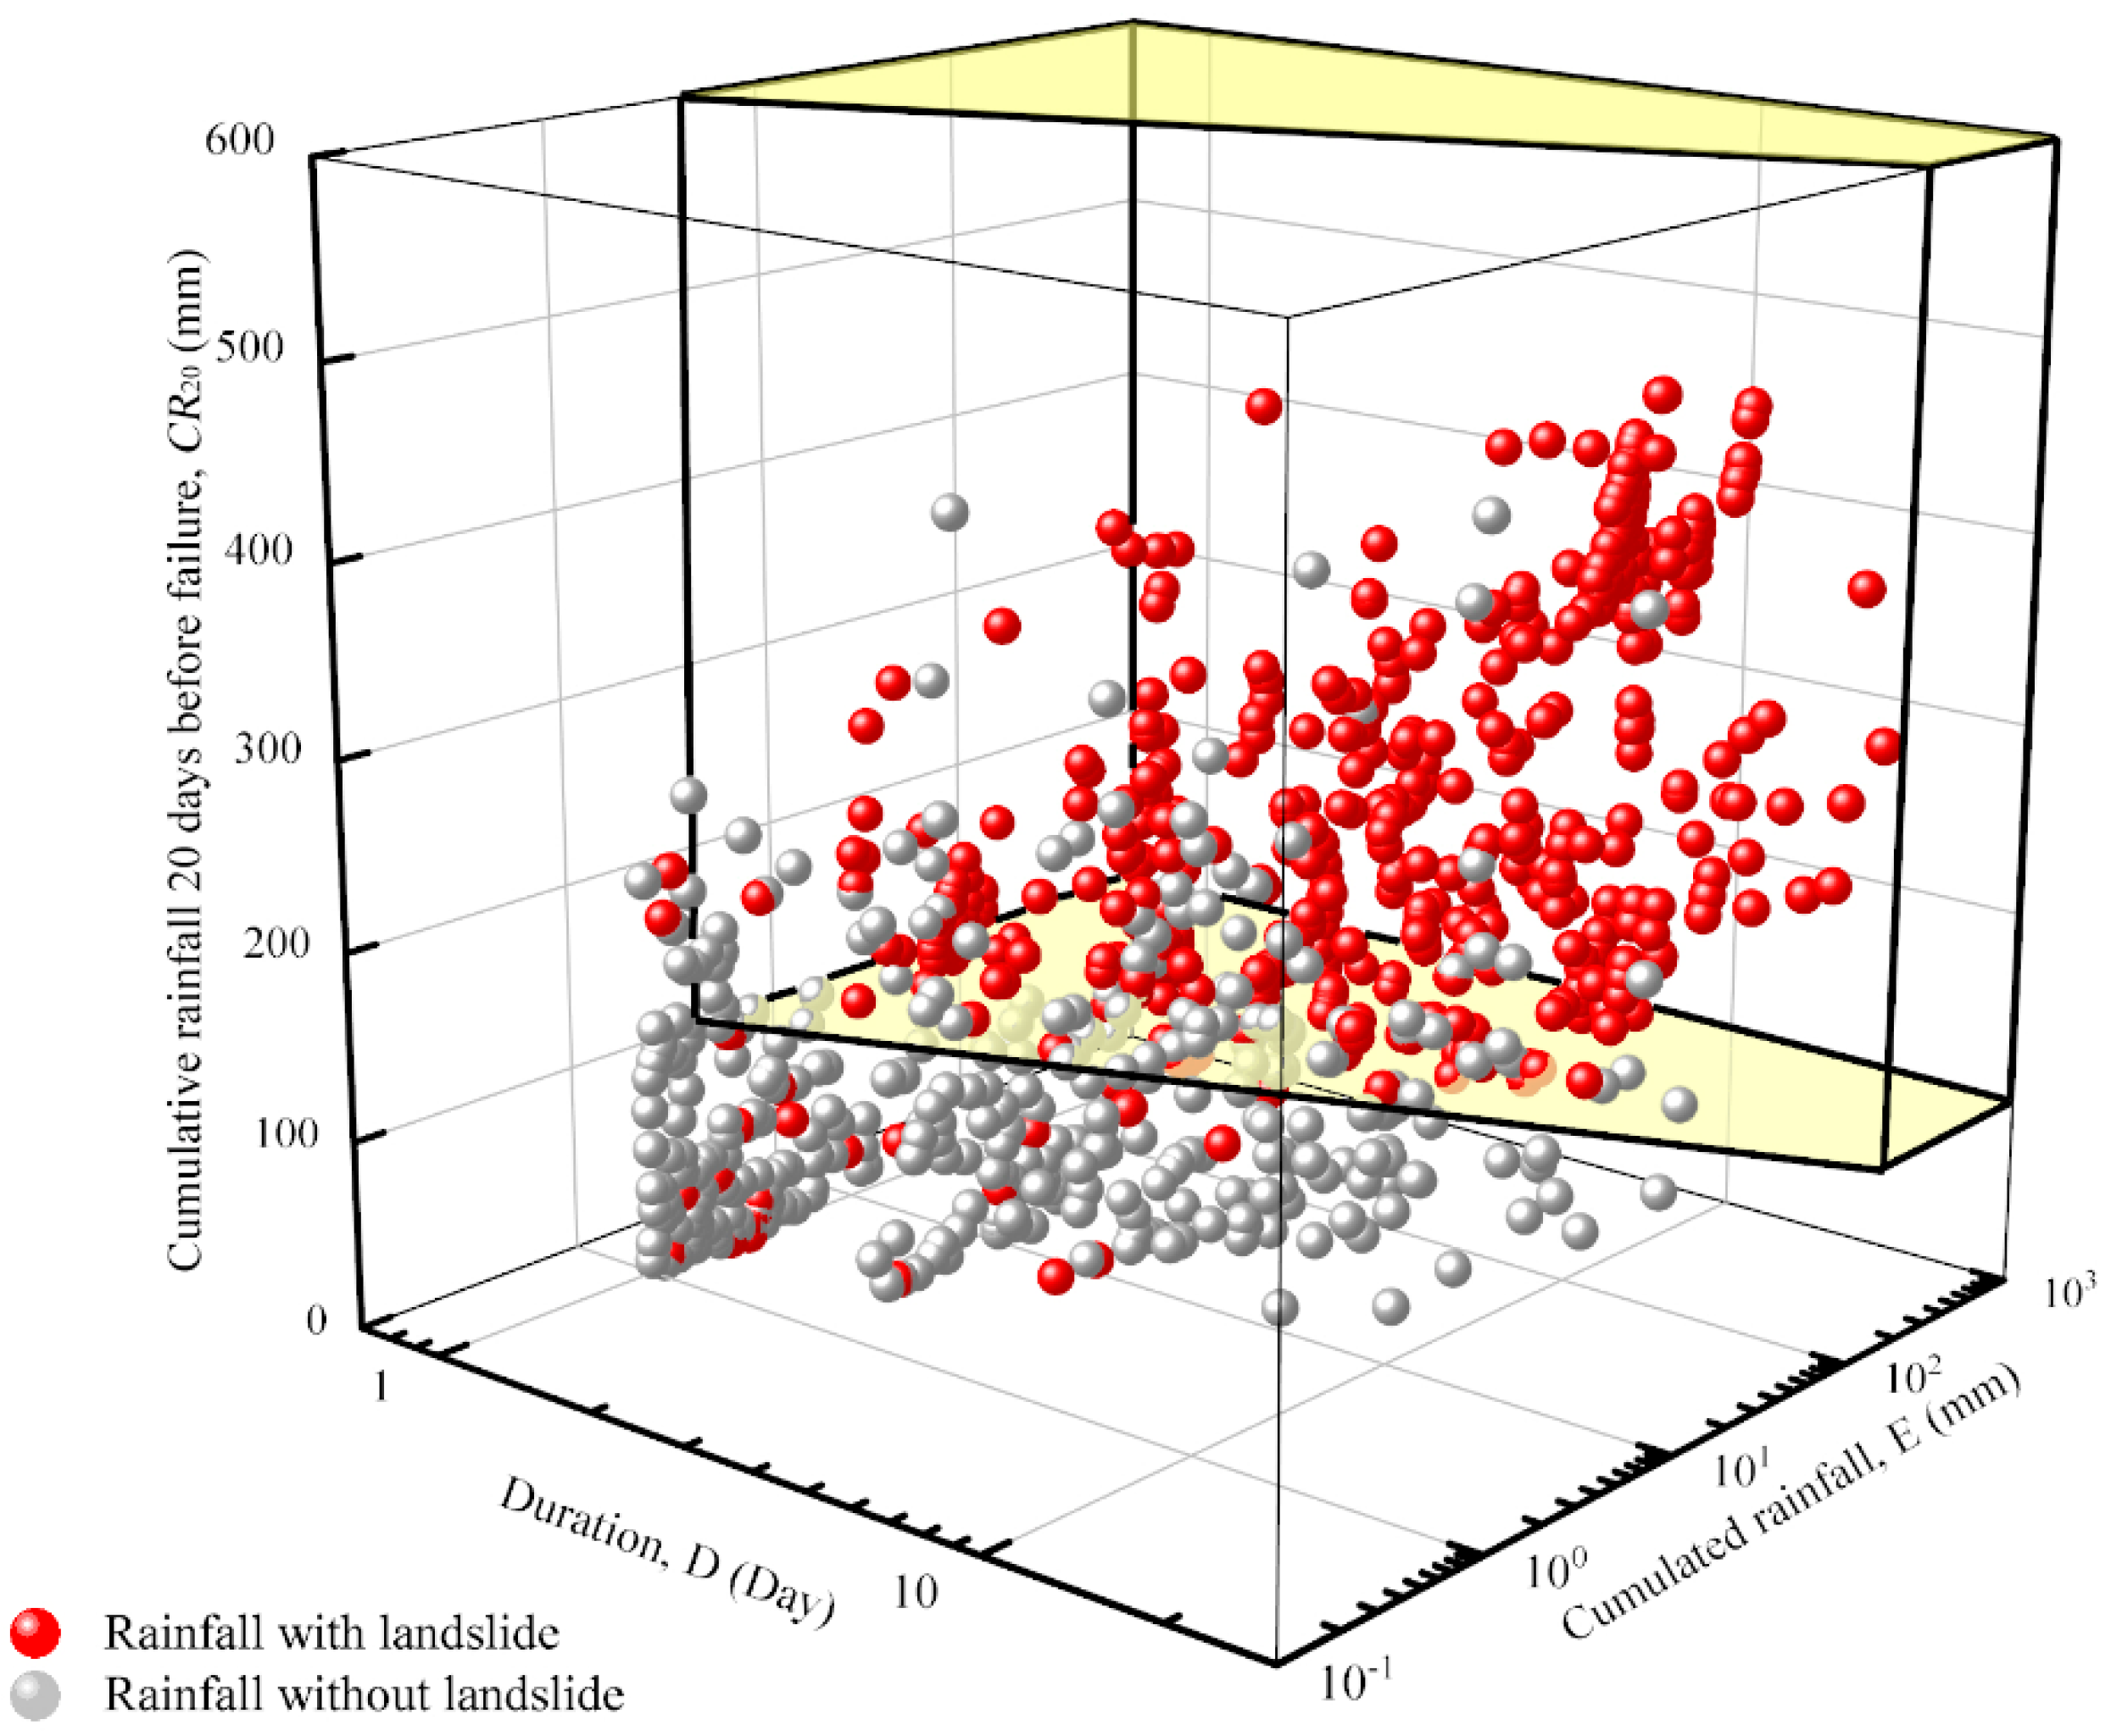
After the previous analysis, the landslide is significantly influenced by the previous rainfall. As can be seen from the Figure 5 and Figure 6, the traditional E–D threshold and EMAP–D threshold have more false alarms for rainfall events that do not trigger a landslide, especially when the quantile level q is small. To reduce the FPR of the thresholds, the 20 days of antecedent rainfall is integrated into the E–D threshold. For this purpose, the threshold consisting of three rainfall variables, CR20, E, and D, is named the CED threshold. The CED threshold is an independent parameter to the E–D threshold to isolate rainfall without a landslide. Based on the E–D threshold, the z-axis is added to be set as CR20, and the area where the E–D threshold moves 97 mm and above along the z-axis is defined as the warning area. For this purpose, CR20, E, and D are plotted in 3D space, and the area shaded in yellow in Figure 9 is the defined warning zone which can be expressed as follows.
Warning Zone = {(D, E, CR20)|E > αDγ, CR20 > 97}
The performance of the CED threshold is compared with that of the E–D threshold, and the ROC curve is given in Figure 10. The ROC curve is plotted for each rainfall event, and the points on the curve represent changes in the threshold settings. For E–D and CED thresholds, the AUC is 0.914 and 0.944, respectively, indicating that the predictive capability of CED thresholds is superior to that of E–D thresholds. Since many rainfall events with CR20 less than 97 mm were excluded from the 3D warning area, the FP was significantly lower, and the FPR generated by the CED threshold was much lower than that generated by the E–D threshold. Since 32 of the 766 landslide events had CR20 less than 97 mm, more landslide events may not satisfy CR20 greater than 97 mm under the condition of a lower probability level. Therefore, the TPR of the CED threshold at the same probability level is lower than the E–D threshold at a lower probability level, and the FPR is significantly better than the E–D threshold. At the 5% probability level, the TPR for the CED threshold and E–D threshold are 0.932 and 0.952, respectively, and the FPR are 0.128 and 0.358, respectively.
4.6. Comparison with Previous Studies
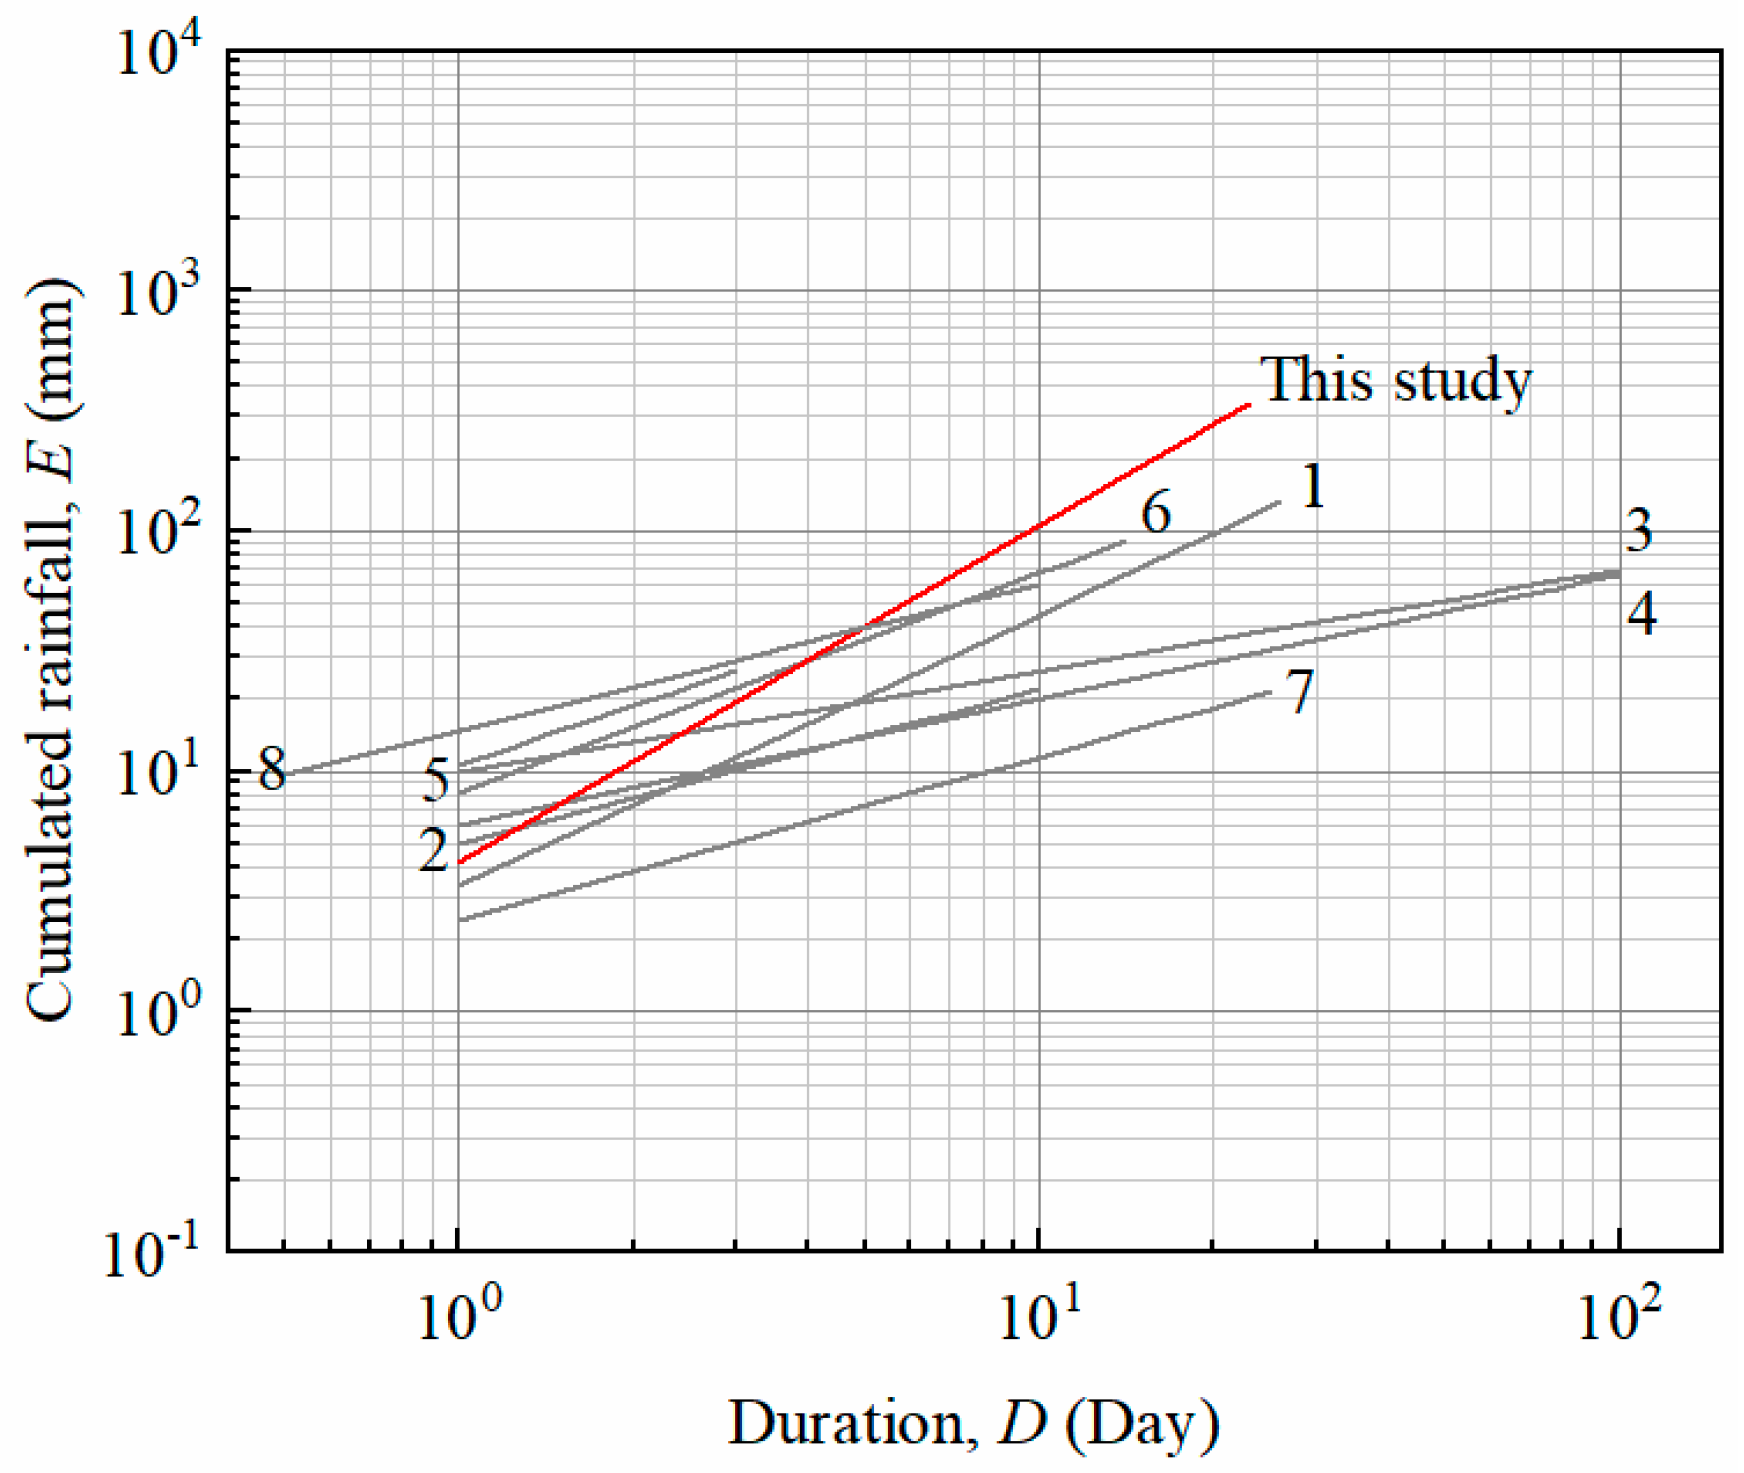
Table 3 lists the E–D thresholds from other regional studies around the globe and plots the E–D thresholds studied here on a log10–log10 plot (Figure 11) for comparison. The E–D rainfall thresholds in this study show a higher slope since the slope of the E–D curve for actual D ≥ 7 days may be higher than the slope for D < 7 days. In addition, the lower temporal resolution (days) also leads to significant changes in the shape and effective range of the thresholds. As the temporal resolution of rainfall decreases, the threshold is characterized by a smaller intercept, higher slope, shorter effective range, and higher uncertainty, but it does not influence the validation and the threshold performance indicators [30]. For short-duration rainfall, the rainfall thresholds established in this paper are similar to most of the thresholds in previous studies. For long-duration rainfall, the rainfall thresholds established in this paper are higher than most of the thresholds. This provides important information for the warning of landslides in Guangzhou, which requires more attention to landslides induced by short-duration heavy rainfall triggered by lower threshold values.
5. Conclusions
Based on 766 landslide events in Guangzhou city from 2010 to 2020, this study defines the cumulative event rainfall–duration (E–D) and normalized cumulative event rainfall–duration (EMAP–D) thresholds for Guangzhou city at 5%, 20%, and 50% probability levels, respectively, using quantile regression methods. The results obtained from this study provide a theoretical basis for the relevant disaster prevention departments to issue different levels of warning information according to the probability level of landslide hazards. The E–D thresholds in this study are similar to those of other countries and regions in the short-duration rainfall range, while they are higher than most thresholds in the long-duration rainfall range. This suggests that short-duration heavy rainfall is more sensitive to landslide triggering and that longer rainfall events require more cumulative rainfall to trigger landslides.
E–D thresholds and EMAP–D thresholds were established for different lithological groups. The rainfall threshold for triggering landslides differed among the different lithological groups, with the carbonate group having the highest threshold and the metamorphic group having the lowest threshold.
Based on the relationship between the rainfall on the day of the landslide and the cumulative rainfall in the previous period, it can be seen that continuous rainfall from 1 to 10 days has a significant effect on the shallow landslide in Guangzhou. The cumulative rainfall 20 days before landslide occurrence (CR20) was selected as a new variable to be added to the E–D threshold, and two event rainfall variables and one cumulative rainfall variable were integrated into a new CED threshold. The AUC of the CED threshold was larger than that of the E–D threshold. Although the CED threshold had a slightly lower TPR than the E–D threshold for the same probability level, the CED threshold performed much better than the E–D threshold in terms of FPR.
Author Contributions
Conceptualization, R.D. and H.L.; methodology, R.D. and H.L.; software, R.D.; validation, X.Z. and Q.Z.; formal analysis, R.D.; investigation, R.D., Q.Z, W.L. and L.C.; resources, H.L.; data curation, R.D. and H.L.; writing—original draft preparation, R.D.; writing—review and editing, H.L. and X.Z.; visualization, R.D.; supervision, H.L. and X.Z; project administration, H.L.; funding acquisition, H.L., Q.Z., W.L. and L.C. All authors have read and agreed to the published version of the manuscript.
Funding
This research was funded by State Key Laboratory of Building Safety and Environment Open Foundation (Grant No. BSBE2021-03); Key Laboratory of City Perception, Monitoring and Early Warning Enterprises Foundation of Guangdong Province (Grant No. 2020B121202019); Science and Technology Foundation Program of Guangzhou Urban Planning & Design Survey Research Institute (Grant No. RDI2210204140, No. RDI2210204146).
Acknowledgments
The authors gratefully acknowledge the support of the Guangzhou Urban Planning & Design Survey Research Institute for providing the necessary rainfall data and landslide data. Special thanks are extended to Yanan Fan from geotechnical department of the Guangzhou Urban Planning & Design Survey Research Institute for leading us in the field survey. The authors would also like to thank the two anonymous reviewers and the editor for their constructive comments, which helped to improve the manuscript.
Conflicts of Interest
The authors declare no conflict of interest.
References
- Dou, J.; Paudel, U.; Oguchi, T.; Uchiyama, S.; Hayakawa, Y.S. Shallow and Deep-Seated Landslide Differentiation Using Support Vector Machines: A Case Study of the Chuetsu Area, Japan. Terr. Atmos. Ocean. Sci. 2015, 26, 227–239. [Google Scholar] [CrossRef] [Green Version]
- Vandromme, R.; Thiery, Y.; Bernardie, S.; Sedan, O. ALICE (Assessment of Landslides Induced by Climatic Events): A single tool to integrate shallow and deep landslides for susceptibility and hazard assessment. Geomorphology 2020, 367, 107307. [Google Scholar] [CrossRef]
- Dai, F.C.; Lee, C.F. Landslide characteristics and, slope instability modeling using GIS, Lantau Island, Hong Kong. Geomorphology 2002, 42, 213–228. [Google Scholar] [CrossRef]
- Zhou, N.Q.; Zhao, S. Urbanization process and induced environmental geological hazards in China. Nat. Hazards 2013, 67, 797–810. [Google Scholar] [CrossRef]
- Zhang, S.; Jiang, Q.; Wu, D.; Xu, X.; Tan, Y.; Shi, P. Improved Method of Defining Rainfall Intensity and Duration Thresholds for Shallow Landslides Based on TRIGRS. Water 2022, 14, 524. [Google Scholar] [CrossRef]
- Yang, F.; Fan, X.; Siva Subramanian, S.; Dou, X.; Xiong, J.; Xia, B.; Yu, Z.; Xu, Q. Catastrophic debris flows triggered by the 20 August 2019 rainfall, a decade since the Wenchuan earthquake, China. Landslides 2021, 18, 3197–3212. [Google Scholar] [CrossRef]
- Yang, H.; Wei, F.; Ma, Z.; Guo, H.; Su, P.; Zhang, S. Rainfall threshold for landslide activity in Dazhou, southwest China. Landslides 2020, 17, 61–77. [Google Scholar] [CrossRef]
- National Bureau of Statistics of China. China Statistical Yearbook on Environment 2021; China Statistics Press: Beijing, China, 2021; p. 250.
- Ou, W.H.; Xu, X.Y.; Zhao, B.B. Application of Mobile GIS Technology in Geologic Hazard Forecast and Prevention of Masses. In Proceedings of the International Conference on Computer Science and Environmental Engineering (CSEE), Beijing, China, 17–18 May 2015; pp. 366–372. [Google Scholar]
- Gariano, S.L.; Guzzetti, F. Landslides in a changing climate. Earth Sci. Rev. 2016, 162, 227–252. [Google Scholar] [CrossRef] [Green Version]
- Lee, M.L.; Ng, K.Y.; Huang, Y.F.; Li, W.C. Rainfall-induced landslides in Hulu Kelang area, Malaysia. Nat. Hazards 2013, 70, 353–375. [Google Scholar] [CrossRef]
- Qi, X.; Li, Q.; Jiao, Y.; Tan, F. Experimental study on response law and failure process of slopes in fully weathered granites under precipitation infiltration. Environ. Earth Sci. 2021, 80, 685. [Google Scholar] [CrossRef]
- Zhang, C.; Zhang, M.; Zhang, T.; Dai, Z.; Wang, L. Influence of intrusive granite dyke on rainfall-induced soil slope failure. Bull. Eng. Geol. Environ. 2020, 79, 5259–5276. [Google Scholar] [CrossRef]
- Yan, X.Q.; Zhou, Z.H.; Tu, P.F. Study on relationship between deformation of reservoir water level fluctuation change of the Shuping landslide. In Proceedings of the International Conference on Mechatronics Engineering and Computing Technology (ICMECT), Shanghai, China, 9–10 April 2014; pp. 881–884. [Google Scholar]
- Lu, J.H.; Qin, J.H. Study on the relationship between deformation and stability of large landslide with the rainfall. In Proceedings of the 3rd International Conference on Civil Engineering, Architecture and Building Materials (CEABM 2013), Jinan, China, 24–26 May 2013; pp. 1199–1202. [Google Scholar]
- Tan, F.; Hu, X.; He, C.; Zhang, Y.; Zhang, H.; Zhou, C.; Wang, Q. Identifying the Main Control Factors for Different Deformation Stages of Landslide. Geotech. Geol. Eng. 2018, 36, 469–482. [Google Scholar] [CrossRef]
- Sari, P.T.K.; Lastiasih, Y. A General Formulation to Describe the Empirical Prediction of The Critical Area of a Landslide. J. Eng. Sci. Technol. 2018, 13, 2379–2394. [Google Scholar]
- Vallet, A.; Varron, D.; Bertrand, C.; Fabbri, O.; Mudry, J. A multi-dimensional statistical rainfall threshold for deep landslides based on groundwater recharge and support vector machines. Nat. Hazards 2016, 84, 821–849. [Google Scholar] [CrossRef]
- Yang, D.D.; Qiu, H.J.; Zhu, Y.R.; Liu, Z.J.; Pei, Y.Q.; Ma, S.Y.; Du, C.; Sun, H.S.; Liu, Y.; Cao, M.M. Landslide Characteristics and Evolution: What We Can Learn from Three Adjacent Landslides. Remote Sens. 2021, 13, 4579. [Google Scholar] [CrossRef]
- Bordoni, M.; Corradini, B.; Lucchelli, L.; Meisina, C. Preliminary results on the comparsion between empirical and physically-based rainfall thresholds for shallow landslides occurence. Ital. J. Eng. Geol. Environ. 2019, 5–10. [Google Scholar] [CrossRef]
- Li, X.; Liu, H.; Pan, J.; Li, D.; Wang, J. Rainfall thresholds of shallow landslides in Wuyuan County of Jiangxi Province, China. Open Geosci. 2020, 12, 821–831. [Google Scholar] [CrossRef]
- van Westen, C.J.; van Asch, T.W.J.; Soeters, R. Landslide hazard and risk zonation—Why is it still so difficult? Bull. Eng. Geol. Environ. 2005, 65, 167–184. [Google Scholar] [CrossRef]
- Guzzetti, F.; Peruccacci, S.; Rossi, M.; Stark, C.P. Rainfall thresholds for the initiation of landslides in central and southern Europe. Meteorol. Atmos. Phys. 2007, 98, 239–267. [Google Scholar] [CrossRef]
- Jakob, M.; Weatherly, H. A hydroclimatic threshold for landslide initiation on the North Shore Mountains of Vancouver, British Columbia. Geomorphology 2003, 54, 137–156. [Google Scholar] [CrossRef]
- Maturidi, A.M.A.M.; Kasim, N.; Abu Taib, K.; Azahar, W.N.A.W.; Tajuddin, H.B.A. Empirically Based Rainfall Threshold for Landslides Occurrence in Peninsular Malaysia. KSCE J. Civ. Eng. 2021, 25, 4552–4566. [Google Scholar] [CrossRef]
- Vaz, T.; Zêzere, J.L.; Pereira, S.; Oliveira, S.C.; Garcia, R.A.C.; Quaresma, I. Regional rainfall thresholds for landslide occurrence using a centenary database. Nat. Hazards Earth Syst. Sci. 2018, 18, 1037–1054. [Google Scholar] [CrossRef] [Green Version]
- Salee, R.; Chinkulkijniwat, A.; Yubonchit, S.; Horpibulsuk, S.; Wangfaoklang, C.; Soisompong, S. New threshold for landslide warning in the southern part of Thailand integrates cumulative rainfall with event rainfall depth-duration. Nat. Hazards 2022, 113, 125–141. [Google Scholar] [CrossRef]
- Kim, S.W.; Chun, K.W.; Kim, M.; Catani, F.; Choi, B.; Seo, J.I. Effect of antecedent rainfall conditions and their variations on shallow landslide-triggering rainfall thresholds in South Korea. Landslides 2021, 18, 569–582. [Google Scholar] [CrossRef]
- Jordanova, G.; Gariano, S.L.; Melillo, M.; Peruccacci, S.; Brunetti, M.T.; Auflic, M.J. Determination of Empirical Rainfall Thresholds for Shallow Landslides in Slovenia Using an Automatic Tool. Water 2020, 12, 1449. [Google Scholar] [CrossRef]
- Gariano, S.L.; Melillo, M.; Peruccacci, S.; Brunetti, M.T. How much does the rainfall temporal resolution affect rainfall thresholds for landslide triggering? Nat. Hazards 2020, 100, 655–670. [Google Scholar] [CrossRef] [Green Version]
- Harilal, G.T.; Madhu, D.; Ramesh, M.V.; Pullarkatt, D. Towards establishing rainfall thresholds for a real-time landslide early warning system in Sikkim, India. Landslides 2019, 16, 2395–2408. [Google Scholar] [CrossRef]
- He, S.; Wang, J.; Liu, S. Rainfall Event–Duration Thresholds for Landslide Occurrences in China. Water 2020, 12, 494. [Google Scholar] [CrossRef] [Green Version]
- Gao, L.; Zhang, L.M.; Cheung, R.W.M. Relationships between natural terrain landslide magnitudes and triggering rainfall based on a large landslide inventory in Hong Kong. Landslides 2018, 15, 727–740. [Google Scholar] [CrossRef]
- Jiang, W.; Chen, G.; Meng, X.; Jin, J.; Zhao, Y.; Lin, L.; Li, Y.; Zhang, Y. Probabilistic rainfall threshold of landslides in Data-Scarce mountainous Areas: A case study of the Bailong River Basin, China. Catena 2022, 213, 106190. [Google Scholar] [CrossRef]
- Gong, Q.H.; Wang, J.; Zhang, J.X.; Yuan, S.X.; Chen, J. Shallow Landslide Spatial Early Warning Model Induced by Heavy Rainfall in South China Area. In Proceedings of the 8th Annual Meeting of Risk Analysis Council of China Association for Disaster Prevention (RAC), Xi’an, China, 20–21 October 2018; pp. 218–223. [Google Scholar]
- Hungr, O.; Leroueil, S.; Picarelli, L. The Varnes classification of landslide types, an update. Landslides 2013, 11, 167–194. [Google Scholar] [CrossRef]
- Li, J.; Heap, A.D.; Potter, A.; Daniell, J.J. Application of machine learning methods to spatial interpolation of environmental variables. Environ. Model. Softw. 2011, 26, 1647–1659. [Google Scholar] [CrossRef]
- Yang, X.; Xie, X.; Liu, D.L.; Ji, F.; Wang, L. Spatial Interpolation of Daily Rainfall Data for Local Climate Impact Assessment over Greater Sydney Region. Adv. Meteorol. 2015, 2015, 563629. [Google Scholar] [CrossRef] [Green Version]
- Wang, Z.X.; Xu, W.B.; Jing, S.C.; Zhou, L.M.; Zhang, W.Z. Research of Critical Precipitation Distribution in Sichuan Province Based on Spatial Interpolation Method. In Proceedings of the 2nd International Conference on Energy and Environmental Protection (ICEEP 2013), Guilin, China, 19–21 April 2013; pp. 3469–3474. [Google Scholar]
- Chen, F.W.; Liu, C.W. Estimation of the spatial rainfall distribution using inverse distance weighting (IDW) in the middle of Taiwan. Paddy Water Environ. 2012, 10, 209–222. [Google Scholar] [CrossRef]
- Gariano, S.L.; Brunetti, M.T.; Iovine, G.; Melillo, M.; Peruccacci, S.; Terranova, O.; Vennari, C.; Guzzetti, F. Calibration and validation of rainfall thresholds for shallow landslide forecasting in Sicily, southern Italy. Geomorphology 2015, 228, 653–665. [Google Scholar] [CrossRef]
- Nolasco-Javier, D.; Kumar, L. Deriving the rainfall threshold for shallow landslide early warning during tropical cyclones: A case study in northern Philippines. Nat. Hazards 2018, 90, 921–941. [Google Scholar] [CrossRef]
- Koenker, R. Quantile Regression in R: A Vignette; 2010. Available online: https://www.cambridge.org/core/books/abs/quantile-regression/quantile-regression-in-r-a-vignette/68519EFD81B88FDAD81553833C0C9278 (accessed on 12 October 2022).
- Dahal, R.K.; Hasegawa, S. Representative rainfall thresholds for landslides in the Nepal Himalaya. Geomorphology 2008, 100, 429–443. [Google Scholar] [CrossRef]
- Chigira, M. Micro-sheeting of granite and its relationship with landsliding specifically after the heavy rainstorm in June 1999, Hiroshima Prefecture, Japan. Eng. Geol. 2001, 59, 219–231. [Google Scholar] [CrossRef]
- Feng, W.; Bai, H.; Lan, B.; Wu, Y.; Wu, Z.; Yan, L.; Ma, X. Spatial–temporal distribution and failure mechanism of group-occurring landslides in Mibei village, Longchuan County, Guangdong, China. Landslides 2022, 19, 1957–1970. [Google Scholar] [CrossRef]
- Bai, H.; Feng, W.; Yi, X.; Fang, H.; Wu, Y.; Deng, P.; Dai, H.; Hu, R. Group-occurring landslides and debris flows caused by the continuous heavy rainfall in June 2019 in Mibei Village, Longchuan County, Guangdong Province, China. Nat. Hazards 2021, 108, 3181–3201. [Google Scholar] [CrossRef]
- Zhao, B.; Dai, Q.; Han, D.; Dai, H.; Mao, J.; Zhuo, L. Probabilistic thresholds for landslides warning by integrating soil moisture conditions with rainfall thresholds. J. Hydrol. 2019, 574, 276–287. [Google Scholar] [CrossRef]
- Chen, C.-W.; Saito, H.; Oguchi, T. Rainfall intensity–duration conditions for mass movements in Taiwan. Prog. Earth Planet. Sci. 2015, 2, 14. [Google Scholar] [CrossRef] [Green Version]
- Chen, H.; Wang, J. Regression analyses for the minimum intensity-duration conditions of continuous rainfall for mudflows triggering in Yan’an, northern Shaanxi (China). Bull. Eng. Geol. Environ. 2014, 73, 917–928. [Google Scholar] [CrossRef]
- Distefano, P.; Peres, D.J.; Scandura, P.; Cancelliere, A. Brief communication: Introducing rainfall thresholds for landslide triggering based on artificial neural networks. Nat. Hazards Earth Syst. Sci. 2022, 22, 1151–1157. [Google Scholar] [CrossRef]
- Caine, N. The rainfall intensity-duration control of shallow landslides and debris flows. Geogr. Ann. Ser. A Phys. Geogr. 1980, 62, 23–27. [Google Scholar] [CrossRef]
Figure 1.
Distribution of landslide and rain gauge locations recorded during 2010–2020 in Guangzhou city.
Figure 1.
Distribution of landslide and rain gauge locations recorded during 2010–2020 in Guangzhou city.

Figure 2.
The geologic setting and the classifications of shallow landslide in Guangzhou: (a,b) Rotational sliding failure; (c) Planar sliding failure; (d) Toppling failure.
Figure 2.
The geologic setting and the classifications of shallow landslide in Guangzhou: (a,b) Rotational sliding failure; (c) Planar sliding failure; (d) Toppling failure.

Figure 3.
Monthly distribution of shallow landslide events and mean precipitation percentage during 2010–2020.
Figure 3.
Monthly distribution of shallow landslide events and mean precipitation percentage during 2010–2020.

Figure 4.
Definition of the criteria used to delineate between two consecutive rainfall events in this study.
Figure 4.
Definition of the criteria used to delineate between two consecutive rainfall events in this study.

Figure 5.
Double-log plot of cumulative rainfall E versus time D for landslides, conditions triggering landslides, and corresponding 5%, 20%, and 50% E–D thresholds in Guangzhou.
Figure 5.
Double-log plot of cumulative rainfall E versus time D for landslides, conditions triggering landslides, and corresponding 5%, 20%, and 50% E–D thresholds in Guangzhou.

Figure 6.
Double-log plot of landslide normalized cumulative rainfall EMAP versus time D for conditions triggering landslides and corresponding 5%, 20%, and 50% EMAP–D thresholds in Guangzhou.
Figure 6.
Double-log plot of landslide normalized cumulative rainfall EMAP versus time D for conditions triggering landslides and corresponding 5%, 20%, and 50% EMAP–D thresholds in Guangzhou.

Figure 7.
(a) Cumulative rainfall–duration E–D thresholds in Guangzhou city divided into five lithological units and the corresponding 5% E–D thresholds; (b) Normalized cumulative rainfall–duration EMAP–D thresholds in Guangzhou city divided into five lithological units and corresponding 5% EMAP–D thresholds.

Figure 8.
Plot of rainfall on the day of landslide failure versus cumulative rainfall during 3 days (a), 7 days (b), 10 days (c), 15 days (d), 20 days (e), and 30 days (f) prior to the landslide event.
Figure 8.
Plot of rainfall on the day of landslide failure versus cumulative rainfall during 3 days (a), 7 days (b), 10 days (c), 15 days (d), 20 days (e), and 30 days (f) prior to the landslide event.

Figure 9.
CED threshold 3D schematic.

Figure 10.
The ROC curves for the E–D threshold and CED threshold.

Figure 11.
Comparison of the 5% probability level E–D thresholds defined in this work with previously published thresholds. The numbers refer to the numbers in Table 3.
Figure 11.
Comparison of the 5% probability level E–D thresholds defined in this work with previously published thresholds. The numbers refer to the numbers in Table 3.


Table 1.
Classification of geotechnical types in Guangzhou.
| Rockiness | Composition | Era | Area/km2 |
|---|---|---|---|
| Extrusive rock | Rhyolite porphyry, dacitic porphyry, rhyolite, and andesite | Middle to Late Jurassic and Cretaceous to Paleocene | 1046.19 |
| Metamorphic rock | Gneiss, slate, mixed rock, mixed gneiss, and gneissic metamorphic quartzite | Yuan Gu Zeus | 647.78 |
| Intrusive rock | Granite, granite porphyry, black mica granite, and amphibole | Caledonian to Yanshanian | 4020.44 |
| Clastic rock | Sandstone, sand conglomerate, and siliceous rock | Devonian to Triassic | 1139.00 |
| Carbonate rock | Limestone, clastic tuff, and dolomitic tuff | Carboniferous to Triassic | 446.45 |
Table 2.
Coefficients of intercept α and slope γ at 5% level of quantile regression lines in five lithological units.
Table 2.
Coefficients of intercept α and slope γ at 5% level of quantile regression lines in five lithological units.
| Rockiness | E–D Threshold | EMAP–D Threshold | ||
|---|---|---|---|---|
| α | γ | α | γ | |
| Extrusive rock | 3.92 | 1.68 | 0.0053 | 1.18 |
| Carbonate rock | 13.04 | 1.06 | 0.0063 | 1.18 |
| Intrusive rock | 4.73 | 1.36 | 0.0021 | 1.45 |
| Metamorphic rock | 4.71 | 1.28 | 0.0020 | 1.41 |
| Clastic rock | 4.39 | 1.38 | 0.0052 | 0.98 |
Table 3.
Comparison of E–D rainfall thresholds for landslide occurrence in this study with rainfall thresholds in previous publications.
Table 3.
Comparison of E–D rainfall thresholds for landslide occurrence in this study with rainfall thresholds in previous publications.
| No. in Figure 11 | Reference | Equation | Range (Day) | Region |
|---|---|---|---|---|
| 1 | (Salee, et al., 2022) [27] | E = 3.322D1.13 | 1 ≤ D ≤ 26 | The southern part of Thailand |
| 2 | (Jiang, et al., 2022) [34] | E = 5.01D0.64 | 1 ≤ D ≤ 10 | Bailong River Basin, China |
| 3 | (Zhao, et al., 2019) [48] | E = 9.97D0.42 | 1 ≤ D ≤ 100 | Emilia-Romagna, northern Italy |
| 4 | (Gariano, et al., 2015) [30] | E = 6D0.52 | 1 ≤ D ≤ 100 | Liguria, NW Italy |
| 5 | (Chen, et al., 2014) [49] | E = 10.545D0.83 | 1 ≤ D ≤ 3 | Taiwan |
| 6 | (Chen, et al., 2014) [50] | E = 0.34D0.91346 | 1 ≤ D ≤ 14 | Yan’an, Shaanxi, China |
| 7 | (Distefano, et al., 2022) [51] | E = 2.40D0.68 | 1 ≤ D ≤ 3 | Sicily, Italy |
| 8 | (Caine, et al., 1980) [52] | E = 14.82D0.61 | 0.007 ≤ D ≤ 10 | World |
Publisher’s Note: MDPI stays neutral with regard to jurisdictional claims in published maps and institutional affiliations. |
© 2022 by the authors. Licensee MDPI, Basel, Switzerland. This article is an open access article distributed under the terms and conditions of the Creative Commons Attribution (CC BY) license (https://creativecommons.org/licenses/by/4.0/).
Share and Cite
MDPI and ACS Style
Deng, R.; Liu, H.; Zheng, X.; Zhang, Q.; Liu, W.; Chen, L. Towards Establishing Empirical Rainfall Thresholds for Shallow Landslides in Guangzhou, Guangdong Province, China. Water 2022, 14, 3914. https://doi.org/10.3390/w14233914
AMA Style
Deng R, Liu H, Zheng X, Zhang Q, Liu W, Chen L. Towards Establishing Empirical Rainfall Thresholds for Shallow Landslides in Guangzhou, Guangdong Province, China. Water. 2022; 14(23):3914. https://doi.org/10.3390/w14233914
Chicago/Turabian StyleDeng, Rilang, Huifen Liu, Xianchang Zheng, Qinghua Zhang, Wei Liu, and Lingwei Chen. 2022. "Towards Establishing Empirical Rainfall Thresholds for Shallow Landslides in Guangzhou, Guangdong Province, China" Water 14, no. 23: 3914. https://doi.org/10.3390/w14233914
Note that from the first issue of 2016, this journal uses article numbers instead of page numbers. See further details here.