


Investigations and Prevention Strategies on the Fracturing Water Pollution Triggering Permeability and Production Decrease in Underground Gas Reservoirs
1
Sinopec North China Petroleum Bureau, Zhengzhou 450006, China
2
College of Petroleum Engineering, Xi’an Shiyou University, Xi’an 710065, China
3
Exploration and Development Research Institute, Sinopec North China Petroleum Bureau, Zhengzhou 450006, China
*
Author to whom correspondence should be addressed.
Water 2022, 14(23), 3921; https://doi.org/10.3390/w14233921
Submission received: 20 October 2022
/
Revised: 26 November 2022
/
Accepted: 28 November 2022
/
Published: 1 December 2022
(This article belongs to the Topic Energy-Water Nexus)
Abstract
:The fracturing water injected into the underground gas reservoirs for development purposes has polluted the reservoirs, triggering a decrease in reservoir permeability and gas production. Here, we quantitatively investigate and provide preventions for the fracturing water pollution in the underground gas reservoir. We study the effects of fracturing water pollution on reservoir permeability with core experiments. According to the core experiments, we constructed an area-divided two-phase porous flow model to study the production of the underground gas reservoir considering fracturing water pollution. The simulation results are in good agreement with the field development data. It reveals that in the early, mid-term and late development, respectively, the fracturing water pollution accounts for 88%, 80% and 45% of the decline in permeability and production of the underground gas reservoir. In terms of the prevention of fracturing water pollution, reservoirs with an initial permeability over 0.20 mD are preferably produced by natural energy rather than fracturing. Once using the fracturing water, we suggest applying the propping agent with a large particle radius to reduce the pollution from the solid solute and adding the clay stabilizer and the surfactant to the fracturing water to reduce the pollution from the water solvent.
1. Introduction
The groundwater protection near the gas reservoirs and the underground environmental hazard from gas exploration have been paid considerable attention [1,2,3], however, the pollution of fracturing water such as fracturing water to the underground gas reservoir receives few focuses. Underground gas reservoirs are usually developed by hydraulic fracturing because of their low or even ultra-low porosity and permeability [4,5,6]. In the process of hydraulic fracturing, due to the injection of the fracturing water, the pollution from the solid solutes and water solvents of the fracturing water will be brought to the underground gas reservoirs, and the reservoir permeability will be reduced [7,8]. Due to the fracturing water pollution and the permeability reduction, the gas production is further declined [9,10] and the gas reservoirs are no longer eligible for CO2 capture and storage or underground hydrogen storage [11,12,13]. From sustainable energy development and recyclable reservoir utilization perspectives, investigations and preventions on fracturing water pollution in the underground gas reservoir are significant.
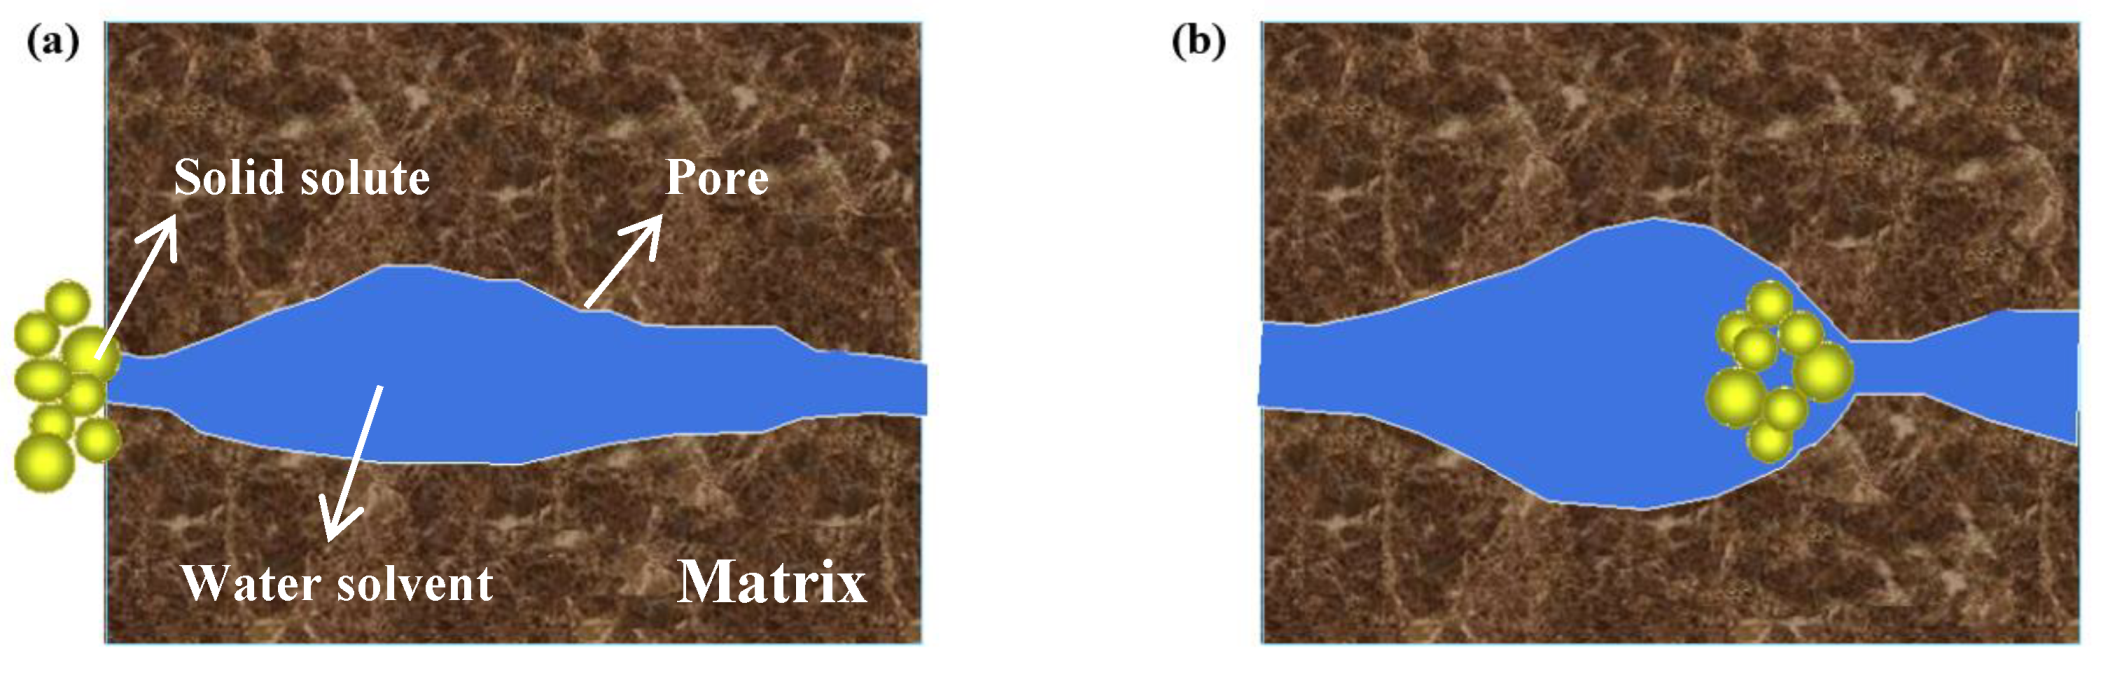
The solid solute pollution of the fracturing water in the underground gas reservoir is that the proppant particles contained in fracturing water are injected into the reservoir pores and form the plugging, resulting in the macroscopic scale loss of the reservoir permeability [14,15,16,17]. The solid solute pollution caused by fracturing water into the underground gas reservoir can be further divided into filter-plugging pollution and matrix-plugging pollution [18,19,20,21]. Filter plugging pollution refers to the proppant particles contained in the fracturing water are squeezed into the end faces of the pores to form a filter, resulting in the loss of reservoir permeability (Figure 1a). The matrix plugging pollution refers to the blockage caused by the adsorption and retention of proppant particles inside the pore matrix, resulting in the loss of reservoir permeability (Figure 1b) [22]. Lipei Fu, et al. [23] studied the pollution law of fracturing water by flow experiment. As the initial core permeability decreases, the water-sensitivity pollution rate and the water-locking pollution rate increase, while the solid solute pollution rate decreases slightly but the total pollution rate increases.
Researches have also been carried out on pollution from water solvent of the fracturing water [24,25,26,27,28]. There are two main aspects of water solvent pollution caused by fracturing water into underground gas reservoirs [29]. On the one hand, the solvent water in the fracturing water penetrates into the reservoir pores, which reduces the original gas saturation in the pores and hence decreases the gas phase permeability, also known as “water lock” pollution. On the other hand, the solvent water in the fracturing water penetrates into the reservoir pores, triggering the clay minerals to expand and migrate, leading to pore collapse and impairing the reservoir permeability, also known as “water sensitive” pollution. Compared with the solid solute pollution of fracturing water, water solvent pollution has a wider range in the underground reservoir [30,31]. For low-permeability reservoirs, the water solvent pollution from fracturing water is more significant.
Quantitatively characterizing the pollution caused by fracturing waters during the fracturing development of underground gas reservoirs is the key to figuring out the core factors that inhibit the permeability and production of underground gas reservoirs, which is also a key prerequisite for underground gas reservoir pollution preventions and preventions and production optimization strategies. In order to observe the microscopic porous flow dynamics in low-permeability reservoirs and explore the mechanism of fluid microscopic flow, Hongqing Song et al. [32] proposed a method to make a visual microscopic seepage model for simulating low-permeability reservoirs. Xuhua Gao et al. [33] used the LBM method to simulate the flow of shale gas in nanopores, thereby establishing the LBM adsorption model. Weiyao Zhu et al. [34] proposed the multiphase seepage theory of low-permeability reservoirs. Hongqing Song [35] established a fracturing well production model considering shale gas seepage to calculate the relevant changes in the production process. However, there are no researches that consider the impact of solid solute and water solvent pollution from fracturing water on the permeability and production of underground gas reservoirs during the development, or propose how to prevent or treat the fracturing water pollution.
In this work, we quantitatively investigate the fracturing water pollution in the underground gas reservoir and provide preventions for the fracturing water pollution. We study the effects of fracturing water pollution on reservoir permeability with core experiments. We construct a mathematical physical model by integrating the revealed parameters from the core experiments to study the production of the underground gas reservoir considering fracturing water pollution and use COMSOL numerical software to solve the model. We consider the effects of stress sensitivity and threshold pressure gradient, which are two crucial geological properties of the gas reservoirs in our model to precisely reveal the gas production. According to the experimental and numerical investigations, we provide preventions for the fracturing water pollution triggering the production decline in the underground gas reservoirs.
2. Experimental Research
2.1. Fracturing Water Pollution Research
Aiming at the problems that the existing storage pollution evaluation system is imperfect, and the single pollution degree cannot be accurately calibrated under the condition of coexistence of multiple injuries, we propose the concepts of absolute pollution degree of storage (Da) and relative pollution degree (Dr) to quantitatively evaluate the weight of single pollution in the total pollution of storage [36].
Absolute degree of pollution Da: Characterize the decrease in storage permeability due to a particular type of pollution, %.
Calculation method:
where, Ki is the initial core permeability, m2. Kp is the permeability after single pollution, m2.
Means of realization: Conventional pollution physics simulation (SY/T 5858-2010).
Relative degree of pollution Dr: Indicates the proportion and weight of a specific type of pollution in the total pollution stored, %.
Calculation method:
where, ΔKs is the permeability reduction under single pollution, m2. ΔKm is the permeability reduction under multiple pollution, m2.
Means of realization: A single factor evaluation experiment under the multiple pollution.
2.1.1. Solid Solute Pollution from Fracturing Water (SSP)
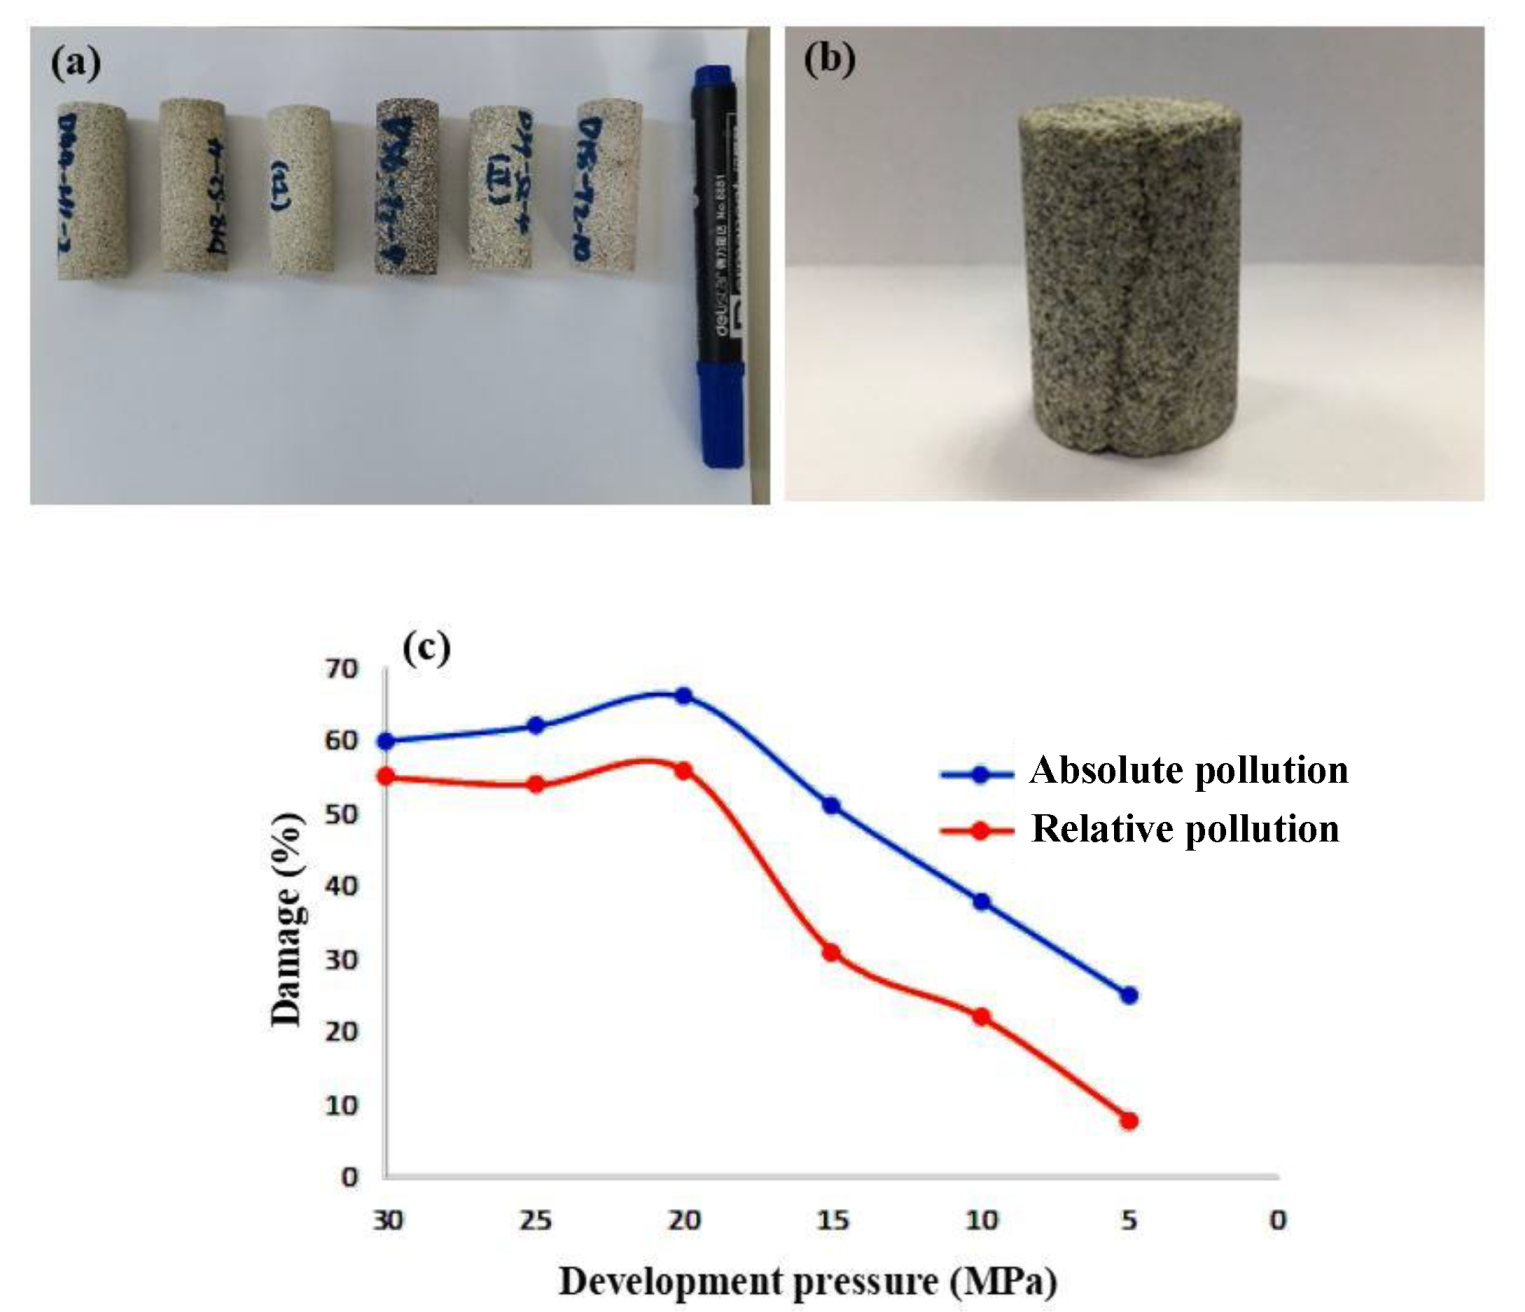
In this study, the impact of solid solute pollution from fracturing water on the permeability of underground gas reservoirs was explored through core experiments. In the experiment, artificial and natural cores with a diameter of 2.5 cm and a length of 2.5 cm were used to quantitatively clarify the solid pollution of the fracturing water by measuring and comparing the permeability of the core before and after fracturing water displacement. The initial permeability was measured by the forward displacement of kerosene after saturated standard saline. We reversely displaced the fracturing water, and when placed at a constant temperature, we displaced the kerosene forward to measure post-pollution permeability. Figure 2a,b are the core pollution test results using 90 °C conventional fracturing water (the total solid phase content in the gel-breaking solution is 476 mg/L) and 90 °C low-pollution fracturing water (the total solid phase content in the gel-breaking solution is 227 mg/L), respectively. Figure 2c shows the experimental results of pollution in natural cores and artificial cores using conventional fracturing water.
2.1.2. Water Solvent Pollution from Fracturing Water (WSP)
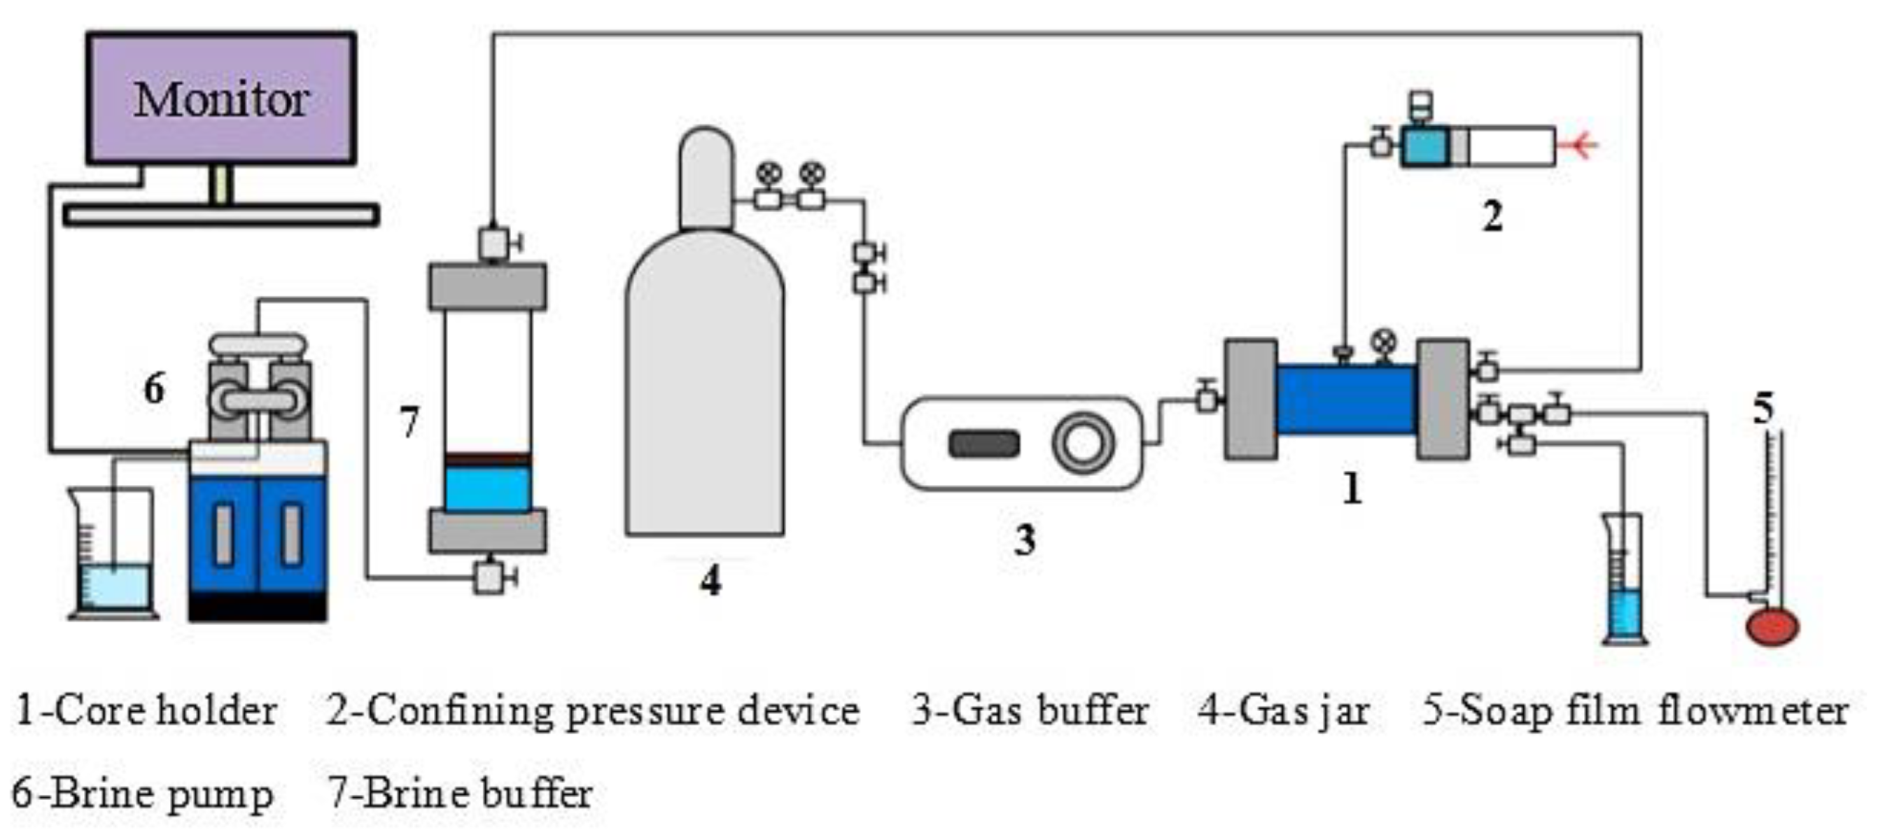
Water lock pollution widely exists in low-permeability tight sandstone oil and gas reservoirs and is one of the main pollution types of low-permeability tight sandstone oil and gas reservoirs, which seriously affects the exploration and development of oil and gas reservoirs. Although there is no unified evaluation standard and normative process for indoor evaluation of water lock pollution, according to its specific action process, different scholars have adopted different experimental methods to evaluate. However, a consensus has been reached on the pollution caused by the water lock effect on the permeability. Studies have shown that the smaller the permeability of the core, the more serious the water lock pollution. In this study, 10-14 cm long cores were used for the experiment (Figure 3), which overcomes the end effect of short cores during the experiment. Different degrees of water lock were simulated by reverse injection of formation water, and the flow rate was obtained by using a soap film flowmeter at the end of the core gripper, then the permeability of the core with different degrees of water lock can then be obtained and the pollution degree can be calculated [37].
- (1)
- Experimental procedure
- ①
- The long cores were dried in an incubator at 80 °C for 48 h;
- ②
- Put the core into the long core holder, add a confining pressure of 3 MPa and use a soap film flowmeter to test the gas permeability of the core;
- ③
- After the long core is evacuated for 24 h, the formation water is saturated;
- ④
- After 48 h of pressure saturation, take it out for use;
- ⑤
- Put the core into the long core holder, add the confining pressure of 3.0 MPa, the pressure at the inlet end of 1.601 MPa, the pressure at the outlet end of 0.101MPa and start the displacement;
- ⑥
- Use a soap film flowmeter at the end of the holder to record the flow rate, and obtain the core permeability, end the experiment and then change the experimental conditions to carry out the next set of experiments;
- ⑦
- The Wendeng pump was used to reverse inject 0.1 PV, 0.2 PV and 0.5 PV formation water into the end of the long rock core, repeat steps ⑤ and ⑥, and then end the experiment.
- (2)
- Experimental results (Figure 4a)
- ①
- The water-lock pollution rate of tight core is inversely proportional to overburden permeability;
- ②
- The water lock pollution rate of tight cores is above 40%. When the permeability is lower than 0.1 mD, the water lock pollution rate can reach more than 95%;
- ③
- The water lock pollution law of natural fracture cores is similar to that of matrix cores, but the pollution rate is generally lower (15–25%).
2.2. Stress Sensitivity (SS) Research
Reservoir rocks are often composed of bedrock, pores, cracks, karst caves, etc., and belong to a typical porous medium structure. The complex physical structure inside the rock leads to extremely complex internal stress conditions. Generally speaking, there are basically the following two types of stress applied to the rock: internal stress (pore fluid pressure) and external stress (formation overburden pressure). When the stress exerted on the storage rock changes, the rock will deform and the pore structure of the rock will also change accordingly, which will eventually lead to changes in the rock seepage and storage production (permeability, porosity, etc.), that is, so-called stress sensitivity. For tight reservoirs, due to their small pore throats, the internal structure of the rock is more complex than that of conventional oil and gas reservoirs. Therefore, the stress state and deformation under stress will be very different from conventional oil and gas reservoirs, and the stress sensitivity characteristics and the influence on reservoir seepage will also be very different from conventional ones.
On the basis of conventional stress-sensitivity research, time variables are introduced and the concept of instantaneous and delayed stress-sensitivity effects is proposed.
The conventional stress-sensitive evaluation method believes that the storage compression deformation is completed in a very short time; therefore, the oil and gas industry standard sets the pressure-bearing time for evaluating stress sensitivity as 30 min. With the production of fluid, the effective stress of the storage increases, the storage deforms in a very short time and then the stress-sensitive phenomenon occurs. We name this stress-sensitive phenomenon generated in a short time the transient stress-sensitive effect.
In fact, the stress deformation of dense storage is a complex and slow process. Under a certain overburden pressure and pore pressure, the effective stress of the reservoir is constant, but with the extension of time, the reservoir pores continue to be compressed and the permeability will continue to change with time, which is called the delayed stress sensitivity effect.
Based on the time-delayed stress-sensitive theory, we obtained the true stress-sensitive pollution degree of the core in the target area as follows: Under the effect of transient stress sensitivity, the stress-sensitive pollution rate of cores in Daniudi underground gas reservoirs is between 25% and 45%; Under the action of delayed stress sensitivity effect, the stress-sensitive pollution rate of cores in the Daniudi underground gas reservoir is between 55% and 70%, especially in the late development when the pore fluid pressure is low, the permeability loss will reach more than 70% and stress-sensitive pollution will become the main source of pollution (Figure 4b).
2.3. Threshold Pressure Gradient (TPG) Research
In order to further study the threshold pressure gradient characteristics of underground gas reservoirs, we firstly investigated the threshold pressure gradient of tight cores containing irreducible water under normal pressure (101 KPa) and storage conditions. The threshold pressure gradient research cores are natural cores taken from underground gas reservoirs in the research target area, the basic physical properties of the core are shown in Table 1.
In order to better simulate the real situation of storage, the cores used in the dynamic start-up pressure gradient test are all cores containing irreducible water and the water saturation of all cores is 41–45%, which is close to the irreducible water saturation.
The characteristics of the threshold pressure gradient of underground gas reservoir cores under storage conditions are clarified by comparing the threshold pressure gradients of different cores under storage conditions and at normal pressure. In the initial pressure gradient test under storage conditions, the pore fluid pressure is set at the original formation pressure of the gas field, 26 MPa, and the confining pressure is 39 MPa (Figure 4c). According to the results of previous research, it can be seen that the threshold pressure gradient of the core is closely related to its own permeability, and the underground gas reservoir core also has a relatively obvious stress-sensitive effect. In order to avoid the influence of permeability changes due to different pore fluid pressures on the measurement results of the threshold pressure gradient. In the normal pressure test, the pore fluid pressure was set to 0.101 MPa and the confining pressure was set to 13.101 MPa, that is, the effective stress on the cores in the two experiments was the same, 13 MPa. Therefore, it can be considered that the permeability of the two groups of experimental cores is the same, so as to ensure the reliability of the test results as much as possible.
According to the experimental data, it is found that the threshold pressure gradient of core 1 increases linearly with the decrease of pore fluid pressure its expression is as follows:
where, is the threshold pressure gradient, MPa/m; is the pore fluid pressure, MPa.
The dynamic threshold pressure gradient effect during the development of underground gas reservoirs can be quantitatively described as follows:
where, is the threshold pressure gradient under the initial conditions of the core, MPa/m; is the threshold pressure gradient sensitivity coefficient, cm−1.
3. Materials and Methods
3.1. Physical Models and Model Assumptions
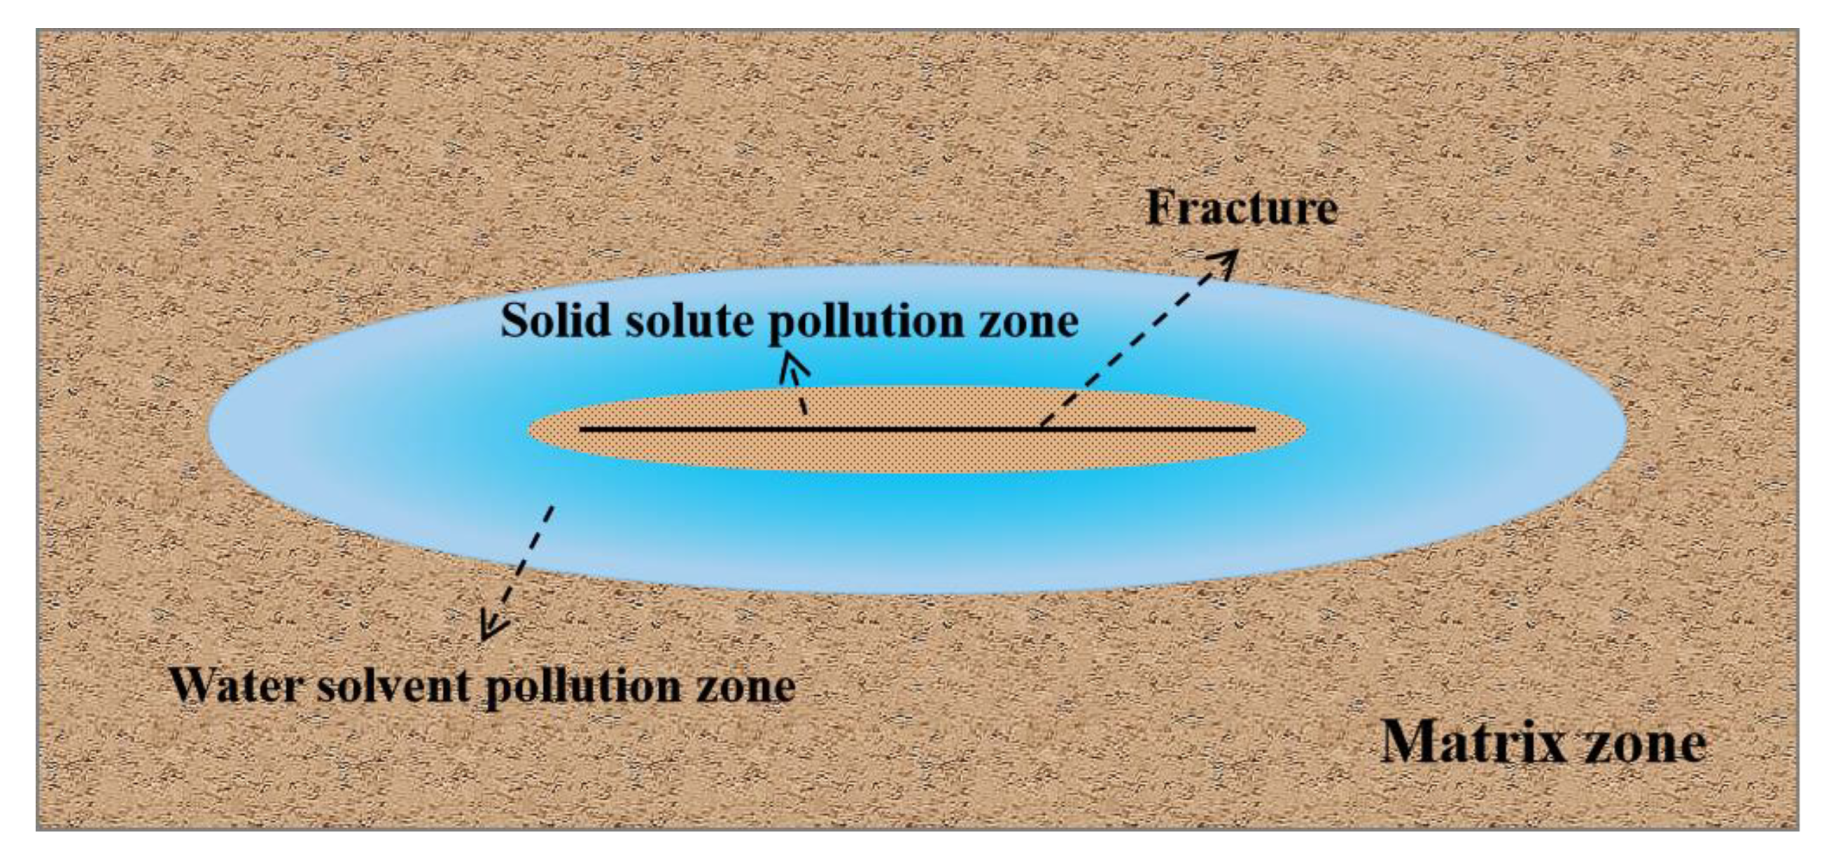
Assuming hydraulic fracturing development of vertical wells, the pollution to the reservoir by fracturing water will lead to a decrease in permeability, so the area around the fracturing vertical well is divided into three areas. Zone Ⅰ is the pollution of fracturing water caused by the injection of fracturing water into the reservoir during hydraulic fracturing, which is manifested as a decrease in permeability. Zone Ⅱ is the high water cut area formed after the injection of fracturing water, Zone Ⅲ is the matrix flow zone. Details are shown in Figure 5.
3.2. Mathematical Model
Motion equation of water solvent:
where, α—dimensionality coefficient, dimensionless; Kf—penetration, mD; Krw—liquid phase relative permeability; ρfw—water solvent density, kg/m3; μfw—water solvent viscosity, mPa∙s; t—time, s; P—pressure, MPa; ∅—porosity; Sw—water saturation; qw—mass flow of water, kg/s;
Motion equation of gas:
where, Krg—gas relative permeability; ρfg—gas phase density, kg/m3; μ—gas viscosity, mPa∙s; Sg—gas saturation; qg—mass flow of gas, kg/s; σ—shape factor, dimensionless; Km—original permeability, mD.
The stress is sensitive to the fracture system, and the exponential fitting formula for fracture permeability is as follows:
Zone Ⅰ:
Zone Ⅱ:
Zone Ⅲ:
Threshold pressure gradient:
3.3. Model Validation
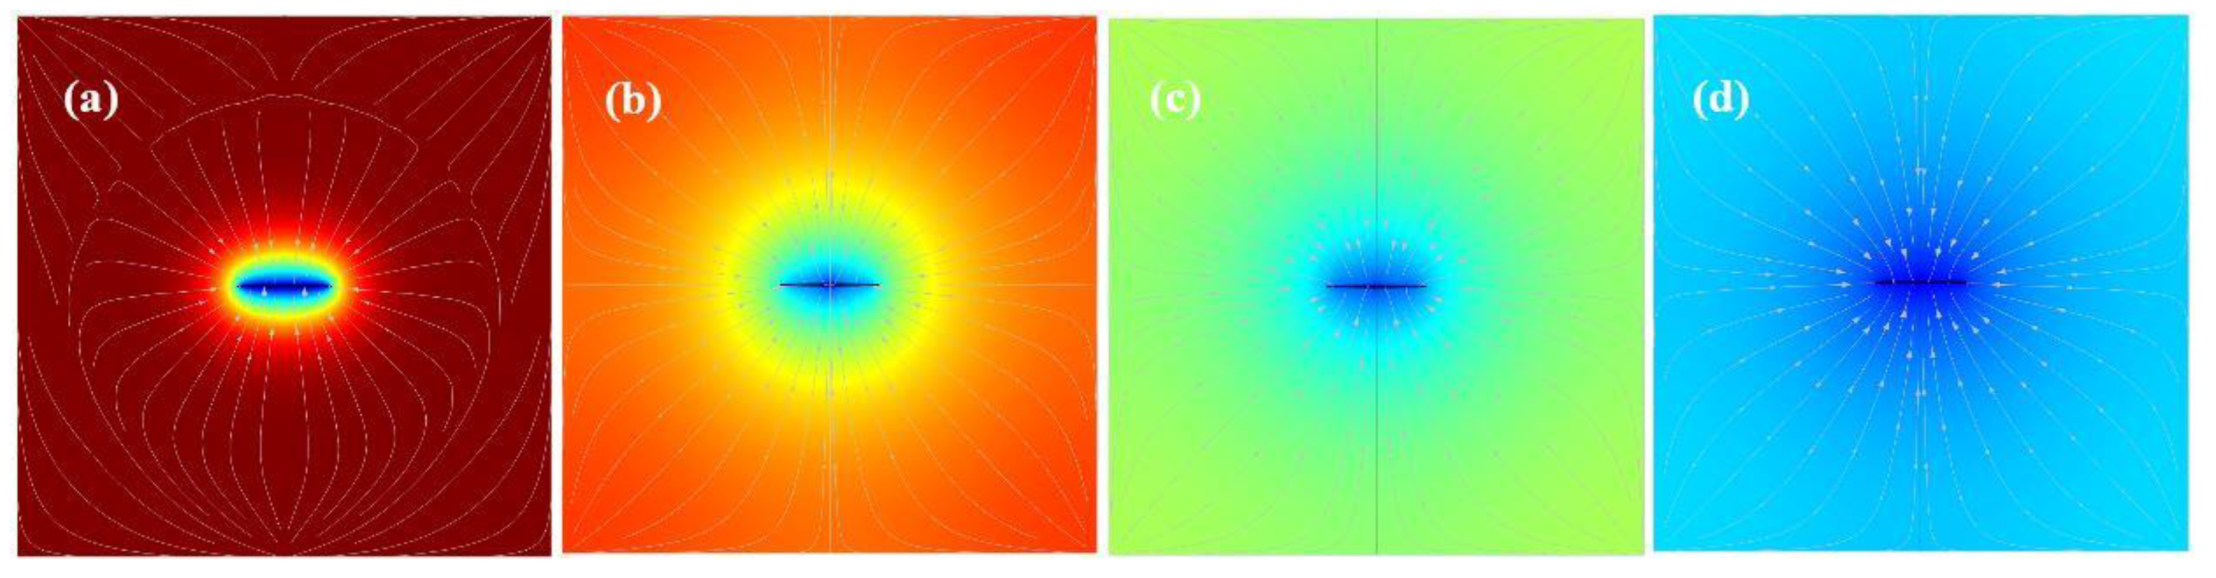
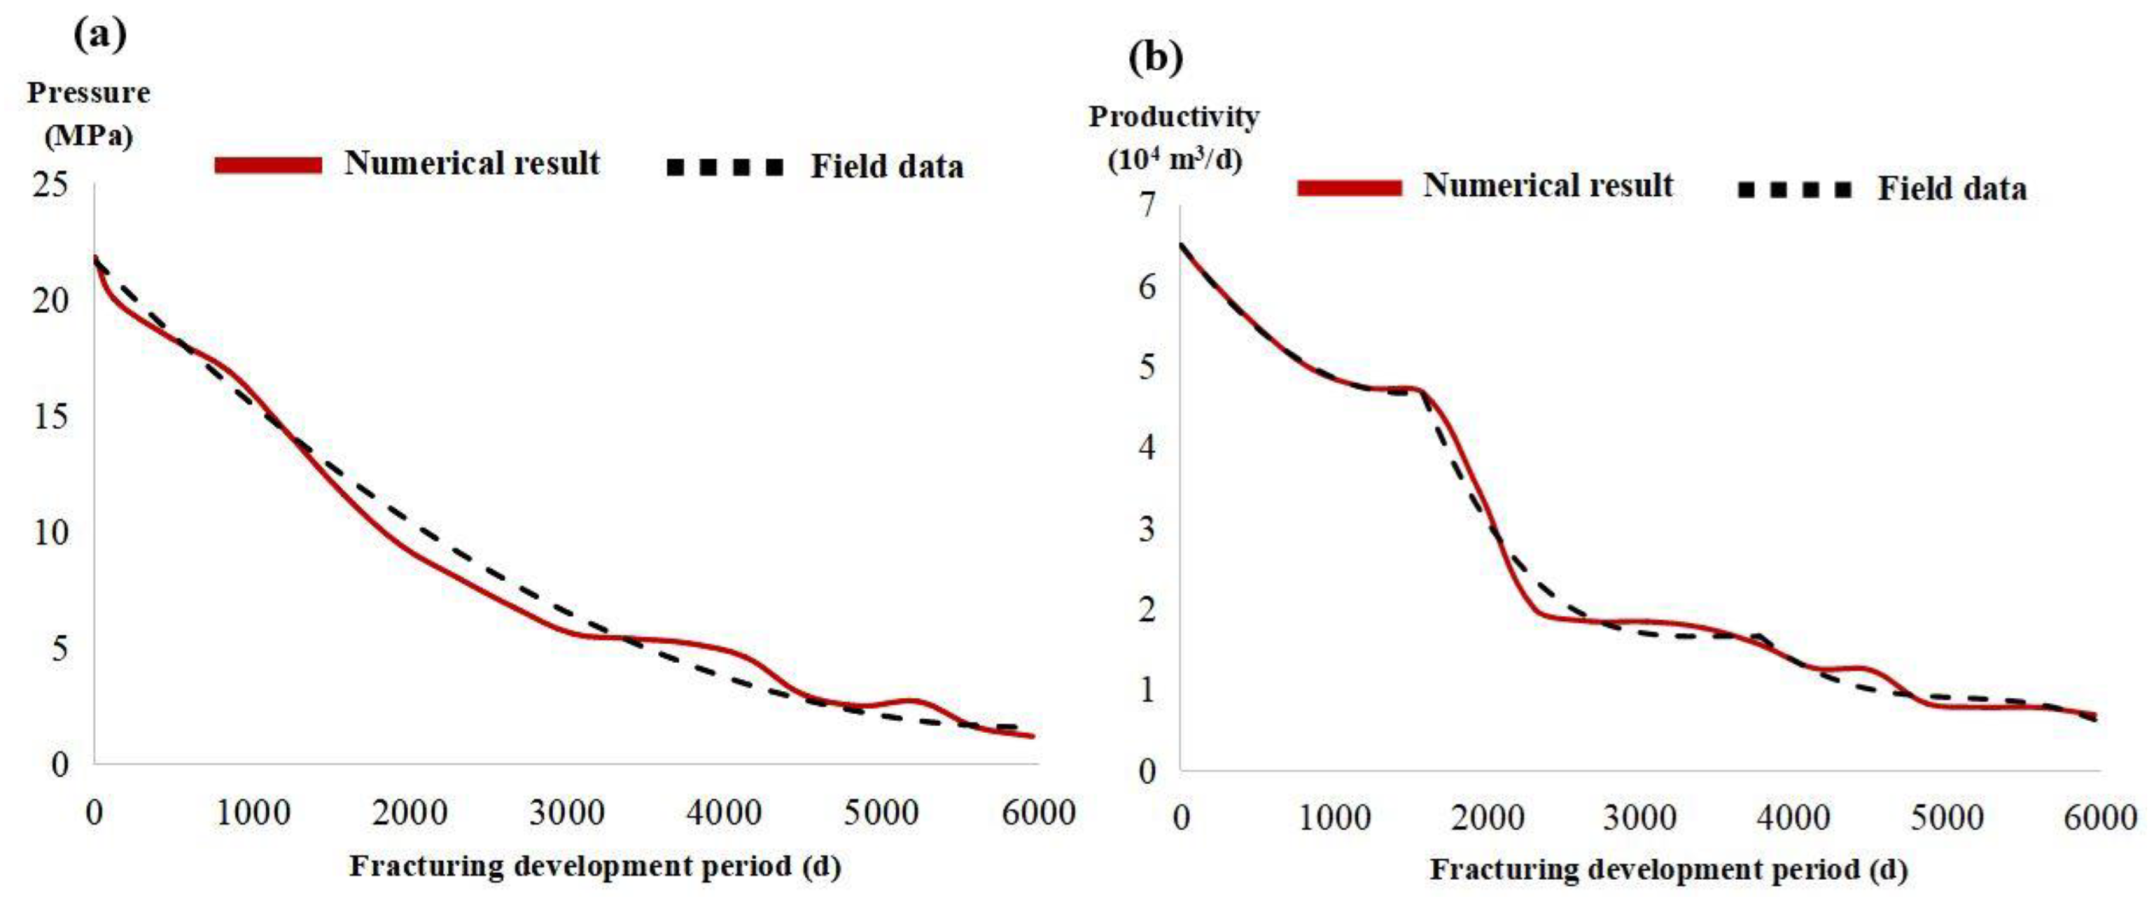
The model was numerically solved by COMSOL, and detailed meshing information and initial and boundary conditions are shown in Table 2. The simulation results were compared with the field development results (Figure 6 and Figure 7) from the Daniudi gas field in Inner Mongolia, PR China.
The Daniudi gas field is located in the northern part of the Yishan slope in the Ordos Basin, with an area of 2003 km2. By the end of 2016, it had submitted natural gas proven reserves of 4545.63 × 108 m3, controlled reserves of 43.78 × 10⁸ m3, predicted reserves of 315.1 × 10⁸ m3 and tertiary reserves of 4904.51 × 108 m3. The average permeability of the study zone of the Daniudi gas field is 0.046 mD. It is the main natural gas production base of North China Oil and Gas Branch.
4. Mechanisms of Water Pollution in Underground Gas Reservoir
4.1. Fracturing Water Solid Solute Pollution
A full-cycle fracturing development production model for water-bearing underground gas reservoirs based on this study, combined with COMSOL numerical simulation software to solve for yields under single pollution factors and under conventional storage development conditions, the gas reservoir production under conventional reservoir development conditions is also compared with the gas reservoir production under the action of a single pollution factor, and finally, the degree of pollution caused by the action of each factor on the gas reservoir production is discussed. In this study, single pollution factors refer to solid solute pollution from fracturing water, water solvent pollution from fracturing water, stress sensitivity and threshold pressure gradient. The conventional reservoir development conditions refer to the gas reservoir development without considering the solid pollution of fracturing water, the liquid pollution of fracturing water, stress sensitivity and threshold pressure gradient.
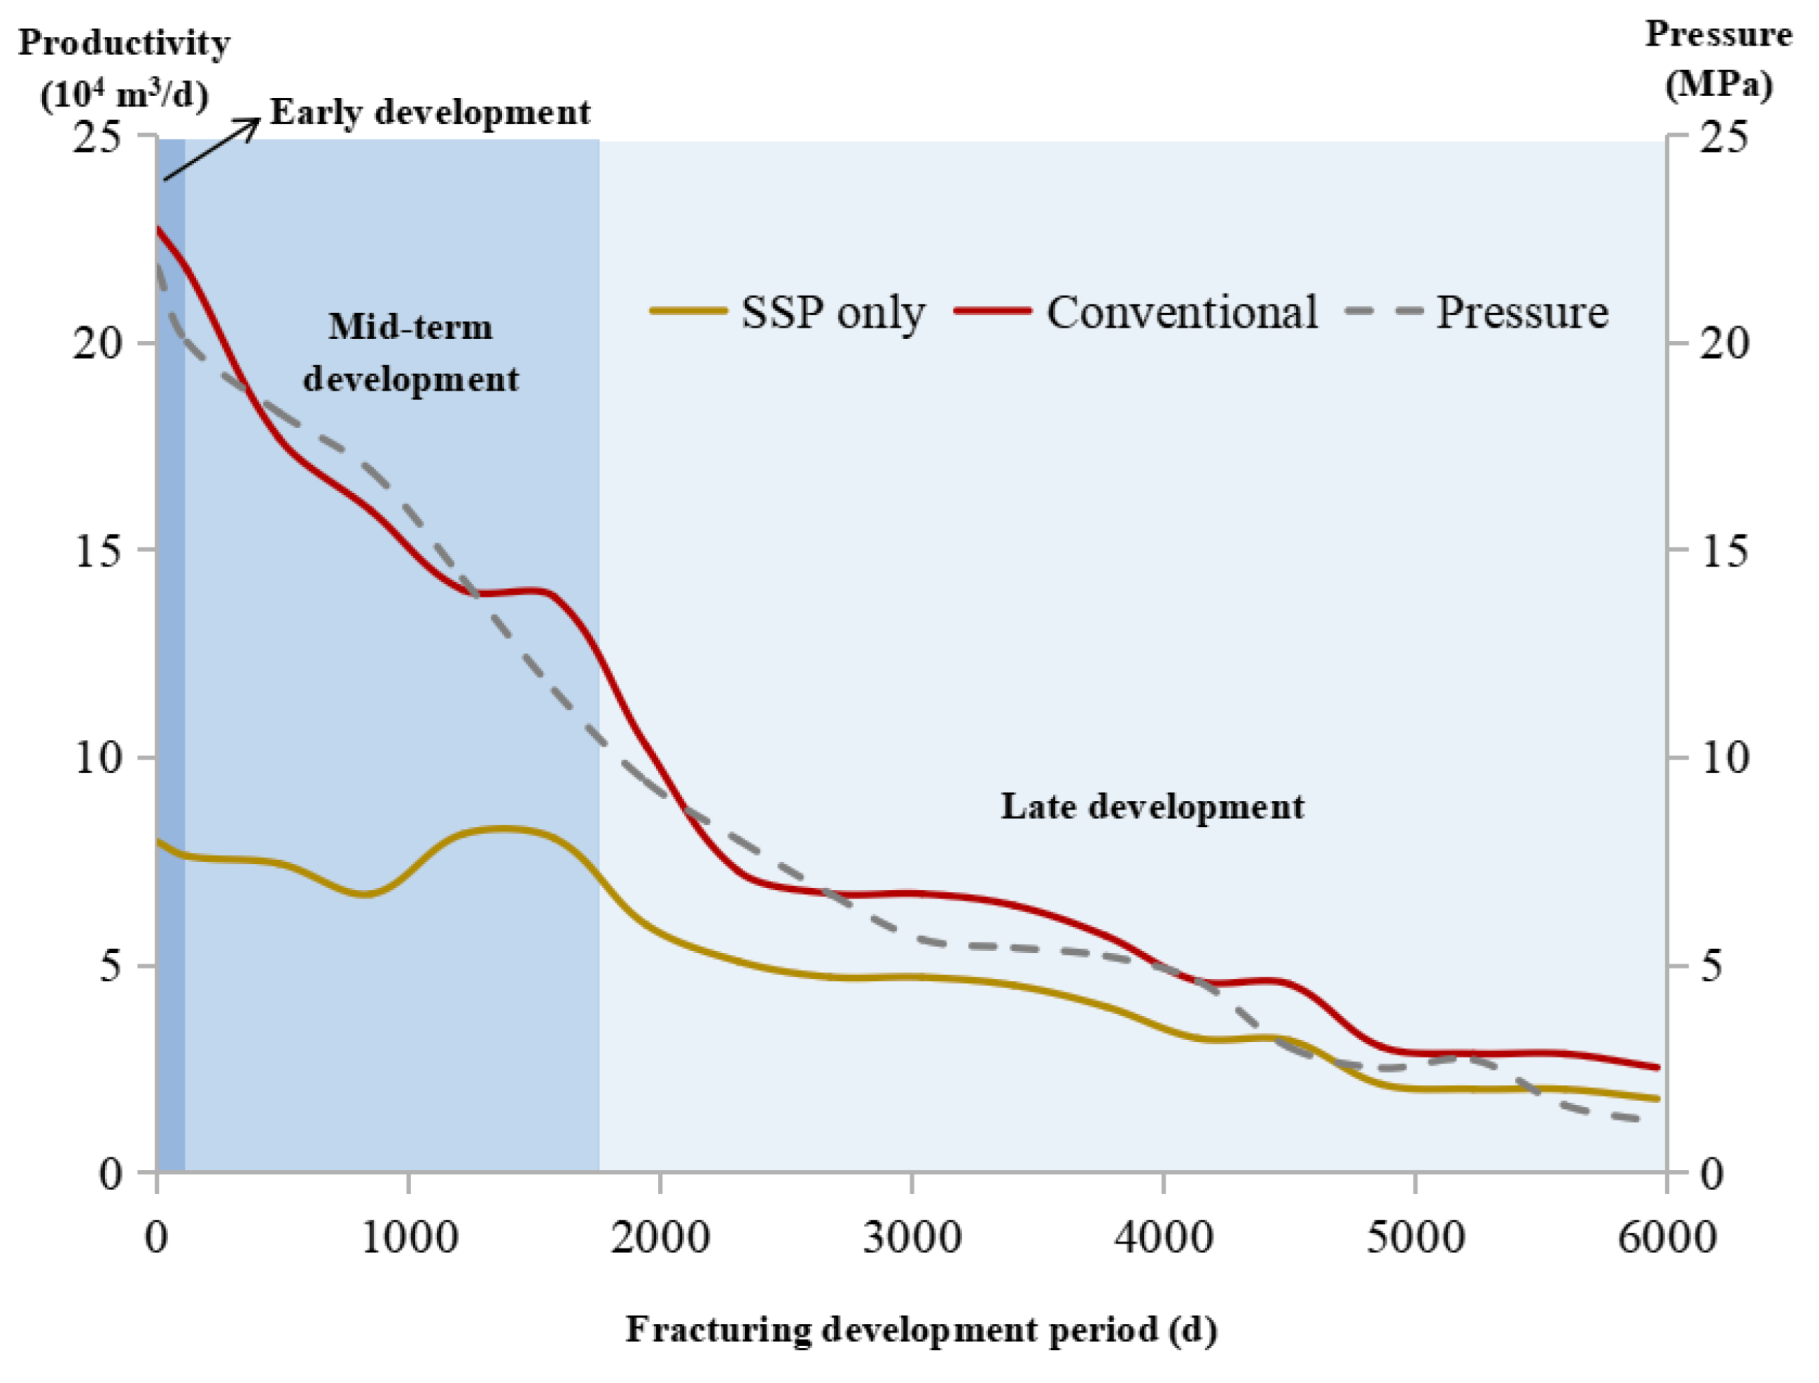
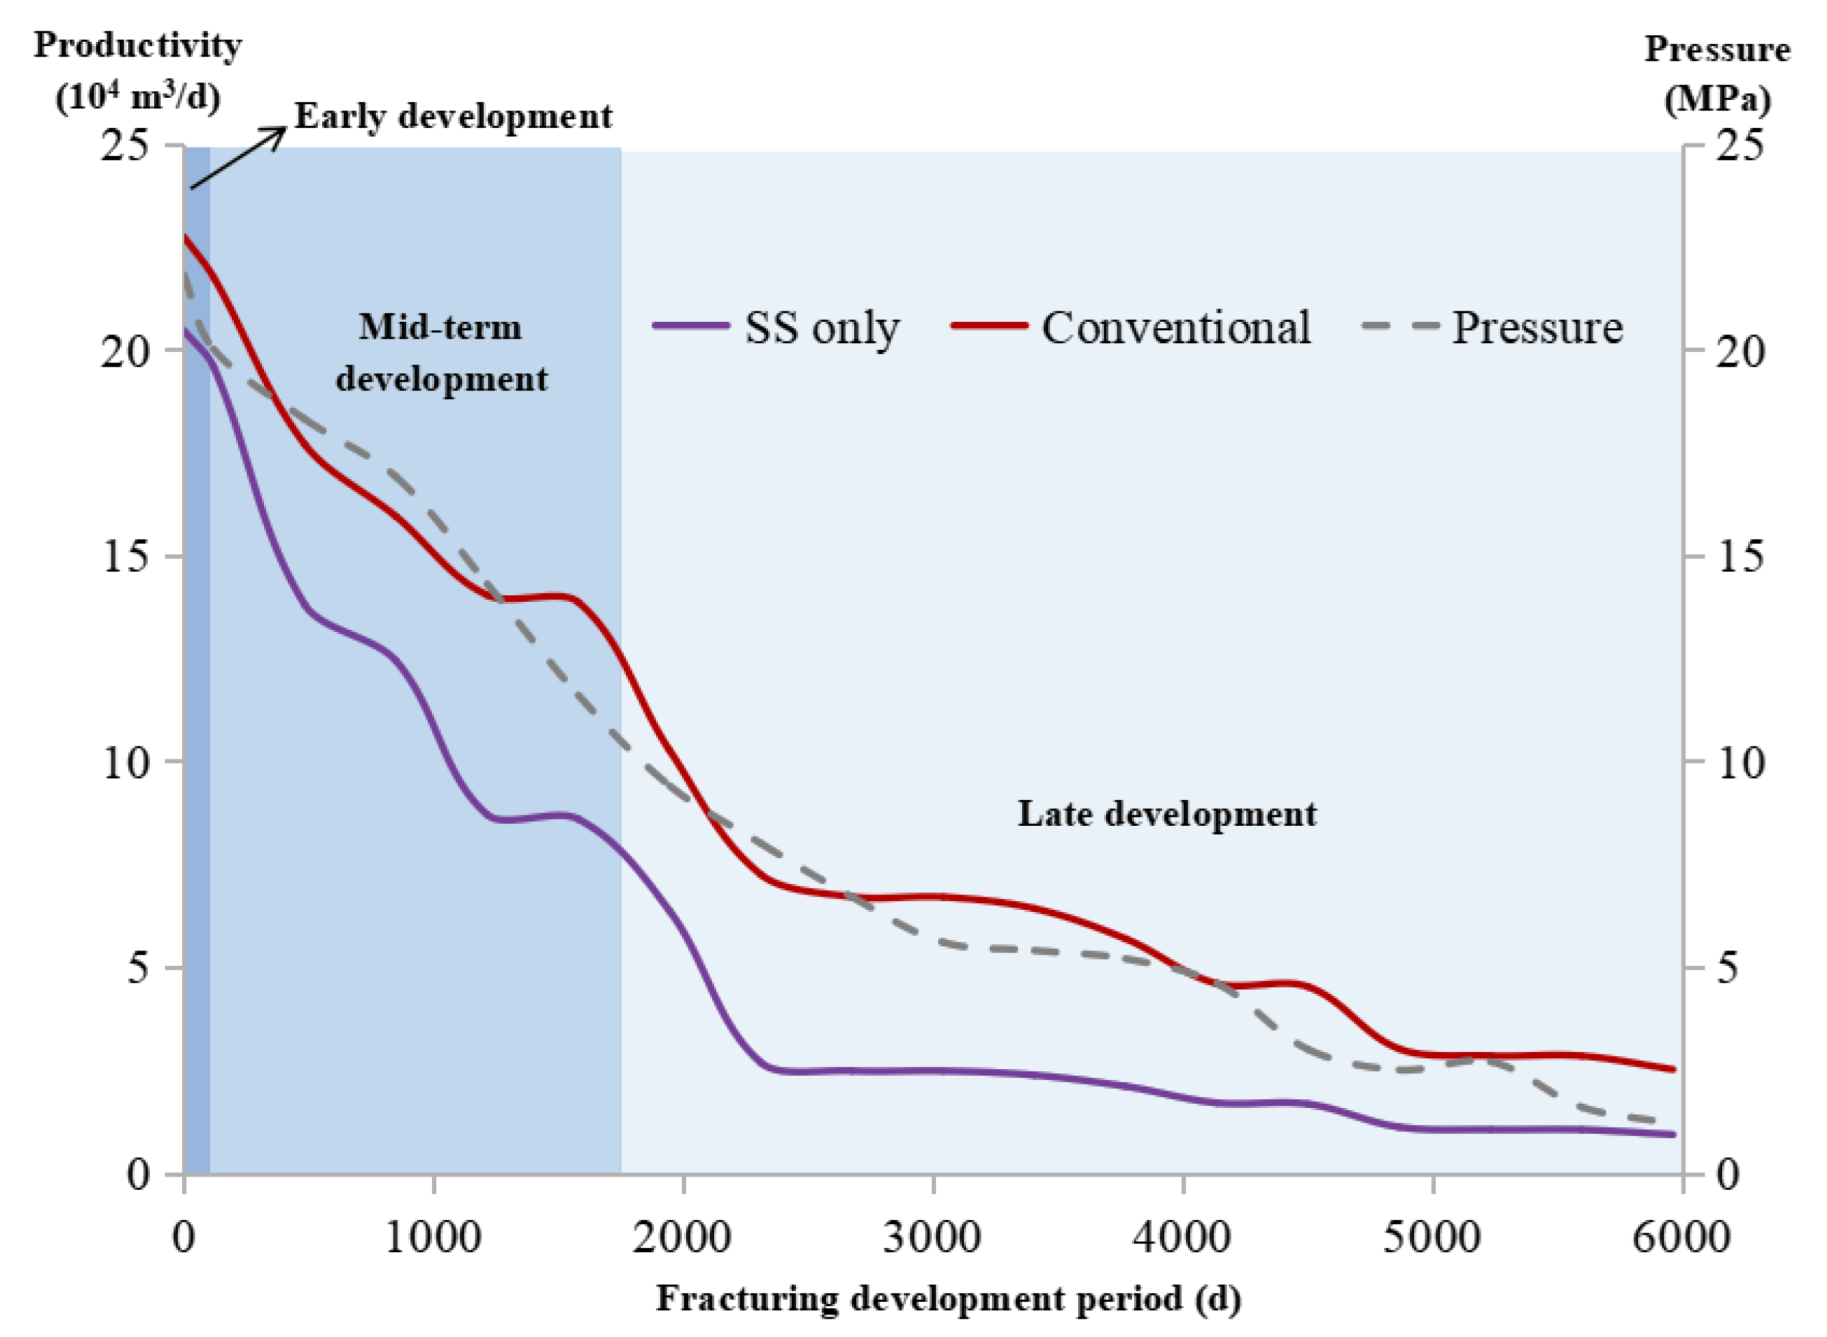
Firstly, the influence on the development production of gas reservoirs under the condition of only solid solute pollution from fracturing water is explored. Combined with the core experimental results, it can be seen that the proppant particles injected from the fractures form filter cakes and matrix plugging in the reservoir pores, which at the same time hinder the migration and diffusion of proppant particles in the pores. Therefore, the solid pollution from fracturing water is mainly concentrated in the action area around the fracture. In the early stage of underground gas reservoir development, although the development pressure is high (>20 MPa), most of the development pressure is consumed by the solid phase particles plugged in the pores. Therefore, compared with the conventional reservoir development conditions, the production at the initial stage of development under the condition of solid solute pollution from fracturing water is significantly reduced (Figure 8). It is obvious that the solid solute pollution from fracturing water will continue from the early stage of development to the first half of the middle stage of development (about 900 days ago, Figure 8). As the development pressure decreases, in the second half of the mid-development period, the solid particles tend to be dispersed from the aggregated state in the pores, the plugging effect is weakened, the pollution to the production by the solid pollution is reduced and the production of the gas reservoir has recovered. At the end of development, the pollution effect of solid solute pollution from fracturing water on gas reservoir production is further reduced.
4.2. Fracturing Water Water Solvent Pollution
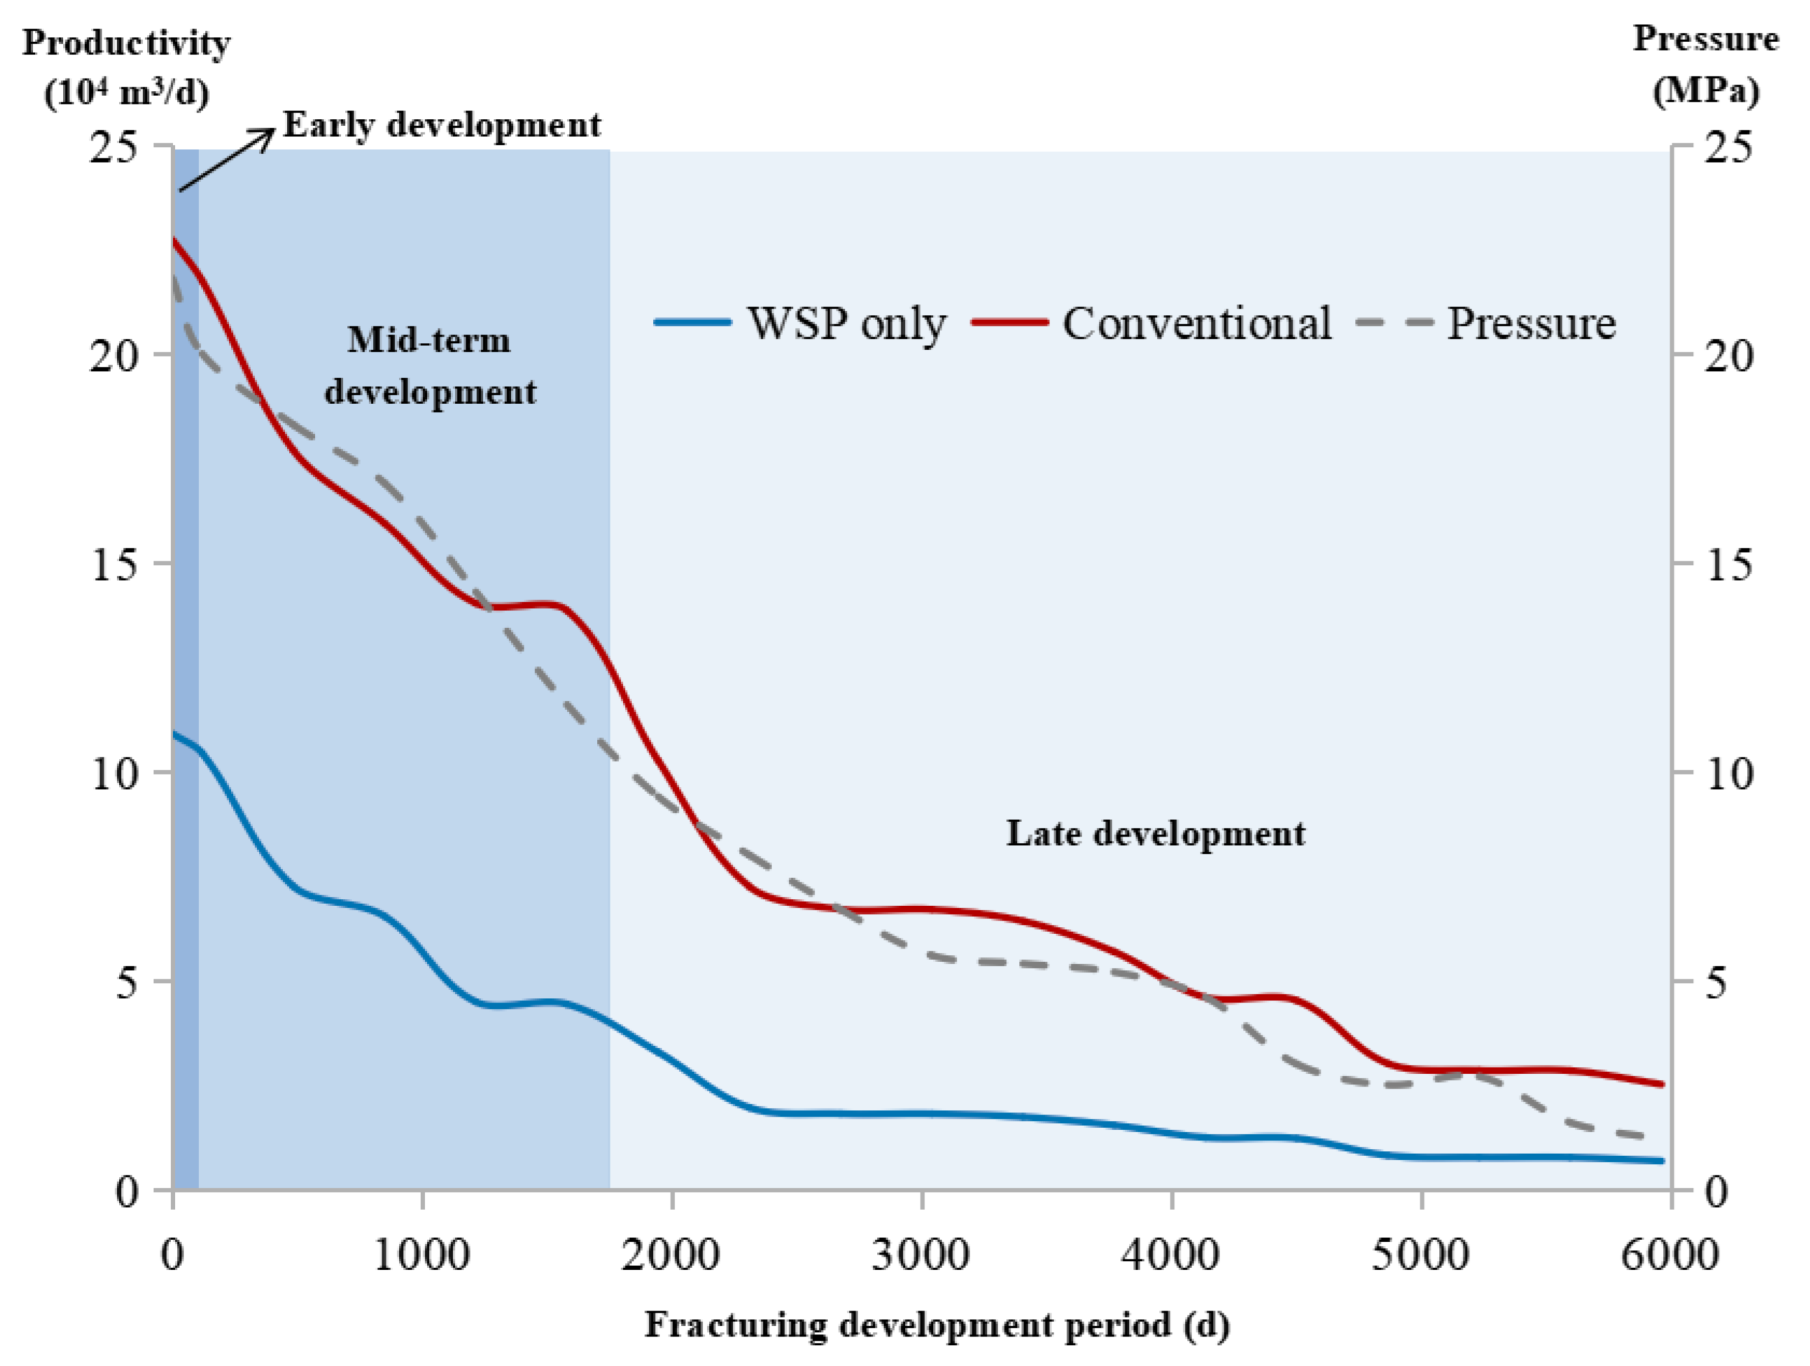
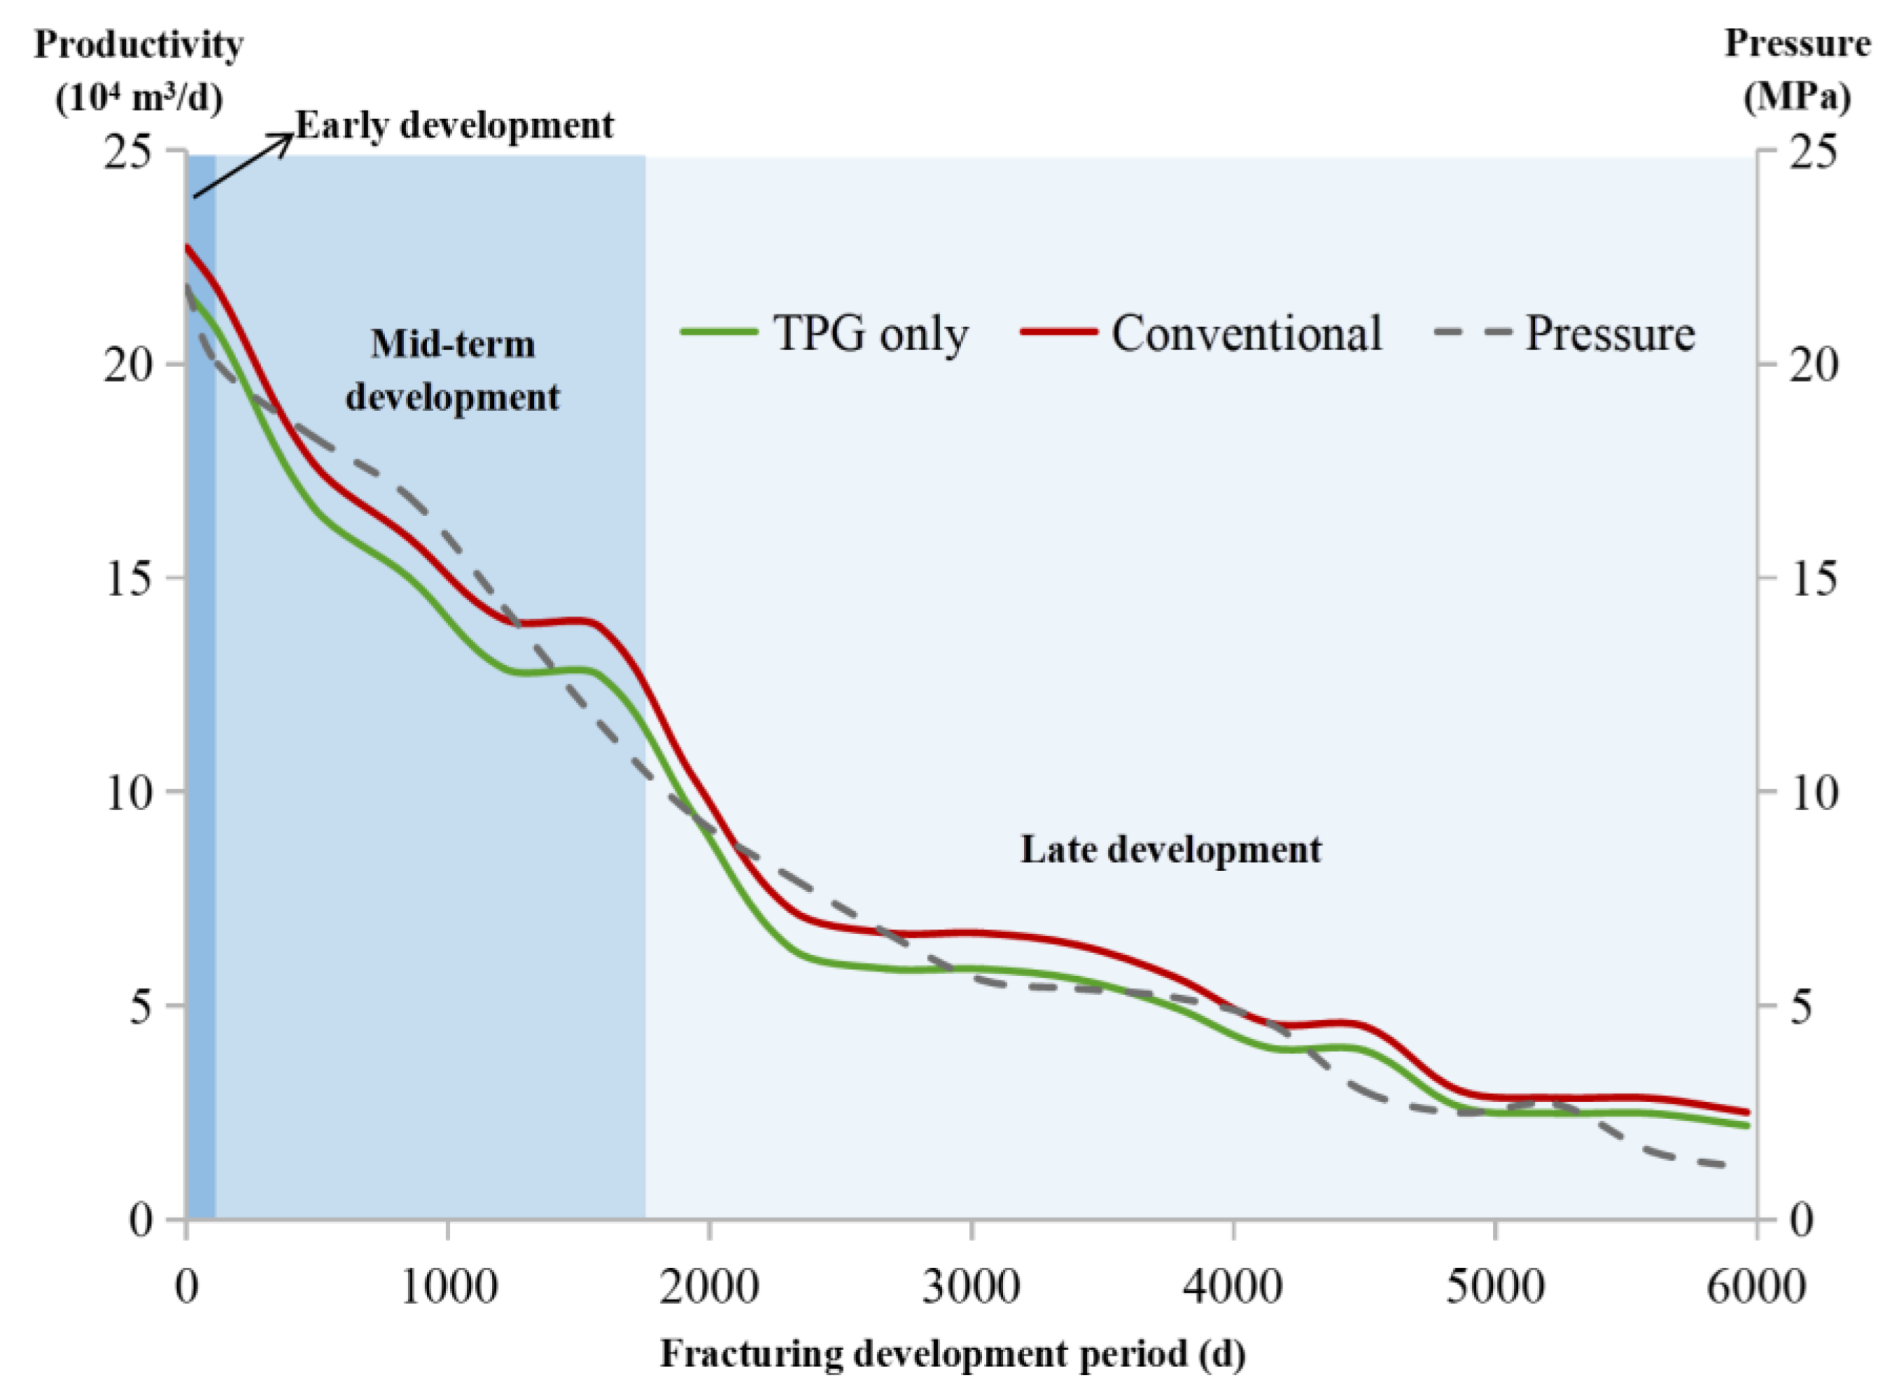
Compared with solid solute pollution from fracturing water, because the solvent water in the fracturing water has a stronger migration ability in the pores, the liquid pollution of the fracturing water not only exists in the action area around the fracture but also affects the reservoir pores outside the action area around the fracture. In the early development, the reservoir area affected by the liquid pollution for fracturing water has high water saturation. The water saturation in the action area around the fracture is even close to 100%, which has significant pollution to the “water lock” and “water sensitivity” of the gas reservoir, and the gas permeability is low. With the advancement of the development cycle, the water in the storage is continuously discharged and the water saturation decreases; however, at the same time, the pressure of storage development is also reduced, resulting in the weakening of liquid pollution at the end of development, but it still cannot be ignored (Figure 9). Therefore, from the perspective of a single influencing factor, the liquid pollution of fracturing water has the most significant pollution on the production of underground gas reservoirs.
4.3. Stress Sensitivity Effects
When the impact of fracturing water on storage production pollution is not considered and the pollution to production caused by the characteristics of underground gas reservoirs is focused on, the pollution to production caused by the stress sensitivity of storage is more significant. When the stress applied to the storage rock changes, the rock will deform and the pore structure of the rock will change accordingly, which will eventually lead to changes in the rock seepage and storage production (permeability, porosity, etc.), the so-called stress sensitivity phenomenon occurs. For tight reservoirs, due to their small pore throats, the internal structure of the rock is more complex than that of conventional oil and gas reservoirs, and its stress sensitivity is more pronounced. In addition, the stress and deformation of tight reservoirs is a complex and slow process. Under a certain overburden pressure and pore pressure, the effective stress on the reservoir is constant. However, with the extension of time, the pores of the reservoir continue to be compressed and the permeability will continue to change with the passage of time, which is called the delayed stress sensitivity effect. Therefore, in the middle and late stages of development, stress-sensitive pollution becomes the main source of production pollution (Figure 10).
4.4. Threshold Pressure Gradient Effects
For tight reservoirs, the reservoir characteristics of low porosity and low permeability make the seepage law of reservoir fluid (oil, gas, water) very different from that of conventional medium and high permeability reservoirs. The most obvious difference is that the fluid will have a threshold pressure gradient in a tight reservoir. In general, compared with solid solute pollution from fracturing water, water solvent pollution from fracturing water and stress sensitivity, the threshold pressure gradient has the lowest impact on production pollution. From the perspective of the full cycle, the start-up pressure gradient is more harmful to the production in the first half of the early, middle and late stages of development (about 4000 days ago; Figure 11). This is because the permeability of the core will decrease rapidly at the initial stage of the decrease in pore fluid pressure, and the threshold pressure gradient of the core will increase with the decrease of permeability. Therefore, in the initial stage of pore fluid pressure drop, the threshold pressure gradient of the experimental cores rises rapidly. When the pore fluid pressure further decreases, on the one hand, the permeability of the core tends to be stable gradually, so the variation range of the threshold pressure gradient of the core will also decrease. On the other hand, when the pore fluid pressure is low, the slippage effect has a greater impact on the gas seepage, resulting in a high apparent permeability of the core and a decrease in the threshold pressure gradient of the core. Therefore, under the influence of the dual factors of permeability and slippage effect, the increase of the threshold pressure gradient of the core will be much slower when the pore fluid pressure is low.
5. Preventions of Water Pollution in Underground Gas Reservoir
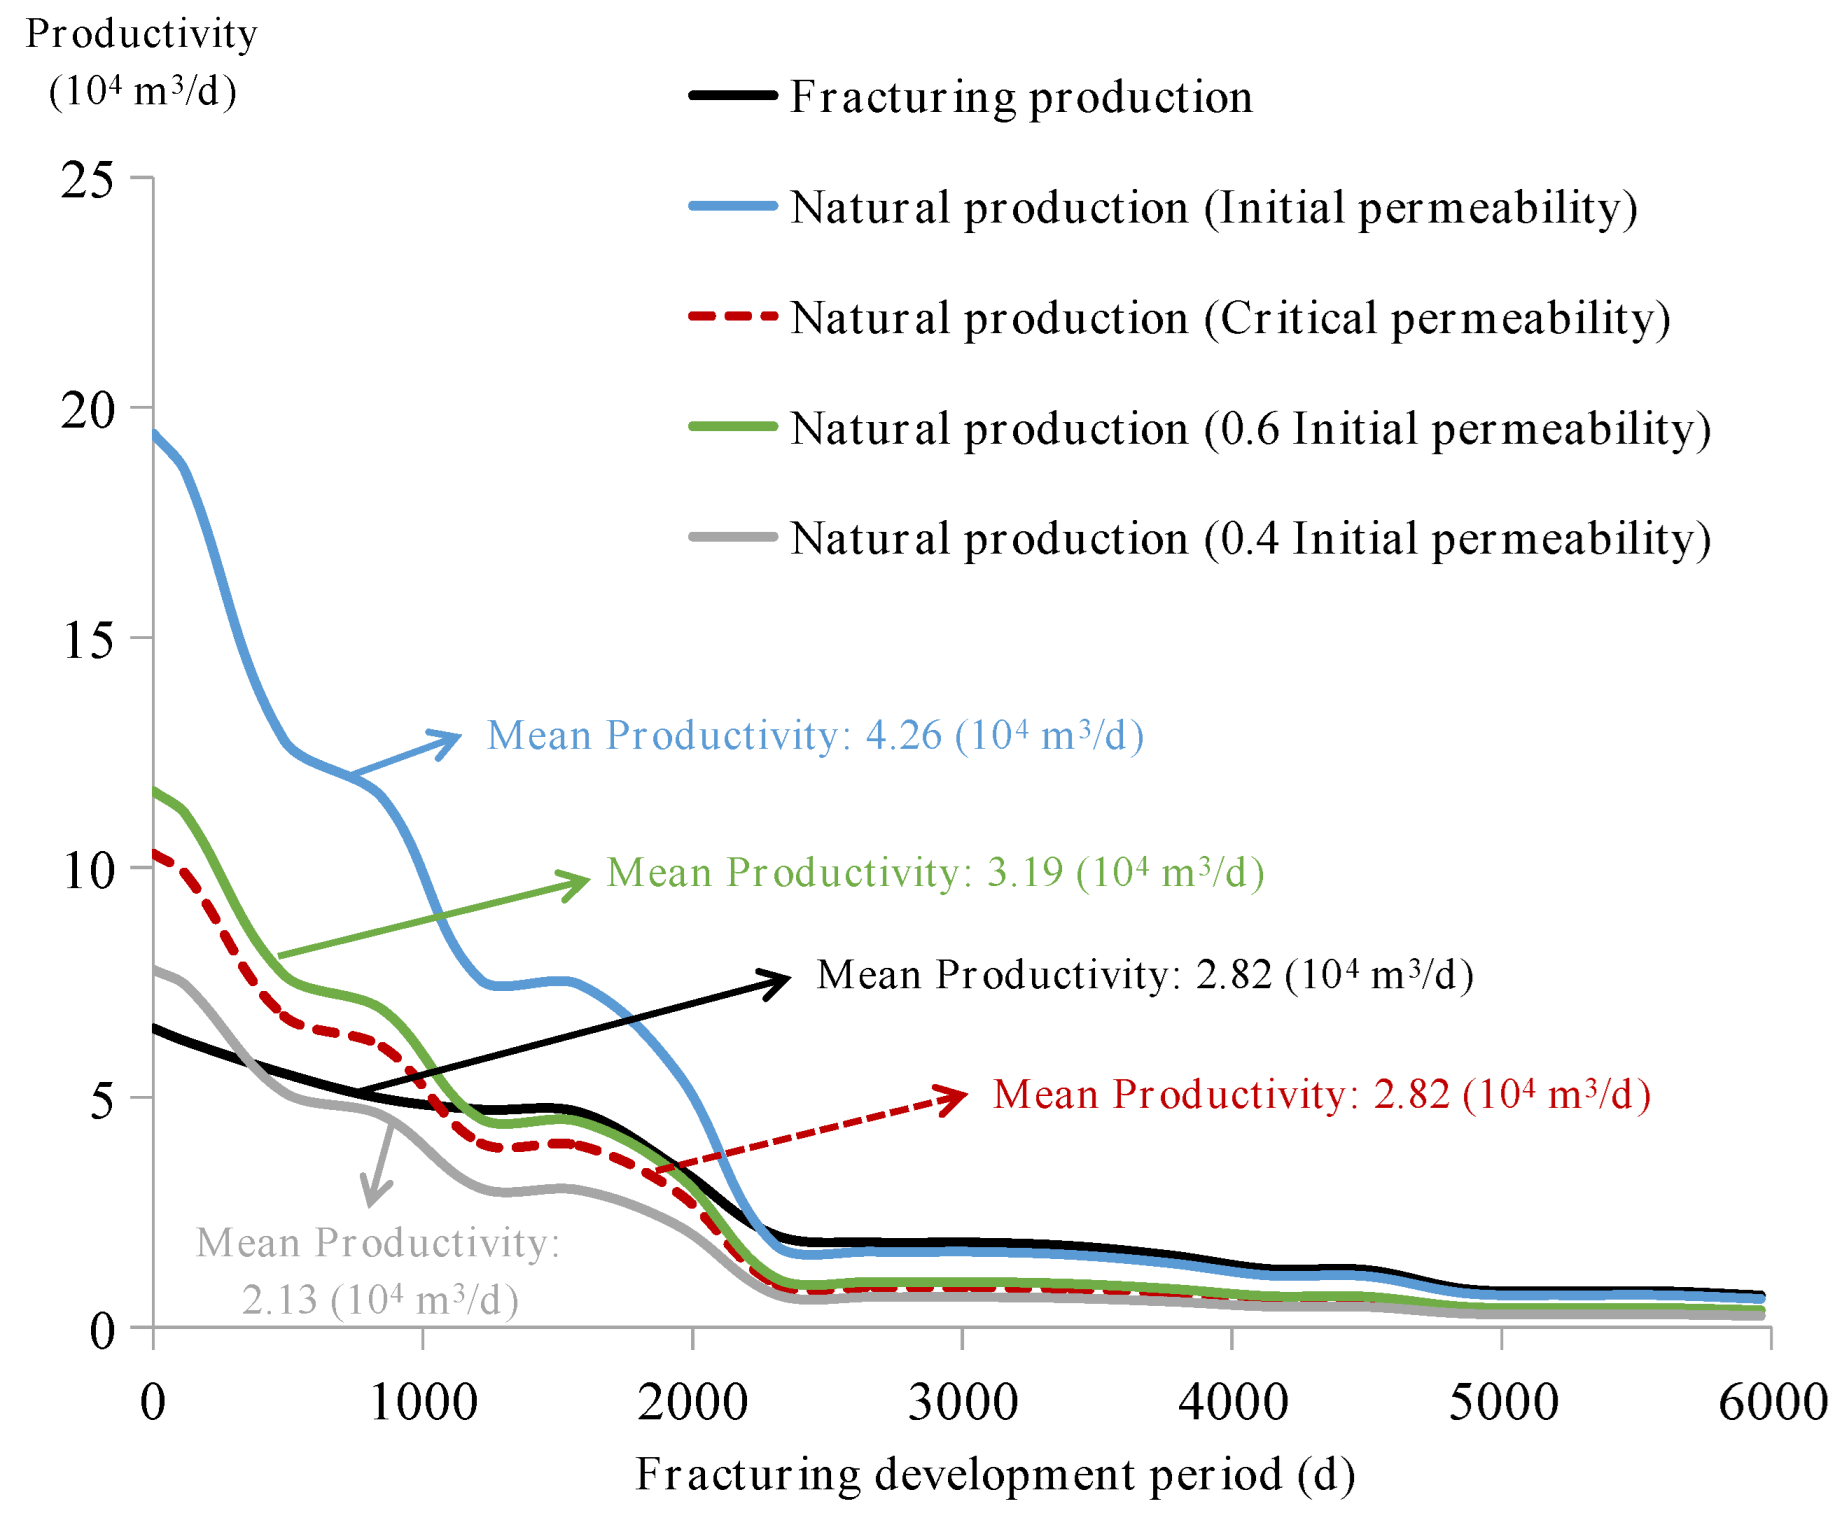
As we discussed, the fracturing development is not adoptable for any underground gas reservoirs due to the production pollution from the fracturing water, but there is a criterion for choosing the production mode. To determine the production mode, we investigated the gas production of the natural development and the fracturing development, and fracturing development is preferable only when the mean production is higher than that of the natural development. To calculate the production of the fracturing development, we considered solid pollution, liquid pollution, stress sensitivity and threshold pressure gradient, and we adopted the mean permeability of the Daniudi gas field, 0.38 mD (after fracturing), as the initial permeability. To calculate the production of the natural development, we considered stress sensitivity and threshold pressure gradient, but we varied the initial permeability from 0.38 mD to 0.15 mD (0.4×). Via tuning the initial permeability, we figured out the critical permeability (Figure 12), 0.20 mD, for the determination of the production mode. Reservoirs with an initial permeability over 0.20 mD are preferably produced by natural energy rather than fracturing.
It is notable that the critical permeability, 0.2 mD, is obtained by the established model according to the specific boundary and initial conditions we adopt in this work. At various boundary and initial conditions, such as initial reservoir pressure, boundary reservoir pressure, geological properties, rock and clay properties and fracture properties, a diverse critical permeability can be calculated. The key goal of this section is to demonstrate the application of our model to obtain a critical permeability. According to the critical permeability, further prevention of the fracturing water pollution to the gas reservoir accordingly can be implemented.
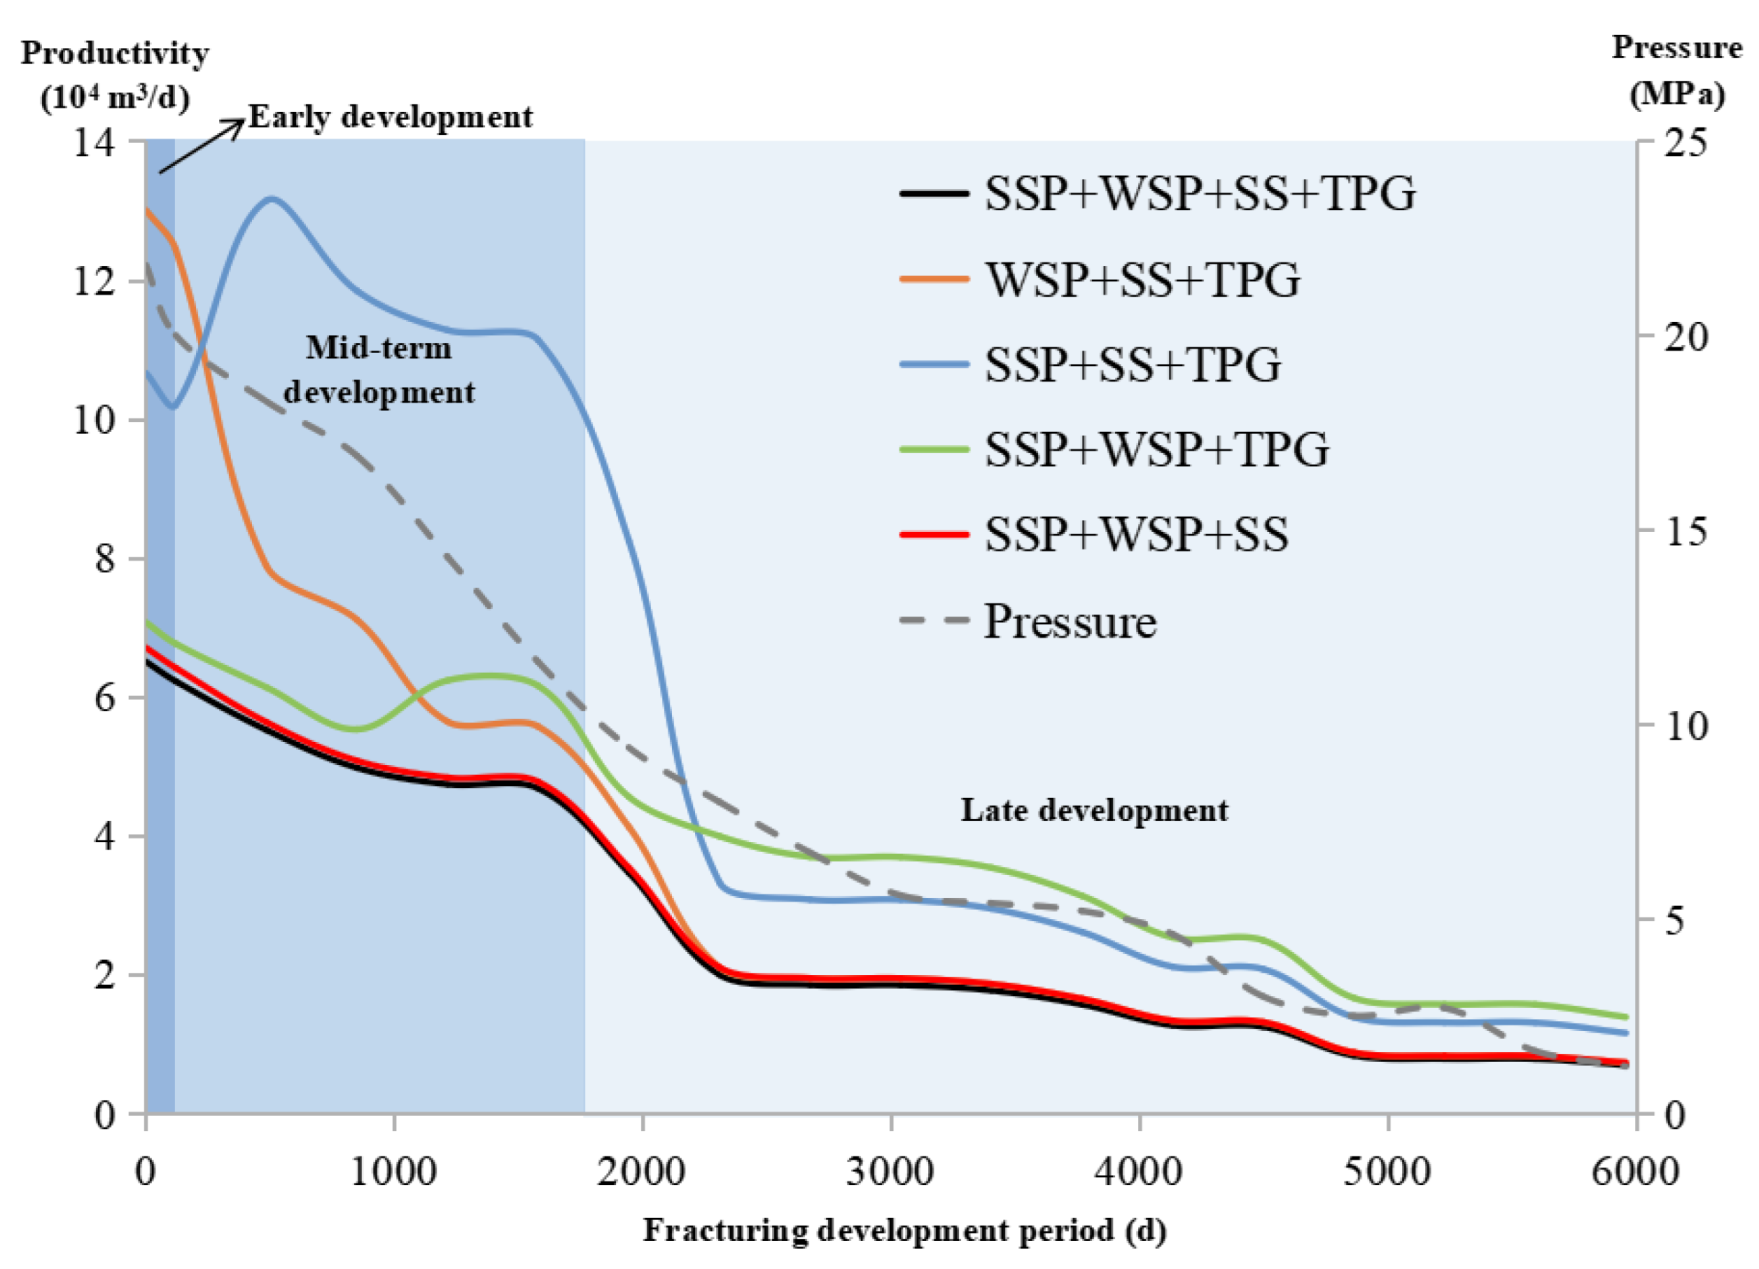
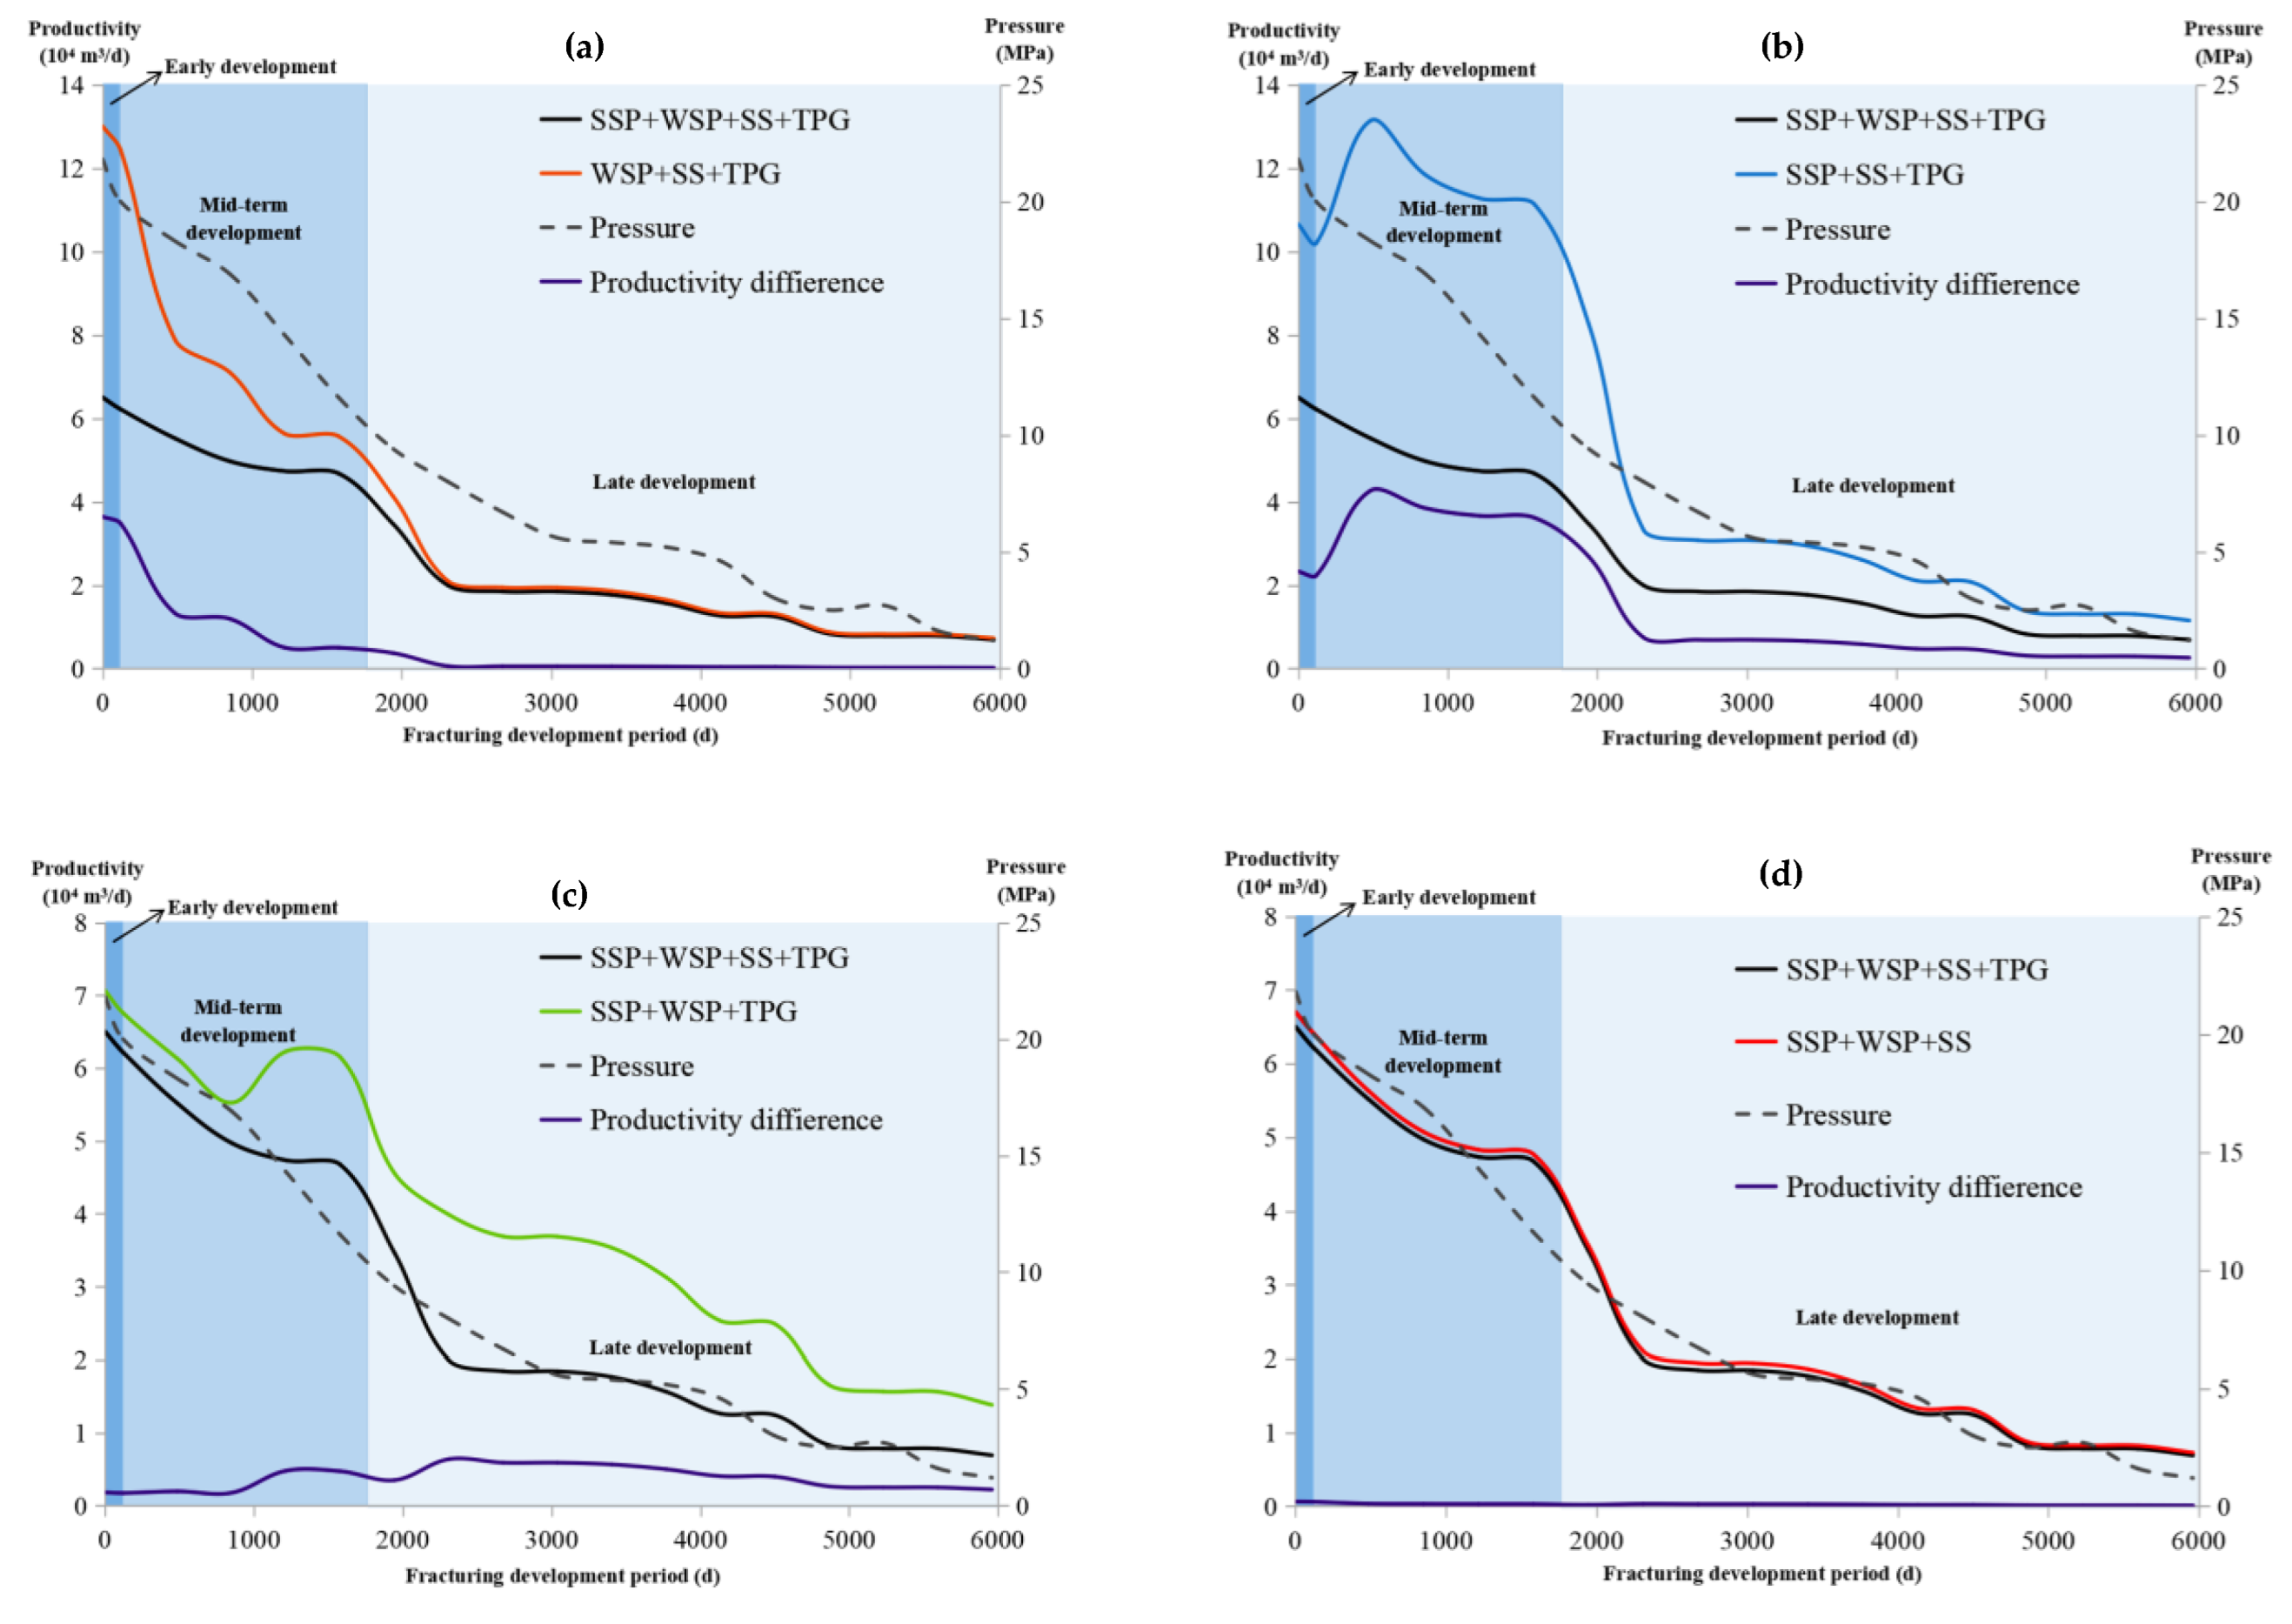
In order to comprehensively explore the influence degree of each pollution factor on production under the combined action of multiple pollution factors in the whole development cycle, we have discussed the following five scenarios, such as: including all pollution factors contains all pollution factors except solid solute pollution from fracturing water contains all pollution factors except water solvent pollution from fracturing water contains all pollution factors except stress-sensitive injuries contains all pollution factors except threshold pressure gradient pollution (Figure 13). By comparing the difference in production when a single pollution factor is excluded, the influence of each pollution factor on the production in the whole development cycle is obtained (Figure 14).
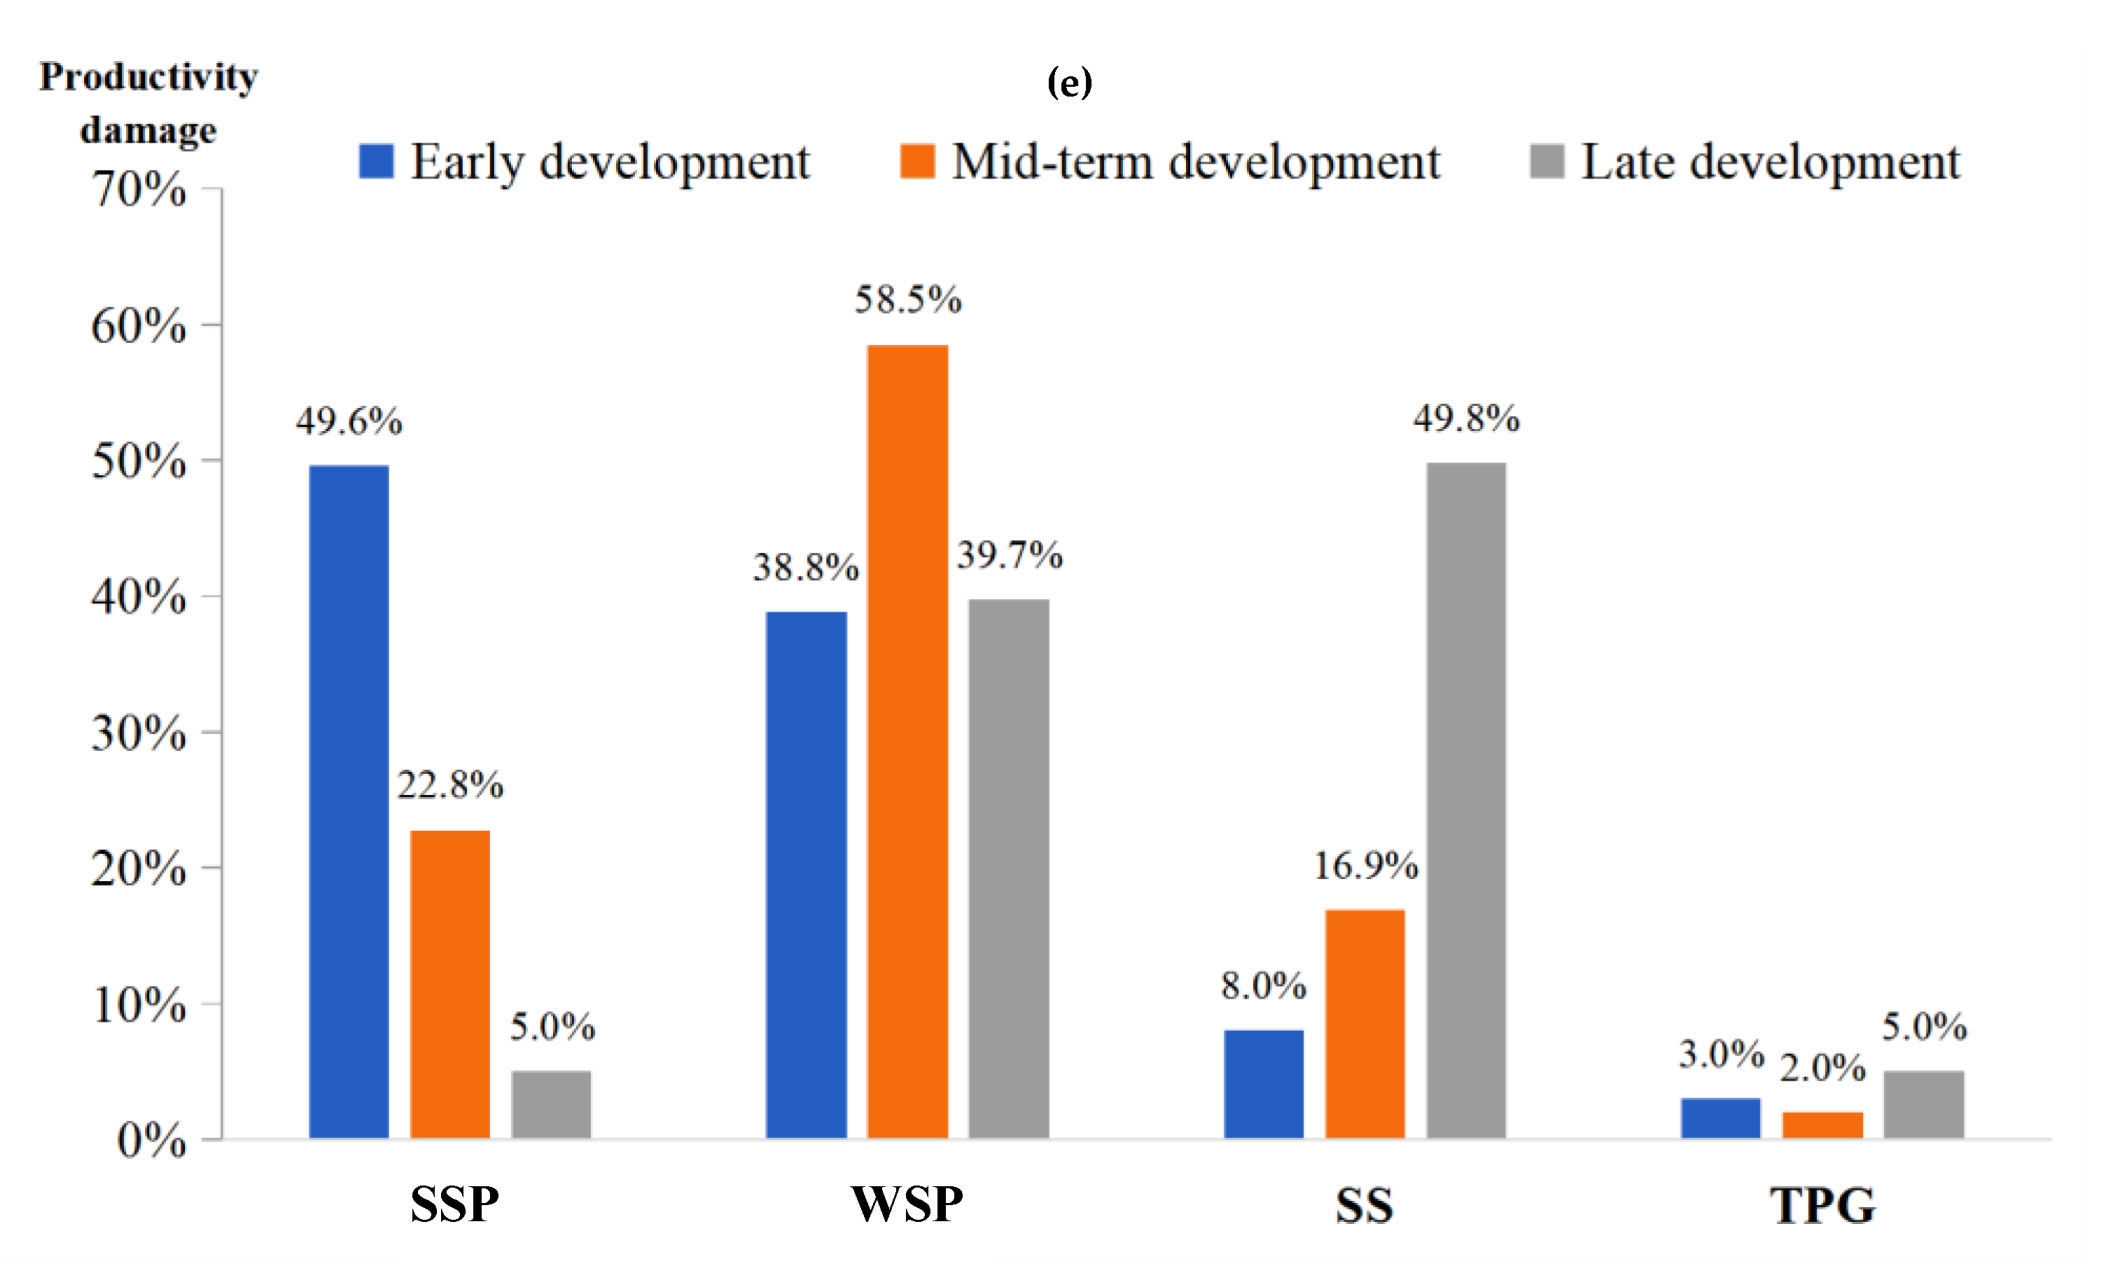
The simulation results show that in the early development, fracturing water-solid relative storage production pollution is the largest, accounting for 40–50%; fracturing water solvent pollution accounts for 30–45%; stress-sensitive pollution accounts for 5–10%; pressure gradient pollution accounts for less than 3%. In the mid-term development, fracturing water has the greatest pollution to storage Production, accounting for 50–60%; solid solute pollution from fracturing water accounts for 15–25%; stress-sensitive pollution accounts for 10–25%; threshold pressure gradient pollution accounts for 3–5%. At the end of development, stress sensitivity has the greatest pollution to storage production, accounting for 40–60%; solid solute pollution from fracturing water accounts for less than 10%; water solvent pollution from fracturing water accounts for 40–50%; threshold pressure gradient pollution accounts for 3% within (Figure 13 and Figure 14).
In addition, from the perspective of the whole development cycle, when considering all the pollution factors of fracturing water-containing solid pollution, water solvent pollution from fracturing water, stress sensitivity and threshold pressure gradient, the average daily production of underground gas reservoirs in the early development stage It is similar to the mid-term, with a difference of no more than 15%; the average daily production in the early and mid-stage development is about three times that of the late-stage development.
According to the numerical results, we clarify that in early development, the solid pollution is dominant due to the formation of filter- and matrix-plugging in pores; the liquid pollution is dominant in mid-term development and significant in the full development cycle due to high water saturation that constrains the gas permeability and clay swelling that constrains the reservoir permeability; in late development, the stress sensitivity is dominant due to the pore collapse caused by the reservoir pressure drop.
We further provide the pollution constraint and production decision based on the clarified mechanisms. When considering pollution constraints, we suggest optimizing both the propping agent and solvent of the fracturing water to reduce the production pollution of underground gas reservoirs. To reduce the solid pollution in early development and stress sensitivity in late development, we suggest applying the propping agent with a large particle radius, which maintains high porosity and constrains the pore collapse compared with that with a small particle radius. To reduce the liquid pollution in mid-term development, we suggest adding the clay stabilizer and the surfactant to the fracturing water solvent, which constrains the clay swelling and accelerates the fracturing water draining back.
6. Discussion
In this work, we consider the solid solute effect, water solvent effect, stress sensitivity and threshold pressure gradient in our model to reveal the fracturing water pollution to the production of the gas reservoirs. Our model and analysis are adaptable for the precise forecast of gas production and reliable prevention of fracturing water pollution in tight rock gas reservoirs developed by water fracturing.
In addition to these factors, more factors should be considered since situations of the actual gas reservoirs can be more complicated than reported in this work. For instance, fluid species and chemical equilibrium should be considered when the water with high salinity or carrying acid or base is adopted for fracturing [38]. The chemical reaction between the water solvent and reservoir probably corrodes the rock and clay, increasing the porosity and permeability. However, the solid solute can spread more broadly after the corrosion, which conversely inhibiting gas production. Therefore, further studies on the effects of fluid species and chemical equilibrium are promising. Besides, improving our model to study the fracturing water pollution to coalbed methane production is highly recommended. The coalbed demonstrates various physical properties compared with rock reservoirs, complicating the gas production forecasting and water pollution evaluation [39]. Moreover, the effects of 3D heterogeneity of the gas reservoir on gas production and fracturing water pollution are encouraged based on expanding our model from 2D to 3D form. Last but not least, coupling researches on gas production and fracturing water pollution considering CO2 underground sequestration are promising to achieve a water-energy-environment eco-system.
7. Conclusions
We have demonstrated the mechanisms of the fracturing water pollution, particularly the fracturing water pollution in the underground gas reservoir. We divided the fracturing water pollution into solid solute pollution and water solvent pollution to bring a comprehensive insight into how fracturing water pollution impacts the permeability and production of the underground gas reservoir. We revealed that the injected solid solute plugged the entrance of the narrow pores and plugged the inside domain of the wide pores to trigger the permeability decline of the underground gas reservoir. In addition, the fracturing water solvent displaced the gas in pores to reduce the gas saturation and swelled the reservoir matrix to collapse the pores, leading to the production decline of the underground gas reservoir.
We clarified that as the underground gas reservoir was developed from the early stage to the late stage, the pollution contribution from the solid solute of the fracturing water decreased from 50% to 5%. Meanwhile, the pollution contribution from the water solvent of the fracturing water maintained over 40%, and in the mid-term development was roughly 60%. In general, the fracturing water pollution to the permeability and production of the underground gas reservoir accounted for over 80% in the early and mid-term development stages and 62% throughout the development.
We provided preventions for fracturing water pollution in the underground gas reservoir to eliminate the permeability and production decline. According to our numerical results, we proposed that reservoirs with an initial permeability over 0.20 mD are preferably produced by natural energy rather than fracturing. In terms of the underground gas reservoirs with an initial permeability under 0.20 mD, the fracturing water should be used after optimization. Once using the fracturing water, we suggest applying the propping agent with a large particle radius to reduce the pollution from the solid solute and adding the clay stabilizer and the surfactant to the fracturing water to reduce the pollution from the water solvent.
Author Contributions
F.H. was the primary author of this article, with all co-authors also contributing to the manuscript. F.H. and R.W. developed the ideas and concepts of this work. F.H. and K.C. undertook the core flooding experiments and the numerical simulations of this work. F.H. drew the manuscript and R.W. supervised and edited the manuscript. They warrant that the article is the authors’ original work, has not received prior publication and is not under consideration for publication elsewhere. All authors have read and agreed to the published version of the manuscript.
Funding
The authors are financially support from the Key R & D Plan of Shaanxi Province (key industrial innovation chain (Group)) “Research, development and industrialization promotion of small-molecular recyclable self-cleaning fracturing water (Project No.2022ZDLSF07-04)”.
Data Availability Statement
The raw data supporting the conclusion of this article will be made available by the authors, without undue reservation.
Conflicts of Interest
The authors declare that the research was conducted in the absence of any commercial or financial relationships that could be construed as a potential conflict of interest.
References
- Sun, Z.; Li, Z.; Song, H.; Xing, Y.; Zhang, H.; Zhu, Q.; Li, Z. Sponge middle urban construction influence on runoff water characteristic curve. China Water Supply Drain. 2020, 36, 117–122. [Google Scholar] [CrossRef]
- Tan, J.; Li, M.; Song, H.; Zhu, Q.; Li, T. Slope planting CaoGou infiltration simulation and impact analysis on construction sponge city. J. Environ. Eng. 2018, 4, 150–155. [Google Scholar] [CrossRef]
- Sun, Z.; Song, H.; Xing, Y.; Li, J.; Lu, Y.; Wang, J. Simulation of rainwater infiltration and heavy metal pollutant migration in permeable brick pavement system in sponge City. Environ. Eng. 2020, 38, 46–52+100. [Google Scholar] [CrossRef]
- Bahrami, H.; Rezaee, M.R.; Ostojic, J.; Nazhat, D.; Clennell, B. Evaluation of Damage Mechanisms and Skin Factor in Tight Gas Reservoirs. In Proceedings of the SPE European Formation Damage Conference, Noordwijk, The Netherlands, 7 June 2011. [Google Scholar]
- Wu, Y.; Ma, L.; Huang, S.; Cheng, L. A transient two-phase flow model for production prediction of tight gas wells with fracturing water-induced formation pollution. J. Pet. Sci. Eng. 2021, 199. [Google Scholar] [CrossRef]
- Song, H.; Liu, Q.; Yu, M.; Wu, P.; Zhang, Y. Seepage characteristics of shale gas and productivity of fractured Wells. Beijing Sci. Technol. Univ. 2014, 4, 139–144. [Google Scholar] [CrossRef]
- Fang, J.; Song, H.; Xu, J.; Yang, L.; Li, Z. Considering the effects of effective stress in coal mine underground reservoir water storage coefficient calculation model. J. Coal Sci. 2019, 44, 3750–3759. [Google Scholar] [CrossRef]
- Li, Y. Microscopic Pore Characteristics and Fracturing Water Damage Mechanism of Chang 8 Reservoir in Heshui Area. Master’s Thesis, Xi’an Shiyou University, Xi’an, China, 2019. [Google Scholar]
- Gao, X.; Song, H.; Shang, X.; Zhu, W. Fluid-structure interaction model of shale gas multi-stage fractured horizontal well considering nano-pore characteristics. In Proceedings of the 23rd Annual Conference of Beijing Mechanics Society, Ghent, Belgium, 23 December 2017. [Google Scholar]
- Qian, B.; Li, W. Hydraulic fracturing technology and environmental problems in shale gas Wells. Nat. Gas Oil 2013, 1, 4+48–53. [Google Scholar]
- Bottero, S.; Picioreanu, C.; Enzien, M.; van Loosdrecht, M. Formation pollution and impact on gas flow caused by biofilms growing within proppant packing used in hydraulic fracturing. In Proceedings of the SPE International Symposium and Exhibition on Formation Damage Control, Lafayette, LA, USA, 13–15 February 2010. [Google Scholar]
- Zhu, W.; Song, H.; He, D.; Wang, M.; Jia, A.; Hu, Y. Mathematical model and production equation of low-velocity non-Darcy seepage in water-bearing and low-permeability gas reservoirs. Nat. Gas Geosci. 2008, 5, 685–689. [Google Scholar]
- Zhu, W. Coupled Flow Theory of Shale Gas with Multi-Scale Transport and Multi-Zone Beijing. Ph.D. Thesis, University of Science and Technology Beijing, Beijing, China, 2017. [Google Scholar]
- Fan, X.; Ren, X. Damage characteristics and experimental influencing factors of fracturing water in tight gas reservoirs. Petrochem. Ind. Appl. 2017, 36, 24–27. [Google Scholar]
- Cao, Y.; Qu, Z.; Guo, T.; Xu, H.; Gong, D. Experimental study on reservoir damage mechanism of water-based fracturing water. J. Xi’an Shiyou Univ. Nat. Sci. Ed. 2016, 31, 87–92+98. [Google Scholar]
- Liu, J. Research on Fracturing Water Damage Mechanism of Low Permeability Sandstone Gas Reservoir. Ph.D. Thesis, Graduate University of Chinese Academy of Sciences, Institute of Seepage Fluid Mechanics, Beijing, China, 2011. [Google Scholar]
- He, C.; Hua, M. Reservoir damage by fractu ring fluid and its prevention. Drill. Fluid Comple Tion Fluid 2003, 20, 49–53. [Google Scholar]
- Lu, Y. Damage reservoir by fracturing fluid and its protection technology. Drill. Fluid Complet. Fluid 1995, 12, 39–46. [Google Scholar]
- Wu, Y. An analytical model for analyzing the impact of fracturing water-induced formation pollution on rate transient behavior in tight formations. J. Pet. Sci. Eng. 2019, 179, 513–525. [Google Scholar] [CrossRef]
- Li, T.; Zhou, J.; Jin, Z.; Wang, J.; Zhang, H. Application of NMR technique in the evaluation of fracturing water damage. J. Chongqing Univ. Sci. Technol. Nat. Sci. Ed. 2014, 16, 62–65. [Google Scholar]
- Wang, Y.; Zhou, K.; Wang, W.; Li, G. Relationship between solid particles from incoming well flu ids in production and formation damage. J. Jianghan Pet. Inst. 2001, 23, 65–66. [Google Scholar]
- Liu, N.; Gao, Q. Experimental Study on Pollution Mechanism of Fracturing water in CBM Reservoir of Eastern Yunnan and Western Guizhou. IOP Conf. Ser. Earth Environ. Sci. 2018, 189, 052075. [Google Scholar]
- Fu, L.; Liao, K.; Ge, J.; Huang, W.; Chen, L.; Sun, X.; Zhang, S. Study on the pollution and control method of fracturing water to tight reservoir matrix. J. Nat. Gas Sci. Eng. 2020, 82, 10346. [Google Scholar] [CrossRef]
- Li, Z. Damage evaluation and optimization of fracturing water in low porosity and low permeability gas reservoirs. Chem. Des. Commun. 2017, 43, 38. [Google Scholar]
- Wu, H. Analysis and evaluation of fracturing water damage factors. Petrochem. Technol. 2016, 23, 187. [Google Scholar]
- Zhang, B.; Zhang, H.; Wu, X.; Wu, P. Hydraulic fracturing of low permeability oilfield fracturing water damage experimental study. J. Chongqing Inst. Technol. Nat. Sci. Ed. 2016, 17, 82–86. [Google Scholar] [CrossRef]
- Zhou, W.; Liang, X. Evaluation of fracturing water system on damage performance of reservoir matrix in tight sandstone gas reservoir. J. Yangtze Univ. 2016, 13, 7+64–69. [Google Scholar]
- Pang Feng, P. Microsimulation Study on Multi-Functional Environmental Fracturing Water. Ph.D. Thesis, China University of Petroleum Beijing, Beijing, China, 2019. [Google Scholar] [CrossRef]
- Gao, T.; Qu, H.; Chang, C. Mechanism and evaluation of fracturing water pollution in low-permeability sandstone gas reservoirs. Liaoning Chem. 2021, 50, 901–903. [Google Scholar] [CrossRef]
- Lin, T. Study on Pollution Mechanism and Hydraulic Fracturing Modification in Deep Condensate Reservoirs. Ph.D. Thesis, Southwest Petroleum Institute, Chengdu, China, 2004. [Google Scholar]
- Sun, D. Study on the mechanism of Fracturing Water Seepage and Pollution and Timing of Well Staging in Fuyu Tight Oil Reservoir. Ph.D.Thesis, Northeastern Petroleum University, Daqing, China, 2022. [Google Scholar] [CrossRef]
- Yu, M.; Zhu, W.; Song, H. Development of visual microscopic seepage model for low permeability reservoir. J. Liaoning Tech. Univ. Nat. Sci. Ed. 2013, 32, 1646–1650. [Google Scholar]
- Gao, X.; Song, H.; Zhu, W.; Shang, X.; Li, Z. Adsorption effect of shale gas in nano-pores simulated by LBM. In Proceedings of the 24th Annual Conference of Beijing Mechanics Society, Beijing, China, 24 November 2018; Volume 841. [Google Scholar]
- Wang, M.; Zhu, W.; Li, J.; Wang, Z.; Xu, J. Analysis of two-phase seepage in low-permeability fractured well networks. J. China Univ. Min. Technol. 2010, 39, 779–783. [Google Scholar]
- Song, H.; He, D.; Lou, Y.; Yi, H.; Zhu, W. Production of low-velocity nonlinear percolation in low permeability underground gas reservoirs. Spec. Oil Gas Reserv. 2011, 18, 79–81+139. [Google Scholar]
- Liu, Y. Absorption of fracturing water in shale storage and its influence on engineering. Ph.D. Thesis, China University of Petroleum Beijing, Beijing, China, 2016. [Google Scholar]
- Yuan, X.; Xu, D.; Chen, S.; He, X.; Cheng, N.; Chen, J. Pollution of fracturing water intrusion on shale storage conductivity. Sci. Technol. Eng. 2020, 20, 3591–3597. [Google Scholar]
- Tao, Z.; Sun, S. A coupled Lattice Boltzmann approach to simulate gas flow and transport in shale reservoirs with dynamic sorption. Fuel 2019, 246, 196–203. [Google Scholar]
- Du, S.; Wang, J.; Wang, M.; Yang, J.; Zhang, C.; Zhao, Y.; Song, H. A systematic data-driven approach for production forecasting of coalbed methane incorporating deep learning and ensemble learning adapted to complex production patterns. Energy 2022, 263, 126121. [Google Scholar] [CrossRef]
Figure 1.
Solid pollution of fracturing water to the underground gas reservoir. (a) Filter plugging pollution. (b) Matrix plugging pollution.
Figure 1.
Solid pollution of fracturing water to the underground gas reservoir. (a) Filter plugging pollution. (b) Matrix plugging pollution.

Figure 2.
Core flooding samples. (a) Artificial core. (b) natural core. (c) Variation curve of solid solute pollution from fracturing water degree with formation pressure drop.
Figure 2.
Core flooding samples. (a) Artificial core. (b) natural core. (c) Variation curve of solid solute pollution from fracturing water degree with formation pressure drop.

Figure 3.
The core flooding experimental process.

Figure 4.
Variation curves. (a) Variation curve of water solvent pollution from fracturing water degree with formation pressure drop. (b) Variation curve of stress-sensitive pollution degree with drop of formation pressure. (c) Variation curve of pollution degree of threshold pressure gradient with drop of formation pressure.

Figure 5.
Schematic diagram of fracturing development zones for water-bearing underground gas reservoirs considering fracturing water pollution.
Figure 5.
Schematic diagram of fracturing development zones for water-bearing underground gas reservoirs considering fracturing water pollution.

Figure 6.
Pressure distribution during the fracturing development derived from the numerical model. (a) 30 days. (b) 1020 days. (c) 3000 days. (d) 5520 days.
Figure 6.
Pressure distribution during the fracturing development derived from the numerical model. (a) 30 days. (b) 1020 days. (c) 3000 days. (d) 5520 days.

Figure 7.
Verification of the numerical model with the field data. (a) From development pressure perspective. (b) From gas production perspective.
Figure 7.
Verification of the numerical model with the field data. (a) From development pressure perspective. (b) From gas production perspective.

Figure 8.
Influence of pollution on gas reservoir production under the condition of only solid solute pollution from fracturing water.
Figure 8.
Influence of pollution on gas reservoir production under the condition of only solid solute pollution from fracturing water.

Figure 9.
Influence of pollution on gas reservoir production under the condition of only water solvent pollution from fracturing water.
Figure 9.
Influence of pollution on gas reservoir production under the condition of only water solvent pollution from fracturing water.

Figure 10.
Influence of pollution on gas reservoir production under the condition of stress-sensitive pollution only.
Figure 10.
Influence of pollution on gas reservoir production under the condition of stress-sensitive pollution only.

Figure 11.
The pollution effect on gas reservoir production under the condition of only threshold pressure gradient pollution.
Figure 11.
The pollution effect on gas reservoir production under the condition of only threshold pressure gradient pollution.

Figure 12.
Critical permeability for natural development rather than fracturing.

Figure 13.
The pollution effect on gas reservoir production under the condition of only threshold pressure gradient pollution.
Figure 13.
The pollution effect on gas reservoir production under the condition of only threshold pressure gradient pollution.

Figure 14.
The influence of each pollution factor on the production in the whole development cycle. (a) The influence of solid solute pollution. (b) The influence of water solvent. (c) The influence of stress sensitivity. (d) The influence of threshold pressure gradient. (e) The contribution of each pollution factor.


Table 1.
Test core physical properties.
| Core Serial Number | Diameter (cm) | Length (cm) | Porosity at Atmospheric Pressure (%) | Permeability at Atmospheric Pressure (×10−3 μm2) | Remark |
|---|---|---|---|---|---|
| 1 | 2.534 | 5.968 | 5.51 | 0.05 | Conventional core |
| 2 | 2.536 | 6.210 | 6.98 | 0.17 | Conventional core |
| 3 | 2.538 | 4.254 | 8.46 | 0.53 | Conventional core |
| 4 | 2.535 | 6.041 | 10.63 | 1.24 | Conventional core |
| 5 | 2.538 | 6.084 | 10.95 | 3.94 | Fractured core |
Table 2.
Meshing information and initial and boundary conditions.
 | Initial outer boundary pressure | 21 MPa |
| Bottom hole flow pressure | 5 MPa | |
| Reservoir permeability (averages) | 0.046 mD | |
| Reservoir porosity (average) | 0.1 | |
| Fracture half-length | 200 m | |
| Fracture width | 1 mm | |
| Reservoir depth | 10 m | |
| Wellbore radius | 0.1 m | |
| Reservoir temperature (isothermal) | 24 ℃ | |
| Reservoir width (square) | 600 m | |
| Gas viscosity | 0.015 mPa·s |
Publisher’s Note: MDPI stays neutral with regard to jurisdictional claims in published maps and institutional affiliations. |
© 2022 by the authors. Licensee MDPI, Basel, Switzerland. This article is an open access article distributed under the terms and conditions of the Creative Commons Attribution (CC BY) license (https://creativecommons.org/licenses/by/4.0/).
Share and Cite
MDPI and ACS Style
He, F.; Wang, R.; Chen, K. Investigations and Prevention Strategies on the Fracturing Water Pollution Triggering Permeability and Production Decrease in Underground Gas Reservoirs. Water 2022, 14, 3921. https://doi.org/10.3390/w14233921
AMA Style
He F, Wang R, Chen K. Investigations and Prevention Strategies on the Fracturing Water Pollution Triggering Permeability and Production Decrease in Underground Gas Reservoirs. Water. 2022; 14(23):3921. https://doi.org/10.3390/w14233921
Chicago/Turabian StyleHe, Faqi, Ruifei Wang, and Kui Chen. 2022. "Investigations and Prevention Strategies on the Fracturing Water Pollution Triggering Permeability and Production Decrease in Underground Gas Reservoirs" Water 14, no. 23: 3921. https://doi.org/10.3390/w14233921
Note that from the first issue of 2016, this journal uses article numbers instead of page numbers. See further details here.