
How to Create a Regional Diatom-Based Index: Demonstration from the Yuqiao Reservoir Watershed, China

1
Tianjin Key Laboratory of Environmental Technology for Complex Trans-Media Pollution, Tianjin International Joint Research Center for Environmental Biogeochemical Technology, College of Environmental Science and Engineering, Nankai University, Tianjin 300350, China
2
School of Geography and Environmental Science, Tianjin Normal University, Tianjin 300387, China
3
Tianjin Eco-Environmental Monitoring Center, Tianjin 300191, China
4
R&D Department, FS Limited, Katikati 3129, New Zealand
*
Authors to whom correspondence should be addressed.
Water 2022, 14(23), 3926; https://doi.org/10.3390/w14233926
Submission received: 28 September 2022
/
Revised: 20 October 2022
/
Accepted: 28 November 2022
/
Published: 2 December 2022
(This article belongs to the Special Issue Pollution Control and Ecological Restoration in Freshwater and Marine Systems)
Abstract
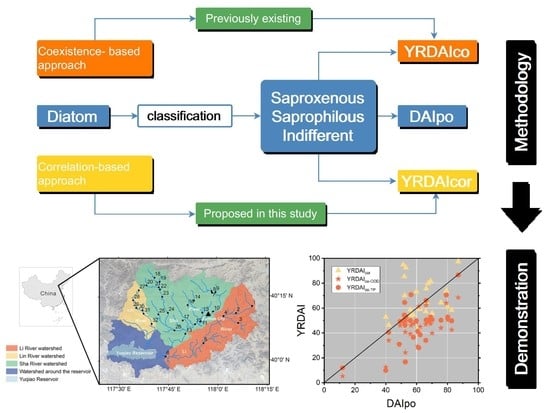
:Diatom-based indices derived from the percentage of diatom taxa groups can be used to assess water quality. As some diatoms are location-dependent, such diatom indices are correspondingly location-dependent and the regional classification of taxa group is thereby needed. This study aims to demonstrate how to create a regional diatom assemblage index (YRDAI) based on a case study from the Yuqiao Reservoir watershed, China. Herein, we proposed a simple taxa classification approach based on the correlation between pollutant concentration and diatom abundance, and compared it with the traditional approach based on the coexistence index. Using the two approaches, a total of 34 diatom taxa groups were reclassified for localization of the well-known DAIpo index. The YRDAI was then derived from the reclassified diatom taxa groups. The results in the Yuqiao Reservoir watershed showed that the correlation-based YRDAIcor scores could better reflect the pollution levels of COD and TP than the coexistence-based YRDAIco scores and the original DAIpo scores with the unreclassified taxa groups. It can be expected that the precision of YRDAI can be improved with the accumulation of the diatom data, and the above approaches can be applied to other watersheds for making their own regional indices.
1. Introduction
With the rapid growth of the population and intensification of industrial and agricultural activities, the freshwater ecosystem has been damaged continuously [1]. To understand the health status of water bodies, water quality can be evaluated by scoring the physical, chemical and biological indices of water bodies based on expert knowledge and government standards [2,3]. Another way to evaluate the water health status is to assess the community characteristics of aquatic organisms through biological monitoring. For example, since the EU Water Framework Directive (WFD) was initiated, all EU states were required to use biological indicators to monitor and evaluate water quality [4]. Because some aquatic organisms are location-dependent, the location-specific knowledge on the relationships between aquatic organisms and water indices are crucial for application of the method. However, such work in many developing countries such as China started later than the developed countries, although some scholars have studied this topic [5,6,7,8]. There is still a gap of knowledge on the relationship between biological indicators and environmental variables.
A diatom-based index, as one of the biological indicators for assessing water quality, has become increasingly popular, because a diatom-based index has been proven to be effective even in the streams where the concentration of a pollutant in water can change significantly within a few hours [9,10]. Meanwhile, the diatom-based index is convenient, as only a small amount of sediment samples is required to quantitatively describe benthic diatom communities [11,12]. In most cases, diatoms respond to changes in water chemistry with a delay, therefore, they reflect relatively long-term status in water chemistry [13,14,15]. For aquatic ecosystems characterized by high stress, diatom-based indices performed better than other biological indices, in terms of reflecting pollution gradients and impacts of specific pollution sources [16].
At present, there are various diatom-based indices, which can reflect the status of organic pollution, eutrophication or specific pollutants of water bodies. For example, the diatom assemblage index (DAIpo) developed by Watanabe et al. was used to reflect the organic pollution status of rivers in Japan [17], and this index has also been applied in East and Southeast Asia [18,19,20,21]. For the DAIpo index, species were divided into three groups, saprophilous, saproxenous and indifferent taxa groups, according to the sensitivity of different species to biological oxygen demand and the symbiosis between species. The DAIpo score was derived from the percentages of three taxa groups [17,22]. The trophic diatom index (TDI) developed by Kelly for assessing river eutrophication is widely used around the world, especially in Europe [23,24,25,26]. For the TDI index, species were allocated to one of five groups based on their sensitivity to phosphorus. Following the similar approach of the TDI, Oeding and Taffs developed a regional diatom index, the Richmond river diatom index (RRDI), for evaluating the eutrophication status of sub-tropical Australian rivers [12]. Other diatom indices for evaluating specific pollutants, e.g., herbicides and pesticides, were also developed based on the difference of diatom sensitivity to pollutants [27].
Diatom-based indices were regarded as having significant applicability across geographic regions due to the cosmopolitan nature of species [28,29]. Diatom-based indices were mainly developed in Japan, Europe or North America [30,31,32,33,34]. Despite a lack of information on the ecological preference and tolerance of diatoms in some countries, diatom-based indices were often directly used [21,35]. However, the environmental selection process was the major driver for diatom biogeography [36,37], and because of the regional differences in associated taxonomic variability within the indices [29,38,39], diatom-based indices responded inconsistently to measured environmental variables in different regions. The development of a new diatom index requires a long-term series of data. Instead, some researchers attempted to create the “borrowed” diatom index through localization of an existing diatom-based index, (e.g., Oeding and Taffs, 2017). Nevertheless, localization of the diatom-based index is necessary to achieve better evaluation results than the direct use of the initial index [40,41], based on the hypothesis that diatoms are location-dependent.
In this study, a correlation-based approach was proposed to replace the coexistence-based approach for simplifying the procedure of diatom reclassification, which is crucial in creating a regional diatom assemblage index. The Yuqiao Reservoir watershed was chosen as an example to validate the approach and demonstrate the localization of DAIpo, a diatom-based index that originated from Japan.
2. Methods
2.1. Establishment of the Yuqiao Reservoir Watershed Diatom Assemblage Index (YRDAI)
2.1.1. General Routine for YRDAI Establishment
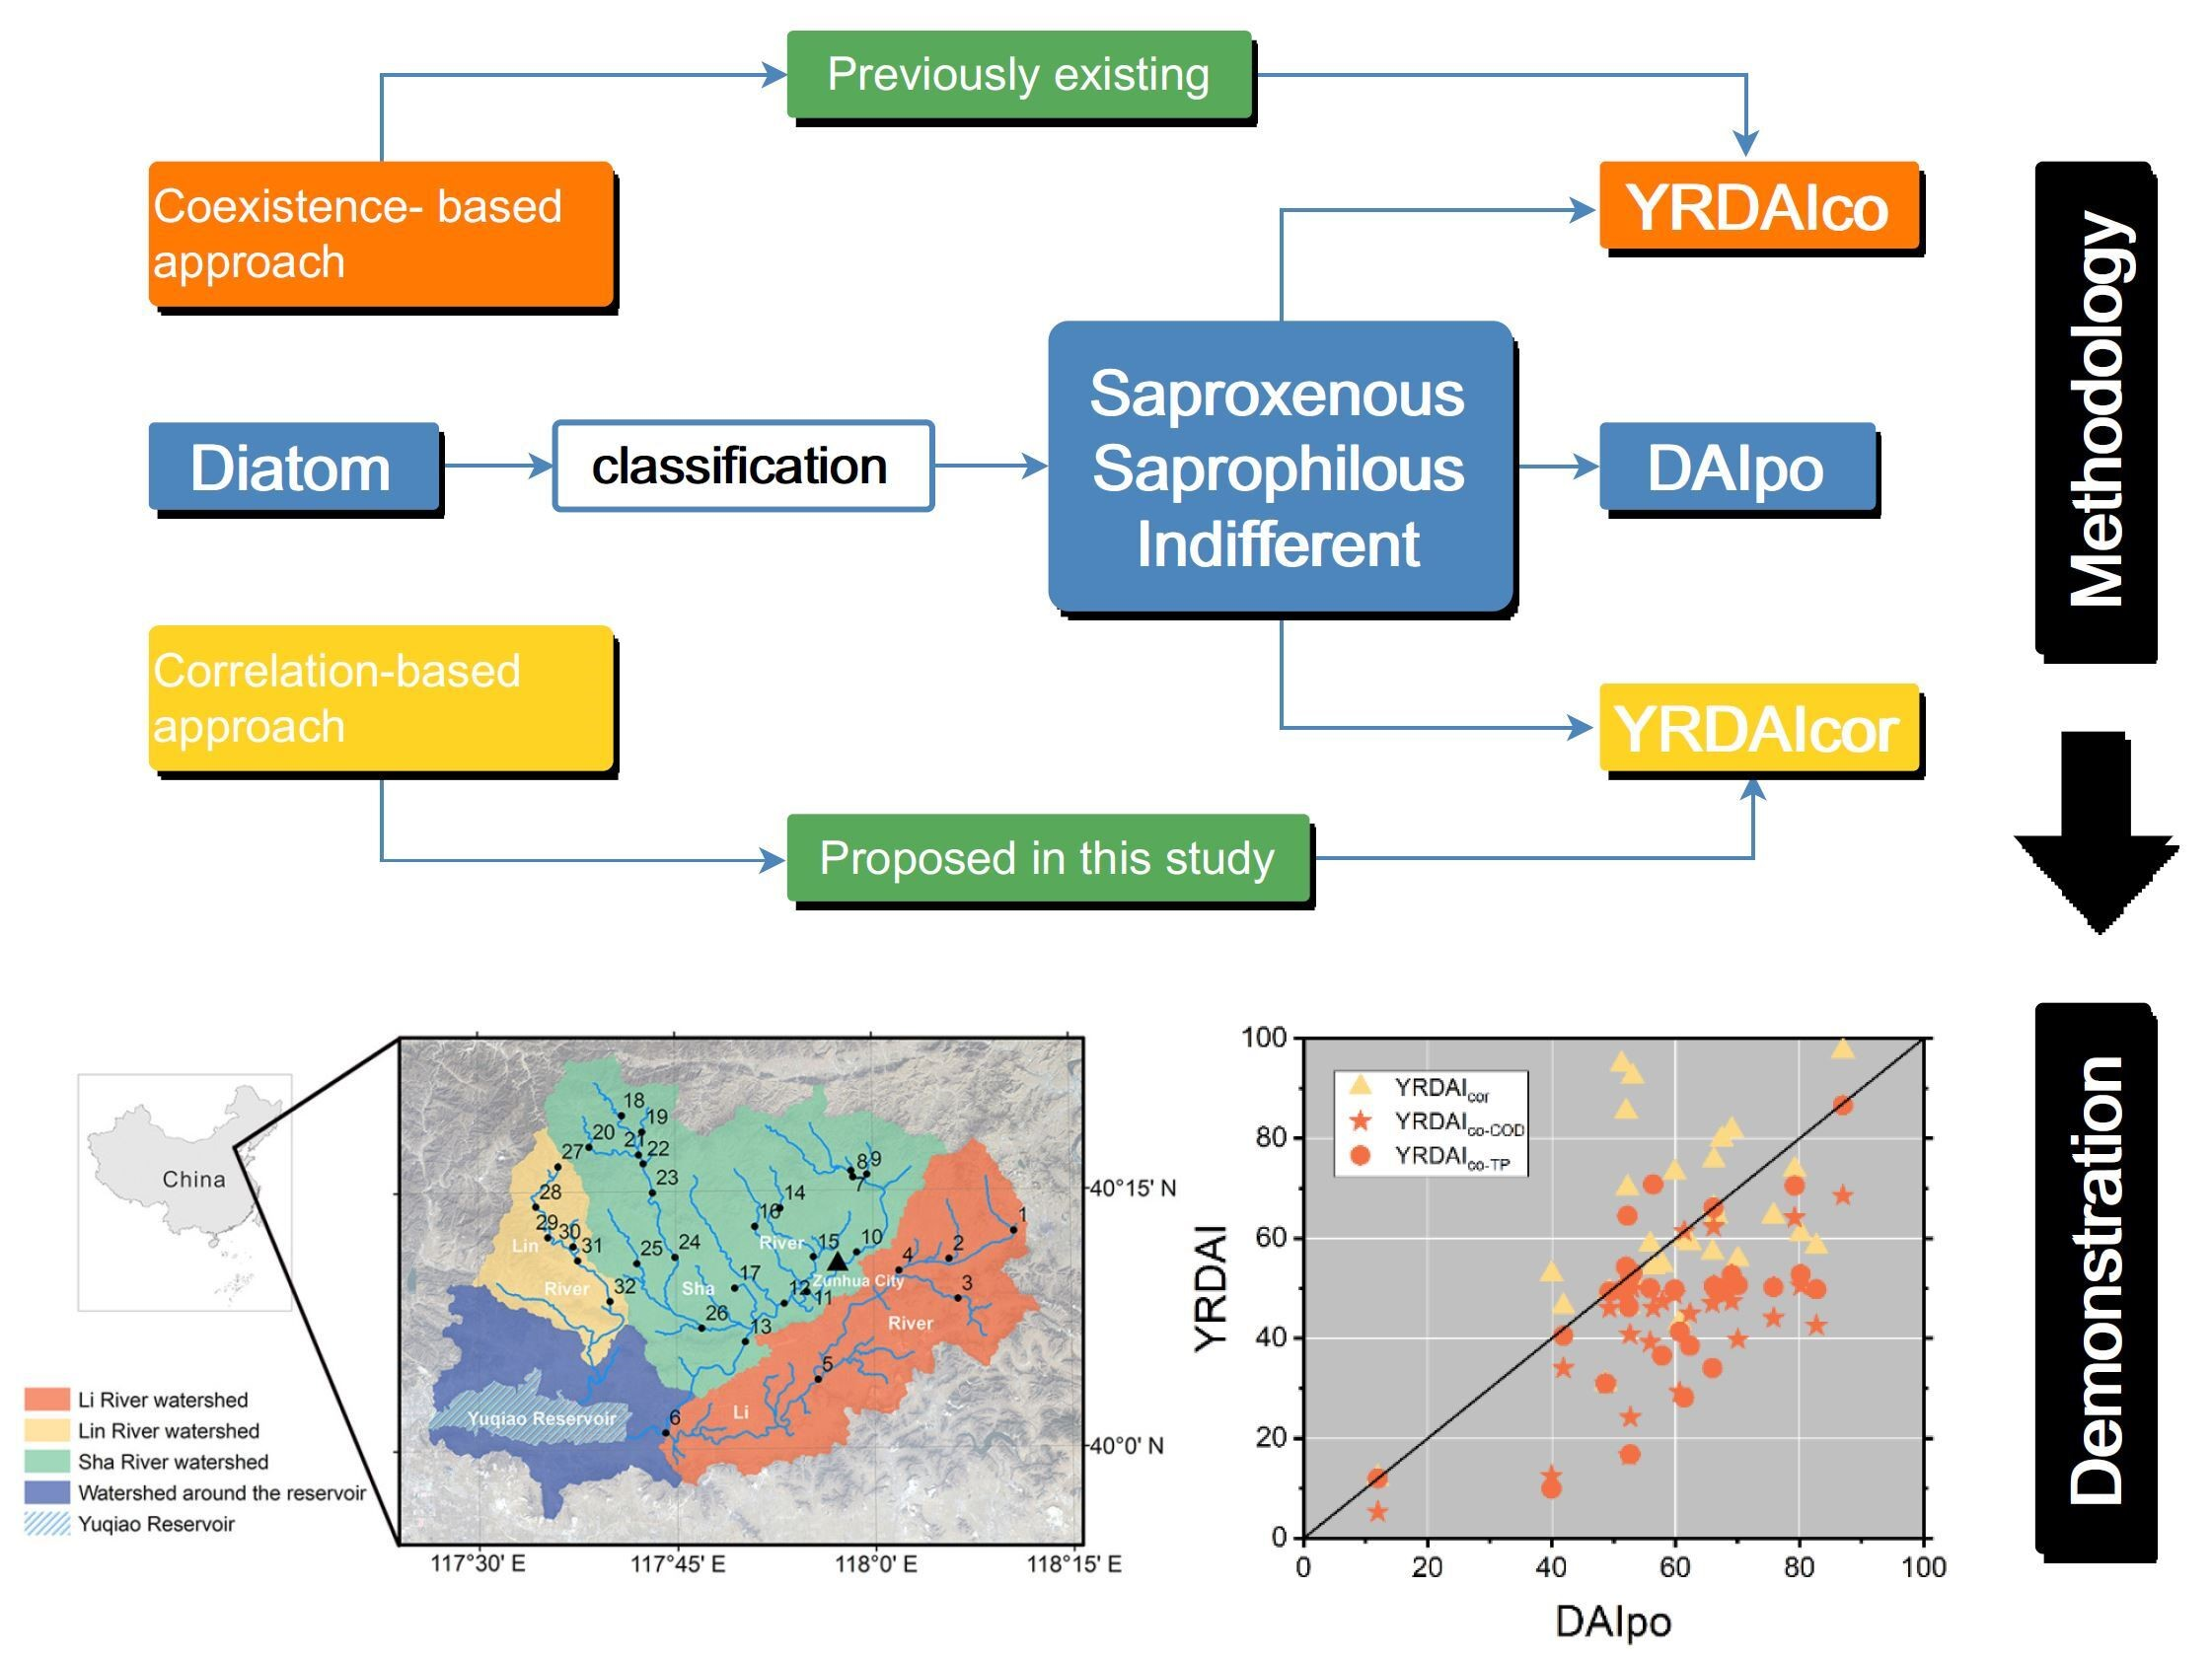
For establishment of a regional diatom index, it is crucial to reclassify the diatom taxa groups based on the relationship between the diatom community and environmental pollutants. The previous approach, the coexistence index of diatom, can be used to reclassify the taxa groups through updating the regional data. Meanwhile, we proposed a new approach based on the correlation between diatom taxa and pollutants. Figure 1 shows the procedure to establish the regional diatom assemblage index for the Yuqiao Reservoir watershed (YRDAI) from the “borrowed” diatom assemblage index (DAIpo).
Compared with other environmental factors, such as pH and electrical conductivity, organic pollution and eutrophication have a greater impact on diatom growth [42]. Organic pollution can be characterized by BOD or COD, and eutrophication is related to nitrogen and phosphorus in water. DAIpo was initially constructed based on the relationship between organic pollution and the diatom community, which also had a correlation with total nitrogen (TN) and total phosphorus (TP). According to the regional water quality standard (GB3838-2002) in the study area, three commonly used parameters (COD, TN and TP) were selected to establish the regional diatom index. However, the diatoms seemed not to be TN-sensitive in this study. Therefore, COD and TP were used to reclassify the diatom taxa groups when developing YRDAI.
2.1.2. Coexistence-Based Approach for Diatom Reclassification
The coexistence index approach followed Watanabe (2005) with a few modifications [43]. The pollutants were selected from pollution characteristics and the relationship with diatom taxa. Pollutant concentration thresholds were then determined. In this study, the thresholds for COD and TP were determined as {<detection limit, ≥40 mg/L} and {≤0.02 mg/L, ≥0.3 mg/L}, respectively, based on the Chinese National Surface Water Quality Standard (GB3838-3002). The pollutant optima value of diatoms was derived from the tolerance index, and the diatom species was classified into three ecological groups (saprophilous species, indifferent species and saproxenous species) by the coexistence index.
The tolerance index (TI) for diatom species that occurred in the study area was computed using diatom proportion as its weight, namely:
where TIj is the tolerance index value of species j; Pollutanti is the pollutant concentration at sampling site i; Pij is the proportion of species j at sampling site i; n is the total number of sampling sites. Here, TI is also the optima value for the diatom species.
The coexistence index (CI) between species j and species k (CIjk) was calculated using the following equation developed by Pianka (1973) [44]:
A total of 25 benthic diatom taxa were reclassified using this approach, and each species was classified into saprophilous, saproxenous or indifferent taxa groups.
2.1.3. Correlation-Based Approach for Diatom Reclassification
The proportion of diatoms with high pollutant sensitivity in a diatom community gradually decreased with the increase in pollutant concentration [43,45]. Therefore, we proposed a simple method to classify diatom groups through the correlation between the proportion of each diatom species and the pollutant concentration at each sampling site. The positive, negative and noncorrelations indicate the diatom belongs to the saproxenous, saprophilous and indifferent taxa group, respectively.
2.1.4. Calculation of Diatom Index Score
The calculation of YRDAI score followed the DAIpo score [43], and the index score ranges from 0 (very serious pollution) to 100 (very slight pollution). According to the two classification approaches above, four diatom indices, i.e., YRDAIco-COD, YRDAIco-TP, YRDAIcor-COD and YRDAIcor-TP were calculated. YRDAIco-COD and YRDAIco-TP were the coexistence-based indices obtained from the COD and TP tolerance sequences for reclassified diatom taxa groups, respectively. YRDAIcor-COD and YRDAIcor-TP were the correlation-based indices derived from the reclassified diatom taxa groups through the correlation analysis between diatom species and the two pollutants (COD, TP), respectively. Because the reclassification results from two pollutants were the same, YRDAIcor-COD and YRDAIcor-TP were also the same. Therefore, YRDAIcor was used to represent YRDAIcor-COD and YRDAIcor-TP for convenience.
2.2. Case Study Area and Sample Analysis
2.2.1. Yuqiao Reservoir
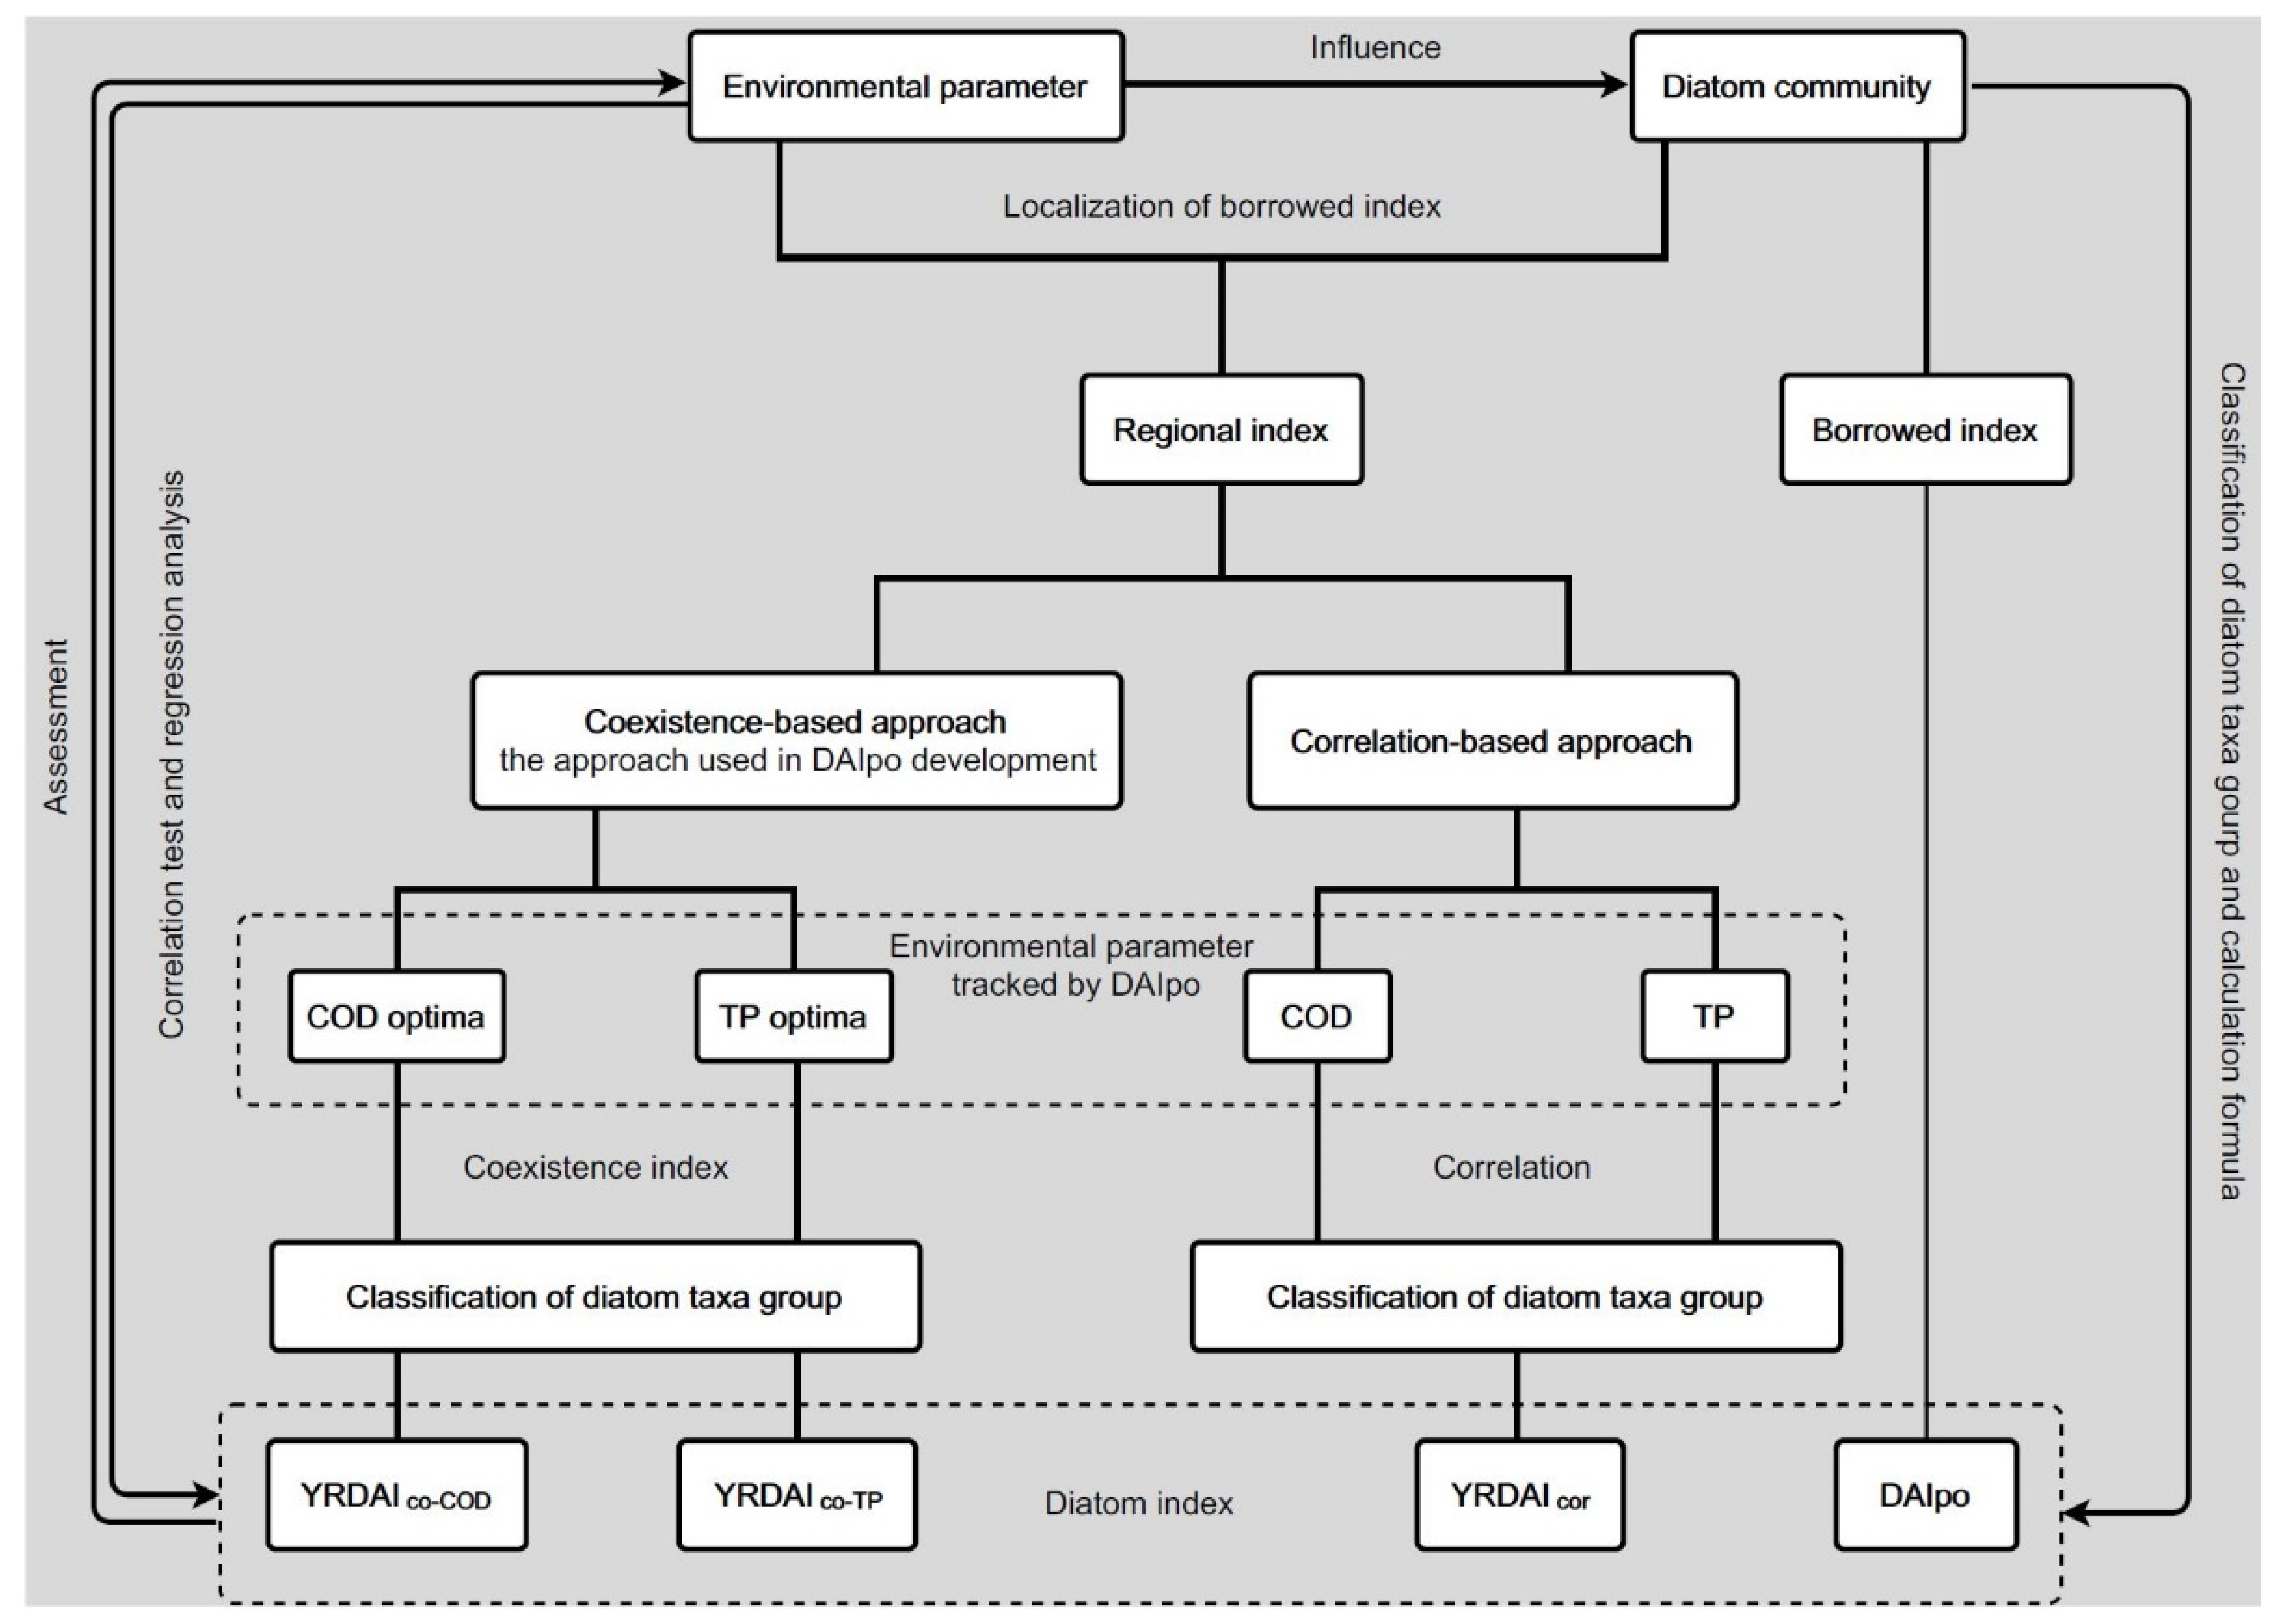
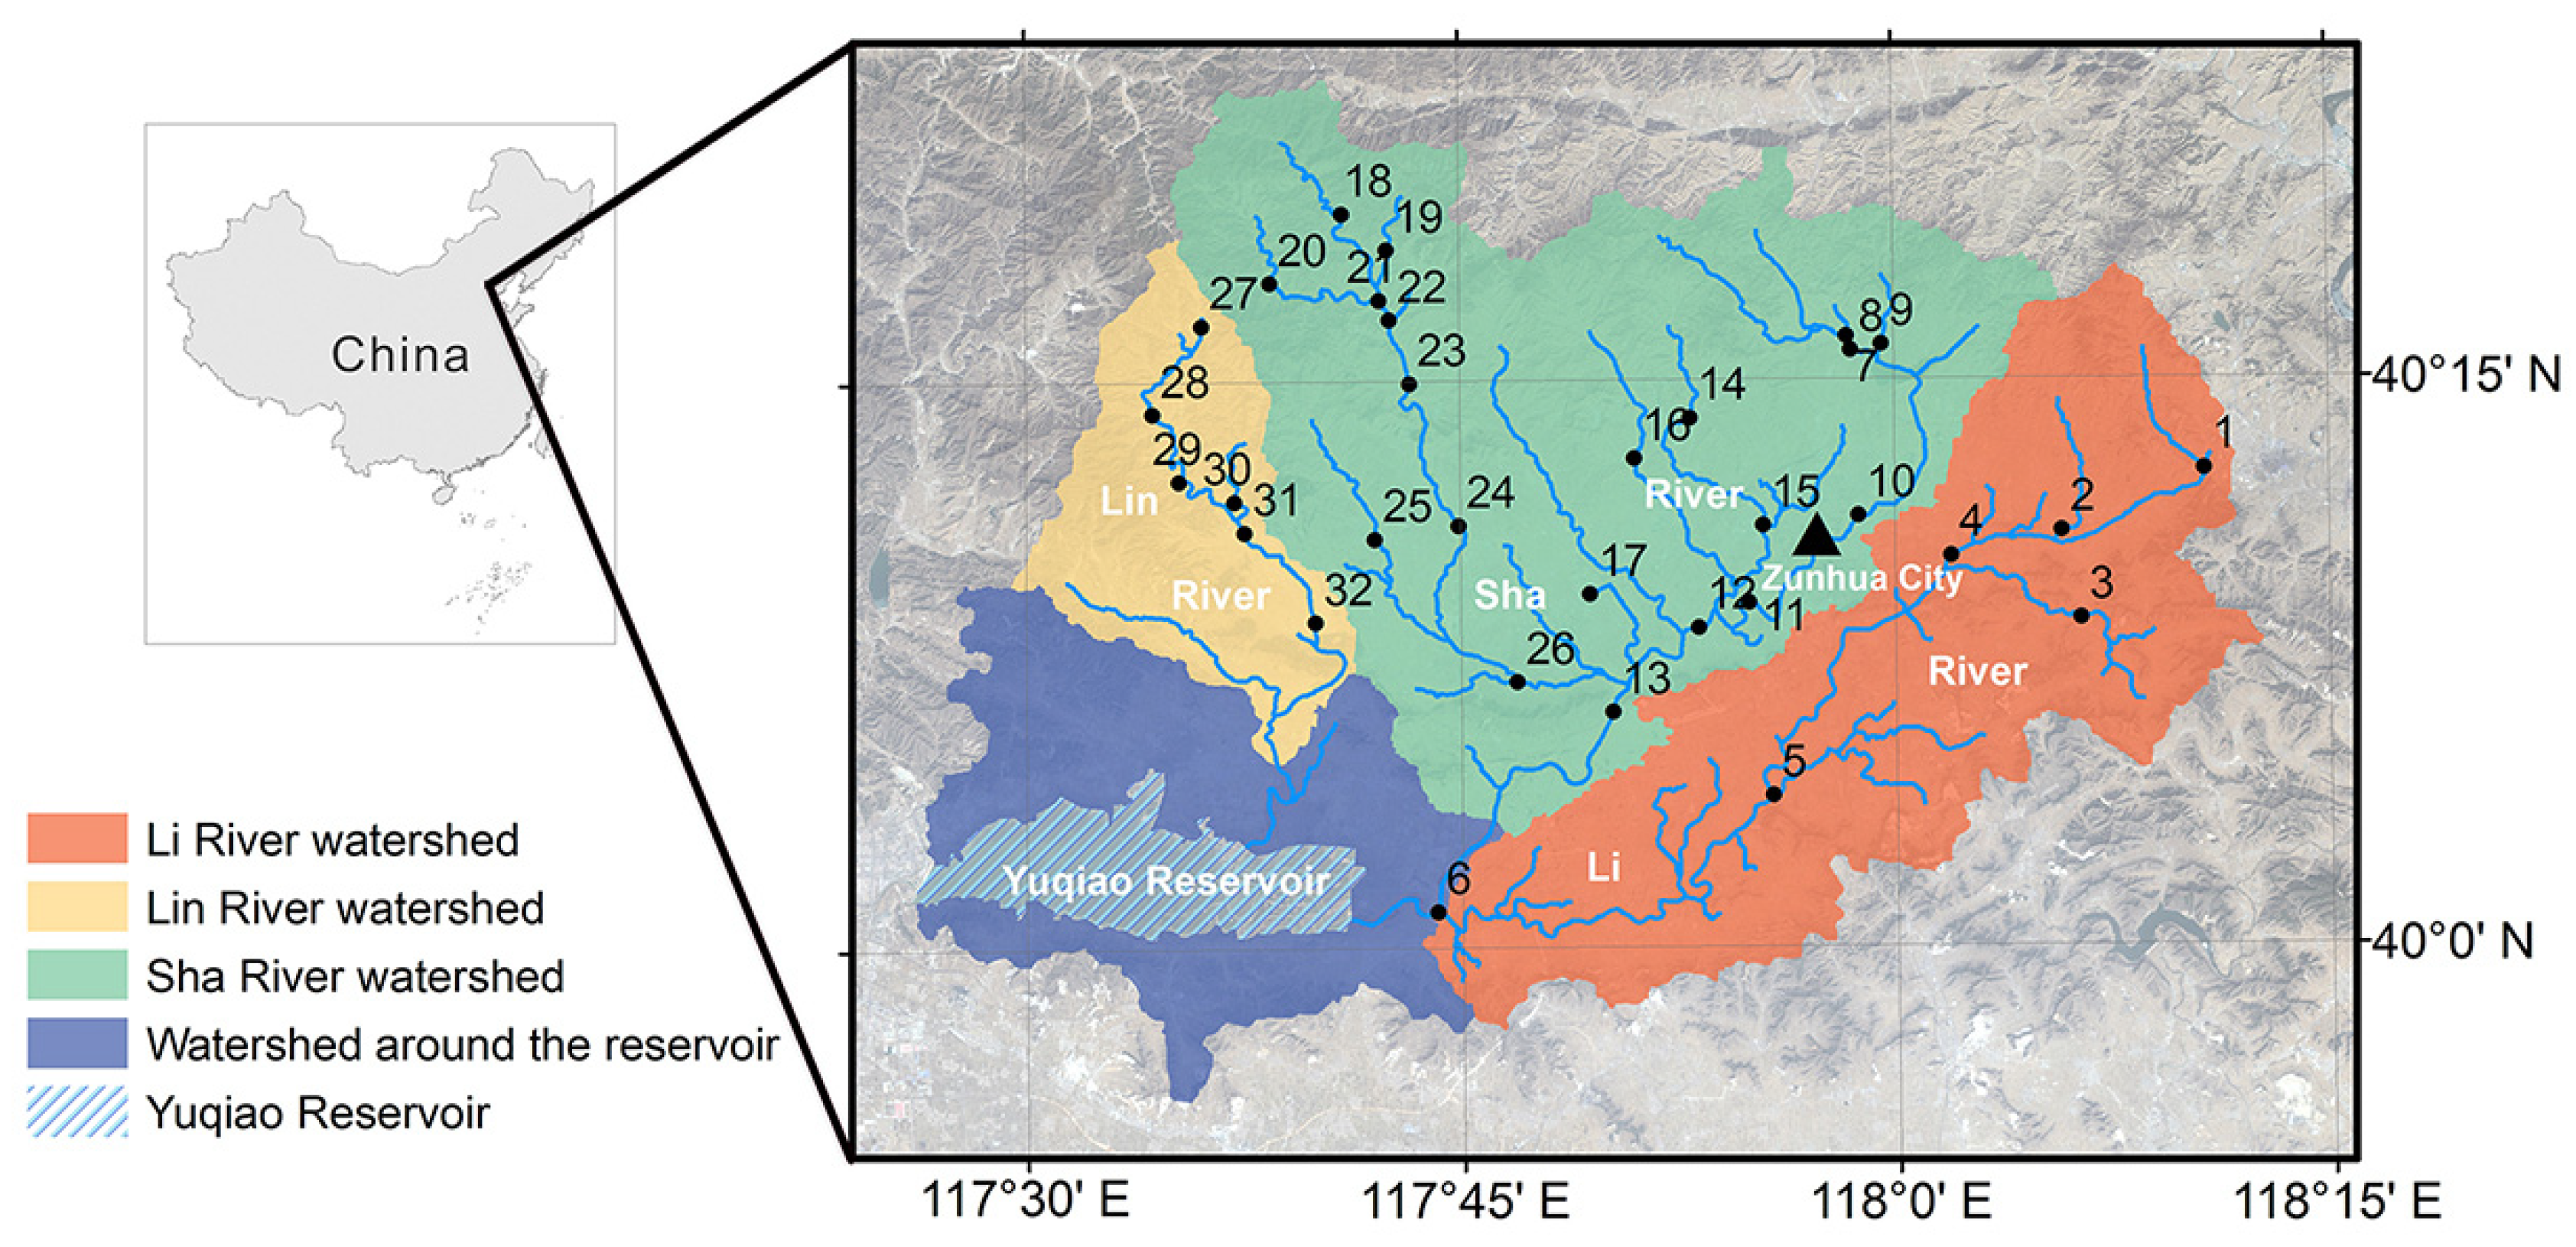
The watershed of Yuqiao Reservoir with a total area of 2060 km2 is located in North China (39°56′~40°23′ N, 117°26′~118°12′ E), where the climate is temperate continental monsoon climate. The three inflow rivers are the Li River (st.1–st.6), the Sha River (st.7–st.26) and the Lin River (st.27–st.33), and average annual runoff is 506 million m3. The areas of wood-grass land and farmland in the watershed of Yuqiao Reservoir account for 54.22% and 31.81%, respectively. The three rivers receive all nonpoint source pollution from farmland and orchards, and point source pollution [46].
2.2.2. Sample Collection and Analysis
Thirty-two sampling sites were set up in the watershed of Yuqiao Reservoir. Sampling was conducted during the normal water season in mid-May 2019 (Figure 2). Water samples (500 mL) were taken from each site using plastic bottles, then stored in an incubator at 4 °C. Surface sediment (50 g for each) was collected by a grab and brought back to the laboratory in a sealed plastic bag.
Preparation of sediment samples: A total of 2 cm3 of each sample was put into a conical flask, and 15% hydrogen peroxide was added to remove the organic matter. After the reaction was sufficient, clean water was added. The upper suspension was poured out after standing for 24 h, and then clean water was filled again. The upper suspension was poured out again after standing for 4 h. This operation was repeated for 4 times. Preparation of diatom slides: The heating plate was heated to 180 °C, then slide and cover slips were placed on a heating plate and heated to keep them dry. After the sample was shaken for 10 s, a small amount of sample was dropped on the cover slip using a dropper. Then, heated neutral balsam was dropped on the slide, and dried cover slips were covered on neutral balsam. The slide was then moved from the heating plate to operating table and put into a sealed box after cooling. More than 400 diatoms were identified at each sampling site, except the sites (st.11, 12, 24 and 26) with a small number of diatoms.
For the pollutant analysis, COD was measured using dichromate method, TP was measured using ammonium molybdate spectrophotometric method and TN was measured using alkaline potassium persulfate digestion by ultraviolet spectrophotometry.
2.3. Data Analysis
SPSS Statistics 19 (IBM, Armonk, NY, USA) and Origin 2018 (OriginLab, Northampton, MA, USA) were used for statistical analysis to explore the relationships between the environmental variables and the diatom data. All water quality variable measurements below detection limits were expressed as half the detection limit for statistical purposes [12]. The regression and correlations were performed using Pearson’s product-moment correlation coefficient.
3. Results
3.1. Pollutants
Water quality analysis showed an increasing pollution gradient from the Lin River basin with weak human activities to the upper reaches of Li River and Sha River with a higher degree of urbanization (Table 1). The area with relatively high pollution was concentrated in the vicinity of Zunhua city. In areas with a high degree of urbanization (st.1, 2, 3, 4, 10, 11, 12 and 15), the average value of COD was 27.25 ± 14.28 mg/L, the average value of TP was 0.22 ± 0.18 mg/L, and the average value of TN was 7.96 ± 4.33 mg/L. In the Lin River basin (st.27, 28, 29, 30, 31 and 32) where human activities were relatively weak, the average value of COD was 2.67 ± 1.49 mg/L, the average value of TP was 0.03 ± 0.03 mg/L and the average value of TN was 6.73 ± 3.96 mg/L. It is worthy to note that COD value at st.5 (84 mg/L) was abnormally high. We checked the historical water quality for the nearest routine monitoring station. The routine monitoring results showed that the maximum value of COD concentration was 30 mg/L during 2015–2019. The water sample of st.5 was obviously affected by accidental or occasional factors, and the data for st.5 were therefore excluded from further analysis to explore the relationship between water parameters and diatom communities.
3.2. Diatoms
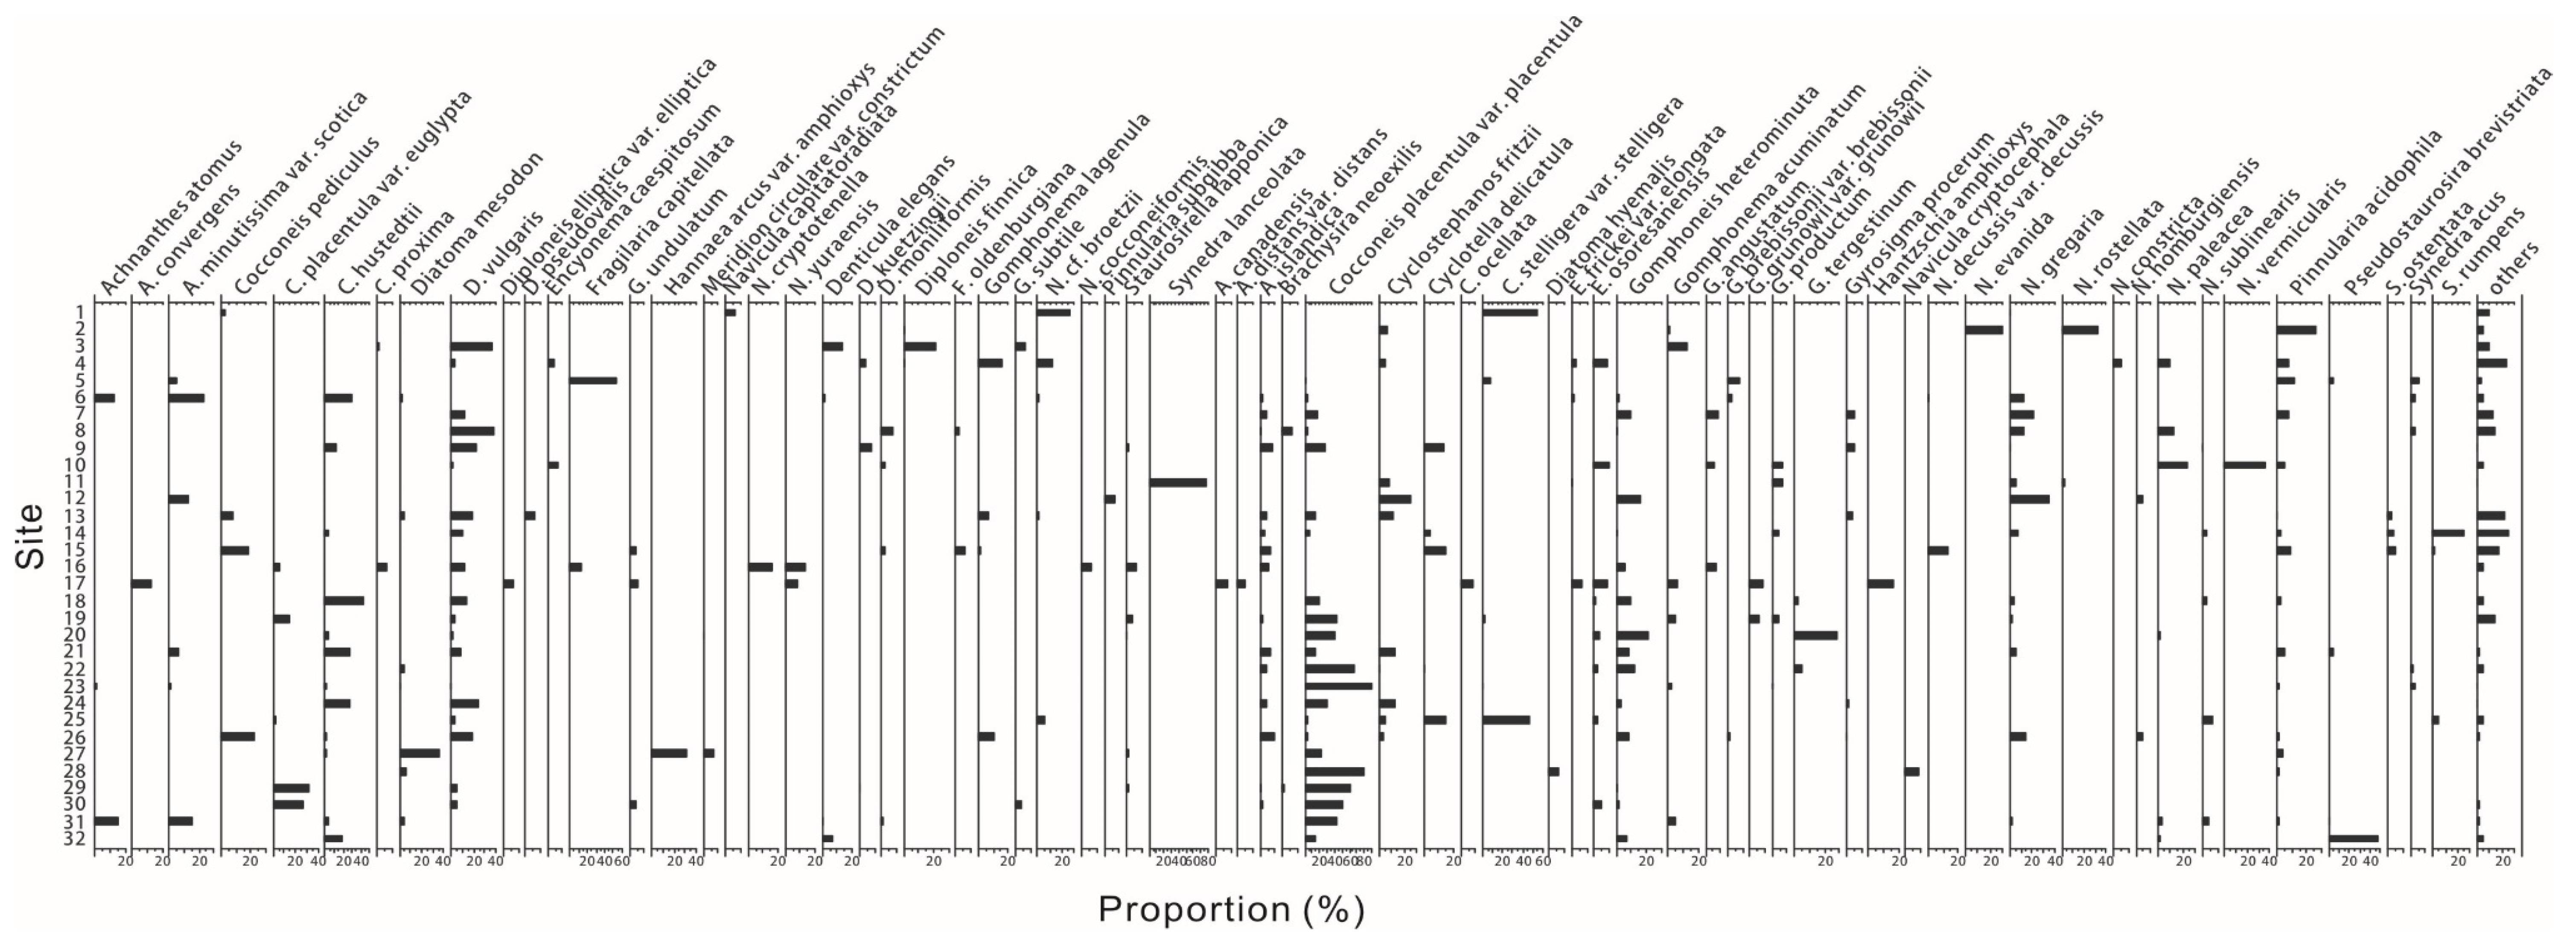
The diatom species identified from the three main rivers in the Yuqiao Reservoir watershed included 136 species from 35 genera (Figure 3). In the 136 species recorded, 25 and 21 species were reclassified by coexistence- and correlation-based approaches, respectively (Table 2).
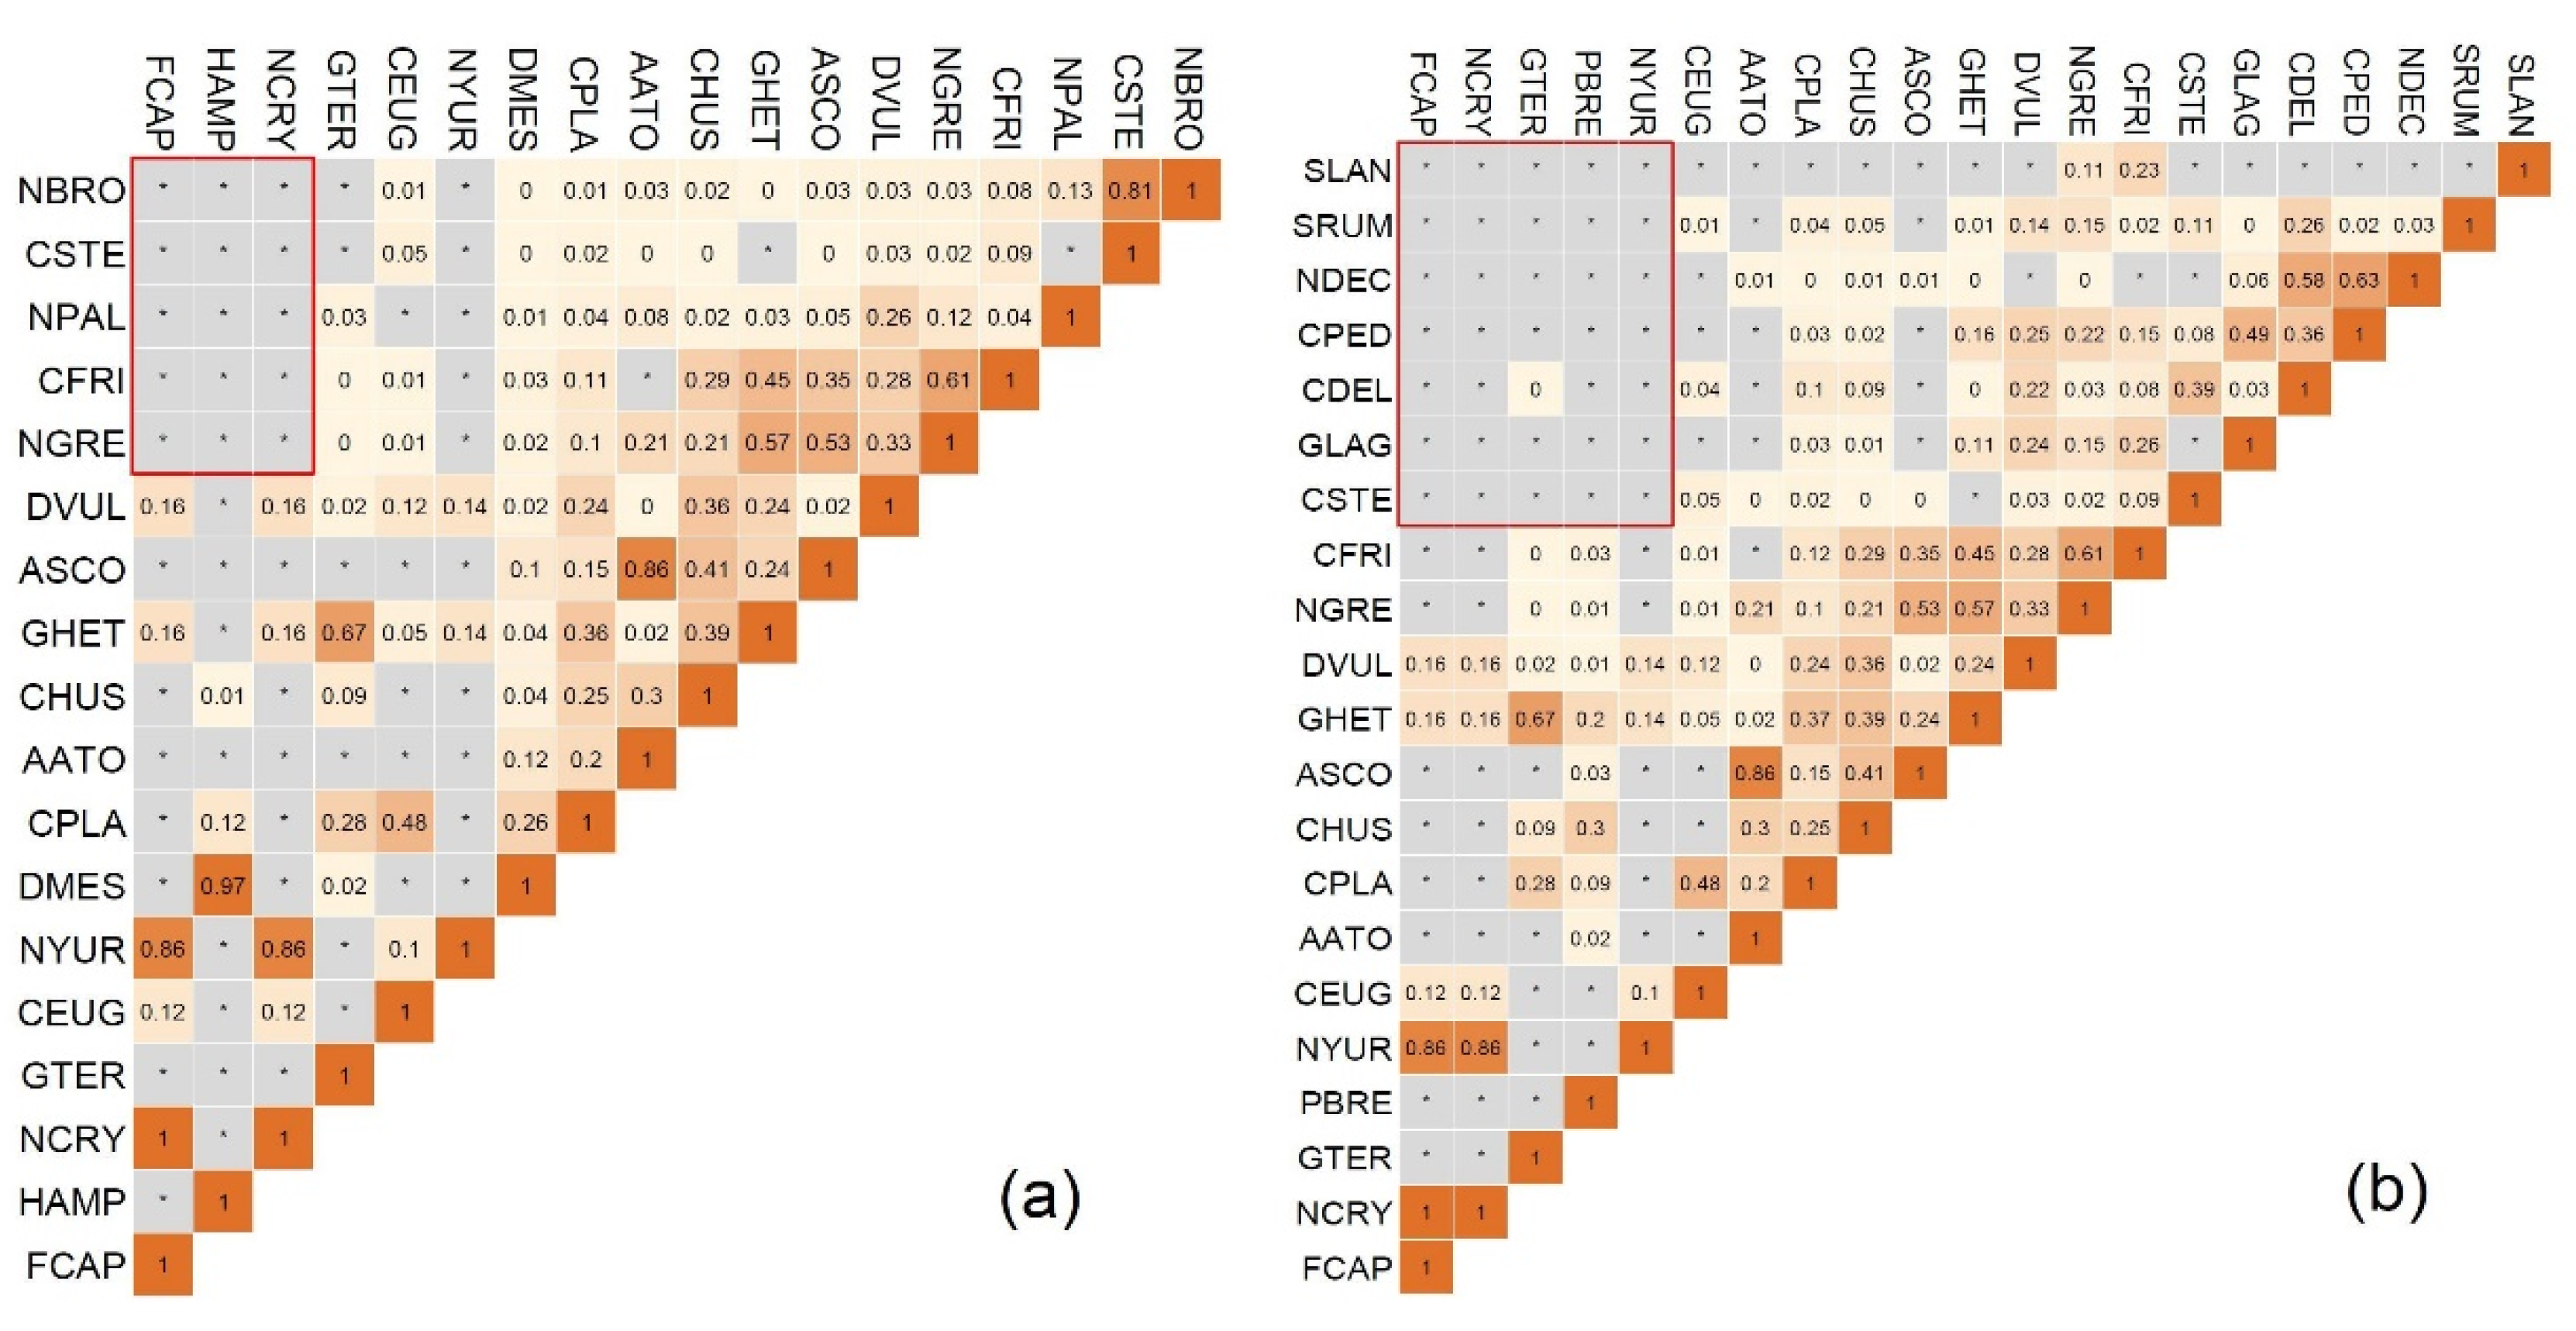
For the coexistence-based approach, the pollutant optima values for the 25 diatoms were calculated, and the diatoms were ranked with their TI values. Two boundaries based on the COD concentrations were recognized at the order between Navicula cryptotenella and Cocconeis placentula var. euglypta and between Diatoma vulgaris and Navicula gregaria, and the other two boundaries based on the TP concentrations were recognized at the order between Navicula yuraensis and Cocconeis placentula var. euglypta and between Cyclostephanos fritzii and Cyclotella stelligera var. stelligera (Figure 4). We classified these diatoms as saproxenous or saprophilous taxa groups, and the diatoms in the middle of the order sequence were classified as indifferent taxa group (Table 2).
The correlation results showed that only the proportion of Cocconeis placentula var. placentula had a significant negative correlation with the COD (r = −0.56, p < 0.01) and TP (r = −0.50, p < 0.05) concentrations. Therefore, we classified it into the saproxenous taxa group, and the remaining 20 diatom species were classified into the indifferent taxa group (Table 2).
3.3. YRDAI Performance
The YRDAIco-COD, YRDAIco-TP and YRDAIcor scores ranged (5.26, 68.56), (9.91, 86.64) and (11.96, 97.52), respectively. DAIpo scores using the unreclassified diatom groups, ranged from 11.96 to 87. The lowest scores of DAIpo, YRDAIco-COD and YRDAIcor appeared near Zunhua City, while the lowest score of YRDAIco-TP appeared in st.1 in the upper reaches of Li River, where residential areas and factories were gathered.
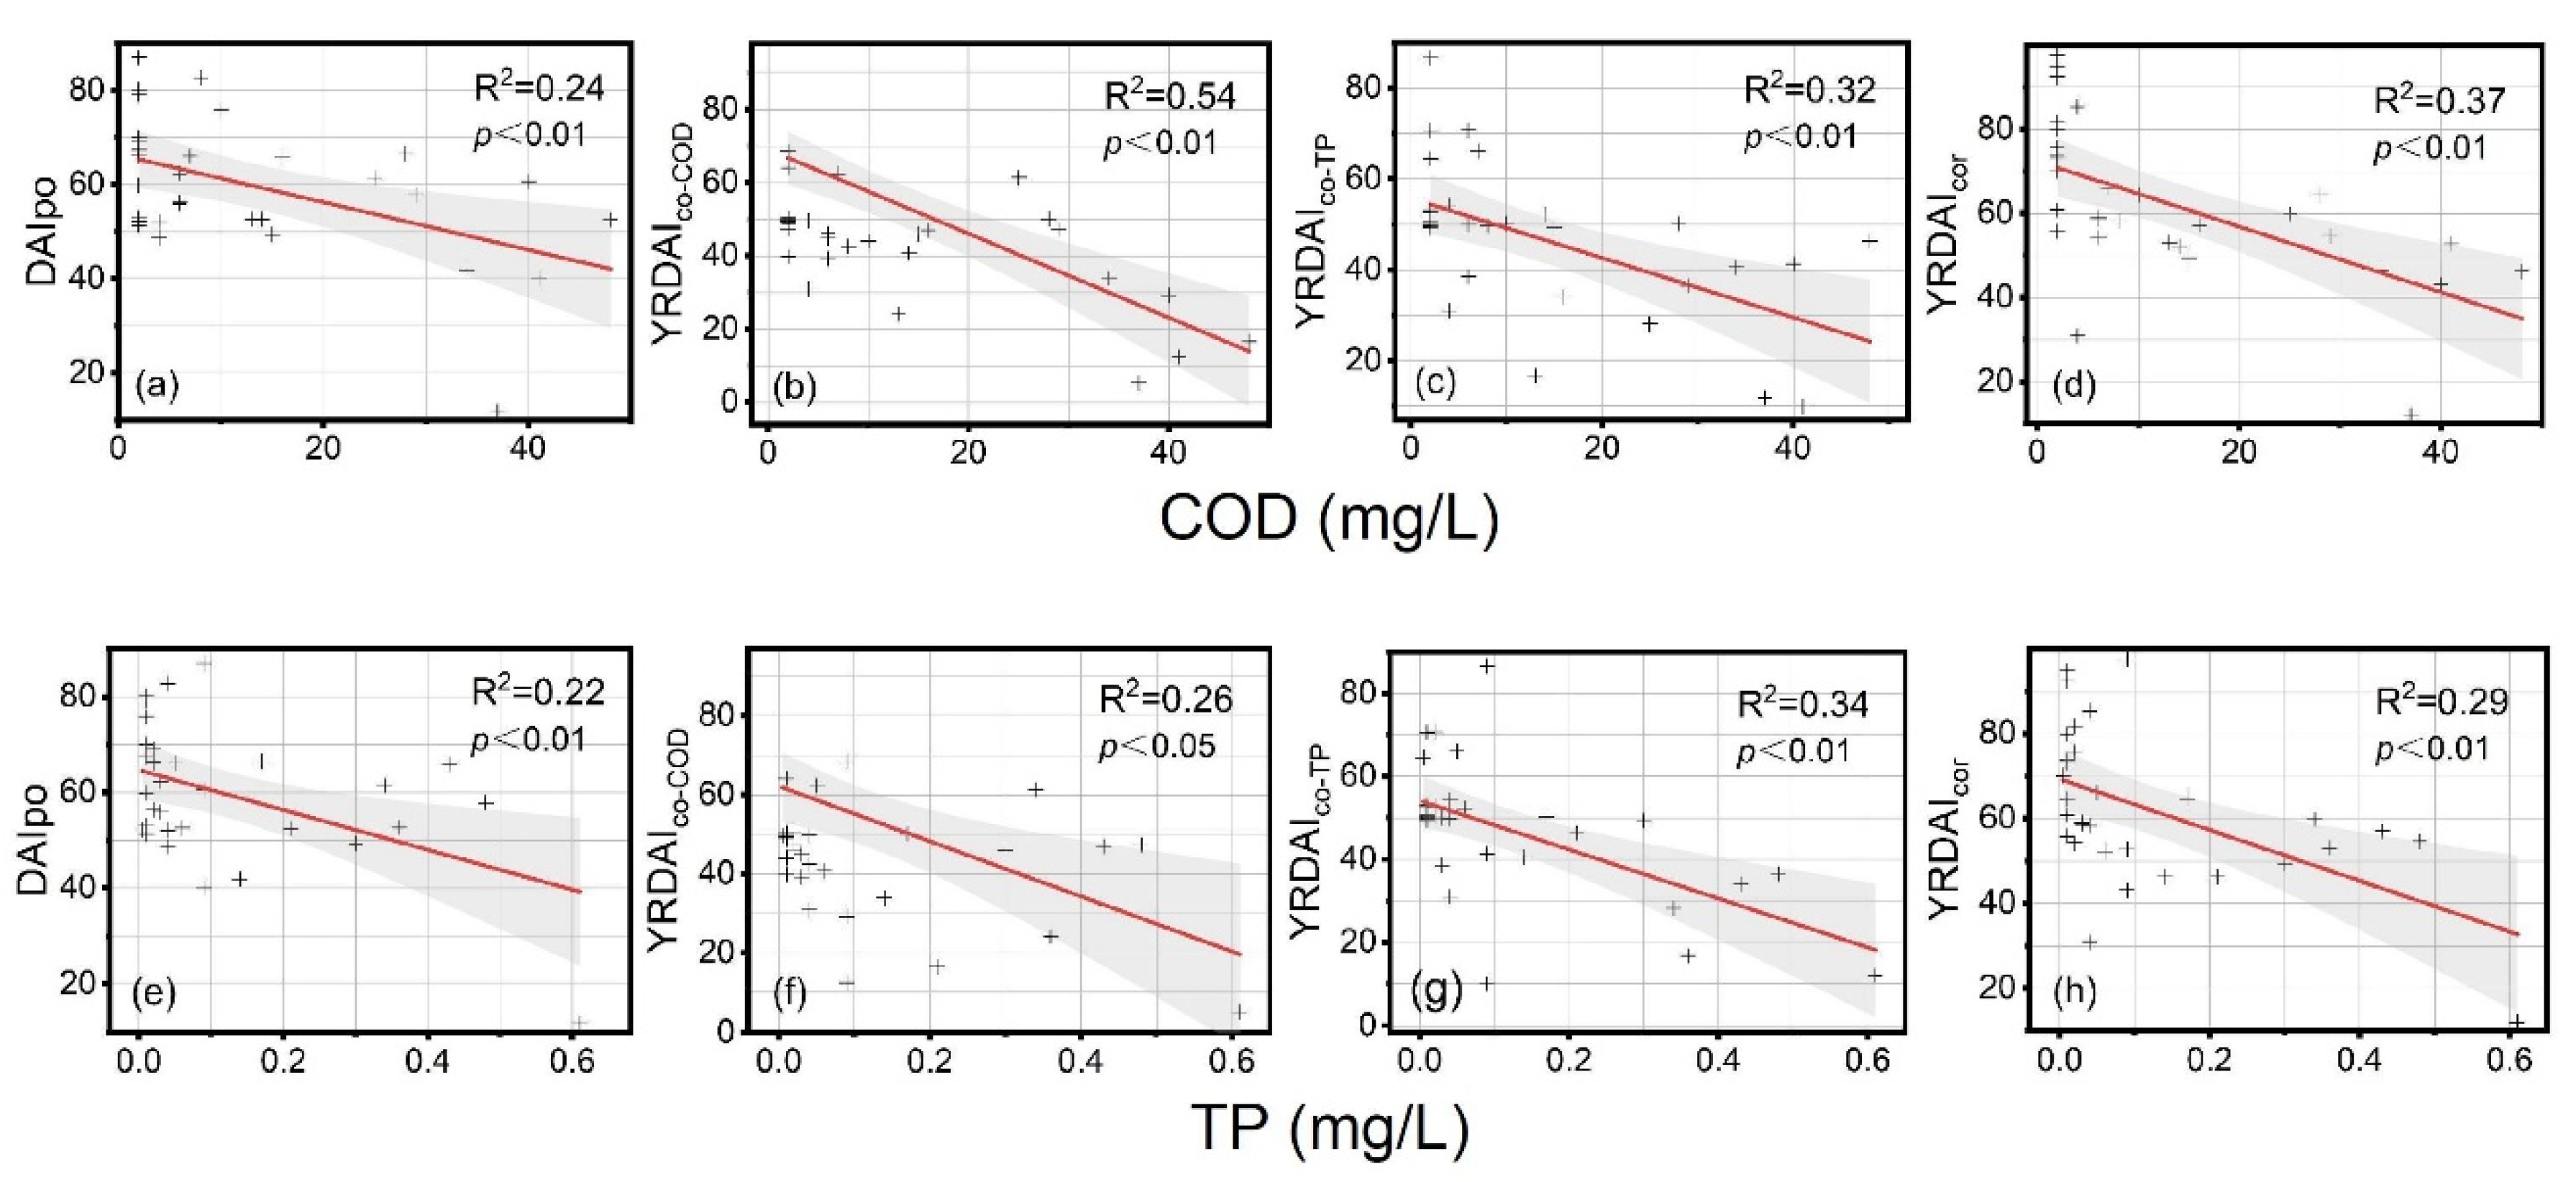
The regression analysis between diatom indices and pollutant concentrations can indicate the performance effect of the indices (Table 3, Figure 5). Both the YRDAIco (for COD and TP) and YRDAIcor scores had a higher correlation with the pollutants (COD and TP) than the DAIpo scores, indicating that the regional diatom assemblage index (YRDAI) showed the improved performance compared the original diatom assemblage index (DAIpo). For the YRDAI, the YRDAIco-COD and YRDAIcor had the best performance for COD and TP, respectively.
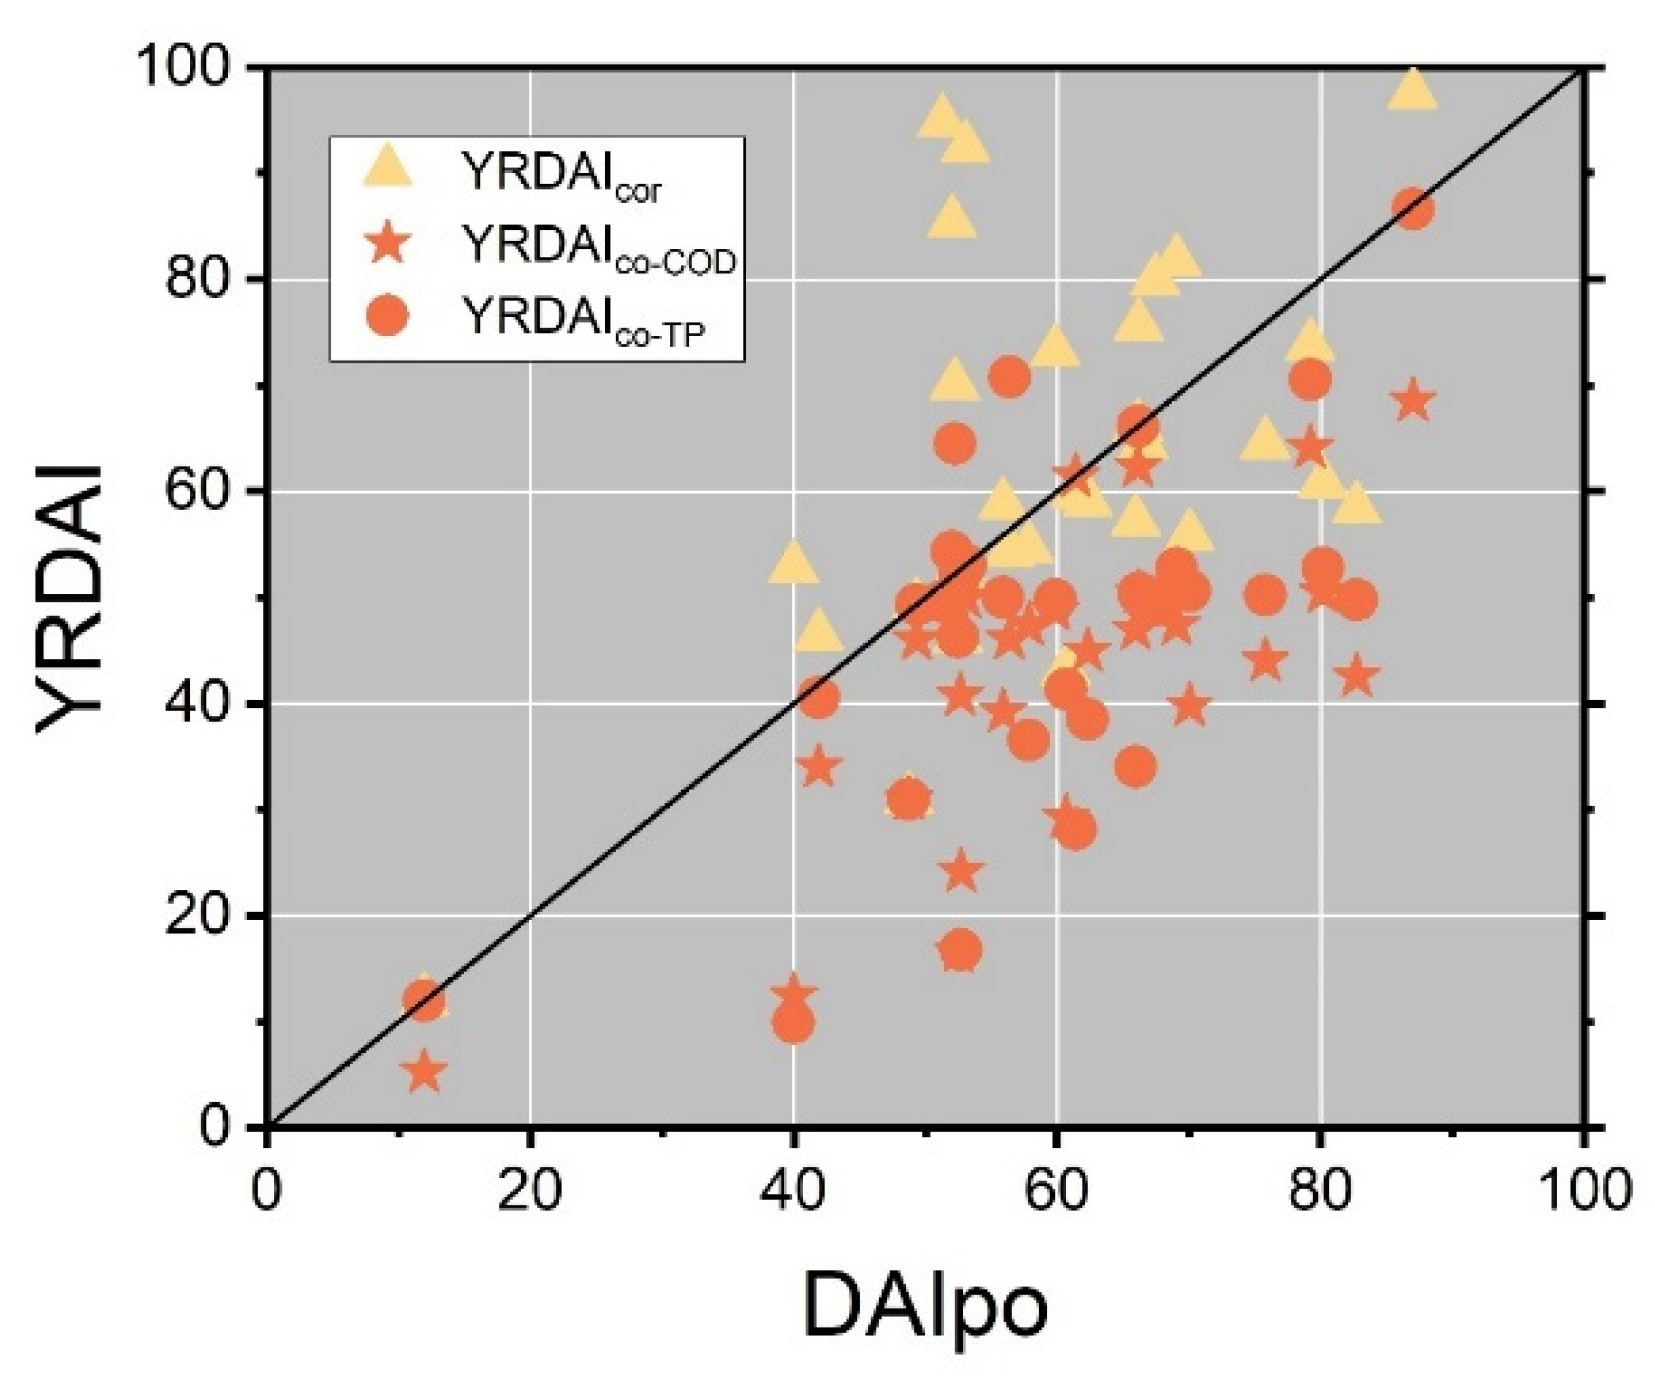
As shown in Figure 6, there were obvious differences in the scores from the two approaches. Generally, the scores from the correlation-based approach were greater than the scores from the coexistence-based approach. For the coexistence-based approach, the scores of YRDAIco-TP were slightly greater than those of YRDAIco-COD.
4. Discussion
The diatom-based index may not reflect all of the pollutants. In other words, the pollutants should be verified and selected when constructing a regional diatom index. In this study, TN was not used to reclassify the diatom species, because the large variance of TN led to chaotic order of TI values and a weak correlation with the proportion of diatom species. The high variance of TN may be attributed to the complex forms (nitrate, nitrite, ammonia and organic nitrogen) and environmental behaviors (e.g., nitrification, denitrification and anammox processes), and possible various sources. In addition, DAIpo is originally a diatom index related to organic pollution ((BOD) biological oxygen demand), although it can also reflect other pollutants in many cases [21,47,48].
The key to the establishment of a diatom index is to classify the ecological preferences of dominant species, and the development of a regional diatom index based on the existing diatom index often followed the classification method of the original index [12,27]. However, lack of knowledge of the ecology of diatoms in the studied watershed may lead to the wrong classification of diatoms and increase the uncertainty of the developed regional diatom index [12,20,27]. When diatoms with small proportions are used to calculate the index score, the calculated results will be severely affected, resulting in an inaccurate assessment of water quality [49]. Therefore, we selected the diatoms with a proportion of >10% for at least one sampling site as representative diatoms for classification, in order to avoid the bias caused by the species with low abundance. Although the sparse diatoms should be excluded, an increase in diatom species number may improve the confidence in the diatom index score for water quality assessment.
In total, 34 diatom species were reclassified using the two approaches (Table 2). The reclassification of diatom species for YRDAIco-COD and YRDAIco-TP increased the saprophilous taxa, which led to the lower scores of YRDAIco-COD and YRDAIco-TP than that of DAIpo. In the case of YRDAIcor, the reclassification of diatom species identified a saproxenous species, Cocconeis placentula var. placentula, resulting in the larger YRDAIcor scores than the DAIpo, YRDAIco-COD and YRDAIco-TP scores. Cocconeis placentula var. placentula, which is one of the dominant species with a total number of 2672, accounted for about 22% of the identified diatoms in the watershed. The COD and TP optima values (3.95 mg/L, 0.03 mg/L) of Cocconeis placentula var. placentula were low, and Cocconeis placentula was known to be sensitive to pollutants [50]; it should be classified into the saproxenous group. However, it was still classified into the indifferent taxa by the coexistence-based approach, which is not reasonable. Here, the correlation-based approach performed better than the coexistence-based approach.
The ecological status of benthic diatoms is affected by many factors, and the factors may be location-specific [36]. Therefore, the application of the diatom index should be carefully verified to ensure that water quality is the main factor. Due to the considerable high variance for the biological indicators, the prolonged accumulation of investigative datasets is necessary. It is necessary to note that augmentability for the correlation-based approach is better than that for the coexistence-based approach, because the tolerance index scores of all diatoms need to be recalculated when adding new data. However, the correlation-based approach more easily discriminates diatom taxa.
It should be noted that a diatom community may change with time. Though some researchers found there was no significant difference in diatom index scores in different seasons [42,51], others held opposing opinions [42,52,53,54]. For example, the abundance of Cocconeis placentula var. placentula has a positive correlation with temperature [55]. Furthermore, due to the temporal and spatial change of a diatom community, the values of a regional diatom index may correspondingly change [56].
5. Concluding Remarks
Using the Yuqiao Reservoir watershed as an example, the establishment of a regional diatom index (YRDAI) based on the DAIpo index has been conducted via both the previous coexistence-based approach and the newly proposed correlation-based approach. The localized diatom index (YRDAI) can better reflect the pollution level of the watershed of Yuqiao Reservoir than the borrowed index (DAIpo), indicating the applicability of both approaches. The correlation-based approach performed better than the coexistence-based approach in terms of calculation and augmentability. In particular, the correlation-based approach simplified the procedure of diatom reclassification in the establishment of a regional diatom index. In addition, the modified indices should be further improved through the continuous accumulation of datasets, and the proposed approaches can be applied to other watersheds as well. However, it is worthy to note that the regional diatom index cannot be directly compared due to its regional specificity.
Author Contributions
Conceptualization, X.L.; Methodology, J.F., X.L. and Y.L.; Software, Y.L.; Validation, Y.L.; Formal analysis, Y.L.; Investigation, J.F., Y.L. and S.Y.; Resources, P.M.; Data curation, Y.L. and S.Y.; Writing—original draft preparation, Y.L.; Writing—review and editing, X.L. and B.Z.; Visualization, Y.L.; Supervision, J.F. and X.L.; Project administration, J.F. and X.L.; Funding acquisition, J.F. and X.L. All authors have read and agreed to the published version of the manuscript.
Funding
This research was funded by National Social Science Fund (19AZD005), Tianjin Science and Technology Program (21YFSNSN00220), National Key Research & Development Program of China (2019YFE0122300) and Hebei Province Key Research & Development Program (22373301D).
Data Availability Statement
The data used to support the findings of this study are available from the corresponding author upon request.
Acknowledgments
We are grateful for the constructive comments from the anonymous reviewers.
Conflicts of Interest
The authors declare no conflict of interest.
References
- Luo, Z.; Zuo, Q.; Shao, Q. A New Framework for Assessing River Ecosystem Health with Consideration of Human Service Demand. Sci. Total Environ. 2018, 640–641, 442–453. [Google Scholar] [CrossRef]
- Su, Y.; Li, W.; Liu, L.; Hu, W.; Li, J.; Sun, X.; Li, Y. Health Assessment of Small-to-Medium Sized Rivers: Comparison between Comprehensive Indicator Method and Biological Monitoring Method. Ecol. Indic. 2021, 126, 107686. [Google Scholar] [CrossRef]
- Zhao, Y.W.; Zhou, L.Q.; Dong, B.Q.; Dai, C. Health Assessment for Urban Rivers Based on the Pressure, State and Response Framework—A Case Study of the Shiwuli River. Ecol. Indic. 2019, 99, 324–331. [Google Scholar] [CrossRef]
- Almeida, S.F.P.; Feio, M.J. DIATMOD: Diatom Predictive Model for Quality Assessment of Portuguese Running Waters. Hydrobiologia 2012, 695, 185–197. [Google Scholar] [CrossRef]
- Liu, S.; Xie, G.; Wang, L.; Cottenie, K.; Liu, D.; Wang, B. Different Roles of Environmental Variables and Spatial Factors in Structuring Stream Benthic Diatom and Macroinvertebrate in Yangtze River Delta, China. Ecol. Indic. 2016, 61, 602–611. [Google Scholar] [CrossRef]
- Liu, W.; Xu, M.; Zhao, N.; Zhou, X.; Pan, B.; Tian, S.; Lei, F. River Health Assessment of the Yellow River Source Region, Qinghai-Tibetan Plateau, China, Based on Tolerance Values of Macroinvertebrates. Environ. Sci. Pollut. Res. 2019, 26, 10251–10262. [Google Scholar] [CrossRef]
- Shan, C.; Dong, Z.; Lu, D.; Xu, C.; Liu, Q. Study on River Health Assessment Based on a Fuzzy Matter-Element Extension Model. Ecol. Indic. 2021, 127, 107742. [Google Scholar] [CrossRef]
- Sun, S.; Wang, Y.; Jing, L.; Cai, H.; Xu, L. Sustainability Assessment of Regional Water Resources Under the DPSIR Framework. J. Hydrol. 2015, 532, 140–148. [Google Scholar] [CrossRef]
- Ector, L.; Hlubikova, D.; Hoffmann, L. Preface: Use of Algae for Monitoring Rivers. Hydrobiologia 2012, 695, 1–5. [Google Scholar] [CrossRef] [Green Version]
- Rosenberg, D.M.; Resh, V.H. Freshwater Biomonitoring and Benthic Macroinvertebrates; Chapman & Hall: New York, NY, USA, 1993; ISBN 978-0-412-02251-7. [Google Scholar]
- Cunningham, L.; Snape, I.; Stark, J.S.; Riddle, M.J. Benthic Diatom Community Response to Environmental Variables and Metal Concentrations in a Contaminated Bay Adjacent to Casey Station, Antarctica. Mar. Pollut. Bull. 2005, 50, 264–275. [Google Scholar] [CrossRef]
- Oeding, S.; Taffs, K.H. Developing a Regional Diatom Index for Assessment and Monitoring of Freshwater Streams in Sub-Tropical Australia. Ecol. Indic. 2017, 80, 135–146. [Google Scholar] [CrossRef]
- Lavoie, I.; Campeau, S.; Darchambeau, F.; Cabana, G.; Dillon, P.J. Are Diatoms Good Integrators of Temporal Variability in Stream Water Quality? Freshw. Biol. 2008, 53, 827–841. [Google Scholar] [CrossRef]
- Smucker, N.J.; Vis, M.L. Diatom Biomonitoring of Streams: Reliability of Reference Sites and the Response of Metrics to Environmental Variations across Temporal Scales. Ecol. Indic. 2011, 11, 1647–1657. [Google Scholar] [CrossRef]
- Stevenson, J. Ecological Assessments with Algae: A Review and Synthesis. J. Phycol. 2014, 50, 437–461. [Google Scholar] [CrossRef]
- Beyene, A.; Addis, T.; Kifle, D.; Legesse, W.; Kloos, H.; Triest, L. Comparative Study of Diatoms and Macroinvertebrates as Indicators of Severe Water Pollution: Case Study of the Kebena and Akaki Rivers in Addis Ababa, Ethiopia. Ecol. Indic. 2009, 9, 381–392. [Google Scholar] [CrossRef]
- Watanabe, T.; Asai, K.; Houki, A. Numerical Estimation to Organic Pollution of Flowing Water by Using the Epilithic Diatom Assemblage—Diatom Assemblage Index (DAIpo). Sci. Total Environ. 1986, 55, 209–218. [Google Scholar] [CrossRef]
- Duong, T.T.; Feurtet-Mazel, A.; Coste, M.; Dang, D.K.; Boudou, A. Dynamics of Diatom Colonization Process in Some Rivers Influenced by Urban Pollution (Hanoi, Vietnam). Ecol. Indic. 2007, 7, 839–851. [Google Scholar] [CrossRef]
- Sakai, M.; Kawakami, M.; Amada, K. Evaluation of the Water Quality of the Hakata River Based on Diatoms. J. Environ. Sci. 2013, 25, S132–S135. [Google Scholar] [CrossRef] [PubMed]
- Tan, X.; Sheldon, F.; Bunn, S.E.; Zhang, Q. Using Diatom Indices for Water Quality Assessment in a Subtropical River, China. Environ. Sci. Pollut. Res. 2013, 20, 4164–4175. [Google Scholar] [CrossRef] [PubMed] [Green Version]
- Tang, T.; Cai, Q.; Liu, J. Using Epilithic Diatom Communities to Assess Ecological Condition of Xiangxi River System. Environ. Monit. Assess. 2006, 112, 347–361. [Google Scholar] [CrossRef]
- Watanabe, T.; Asai, K.; Houki, A. Epilithic Diatom Assemblage Index to Organic Water Pollution (DAIpo) and Its Ecological Significance. Ann. Grad. Sch. Humanit. Sci. Nara Womens Univ. 1986, 1, 77–95. [Google Scholar]
- Kelly, M.G.; Whitton, B.A. The Trophic Diatom Index: A New Index for Monitoring Eutrophication in Rivers. J. Appl. Phycol. 1995, 7, 433–444. [Google Scholar] [CrossRef]
- Jakovljević, O.S.; Popović, S.S.; Živić, I.M.; Stojanović, K.Z.; Vidaković, D.P.; Naunovic, Z.Z.; Krizmanić, J.Ž. Epilithic Diatoms in Environmental Bioindication and Trout Farm’s Effects on Ecological Quality Assessment of Rivers. Ecol. Indic. 2021, 128, 107847. [Google Scholar] [CrossRef]
- Lee, K.-L.; Choi, J.S.; Lee, J.-H.; Jung, K.-Y.; Kim, H.S. Response of Epilithic Diatom Assemblages to Weir Construction on the Nakdong River, Republic of Korea. Ecol. Indic. 2021, 126, 107711. [Google Scholar] [CrossRef]
- Torres-Franco, A.F.; Alatrista-Góngora, G.R.; Guzmán-Rodríguez, N.P.; Calizaya-Anco, J.A.; Mota, C.R.; Figueredo, C.C. Physicochemical and Diatom Trophic State Indexes: A Complementary Approach for Improving Water Sustainability in a High Andean Urban Stream. Ecohydrol. Hydrobiol. 2019, 19, 577–587. [Google Scholar] [CrossRef]
- Wood, R.J.; Mitrovic, S.M.; Lim, R.P.; Warne, M.S.J.; Dunlop, J.; Kefford, B.J. Benthic Diatoms as Indicators of Herbicide Toxicity in Rivers—A New SPEcies At Risk (SPEARherbicides) Index. Ecol. Indic. 2019, 99, 203–213. [Google Scholar] [CrossRef]
- Lane, C.R.; Reiss, K.C.; DeCelles, S.; Brown, M.T. Benthic Diatom Composition in Isolated Forested Wetlands Subject to Drying: Implications for Monitoring and Assessment. Ecol. Indic. 2009, 9, 1121–1128. [Google Scholar] [CrossRef]
- Mangadze, T.; Dalu, T.; William Froneman, P. Biological Monitoring in Southern Africa: A Review of the Current Status, Challenges and Future Prospects. Sci. Total Environ. 2019, 648, 1492–1499. [Google Scholar] [CrossRef] [PubMed]
- Coste, M.; Ayphassorho, H. Etudes de La Qualité Des Eaux Du Bassin Artois-Picardie á Làide Des Communautés de Diatomées Benthiques (Aplication Des Indices Diatomiques), Rapport Cemagref, Bordeaux-Agence de l’Eau Artois-Picardie, Douai Coste, M., Bosca, C., Dauta, A. Use of algae for monitoring rivers in France. In Use of algae for monitoring rivers, Proceedings of International Symposium; Whitton, B.A., Rott, E., Friedrich, G., Eds.; Institut für Botanik, Universität Innsbruck: Innsbruck, Austria, 1991; pp. 75–88. [Google Scholar]
- Descy, J.-P. A New Approach to Water Quality Estimation Using Diatoms. Nova Hedwig. 1979, 64, 305–323. [Google Scholar]
- Descy, J.-P.; Coste, M. A Test of Methods for Assessing Water Quality Based on Diatoms. SIL Proc. 1991, 24, 2112–2116. [Google Scholar] [CrossRef]
- Köhler, J.; Whitton, B.A.; Rott, E. (Eds.) Use of Algae for Monitoring Rivers II. In Internationale Revue der Gesamten Hydrobiologie und Hydrographie; Wiley: Hoboken, NJ, USA, 1997; Volume 82, p. 340. ISBN 3-9500090-0-2. [Google Scholar] [CrossRef]
- Prygiel, J.; Lévêque, L.; Iserentant, R. Un Nouvel Indice Diatomique Pratique Pour l’Évaluation de La Qualité Des Eaux En Réseau de Surveillance. Rev. Sci. Eau 1996, 9, 97. [Google Scholar] [CrossRef]
- Duong, T.T.; Coste, M.; Feurtet-Mazel, A.; Dang, D.K.; Gold, C.; Park, Y.S.; Boudou, A. Impact of Urban Pollution from the Hanoi Area on Benthic Diatom Communities Collected from the Red, Nhue and Tolich Rivers (Vietnam). Hydrobiologia 2006, 563, 201–216. [Google Scholar] [CrossRef]
- Abarca, N.; Jahn, R.; Zimmermann, J.; Enke, N. Does the Cosmopolitan Diatom Gomphonema Parvulum (Kützing) Kützing Have a Biogeography? PLoS ONE 2014, 9, e86885. [Google Scholar] [CrossRef]
- Wang, J.; Liu, Q.; Zhao, X.; Borthwick, A.G.L.; Liu, Y.; Chen, Q.; Ni, J. Molecular Biogeography of Planktonic and Benthic Diatoms in the Yangtze River. Microbiome 2019, 7, 153. [Google Scholar] [CrossRef] [PubMed] [Green Version]
- Bere, T. Are Diatom-Based Biotic Indices Developed in Eutrophic, Organically Enriched Waters Reliable Monitoring Metrics in Clean Waters? Ecol. Indic. 2015, 62, 312–316. [Google Scholar] [CrossRef]
- Lobo, E.; Callegaro, V.L.M.; Hermany, G.; Bes, D.; Wetzel, C.; Linton, M. Use of Epilithic Diatoms as Bioindicators from Lotic Systems in Southern Brazil, with Special Emphasis on Eutrophication. Acta Limnol. Bras. 2004, 16, 25–40. [Google Scholar]
- Besse-Lototskaya, A.; Verdonschot, P.F.M.; Coste, M.; Van de Vijver, B. Evaluation of European Diatom Trophic Indices. Ecol. Indic. 2011, 11, 456–467. [Google Scholar] [CrossRef]
- Oeding, S.; Taffs, K.H. Are Diatoms a Reliable and Valuable Bio-Indicator to Assess Sub-Tropical River Ecosystem Health? Hydrobiologia 2015, 758, 151–169. [Google Scholar] [CrossRef]
- Kennedy, B.; Buckley, Y.M. Use of Seasonal Epilithic Diatom Assemblages to Evaluate Ecological Status in Irish Lakes. Ecol. Indic. 2021, 129, 107853. [Google Scholar] [CrossRef]
- Watanabe, T.; Asai, K.; Ohtsuka, T.; Tuji, A.; Houki, A. Picture Book and Ecology of the Freshwater Diatoms; Uchida Rokakuho Publishing: Tokyo, Japan, 2005. [Google Scholar]
- Pianka, E.R. The Structure of Lizard Communities. Annu. Rev. Ecol. Syst. 1973, 4, 53–74. [Google Scholar] [CrossRef] [Green Version]
- Carayon, D.; Eulin-Garrigue, A.; Vigouroux, R.; Delmas, F. A New Multimetric Index for the Evaluation of Water Ecological Quality of French Guiana Streams Based on Benthic Diatoms. Ecol. Indic. 2020, 113, 106248. [Google Scholar] [CrossRef]
- Zhang, Y.J.; Li, C.W.; Hu, B.B.; Xie, H.J.; Song, A.Y. Impact of a “source-sink” landscape pattern in an urbanized watershed on nitrogen and phosphorus spatial variations in rivers: A case study of Yuqiao Reservoir watershed, Tianjin, China. Acta Ecol. Sin. 2017, 37, 839–845. [Google Scholar] [CrossRef]
- Bere, T.; Tundisi, J.G. Applicability of the Pampean Diatom Index (PDI) to Streams around São Carlos-SP, Brazil. Ecol. Indic. 2012, 13, 342–346. [Google Scholar] [CrossRef] [Green Version]
- Taylor, J.C.; Prygiel, J.; Vosloo, A.; de la Rey, P.A.; van Rensburg, L. Can Diatom-Based Pollution Indices Be Used for Biomonitoring in South Africa? A Case Study of the Crocodile West and Marico Water Management Area. Hydrobiologia 2007, 592, 455–464. [Google Scholar] [CrossRef]
- Lavoie, I.; Hamilton, P.B.; Wang, Y.K.; Dillon, P.J.; Campeau, S. A Comparison of Stream Bioassessment in Quebec (Canada) Using Six European and North American Diatom-Based Indices. Nova Hedwig. 2009, 135, 37–56. [Google Scholar]
- Butcher, R.W. Studies in the Ecology of Rivers: VI. The Algal Growth in Certain Highly Calcareous Streams. J. Ecol. 1946, 33, 268. [Google Scholar] [CrossRef]
- Bennion, H.; Kelly, M.G.; Juggins, S.; Yallop, M.L.; Burgess, A.; Jamieson, J.; Krokowski, J. Assessment of Ecological Status in UK Lakes Using Benthic Diatoms. Freshw. Sci. 2014, 33, 639–654. [Google Scholar] [CrossRef] [Green Version]
- DeNicola, D.M.; Kelly, M. Role of Periphyton in Ecological Assessment of Lakes. Freshw. Sci. 2014, 33, 619–638. [Google Scholar] [CrossRef]
- Dalu, T.; Cuthbert, R.N.; Taylor, J.C.; Magoro, M.L.; Weyl, O.L.F.; Froneman, P.W.; Wasserman, R.J. Benthic Diatom-Based Indices and Isotopic Biomonitoring of Nitrogen Pollution in a Warm Temperate Austral River System. Sci. Total Environ. 2020, 748, 142452. [Google Scholar] [CrossRef]
- Çetin, T.; Solak, C.N.; Yılmaz, E. Testing the Performance of European Diatom Indices for Evaluating the Ecological Status in the Kızılırmak Basin, Turkey: Flowing Waters. Environ. Sci. Pollut. Res. 2021, 28, 43567–43578. [Google Scholar] [CrossRef] [PubMed]
- Jakovljević, O.; Popović, S.; Živić, I.; Stojanović, K.; Krizmanić, J. Benthic Diatoms of the Vrla River (Serbia) and Their Application in the Water Ecological Status Assessment. Oceanol. Hydrobiol. Stud. 2016, 45, 304–315. [Google Scholar] [CrossRef]
- Blocksom, K.A. A Performance Comparison of Metric Scoring Methods for a Multimetric Index for Mid-Atlantic Highlands Streams. Environ. Manage. 2003, 31, 670. [Google Scholar] [CrossRef]
Figure 1.
Flow chart for creating a regional diatom index (YRDAI).

Figure 2.
Study area and sampling locations.

Figure 3.
Diatom distribution for each sampling site. All the diatom species with a relatively low percentage are included in the category entitled as Others.
Figure 3.
Diatom distribution for each sampling site. All the diatom species with a relatively low percentage are included in the category entitled as Others.

Figure 4.
Matrix of coexistence index of each pair of diatom species which were selected by the coexistence-based approach, and the diatoms were ordered according to TI values based on (a) COD and (b) TP. Grey color means that two diatoms were not found at the same sampling location. The abbreviations of species are listed in Table 2.

Figure 5.
Relationship between COD (a–d) and TP (e–h) concentrations and the diatom indices with 95% confidence interval.
Figure 5.
Relationship between COD (a–d) and TP (e–h) concentrations and the diatom indices with 95% confidence interval.

Figure 6.
Comparison of DAIpo, YRDAIco and YRDAIcor scores.


Table 1.
Pollutants and diatom index scores in the Yuqiao Reservoir watershed, China.
| Site | COD | TN | TP | DAIpo | YRDAIco-COD | YRDAIco-TP | YRDAIcor |
|---|---|---|---|---|---|---|---|
| (mg/L) | (mg/L) | (mg/L) | |||||
| 1 | 41 | 5.01 | 0.09 | 39.98 | 12.42 | 9.91 | 52.83 |
| 2 | 15 | 5.69 | 0.3 | 49.32 | 46.02 | 49.32 | 49.32 |
| 3 | 4 | 12.5 | 0.04 | 48.74 | 30.96 | 30.96 | 30.96 |
| 4 | 34 | 6.56 | 0.14 | 41.89 | 33.99 | 40.57 | 46.38 |
| 5 | 84 | 4.48 | 1.13 | 77.56 | 71.71 | 73.66 | 75.61 |
| 6 | 8 | 5.74 | 0.04 | 82.73 | 42.58 | 49.76 | 58.39 |
| 7 | 6 | 2.9 | 0.03 | 55.88 | 39.21 | 50.00 | 58.75 |
| 8 | 40 | 3.36 | 0.09 | 60.66 | 29.27 | 41.33 | 43.09 |
| 9 | 6 | 3.94 | 0.03 | 62.32 | 44.95 | 38.50 | 59.04 |
| 10 | 14 | 7.22 | 0.06 | 52.64 | 40.77 | 52.16 | 52.16 |
| 11 | 37 | 17.3 | 0.61 | 11.96 | 5.26 | 11.96 | 11.96 |
| 12 | 48 | 3.22 | 0.21 | 52.48 | 16.58 | 46.29 | 46.29 |
| 13 | 28 | 8.57 | 0.17 | 66.54 | 50.12 | 50.25 | 64.44 |
| 14 | 29 | 5.54 | 0.48 | 57.84 | 47.35 | 36.53 | 54.64 |
| 15 | 25 | 6.16 | 0.34 | 61.41 | 61.41 | 28.16 | 59.80 |
| 16 | 2 | 10.5 | 0.01 | 79.20 | 64.11 | 70.56 | 73.72 |
| 17 | 7 | 4.28 | 0.05 | 66.11 | 62.32 | 66.11 | 66.11 |
| 18 | 2 | 4.71 | 0.01 | 80.16 | 50.46 | 52.75 | 60.78 |
| 19 | 2 | 2.16 | 0.01 | 59.84 | 48.76 | 49.77 | 73.19 |
| 20 | 2 | 3.79 | 0.005 | 52.23 | 49.63 | 64.48 | 70.05 |
| 21 | 2 | 3.27 | 0.01 | 70.03 | 39.80 | 50.63 | 55.79 |
| 22 | 4 | 5.98 | 0.04 | 52.02 | 49.76 | 54.29 | 85.36 |
| 23 | 2 | 4.5 | 0.01 | 51.29 | 49.53 | 49.65 | 94.85 |
| 24 | 10 | 9.22 | 0.01 | 75.81 | 44.01 | 50.23 | 64.52 |
| 25 | 13 | 6.03 | 0.36 | 52.71 | 24.17 | 16.75 | 53.07 |
| 26 | 16 | 8.67 | 0.43 | 65.97 | 46.99 | 34.03 | 57.18 |
| 27 | 2 | 3.77 | 0.09 | 87.00 | 68.56 | 86.64 | 97.52 |
| 28 | 2 | 4.55 | 0.01 | 53.07 | 50.00 | 53.07 | 92.38 |
| 29 | 2 | 4.85 | 0.01 | 67.44 | 49.27 | 49.27 | 79.88 |
| 30 | 2 | 4.57 | 0.02 | 66.18 | 50.42 | 50.42 | 75.63 |
| 31 | 2 | 15.2 | 0.02 | 69.06 | 47.40 | 52.72 | 81.68 |
| 32 | 6 | 7.43 | 0.02 | 56.36 | 46.09 | 70.78 | 54.28 |
Table 2.
Diatom TI value and taxa groups in the Yuqiao Reservoir watershed.
| Taxon | Abbreviation | Origin Group [43] | TP | COD | Correlation | |||||
|---|---|---|---|---|---|---|---|---|---|---|
| Order | Optima (mg/L) | Group | Order | Optima (mg/L) | Group | Group | ||||
| Achnanthes atomus | AATO | saproxenous | 7 | 0.03 | indifferent | 9 | 4.73 | indifferent | ||
| A. minutissima var. scotica | ASCO | saproxenous | 10 | 0.05 | indifferent | 12 | 10.27 | indifferent | non | indifferent |
| Aulacoseira islandica | AISL | indifferent | non | indifferent | ||||||
| Cocconeis pediculus | CPED | saproxenous | 18 | 0.31 | saprophilous | |||||
| C. placentula var. euglypta | CEUG | saproxenous | 6 | 0.03 | indifferent | 5 | 2.37 | indifferent | non | indifferent |
| C. placentula var. placentula | CPLA | indifferent | 8 | 0.03 | indifferent | 8 | 3.95 | indifferent | negative | saproxenous |
| Ctenophora pulchella | CPUL | saproxenous | non | indifferent | ||||||
| Cyclostephanos fritzii | CFRI | indifferent | 14 | 0.19 | indifferent | 15 | 23.02 | saprophilous | non | indifferent |
| Cyclotella delicatula | CDEL | indifferent | 17 | 0.27 | saprophilous | non | indifferent | |||
| C. stelligera var. stelligera | CSTE | indifferent | 15 | 0.20 | saprophilous | 17 | 28.14 | saprophilous | ||
| Cymbella hustedtii | CHUS | saproxenous | 9 | 0.03 | indifferent | 10 | 5.32 | indifferent | non | indifferent |
| Diatoma mesodon | DMES | saproxenous | 7 | 3.94 | indifferent | non | indifferent | |||
| D. vulgaris | DVUL | saproxenous | 12 | 0.10 | indifferent | 13 | 14.99 | indifferent | non | indifferent |
| Eunotia osoresanensis | EOSO | indifferent | non | indifferent | ||||||
| Fragilaria capitellata | FCAP | saproxenous | 1 | 0.01 | saproxenous | 1 | 2.00 | saproxenous | ||
| Gomphoneis heterominuta | GHET | indifferent | 11 | 0.05 | indifferent | 11 | 8.02 | indifferent | non | indifferent |
| Gomphonema acuminatum | GACU | indifferent | non | indifferent | ||||||
| G. lagenula | GLAG | saprophilous | 16 | 0.20 | saprophilous | |||||
| G. productum | GPRO | indifferent | non | indifferent | ||||||
| G. tergestinum | GTER | indifferent | 3 | 0.01 | saproxenous | 4 | 2.28 | indifferent | ||
| Gyrosigma procerum | GPRO | indifferent | non | indifferent | ||||||
| Hannaea arcus var. amphioxys | HAMP | saproxenous | 2 | 2.00 | saproxenous | |||||
| Navicula cf. broetzii | NBRO | saprophilous | 18 | 34.84 | saprophilous | non | indifferent | |||
| N. cryptotenella | NCRY | saproxenous | 2 | 0.01 | saproxenous | 3 | 2.00 | saproxenous | ||
| N. decussis var. decussis | NDEC | indifferent | 19 | 0.33 | saprophilous | |||||
| N. gregaria | NGRE | indifferent | 13 | 0.15 | indifferent | 14 | 21.37 | saprophilous | non | indifferent |
| N. sublinearis | NSUB | indifferent | non | indifferent | ||||||
| N. yuraensis | NYUR | saproxenous | 5 | 0.03 | saproxenous | 6 | 3.88 | indifferent | ||
| Nitzschia paleacea | NPAL | indifferent | 16 | 23.35 | saprophilous | non | indifferent | |||
| Pinnularia acidophila | PACI | indifferent | non | indifferent | ||||||
| Pseudostaurosira brevistriata | PBRE | indifferent | 4 | 0.02 | saproxenous | |||||
| Staurosirella lapponica | SLAP | saprophilous | non | indifferent | ||||||
| Synedra lanceolata | SLAN | saprophilous | 21 | 0.61 | saprophilous | |||||
| S. rumpens | SRUM | indifferent | 20 | 0.46 | saprophilous | |||||
Table 3.
Results of correlation analysis quantifying the significance of the relationship between diatom indices and total phosphorus (TP), total nitrogen (TN) and chemical oxygen demand (COD). The symbols * and ** indicate significant correlation at the level of 0.05 and 0.01, respectively.
Table 3.
Results of correlation analysis quantifying the significance of the relationship between diatom indices and total phosphorus (TP), total nitrogen (TN) and chemical oxygen demand (COD). The symbols * and ** indicate significant correlation at the level of 0.05 and 0.01, respectively.
| COD | TN | TP | DAIpo | YRDAIcor | YRDAIco-COD | YRDAIco-TP | |
|---|---|---|---|---|---|---|---|
| COD | 1 | ||||||
| TN | 0.09 | 1 | |||||
| TP | 0.58 ** | 0.35 | 1 | ||||
| DAIpo | −0.49 ** | −0.28 | −0.47 ** | 1 | |||
| YRDAIcor | −0.61 ** | −0.36 * | −0.54 ** | 0.55 ** | 1 | ||
| YRDAIco-COD | −0.65 ** | −0.24 | −0.37 * | 0.70 ** | 0.72 ** | 1 | |
| YRDAIco-TP | −0.57 ** | −0.27 | −0.58 ** | 0.61 ** | 0.62 ** | 0.73 ** | 1 |
Publisher’s Note: MDPI stays neutral with regard to jurisdictional claims in published maps and institutional affiliations. |
© 2022 by the authors. Licensee MDPI, Basel, Switzerland. This article is an open access article distributed under the terms and conditions of the Creative Commons Attribution (CC BY) license (https://creativecommons.org/licenses/by/4.0/).
Share and Cite
MDPI and ACS Style
Liu, Y.; Fang, J.; Mei, P.; Yang, S.; Zhang, B.; Lu, X. How to Create a Regional Diatom-Based Index: Demonstration from the Yuqiao Reservoir Watershed, China. Water 2022, 14, 3926. https://doi.org/10.3390/w14233926
AMA Style
Liu Y, Fang J, Mei P, Yang S, Zhang B, Lu X. How to Create a Regional Diatom-Based Index: Demonstration from the Yuqiao Reservoir Watershed, China. Water. 2022; 14(23):3926. https://doi.org/10.3390/w14233926
Chicago/Turabian StyleLiu, Yufei, Jing Fang, Pengyu Mei, Shuo Yang, Bo Zhang, and Xueqiang Lu. 2022. "How to Create a Regional Diatom-Based Index: Demonstration from the Yuqiao Reservoir Watershed, China" Water 14, no. 23: 3926. https://doi.org/10.3390/w14233926
Note that from the first issue of 2016, this journal uses article numbers instead of page numbers. See further details here.