
Enhanced Swine Wastewater Treatment by Constructed Wetland—Microbial Fuel Cell Systems
by
Yun Zhang
1,
Feng Liu
1,*,
Yidong Lin
2,
Lei Sun
1,3,*,
Xinru Guo
1,
Shuai Yang
1 and
Jinlong He
1 1
School of Chemistry and Chemical Engineering, Jiangxi Science and Technology Normal University, Nanchang 330013, China
2
Yushan County Ecological Environment Bureau, Shangrao 334700, China
3
School of Materials and Mechanical & Electrical Engineering, Jiangxi Science and Technology Normal University, Nanchang 330036, China
*
Authors to whom correspondence should be addressed.
Water 2022, 14(23), 3930; https://doi.org/10.3390/w14233930
Submission received: 24 October 2022
/
Revised: 22 November 2022
/
Accepted: 29 November 2022
/
Published: 2 December 2022
(This article belongs to the Special Issue Advances in Wastewater Treatment: Resources Recovery, Energy Neutralization, Water Reuse)
Abstract
:This paper studies the effects of planting plants and coupled microbial fuel cells (MFCs) on the decontamination capacity and purification mechanism of constructed wetlands (CWs). Four systems were set, namely CW-without plants (A1), CW-with plants (A2), CW-MFC-without plants (A3) and CW-MFC-with plants (A4). The daily reductions per unit area of chemical oxygen demand (COD) were 48.72 ± 5.42, 51.26 ± 4.10, 53.49 ± 5.44 and 58.54 ± 4.16 g·(d·m2)−1, respectively. The daily reductions per unit area of nitrogen (N) were 11.89 ± 0.73, 12.38 ± 0.76, 12.24 ± 0.79 and 13.61 ± 1.07 g·(d·m2)−1, respectively. After studying the pollutant removal efficiency, it was found that the unit area of A4 removes the highest number of pollutants, improving the area efficiency of the wetland system and fundamentally alleviating the disadvantage of the large land footprint of wetland processes. The average output voltages of A3 and A4 were 568.29 and 717.46 mV, respectively, and the maximum power densities were 4.59 and 15.87 mW/m3, respectively. In addition, after high-throughput analysis of microbial samples, anaerobic ammonia oxidising (anammox) bacteria were found to remove N from the system in the anaerobic anode region.
1. Introduction
There is an imbalance between the production and treatment of wastewater across the world. A large amount of wastewater cannot be treated effectively mainly due to high treatment costs. Although saving water and improving the utilisation rate of clean water are always observed, an affordable wastewater purification technology is a key step in reducing the harmful effects of pollutants to the natural environment and improving the water quality [1]. Research states that the pollutants contained in wastewater have two-sided effects. On the one hand, the pollutants will harm the natural ecosystem. On the other hand, they contain inherent energy, perhaps far more than it requires for purification [2,3].
Among several swine wastewater treatment technologies, anaerobic biological treatment, aerobic biological treatment and natural methods, the high cost and complex maintenance process are obstacles to widespread adoption [4]. The constructed wetland (CW) technology is the one with less capital investment and low operating cost. Many novel technologies have been studied to optimise the disadvantages of large land footprint and long treatment time of the CW [5]. The novel technologies mainly focus on efficient structural design, substrate selection and arrangement, plant selection and combinations, adding aeration and coupling with other equipment. Among them, the coupling of the microbial fuel cell (MFC) with CW is considered because it can purify wastewater and generate electricity simultaneously. An MFC is a water–energy nexus among wastewater treatment technologies [6]. The use of MFCs is a newly emerging method of purifying pollutants and producing energy simultaneously. Studies on MFC opportunities have received extensive attention in recent years [7,8], as MFCs have advantages like low sludge production and low operating cost. An MFC is usually composed of reaction chambers, electrodes and an external circuit, and the electrochemically active bacteria (EAB) are the primary biocatalysts in electricity generation. In the anaerobic area, EAB generate and transmit electrons to the anode. The anode acts as the temporary electron acceptor, and then the electrons are transmitted to the cathode via an external circuit. The aerobic area receives the electrons and protons from the anaerobic area, and the final electron acceptor (as O2) receives the electrons from the cathode. The dissolved oxygen (DO) in the CW changes with the CW depth, generating favourable conditions in the aerobic, anoxic and anaerobic areas. The naturally present redox gradient in CWs is a favourable condition for MFC [9]. The artificially provided conductive materials can transfer electrons to avoid electron accumulation. This process can facilitate the degradation of pollutants [10,11]. Thus, coupling MFC with CW for wastewater treatment has attracted increased attention [12]. Several factors have been considered regarding this coupling technology, for example, the selection of the media and plants, the different types of wastewater, the function of EAB and the different N removal methods, among others. Tanveer et al. [13] reported the influence of the media and the wet–dry period ratio. Six kinds of media, biochar, coal, jute fibre, slag, concrete and brick were studied. The percentages of COD, N (nitrogen) and P (phosphorus) removal ranged between 75% and 100%, 57% and 86% and 80% and 100%, respectively. The wet–dry period variation has a clear effect on N removal kinetics and almost has no effect on the organics and P removal. The wet–dry period variation has an influence on oxygen utilisation in TN removal (the process of nitrification and denitrification), while P removal in CWs is generally achieved via adsorption into media. Liu et al. [14] employed this approach to treat swine wastewater, achieving high COD and ammonium nitrogen (NH4+-N) removal rates of 79.65% and 77.5%, respectively, and simultaneously realising a peak voltage and power density of 713 mV and 0.456 W/m3, respectively. The swine wastewater flows in the aerobic, anaerobic and aerobic areas orderly, where nitrification and denitrification occur in different areas. Doherty [15] used the vertical flow CW coupled with MFC in the swine slurry treatment and discovered the superior organic contaminant removal of the CW-MFC compared to traditional CW systems. Camacho et al. [16] coupled the horizontal submersible CW with MFC to treat high-salt wastewater to study the effect of salt content on the performance of CW-MFC. The NaCl concentration was increased from 0.51 to 9.51 g/L to change the wastewater salinity. It was found that although the presence of a certain salt concentration can inhibit microbial growth and impair plant performance, higher salinity levels can reduce the internal ohmic resistance and then improve the power generation capacity. The coupled system CW-MFC was also used in the sustainable greywater treatment, and the COD removal efficiency was up to 91.7 ± 5.1%, which was better than CW [17]. The effects of macrophytes CW-MFCs were investigated, and it was found that the COD removal rates of no-plants, Canna indica, Acorus calamus and Ipomoea aquatica were 80.20%, 88.07%, 84.70% and 82.20%, respectively, and the NH4+-N removal rates were 49.96%, 75.02%, 70.25% and 68.47%, respectively. Oxygen and organic matter released by different plants’ roots affected the N and organics removal and the electricity generation. The decontamination capability of the Canna indica system was the best, while Ipomoea aquatica had the largest effect on bioelectricity generation promotion [18]. Patel et al. [19] used a pilot scale sequential two-step horizontal subsurface flow CWs-MFC (HSCW-MFC) system to treat textile dye wastewater. They found that after bioaugmentation of DC5 into the HSCW-MFC, COD and ADMI removal was enhanced to 74.10 ± 1.75% and 97.32 ± 1.90%, respectively, with a maximum power density of 197.94 mW/m2. They also found that the voltage outputs increased with an increase in the influent COD of the wastewater. The higher influent COD of wastewater can offer more electrons that can be accepted by the anode, resulting in higher-power density generation [20]. An electrode-dependent anaerobic ammonium oxidation in an integrated hybrid CW-MFC was examined to explain the phenomenon that the TN and NH4+-N removal in the closed circuit mode is always higher than the normal CW. An electrode was used as an electron acceptor in anaerobic conditions in the process of the dominant bacteria for the electro-anammox and the pathway of ammonium oxidation [21].
In this study, the MFC was coupled into the traditional IVCW (Integrated Vertical-flow Constructed Wetland). Two regulatory conditions included the plants and the closed circuit, which were used to establish the orthogonal experiments. The coupled systems were set up as follows (Table 1): without plants, and the open circuit was a control system (A1), without the plants and the closed circuit (A2), with the plants and the open circuit (A3), with the plants and the closed circuit (A4). COD, NH4+-N, NO3−-N and TP removal was the main focus, and the mechanisms were discussed. The bioelectricity generation effects and the microbial distribution characteristics were investigated. By improving the removal amount per unit area and the operating conditions of CWs, the disadvantages of CWs, such as a large land footprint and limited service time, are optimised.
2. Materials and Methods
2.1. Experimental Setup and Operating Conditions
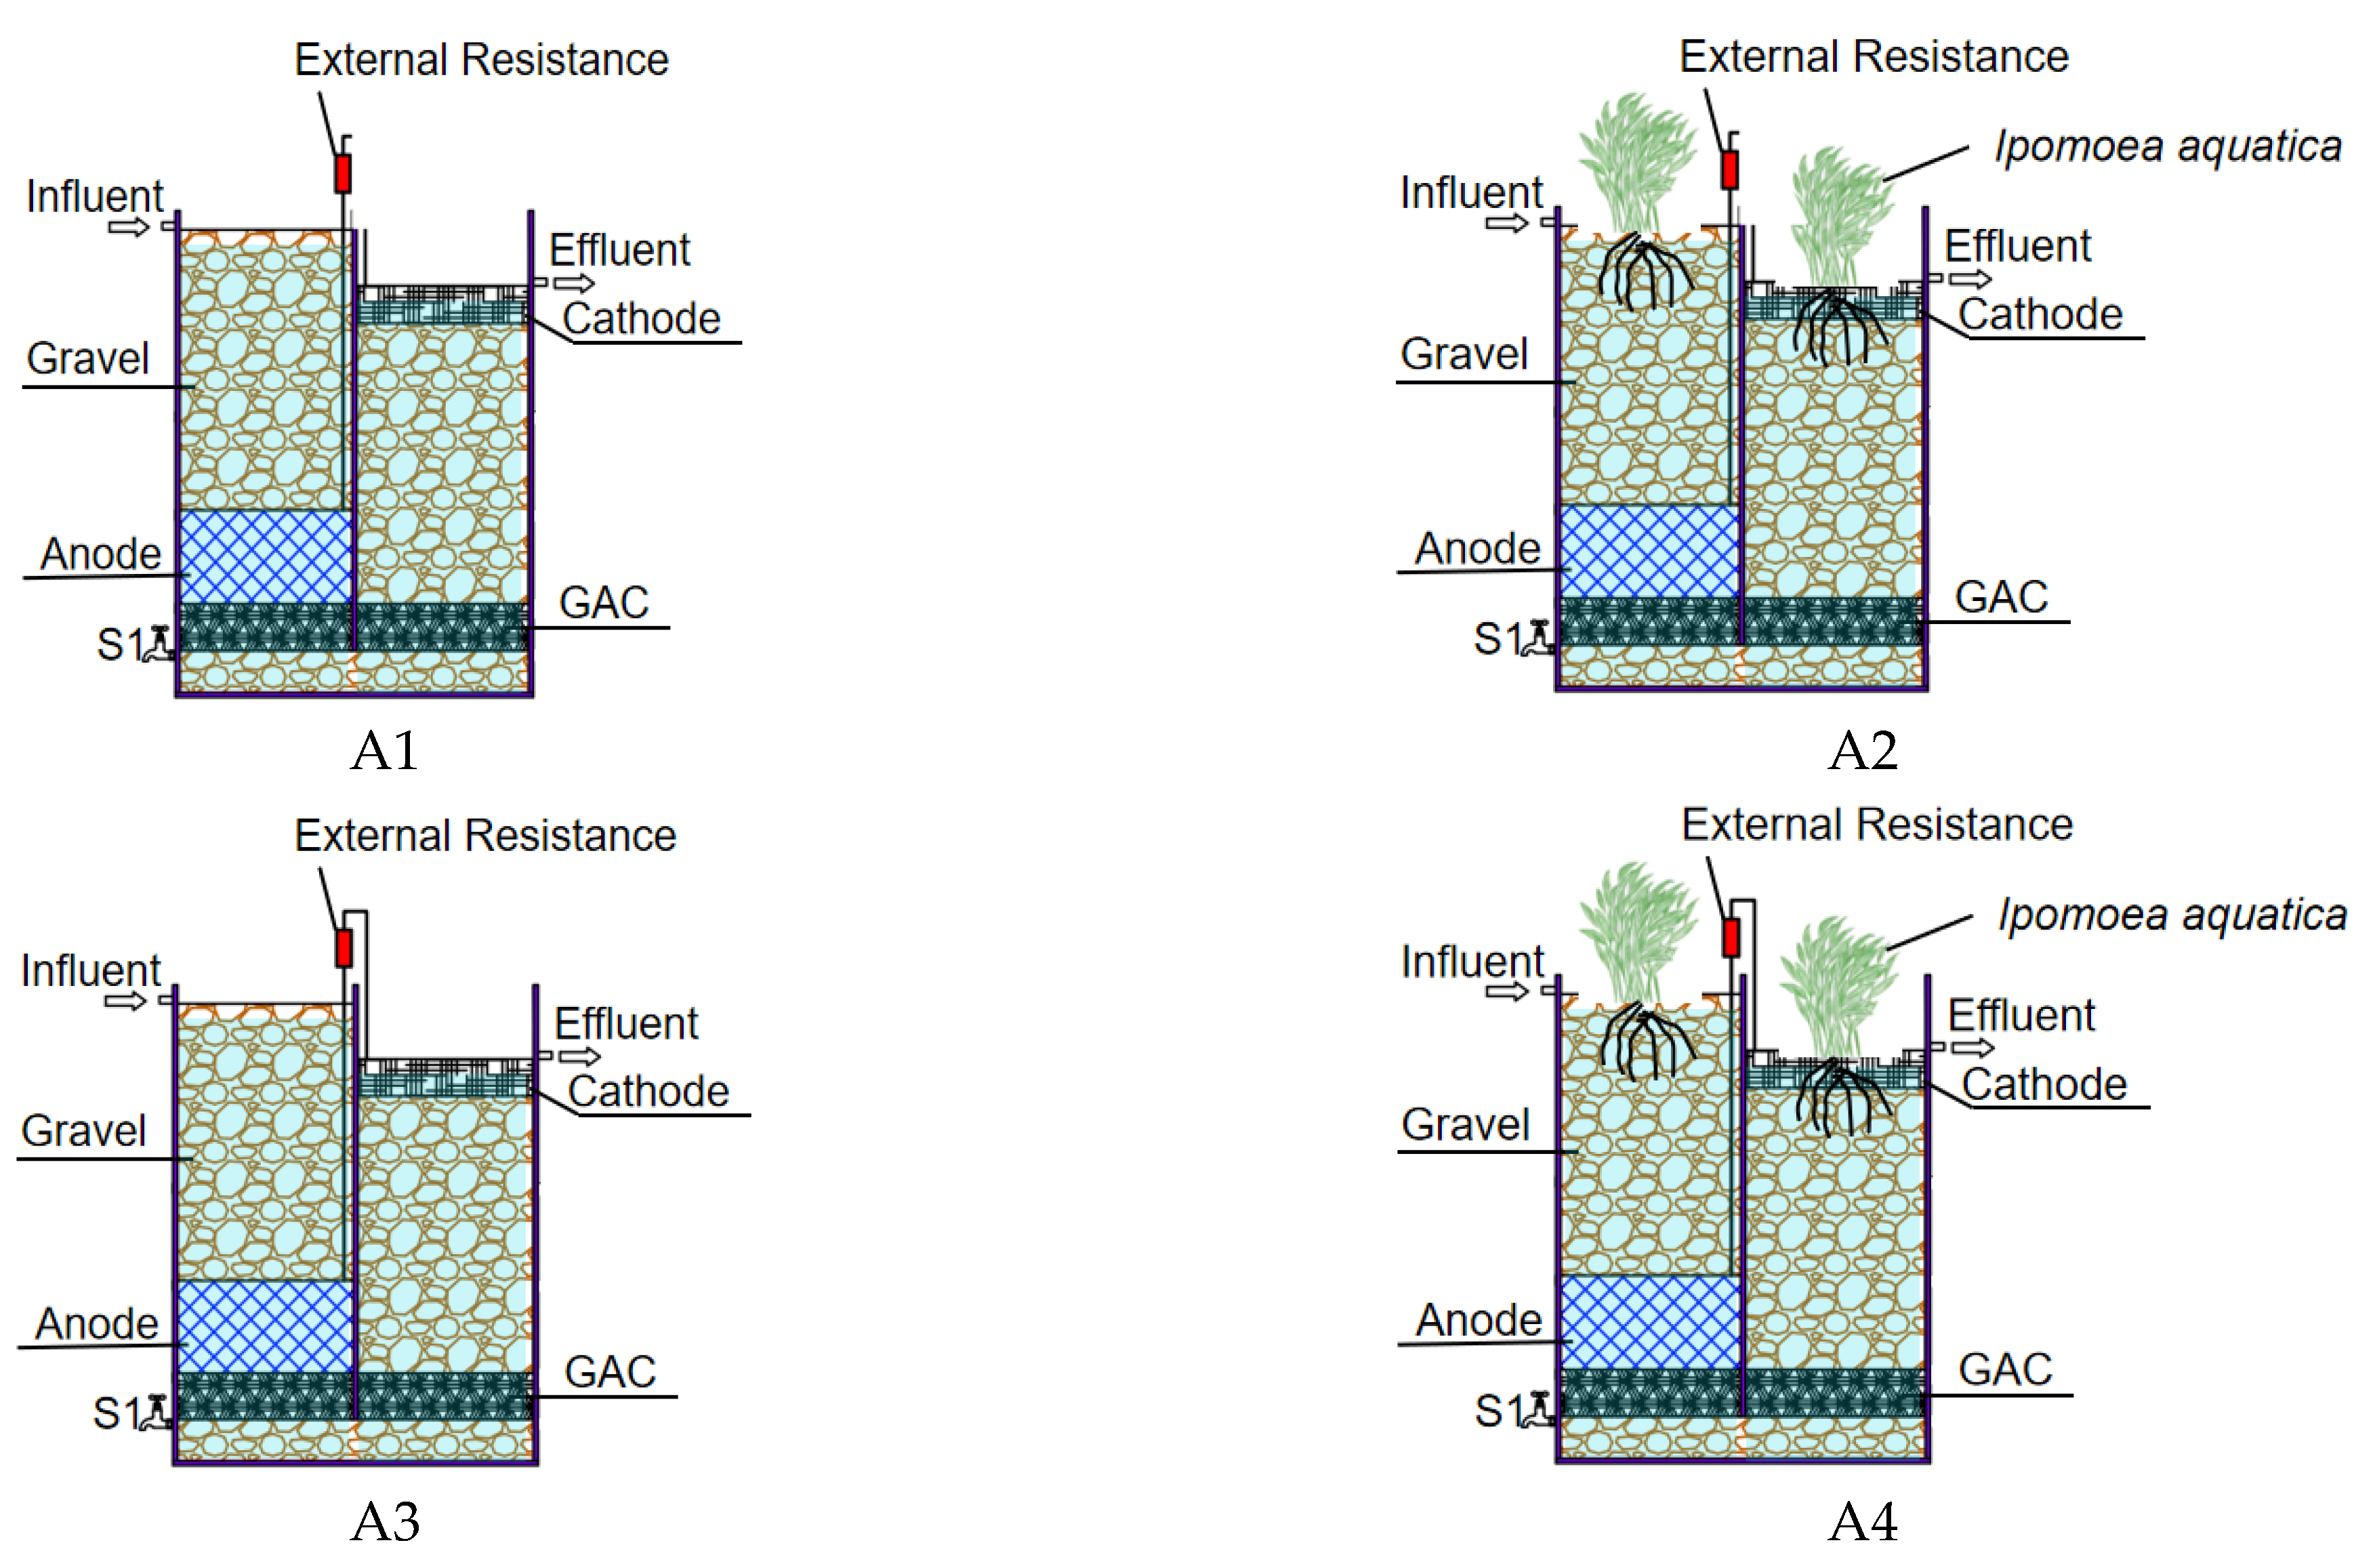
There are four coupled systems set up in this study. The coupled system was composed of a 50-cm-tall polyacrylic plastic box with a rectangular cross-section of 40 cm × 20 cm, as shown in Figure 1. To improve the effects of the system on the anaerobic and aerobic environment as well as the redox gradient, the reactor was divided into downflow and upflow regions by polyacrylic plastic; the bottom 5 cm was left unblocked. The water inlet was above the downflow region. The influent first arrived in the downflow area, passed the anode region, moved through the bottom to the upflow area, and finally arrived at the cathode region. The anode adopted a stainless-steel wire mesh to wrap the activated carbon particles in (20 cm × 20 cm × 10 cm) that was buried in the downflow area (10–20 cm from the bottom), complying with the anodic conditions of the MFC, which was in an anaerobic condition [22]. Carbon felt was used as the cathode (20 cm × 20 cm) and arranged on the upflow surface. It could be combined with plant roots and contact with the air to promote oxygen transport and diffusion to create better aerobic conditions. This layer supplied sufficient support for anaerobic heterotrophic bacteria, which continuously degraded organic compounds remaining after the anodic removal. An activated carbon layer was set 5 cm above the bottom in both the downflow and upflow regions. The stainless-steel screen mesh, the carbon felt and the metal titanium wires were used to connect the anode and cathode with an external resistance of 800 Ω to complete the circuit. The exposed area of wire was then covered with water-proof nonconductive epoxy to insulate it. The activated carbon layer acted as a temporary carbon source. Some organic matter was fixed by the activated carbon absorbing. This process reduced the number of organic compounds reaching the cathode. A sampling port was located at anode that was 10 cm above the bottom. The Ipomoea aquatica was planted in this study. The effective volume of the whole container was 11.5 L, while the whole volume was 37.8 L. The orthogonal experiments were shown in Table 1. The structures of coupled systems were shown in Figure 1.
2.2. Swine Wastewater and Inoculation
The swine wastewater used in this study was collected from Zhenghua Farm (Nanchang, China, 28°51.750′ N, 116°9.950′ E), which breeds live pigs with 20,000 livestock on hand. The COD concentration varied from 852.18 to 1056.71 mg/L, while the NH4+-N, NO3−-N, NO2−-N concentrations varied from 170.23 to 238.13 mg/L, 34.63 to 68.64 mg/L and 0.004 to 0.011 mg/L, respectively. Under continuous, saturated flow conditions, each coupled system treated 5.75 L of swine wastewater daily with a hydraulic residence time (HRT) of 2 days.
The inoculum sludge was taken from the anaerobic process at Pengyao Wastewater Treatment Plant (Nanchang, China). The anaerobic sludge was fed with artificial wastewater at room temperature in the laboratory for longer than two weeks. Glucose, ammonium chloride and sodium nitrate were used as the carbon source (COD 900 mg/L) and nitrogen source (NH4+-N 200 mg/L, NO3−-N 40 mg/L), respectively. The swine wastewater and the inoculum liquid were mixed (v:v, 1:1) and pumped into the coupled system continuously. The systems were operated for about a month until the stable removal rates and the reproducible voltages were observed.
2.3. Chemical Analysis
For each system (shown in Table 1), the samples for analysis were collected from the influent, the anode (S1) and the effluent in the direction of the water flow. To reduce the effects of diurnal variations on the removal efficiency, samples were collected once every two days at 9:00 local time. The wastewater treatment performance of the coupled systems was determined by taking measurements of COD, NH4+-N, NO3−-N, NO2−-N and TP from each sampling port.
2.4. Electrochemical and Other Calculations
The electrochemical parameters were calculated using Ohm’s law. The calculation formulae related to bio-production are as follows:
where U (V) is the measured cell voltage; R (Ω) is the external resistance; I (A) is the current of the circuit; P (W) is the power; Va (m3) is the effective volume of the anode; Pd (W/m3) is the power density; CE (%) is the coulombic efficiency; Q (C) is charge quantity. In addition, M is the molecular mass of O2 (32 g ·mol−1); I (A) is current; F is Faraday’s constant (C·mol−1), which is 96 485; q is flow rate (L·s−1); n is the number of electrons donated per mole of O2 (mol e−/mol O2), which is 4; and ΔCOD represents the change in the concentration between the in influent and effluent (g L−1).
2.5. Microbial Community Analysis
The microbial communities of the coupled systems were examined using high-throughput 16S rRNA pyrosequencing technology. The biofilms were collected at the end of the experiments by scraping the anode and cathode surface, then sampled for microbial community analysis. Genomic DNA of the biofilms was extracted after centrifuging the samples at 10,000 r/min for 3 min. The DNA was extracted by using an extraction kit (E.Z.N.ATM Mag-Bind Soil DNA Kit, Omega, Norcross, GA, USA) and following the manufacturer’s instructions. The Illumina MiSeq platform (Shanghai Sangon Biotech Co., Ltd., Shanghai, China) targeted the V3-V4 region of the 16S rRNA gene. Libraries were constructed through polymerase chain reactions using primers with the Illumina overhang adapter sequences, 341F (CCCTACACGACGCTCTTCCGATCTG (barcode) CCTACGGGNGGCWGCAG) and 805R (GACTGGAGTTCCTTGGCACCCGAGAATTCCA GACTACHVGGGTATCTAATCC), as per the manufacturer’s instructions.
3. Results and Discussions
3.1. Organics/COD Removal
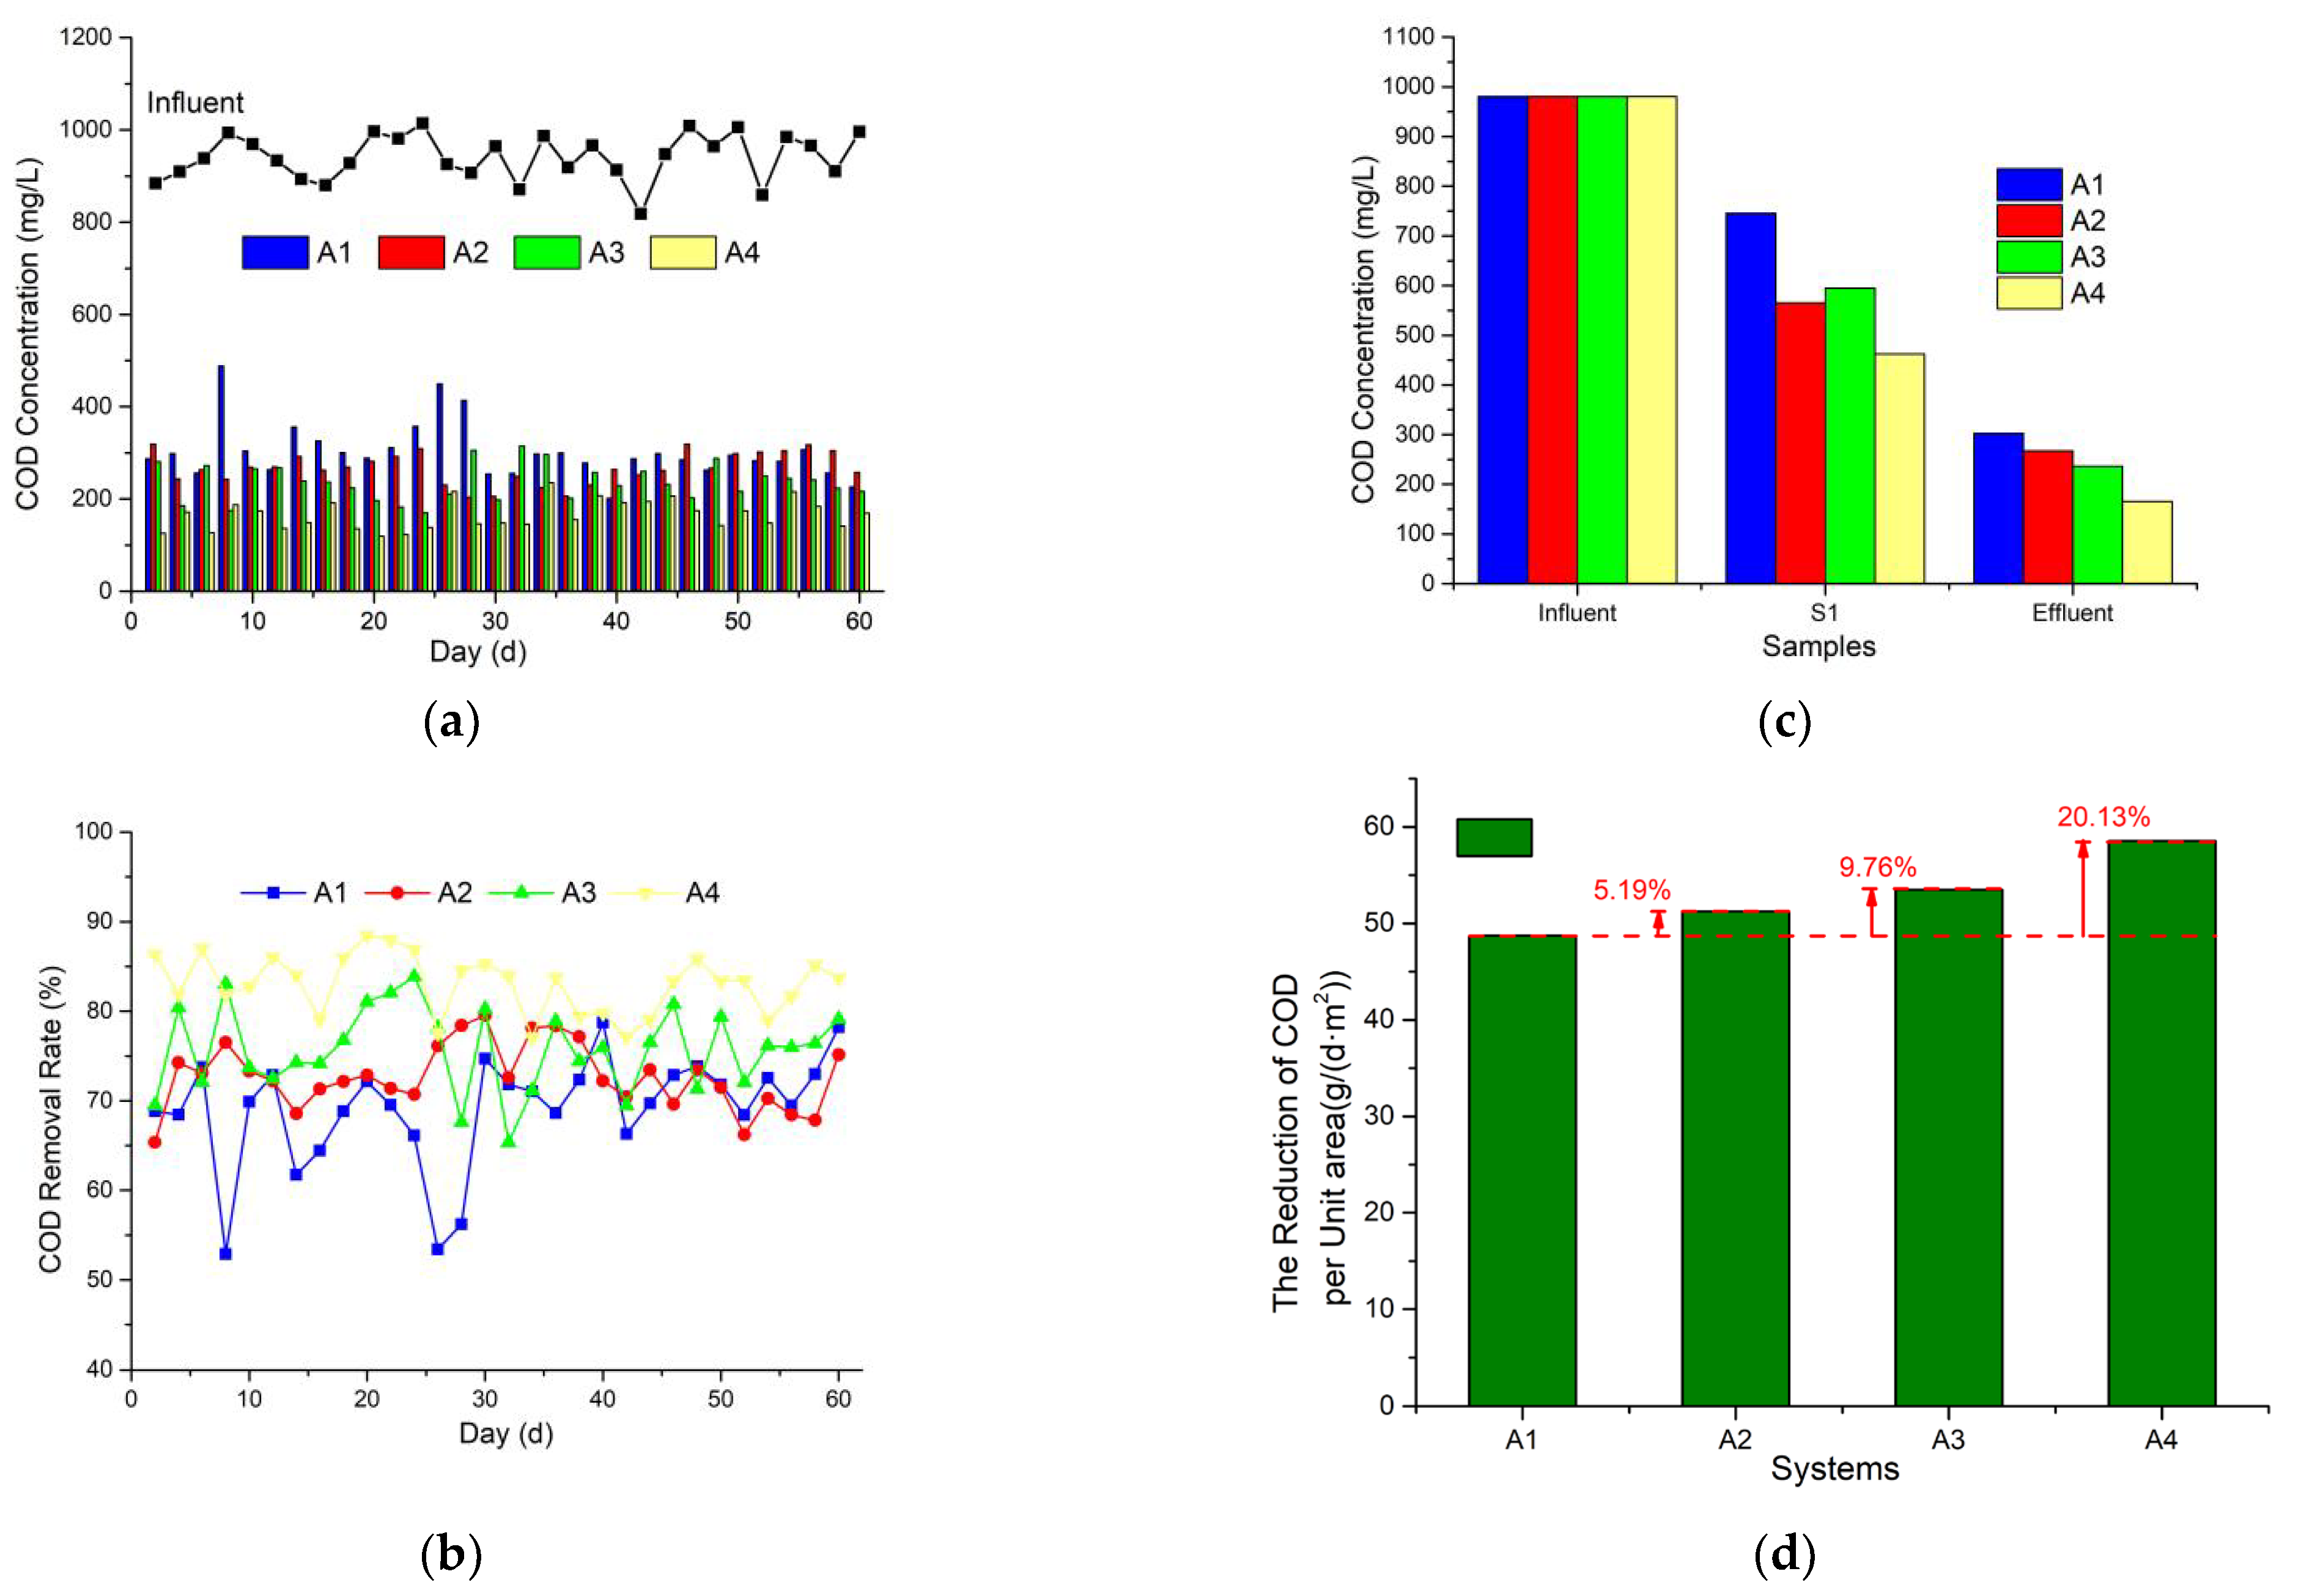
Figure 2a shows the COD effluent concentration, and Figure 2b shows the removal rates of different systems. Figure 2c shows the COD concentrations of the samples from the influent, S1 and the effluent. Figure 2d shows the COD removal amount per unit area of different systems. The COD influent concentration ranges from 852.18 mg/L to 1056.71 mg/L. The average COD effluent concentrations of A1, A2, A3 and A4 were 302.41, 267.21, 236.17 and 165.83 mg/L and the average COD removal rates were 69.09%, 72.69%, 75.76% and 83.07%, while the COD removal amounts per unit area were 48.72 ± 5.42, 51.26 ± 4.10, 53.49 ± 5.44 and 58.54 ± 4.16 g·(d·m2)−1, respectively. As shown in Figure 2b, the same water flow structure but different orthogonal combinations caused different COD concentrations in different systems. The COD concentrations in the anode and cathode areas of A2, A3 and A4 were lower than the controlled system A1, respectively. As shown in Figure 2b, the COD concentration in the anode area (S1) of A3 was lower than that of A2, but the COD effluent concentration of A3 was higher than that of A2. Many studies have demonstrated the improvement in the removal effect of CWs by the cultivation of appropriate plants. In this study, Ipomoea aquatica is chosen as an excellent CW plant. The advantages of Ipomoea aquatica include its strong pollution resistance, good purification effect, well-developed root system and easy maintenance [23]. Not only does this plant have an excellent absorption capacity for pollutants, but the dense mesh structure formed by its developed roots holds a filtration capacity and provides attachment points for wetland microorganisms, which is conducive for improving the effluent quality [24]. In A3, the COD concentration is decreased faster after the purification of the downflow area due to the filtration capacity of the plant roots. In A2, the COD concentration of the effluent is lower than the A3 effluent. However, A3 showed better COD purification effect at the final outlet. In A3, the anode acted as a temporary electron acceptor in the closed electric circuit, promoting the anaerobic bacteria in anaerobic areas and accelerating the degradation of pollutants [21]. The same cathode acted as a temporary electron donor, promoting the metabolism of oxygen heterotrophs in the aerobic area to strengthen the degradation of pollutants. Compared with A2, the plant root filtration only waylaid pollutants and apparently reduced the concentration of COD, which may take longer to complete the degradation and may increase the organic matter content due to plant tissue shedding. In A3, the redox reaction was accelerated by promoting the transmission of electron flow. The degradation of pollutants was more thorough, and the high degradation speed could avoid the accumulation of COD in the system. The advantages of A2 and A3 are found in A4. Liu et al. [18] reported that the oxygen release of the Ipomoea aquatica root could form a significant redox gradient, which can not only effectively create a favourable growth environment for aerobic heterotrophic bacteria but also effectively maintain the anaerobic environment of the anode that is conducive in facilitating the growth of EAB. Mechanical aeration hardly achieved the subtle effect of macrophytic aeration. Although mechanical aeration can promote a metabolic reaction in the aerobic areas, it hindered the survival and growth of EAB in the anode areas. Macrophytic aeration can replace mechanical aeration in terms of cost and efficiency [25,26]. Although it was slightly inefficient, macrophytic aeration did not need to consume fossil fuels, and plants could also serve as temporary aggregates of CO2, which was conducive to reducing air CO2 [27]. The organic matter released by Ipomoea aquatica roots was mostly small molecules that were easily used by EAB, promoting the growth of EAB. This was beneficial to the degradation of organic matter and electricity production. The removal rate was usually used as an indicator to evaluate the CWs. However, due to the great difference in CW structure, the reduction of COD per unit area was introduced in this paper to evaluate the performance of systems purification pollutants. Clearly, A4 had significant advantages in COD removal. The CWs attained most of the pollutant removal in these coupled systems. The removal of pollutants by CWs was mainly caused by interception, precipitation, adsorption, microbial degradation and plant absorption (planting plants), among other processes [28]. In this study, the removal of COD in A1 partly represented the performance of COD removal by no-plants CWs. Comparing three other systems with A1, the improvement of COD removal was discussed in regard to planting plants (A2), electricity generation (A3) and both of the above conditions (A4). Research indicates that the reduction of COD per unit area of A2, A3 and A4 increased by 5.19%, 9.76% and 20.13%, respectively, compared with A1. In other words, the floor area reduction rates achieved by removing the unit COD daily were 4.92%, 8.87% and 16.76%, respectively. This was significant regarding improvements to the disadvantages of the CW’s large land footprint.
By comparing the removal amounts of COD per unit area daily with A1 to assess the COD improvement of A2, A3 and A4 systems, it was found that the amounts increased to 2.53 g·(d·m2)−1, 4.76 g·(d·m2)−1 and 9.81 g·(d·m2)−1, respectively. Moreover, the sum of the increase in the amount of A2 and A3 (i.e., 7.29 g·(d·m2)−1) was lower than the increase in the amount of A4 (9.81 g·(d·m2)−1). The better coupling performance was verified in this study. A4 had achieved the synergistic reaction of plants and the closed circuit simultaneously, which was higher than the sum of a single coupled condition of plants or the closed circuit. Thus, the ability of A4 to perform COD removal was more determined.
3.2. Nitrogen Removal
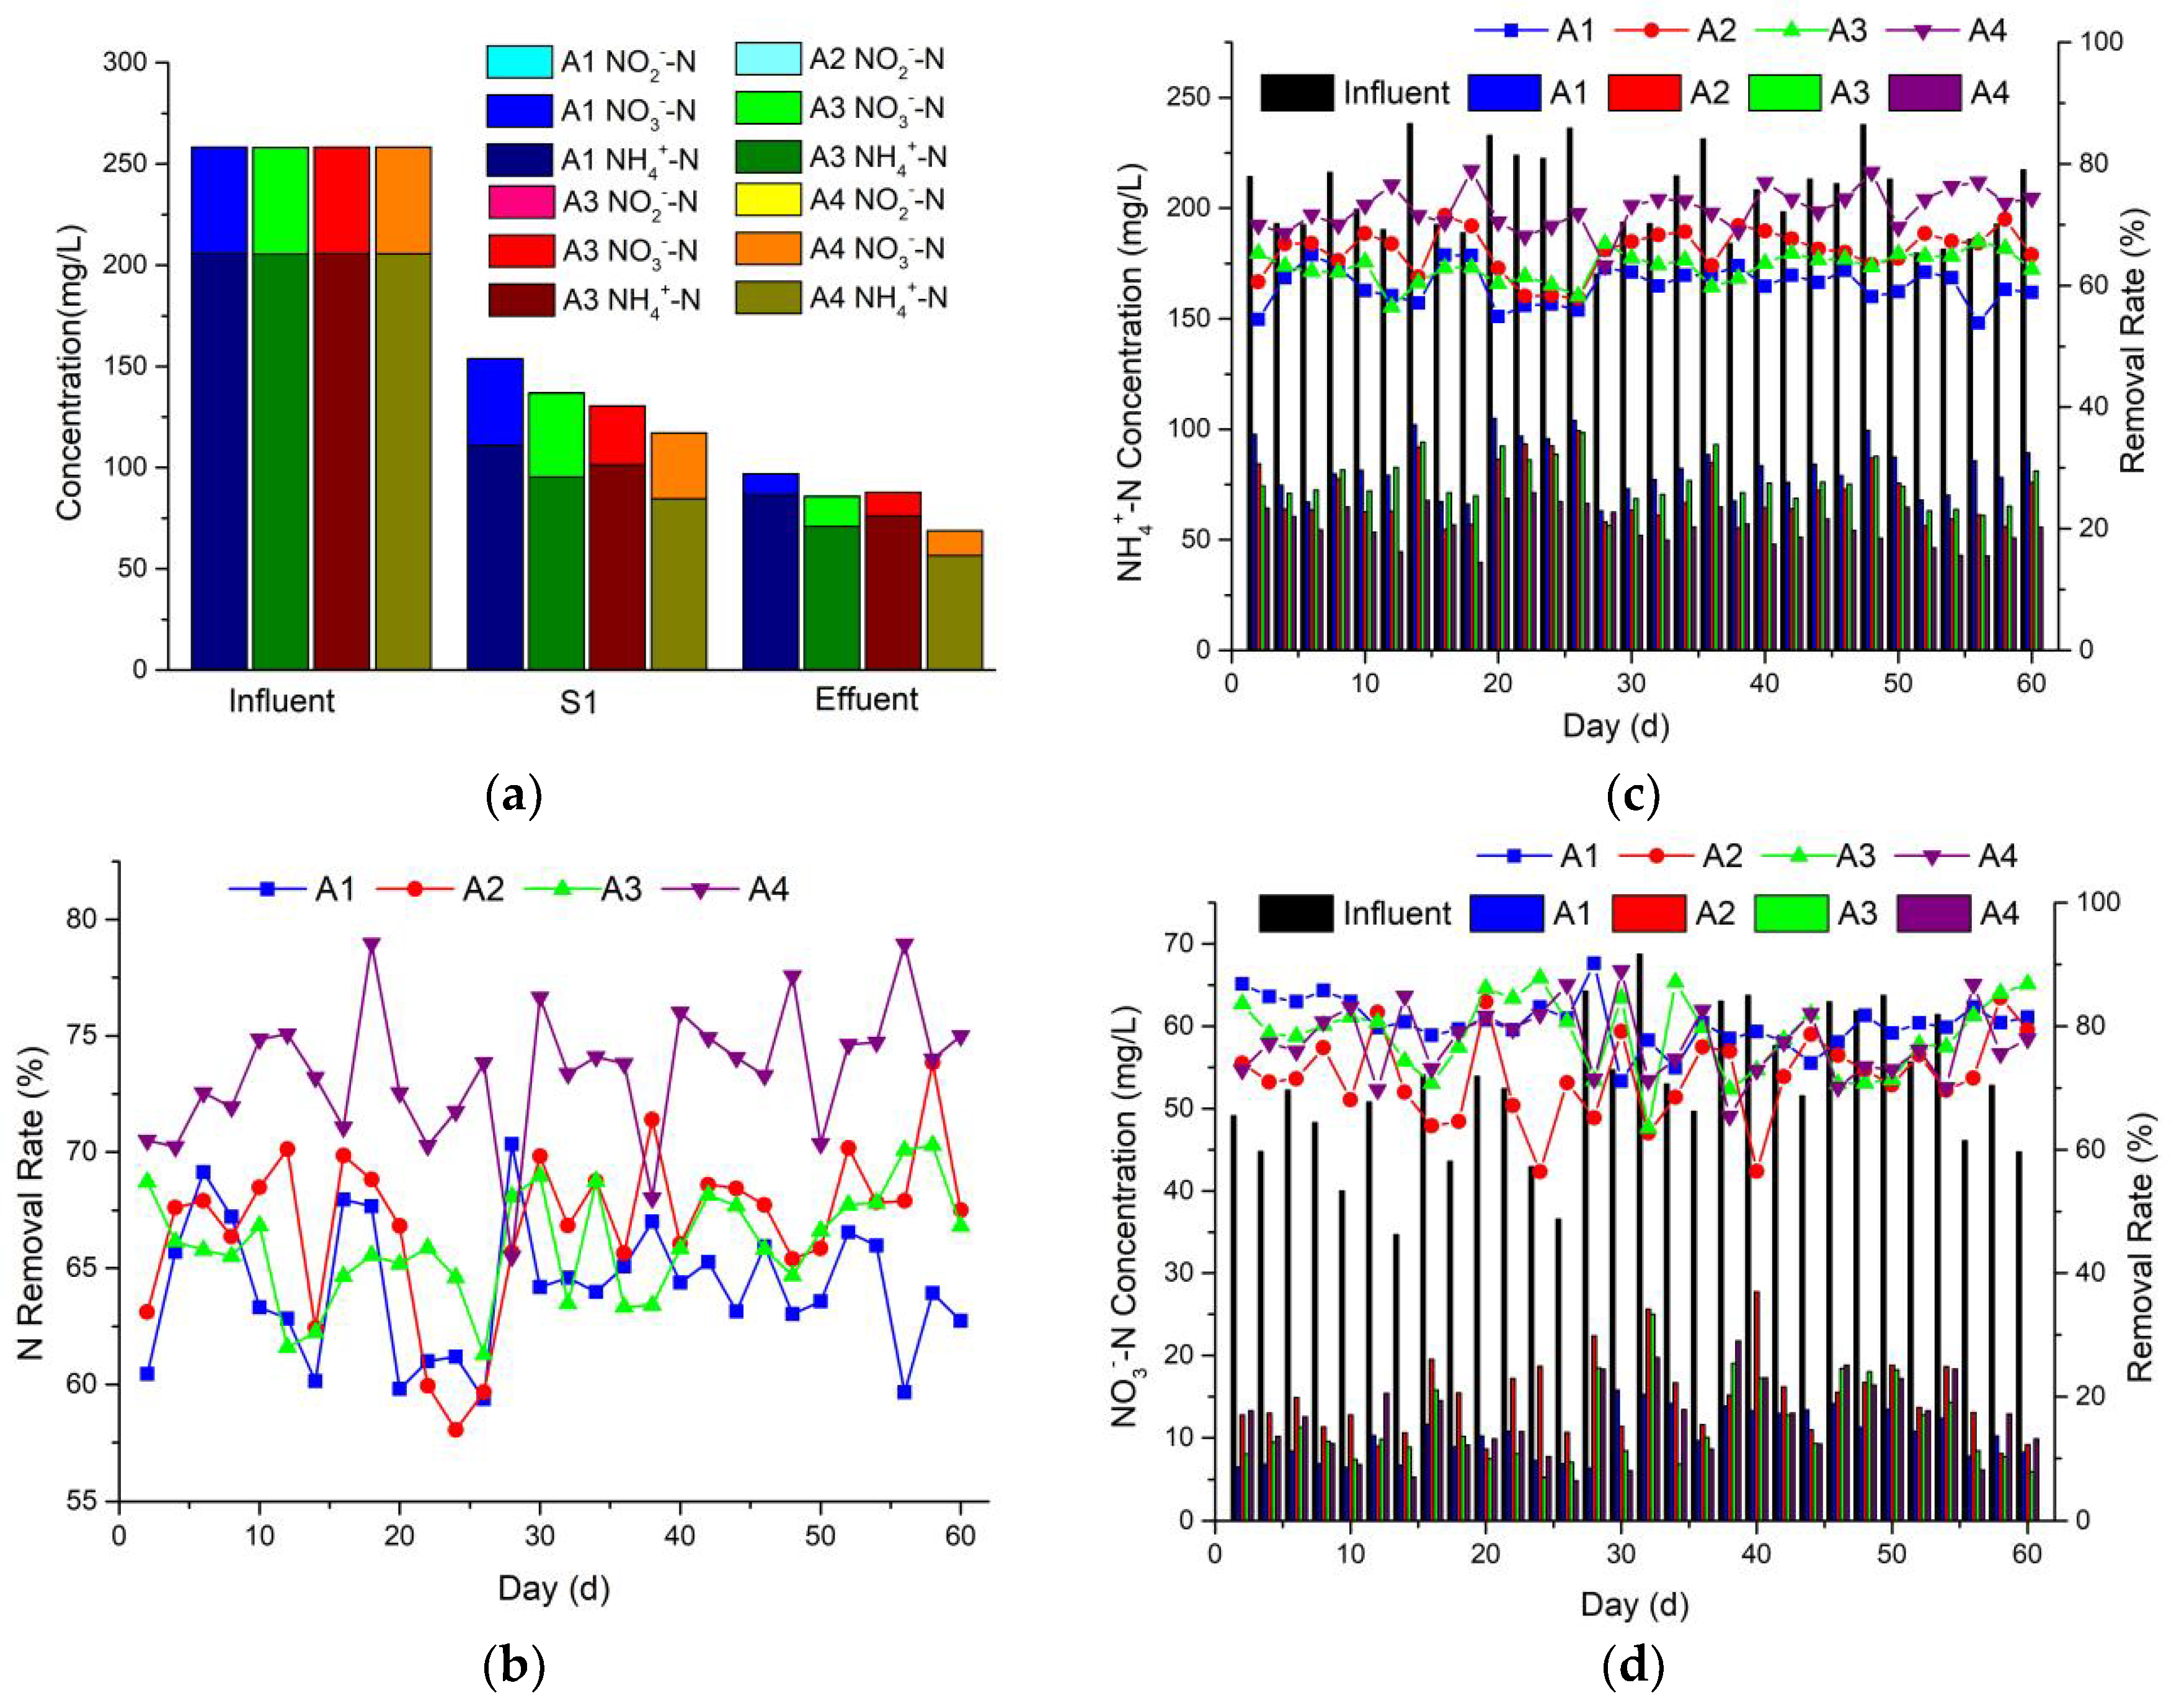
Most studies stated that two steps—nitrification and denitrification—had to be carried out for nitrogen elements to be completely removed from the wastewater. The biological removal of nitrogen was the main approach in CWs; thus, nitrogen removal was always a challenge. As shown in Figure 3a, the NH4+-N, NO3−-N and NO2−-N concentrations in the influent range from 170.23–238.13 mg/L, 34.63–68.64 mg/L and 0.004–0.011 mg/L, respectively. As shown in Figure 3c, the average concentrations of NH4+-N in the effluent of A1, A2, A3 and A4 were 82.33, 70.87, 76.11 and 56.33 mg/L, while the average removal rates were 59.94%, 65.52%, 62.97% and 72.59%, respectively. As shown in Figure 3d, the average concentrations of NO3−-N in the effluent of A1, A2, A3 and A4 were 10.36, 14.87, 11.64 and 12.34 mg/L, while the average removal rates were 80.32%, 71.75%, 77.88% and 76.55%, respectively. The average concentrations of NO2−-N in the effluent of A1, A2, A3 and A4 were 0.031, 0.043, 0.021 and 0.032 mg/L, respectively. In the experiment, nitrogen from different states was transformed through nitrification and denitrification. In this study, nitrogen from the above three states was added to evaluate the system’s overall N removal capacity. As shown in Figure 3b, the average N removal rates of A1, A2, A3 and A4 were 62.53%, 66.77%, 66.00% and 73.39%, respectively. Wu [29] added aeration in the centre part and effluent recirculation in the vertical upflow CW-MFC system; the NH4+-N removal rate was significantly improved (>92%), but the TN removal rate was limited to 24–40%. The additional equipment and energy input did not bring about a substantial improvement in removal rates and also brought difficulties to construction and maintenance. Therefore, in this study, improving the system performance by optimising the structure was best. The amounts of N removed per unit area were 11.89 ± 0.73, 12.38 ± 0.76, 12.24 ± 0.79 and 13.61 ± 1.07 g·(d·m2)−1. During the experiment, all four coupled systems showed a relatively stable removal effect of N. and different systems varied in their ability to remove N in different forms. Based on the down-up water flow design in the coupled system, the oxygen distribution in the system was varied, leading to rich and diverse microbial distribution states.
The concentrations of NH4+-N, NO3−-N and NO2−-N varied in the influent, S1 and effluent, implying that there was the whole process of the nitrification–denitrification reaction for the removal of N. Nitrification occurred in the water downflow area that was close to the surface under aerobic conditions; the oxygen was supplied by water carrying and plant root oxygenation. Denitrification then occurred within the anaerobic area entering into the anode area. The relative abundance of Acinetobacter was high in the anode, as evaluated by high-throughput 16S rRNA pyrosequencing technology. This process facilitated the complete removal of N in wastewater. Nitrification still occurred for the residual NH4+-N in wastewater at the effluent in the upflow area due to air reoxygenation and oxygen exudation of plant roots. Therefore, the NO3−-N and NO2−-N concentrations of A2 and A4 plants were higher than A1 and A3, and the accumulation of NO3−-N and NO2−-N appeared in A2 and A4. In A4, due to oxygen competition that occurred at the cathode area (the effluent), both the electrode reaction of the power generation and the nitrification process consumed oxygen [28]. The accumulation of NO3−-N and NO2−-N was more obvious in A2 than in A4. As shown in Figure 3c, the decrease of NH4+-N concentration is even more obvious from the anode to cathode in A2 and A4 than in A1 and A3. This area was mainly an anaerobicarea, with a partial oxygen pressure below 0.5% air saturation and a low C/N ratio that was maintained at around 4. In earlier studies, an anammox process coned with (MFC) was identified as a new net energy-positive (neutral) domestic wastewater treatment system that was proposed for the development of a low-carbon society, and its energy budget was discussed [30]. The relative abundances of Candidatus Hydrogenedens and Candidatus Kuenenia, with a function of anaerobic ammonia oxidation, were high in the anode area, as evaluated by high-throughput 16S rRNA pyrosequencing technology [31]. Meanwhile, the accumulation of NO3−-N and NO2−-N in the closed circuit groups (A3 and A4) was less than in the open circuit groups (A1 and A2). The anammox process was energy- and cost-efficient, but the growth of anammox bacteria was reported to be slow [32,33]. In A4, the NH4+-N concentration decreased the most, while NO3−-N and NO2−-N accumulated the least. It was deduced that NH4+-N acted as the electron donor and the anaerobic ammonium oxidation consumed NH4+-N and NO2−-N in the system. Vanloosdrecht et al. studied and corrected the measurement of anaerobic ammonia oxidation reaction as follows, and the CH1.72O0.31N0.2 is for the chemical formula of the anammox bacteria [34]:
Studies showed that COD concentration could affect the anaerobic ammonia oxidation process, while the COD exceeded 500 mg/L. In this study, the highest removal rate for COD in the downflow area was observed in A4, and the COD concentration was the lowest, i.e., 500 mg/L, for the wastewater in the anode area. In other systems, the COD concentrations were higher in A1, A2 and A3 than A4, and the inhibition of anaerobic ammonium oxidation was more significant. In A4, the removal of N was the best under both the whole nitrification–denitrification process and the anaerobic ammonium oxidation process [35,36]. As shown in Figure S1, we analysed the removal rate of N per unit area daily with A1 to assess the improvement of N in A2, A3 and A4 systems, and the amounts increased to 4.20%, 3.03% and 14.55%, respectively. Comparing the removal amount of N per unit area daily with A1 to assess the improvement of N in A2, A3 and A4 systems, it was found that the amounts increased to 1.33 g·(d·m2)−1, 1.19 g·(d·m2)−1 and 2.56 g·(d·m2)−1, respectively. It was also found that the sum of the increase in the amounts of A2 and A3 (i.e., 2.52 g·(d·m2)−1) was slightly lower than the increase in the amount of A4 (2.56 g·(d·m2)−1).
3.3. Phosphorus Removal
As indispensable elements in organisms, ATP, ADP, RNA and DNA, which are essential to the growth and reproduction of organisms, were inseparable from phosphorus (P). However, the large discharge of high P concentration into the environment may lead to water eutrophication, accelerate water ageing and shorten the life of lakes. Therefore, it was very critical to prevent P from transforming from nutrient to pollutant [37,38,39].
In traditional CWs, the synergy of a substrate, microorganisms and plants (if planted) was the main method of P removal. In addition, substrate P removal took up the main proportion. The substrate P removal was mainly through adsorption, settlement and interception as well as the synergy with microorganisms in the surface biofilm. The P removal process of microorganisms is mainly referred to the excessive accumulation and normal assimilation of P. Meanwhile, wetland plants could directly absorb and assimilate the inorganic P in the wastewater as nutrients during the growth and reproduction process in the treatment of P-containing wastewater.
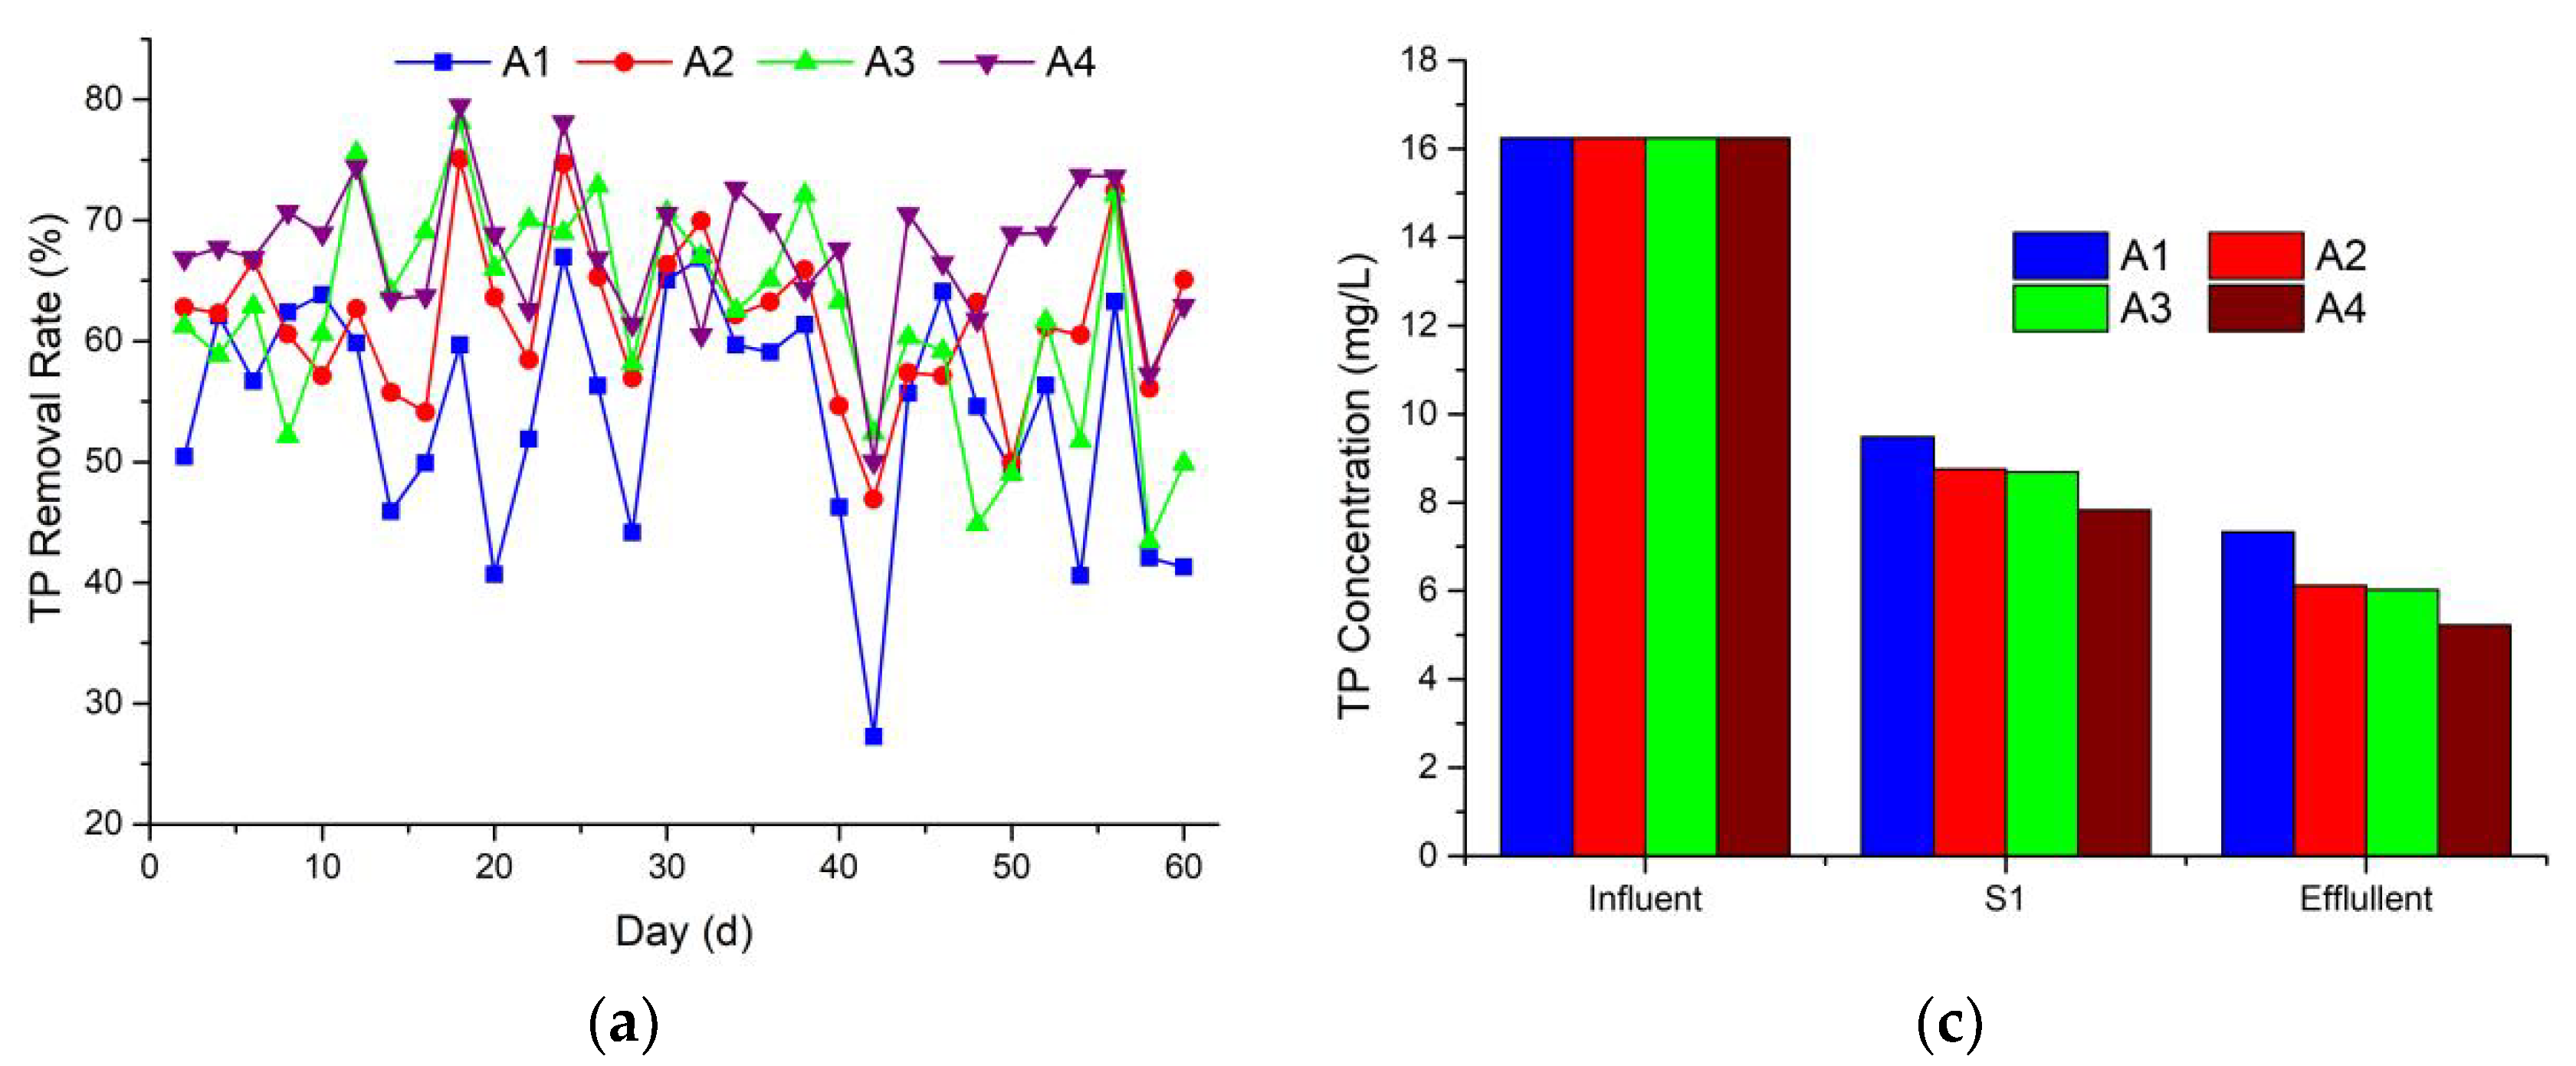
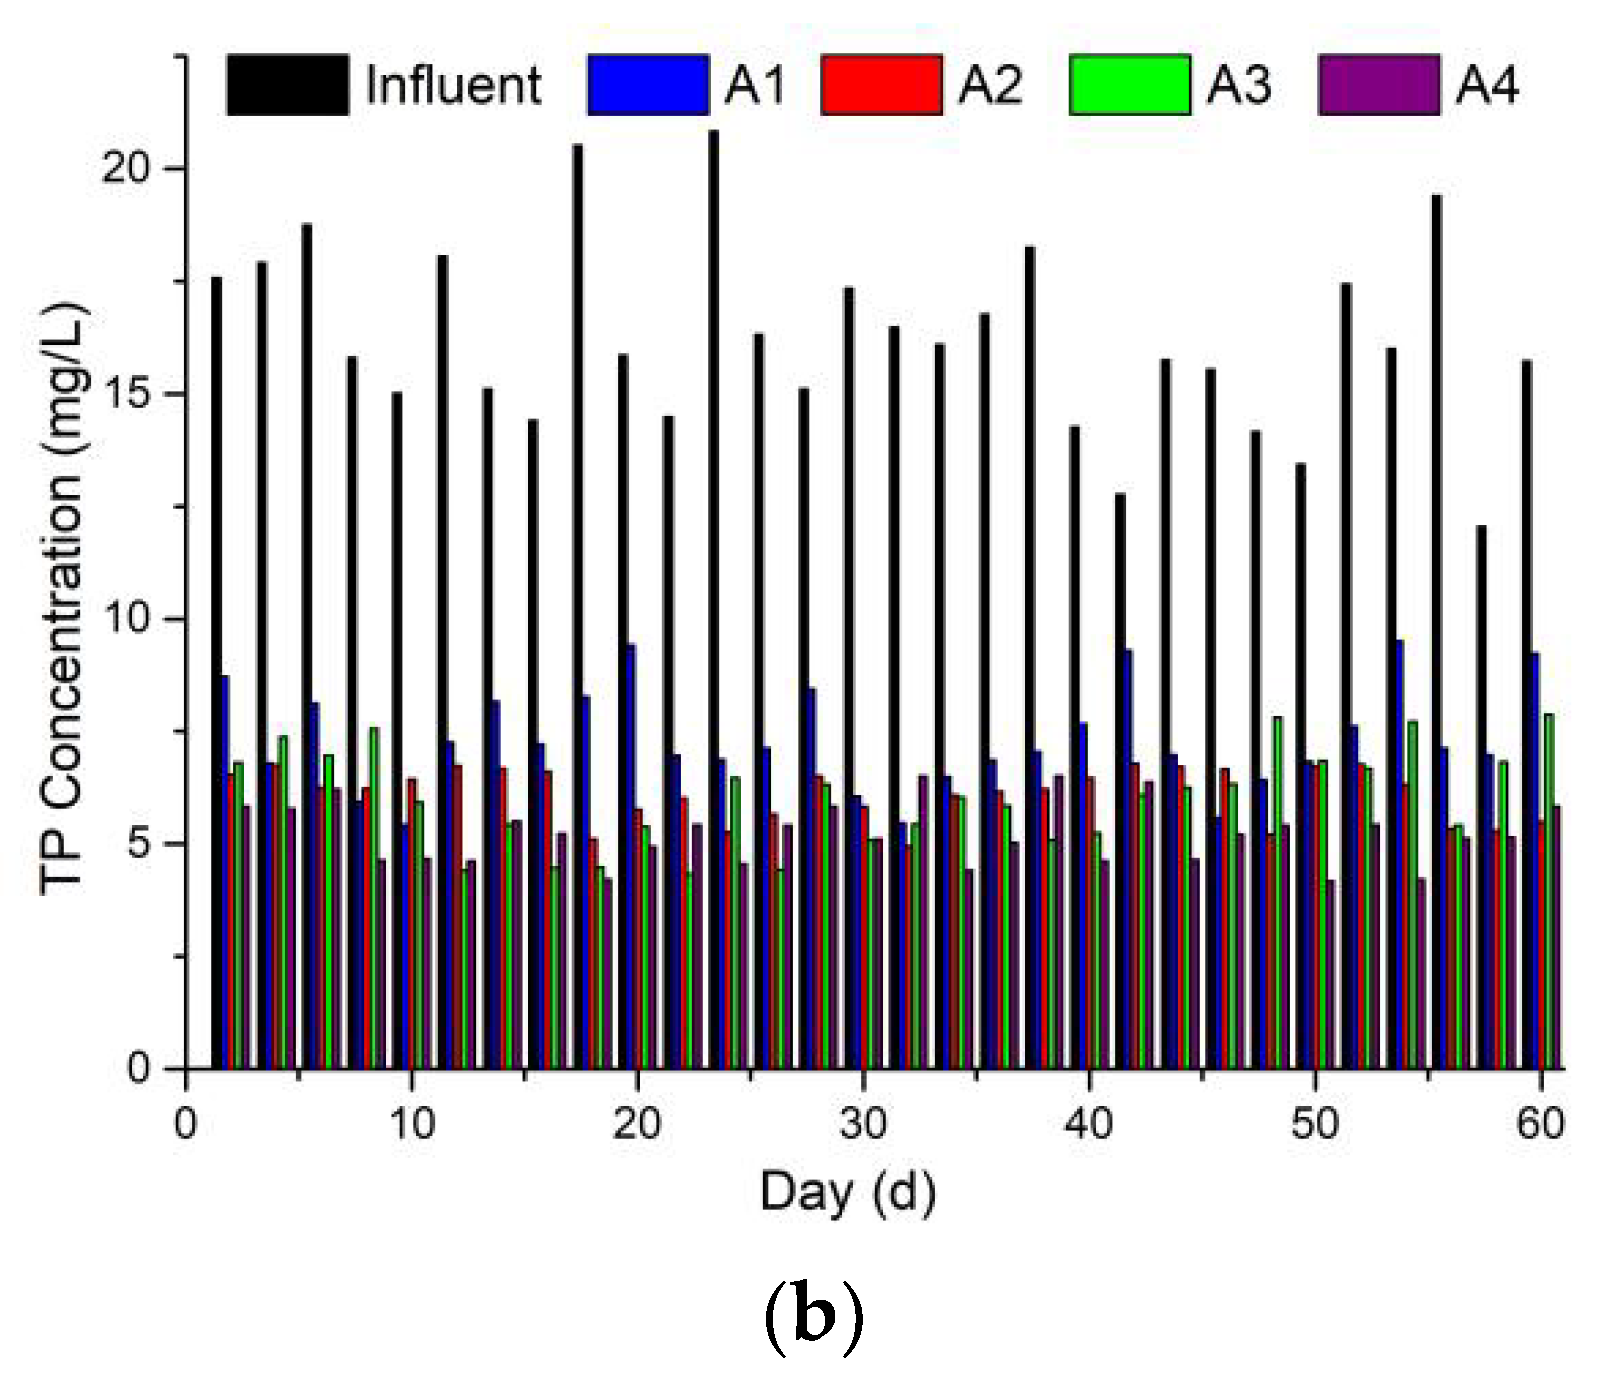
In the CW-MFC coupled system, the mechanism of P removal was the adsorption of the surface chemistry of the conductive materials. As shown in Figure 4a, the P removal rates of A1, A2, A3 and A4 were 55.48%, 62.32%, 62.87% and 67.86%, respectively. The removal rates of A2 and A3 were similar, which meant that planting plants or the closed circuit in the system can have similar effects regarding P removal, and both can result in better impacts. In A2, the roots were distributed into the substrate, forming an interception net. On the one hand, P was absorbed as nutrients. On the other hand, the roots provided an appropriate attachment site for microorganisms, promoting microbial growth and enhancing P resorption. In A3, the electrode was rich in microbes, and microbial growth and reproduction also improved the absorption and use of P. In A4, the synergistic effect of plants and electricity production in the CW, the plant absorption, the microbial absorption and adsorption and the electrode surface adsorption were optimised to enhance the removal of P. Figure 4c shows the comparison of P concentrations in the influent, the anode area (S1) and the effluent. Moreover, more P was removed in the wastewater downflow area. In A1, the amount of P removed in the downflow area was less than the other three systems. However, in the upflow area, the P removal amount in A1, A2, A3 and A4 was similar and less than the downflow area, respectively. The differences of the TP per unit area reductions of A1, A2, A3 and A4 were shown in the Figure S2. It could be inferred that P was mainly cut in the downflow area, and the absorption effect of the anode on P was significant. Zhao [40] had found that Dechloromonas and Tetrasphaera could remove phosphorus via the denitrifying phosphorus removal and fermentation phosphorus removal pathways, respectively. With the continuous and stable system operation, the electric generating voltage as well as the redox potential around the anode gradually rose steadily. Moreover, some metal hydroxides which were susceptible to the redox potential in the swine wastewater changed. For example, Fe2+ was oxidised to Fe3+ to precipitate, and the colloid formed by Fe3+ had better stability and specific surface area, thus making P in the wastewater tend to stabilise, constantly being intercepted and accumulated in the substrate. It could be inferred that the closed circuit in CWs might promote the migration of P from the wastewater to the substrate and microorganism. In other words, this system concentrated and retrieved P in the substrate as fertilisers in the reused way. Therefore, P can be used as a fertiliser in crop production but not the algal blooms [41].
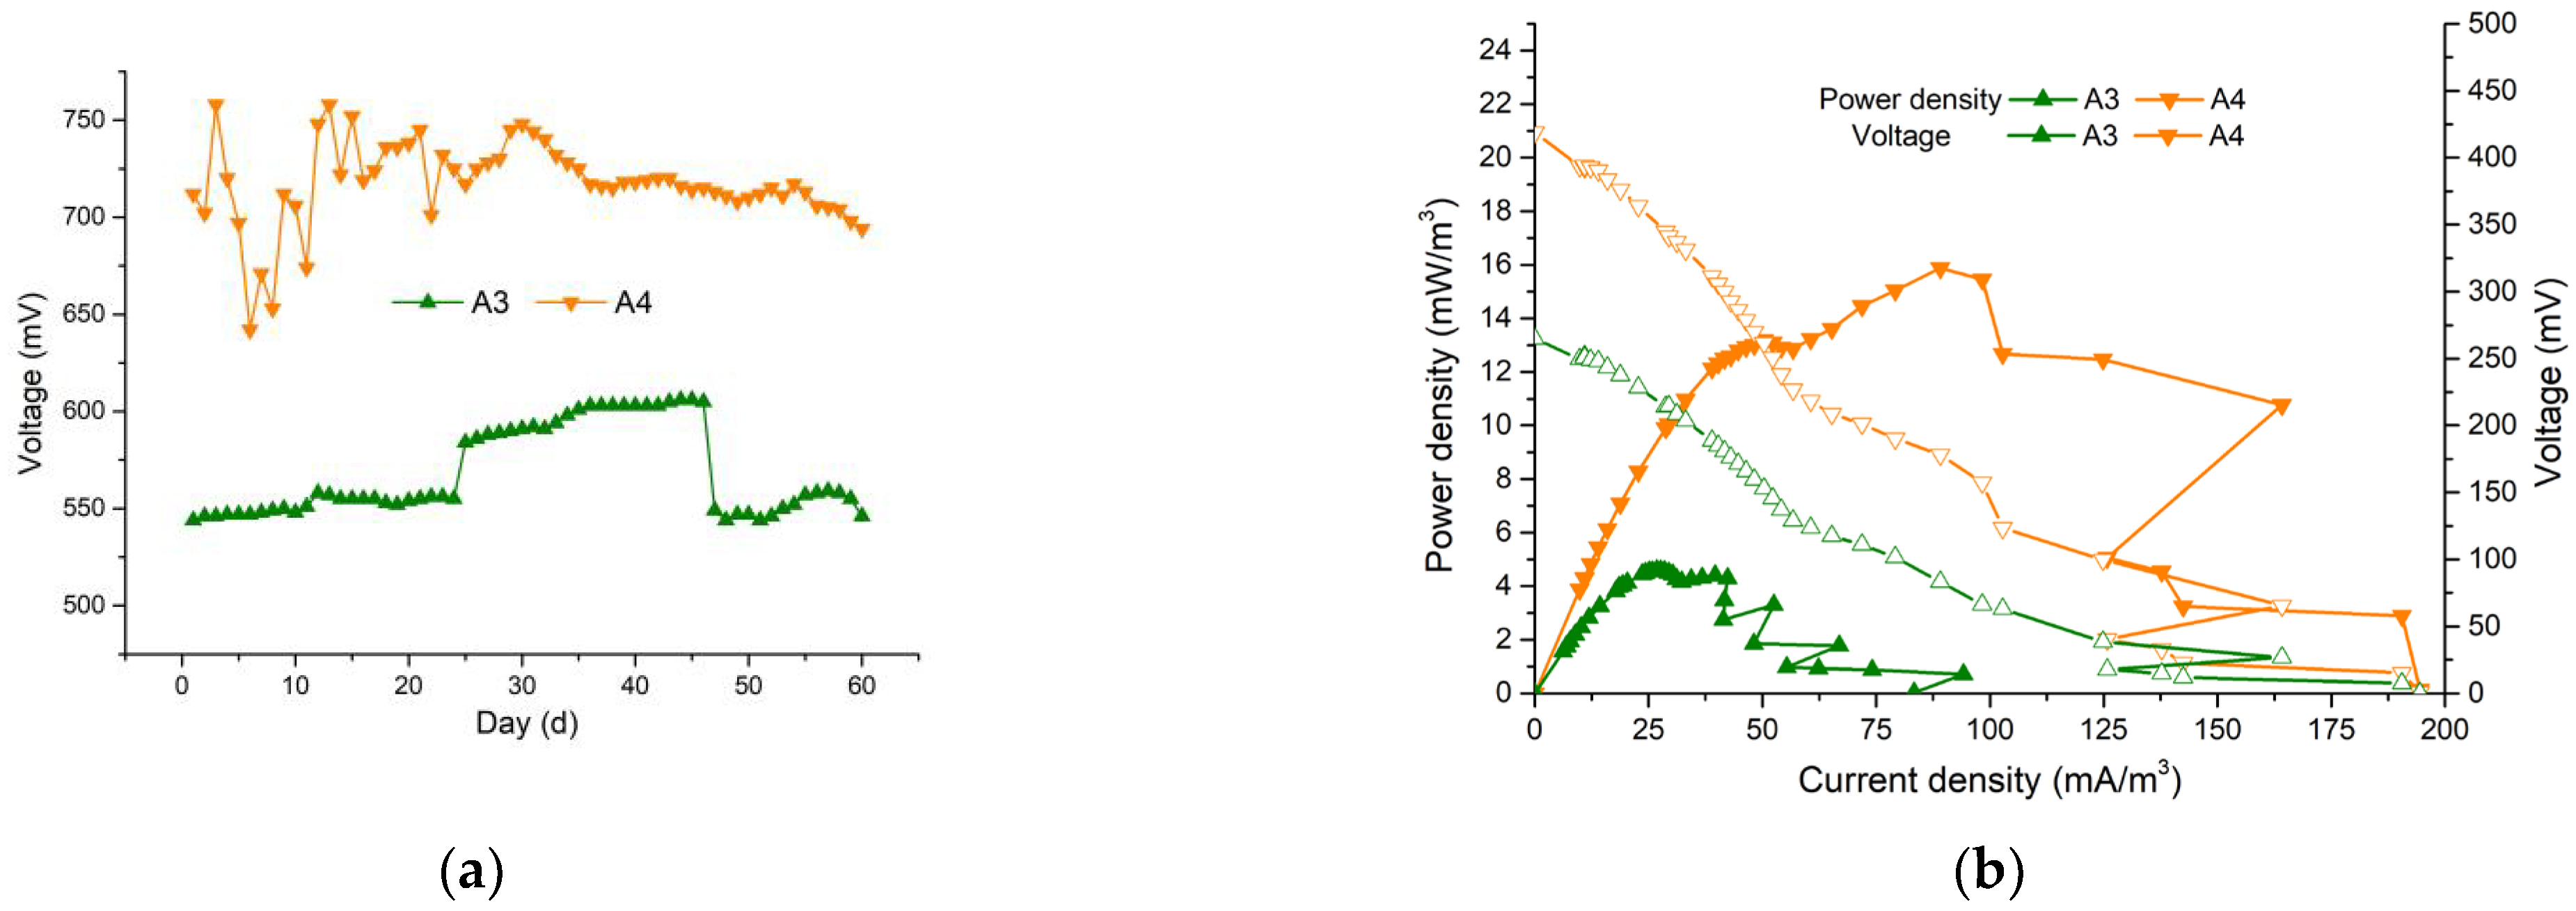
3.4. Electricity Generation
In 60 days of stable operation, voltage measurements were obtained with the closed circuit systems for comparative analysis of the systems’ electricity generation effects. The average voltages of A3 and A4 were 568.29 and 717.46 mV. The peak voltages were 606 and 758 mV, as shown in Figure 5a. When Zhang [41] conducted a similar experiment in paddy soil by denitrification coupled with anammox in a bioelectrochemical system, the maximum voltage for the stable cycle was 60 mV. Our coupled system offers significant advantages. The maximum coulombic efficiencies (CEs) of A3 and A4 were 0.159% and 0.170%. The maximum power densities of A3 and A4 were 4.59 mW/m3 and 15.87 mW/m3. Plant roots not only provided continuous oxygen and maintain the effective redox gradient and root secretion but also provided small molecules of organic matter, which were biodegradable and promote the growth and reproduction of microorganisms in the system. In the downflow area, the DO concentration descended from aerobic to anaerobic, and the removal of pollutants was also observed in this area [18]. The higher NH4+-N concentration of swine wastewater led to low C/N, and the root oxygen secretion promoted the nitrification performance. DO concentration was the key factor regarding the oxygen-autotrophic nitrification bacteria. In this study, the rhizosphere was beneficial for the nitrification process. In the down-flow area, oxygen would be exhausted, generating favourable surroundings in the anaerobic area for anaerobia, such as EAB, denitrifying bacterium and anaerobic ammonia oxidation. In this system, the anode acted as an artificial electron acceptor while the electrons are transferred efficiently during the anaerobic ammonia oxidation process. The anode as the conductor material accepted electrons to enhance the rate and efficiency of the anaerobic ammonia oxidation reaction and formed currents. The anaerobic ammonia oxidation process consumed the carbon source, as shown in Formula (5). NO3−-N and NO2−-N accumulated at the anode. The system can provide excellent nitrification conditions in the down-flow area, guarantee the nitrification of NH4+-N and also provide a sufficient nitrogen source for the anaerobic ammonia oxidation reaction in the anaerobic area. While the electrode in the anaerobic area played as a temporary electron acceptor in the process of anaerobic ammonia oxidation. On the anode electrode the electrons transferred to the cathode through the wire rapidly, so there was no accumulation of electrons. As a result of the limited anaerobic area, the processes of pollutants’ oxidation release electrons, and then electrodes collect the electrons and form an electron flow that is highly interrelated and mutually reinforcing. The macro-performance of the experiments was shown through the enhancement of pollutant removal and current production. The same performance was presented in the aerobic region (cathode). The cathode acted as an externally supplied electron donor. The electron supply and the consumption of electrons upon NO2−-N and NO3−-N reduction both promote each other. The open circuit system lacked the electron transfer mechanism, and the macro-performance was shown through the limited effect of P removal. Nevertheless, electron receptors in anaerobic areas were limited; hence, the oxidative degradation of contaminants was also limited.
In this study, the maximum CEs of A3 and A4 were 0.1585% and 0.1704%, which were much lower than the single MFC system because the electrons produced in the CW-MFC system were not only used to generate voltage into the closed circuit but were also used elsewhere, such as for the degradation of pollutants. The electrons passed through other microconnections to avoid external circuits, or anaerobic bacteria, the competition at the anode [9]. Due to the large numbers of structural differences of CW-MFC studied by different scholars, and since the polarisation curve can avoid the volume effect and characterise the electrical production performance of the system, the maximum power densities of A3 and A4 were found to be 4.59 mW/m3 and 15.87 mW/m3, respectively. Moreover, the A4 showed obvious advantages, and the promotion of plant planting on the CW-MFC system was once again verified.
3.5. Biodiversity of Microbial Communities
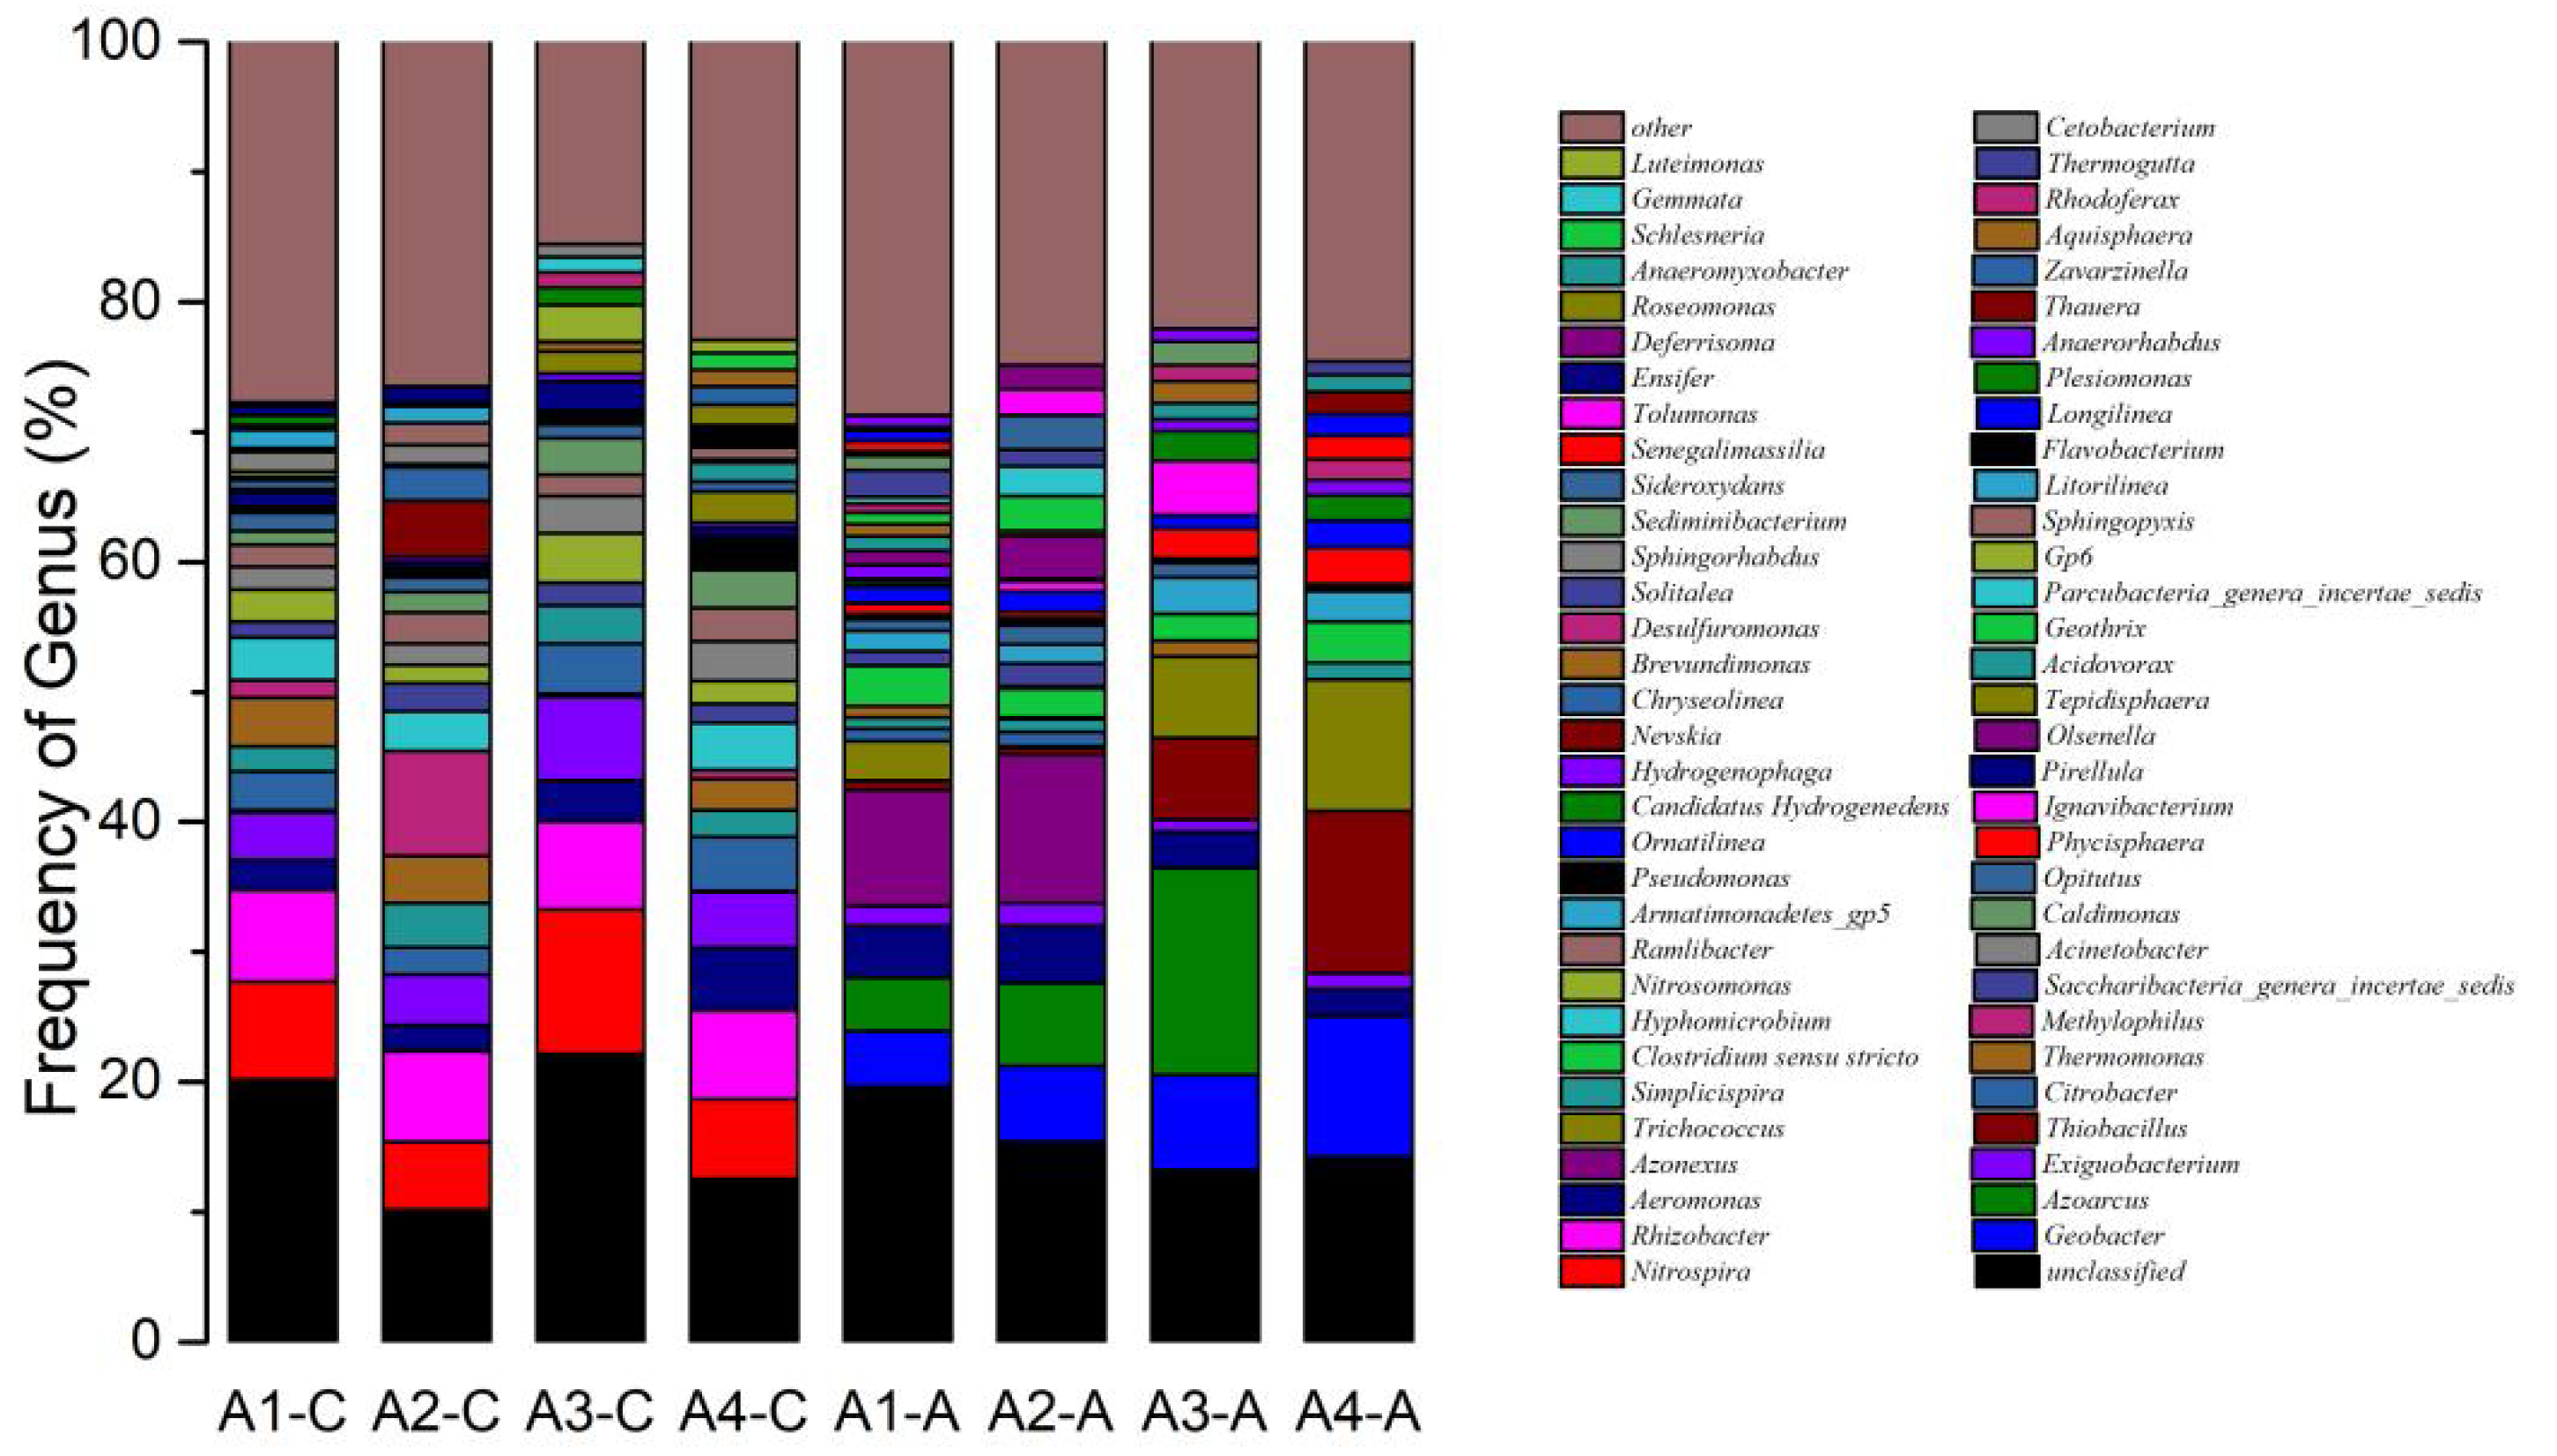
Both in traditional CWs and MFCs, microorganisms acted as the important role, undertaking to degrade most of the pollutants or catalyse electricity production. Similarly, in the CW-MFC coupled system, the importance of microorganisms was more prominent in degrading pollutants and product electricity. Both competition and cooperation were observed between species in the system. It is known that EAB were the key factors for electricity generation, while the growth of EAB was stimulated by the closed circuit. Under the cooperation of the closed circuit and EAB, the flora was domesticated, and the electricity was collected. After 60 days of operation, the flora samples were taken from S1 and the effluent (the cathode) from the four systems, and they were evaluated by 16S rRNA pyrosequencing technology. Clear differences were found in the microbial diversity for the difference in anaerobic and aerobic areas. The Shannon index values in S1 (the anode area) of A1, A2, A3 and A4 were H1 = 3.72, H2 = 4.12, H3 = 4.65 and H4 = 5.44, respectively. The Shannon index values in the efluent (the cathode area) of A1, A2, A3 and A4 were H1′ = 3.81, H2′ = 4.73, H3′ = 4.13 and H4′ = 5.02, respectively. In A1 and A2, i.e., the open circuit systems, the microbial diversities in the cathode area were better than the anaerobic region (H1′ > H1, H2′ > H2). In A2, the microbial diversities under the synergistic effect of plant roots were better than A1 (H2 > H1, H2′ > H1′). In addition, microbial diversity has a significant elevation in the cathode area with planting plants (significant elevation from H1′ to H2′). The same characteristics that planting plants influenced the microbial diversity also existed in A3 and A4 (H4′ > H3′, H4 > H3). The EAB in the closed circuit had a significant influence on the microbial diversity in the anode areas. In A3 and A4, the Shannon index value in the anode area was higher than in the cathode area (H3 > H3′, H4 > H4′). This phenomenon had also been found in previous studies [39,42]. Figure 6 illustrates the microbiological diversity based on phylum for the samples. According to the electrogenesis characteristics of the closed circuit, Geobacter (phylum) is currently a hotspot in the EAB catalysis, with an abundance of up to 10.89% in the anode of A4.
In Kumar’s [43] earlier studies, the nanowire of Geobacter was composed of a series of small molecular weight structural proteins, in which the more conserved n-terminal formed the α-helix region, and protein–protein interactions constituted the core area of hydrophobic pilus fibres. Under the influence of hydrophobic forces, it is conducive to its adhesion on the surface of the electrode material. Even when the bacteria were not attached to the electrode surface, one end of the biological nanowires was connected to the outer membrane, and the other end was connected to the anode surface or other cells, hence achieving the transfer of electrons from cell to electrode and from cell to cell. Biological nanowires could get rid of the limitation of bacterium directly attaching to the surface of the electrode and could also form a ‘nano-power grid’ between cells to realise the transfer of electrons in the system [44]. Geobacter is a highly efficient electric-producing bacteria in MFCs as a microbial catalyst that was critical both in promoting electron production and in electron transport. Therefore, the relative abundance of Geobacter in the anode microbial flora of MFCs had a great influence on the effect of electricity production [45]. Usually, the higher the relative abundance of Geobacter, the better the effect of electricity production. In addition, Aeromonas, with its electrical production characteristics, has a higher abundance of the closed circuit system in the cathode than the anode and a higher abundance of the open circuit system on the anode [46]. It was also found that the bacterial genera with higher abundance of electrical production characteristics include Pseudomonas and Desulfuromonas, with higher abundance in the closed circuit system (A3 and A4) than in open circuit system (A1 and A2). In terms of the contaminant removal function, the other bacterial genera with higher abundance in the samples include Nitrospira, Rhizobacter, Azoarcus, Exiguobacterium, Aareaxus and Thiobacillus, among others. Nitrospira was only present in the aerobic area to oxidise NO2−-N to NO3−-N. Based on the nitrification–denitrification and denitrogen pathway, which provided a N source for the denitrification group, A3 had the highest cathode Nitrospira abundance (11.08%) and the lowest NO2−-N concentration (0.021 mg/L), verifying the characteristics of Nitrospira consumption of NO2−-N. Results of analysis of N in swine wastewater showed that the concentration of NH4+-N decreased in different systems. The decrease of N in the closed circuit system was higher than the open circuit system. Combined with microbial analysis, the abundances of Candidatus Hydrogenedens with anaerobic oxidation function on the anodes in the closed circuit group (A3 and A4) amount to 2.32% and 1.95%, respectively, which was about ten times that of the open circuit system. In the anode area, the wastewater carried the unoxidised NH4+-N and the NO2−-N obtained by NH4+-N oxide in the early stage, significantly reducing the amount of nitrogen pollutants in the system after the anaerobic ammonia oxidation process in the anodes. The accumulation of NO2−-N in the open circuit system (A1 and A2) was more severe due to the lack of anaerobic ammonia-oxidising bacteria. There was also speculation about the reduction of N in the anode, in which the microorganisms that exist in the electrode used other ways or shortcuts to convert N into gas while also reducing the amount of mud produced by the system, avoiding the blockage caused by many microorganisms and directly improving the service life of the wetland system.
4. Conclusions
In this study, some advantages of the coupled system CW-MFC were reported. The COD, NH4+-N, NO3−-N and TP removal rates of A4 were better than others, which account to 83.07%, 72.59%, 76.55% and 67.86%, respectively. The coupled system performed well in pollutants removal, and the unique design promoted the removal of N by anaerobic ammonia oxidation. A4 had a better power production function than A3, with an average voltage of 717.46 mV, the max CE of 0.170%, and the max power density of 15.87 mW/m3. Meanwhile, EAB, such as Geobacter and Desulfuromonas, were detected in the anodic biofilm by 16S rRNA pyrosequencing technology. These findings confirm the important roles of plants and the closed circuit in microbes of the coupled system.
Supplementary Materials
The following supporting information can be downloaded at: https://www.mdpi.com/article/10.3390/w14233930/s1. Figure S1: The reductions of N per unit area of A1, A2, A3 and A4; Figure S2: The reductions of TP per unit area of A1, A2, A3 and A4.
Author Contributions
Designed the experiments and wrote the paper, F.L. and L.S.; conducted the experiments and wrote the paper, Y.Z., F.L., S.Y., X.G. and J.H.; Information Collection, L.S., F.L. and Y.L. All authors have read and agreed to the published version of the manuscript.
Funding
This study was supported by the Ph.D. Startup Fund Project of Jiangxi Science and Technology Normal University (No. 2020BSQD009); Humanities and Social Sciences Research Program of Jiangxi Science and Technology Normal University (No. 2020XJYB010); and the Academic and Technical Leader Plan of Jiangxi Provincial Main Disciplines (20204BCJL22040, 20194BCJ22013).
Acknowledgments
We thank the Experimental Center of School of Chemistry and Chemical Engineering experimental instruments providing the experimental instruments.
Conflicts of Interest
The authors declare no conflict of interest.
References
- Soares, R.B.; Memelli, M.S.; Roque, R.P.; Gonçalves, R.F. Comparative analysis of the energy consumption of different wastewater treatment plants. Int. J. Archit. Arts Appl. 2017, 3, 79. [Google Scholar]
- Heidrich, E.S.; Curtis, T.P.; Dolfing, J. Determination of the internal chemical energy of wastewater. Environ. Sci. Technol. 2011, 45, 827–832. [Google Scholar] [CrossRef] [PubMed]
- Yuan, H.; He, Z. Integrating membrane filtration into bioelectrochemical systems as next generation energy-efficient wastewater treatment technologies for water reclamation: A review. Bioresour. Technol. 2015, 195, 202–209. [Google Scholar] [CrossRef] [PubMed] [Green Version]
- Guo, J.; Yang, C.; Zeng, G. Treatment of swine wastewater using chemically modified zeolite and bioflocculant from activated sludge. Bioresour. Technol. 2013, 143, 289–297. [Google Scholar] [CrossRef] [PubMed]
- Chen, X.; Hu, Z.; Zhang, Y.; Zhuang, L.; Zhang, J.; Li, J.; Hu, H. Removal Processes of Carbamazepine in Constructed Wetlands Treating Secondary Effluent: A Review. Water 2018, 10, 1351. [Google Scholar] [CrossRef]
- Santoro, C.; Walter, X.A.; Soavi, F.; Greenman, J.; Ieropoulos, I. Self-stratified and self-powered micro-supercapacitor integrated into a microbial fuel cell operating in human urine. Electrochim. Acta. 2019, 307, 241–252. [Google Scholar] [CrossRef] [PubMed]
- Goto, Y.; Yoshida, N. Scaling up Microbial Fuel Cells for Treating Swine Wastewater. Water 2019, 11, 1803. [Google Scholar] [CrossRef] [Green Version]
- Yadav, R.K.; Chiranjeevi, P.; Patil, S.A. Integrated drip hydroponics-microbial fuel cell system for wastewater treatment and resource recovery. Bioresour. Technol. Rep. 2020, 9, 100392. [Google Scholar] [CrossRef]
- Corbella, C.; Garfi, M.; Puigagut, J. Vertical redox profiles in treatment wetlands as function of hydraulic regime and macrophytes presence: Surveying the optimal scenario for microbial fuel cell implementation. Sci. Total Environ. 2014, 470, 754–758. [Google Scholar] [CrossRef] [PubMed]
- Rabaey, K.; Verstraete, W. Microbial fuel cells: Novel biotechnology for energy generation. Trends Biotechnol. 2005, 23, 291–298. [Google Scholar] [CrossRef]
- Schroder, U. Anodic electron transfer mechanisms in microbial fuel cells and their energy efficiency. Phys. Chem. Chem. Phys. 2007, 9, 2619–2629. [Google Scholar] [CrossRef]
- Srivastava, P.; Abbassi, R.; Yadav, A.K.; Garaniya, V.; Asadnia, M. A review on the contribution of electron flow in electroactive wetlands: Electricity generation and enhanced wastewater treatment. Chemosphere. 2020, 254, 126926. [Google Scholar] [CrossRef] [PubMed]
- Saeed, T.; Miah, M.J. Organic matter and nutrient removal in tidal flow-based microbial fuel cell constructed wetlands: Media and flood-dry period ratio. Chem. Eng. J. 2021, 411, 128507. [Google Scholar] [CrossRef]
- Liu, F.; Sun, L.; Wan, J.; Tang, A.; Deng, M.; Wu, R. Organic matter and ammonia removal by a novel integrated process of constructed wetland and microbial fuel cells. RSC Adv. 2019, 9, 5384–5393. [Google Scholar] [CrossRef] [Green Version]
- Doherty, L.; Zhao, Y.; Zhao, X.; Wang, W. Nutrient and organics removal from swine slurry with simultaneous electricity generation in an alum sludge-based constructed wetland incorporating microbial fuel cell technology. Chem. Eng. J. 2015, 266, 74–81. [Google Scholar] [CrossRef]
- Camacho, J.V.; Romero, L.R.; Marchante, C.M.F. The salinity effects on the performance of a constructed wetland microbial fuel cell. Ecolog. Eng. 2017, 107, 1–7. [Google Scholar] [CrossRef]
- Araneda, I.; Tapia, N.F.; Allende, K.L.; Vargas, I.T. Constructed Wetland-Microbial Fuel Cells for Sustainable Greywater Treatment. Water 2018, 10, 940. [Google Scholar] [CrossRef] [Green Version]
- Liu, F.; Sun, L.; Wan, J.; Shen, L.; Yu, Y.; Hu, L.; Zhou, Y. Performance of Different Macrophytes in the Decontamination of and Electricity. J. Environ. Sci. 2020, 89, 252–263. [Google Scholar] [CrossRef]
- Patel, D.; Bapodra, S.L.; Madamwar, D.; Desai, C. Electroactive bacterial community augmentation enhances the performance of a pilot scale constructed wetland microbial fuel cell for treatment of textile dye wastewater. Bioresour. Technol. 2021, 332, 125088. [Google Scholar] [CrossRef]
- Wang, J.; Song, X.; Wang, Y.; Bai, J.; Li, M.; Dong, G.; Lin, F.; Lv, Y.; Yan, D. Bioenergy generation and rhizodegradation as affected by microbial community distribution in a coupled constructed wetland microbial fuel cell system associated with three macrophytes. Sci. Total Environ. 2017, 607, 53–62. [Google Scholar] [CrossRef]
- Srivastava, P.; Yadav, A.K.; Garaniyai, K.; Lewis, T.; Abbassi, R.; Khan, S.J. Electrode dependent anaerobic ammonium oxidation in microbial fuel cell integrated hybrid constructed wetlands: A new process. Sci. Total Environ. 2020, 698, 134248. [Google Scholar] [CrossRef] [PubMed]
- Oon, Y.L.; Ong, S.A.; Ho, L.N.; Wong, Y.S.; Dahalan, F.A.; Oon, Y.S. Synergistic effect of up-flow constructed wetland and microbial fuel cell for simultaneous wastewater treatment and energy recovery. Bioresour. Technol. 2016, 203, 190–197. [Google Scholar] [CrossRef] [PubMed]
- Yulistyorini, A.; Puspasari, A.K.; Mujiyono; Sari, A. Removal of BOD and TSS of Student Dormitory Greywater using Vertical Sub-Surface Flow Constructed Wetland of Ipomoea Aquatica. Mater. Sci. Eng. 2019, 515, 012056. [Google Scholar] [CrossRef]
- Ibekwe, A.M.; Lyon, S.R.; Leddy, M.; Jacobson-Meyers, M. Impact of plant density and microbial composition on water quality from a free water surface constructed wetland. J. Appl. Microbiol. 2007, 102, 921–936. [Google Scholar] [CrossRef] [PubMed]
- Gupta, S.; Srivastava, P.; Patil, S.A.; Yadav, A.K. A comprehensive review on emerging constructed wetland coupled microbial fuel cell technology: Potential applications and challenges. Bioresour. Technol. 2021, 320, 124376. [Google Scholar] [CrossRef] [PubMed]
- Yang, Y.; Zhao, Y.; Tang, C.; Xu, L.; Morgan, D.; Liu, R. Role of macrophyte species in constructed wetland-microbial fuel cell for simultaneous wastewater treatment and bioenergy generation. Chem. Eng. 2020, 392, 123708. [Google Scholar] [CrossRef]
- Zhou, Y.; Xu, D.; Xiao, E.; Xu, D.; Xu, P.; Zhang, X.; Zhou, Q.; He, F.; Wu, Z. Relationship between electrogenic performance and physiological change of four wetland plants in constructed wetland-microbial fuel cells during non-growing seasons. Int. J. Environ. Sci. 2018, 70, 54–62. [Google Scholar] [CrossRef]
- Domenico, E.G.D.; Petroni, G.; Mancini, D.; Geri, A.; Palma, L.D.; Ascenzioni1, F. Development of Electroactive and Anaerobic Ammonium-Oxidizing (Anammox) Biofilms from Digestate in Microbial Fuel Cells. BioMed Res. Intern. 2015, 2015, 351014. [Google Scholar] [CrossRef] [Green Version]
- Wu, S.; Lv, T.; Lu, Q.; Ajmal, Z.; Dong, R. Treatment of anaerobic digestate supernatant in microbial fuel cell coupled constructed wetlands: Evaluation of nitrogen removal, electricity generation, and bacterial community response. Sci. Total Environ. 2017, 580, 339–346. [Google Scholar] [CrossRef]
- Muhammad, A.; Satoshi, O. Anammox-based technologies for nitrogen removal: Advances in process start-up and remaining issues. Chemosphere 2015, 141, 144–153. [Google Scholar]
- Lotti, T.; Kleerebezem, R.; Lubello, C.; Loosdrecht, M.C.M. Physiological and kinetic characterization of a suspended cell anammox culture. Water Res. 2014, 60, 1–14. [Google Scholar] [CrossRef] [PubMed]
- Lotti, T.; Kleerebezern, R.; Abelleira-Pereira, J.M.; Abbas, B.; van Loosdrecht, M.C.M. Faster through training: The anammox case. Water Res. 2009, 81, 261–268. [Google Scholar] [CrossRef] [PubMed]
- Ni, B.-J.; Ruscalleda, M.; Smets, B.F. Evaluation on the microbial interactions of anaerobic ammonium oxidizers and heterotrophs in Anammox biofilm. Water Res. 2012, 46, 4645–4652. [Google Scholar] [CrossRef] [PubMed]
- Guo, M.L.; Jiang, Y.; Xie, J.X.; Cao, J.; Zhang, Q.; Mabruk, A.; Chen, C. Bamboo charcoal addition enhanced the nitrogen removal of anammox granular sludge with COD: Performance, physicochemical characteristics and microbial community. J. of Environ. Sci. 2022, 115, 55–64. [Google Scholar] [CrossRef] [PubMed]
- Zhang, H.; Hou, D.; Zhang, S.; Cao, X.; Wang, H.; Li, X. Aerobic Denitrification Is Enhanced Using Biocathode of SMFC in Low-Organic Matter Wastewater. Water 2021, 13, 3512. [Google Scholar] [CrossRef]
- Wang, Q.; Lv, R.; Rene, E.R.; Qi, X.; Hao, Q.; Du, Y.; Zhao, C.; Xu, F.; Kong, Q. Characterization of microbial community and resistance gene (CzcA) shifts in upflow constructed wetlands-microbial fuel cell treating Zn (II) contaminated wastewater. Bioresour. Technol. 2020, 302, 122867. [Google Scholar] [CrossRef]
- Zhao, Y.; Collum, S.; Phelan, M.; Goodbody, T.; Doherty, L.; Hu, Y. Preliminary investigation of constructed wetland incorporating microbial fuel cell: Batch and continuous flow trials. Chem. Eng. J. 2013, 229, 364–370. [Google Scholar] [CrossRef] [Green Version]
- Zhao, C.; Shang, D.; Zou, Y.; Du, Y.; Wang, Q.; Xu, F.; Ren, L.; Kong, Q. Changes in electricity production and microbial community evolution in constructed wetland-microbial fuel cell exposed to wastewater containing Pb(II). Sci. Total Environ. 2020, 732, 139127. [Google Scholar] [CrossRef]
- Xu, F.; Cao, F.; Kong, Q.; Zhou, L.; Yuan, Q.; Zhu, Y.; Wang, Q.; Du, Y.; Wang, Z. Electricity production and evolution of microbial community in the constructed wetland-microbial fuel cell. Chem. Eng. J. 2018, 339, 479–486. [Google Scholar] [CrossRef]
- Zhao, W.; Bi, X.; Peng, Y.; Bai, M. Research advances of the phosphorus-accumulating organisms of Candidatus Accumulibacter, Dechloromonas and Tetrasphaera: Metabolic mechanisms, applications and influencing factors. Chemosphere 2022, 307, 135675. [Google Scholar] [CrossRef]
- Zhang, L.; Jiang, M.; Zhou, S. Conversion of nitrogen and carbon in enriched paddy soil by denitrification coupled with anammox in a bioelectrochemical system. J. Environ. Sci. 2022, 111, 197–207. [Google Scholar] [CrossRef] [PubMed]
- Wang, J.; Song, X.; Wang, Y.; Abayneh, B.; Ding, Y.; Yan, D.; Bai, J. Microbial community structure of different electrode materials in constructed wetland incorporating microbial fuel cell. Bioresour. Technol. 2016, 221, 697–702. [Google Scholar] [CrossRef] [PubMed]
- Kumar, R.; Singh, L.; Zularisam, A.W. Exoelectrogens Recent advances in molecule drivers involved in extracellular electron transfer and strategies used to improve it for microbial fuel cell applications. Renew. Sustain. Energy Rev. 2016, 56, 1322–1336. [Google Scholar] [CrossRef] [Green Version]
- Gemma, R.; Mccarthy, K.D.; Teena, M.; Nicoll, J.S.; Tuominen, M.T.; Lovley, D.R. Extracellular electron transfer via microbial nanowires. Nature 2005, 435, 1098–1101. [Google Scholar]
- Sudirjo, E.; Buisman, C.J.N.; Strik, D.P.B.T.B. Activated Carbon Mixed with Marine Sediment is Suitable as Bioanode Material for Spartina anglica Sediment/Plant Microbial Fuel Cell: Plant Growth, Electricity Generation, and Spatial Microbial Community Diversity. Water 2019, 11, 1810. [Google Scholar] [CrossRef] [Green Version]
- Pham, C.A.; Jung, S.J.; Phung, N.T.; Lee, J.; Chang, I.S.; Kim, B.H.; Yi, H.; Chun, J. A novel electrochemically active and Fe(III) reducing bacterium Phylogenetically related to Aeromonas hydrophila isolated from a microbial fuel cell. FEMS Microbiol. Lett. 2003, 223, 129–134. [Google Scholar] [CrossRef]
Figure 1.
The structures and combinations of A1, A2, A3 and A4.

Figure 2.
(a) The influent and effluent COD concentrations of A1, A2, A3 and A4; (b) The COD remove rates of A1, A2, A3 and A4; (c) The COD concentrations of A1, A2, A3 and A4 along the water flow; (d) The reductions of COD per unit area of A1, A2, A3 and A4.
Figure 2.
(a) The influent and effluent COD concentrations of A1, A2, A3 and A4; (b) The COD remove rates of A1, A2, A3 and A4; (c) The COD concentrations of A1, A2, A3 and A4 along the water flow; (d) The reductions of COD per unit area of A1, A2, A3 and A4.

Figure 3.
(a) The amount concentrations of NH4+−N, NO3−-N and NO2−-N along the water flow; (b) The N remove rates of A1, A2, A3 and A4; (c) The NH4+-N concentrations and remove rates of A1, A2, A3 and A4; (d) The NO3−-N concentrations and remove rates of A1, A2, A3 and A4.
Figure 3.
(a) The amount concentrations of NH4+−N, NO3−-N and NO2−-N along the water flow; (b) The N remove rates of A1, A2, A3 and A4; (c) The NH4+-N concentrations and remove rates of A1, A2, A3 and A4; (d) The NO3−-N concentrations and remove rates of A1, A2, A3 and A4.

Figure 4.
(a) The TP remove rates of A1, A2, A3 and A4; (b) The concentrations of the influent and effluent of A1, A2, A3 and A4; (c) The TP concentrations along the water flow.
Figure 4.
(a) The TP remove rates of A1, A2, A3 and A4; (b) The concentrations of the influent and effluent of A1, A2, A3 and A4; (c) The TP concentrations along the water flow.


Figure 5.
(a) The Voltage of A3 and A4; (b) The power density and current density A3 and A4.

Figure 6.
The frequency of genus, A1-C, A2-C, A3-C and A4-C stand for the cathode of the systems, and A1-A, A2-A, A3-A and A4-A stand for the ANode of the systems.
Figure 6.
The frequency of genus, A1-C, A2-C, A3-C and A4-C stand for the cathode of the systems, and A1-A, A2-A, A3-A and A4-A stand for the ANode of the systems.


Table 1.
The Systems of Orthogonal Method.
| Systems | No Plants | Planting Ipomoea aquatica |
|---|---|---|
| The open circuit | A1 | A2 |
| The closed circuit | A3 | A4 |
Publisher’s Note: MDPI stays neutral with regard to jurisdictional claims in published maps and institutional affiliations. |
© 2022 by the authors. Licensee MDPI, Basel, Switzerland. This article is an open access article distributed under the terms and conditions of the Creative Commons Attribution (CC BY) license (https://creativecommons.org/licenses/by/4.0/).
Share and Cite
MDPI and ACS Style
Zhang, Y.; Liu, F.; Lin, Y.; Sun, L.; Guo, X.; Yang, S.; He, J. Enhanced Swine Wastewater Treatment by Constructed Wetland—Microbial Fuel Cell Systems. Water 2022, 14, 3930. https://doi.org/10.3390/w14233930
AMA Style
Zhang Y, Liu F, Lin Y, Sun L, Guo X, Yang S, He J. Enhanced Swine Wastewater Treatment by Constructed Wetland—Microbial Fuel Cell Systems. Water. 2022; 14(23):3930. https://doi.org/10.3390/w14233930
Chicago/Turabian StyleZhang, Yun, Feng Liu, Yidong Lin, Lei Sun, Xinru Guo, Shuai Yang, and Jinlong He. 2022. "Enhanced Swine Wastewater Treatment by Constructed Wetland—Microbial Fuel Cell Systems" Water 14, no. 23: 3930. https://doi.org/10.3390/w14233930
Note that from the first issue of 2016, this journal uses article numbers instead of page numbers. See further details here.