
Model and Experimental Studies of the Seepage Failure of Damaged Geotextile at the Joint between Tubes in a Geotextile Tube Dam


1
School of Naval Architecture & Ocean Engineering, Jiangsu Maritime Institute, Ge-Zhi Road 309#, Nanjing 211170, China
2
College of Oceanography, Hohai University, Xi-Kang Road 1#, Nanjing 210098, China
3
College of Water Conservancy and Hydropower Engineering, Hohai University, Xi-Kang Road 1#, Nanjing 210098, China
*
Author to whom correspondence should be addressed.
Water 2022, 14(23), 3934; https://doi.org/10.3390/w14233934
Submission received: 12 October 2022
/
Revised: 26 November 2022
/
Accepted: 30 November 2022
/
Published: 2 December 2022
(This article belongs to the Section Hydraulics and Hydrodynamics)
Abstract
:This paper focuses on the impact of geotextile tube damage at the joints between tubes on dam structures subjected to seepage. First, a seepage-induced failure critical gradient model for damaged geotextile tubes was developed. Tests were conducted using geotextile specimens with precut O-shaped holes to simulate the seepage erosion process. Various overburden loads (0, 5, 10, 20, and 30 kPa) and hole radii (0.5, 1.0, 1.5, and 2 cm) were examined. Based on the test phenomena and the changes in pore-water pressure and seepage flow, four progression stages (seepage stability, sand particle wash-out, preferential flow formation and development, and complete failure) were identified. The experimental critical gradients obtained under different conditions agreed well with the model results. The critical gradient is positively correlated with the overburden load and negatively correlated with the hole radius. Critical gradient growth gradually slows with increasing overburden load. The critical gradient difference caused by the hole size decreases rapidly. When the overburden load increases to 20 kPa, this difference is essentially unchanged. These findings can provide a better understanding of the performance of damaged geotextile tubes.
1. Introduction
Compared with traditional technology, geotextile tube dams offer several significant benefits, such as the use of local materials, ease of construction, convenient placement, high efficiency, low cost, labor savings, and low environmental impacts [1,2]. For this reason, geotextile tube dams have been widely used in hydraulic and coastal engineering fields, such as coastal protection, dike construction, beach reclamation, and freshwater reservoirs in estuaries [3,4].
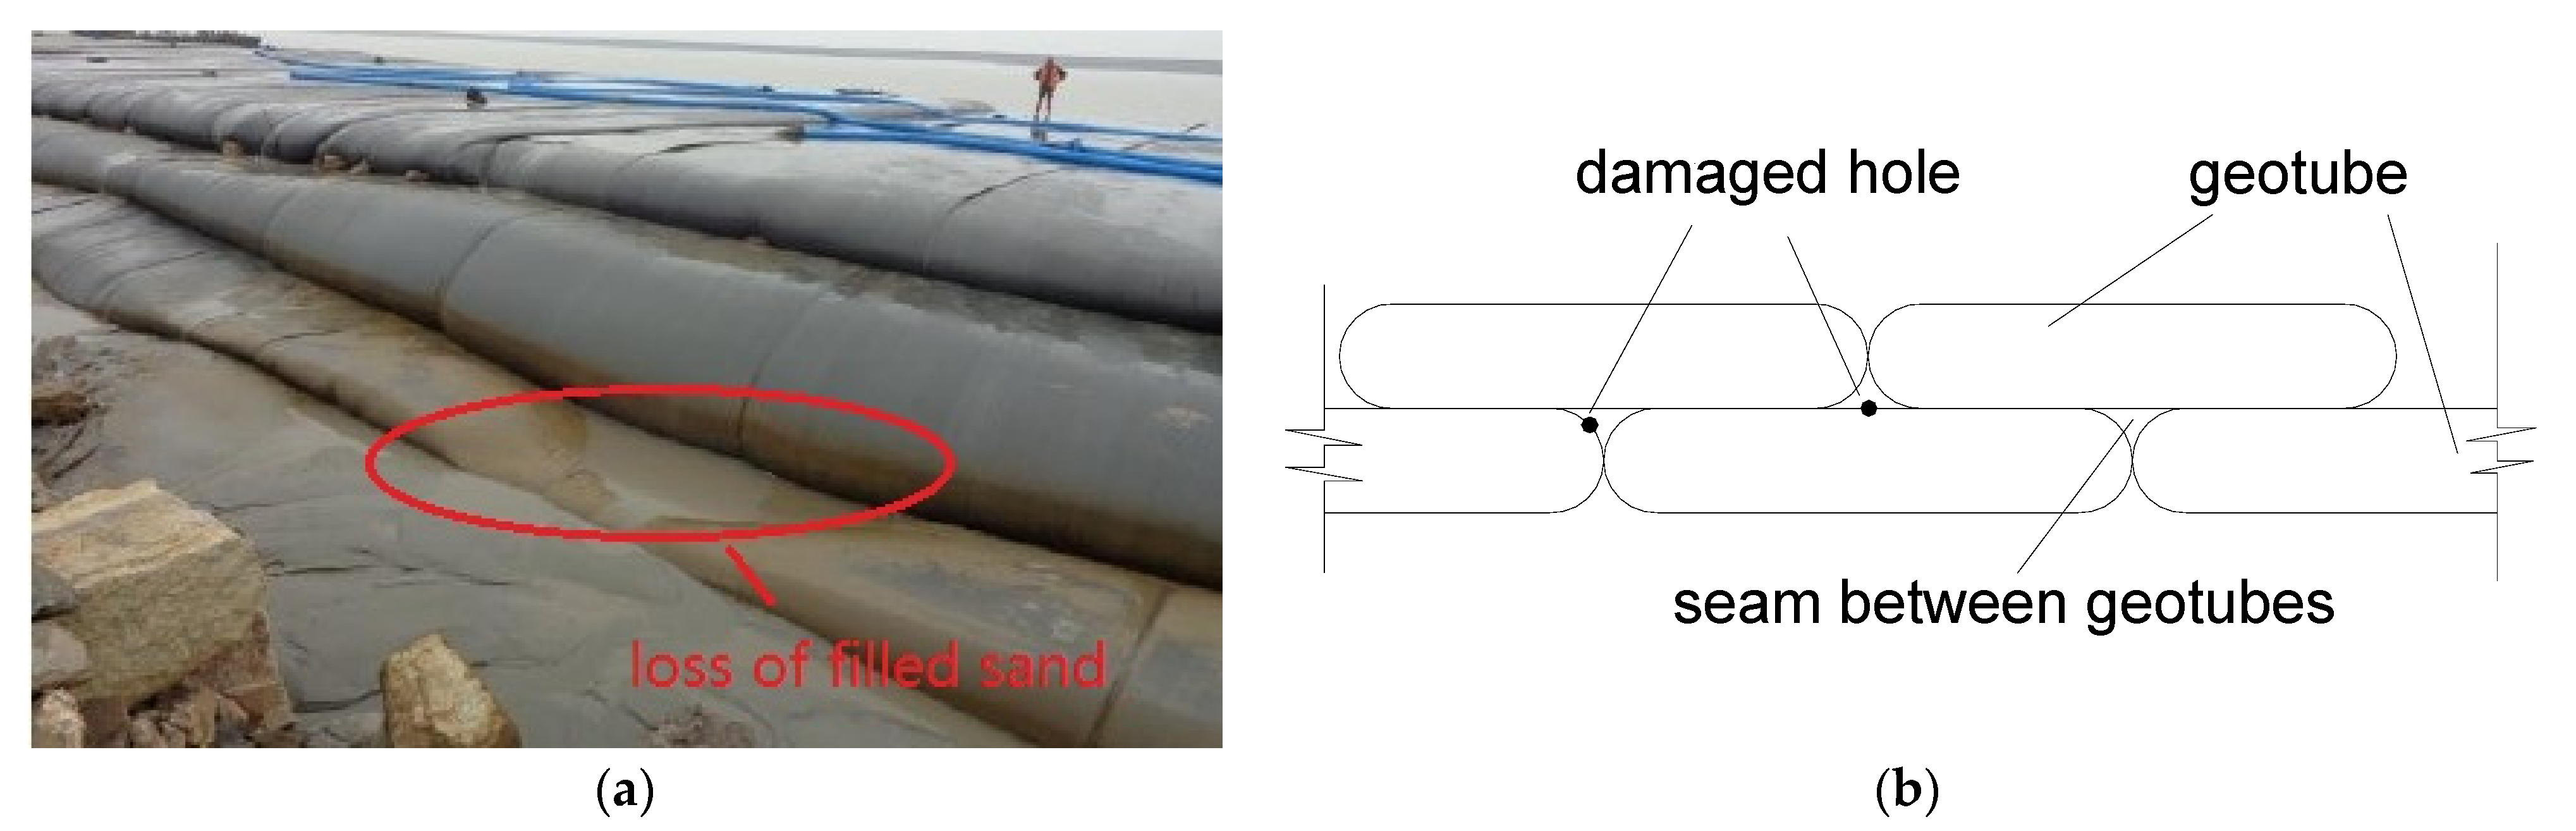
Geotextile tubes are typically filled with a mixture of fine silt and water in the form of slurry through hydraulic pumping. As the water passes through the geotextile, solids in the slurry being dewatered are retained, and the flat tubes can achieve stability and resist external loads [5]. In general, geotextile-sand filtration systems can meet the conditions of drainage and sand retention, and the internal sand can hardly penetrate the geotextile pores. However, during the filling process, geotextile tube damage occurs frequently due to the inevitable bursting, puncturing, and abrasion of sharp and large particles in the filling slurry and improper operation by construction personnel [6,7]. In addition, animal boreholes and particle-enriched flow (or turbid flow) during the construction and service phases may also exacerbate the geotextile damage [8]. Once the geotextile is damaged, the original structure of the sand particles in the damaged tubes is very likely to be destroyed by the seepage force caused by water level fluctuation in the reservoir or tidal action outside the reservoir. Furthermore, the potential failure increases for the damaged parts located at the joint of the adjacent geotextile tubes. This is because the internal sand near the hole at the joint is located on a free surface, and the sand produced by seepage failure can be further transported out of the dam through joint channels under the action of contact erosion (as shown in Figure 1). In China, the problem of holes at a joint may be more serious because poor-quality geotextiles were used in the past due to technology and cost limitations [9,10]. For example, in the 1990s, the Chenhang Reservoir in the Yangtze Estuary in Shanghai was built using a geotextile tube dam. After decades of use, great subsidence occurred at a corner of the dam. After analysis and demonstration, most experts held the view that the settlement was caused by massive sand particle loss in the dam core or tubes under the action of seepage.
In recent years, the effect of damage on geotextiles has been a focal point for researchers. Huang et al. [11,12] introduced a circular flow chamber that can be used to investigate the abrasion damage of a woven geotextile subjected to turbid flow. Pinho-Lopes et al. [13] assessed the influence of field installation damage on the long-term tensile behavior of two geosynthetics and derived relevant design parameters. Rosete et al. [14] evaluated the tensile and hydraulic properties of six geosynthetics after mechanical damage and abrasion laboratory tests. Similarly, Cheah et al. [15] measured the residual permeability of geotextiles after installation damage. However, current research on geotextile damage is mainly focused on mechanical and hydraulic properties, and whether geotextile filters with holes would fail to function after prolonged hydraulic head action has not been deeply studied [16]. Therefore, the current study was carried out to explore the outflow mechanism of sand particles in the tube through the damaged hole under the action of water flow. In addition, factors that influence the mechanism were studied. The results of this paper can provide a theoretical basis for the design, construction, and durability research of geotextile tubes.
The engineering problem of damaged geotextile tubes is essentially a problem of soil internal erosion with a special boundary condition. In embankment dams and foundation engineering, relevant work has been performed by many scholars and experts [17,18]. For instance, Tomlinson and Vaid presented an experimental study of the influence of artificial granular filter thickness and level of confining pressure on piping erosion in base soils [19]. Chang and Zhang developed a stress-controlled erosion apparatus for investigating the initiation and development of suffusion under complex stress states [20]. Wang et al. [21] studied the effects of the stress condition on the critical hydraulic gradient and soil structure in sandy gravel foundations. Liang et al. [22] analyzed and discussed the mechanism that explains how the stress states affect the suffusion under upward seepage flow. Robbins et al. [23] experimentally studied the critical gradient for piping to initiate and progress through a sample subjected to a vertical confining stress with a horizontal flume.
However, the results mentioned above cannot be fully applied to the analysis of soil erosion inside damaged geotextile tubes because of the softness and permeability of geotextiles. The majority of the visible damage is in the form of puncturing, bursting, or tearing and abrasion of geotextiles, resulting in three typical damaged holes (O-, L-, and I-shaped). Chew et al. [24] experimentally studied the erosion stability of punctured geotextile filters subjected to cyclic wave loadings. The effects of overburden pressures, wave periods, and geotextile properties on the stability of geotextiles with precut L-shaped holes were investigated. Bolt and Sterpejkowicz-Wersocki [25] investigated the stability of soil under the cover of geotextiles with precut O-, L-, and I-shaped holes when subjected to a changeable hydraulic head. The results indicate that the O-shaped holes show the worst soil-piping resistance. Although these researchers have summarized some links between the internal erosion and the damaged filters via experimental approaches, a better and more comprehensive understanding of the effects of damaged geotextiles is still necessary.
This study mainly focused on vertical seepage failure problems of sand in O-shaped damaged geotextile tubes under different overburden loads. First, the hydraulic gradient was selected as the criterion of vertical seepage failure, and a theoretical model of the critical gradient was obtained. Then, a series of test procedures were conducted. Finally, a comparison of the test and theoretical model results was presented, and the test critical gradients explained using the model equation.
2. Critical Gradient Theoretical Model
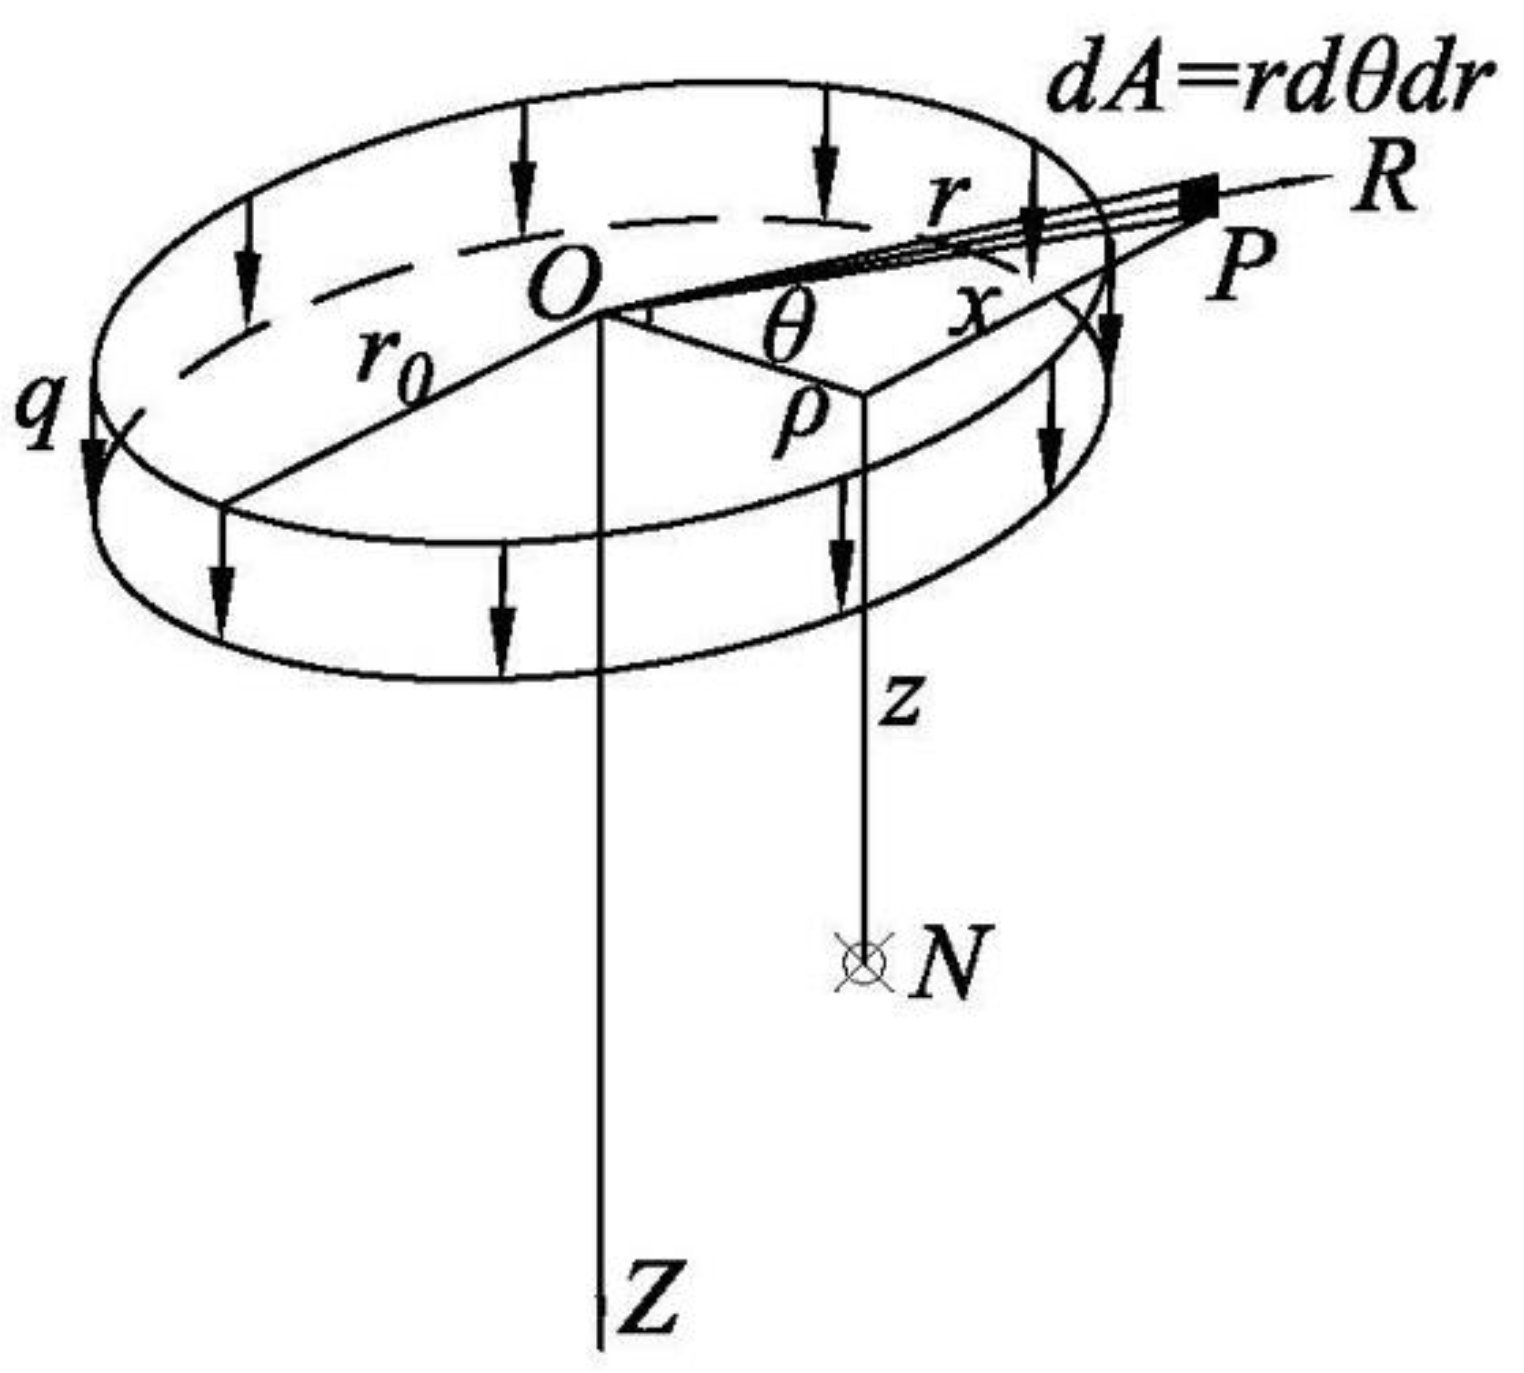
2.1. Vertical Stress Calculation
When an additional vertical concentrated force F is applied to point P of a semi-infinite soil ground surface, arbitrary point N in the soil will be subjected to the stress component of F. Based on Boussinesq’s equation for the calculation of the additional foundation stress, analytical equations of the stress component are obtained (Terzaghi 1943) [26]. Compared to other stress components, the influence of the vertical stress component on vertical seepage failure is particularly significant. Therefore, the stress components in the other directions are ignored, and only additional vertical stress is considered in the present paper.
Here, is the vertical distance between point P and the ground surface, and is the horizontal distance between points P and N.
Due to the reinforcing effect of geotextiles, the sand in the joint, excluding that in the hole, is also subject to the overburden load caused by the weight of the upper-layer geotextile tubes. This additional load can produce a corresponding vertical stress component in the sand underneath the hole. Thus, the sand is also subjected to the effect of the upper-layer tube weight.
As shown in Figure 2, the radius of the hole is r0 in the cylindrical coordinate system. The overburden load caused by the weight of the upper-layer geotextile tubes is distributed around the hole. Assuming that this load is uniformly distributed with a value of q, the micro-concentration force on the micro area P, which is a distance of r from the center point O of the hole, is:
where θ is the horizontal angle between points N and P at center point O.
Based on the general solution of Boussinesq’s equation, the additional vertical stress component at any point in the sand can be obtained by integrating q on the distribution plane as follows:
where D is the distribution area of the force, namely, the undamaged area of the geotextile. Since the damaged area is much smaller than the undamaged area, D can be assumed to be a circle with an infinite outer diameter and an inlet diameter of r0. Moreover, Equation (3) can be written as:
where ρ is the horizontal distance between point N and center point O.
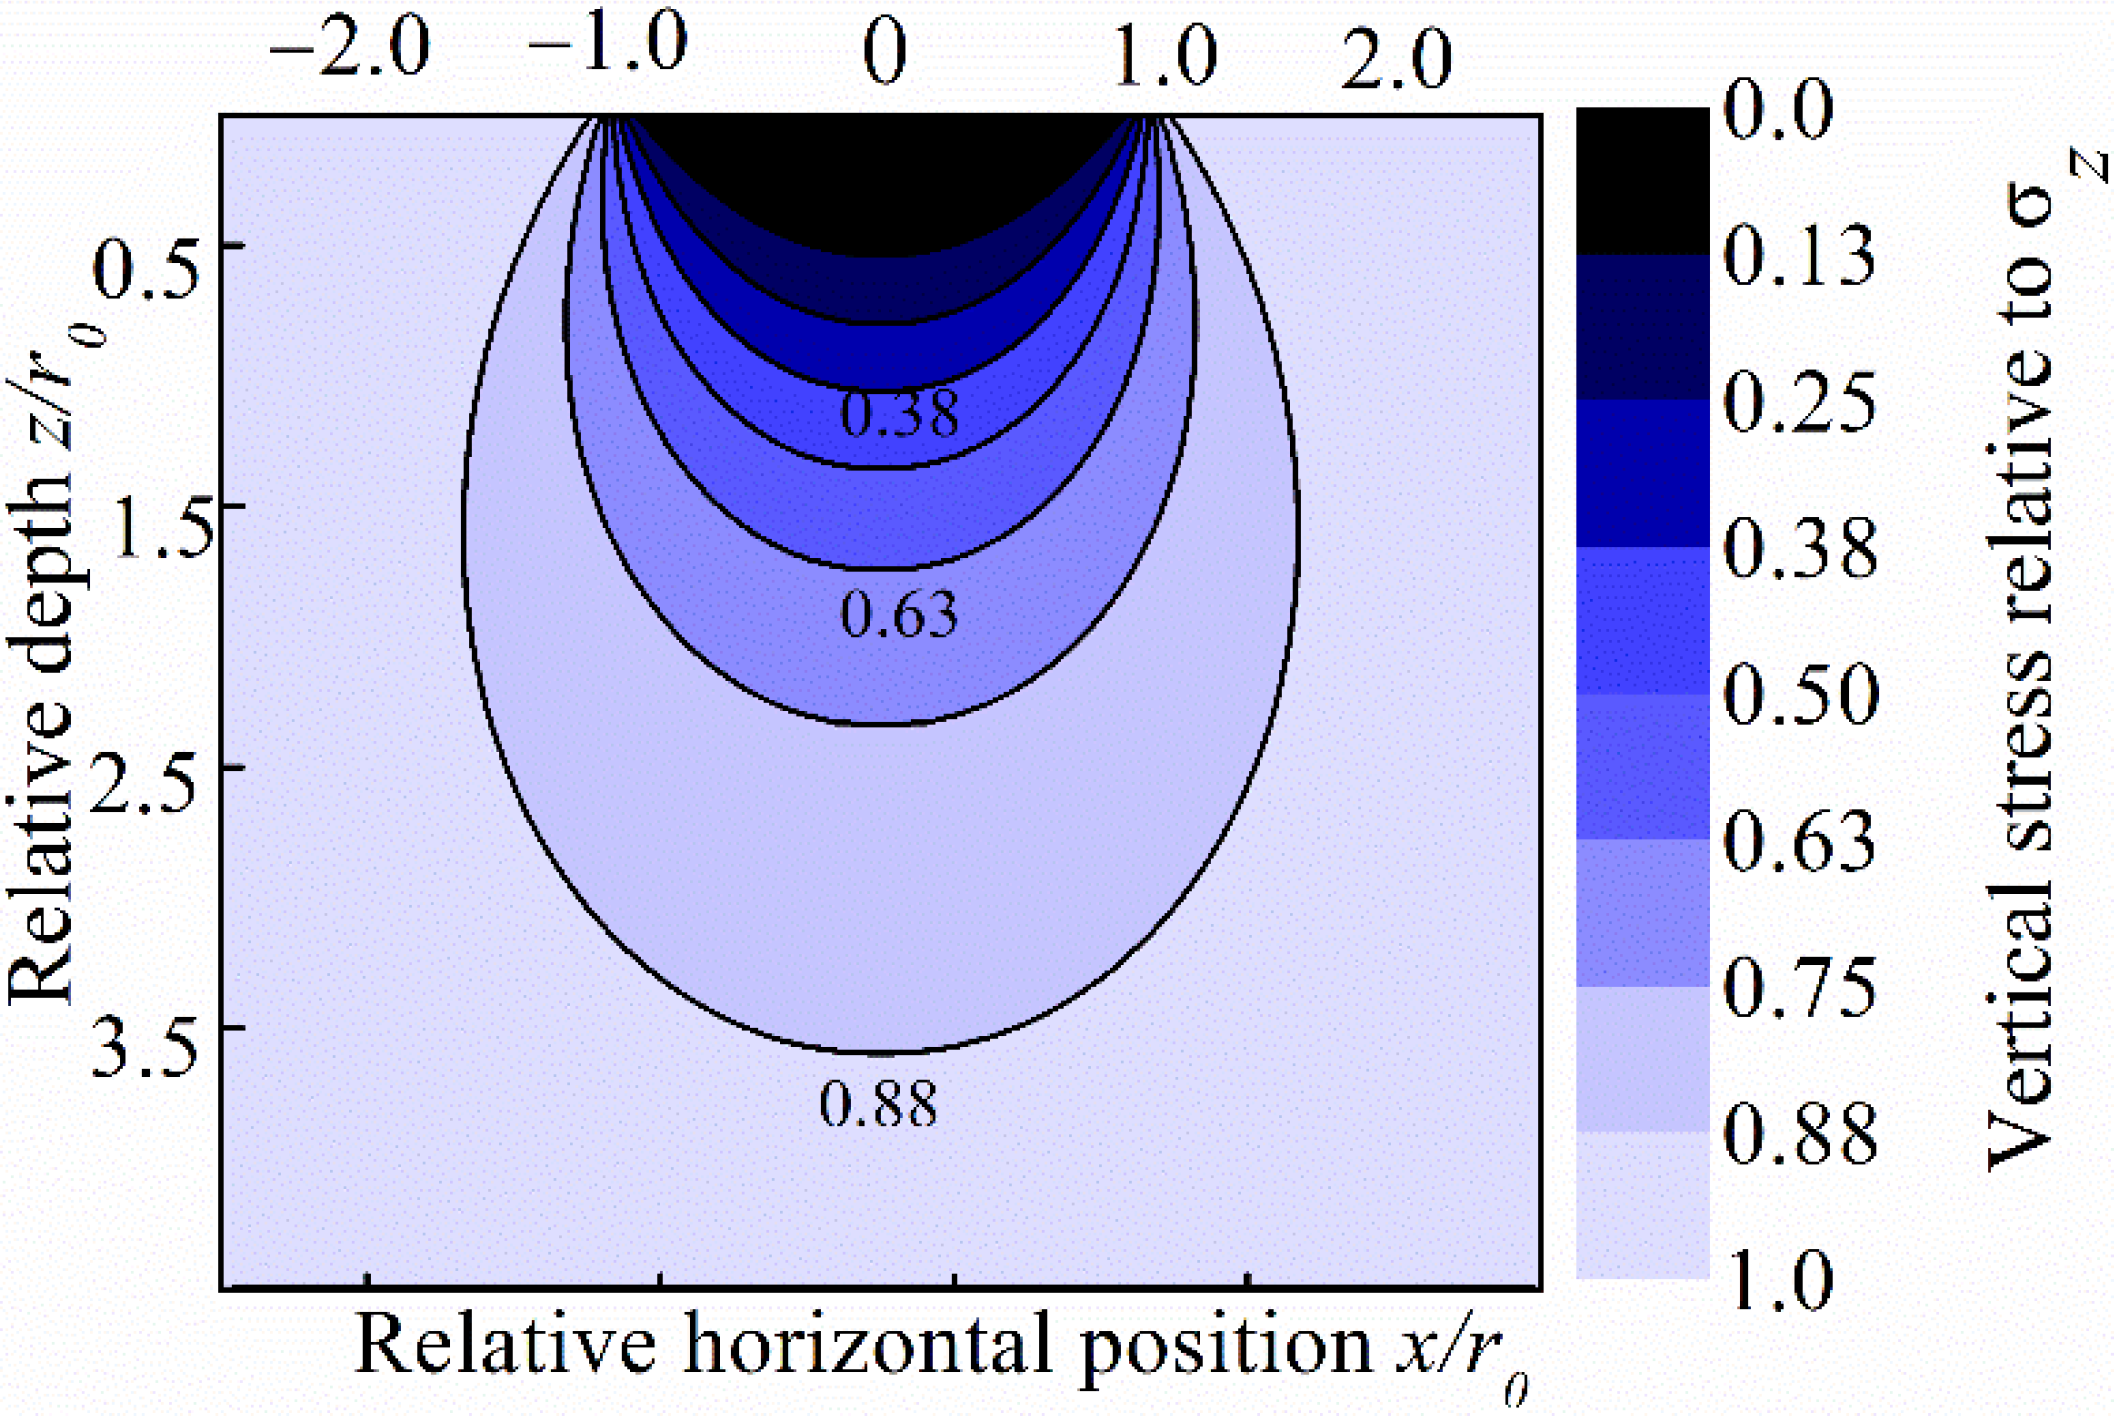
This function cannot be integrated to obtain the original function, but a numerical solution can be obtained via the MATLAB program. The distribution contours of the relative value of the additional vertical stress are shown in Figure 3.
Figure 3 shows that the additional vertical stress is an arched distribution and increases gradually with depth. At the same depth, this stress gradually increases from the center point to the surrounding area. As the geometry is symmetric, one point below the hole center is considered the research object, and its stress is analyzed. In this situation, , and the additional vertical stress below the hole center can be obtained using Equation (5):
2.2. Force Analysis of Seepage Failure
According to Equation (5), is positively correlated with the sand depth and negatively correlated with the radius of the hole. As the depth increases, the additional vertical stress increases gradually and becomes infinitely close to q. A certain percentage of q is considered the critical value of , and the depth corresponding to the critical value can be called the critical depth. Then, the sand can be divided into upper (LS) and lower (DS) parts according to the critical depth. For the upper part of the sand, both the additional vertical stress and the shearing resistance gradually increase. Accordingly, the critical hydraulic gradient increases gradually. For the lower part of the sand, both the additional vertical stress and the shearing resistance are basically unchanged. The corresponding critical hydraulic gradient also remains constant.
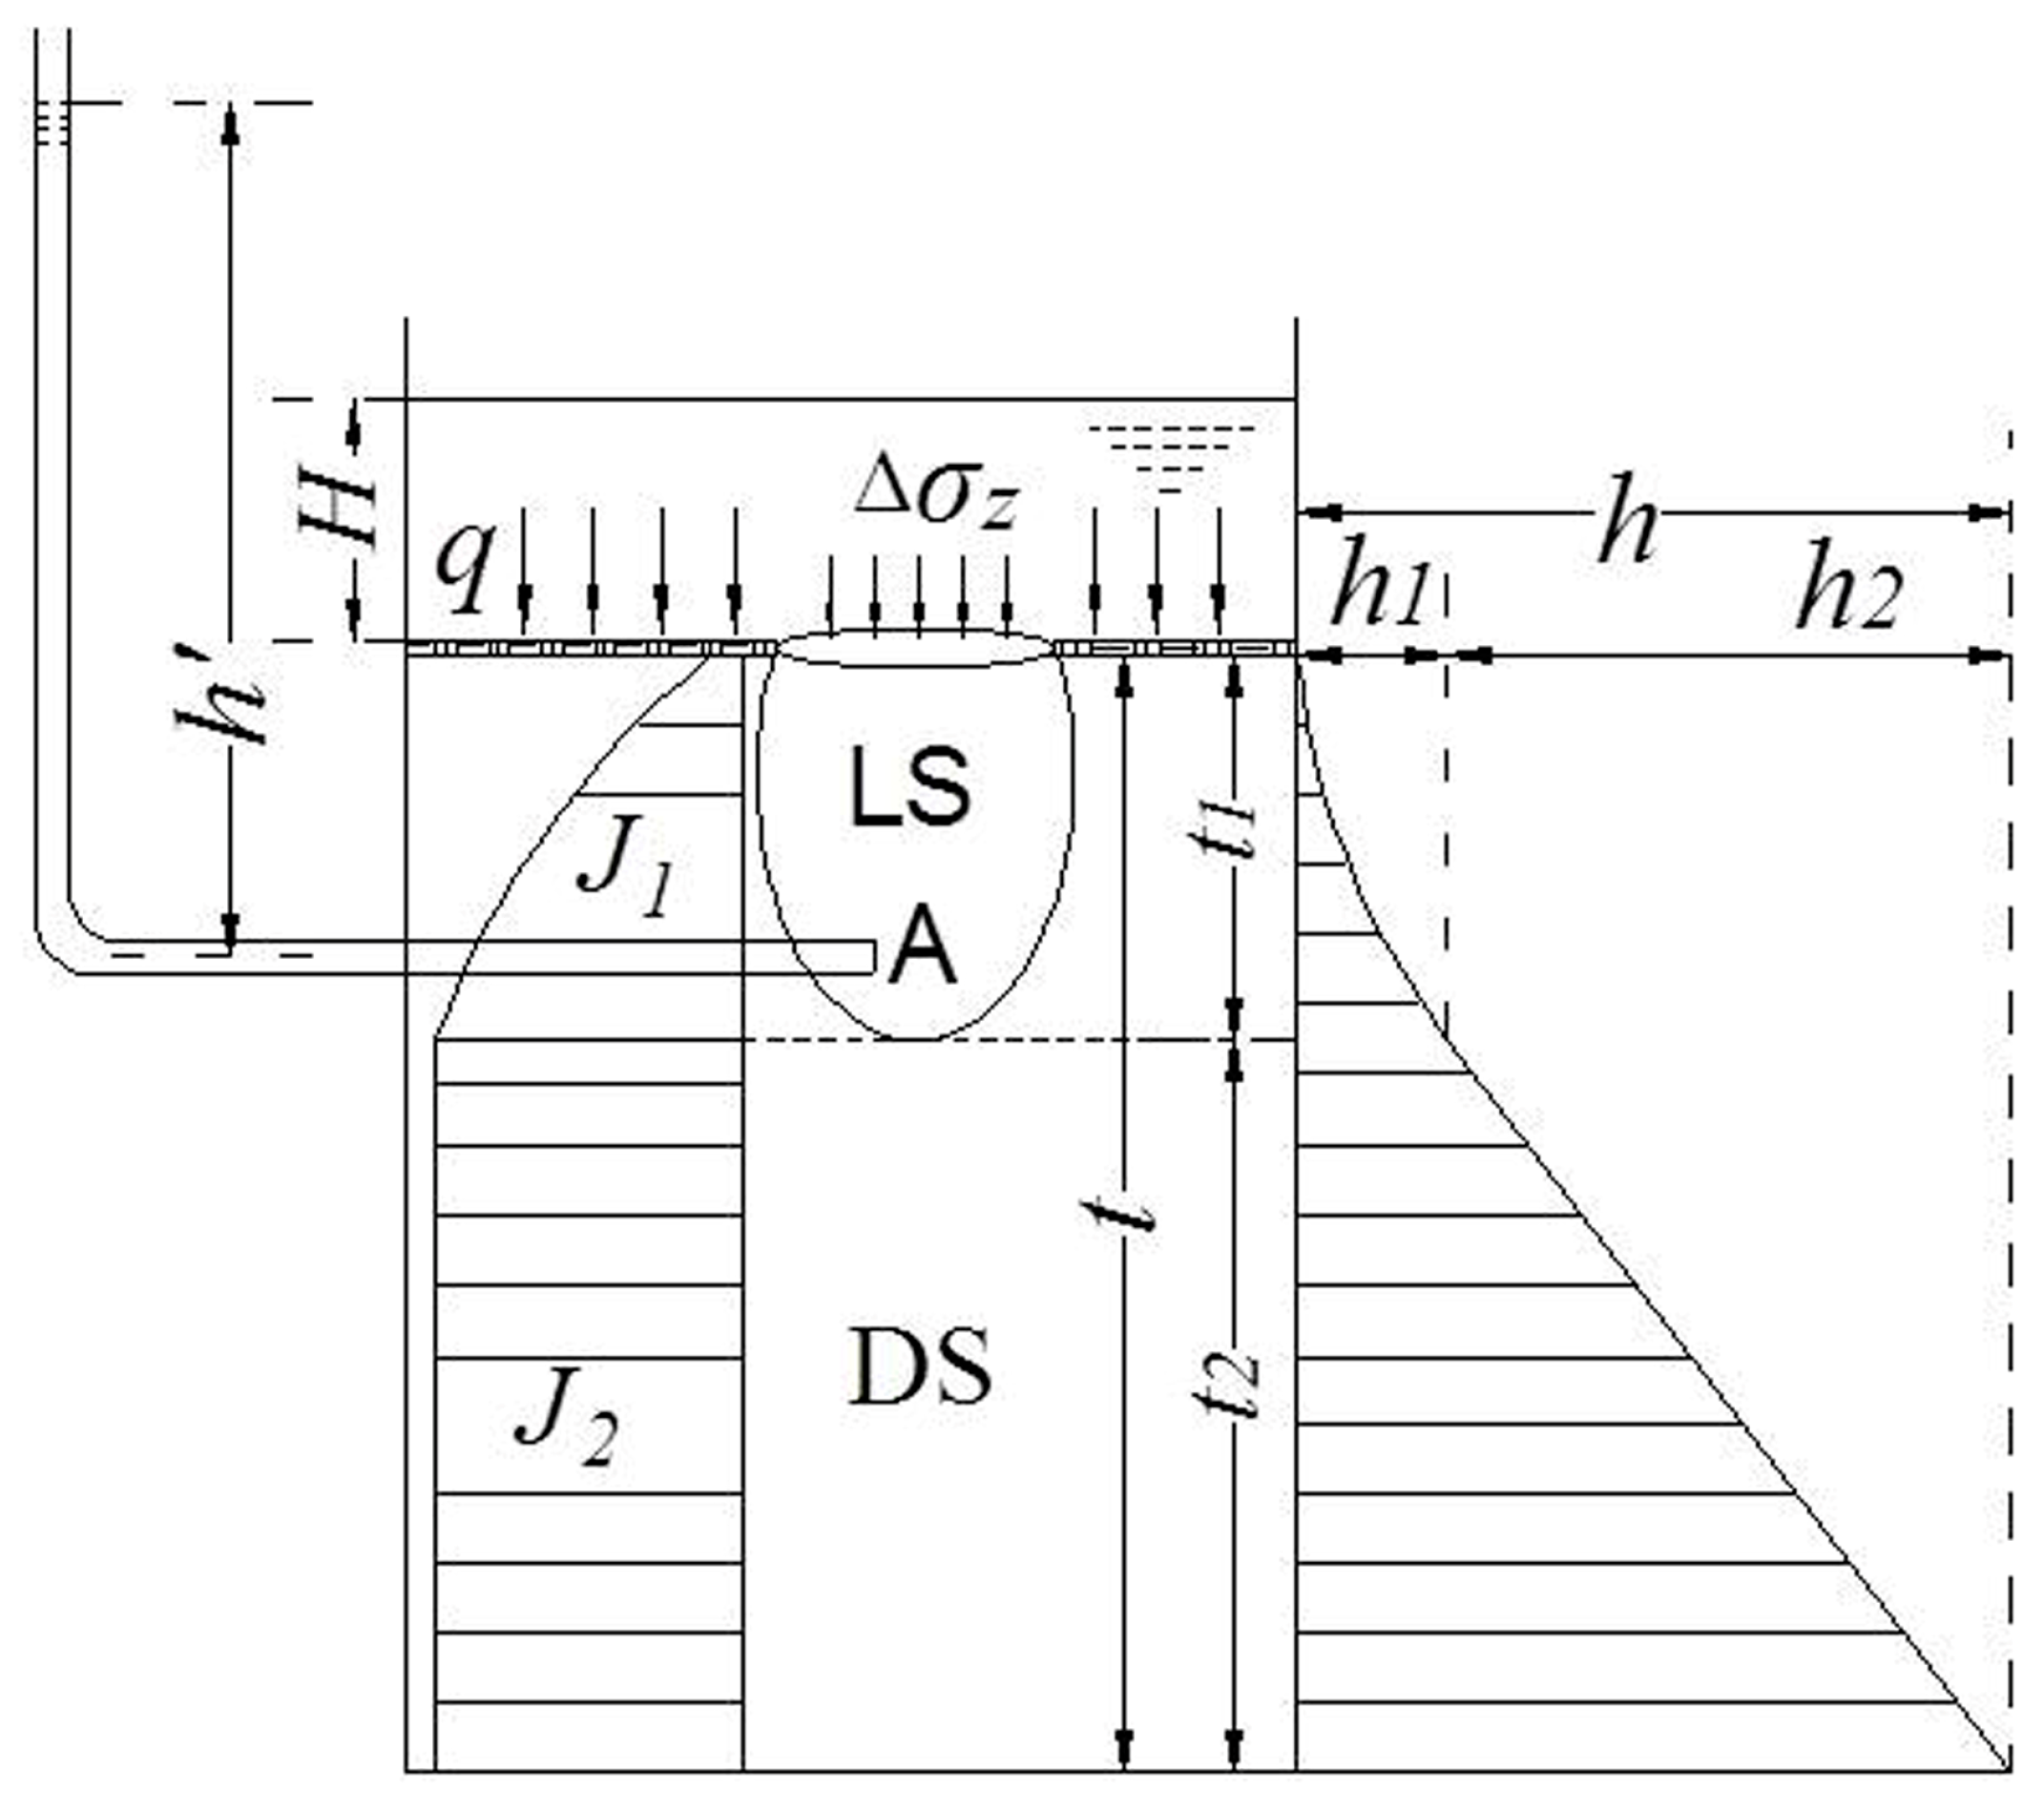
Figure 4 shows the distribution of the critical hydraulic gradient and piezometric head of the sand during seepage erosion under the action of head difference h. The thickness and piezometric head of the upper and lower parts of the sand are t1, t2, h1, and h2, respectively. Hence, the hydraulic gradient of the two sand layers J1 and J2 () can be written as follows:
where J1 and J2 are the critical hydraulic gradients of the upper and lower sand parts, respectively.
In addition, the total sand body thickness t and total hydraulic head h are:
Combining Equations (6) and (7), the average hydraulic gradient J of the sand can be obtained:
For the upper part of the sand body, the critical gradient is not constant with the depth. Thus, the critical gradient of point A at a certain depth ( where m is a constant) is considered the critical gradient of this part of the sand body. At this point, the self-weight stress of saturated sand is , the additional vertical stress is , and the piezometric head is . The depth of the overflow chamber is H. According to Terzaghi’s soil mechanical theory, the unit seepage force must be greater than the effective stress if seepage failure occurs (Terzaghi 1943) [26]. That is, for the critical gradient, the unit seepage force is equal to the effective stress. Then, equilibrium can be established as follows:
where γ is the unit weight of water.
The critical hydraulic gradient of the upper part of the sand can be obtained by simplifying Equation (9):
where is the submerged unit weight of sand.
Similarly, the critical gradient of the lower part of the sand can be obtained as follows:
By substituting Equations (10) and (11) into Equation (8) and including correction coefficients a and b, the average critical gradient of the sand can be written as:
When r0 = 0, seepage failure of the sand in the geotextile tube would not occur and Equation (12) is not applicable. When r0 is very large, geotextiles no longer have a protective effect on sand. The shearing resistance of sand in the tube is equal to that of sand without a tube.
The effects of the overburden load and size of the hole on the critical gradient are mainly studied in the present paper. By ignoring other parameter variations, Equation (12) can be simplified as follows:
where Jt is the Terzaghi theoretical critical gradient, and α and β are the overburden load and hole effect coefficients, respectively.
In Equation (13), the geotextile has two main effects on the sand body. First, αq is related only to the overburden load exerted by the geotextile on the sand body. Second, is related to the overburden load and inversely related to the radius of the hole. The larger the value of coefficient α, the more significant the effect of the overburden load. The larger the value of coefficient β, the greater the effect of the hole on the sand strength.
3. Sand Erosion Tests by Upward Seepage Flow
3.1. Test Apparatus and Materials
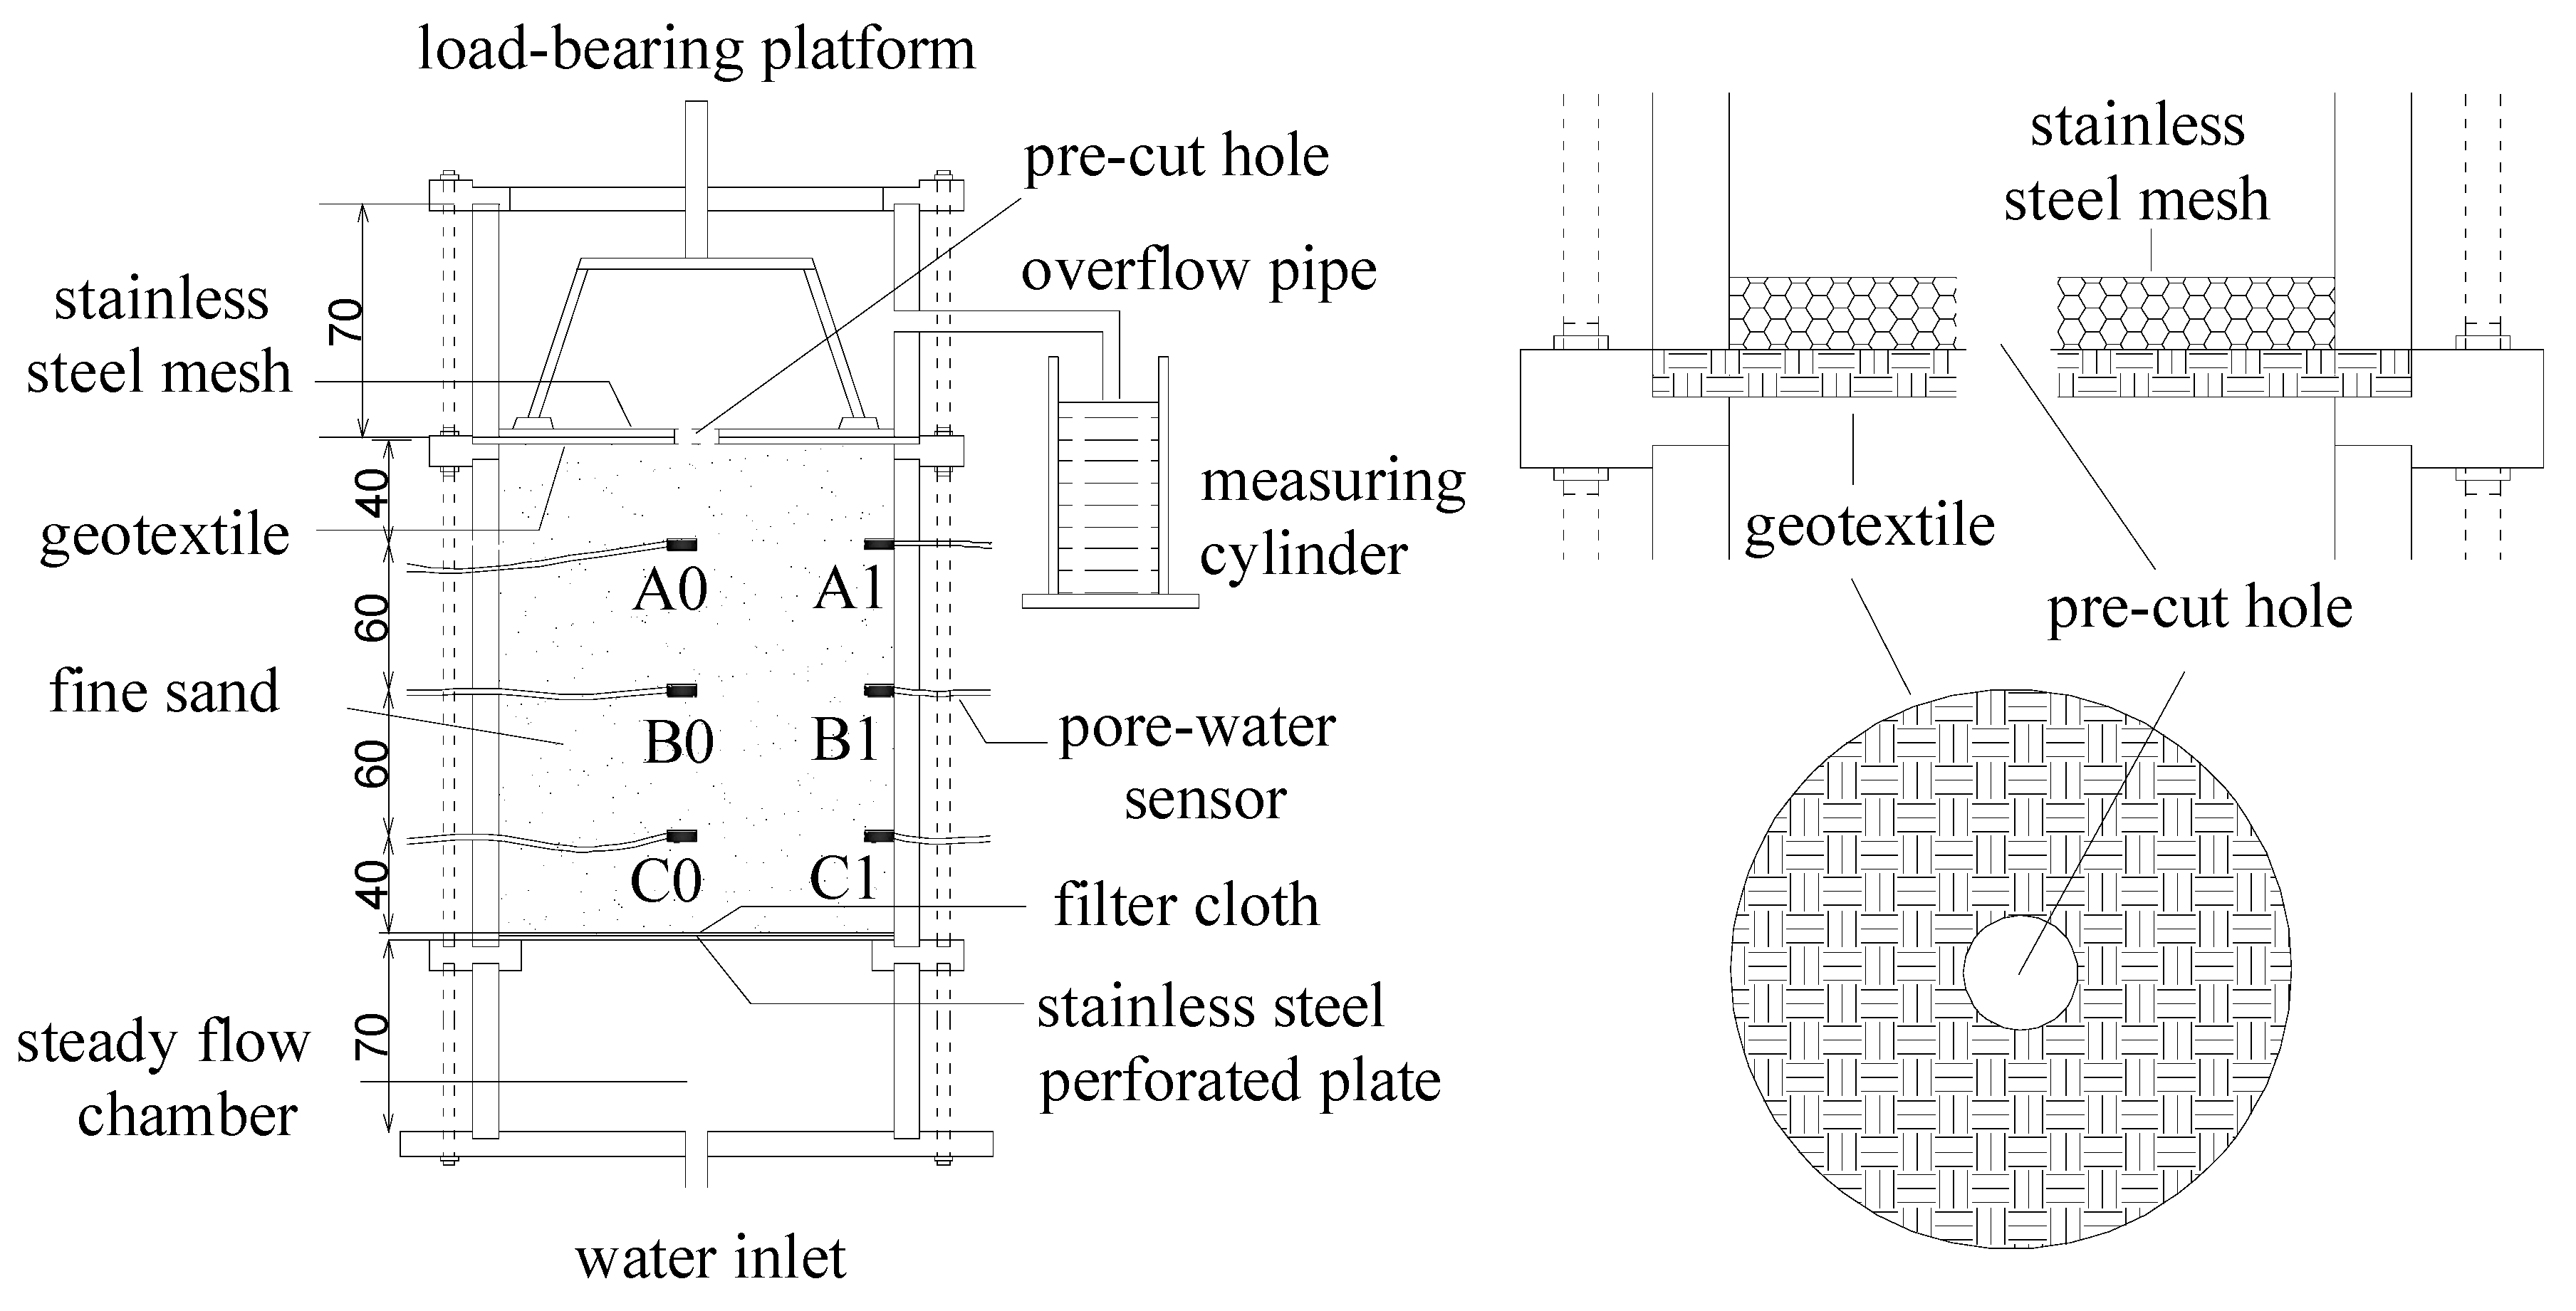
By examining previous soil seepage failure tests [27,28,29], a testing apparatus was developed by adding a flange to fix the geotextile to the original device. This apparatus can systematically investigate the process of internal erosion and the critical gradient of seepage failure of the sand within geotextile tubes subjected to upward seepage flow. The general layout of the apparatus is shown in Figure 5. Its three major parts are the overflow chamber, sand chamber, and steady-flow chamber. All chambers are made of transparent acrylic cylinders (10 mm in wall thickness and 180 mm in inside diameter), enabling visual observation of the seepage progress in the sand sample during the tests. Each adjacent chamber is connected by a flange and fixed by external bolts.
The steady-flow chamber is 70 mm high. Its bottom is a stainless-steel disc with an inlet at the center that is connected to an external tank that provides a steady water flow to the sand specimen. The sand chamber is 200 mm high. Compared with the inner wall of the acrylic cylinder, the inner side of the bottom flange should be convex to hold a stainless-steel perforated plate. The perforated plate is covered with a filter cloth and supports the upper sand sample. Six ports located at three elevations within the sand sample measure the pore-water pressure at 40 mm, 100 mm, and 160 mm from the top of the sand chamber. The top of the sand chamber is a geotextile with a precut hole. The geotextile is placed close to the sand sample, and its edge is closely combined with the acrylic cylinder through the flange. The overflow chamber is 70 mm high, and its bottom is a hard stainless-steel mesh placed on the geotextile. A precut O-shaped hole is set in the center of the steel mesh, and its size is the same as that of the precut hole of the geotextile. A load-bearing platform is placed on the hard stainless-steel mesh to apply an additional load to the sand sample through an external loading device. The 10-mm-diameter overflow port is opened in the sidewall of the overflow chamber to maintain a constant hydraulic head at the top of the sand specimen. To prevent water leakage, a rubber O-ring seal must be placed at the joint of adjacent parts.
The tested geotextile is a burst-film woven geotextile that is widely used in hydraulic engineering in China. Its main performance parameters are listed in Table 1.
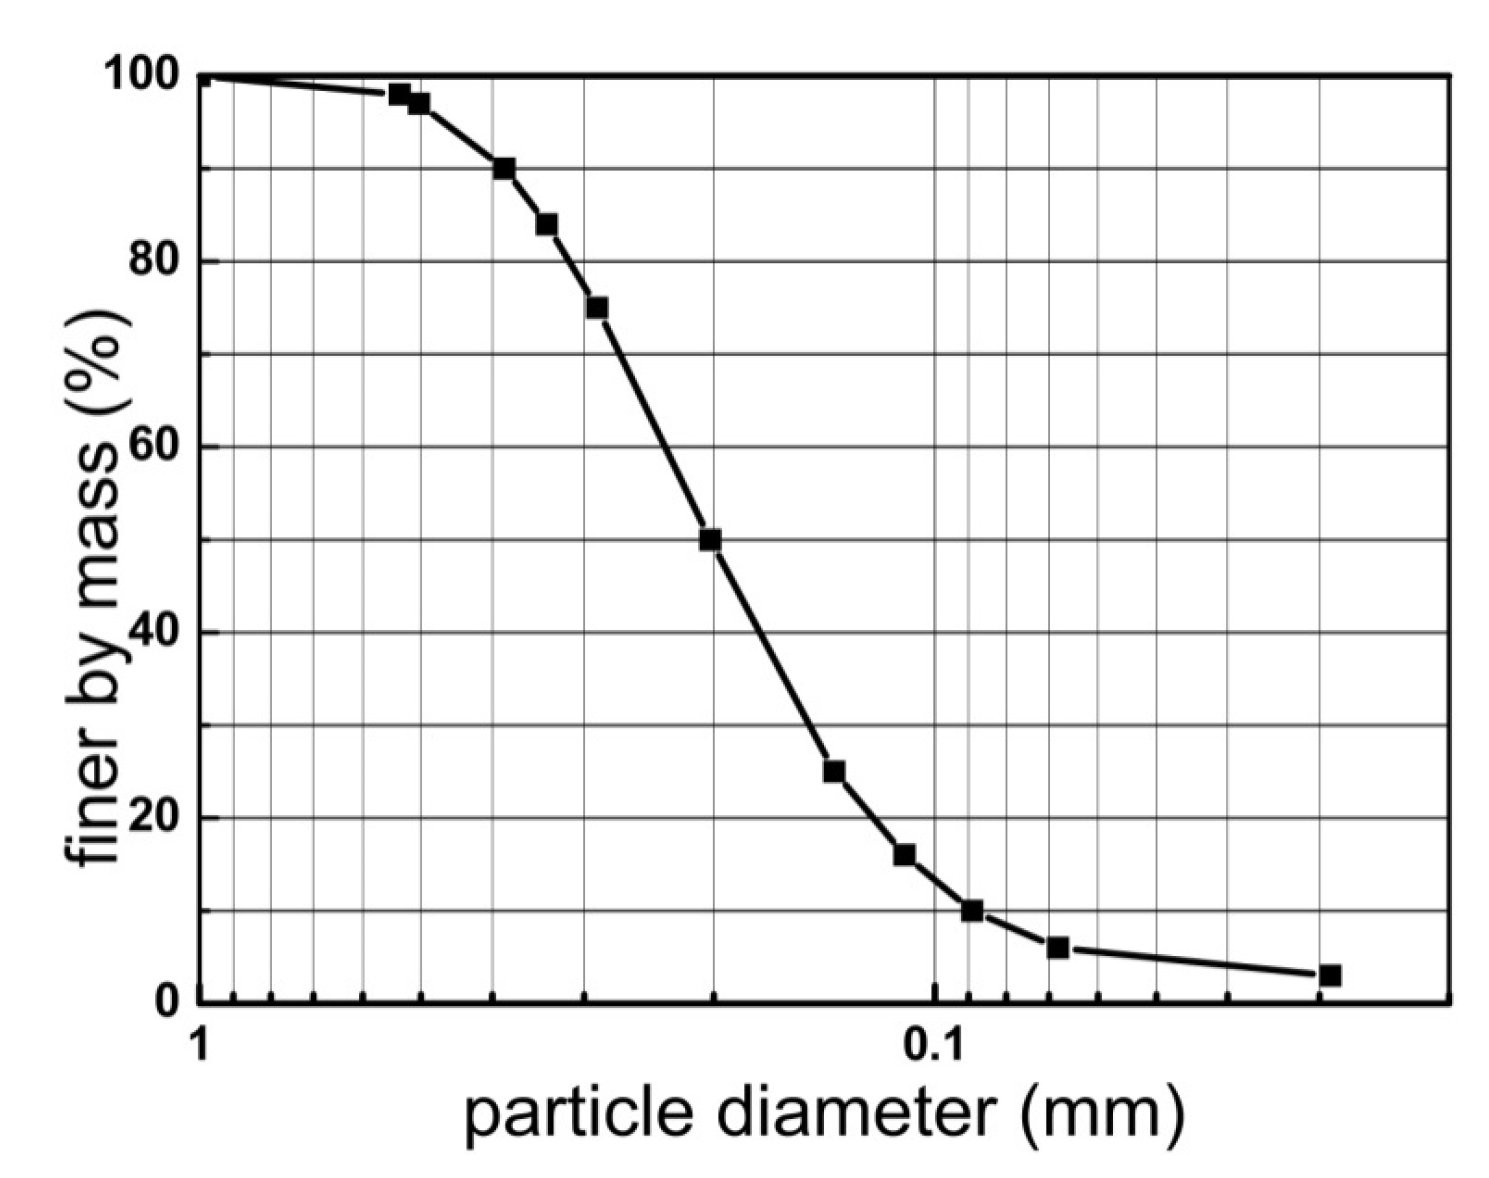
In the process of tube filling, the slurries used are all locally sourced, and the grading of filling materials is not consistent across projects. In order to obtain different grades of sand bodies and facilitate the test research, artificial quartz sand was selected as the test material. A summary of the key properties of the test sand is presented in Table 2. The grain-size distribution curve is presented in Figure 6. The retention criterion (O90 < d85) and permeability criterion (O90 > d15) are both satisfied.
3.2. Testing Program and Procedures
Based on actual projects whereby the cross-sectional diameter of the joint channel is smaller than 5 cm, four different hole radii were adopted (0.5, 1, 1.5, and 2 cm). In addition, considering that the overburden load varies with the depth of the damaged joint channel between the tubes, five normal overburden load levels were selected (0, 5, 10, 20, and 30 kPa). A total of twenty groups of test results were obtained. The testing procedures are described as follows:
- Before the sand seepage erosion tests, the steady-flow chamber, sand chamber, stainless-steel perforated plate, and filter cloth were assembled successively, as shown in Figure 5. To ensure the homogeneity of the sand sample, the sand was compacted layer by layer with a thickness of 4 cm per layer. Each layer was compacted with a metal rod several times to the target relative density. This process was repeated until the sand was filled to the top of the sand chamber. During sand filling, pore-water sensors were placed at predetermined positions.
- The geotextile with the hole and the acrylic cylinder of the overflow chamber were placed successively after the surface of the sand sample was flattened. Then, the hard stainless-steel mesh and the load-bearing platform were installed. In the end, the overflow chamber was secured by bolting the cover plate and flange.
- In the process of specimen saturation, the required overburden load was first applied through the loading device. Second, water from the external tank was slowly introduced into the specimen through the steady-flow chamber. To avoid sand particle disturbance, the saturation process must be slow. Then, the sand was soaked for 12 h under a static head to ensure a high degree of saturation.
- Starting with zero differential head, the water tank was first raised by 3 cm (hydraulic gradient = 0.15). During this period, the pore-water pressure and the seepage rate were recorded using a measuring cylinder under the overflow pipe every 2 min, and the corresponding hydraulic conductivity was calculated. If there is no change in the water pressure and seepage rate for two consecutive times and no notable seepage channel is observed, then the sand sample is considered to be stable. After another 20 min under this hydraulic gradient, the hydraulic gradient was increased by raising the tank another 3 cm. This process was repeated until hydraulic conductivity changed by more than 20%. For the remainder of the test, the differential head was increased in small increments of 1 cm (hydraulic gradient = 0.05). The test progressed until the sand sample completely failed.
4. Test Results and Analysis
Seepage Failure Progression
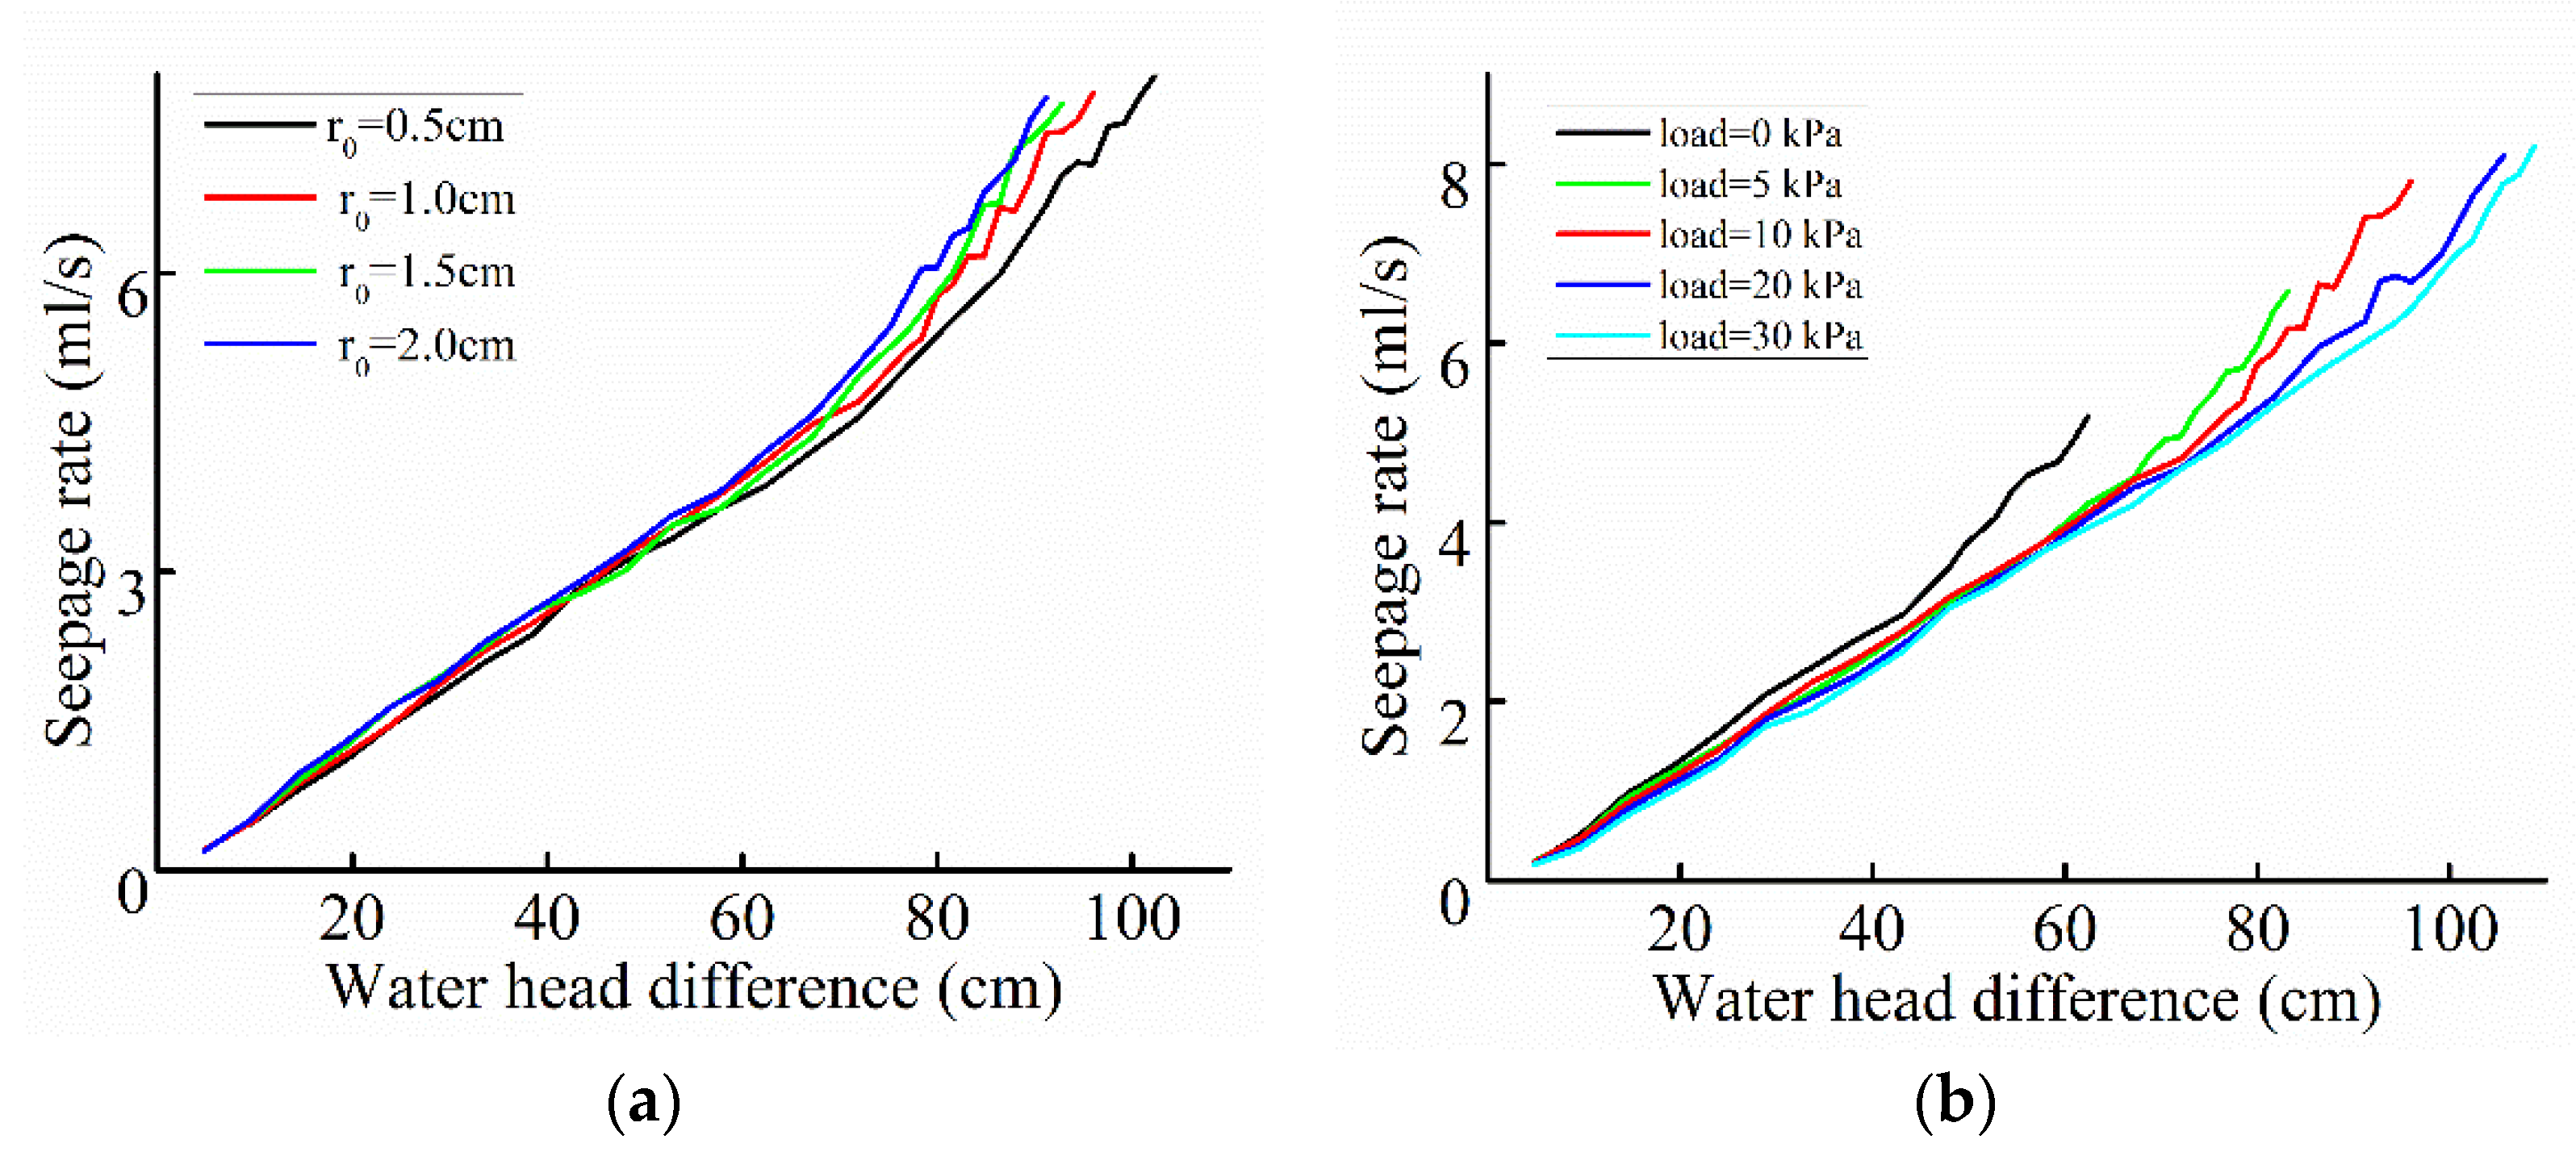
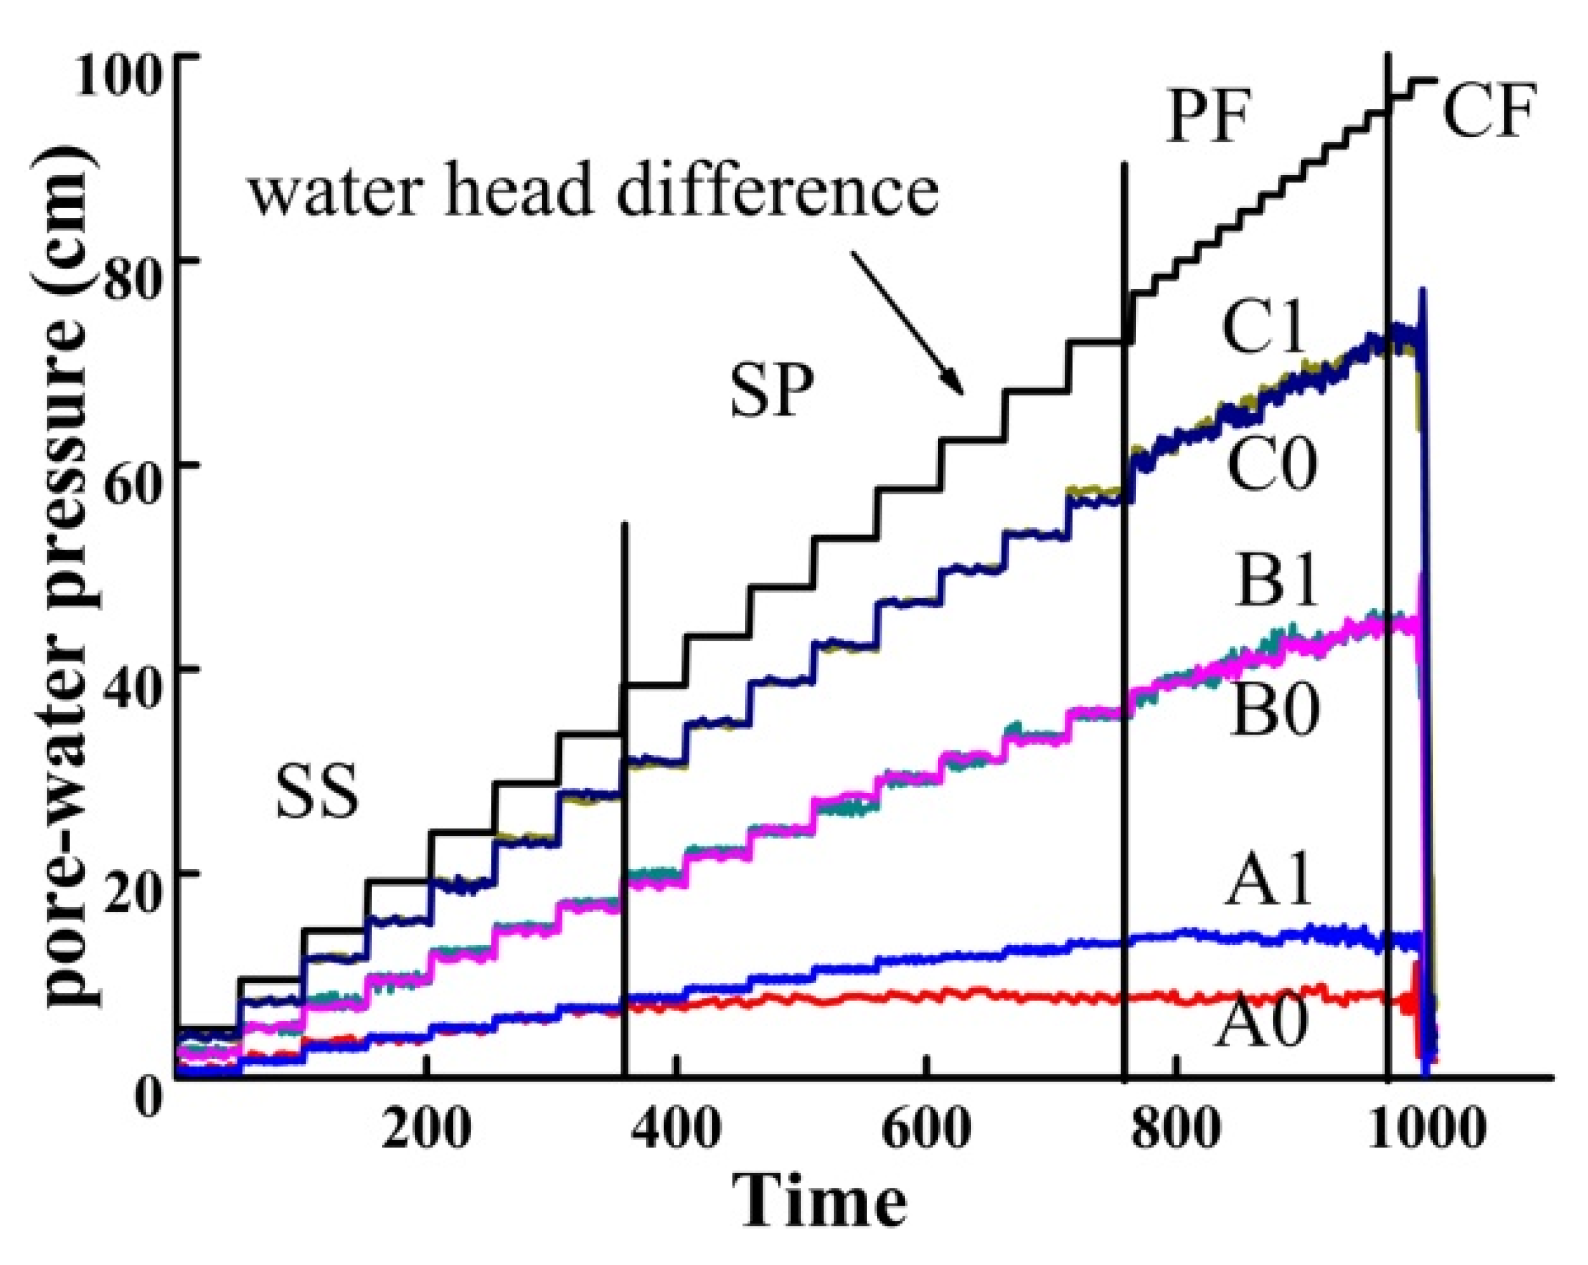
Although there was a significant difference between the critical hydraulic gradients of ultimate failure in each group of tests, the initiation and development processes of seepage erosion were basically the same. Figure 7a shows the variation in the seepage rate under a 10 kPa load and different hole radii. Figure 7b shows the variation in the seepage rate under different loads and a hole radius of 1.0 cm. Figure 8 shows the typical variation in the pore-water pressure over time under a 10 kPa load and a hole radius of 1 cm. Combined with the experimental observations, four stages of development were identified to describe the progression of seepage failure: (1) seepage stability (SS), (2) sand particle wash-out (SP), (3) preferential flow formation and development (PF), and (4) complete failure (CF).
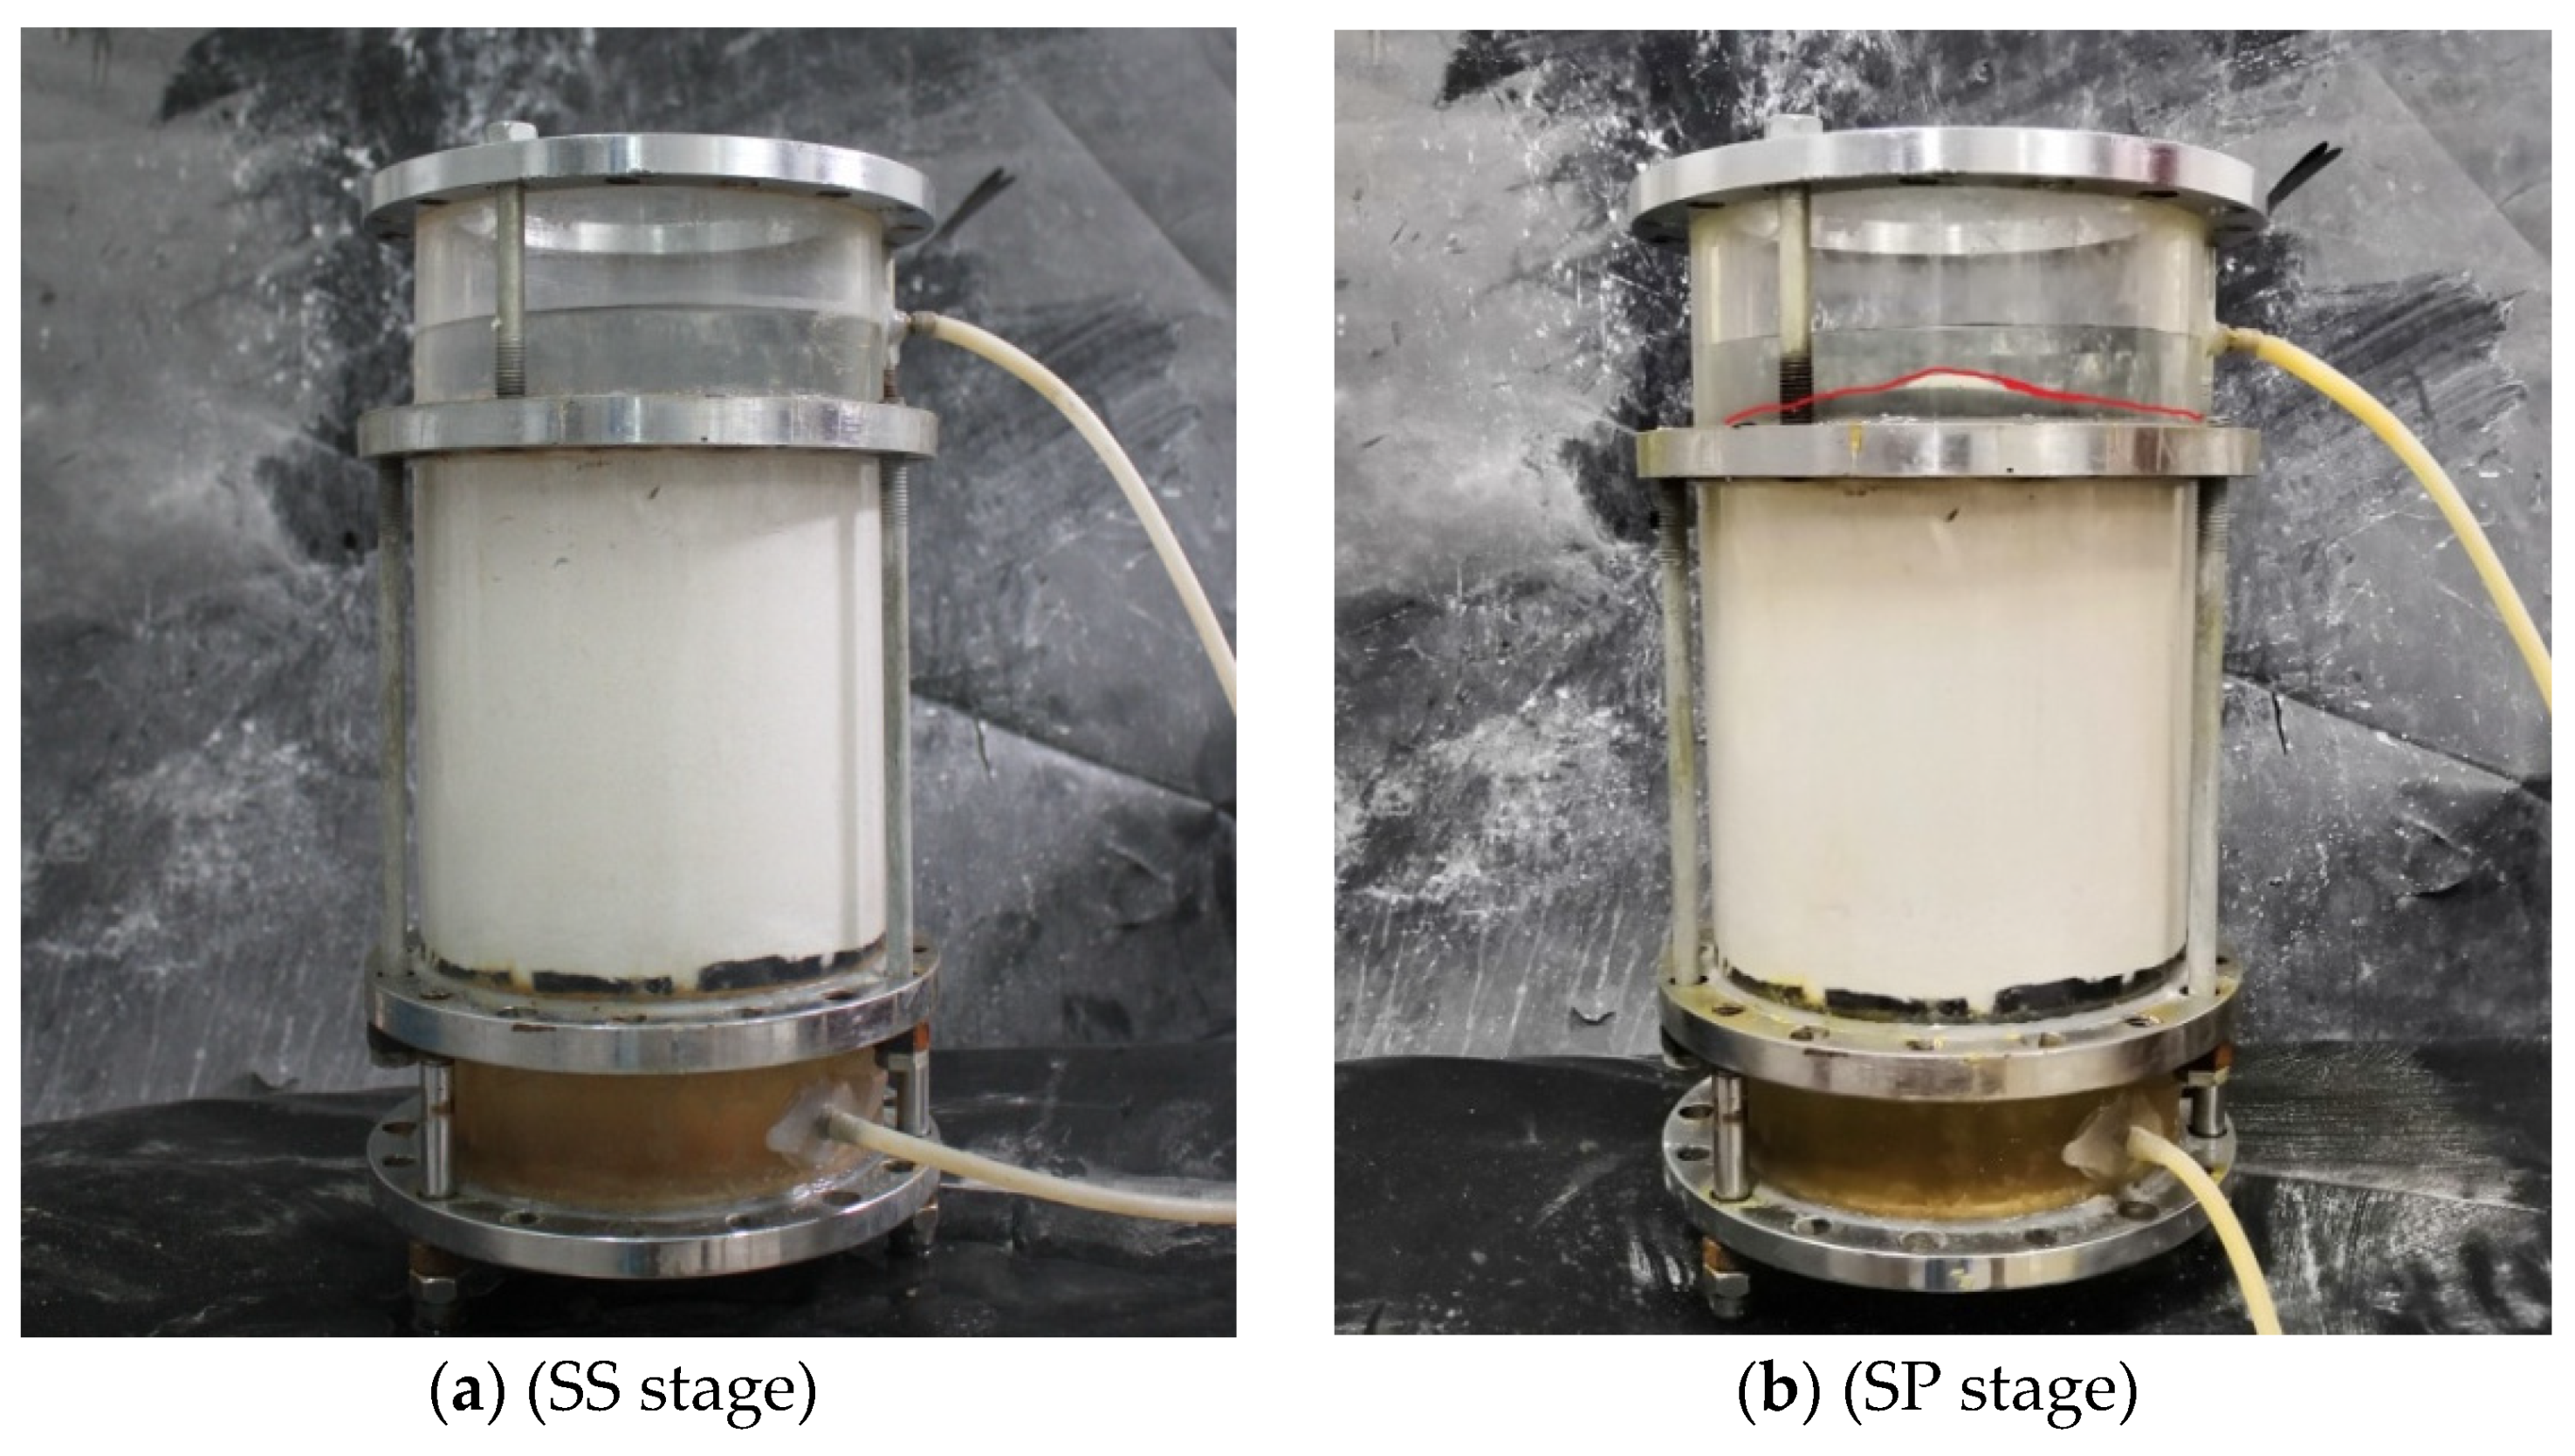
1. Seepage stability (SS): at this stage, the water in the overflow chamber is clear, and no notable change is detected on the surface of the geotextile (Figure 9a). Both the seepage rate under different conditions and the pore-water pressure at all port locations increase linearly with increases in the hydraulic head difference. There is no difference in pore-water pressure at the same height. These results indicate that the soil specimen remained stable in this hydraulic gradient range. This process is in agreement with previous research conclusions on conventional soil seepage [30].
2. Sand particle wash-out (SP): at the beginning of this stage, sand particles near the hole are washed through the hole. When the overburden load is zero, the sand specimen exhibits slight expansion, and the center of the geotextile is bulged slightly and resembles an arch (as shown in Figure 9b). These results indicate that the anti-deformation protection effect of the geotextile on the sand sample gradually becomes apparent. Later, the amount of washed-out sand increases with an increasing hydraulic gradient. However, no noteworthy changes in the sand specimen are observed, indicating that the soil specimen again reaches equilibrium in this hydraulic gradient range. According to Chang [31], seepage forces were not large enough to bring the soil to shear failure within the range of the applied gradients.
In the process, the measured seepage rate and hydraulic head difference still show a linear relationship. This phenomenon is also described by Xie [32] and Indraratna [33]. The pore-water pressure increases with the increase in head difference except for manometer A0 due to the loss of sand near the hole. The pressure difference between A1 and A0 implies that a horizontal hydraulic gradient occurred at the top of the sand sample. This phenomenon indicates that the washed-out sand comes not only from the vertical lower part of the hole but also from the lower part around the damaged area.
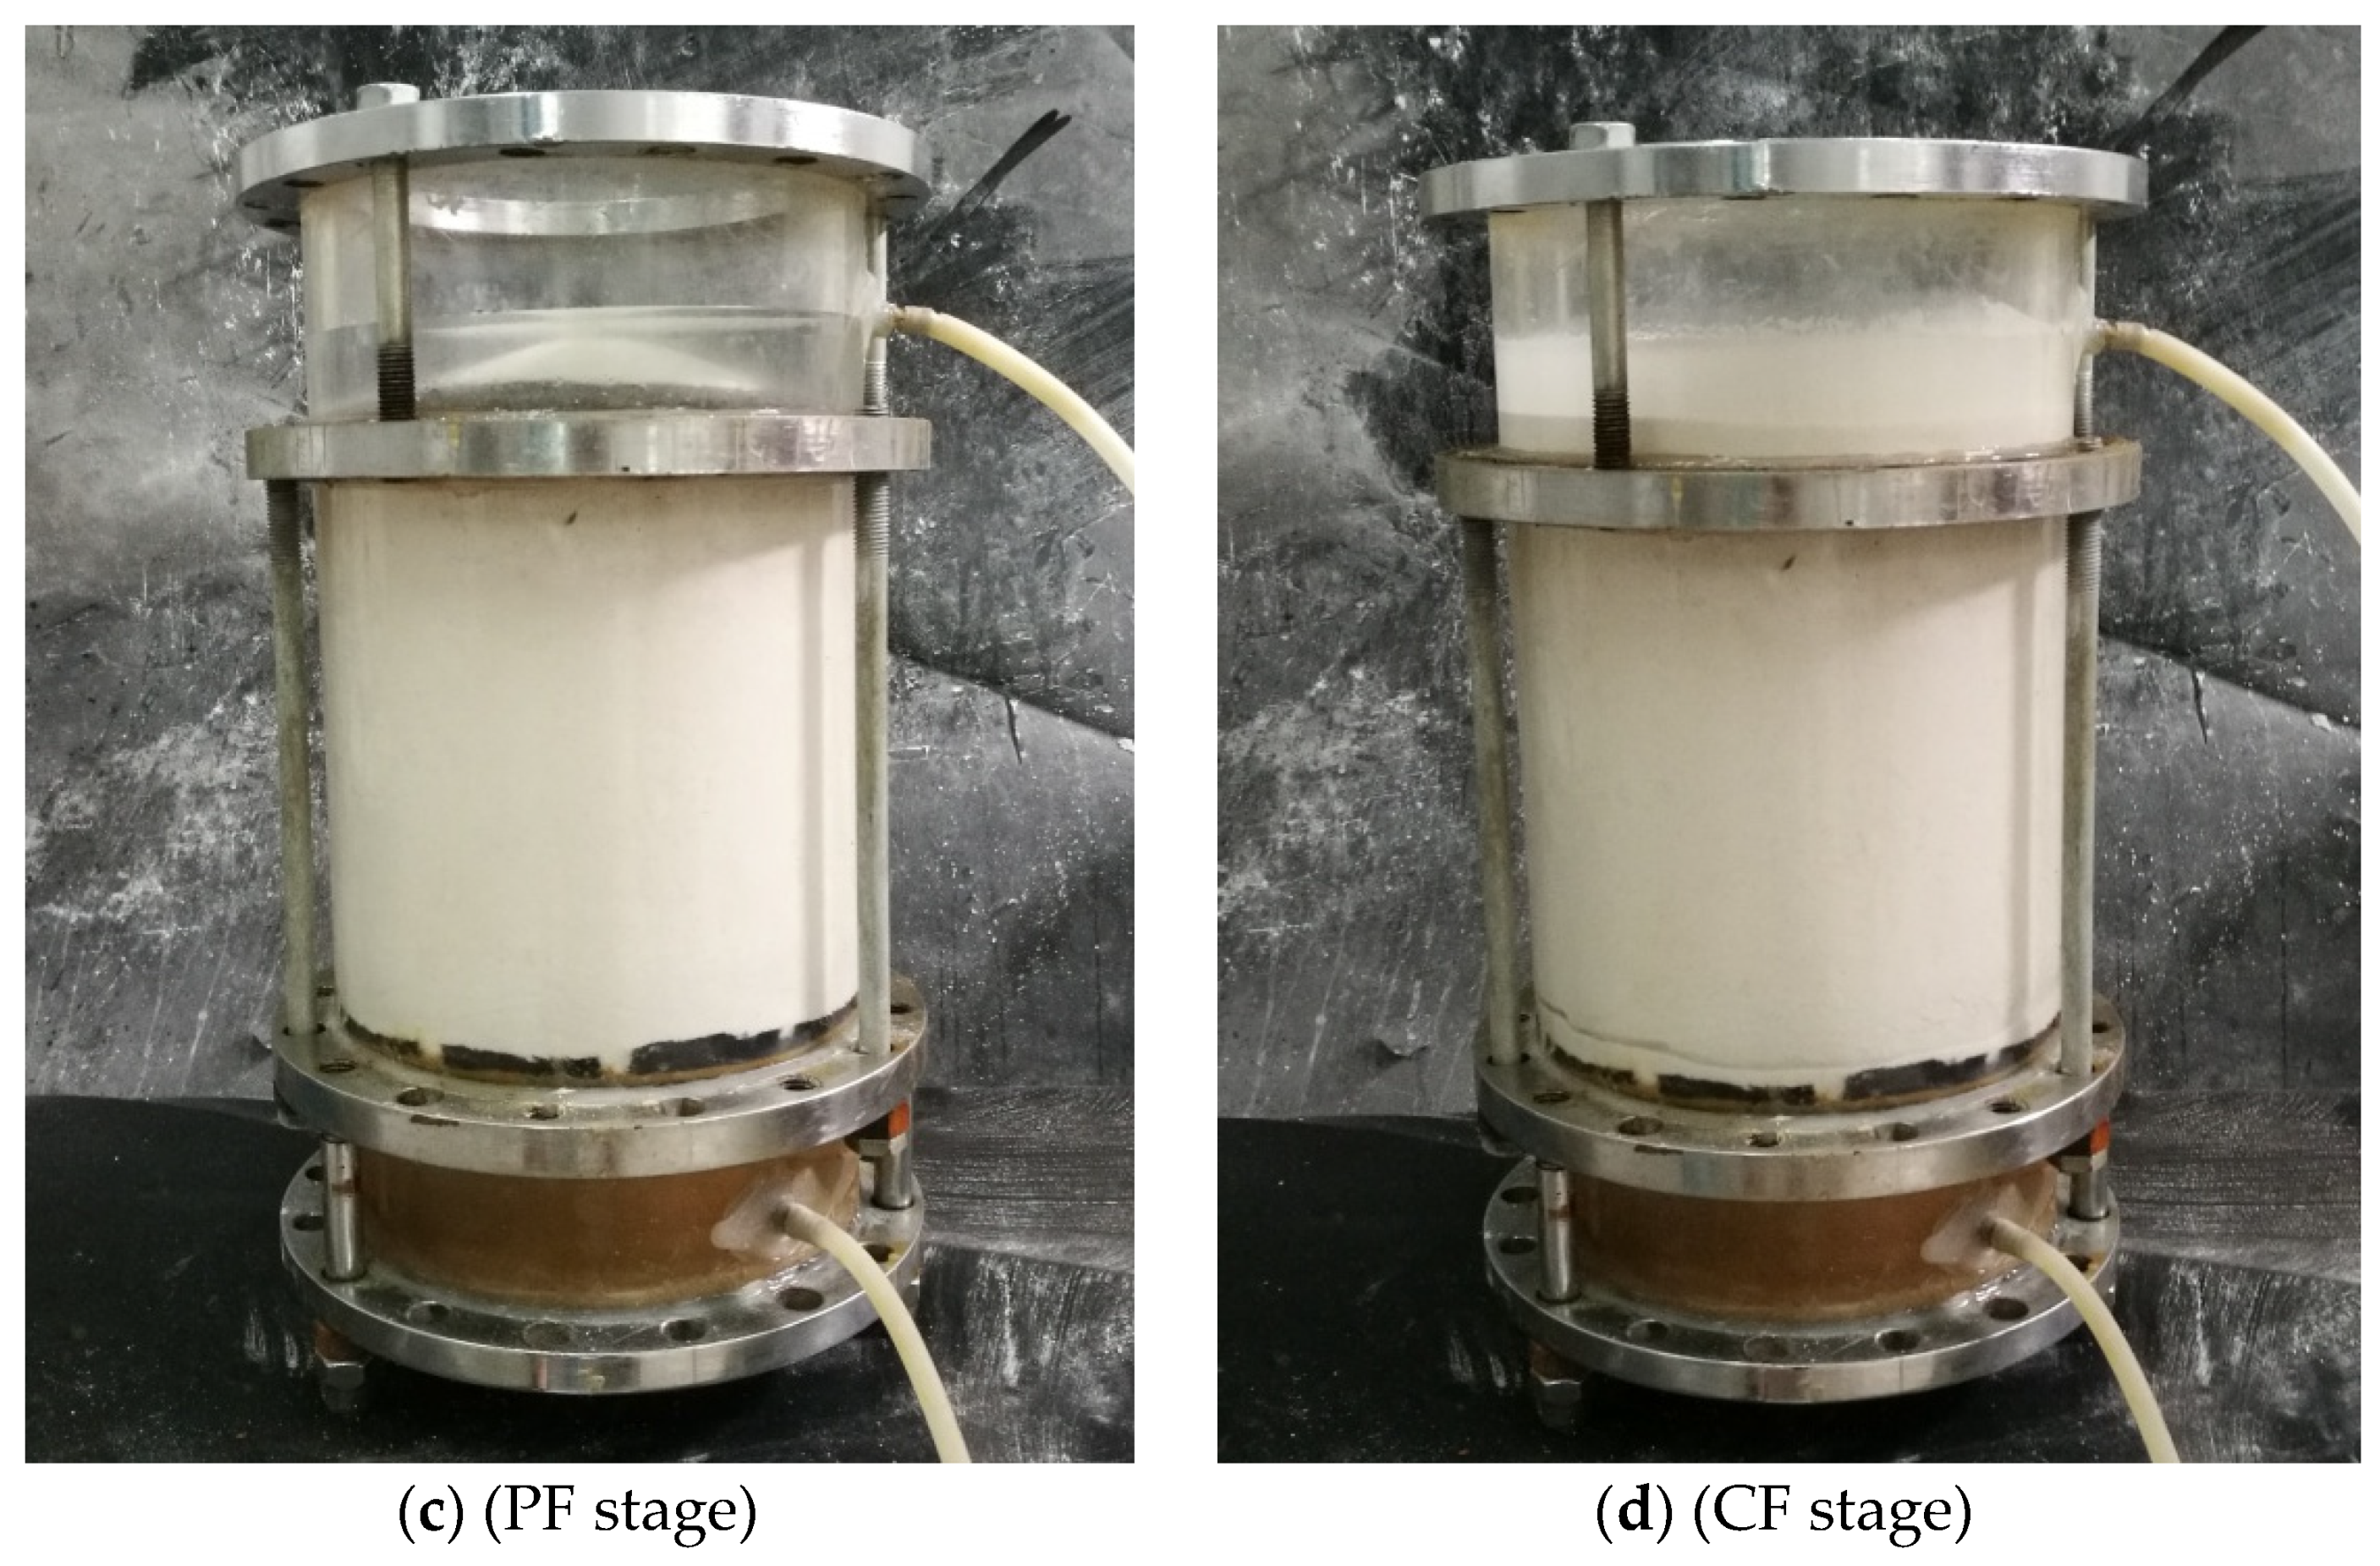
3. Preferential flow formation and development (PF): Preferential flow refers to the intensive and rapid seepage flow in a small number of large connected pores in the sand, while the flow velocity in other areas is much lower than that in the large pores [34]. Although many scholars have noticed the phenomenon of Preferential flow in soil, these studies have not combined Preferential flow with seepage force and seepage failure [35].
At this stage, the sand sample becomes loose as excessive particles are lost through the hole (Figure 9c). The seepage forces are able to overcome the friction between the soil particles to drag fine particles within the matrix of coarse sand particles. Thus, preferential flow can be formed through the nonhomogeneous porosity inside the sand sample. Due to the formation of preferential flow, seepage flow does not conform to Darcy’s law. The relationship between the seepage rate and the hydraulic head difference is quite complex. With the increase in hydraulic head difference, the seepage rate increases, remains unchanged, and even decreases at some point. Moreover, due to variations in the amount of sand loss, the difference in seepage rate under different conditions starts to increase.
The pore-water pressure curve changed significantly compared with those of the previous stages. Specifically, the pore-water pressure in the upper part of the sand sample decreased slightly, while the pressure in the rest of the sand sample continued to rise but at a lower rate. In addition, all the pressure curves show notable fluctuation characteristics. The pressure fluctuation was also observed in experimental and field tests by Parekh [36]. However, with this cyclic process of formation, development, disappearance, and reformation of preferential flow, the sand sample can remain stable under all hydraulic gradient levels at this stage. From prior studies, it is known that seepage force is related to the seepage gradient [37]. The formation of preferential flow leads to a decrease in the gradient in areas without preferential flow, which is the reason for the stability of the sand structure at this stage4. Complete failure (CF): at the beginning, vigorous sand boil formation in the geotextile hole can be observed. The water in the overflow chamber becomes cloudy, accompanied by a slight decrease in pore-water pressure (Figure 9d). This result is attributed to the continuous development of sand sample internal erosion. Over time, the suspended fine particles caused by sand boiling gradually increase and are distributed. Finally, the water in the overflow chamber becomes completely cloudy. At the same time, the sand sample is completely destroyed, and particles of all sizes are washed from the geotextile hole. The pore-water pressure instantaneously drops to near zero [38]. While sand erosion occurs slowly, sand destruction is instantaneous. The seepage rate no longer has practical significance after seepage failure, therefore, the change in seepage rate is not shown at this stage in Figure 7.
Based on soil seepage theory and experience of seepage in earth-rock dams engineering, once seepage failure occurs, soil erosion and loss will continue until the soil structure fails. Thus, the sand in the damaged tube will be continuously lost along the channel between adjacent tubes under the action of seepage flow. With the increase in the amount of sand, local dam instability is inevitable. Compared with the sand failure mode under the overlying clay layer obtained by Zhou et al. [39] and Tomlinson [20], this failure process is obviously different and more complex.
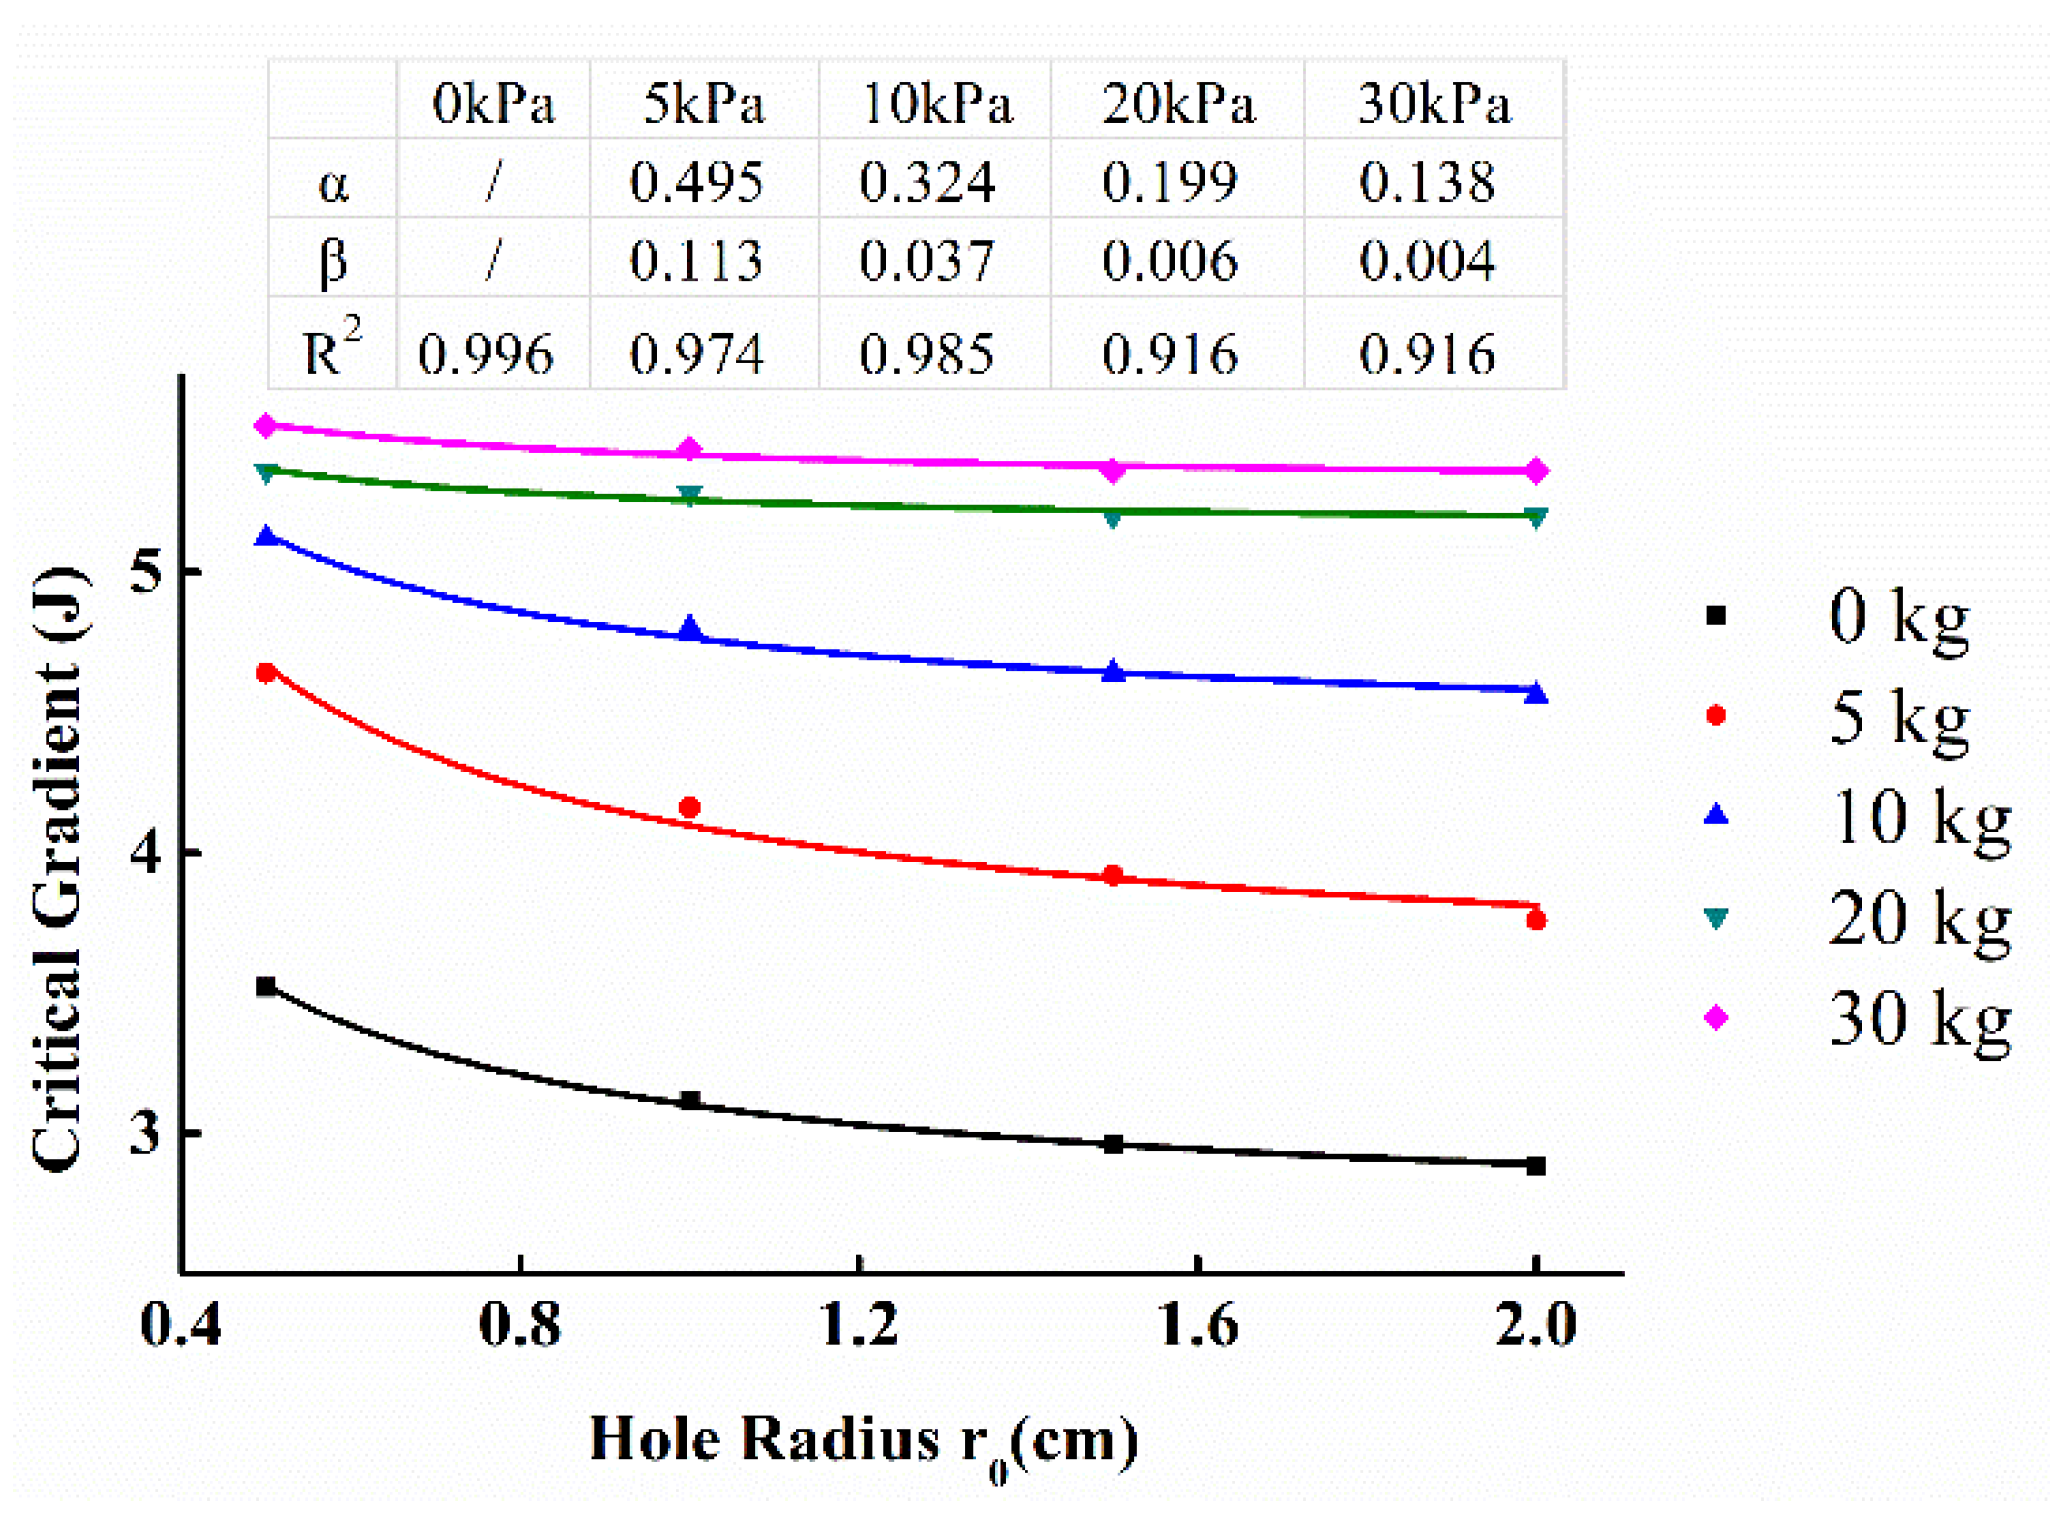
The final gradient in the PF stage is taken as the critical gradient of seepage failure, and a summary of the critical gradients for the different conditions is presented in Table 3.
Figure 10 shows the fitting results of the critical hydraulic gradient obtained from the tests and theoretical model (Equation (13)). Discrete points represent the test data and the solid lines represent the model-fitting curves. The alpha, beta, and coefficient of determination (R2) of each curve are also placed in the picture The coefficient of determination (R2) indicates that the theoretical model is in good agreement with the experimental results.
The test results show that the critical gradient decreases as the radius of the hole increases. However, the critical gradient is still higher than that of sand without the protection of the geotextile when the hole reaches the maximum test value. The critical gradient of sand increases significantly with increasing overburden load when the radius of the hole remains the same.
5. Discussion
5.1. Effect of the Overburden Load
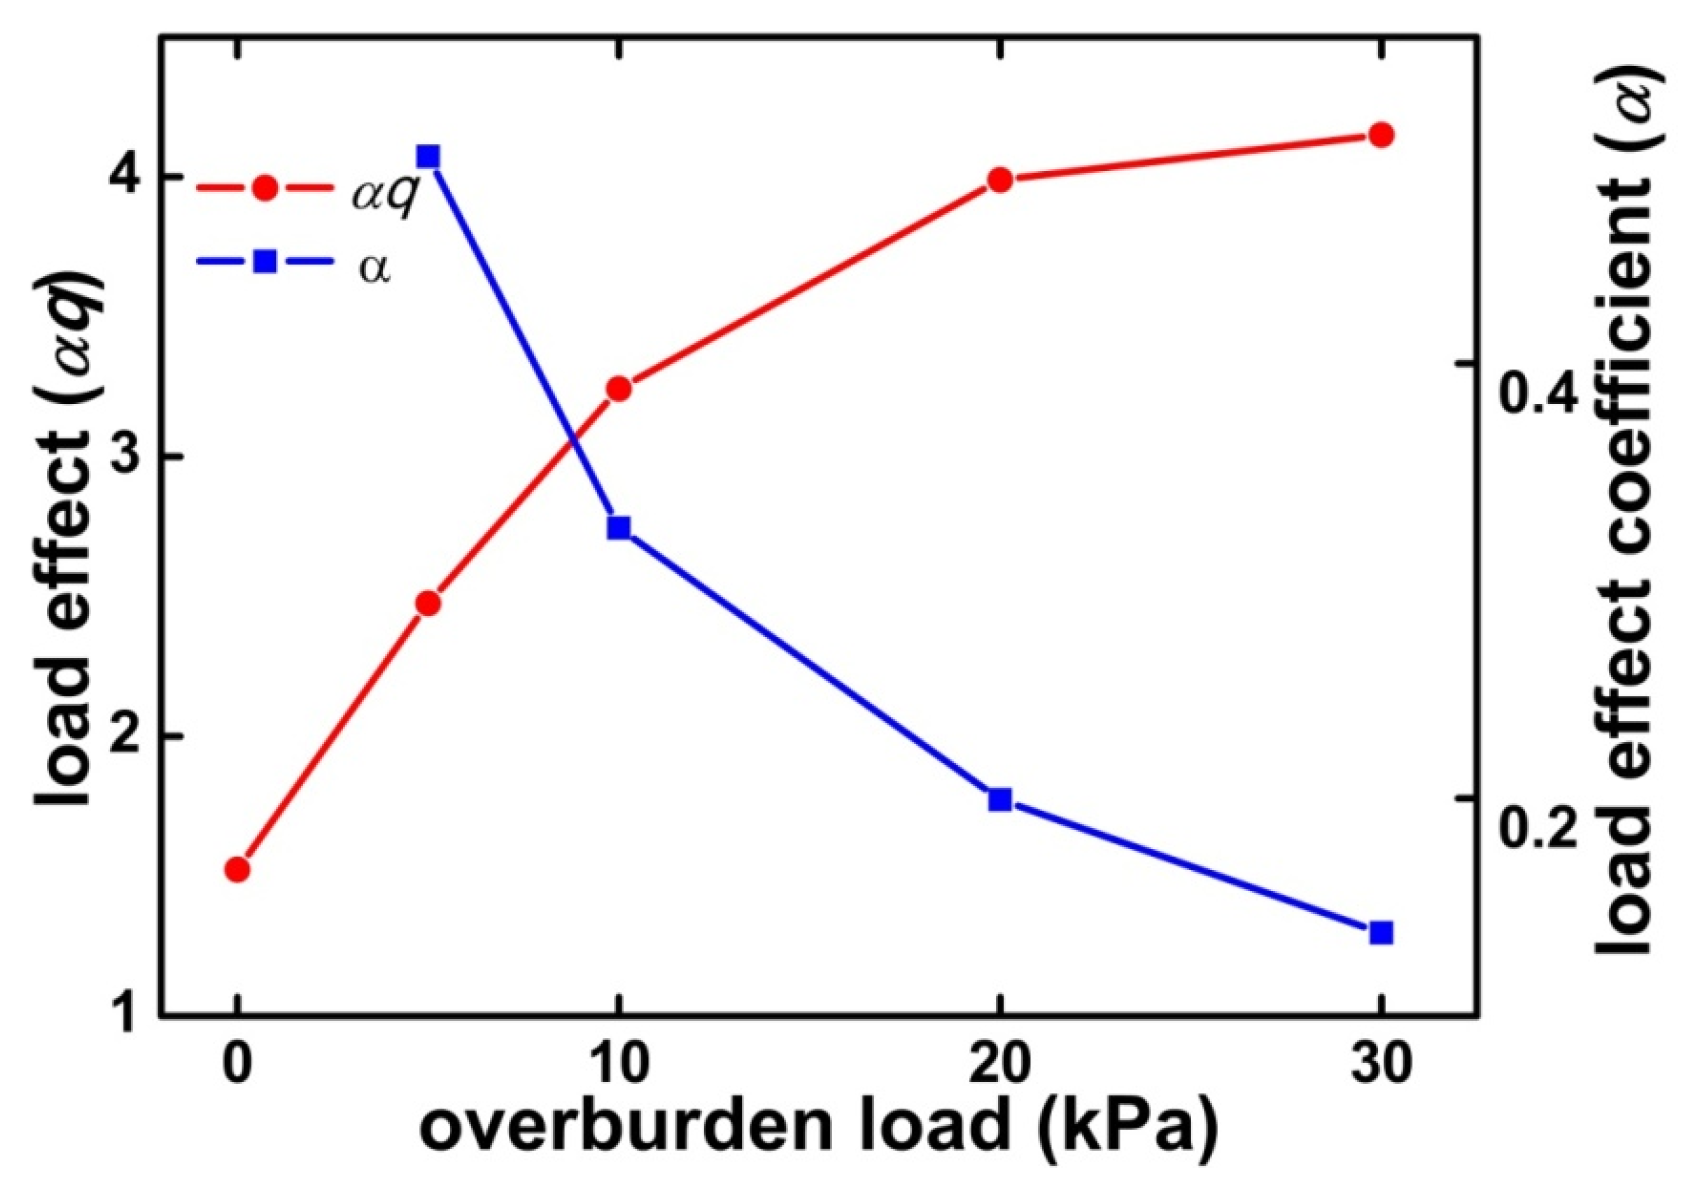
Figure 11 shows the effect of the overburden load αq and the effect coefficient α along with the overburden load based on the fitting function. When no overburden load is applied, α in Equation (13) can be considered meaningless. When an additional load is applied to the sand sample, as the load increases, the load effect coefficient α decreases gradually, which implies that the effect of the overburden load does not increase linearly with the increase in overburden load. When the overburden load increased beyond what is needed to confine the soil particles against the water drag force, the effect of overburden load on the soil–geotextile interface will be limited, which is basically consistent with the results of erosion under the action of cyclic waves [24]. Furthermore, this research regards that the increase in load increases the deviatoric stress of soil near the hole, which affects the seepage failure strength of sand. This view has been confirmed by Liang et al. [22]. The authors also believe that the sand particles washed out in the hole affect the transfer of the overburden load. The higher the overburden load, the higher the critical gradient. Accordingly, the more sand particles wash out before seepage failure, the greater the overburden load loss during transmission.
When no overburden load is applied, the load effect value αq is not 0. This effect contributed to the reaction force exerted by the geotextile due to the expansion and deformation of the sand body (Figure 9b). As the overburden load increases, the overburden load effect value αq increases gradually, which implies that the critical gradient increases with the overburden load. This phenomenon occurs because the overburden load can effectively improve the vertical effective stress and friction between the particles. However, since the changing trend of α is decreasing, the rate of ascent of αq gradually decreases. This means that the value of the critical gradient does not increase indefinitely with the increase of the overburden load.
5.2. Effect of the Hole
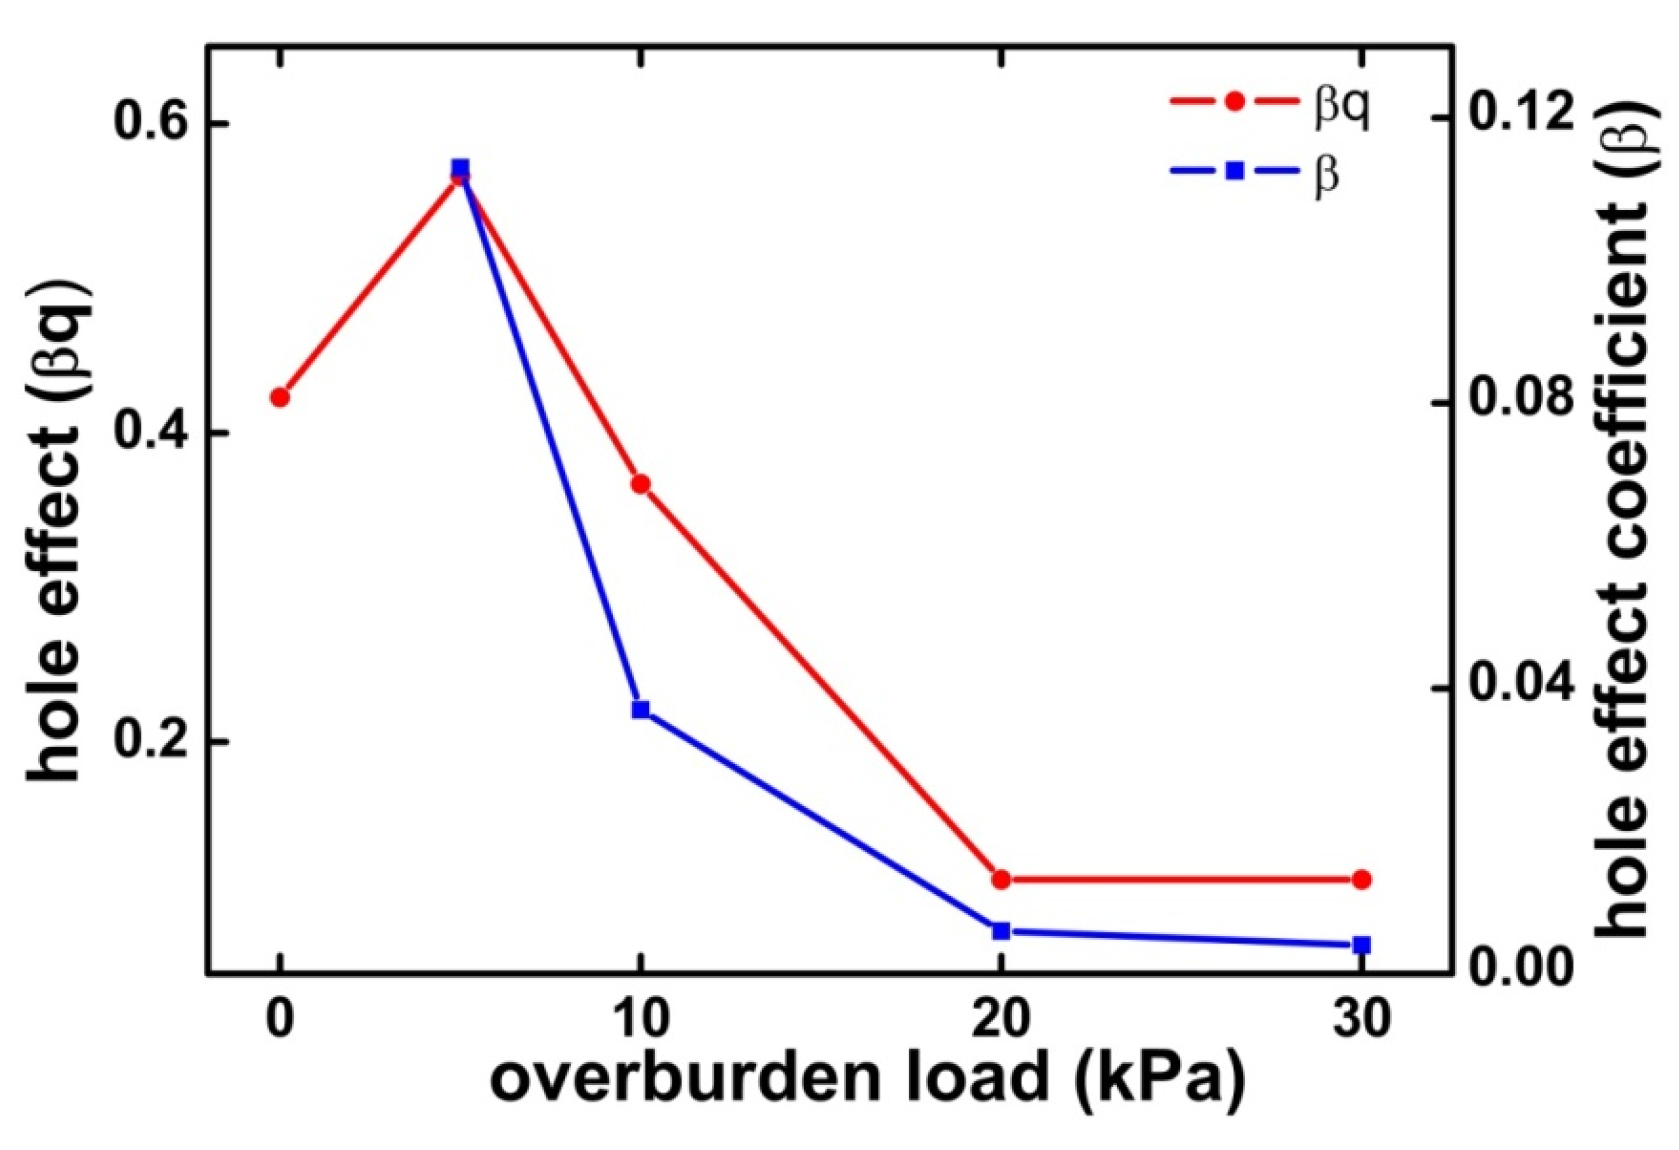
Figure 12 shows the effect of the hole βq and the effect coefficient β against the overburden load based on the fitting function. When the overburden load increases from 5 kPa to 30 kPa, the effect coefficient β decreases gradually. Thus, the critical gradient difference caused by the radius of the hole gradually decreases with the increase in the overburden load. This can be explained by the theoretical model. The loose sand body volume in the upper part under the hole decreases with increasing overburden load, and the thickness of t1 in the theoretical model decreases, the increase in overburden load further increases the critical gradient difference between the upper and lower sand body parts. Combined with Equations (8) and (12), it can be found that, with the increase in overburden load, the overall anti-seepage strength of the sand sample is more affected by the compacted sand body of the lower part.
When the overburden load increases from 5 to 20 kPa, the value of βq decreases owing to the drastic change in β. However, when the overburden load increases from 20 kPa to 30 kPa, there is no change in the value of βq. This result indicates that the degree of decrease in the critical gradient with increasing radius decreases slowly until reaching a constant value. This conclusion is similar to previous studies [24]. The reasons are as follows: as long as the hole is present, the overburden load on the sand top in the hole is zero, regardless of how much pressure is exerted around the hole. Accordingly, neither the thickness t1 nor the critical gradient J1 of the upper sand part can be reduced to zero with the increase in overburden load. That is, the specific conditions of the theoretical model (Equation (8)) can always be satisfied.
When the overburden load is zero, the hole effect value βq is smaller in comparison to when the overburden load is 5 kPa. This result is obtained because, although the geotextile exerts a downward reaction pressure on the sand, the geotextile around the hole has bulged to form an arc in this case. The reaction pressure is not a rigorous uniform distribution force, and it is far lower than the additional overburden load (as shown in Figure 9b).
6. Conclusions
Considering the effect of the overburden load and the radius of the hole, the results of the mathematical model and laboratory test were carried out to study the seepage failure mechanisms of the soil–geotextile filtration structure when geotextile specimens were precut with O-shaped hole, the following conclusions can be drawn:
The erosion process inside the damaged tube, which is different and more complex than that without a protected layer, is divided into four stages: SS, SP, PF, and CF. (1) In the SS stage, seepage erosion is negligible, and specimen deformation is not visible. (2) In the SP stage, some particles in the upper part of the sample slowly wash out through the hole. The sand washed out comes not only from the vertical lower part of the hole but also from the lower part around the damaged area. (3) In the PF stage, preferential flow formation and development are observed, accompanied by specimen deformation, as many particles wash out. (4) In the CF stage, complete seepage failure occurs instantly due to the loss of the vertical stress exerted by the geotextile because the excessive amount of sand in the top part is released. Thus, once the sand in the tube loses contact with the geotextile surrounding the sand, the sand erosion rate increases rapidly.
The complete failure gradient is considered to be a critical gradient. The critical gradients obtained from the different experimental conditions were fitted with the theoretical model. The consistency between the mathematical model and test results shows that the model has high reliability and practical value. The combination of the physical test and the mathematical model can provide a better understanding of the performance of damaged geotextile tubes. These findings can provide ideas and suggestions for solving the problem of geotextile damage during the construction of a geotextile tube dam.
The geotextile damage at the joints has an important effect on the filtration behavior of the geotextile tube under seepage erosion. The seepage failure strength of sand in damaged tubes is positively correlated with the overburden load and negatively correlated with the radius of the hole. However, as the overburden load increases, the strength difference caused by the radius of the hole gradually decreases, and the growth in the strength gradually slows. That is, even for the tubes at the bottom of the dam, whose upper tubes are equivalent to the overburden load, the seepage failure strength of the internal sand is not infinite. Therefore, a hole of any size in a geotextile tube cannot be completely ignored.
Author Contributions
Conceptualization, Y.S.; methodology, W.M.; validation, W.M.; formal analysis and investigation, W.M. and T.W.; resources, Y.S.; writing—review and editing, W.M.; project administration, T.W.; funding acquisition, W.M. and T.W. All authors have read and agreed to the published version of the manuscript.
Funding
This research was funded by the Natural Science Foundation for Colleges and Universities of Jiangsu Province (Grant NO. 22KJB570006, 17KJD570001) and the Science and Technology Innovation Fund of Jiangsu Maritime Institute (Grant NO. 2021BSJJ01, kjcx2020-4).
Institutional Review Board Statement
Not applicable.
Informed Consent Statement
Not applicable.
Acknowledgments
The authors are grateful to Ke Gu, Yun-Feng Liu, Xing Cheng, and Zhen Zhang, former or current students of Hohai University, and several colleagues at the Jiangsu Maritime Institute for their great help in this study. The authors also appreciate the reviewers’ excellent comments and constructive suggestions for the study.
Conflicts of Interest
The authors declare no conflict of interest.
References
- Guo, W.; Chu, J.; Nie, W. Analysis of geosynthetic tubes inflated by liquid and consolidated soil. Geotext. Geomembr. 2014, 42, 277–283. [Google Scholar] [CrossRef]
- Kiran, A.S. Stability of Upper Geotextile Tube in a Stacked Formation Under Wave Loading. Int. J. Geosynth. Ground Eng. 2022, 8, 32. [Google Scholar] [CrossRef]
- Kim, H.-J.; Won, M.-S.; Jamin, J.C. Finite-element analysis on the stability of geotextile tube–reinforced embankments under scouring. Int. J. Geomech. 2015, 15, 06014019. [Google Scholar] [CrossRef]
- Chang, Y.; Chu, K.-W.; Chuang, L.Z.-H. Sustainable coastal zone planning based on historical coastline changes: A model from case study in Tainan, Taiwan. Landsc. Urban Plan. 2018, 174, 24–32. [Google Scholar] [CrossRef]
- Yang, Y.; Wei, Z.; Cao, G.; Yang, Y.; Wang, H.; Zhuang, S.; Lu, T. A case study on utilizing geotextile tubes for tailings dams construction in China. Geotext. Geomembr. 2019, 47, 187–192. [Google Scholar] [CrossRef]
- Carlos, D.; Carneiro, J.R.; Pinho-Lopes, M.; Lopes, M. Effect of soil grain size distribution on the mechanical damage of nonwoven geotextiles under repeated loading. Int. J. Geosynth. Ground Eng. 2015, 1, 9. [Google Scholar] [CrossRef] [Green Version]
- Lopes, M.; Paula, A.M. Long-term response and design of two geosynthetics: Effect of field installation damage. Geosynth. Int. 2018, 25, 98–117. [Google Scholar] [CrossRef]
- Huang, C.-C. Comparative study on performance and index tests simulating abrasion damage of a woven geotextile. Geosynth. Int. 2008, 15, 358–368. [Google Scholar] [CrossRef]
- Lu, Z.-M.; Wu, C.-E. Key techniques and practices of dyke engineering design of qingcaosha reservoir. Yangtze River 2013, 44, 28–32. (In Chinese) [Google Scholar] [CrossRef]
- Lv, Z.J. Application of technology of geotextile tubes in Sizhaopu reclamation project. Zhejiang Hydrotech. 2002, 4, 27–30. (In Chinese) [Google Scholar] [CrossRef]
- Huang, C.-C.; Tzeng, Y.-S. Abrasion damage of a woven geotextile due to various gravelly flows. Geosynth. Int. 2007, 14, 277–286. [Google Scholar] [CrossRef]
- Huang, C.; Tzeng, Y.; Liao, C. Laboratory tests for simulating abrasion damage of a woven geotextile. Geotext. Geomembr. 2007, 25, 293–301. [Google Scholar] [CrossRef]
- Pinho-Lopes, M.; Lopes, M.D.L. Influence of mechanical damage induced in laboratory on the soil-geosynthetic interaction in inclined-plane shear. Constr. Build. Mater. 2018, 185, 468–480. [Google Scholar] [CrossRef] [Green Version]
- Rosete, A.; Lopes, P.M.; Pinho-Lopes, M. Tensile and hydraulic properties of geosynthetics after mechanical damage and abrasion laboratory tests. Geosynth. Int. 2013, 20, 358–374. [Google Scholar] [CrossRef] [Green Version]
- Cheah, C.; Gallage, C.; Dawes, L.; Kendall, P. Measuring hydraulic properties of geotextiles after installation damage. Geotext. Geomembr. 2017, 45, 462–470. [Google Scholar] [CrossRef] [Green Version]
- Miszkowska, A.; Lenart, S.; Koda, E. Changes of Permeability of Nonwoven Geotextiles due to Clogging and Cyclic Water Flow in Laboratory Conditions. Water 2017, 9, 660. [Google Scholar] [CrossRef]
- Shao, J.; Zhang, Q.; Wu, X.; Lei, Y.; Wu, X.; Wang, Z. Investigation on the Water Flow Evolution in a Filled Fracture under Seepage-Induced Erosion. Water 2020, 12, 3188. [Google Scholar] [CrossRef]
- Huang, Z.; Bai, Y.; Xu, H.; Cao, Y.; Hu, X. A Theoretical Model to Predict the Critical Hydraulic Gradient for Soil Particle Movement under Two-Dimensional Seepage Flow. Water 2017, 9, 828. [Google Scholar] [CrossRef] [Green Version]
- Tomlinson, S.S.; Vaid, Y.P. Seepage forces and confining pressure effects on piping erosion. Can. Geotech. J. 2000, 37, 1–13. [Google Scholar] [CrossRef]
- Suits, L.D.; Sheahan, T.C.; Chang, D.S.; Zhang, L.M. A stress-controlled erosion apparatus for studying internal erosion in soils. Geotech. Test. J. 2011, 34, 579–589. [Google Scholar] [CrossRef]
- Wang, S.; Chen, J.-S.; Luo, Y.-L.; Sheng, J.-C. Experiments on internal erosion in sandy gravel foundations containing a suspended cutoff wall under complex stress states. Nat. Hazards 2014, 74, 1163–1178. [Google Scholar] [CrossRef]
- Liang, Y.; Yeh, T.-C.J.; Wang, J.; Liu, M.; Zha, Y.; Hao, Y. Onset of suffusion in upward seepage under isotropic and anisotropic stress conditions. Eur. J. Environ. Civ. Eng. 2017, 23, 1520–1534. [Google Scholar] [CrossRef]
- Robbins, B.A.; Stephens, I.J.; Leavell, D.A.; Lopez-Soto, J.; Montalvo-Bartolomei, A.M. Laboratory piping tests on fine gravel. Can. Geotech. J. 2018, 55, 1552–1563. [Google Scholar] [CrossRef]
- Chew, S.H.; Tian, H.; Tan, S.A.; Karunaratne, G.P. Erosion stability of punctured geotextile filters subjected to cyclic wave loadings—A laboratory study. Geotext. Geomembr. 2003, 21, 221–239. [Google Scholar] [CrossRef]
- Bolt, A.F.; Sterpejkowicz-Wersocki, W. Test of Soil-Geotextile System under Changable Hydrclic Head Conditions; ICGGE: Bombay, India, 2004. [Google Scholar]
- Terzaghi, K. Theoretical Soil Mechanics; Wiley and Sons, Inc.: New York, NY, USA, 1943. [Google Scholar]
- Israr, J.; Indraratna, B. Study of critical hydraulic gradients for seepage-induced failures in granular soils. J. Geotech. Geoenviron. Eng. 2019, 145, 04019025. [Google Scholar] [CrossRef]
- Chang, K.-T.; Lee, K.Z.-Z.; Wu, H.-Y. Internal Erosion Failure of Uniform Sands under Confinement and Constricted Seepage Exit. Water 2020, 12, 2417. [Google Scholar] [CrossRef]
- Finno, R.J.; Zhang, Y.; Buscarnera, G. Experimental validation of terzaghi’s effective stress principle for gassy sand. J. Geotech. Geoenviron. Eng. 2017, 143, 04017092. [Google Scholar] [CrossRef]
- Wang, J.; Liu, X.; Xiang, J.; Jiang, Y.; Feng, B. Laboratory model tests on water inrush in foundation pit bottom. Environ. Earth Sci. 2016, 75, 1072. [Google Scholar] [CrossRef]
- Chang, D.S.; Zhang, L.M. Critical hydraulic gradients of internal erosion under complex stress states. J. Geotech. Geoenviron. Eng. 2013, 139, 1454–1467. [Google Scholar] [CrossRef]
- Xie, Q.; Liu, J.; Han, B.; Li, H.; Li, Y.; Li, X. Critical hydraulic gradient of internal erosion at the soil-structure interface. Fluid Flow Fract. Porous Media 2018, 6, 92. [Google Scholar] [CrossRef]
- Indraratna, B.; Radampola, S. Analysis of Critical Hydraulic Gradient for Particle Movement in Filtration. J. Geotech. Geoenviron. Eng. 2002, 4, 128. [Google Scholar] [CrossRef]
- Allaire, S.E.; Roulier, S.; Cessna, A.J. Quantifying preferential flow in soils: A review of different techniques. J. Hydrol. 2009, 378, 179–204. [Google Scholar] [CrossRef]
- Lu, D.; Wang, H.; Geng, N.; Xia, Y.; Xu, C.; Hua, E. Imaging and characterization of the preferential flow process in agricultural land by using electrical resistivity tomography and dual-porosity model. Ecol. Indic. 2022, 134, 108498. [Google Scholar] [CrossRef]
- Parekh, M.L.; Kanning, W.; Bocovich, C.; Mooney, M.A.; Koelewijn, A.R. Backward erosion monitored by spatial-temporal pore pressure changes during field experiments. J. Geotech. Geoenviron. Eng. 2016, 142, 04016050. [Google Scholar] [CrossRef]
- Shao, W.; Bogaard, T.; Bakker, M.; Berti, M. The influence of preferential flow on pressure propagation and landslide triggering of the Rocca Pitigliana landslide. J. Hydrol. 2016, 543, 360–372. [Google Scholar] [CrossRef]
- Zhu, X.; Peng, J.; Jiang, C.; Guo, W. A Preliminary Study of the Failure Modes and Process of Landslide Dams Due to Upstream Flow. Water 2019, 11, 1115. [Google Scholar] [CrossRef] [Green Version]
- Zhou, H.X.; Cao, H.; Zhang, W. Experimental studies on seepage failure of the top stratum at a weak spot in double-layer dike foundations. Adv. Mater. Res. 2011, 368, 2387–2393. [Google Scholar] [CrossRef]
Figure 1.
(a) field photo and (b) simplified diagram, geotextile tubes collapse and joint seams between tubes.
Figure 1.
(a) field photo and (b) simplified diagram, geotextile tubes collapse and joint seams between tubes.

Figure 2.
Calculation diagram of the vertical stress exerted by a uniformly distributed load.

Figure 3.
Distribution contours of the additional vertical stress relative to near the damaged hole.
Figure 3.
Distribution contours of the additional vertical stress relative to near the damaged hole.

Figure 4.
Schematic illustration of the piezometric head and critical gradient.

Figure 5.
Schematic illustration of testing apparatus.

Figure 6.
Particle-size distribution of the tested sand.

Figure 7.
Seepage rate versus water head difference. (a) seepage rate under different hole radii and (b) seepage rate under different loads.
Figure 7.
Seepage rate versus water head difference. (a) seepage rate under different hole radii and (b) seepage rate under different loads.

Figure 8.
Pore-water pressure versus time.

Figure 9.
Images of the four seepage erosion stages (q = 0 kPa, r0 = 1.0 cm). (a) Seepage stability stage (SS), (b) sand particle wash-out stage (SP), (c) preferential flow formation and development stage (PF), and (d)complete failure stage (CF).
Figure 9.
Images of the four seepage erosion stages (q = 0 kPa, r0 = 1.0 cm). (a) Seepage stability stage (SS), (b) sand particle wash-out stage (SP), (c) preferential flow formation and development stage (PF), and (d)complete failure stage (CF).


Figure 10.
Fitting results of the theoretical model and experimental data.

Figure 11.
Plot of the overburden load effect and effect coefficient versus overburden load.

Figure 12.
Plot of the damaged hole effect and effect coefficient versus overburden load.


Table 1.
Geotextile properties.
| Geotextile Type | Ma | Tgt | kn | n | O90 | Ts | εu | Tc |
|---|---|---|---|---|---|---|---|---|
| Woven polypropylene | 170 | 0.68 | 6.7 × 10⁻³ | 85 | 0.12 | 75 × 75 | 17.8 × 17.8 | 3.4 |
Notes: Ma = mass per unit area (g/m2); Tgt = thickness (mm); kn = hydraulic conductivity normal to the geotextile plane (cm/s) (ASTM D4491); n = porosity (%); O90 = characteristic opening size (mm) (ASTM D4751); Ts = tensile strength (kN/m) (ASTM D4595); εu = ultimate elongation at maximum load (%) (ASTM D4595); and Tc = static puncture strength (kN).
Table 2.
Properties of the tested sand.
| Soil Type | Cu | Cc | Gs | k | e0 | φ | Jt |
|---|---|---|---|---|---|---|---|
| Quartz sand | 2.6 | 1.1 | 2.65 | 3.5 × 10⁻³ | 42.8 | 30° | 1.155 |
Notes: Cu = uniformity coefficient; Cc = curvature coefficient; Gs = specific gravity (g/cm3); k = hydraulic conductivity (cm/s); e0 = void ratio (%); φ = angle of internal friction; and Jt = Terzaghi theoretical critical gradient.
Table 3.
The critical gradient of each group.
| Load (kPa) | 0 | 5 | 10 | 20 | 30 | |
|---|---|---|---|---|---|---|
| Radius (cm) | ||||||
| 0.5 | 3.52 | 4.64 | 5.12 | 5.36 | 5.52 | |
| 1 | 3.12 | 4.16 | 4.8 | 5.28 | 5.44 | |
| 1.5 | 2.96 | 3.92 | 4.64 | 5.2 | 5.36 | |
| 2 | 2.88 | 3.76 | 4.56 | 5.2 | 5.36 | |
Publisher’s Note: MDPI stays neutral with regard to jurisdictional claims in published maps and institutional affiliations. |
© 2022 by the authors. Licensee MDPI, Basel, Switzerland. This article is an open access article distributed under the terms and conditions of the Creative Commons Attribution (CC BY) license (https://creativecommons.org/licenses/by/4.0/).
Share and Cite
MDPI and ACS Style
Mao, W.; Wang, T.; Shu, Y. Model and Experimental Studies of the Seepage Failure of Damaged Geotextile at the Joint between Tubes in a Geotextile Tube Dam. Water 2022, 14, 3934. https://doi.org/10.3390/w14233934
AMA Style
Mao W, Wang T, Shu Y. Model and Experimental Studies of the Seepage Failure of Damaged Geotextile at the Joint between Tubes in a Geotextile Tube Dam. Water. 2022; 14(23):3934. https://doi.org/10.3390/w14233934
Chicago/Turabian StyleMao, Wenlong, Tianwen Wang, and Yiming Shu. 2022. "Model and Experimental Studies of the Seepage Failure of Damaged Geotextile at the Joint between Tubes in a Geotextile Tube Dam" Water 14, no. 23: 3934. https://doi.org/10.3390/w14233934
Note that from the first issue of 2016, this journal uses article numbers instead of page numbers. See further details here.