Article

A Comparison Study on Defluoridation Capabilities Using Syzygium cumini and Psidium guajava: Process Optimization, Isotherm, Kinetic, Reusability Studies

by
Malihe Qazi
1,2,
Hamze Ali Jamali
1,3,
Reza Darvishi Cheshmeh Soltani
4,
Mahmoud Nasr
5,6,
Adel Kamyab Rudsari
1,2 and
Reza Ghanbari
1,7,*
1
Department of Environmental Health Engineering, School of Health, Qazvin University of Medical Sciences, Qazvin 34199-15315, Iran
2
Student Research Committee, School of Health, Qazvin University of Medical Sciences, Qazvin 34199-15315, Iran
3
Social Determinants of Health Research Center, Research Institute for Prevention of Non-Communicable Diseases, Qazvin University of Medical Sciences, Qazvin 34199-15315, Iran
4
Department of Environmental Health Engineering, School of Health, Arak University of Medical Sciences, Arak 38196-93345, Iran
5
Environmental Engineering Department, Egypt-Japan University of Science and Technology (E-JUST), New Borg El-Arab City, Alexandria 21934, Egypt
6
Sanitary Engineering Department, Faculty of Engineering, Alexandria University, Alexandria 21526, Egypt
7
Health Products Safety Research Center, Qazvin University of Medical Sciences, Qazvin 34199-15315, Iran
*
Author to whom correspondence should be addressed.
Water 2022, 14(23), 3939; https://doi.org/10.3390/w14233939
Submission received: 28 October 2022 / Revised: 25 November 2022 / Accepted: 27 November 2022 / Published: 3 December 2022
(This article belongs to the Special Issue Advances in Management of Solid Waste and Wastewater Treatment)

Abstract

:
For the first time, this work conducted a comparison of two indigenous plants in Iran, namely, Syzygium cumini and Psidium guajava, which were prepared as low-cost adsorbents to remove fluoride contamination from aqueous solution. The results revealed the nonlinearity of the interactive effects and showed that the pH and adsorbent dosage were the most influential factors during fluoride adsorption. The results of characterization exhibited a mesoporous structure of prepared biosorbents; therefore, the adsorption process may involve multiple functional groups, resulting in electrostatic attraction and hydrogen binding between fluoride ions and the biosorbents. In the case of Syzygium cumini, the maximum removal efficiency of 72.5% was obtained under optimum experimental conditions (Co = 6 mg/L, pH = 5, adsorbent dose = 8 g/L, and contact time = 75 min). For the Psidium guajava, the maximum removal efficiency of 88.3% was achieved at a Co of 6 mg/L, adsorbent dose of 6 g/L, initial pH of 5.1, and a contact time of 90 min. Moreover, four consecutive adsorption/desorption cycles with the chemical agent of NaOH solution (0.1 mol/L) showed excellent reusability of the biosorbents. The adsorption isotherm fitted better to the Langmuir model and the kinetic data best accorded with the pseudo-second-order kinetic model for both biosorbents, expressing a monolayer chemisorption process with recorded maximum adsorption capacities of 1.14 and 1.50 mg/g for Syzygium cumini and Psidium guajava, respectively. Therefore, given their removal capacity and potential utility, the prepared biomass could be effective reusable biosorbents to treat water contaminated with fluoride.

1. Introduction

Among various drinking water resources in developing countries, groundwater reserves are an economical source of drinking water. The presence of excess fluoride in drinking water has been engaging the researchers’ attention over the past years, mainly because it could have long-term negative impacts on human health [1]. Water, groundwater, and wastewater are all commonly contaminated with fluoride, which is an abundant and persistent anion. The fluoride element is corrosive and toxic with the oxidation state of −1, which is not found in nature as an element since it is highly reactive [2].
Fluoride contamination occurs in groundwater as a result of both geological processes of fluoride-bearing minerals and effluents discharged from industries such as pesticide, semiconductor, and electroplating plants [3]. Fluoride ion is considered an essential micronutrient for human beings at low concentrations (in the range of 0.5 to 1.5 mg/L) according to the World Health Organization (WHO) recommendation, having a profound impact on the development of strong bones and optimal dental health. However, prolonged exposure to high levels of F could adversely affect public health, triggering a range of conditions from mild dental fluorosis to debilitating skeletal fluorosis, brain damage, and thyroid disorders [4]. Therefore, the WHO has proposed a fluoride concentration of 1.5 mg/L in drinking water as the maximum permissible level [5]. According to studies, almost 90% of fluoride intake is from drinking water, whereas about 30–60% is absorbed through food [6]. Excessive contamination of F up to 30 mg/L was reported in many developed and developing countries, including various regions in the United States, North Africa, Mexico, and Asia [7]. Moreover, the presence of fluoride ions poses a threat to more than 260 million people around the world [8].
In order to remove excess fluoride content from aqueous medium, a variety of techniques have been used, including ion exchange [9], electro-coagulation [10], adsorption [2], and membrane-filtration [11]. Among such fluoride removal processes, the adsorption process has been found an attractive treatment technique, due to simple design, less sludge production, and cost-efficiency [12]. Various non conventional biomass materials such as activated carbon and activated alumina are notable for their low cost and great efficiency as alternatives to conventional adsorbents [13]. In recent years, there has been an increasing interest in searching for new and economic adsorbents for fluoride removal, including orange waste [14], tea waste [15], rice husk biochar [16], seed biochar [17], leaf ash [18], and leaf powder [19]. Moreover, some characteristics of bioinspired biomass such as carboxylic acid, hydroxyl, carbonyl and amine functional groups make it a promising, low-cost alternative to conventional absorbents with a high-efficiency process, especially in rural small-scale systems and small communities [20,21].
Considering the above-mentioned advantages and the presence of indigenous abundant biological biomass, this study was performed for the first time to assess fluoride removal using Syzygium cumini (SC) and Psidium guajava (PG) leaves, commonly known as jamun and guava, respectively. Developing this leaf powder provides a green and low-cost novel biosorbent to explore the practical application for fluoride biosorption. These worldwide plants whose usage as a biosorbent has shown great adsorption capacity are native to India and are found in the south of Iran. Response surface methodology (RSM) based on central composite design (CCD) was used to evaluate the adsorption process of fluoride and predict the optimum operation parameters. The properties of prepared biosorbents were evaluated by using techniques such as scanning electron microscopy (SEM), Brunauer–Emmett–Teller (BET), and Fourier-transform infrared (FTIR) spectrometry. Furthermore, studies on kinetic and isotherms were carried out and the adsorptive capacity of both biosorbents was compared with other biosorbents.

2. Materials and Methods

2.1. Materials

Mature jamun and guava leaves were obtained from a farmers’ market located in the city of Minab, Hormozgan, Iran. The standard fluoride stock solution at a concentration of 100 mg/L was prepared in 1000 mL of distilled water by dissolving 0.221 g NaF (Merck, Germany) and diluted subsequently to prepare required F concentrations just before use. All the reagents were of analytical quality and were used directly with no additional purification. NaOH and HCL 0.1 N were used for the pH adjustment of the solutions.

2.2. Adsorbents Preparation

The obtained SC and PG leaves were transferred to the laboratory and washed thoroughly with distilled water several times for the removal of any color and soluble substances (or other impurities that could have adhered to the plant surface). The leaves were placed at room temperature and sun-dried for one week and then heated in an oven at 60 °C for 12 h. Finally, dried biomass was crushed to obtain particle sizes of 500–710 microns [22]. The sieved powder was kept in a plastic container for upcoming tests.

2.3. Adsorbents Characterization

Textural features of biosorbents were examined by N2 sorption–desorption isotherms via the Brunauer–Emmett–Teller (BET) equation at 77 K using a Belsorp mini II (BEL Japan Inc., Japan). The specific surface area and porosity distribution analysis of the biosorbents were carried out through the BET equation at the relative pressures of 0.01–0.5 and P/P0 = 0.99. The morphology and microstructure of the biomass were observed through scanning electron microscopy (SEM, Tescan VEGA-II, Czech Republic) at 15 kV accelerating voltage.
Surface chemical characterization was conducted on a Fourier-transform infrared (FTIR) spectrometer using the KBr method, Bomem MB-series, from 700–4000 cm−1 to clarify the adsorbents functional groups before and after F adsorption. The point of zero charge (pHPZC) of biosorbents at which the surface of the leaves was electrically neutral was investigated using a procedure known as the salt addition method [23]. Briefly, the process comprised of adding 50 mg of adsorbent to 50 mL of 0.01 M NaCl solution at 10 different initial pH (3–11) levels, under stirring at the rate of 100 rpm for 24 h. Recording and plotting a graph between the initial pH and final pH was done to calculate pHPZC, which is defined as the pH being constant regardless of the initial pH.

2.4. Adsorption Tests

F stock solution (100 mg/L) was used to prepare different concentrations of fluoride. Operating parameters of contact time (20–40–60–80–100 min), initial fluoride concentration (4–6–8–10–12 mg/L), pH (3–5–7–9–11), and biosorbent dosage (2–4–6–8–10 g/L) were selected according to the literature review and a set of pretests in order to specify their effects on the biosorption of F. A digital pH meter (Consort-C863, Belgium) was used to regulate the pH values of solutions after adding the 0.1 M NaOH or HCL solutions.
All the experiments were performed using batch flow mode reactors in duplicate by adding a certain amount of adsorbents in 50 mL F solution. At room temperature (25 ± 2 °C), the solutions were agitated on a shaker (model Pole Ideal Pars, Iran) for an assigned contact time at 120 rpm. The samples were taken out from batch reactors at regular intervals and solid particles of the biosorbents were separated via filtration (Whatman N.42). The residual F was measured by using the SPADNS method, applying a UV–Vis spectrophotometer (HACH DR 6000, Germany) at a wavelength of 580 nm [24]. The F removal efficiency (R%) and the adsorption capacity, (qt, mg/g) of SC and PG leaves were calculated according to Equations (1) and (2) [25], respectively:
R % = C 0 C e × 100 C 0
q t = C 0 C t m V
where C0, and Ce are the fluoride concentration at initial and equilibrium time, respectively, and Ct is the fluoride concentration at specified time (t). Moreover, V is the volume of fluoride solution (L) and m (g) is the weight of biosorbent.

2.5. Response Surface Methodological Optimization

RSM is used for designing and analyzing experiments whose results are based on an examination of several factors. It is an approach with significant features that provide the optimum conditions for a multifactor system [26]. The interaction between four independent variables (initial pH, adsorbent dose, contact time, initial fluoride concentration) were analyzed at five levels (−α, −1, 0, +1, +α) by applying 30 experimental runs using a standard RSM design based on CCD. Table 1 presents the process parameters with the specified levels. Finally, the experimental data were analyzed by Design Expert 11 software. The nonlinear regression model and reaction optimization between the dependent and independent parameters were determined using the quadratic equation, as presented in the following equation (Equation (3)) [2]:
y = a0 + ∑ai xi + ∑aii x2i + ∑aij xixj + ε
where y is the predicted response (removal efficiency) and x is the input variables. In addition, a0, ai, and ε denote the constant coefficient, respective coefficients, and error of model, respectively.

2.6. Equilibrium Model Fitting (Isotherms and Kinetics)

The data for the adsorption equilibrium was modeled using the Langmuir (Equation (4)) and Freundlich isotherm models (Equation (5)) in order to indicate the adsorbent/adsorbate interactions and the surface features of the adsorbent, which help to determine the adsorption mechanisms. The Langmuir model usually deduces that monolayer adsorption occurs on a surface with constant energy sites, whereas the Freundlich model declares that the multilayer adsorption process happens over a surface with energetically heterogeneous sites, as displayed in the following equations [27]:
C e Q e   =   C e q m   +   1 K L Q m
ln Q e   =   ln K F   +   1 n   ln c e
where Ce (mg/L) and Qe(mg/g) are the equilibrium solute concentration and the adsorption capacity at equilibrium, respectively, qm represents the maximum adsorption capacity corresponding to a complete monolayer, n is the Freundlich exponent and represents the adsorption intensity, and KL (L/mg) and KF (mg/g(L/mg)1/n) are the Langmuir and Freundlich adsorption coefficients, respectively.
For the study of isotherm modeling, the tests were carried out by agitating 50 mL-solution containing fluoride ions with different concentrations (3–20 mg/L) at equilibrium time and known optimum pH and adsorbent dosage for both biosorbents.
A kinetic study was also performed in order to identify the effect of contact time on adsorption as well as the possible mechanism. For this purpose, experiments were carried out by adjusting contact times between 5 and 90 min, while initial pH, adsorbent dose, and fluoride concentration were kept constant at optimum values. The experimental data was fitted by the pseudo-first-order (Equation (6)) and pseudo-second-order (Equation (7)) kinetic models, as given below [28]:
log ( Q e Q t ) = log Q e K 1 2.303 t
t Q t = t Q e + 1 K 2 Q e 2
where Qt and Qe (mg/g) are the absorbed amount of adsorbate at time t (min) and at equilibrium, respectively. Furthermore, K1 (1/min) and K2 (mg/g min) are the pseudo-first-order and pseudo-second-order equilibrium rate constants, respectively.

3. Results and Discussion

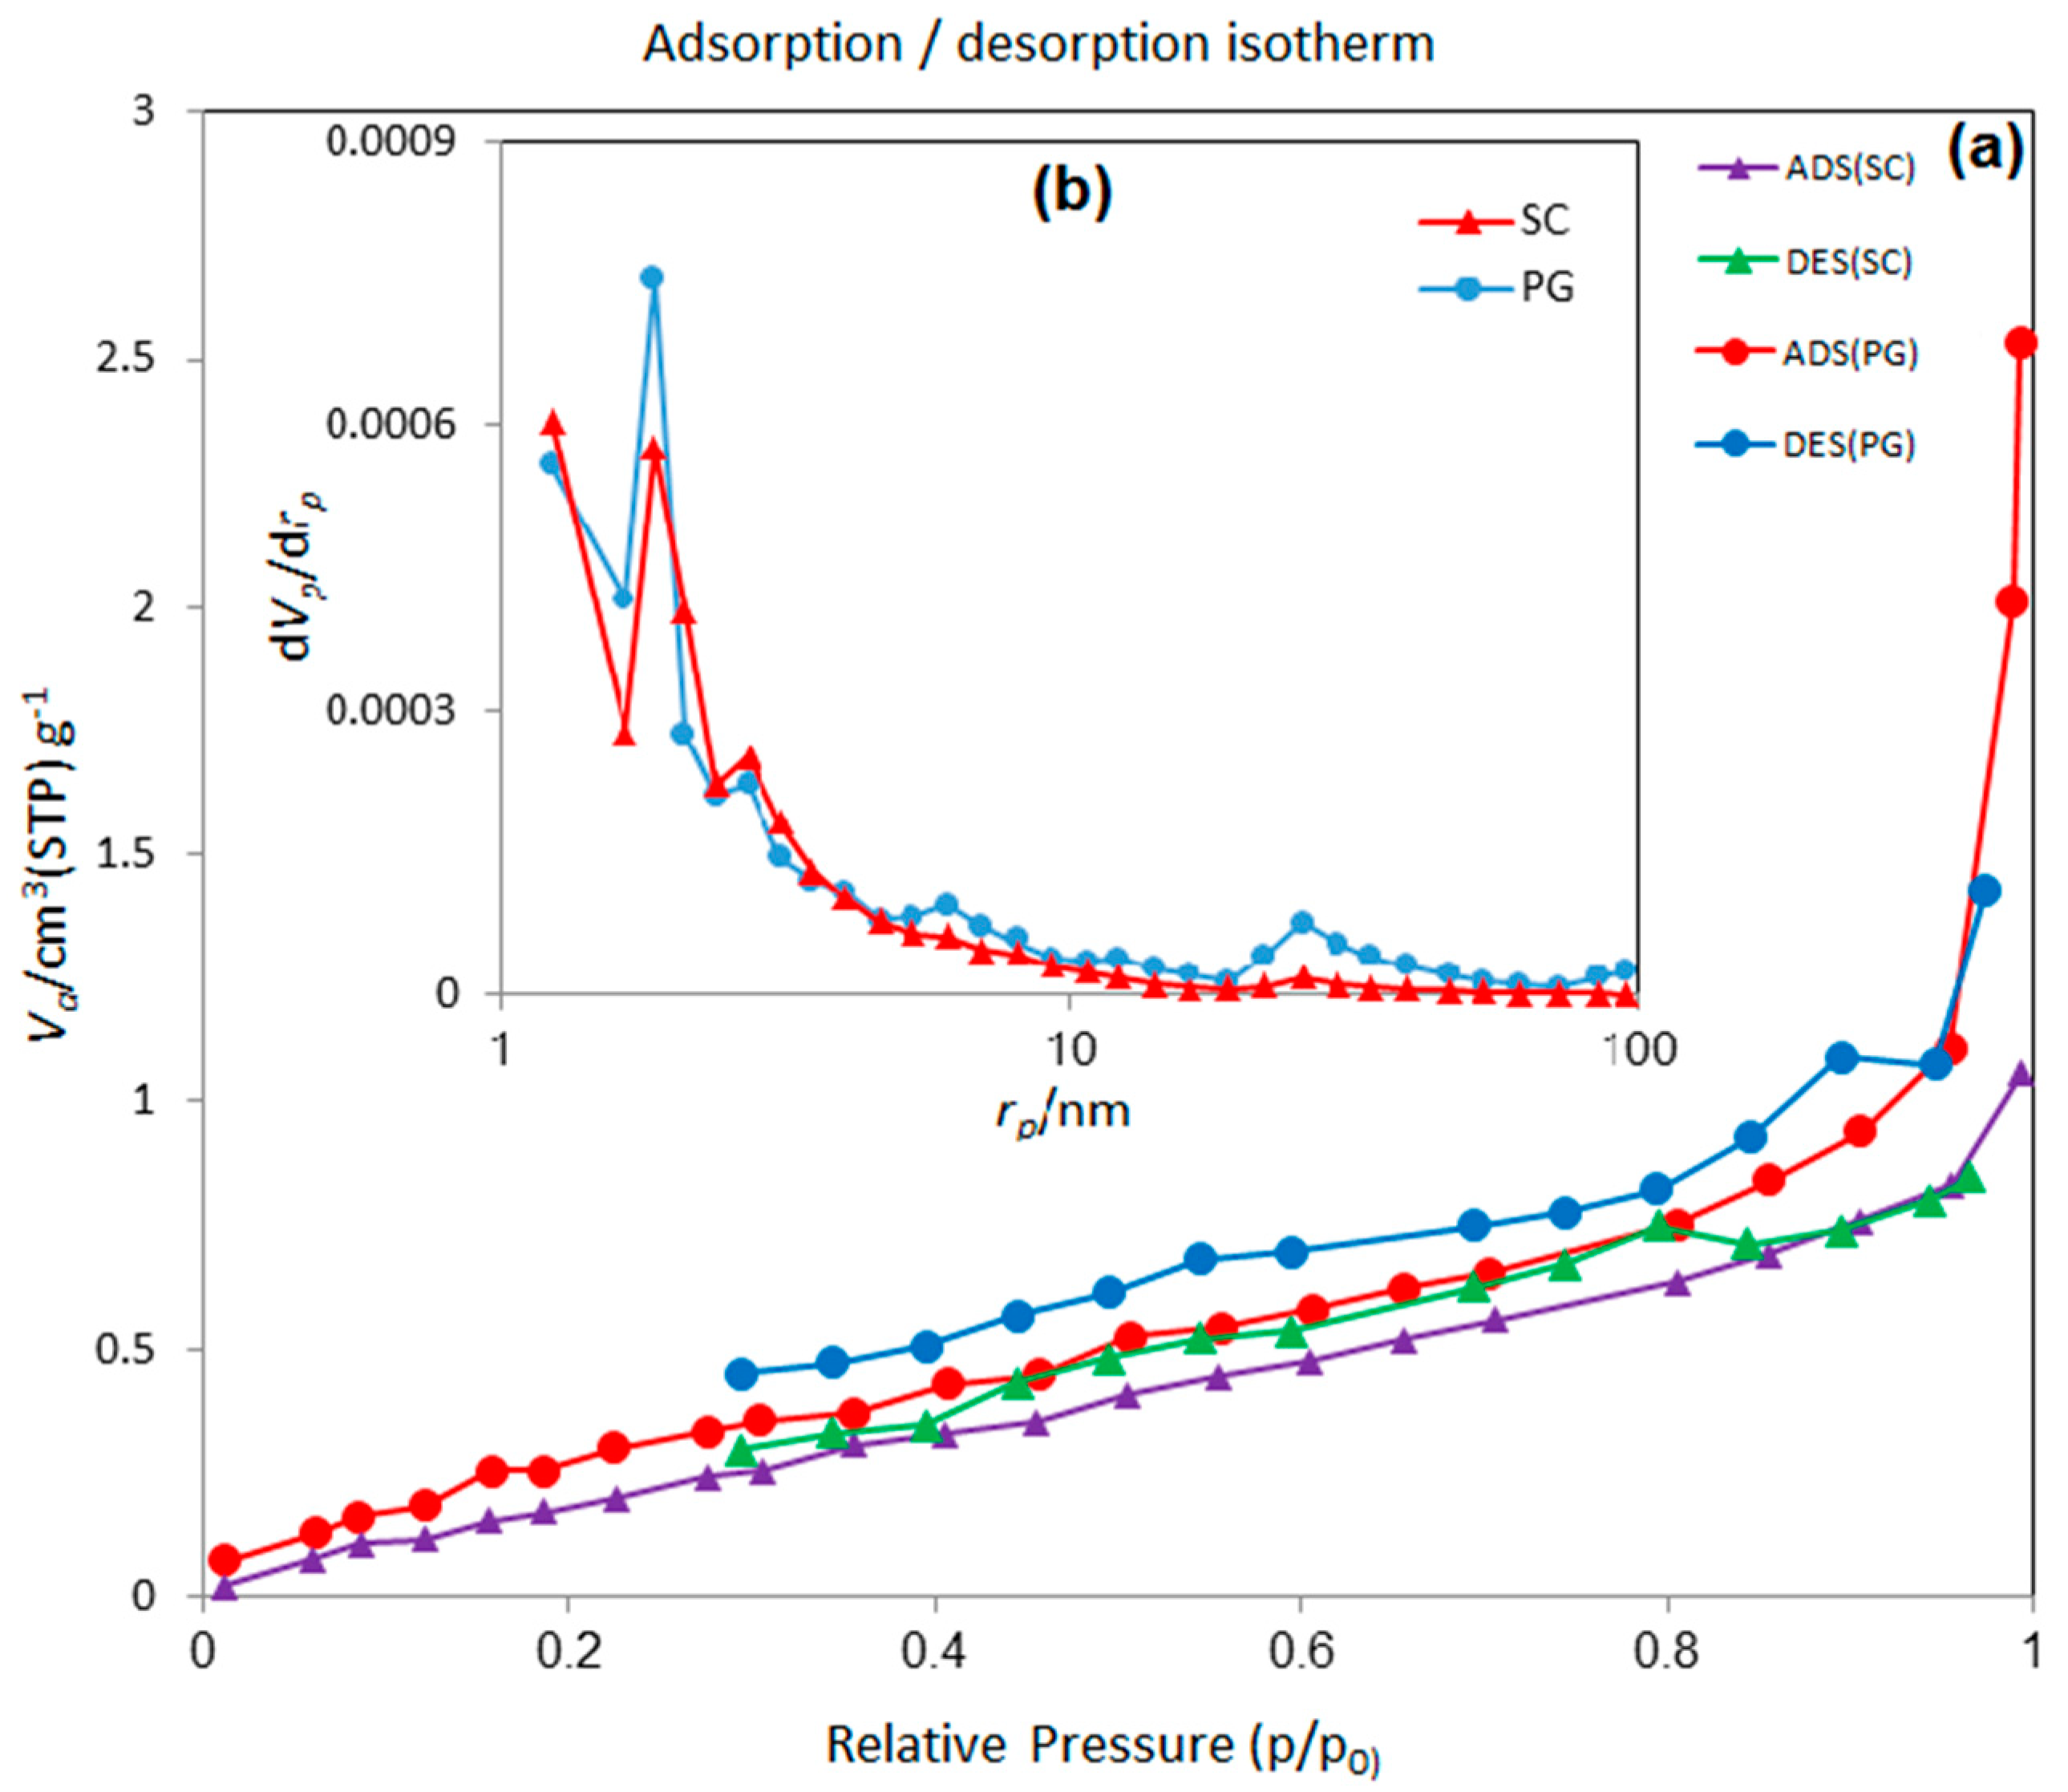
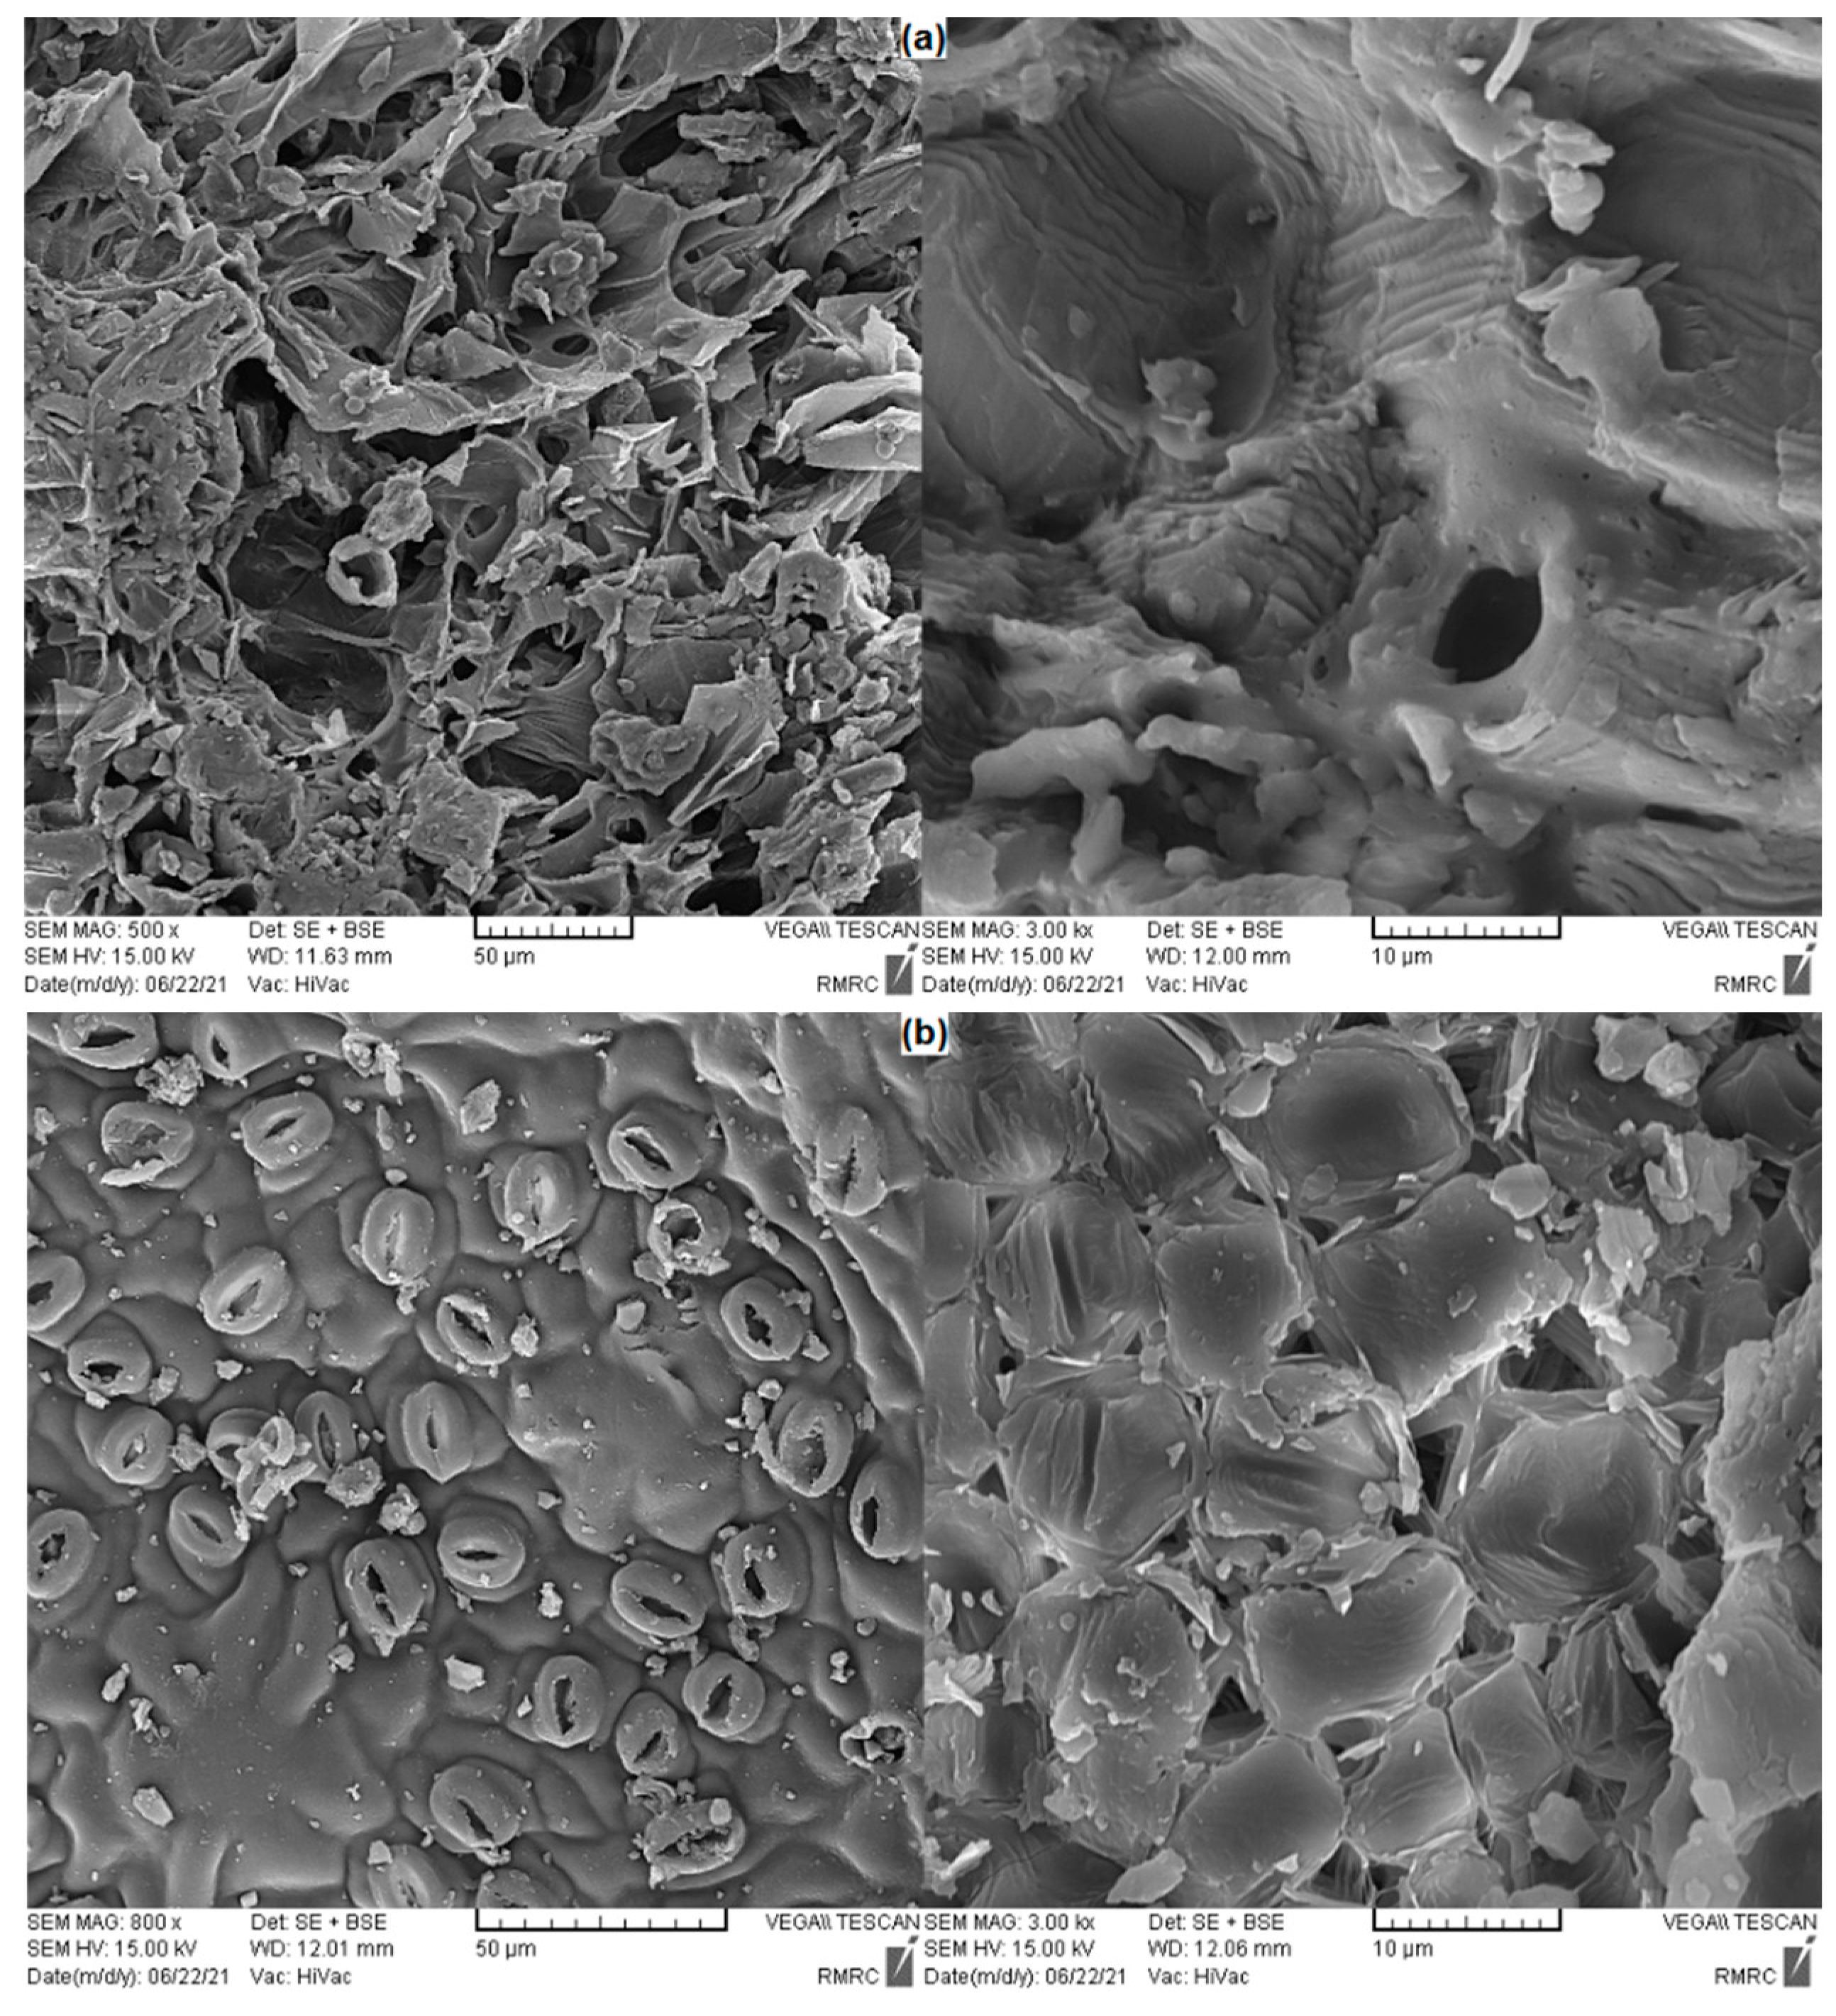
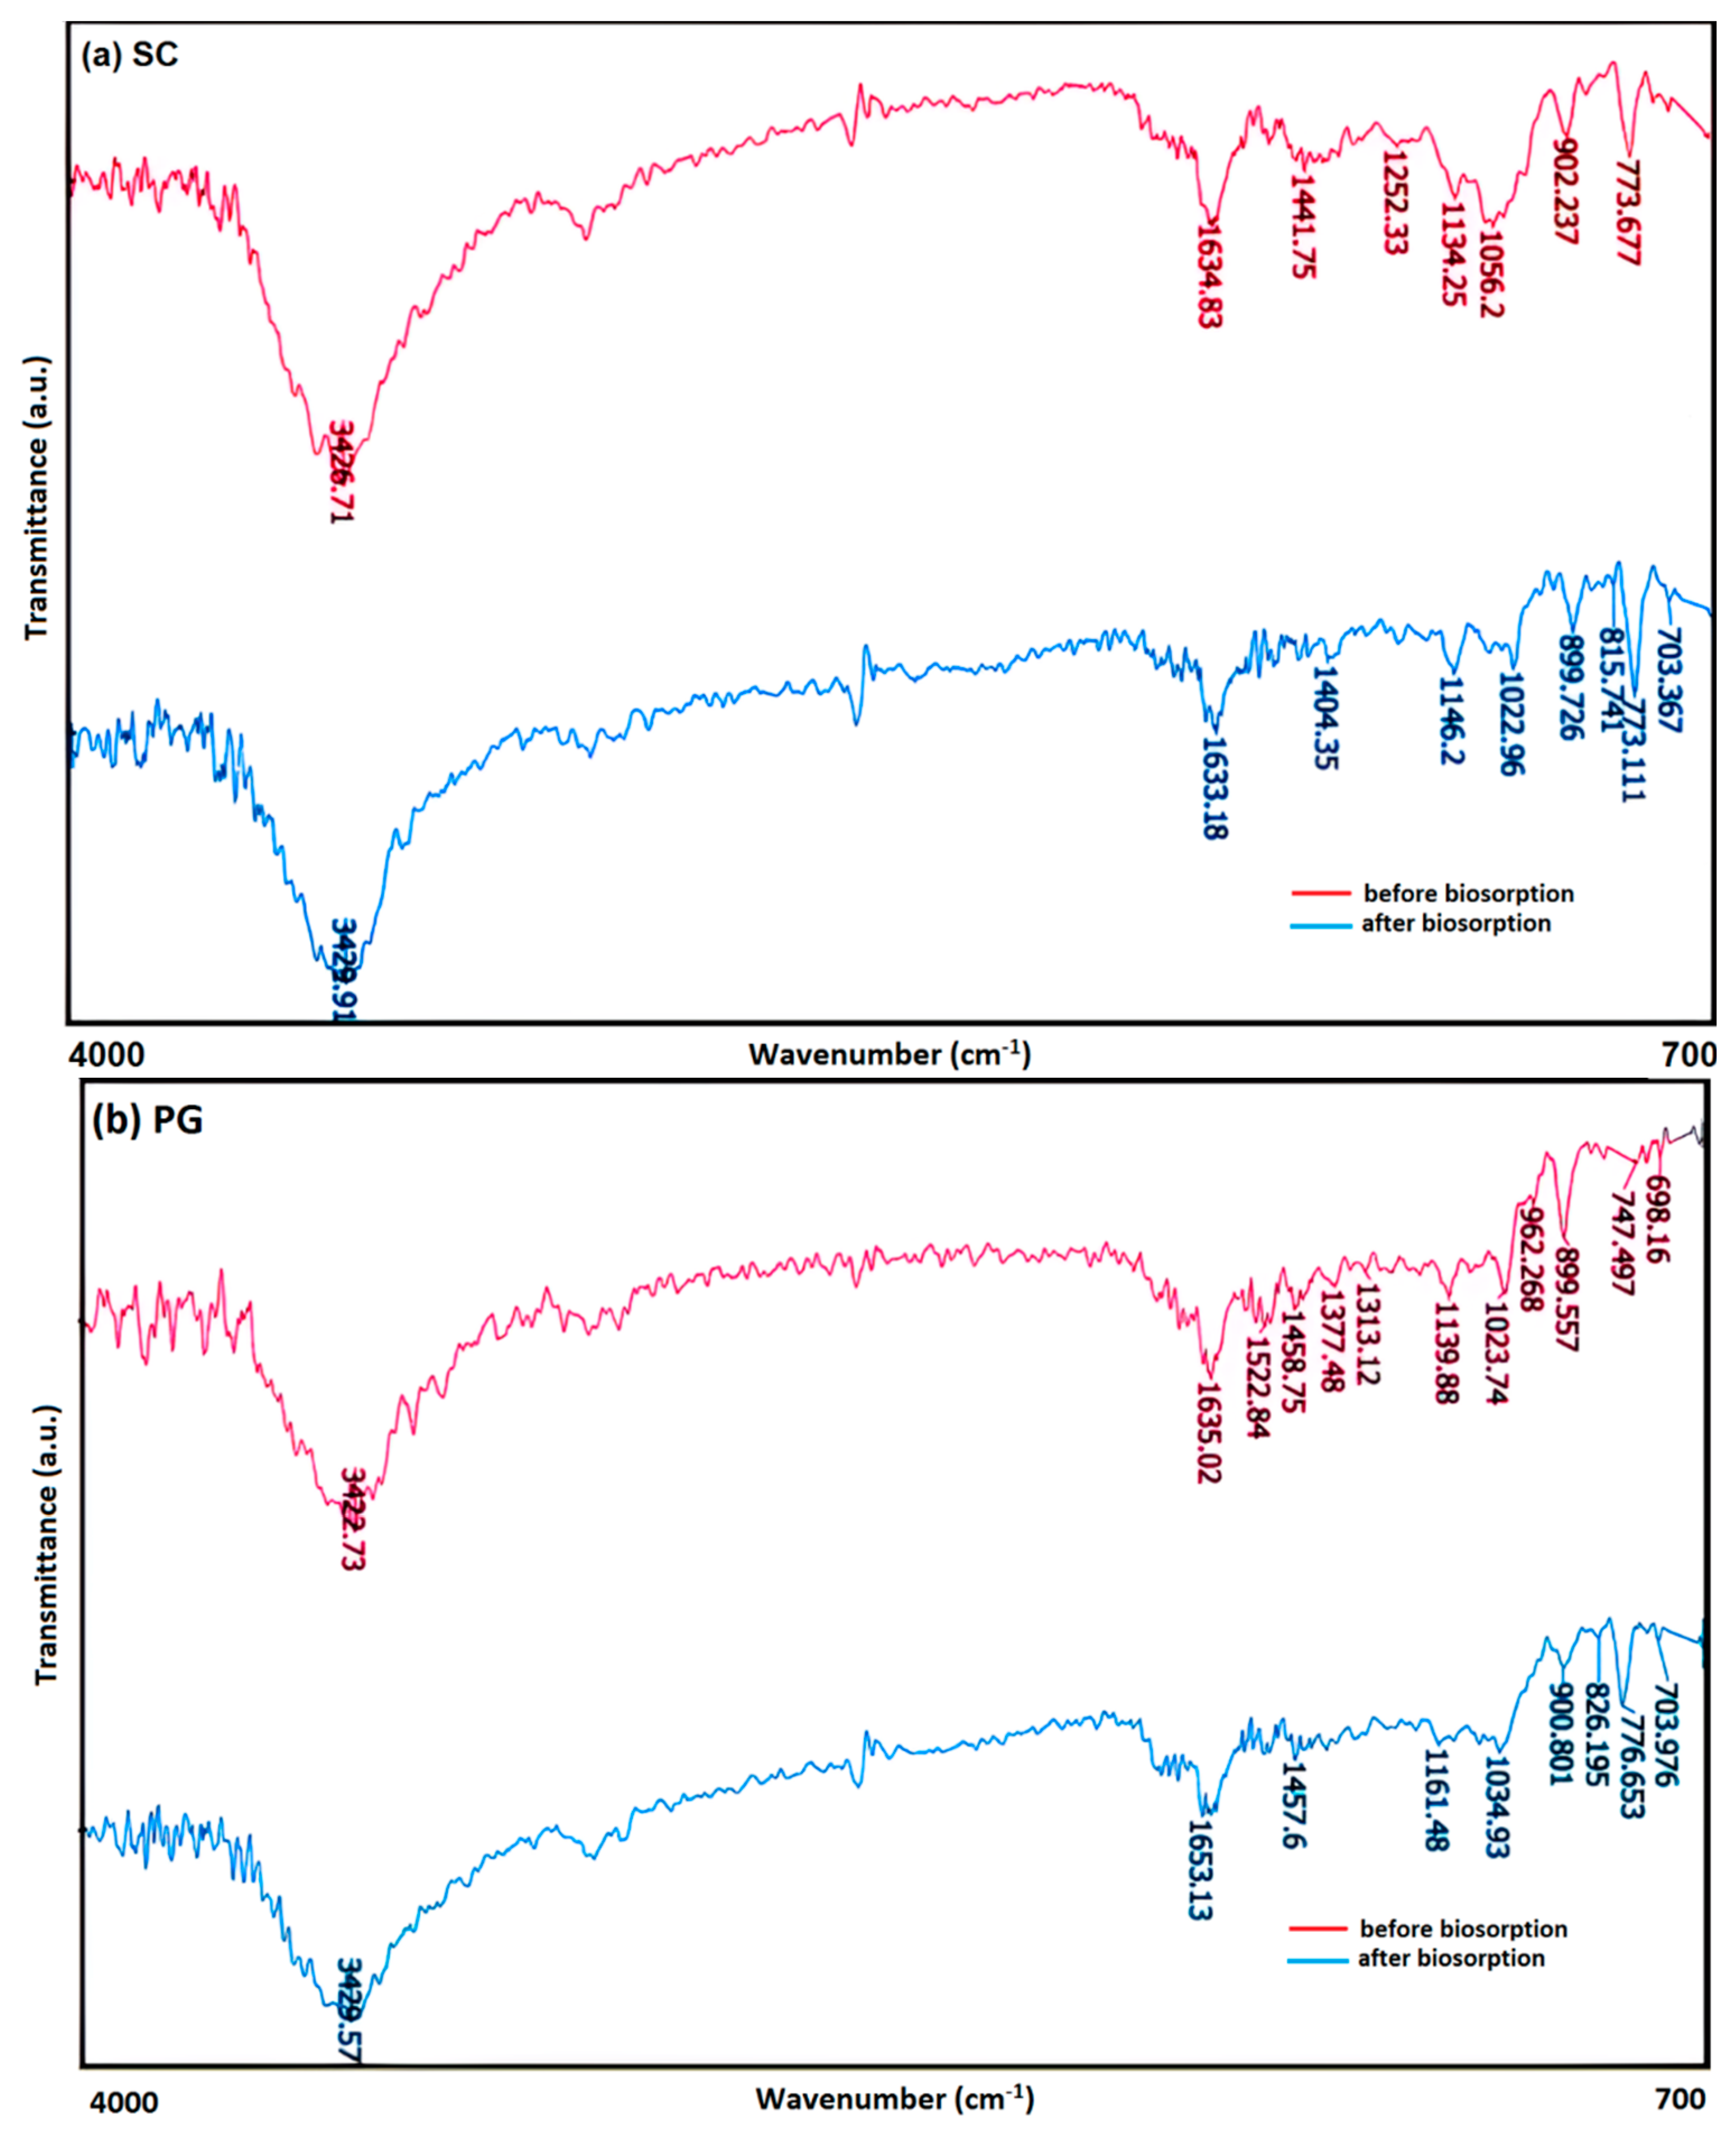
3.1. Characterization of the Biosorbents

The SC and PG surface properties were inspected by BET, SEM, and FTIR analyses. BET analysis was conducted to evaluate the textural properties of as-prepared biosorbents. N2 adsorption–desorption isotherms and the distribution of BJH pore size are represented in Figure 1. Pore-size distribution indicates that most of the SC and PG pores are distributed in the size from 5 to 16 nm, depicting the dominance of mesopores in the structure of biosorbents. The BET surface area was approximately 3 m2 g−1 for both adsorbents, which is a little smaller than that of previously used adsorbents, namely tea-waste biochar (5.07 m2/g) [15] and food-waste biochar (4.50 m2/g) [29], and much smaller compared to other adsorbents such as activated coffee grounds (302 m2/g) [30] that have been used for defluoridation from aqueous medium. However, it is greater than some biomass, such as cotton cellulose (1.081 m2/g) [31], rice husk (0.69 m2/g) [32], pine bark char (1.88 m2/g) [33] and ground tea powder (0.93 m2/g) [34]. In addition, some important textural properties are presented in Table 2. It can be noticed that SC and PG showed average pore diameters of 5.98 and 11.67, respectively, which is compatible with the findings of the SEM analysis. From the micrograph obtained for SC (Figure 2a), it can be observed that the adsorbent is composed of asymmetrical pores and a fibrous heterogeneous surface as well as that there is the presence of a rough and porous surface with spherical-shaped particles, which are noticeable in the PG images (Figure 2b).
FTIR examination was done for the adsorbents in order to determine the associated surface functional groups. Figure 3a,b represent the adsorbents’ FTIR spectra in the range of 700–4000 cm−1 before and after fluoride biosorption. The FTIR spectra of SC and PG showed numerous functional groups on their surface. For example, the intense peaks located at the wavelength of 3200–3600 cm−1 (broad peak at 3426 and 3422 cm−1) corresponded to O–H vibration-stretching of hydroxyl groups [35]. The peak at the 1635 cm−1 wavenumber indicates the carbonyl or carboxyl (C=O) stretching vibration and the ones around 1441–1522 suggest the presence of C–H vibrations of aromatic compounds [2]. The adsorption peaks between 1000 and 1300 cm−1 refer to C–O stretching of carboxylic acids and alcohol (strong peaks 1056 and 1023) [36]. C–N (largest peak 1252 cm−1) and C–O–C (peaks at 1134 and 1139 cm−1) vibration is evidence of the presence of amine and esters groups, respectively [37]. Additionally, the small peaks around 750–900 cm−1 denote aliphatic and out-of-plane C–H bending [38]. Based on the IR spectrum after the adsorption process, it could be concluded that there were some changes including less sharp peaks in the range of 3000–3500 cm−1 and fewer intense peaks between 1000 and 2000 cm−1, which confirms that the O–H and C–O are the primary functional groups which control the elimination of fluoride ions via the biosorption.
The pHpcz was experimentally performed in order to have a clear understanding of the quantity of charges on the adsorbents’ surfaces. Above pHpcz, the adsorbent surface has a negative charge and below it has a positive charge [36]. As shown in Figure 4, PG and SC have pHpzc values of 5.8 and 5.3, respectively. These values indicate that the adsorbent surface must be positively charged for attracting fluoride ions. An initial pH range of 3–11 is assessed for the biosorption process. In conclusion, at pH values greater than pHzpc (around 5), the surface charge is negative; therefore, the repulsion is expected.

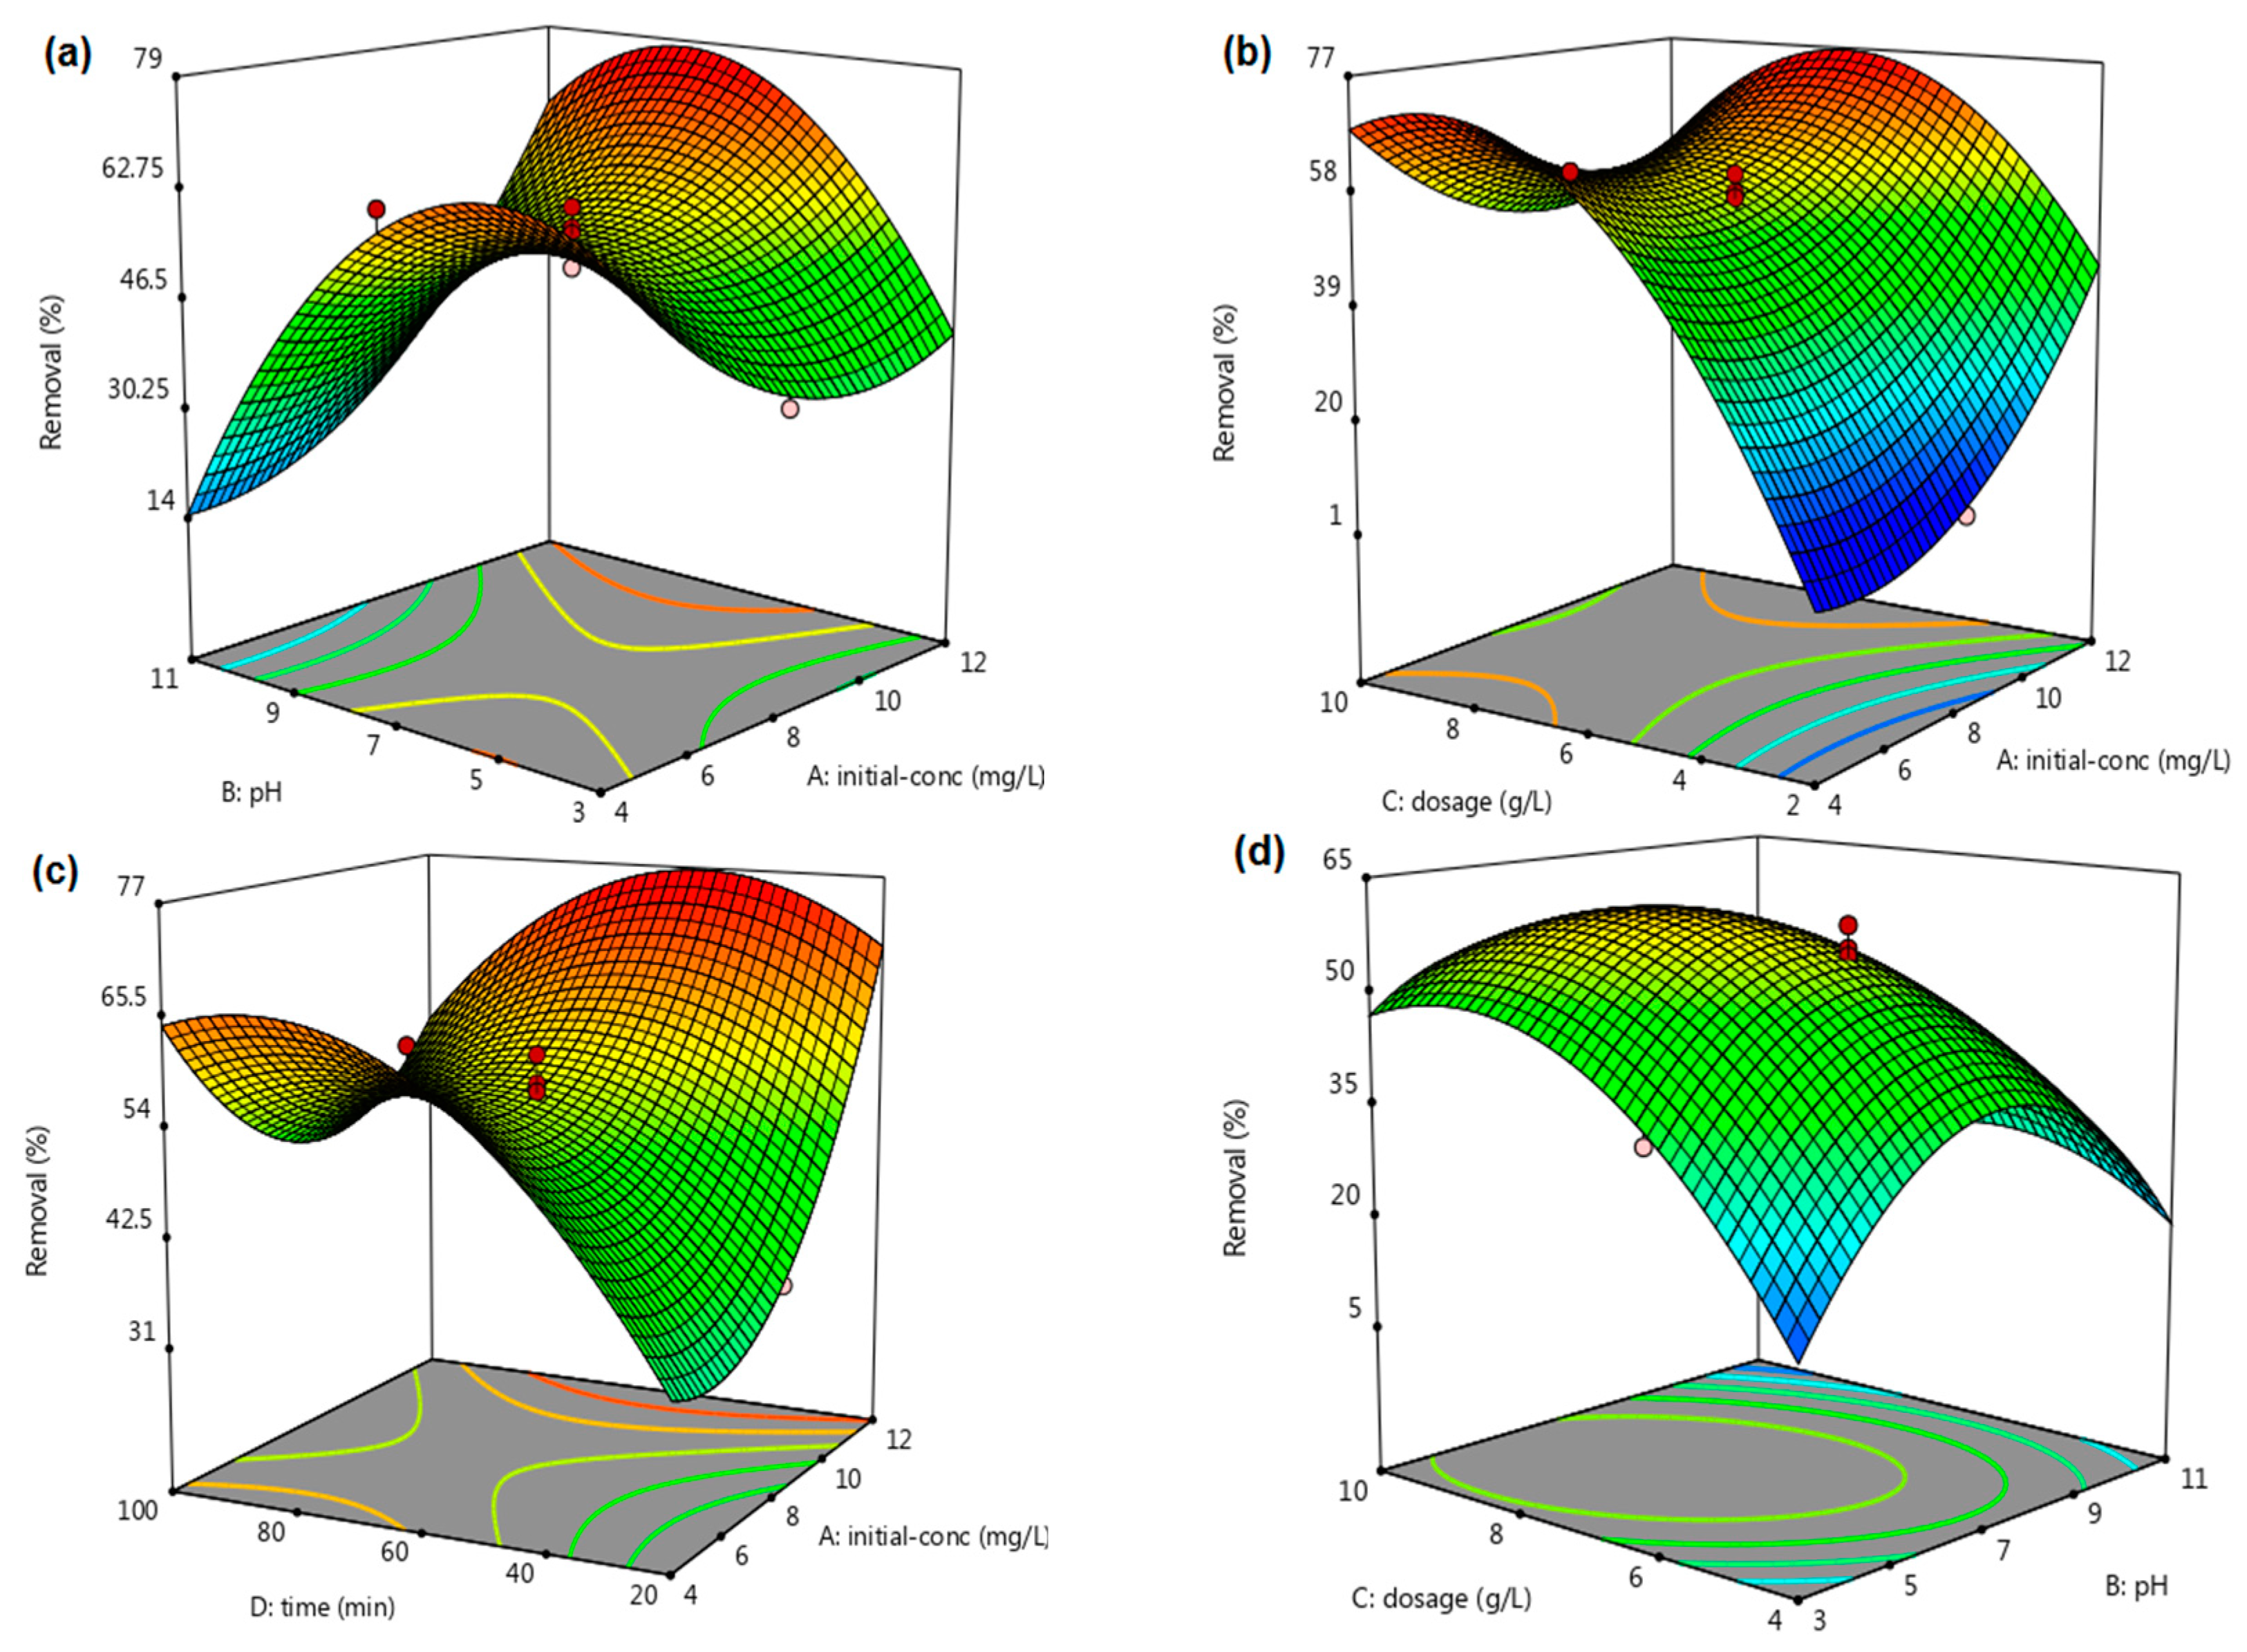
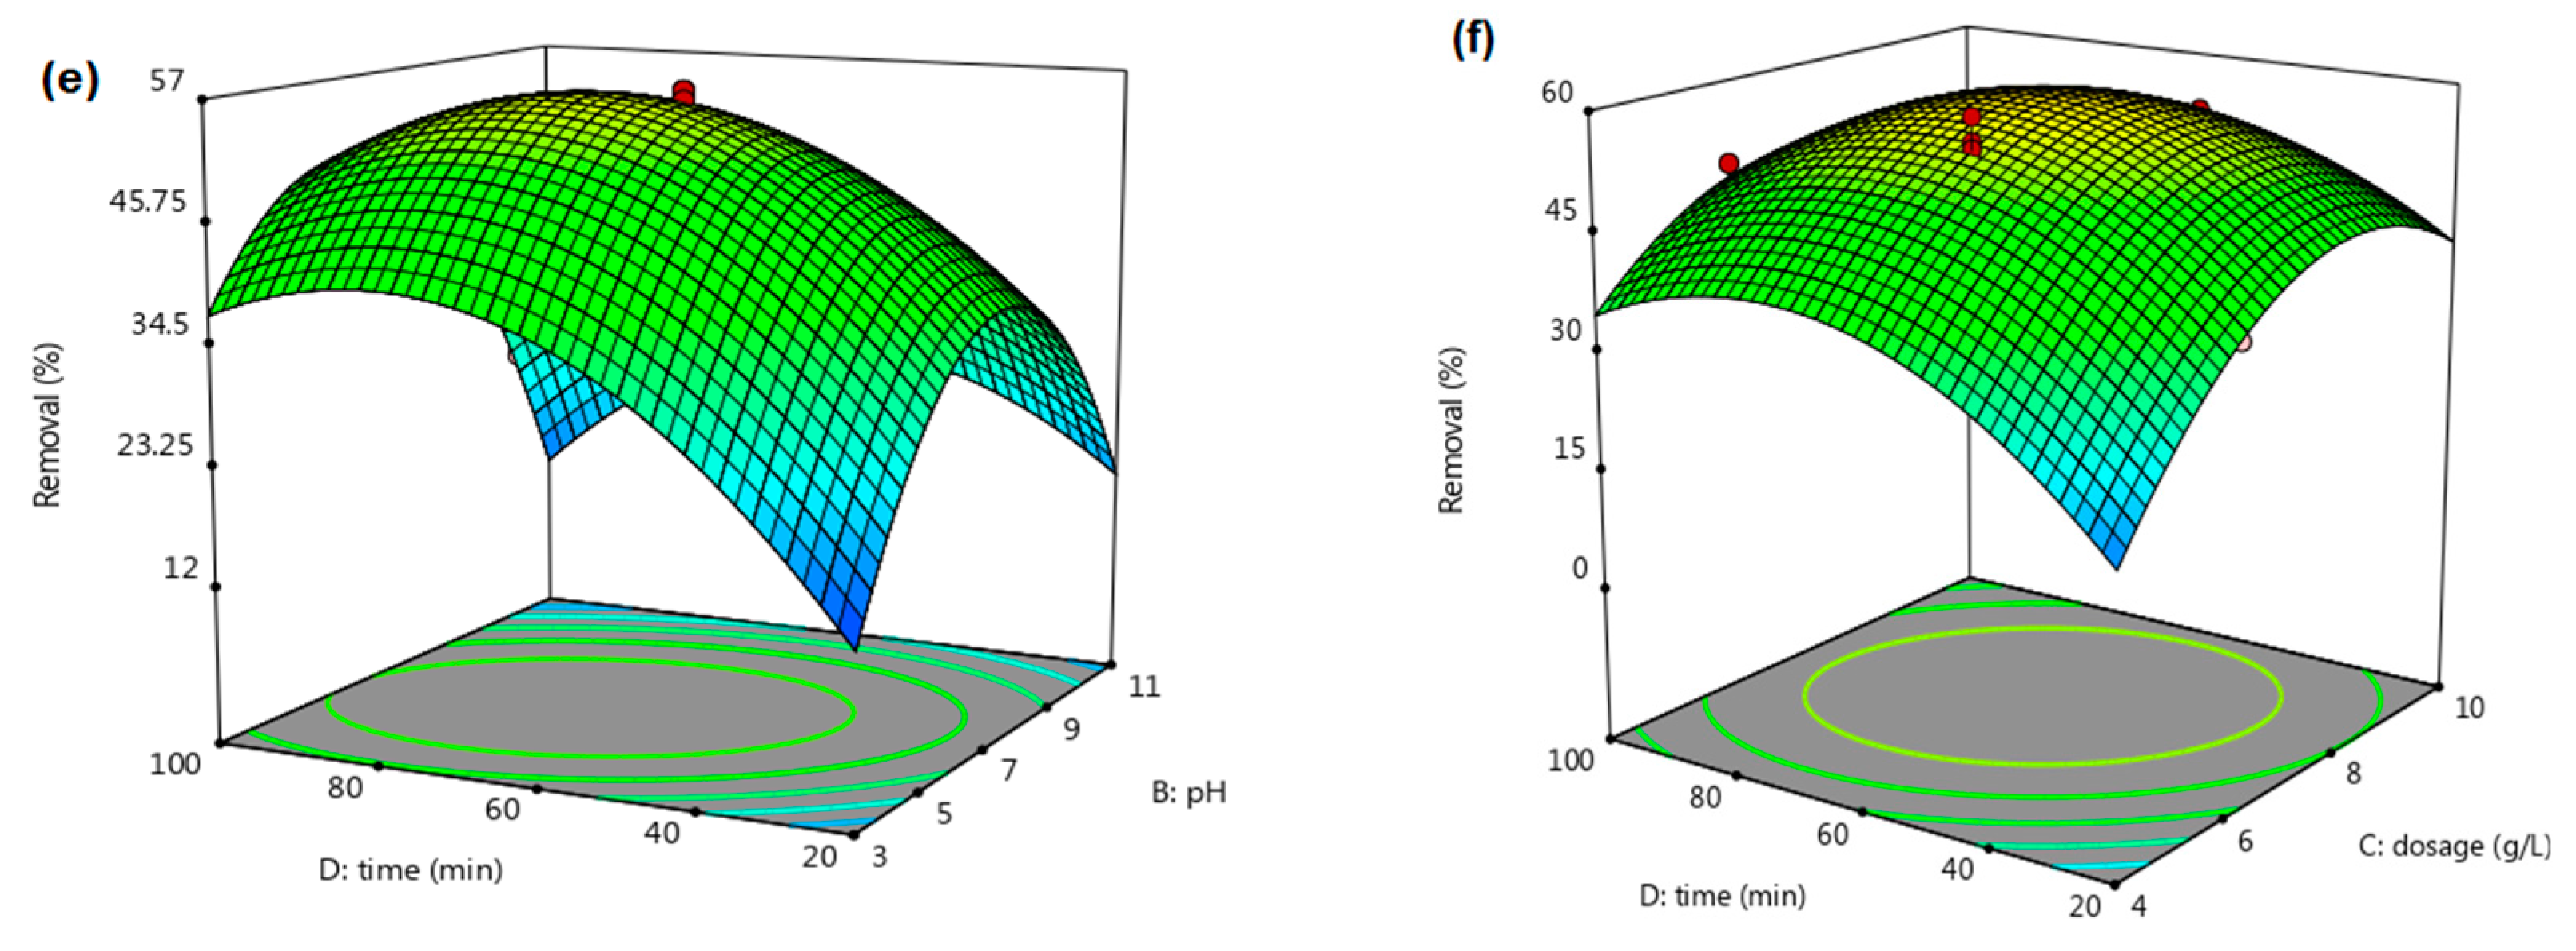
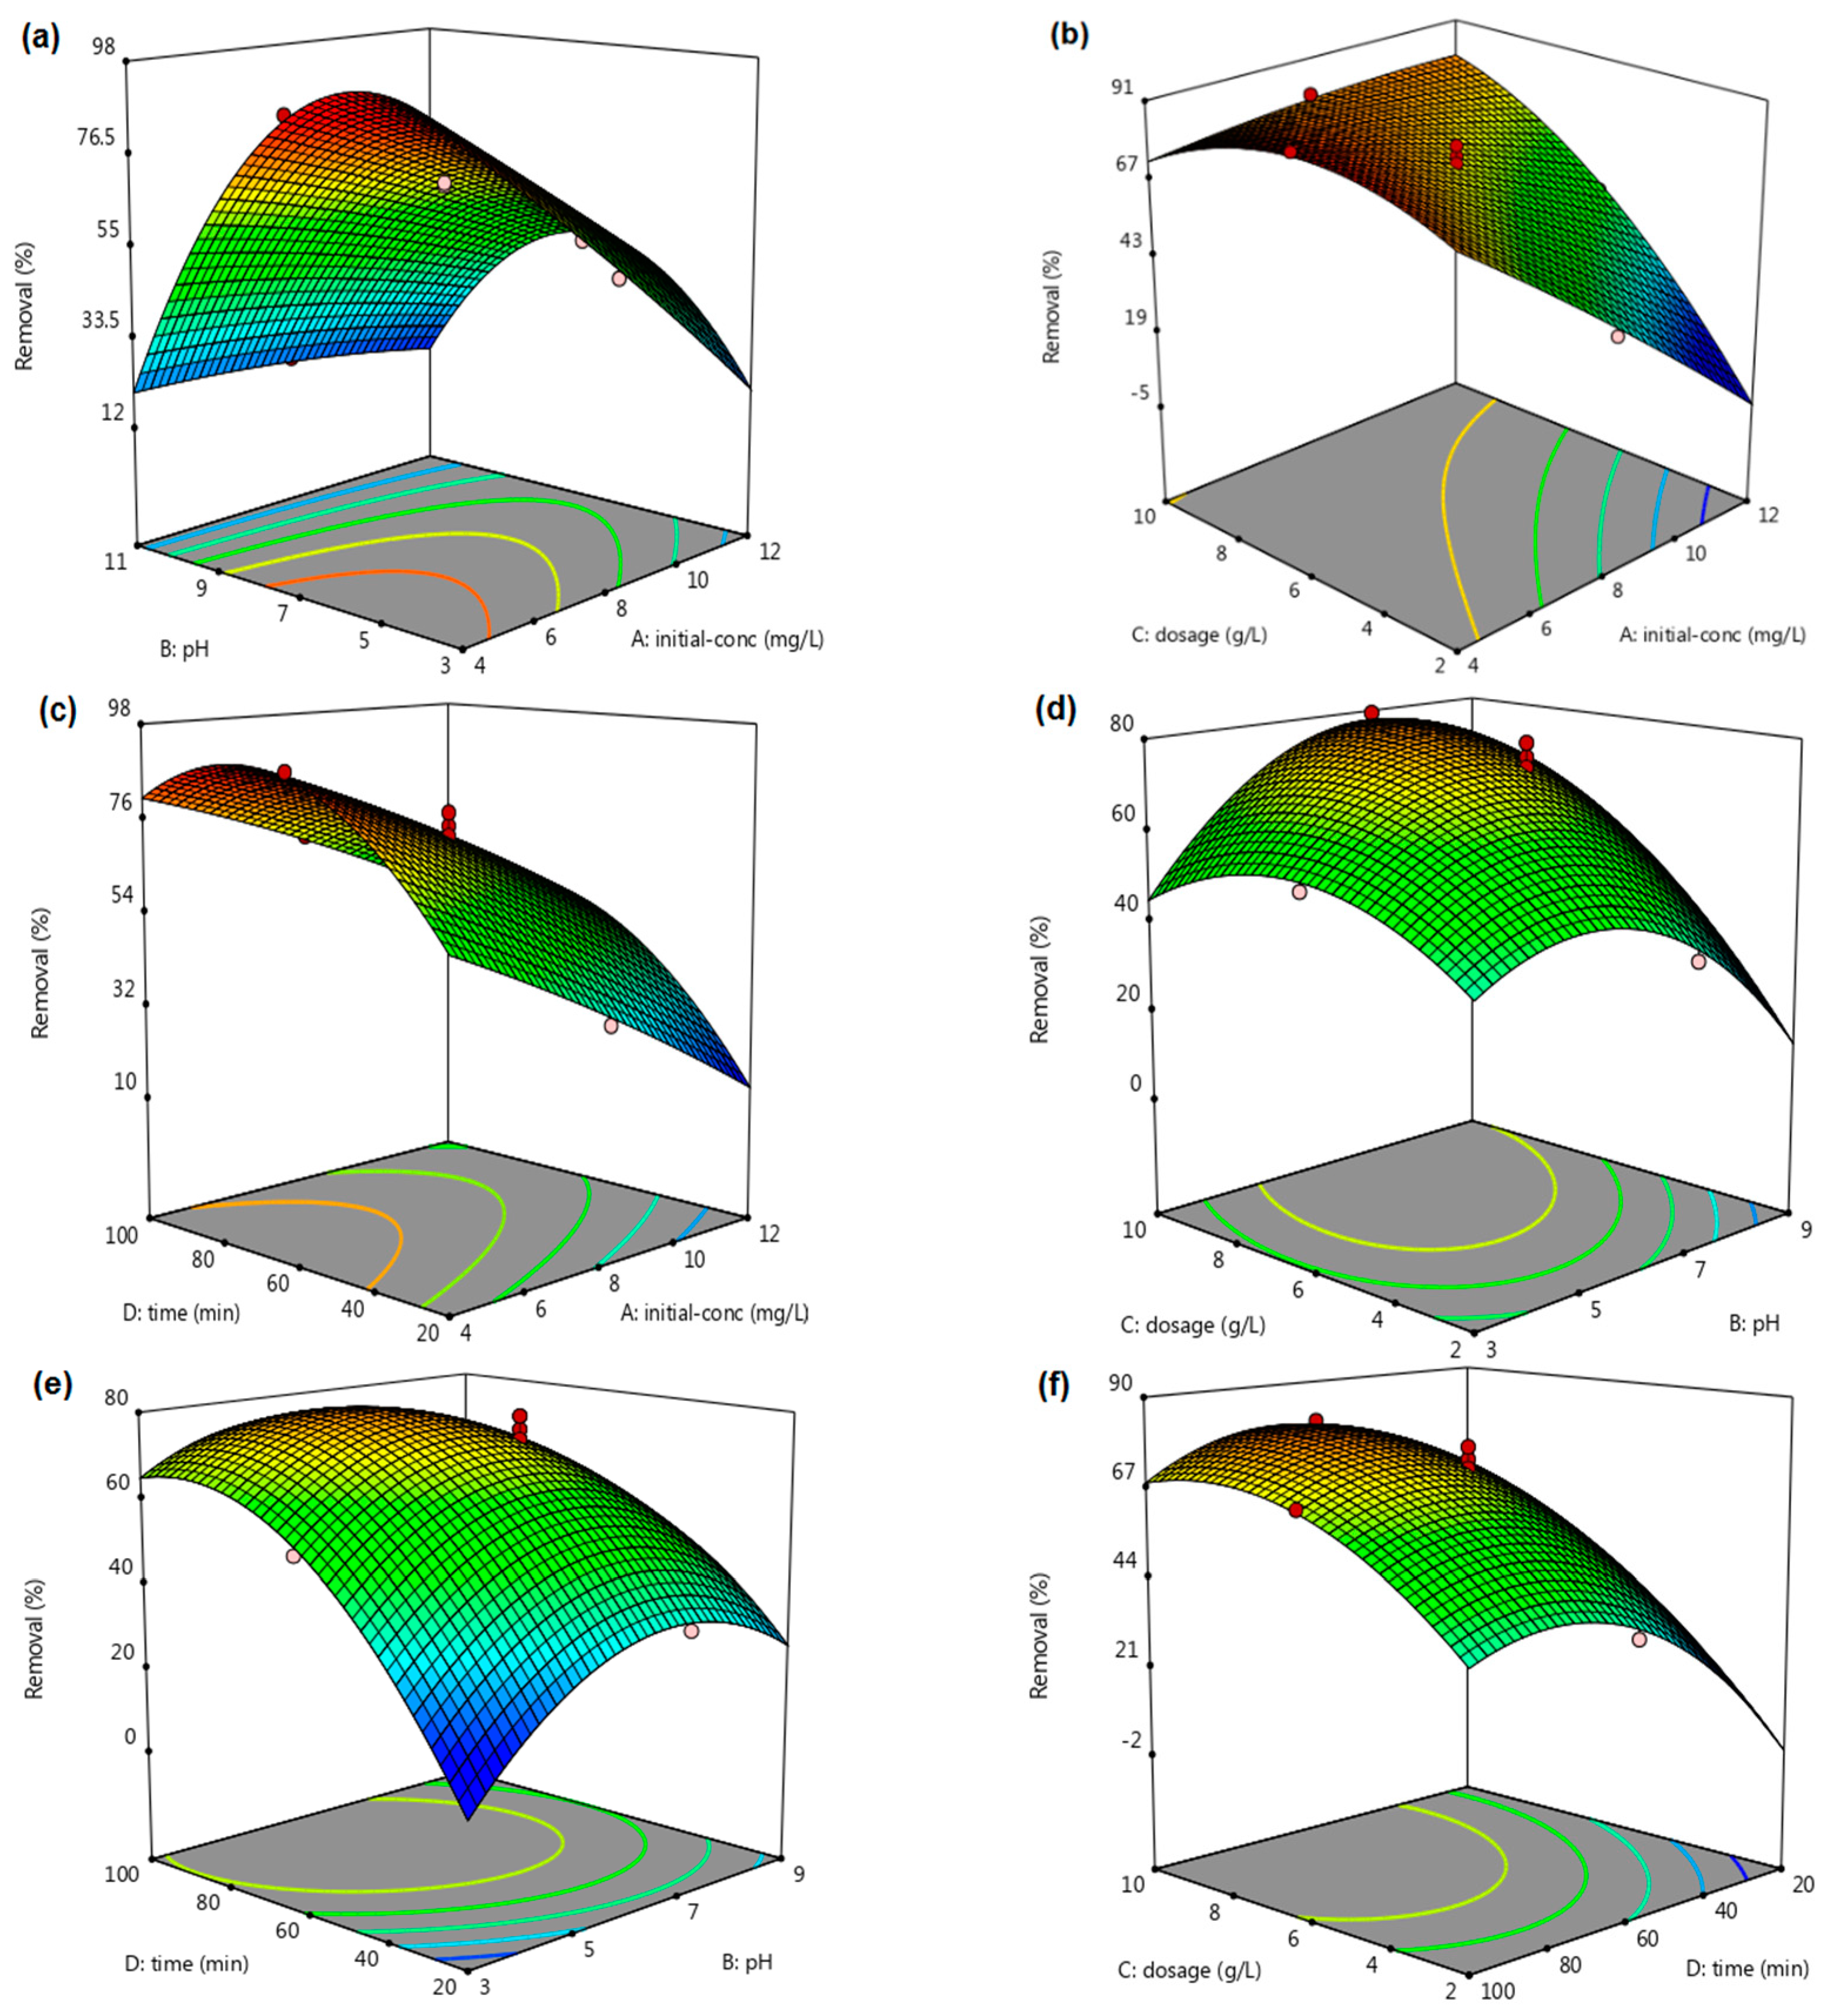
3.2. Response Surface Analysis and Model Fitting

The 30 sets of experiments with different values of variables were designed and obtained for each adsorbent using the CCD model of RSM. Table 3 presents the experimental design as well as the results obtained and predicted by the quadratic model. Fitting the experimental results and depicting the relationship between fluoride removal efficiency and the examined parameters were achieved initially using the second-degree polynomial model.
The final models with coded factors for SC (Equation (8)) and PG (Equation (9)) were obtained as shown below:
Removal efficiency (%) by SC = 55.37 + 3.68A − 2.67B + 10.19C + 2.48D + 4.69AB − 3.14AC − 2.73AD − 3.68BC − 1.78BD − 1.92CD + 3.34A2 − 5.70B2 − 6.52C2 − 3.16D2
Removal efficiency (%) by PG = 71.83 − 9.53A − 9.29B + 9.74C + 7.60D + 3.83AB + 5.61AC + 4.28BC − 3.55BD − 8.67B2 − 3.34 C2 − 5.08D2
where, A, B, C and D are fluoride concentration, pH, dosage, and time.
An analysis of variance (ANOVA) was conducted to determine the interactions between independent parameters, coefficient of determination (R2), and significance for each term. The results are shown in Table 4 for SC and Table 5 for PG. According to ANOVA calculation, the models and the coefficient whose p-value < 0.05 (experimental < 0.0001) with high F-value are appraised to be significant, whereas p-value > 0.05 indicates an insignificant model term [39]. In the case of SC, A, B, C, D, AB, AC, AD, BC, BD, A2, B2, C2, and D2 were significant model terms and A, B, C, D, AB, AC, BC, BD, B2, C2, and D2 were the significant ones for the PG model. Model F-values of 47.56 for SC and 51.87 for PG with p-values < 0.0001 imply that the models had statistical significance and produced good predictions. The adjusted R2 values (0.96 and 0.96) and predicted R2 values (0.90 and 0.91) were considered satisfactory and in close agreement with each other.

3.3. Pareto Chart Analysis

In order to achieve the significance level of each of the variables affecting the responses, the ratio SSterm to SSTotal is used to depict the Pareto chart [40]. Overall, it is readily apparent from Figure 5 that the absorbent dose had the most effect by 37%. On the other hand, fluoride concentration, pH, and time had the least effect on fluoride removal using SC with 2%, 3%, and 5%, respectively. In the PG, fluoride concentration and adsorbent dose were not significantly different from each other and had the largest contribution equal to 19%. However, pH was also observed with an almost similar effect of 18%.

3.4. Effect of Main Operational Parameters

The significant interactive influence of selected parameters on fluoride removal is displayed through 3D response surface plots in Figure 6 and Figure 7.

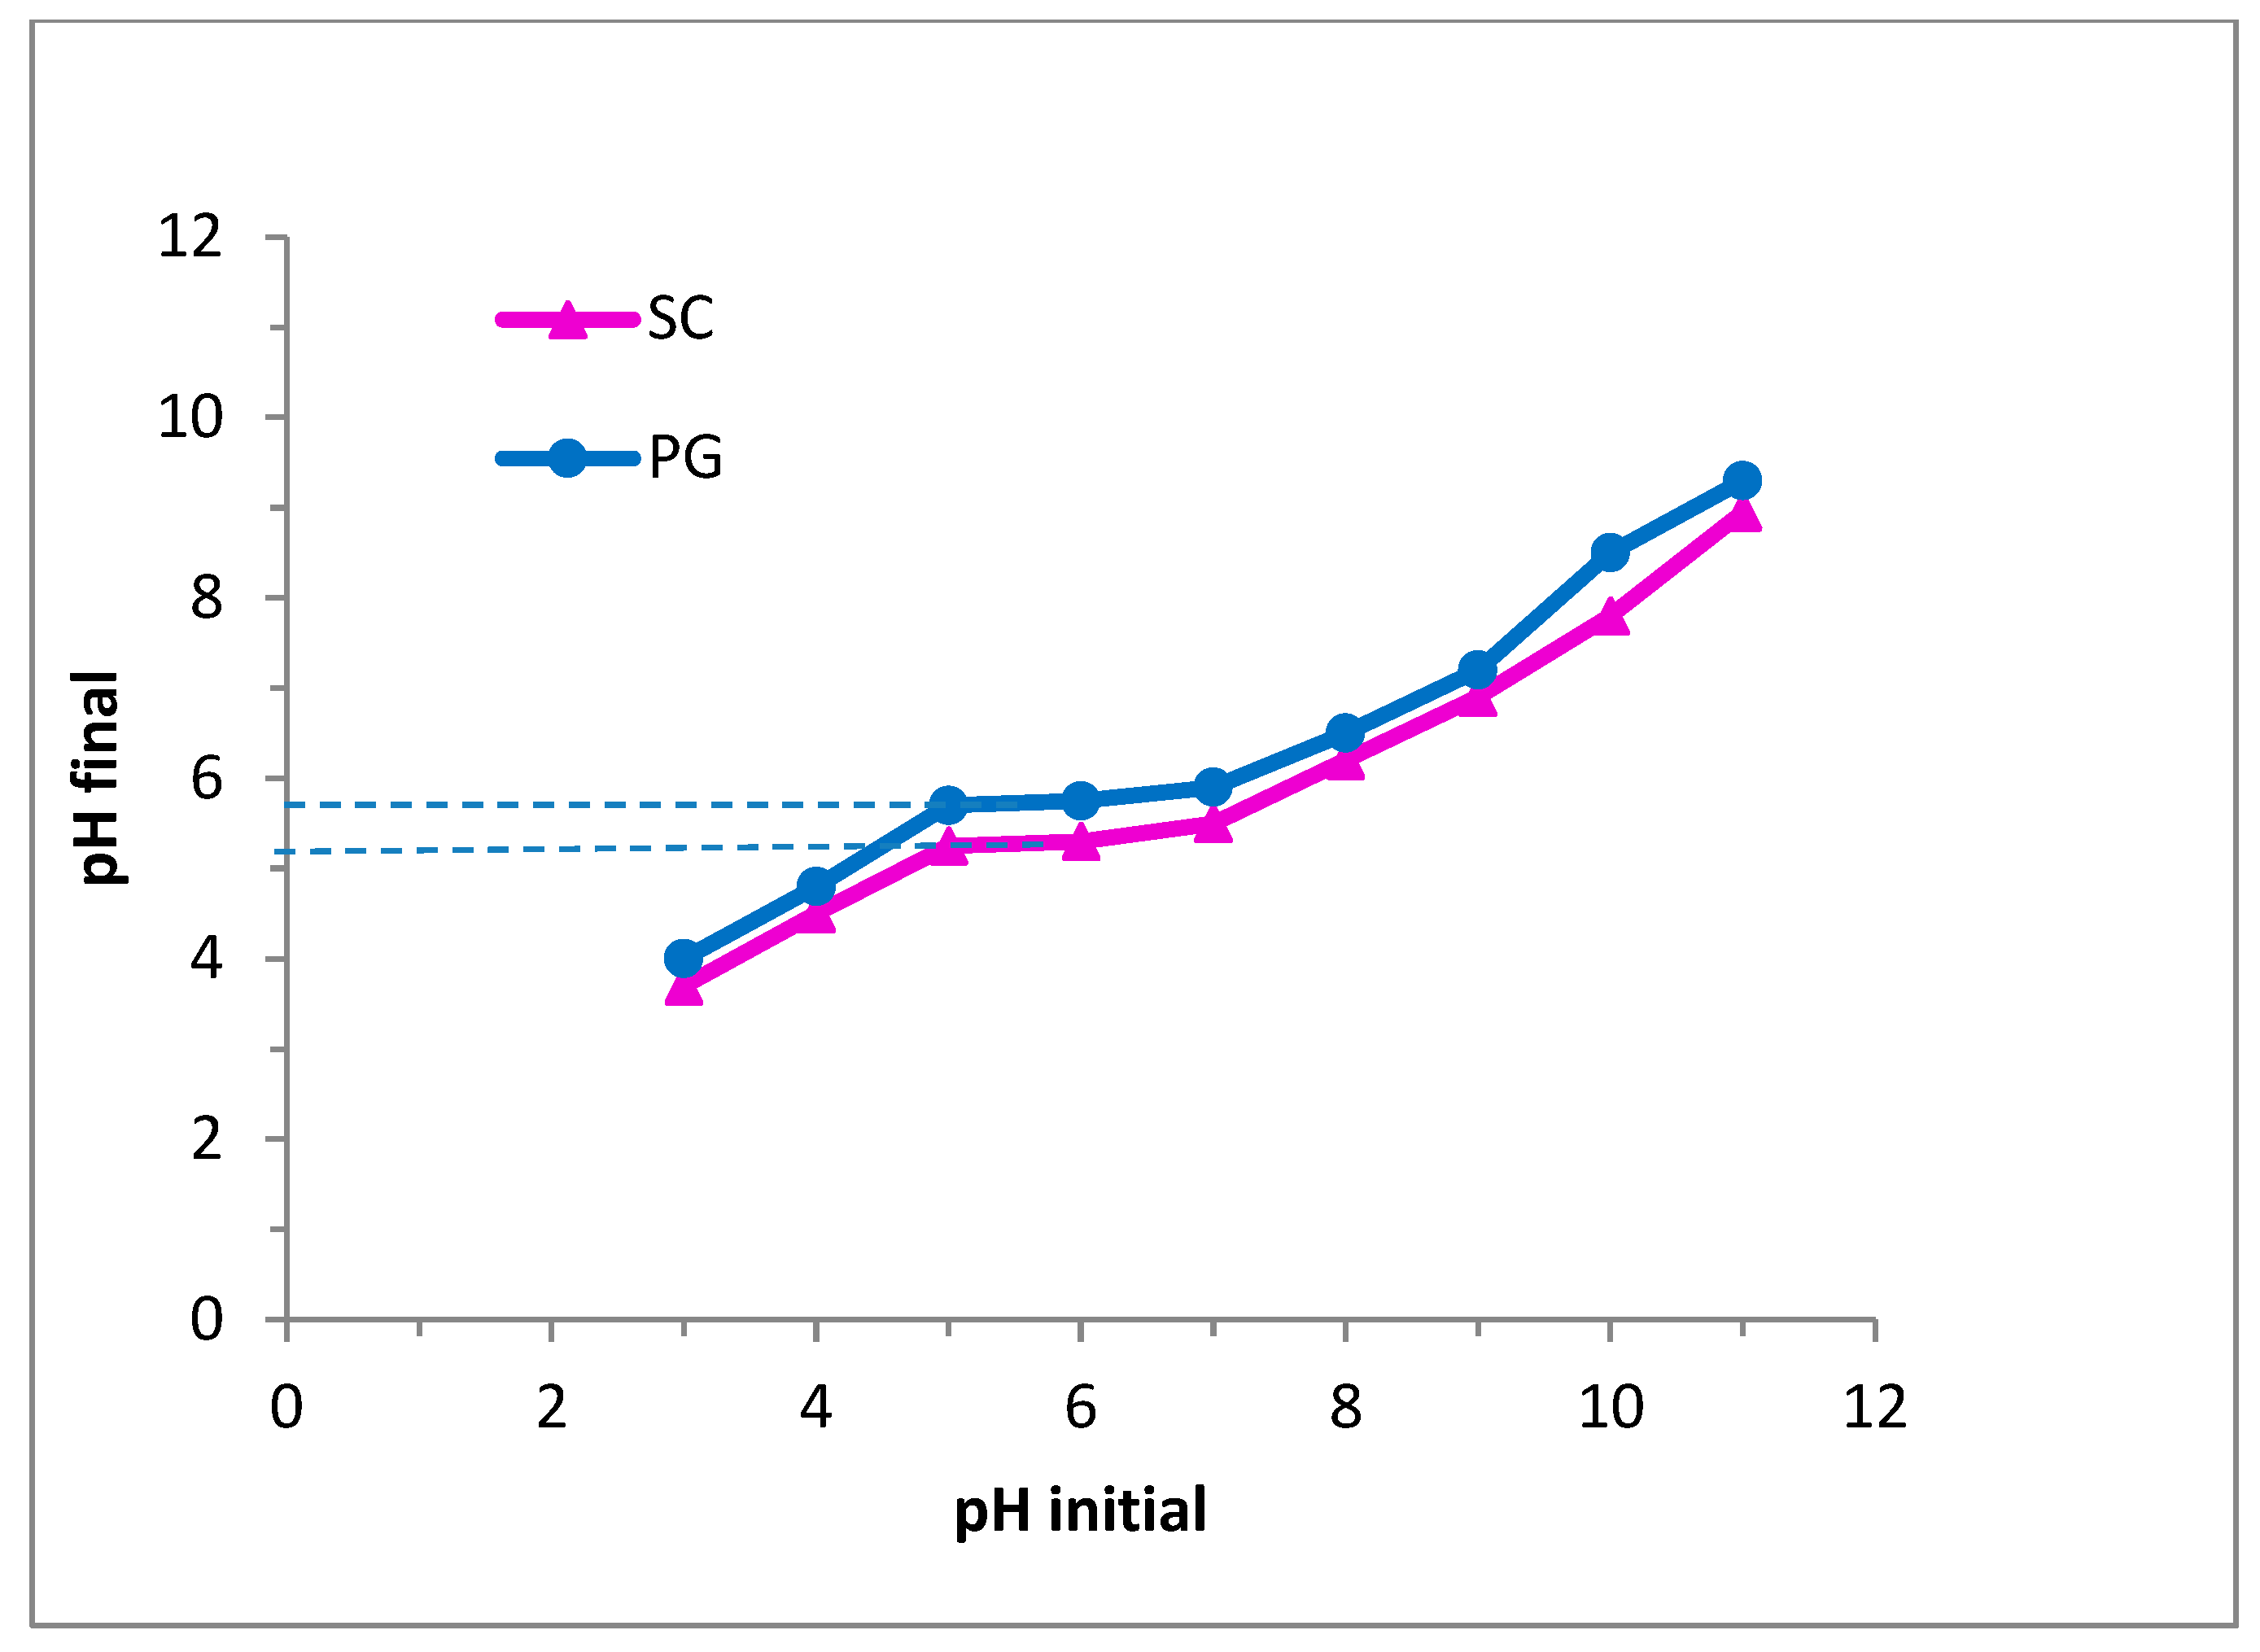
3.4.1. Effect of Solution pH

Solution pH is a pronounced factor that can greatly affect the amount of ionic adsorbate removed because it has the ability to alter the nature of ionic adsorbate molecule and protonation/dissociation of the adsorbent surface [41,42]. The effect of solution pH on the F removal efficiency was examined in the pH range of 3–11. According to Figure 6 and Figure 7 (pH-time, pH-dose, and pH-concentration), it is evident that there is a strong interactive influence between the initial pH and other operating parameters. The defluoridation efficiency increased at first in the pH range of 3–5 and subsequently decreased as the pH values exceeded 5 for both adsorbents. Based on the highest removal efficiency of both biosorbents, a pH of 5 as the optimum one was chosen for subsequent adsorption experiments. Similar results have shown that pH variation significantly affected F adsorption onto various adsorbents and those with a pH above 6.5 [4,43]. The surface’s negative charges can be the main reason for decreasing adsorption at pH > 6.5 [44]. The result is in accordance with the results of zero-point charge determination (see Figure 4).

3.4.2. Effect of Adsorbent Dosage

The influence of adsorbent dosage on defluoridation is demonstrated and the results are shown in Figure 6 and Figure 7 (dosage–pH, dosage–concentration, dosage–time). According to the result, it is clear that there is an improvement in removal efficiency with increasing adsorbent dosage until reaching the optimum amount. Furthermore, the pH curve has a steep slope, indicating that defluoridation efficiency was highly affected by this factor. Fluoride biosorption of greater than 70% was recorded with an increase in adsorbent dosage from 4 to 8 g/L. This phenomenon reflects higher adsorption capacity and availability of the active absorptive sites caused by an increase in adsorbent dosage [45]. Similar results in a study showed that the biosorption of fluoride by possotia leaf powder improved with increasing biosorbent dose [46].
From the Co plots and its influence on removal efficiency, it can be seen that as the fluoride concentration increased, the removal efficiency declined. The adsorption capacity of SC and PG increased at first with increasing concentration, which can be justified by the higher active adsorption site. However, insufficient surface adsorption sites were developed by increasing Co from 6 to 12 mg/L, which decreased the removal efficiency. Thus, the optimum fluoride concentration with the highest removal efficiency was 6 mg/L for both biosorbents. Kumar reported that by increasing the concentration of F, the removal rate decreases significantly, which can be due to the saturation of surface adsorptive sites by high accumulation of fluoride ions [47].
All of the interactions between various factors are presented in ANOVA analysis. It was evident that time was the least effective parameter, with a weak interactive effect in both models. Moreover, the values of optimum conditions for both adsorbents are depicted in Table 6. The greatest F removal efficiency for SC was 72.5% and for PG was 88.3%, which occurred after 75 min of contact time and a dosage of 8 g/L for SC and contact time of 90 min, and adsorbent dose of 6 g/L for PG.

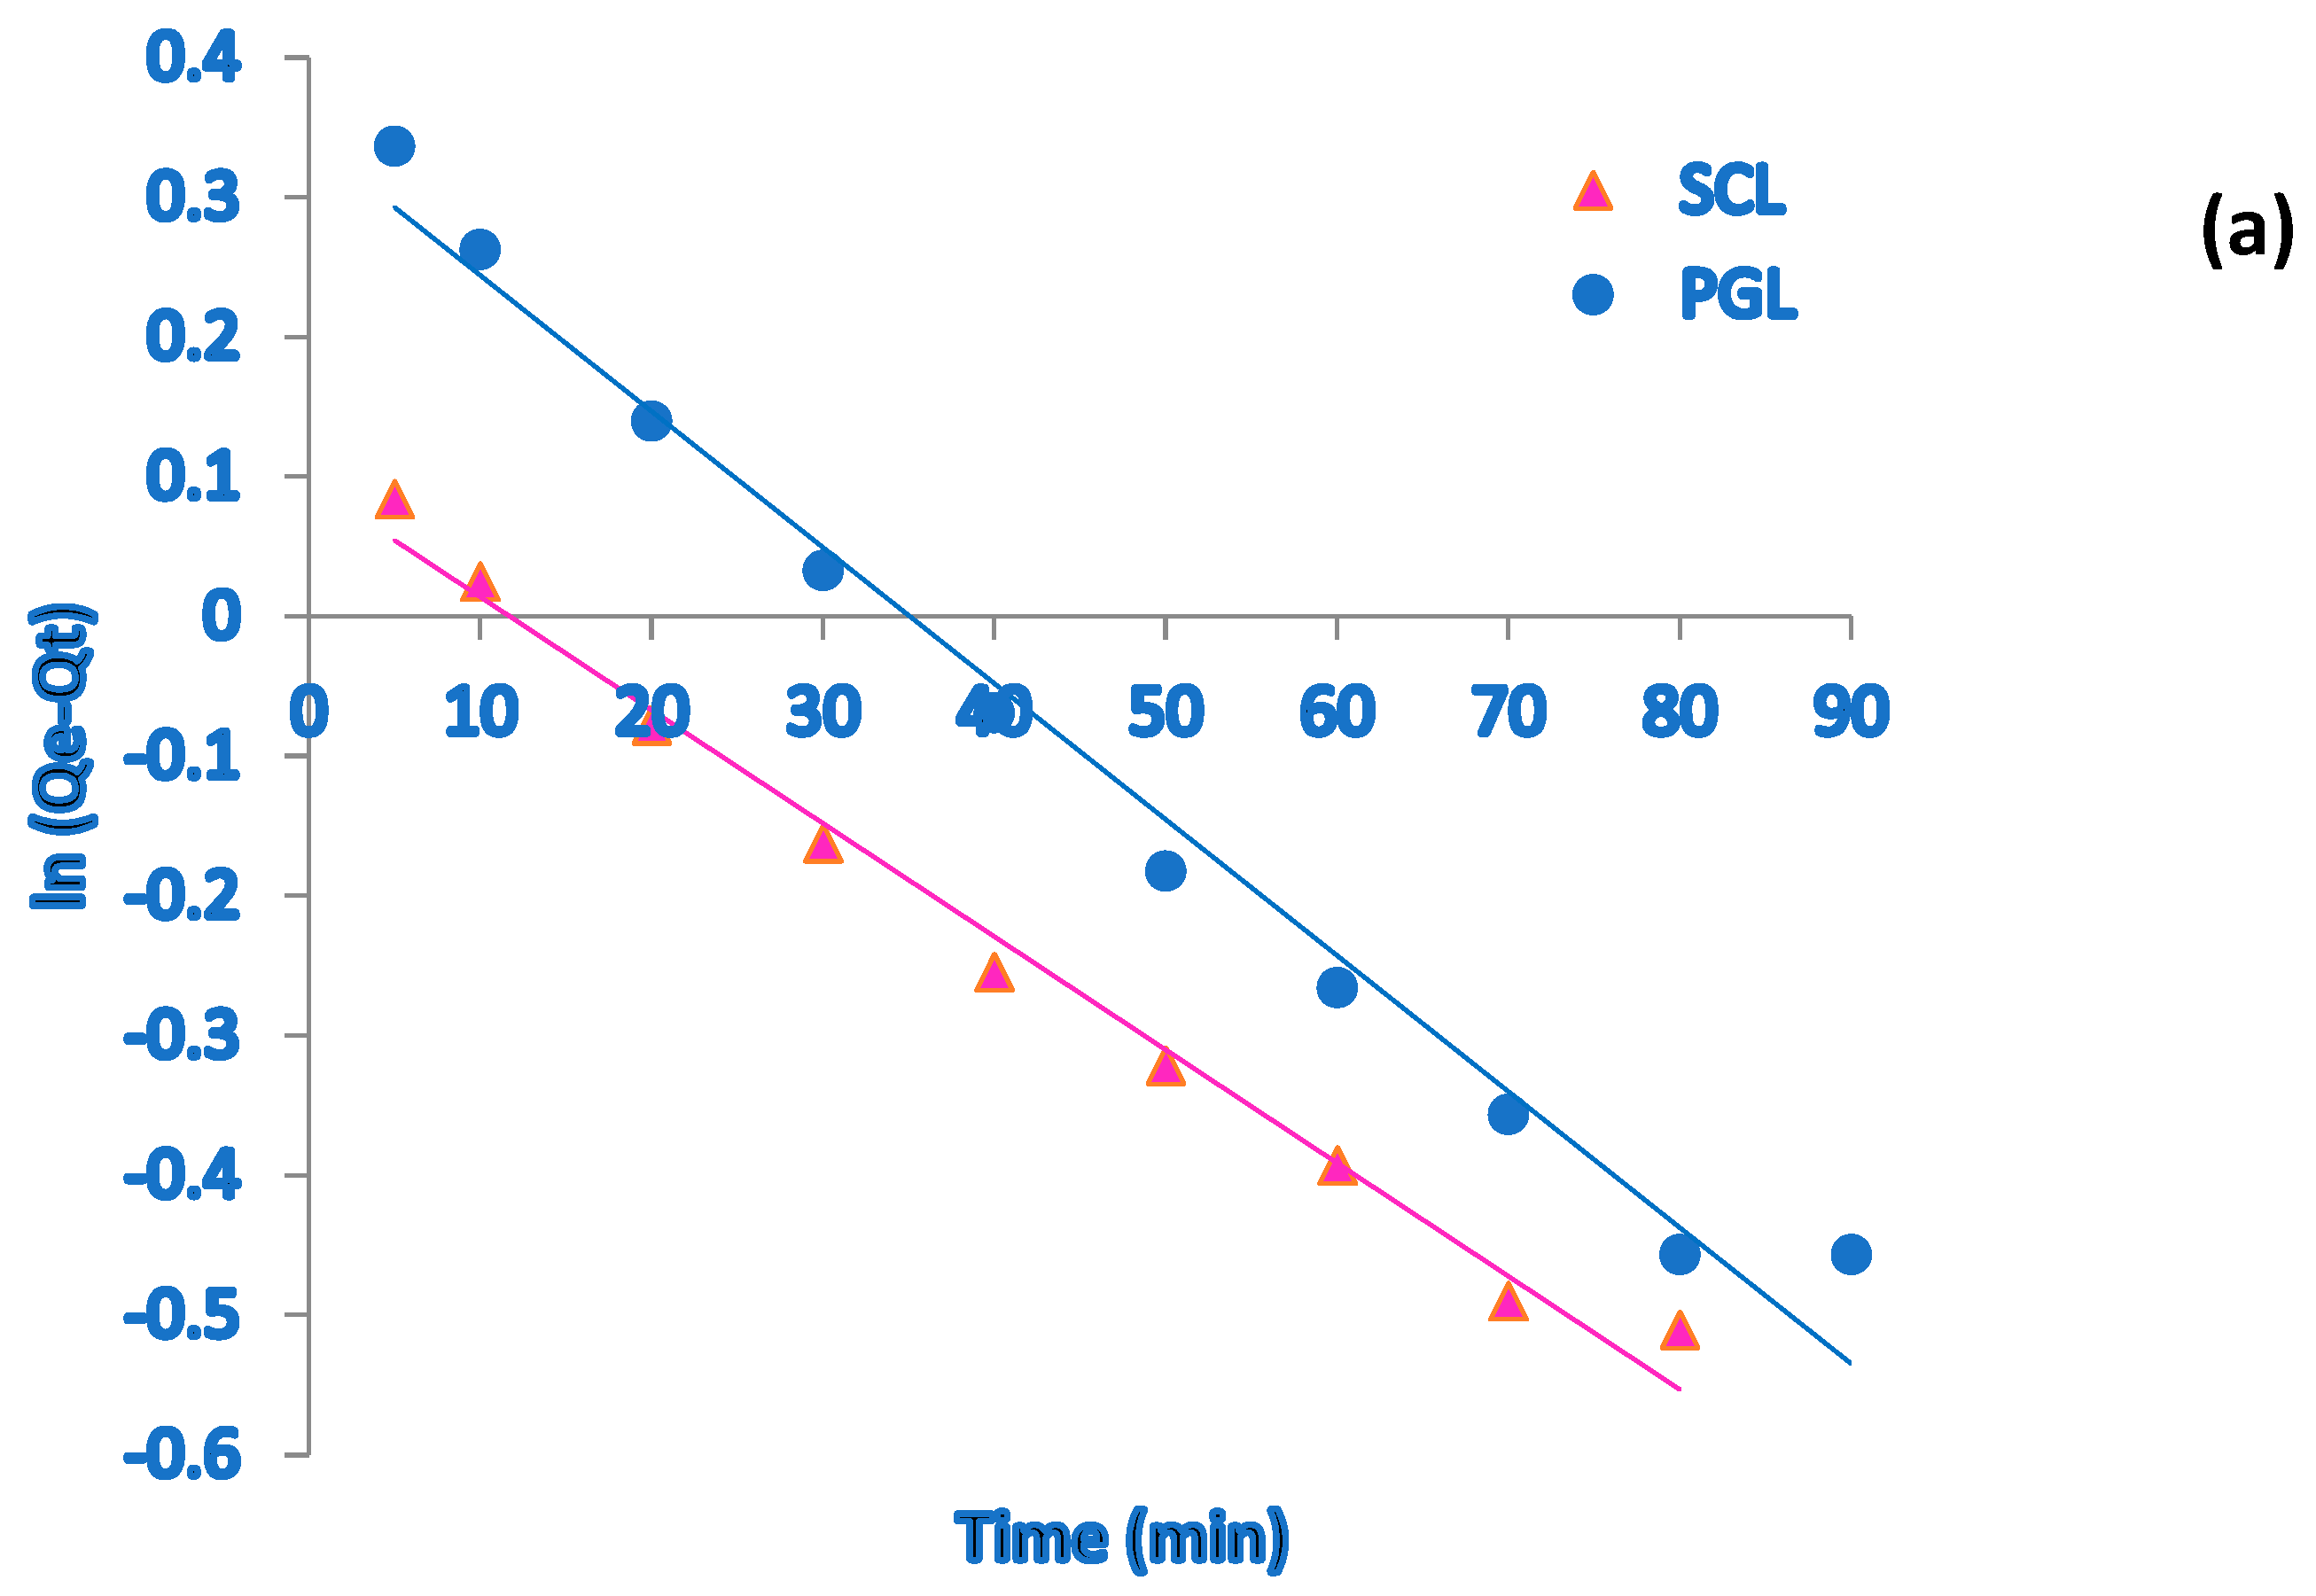
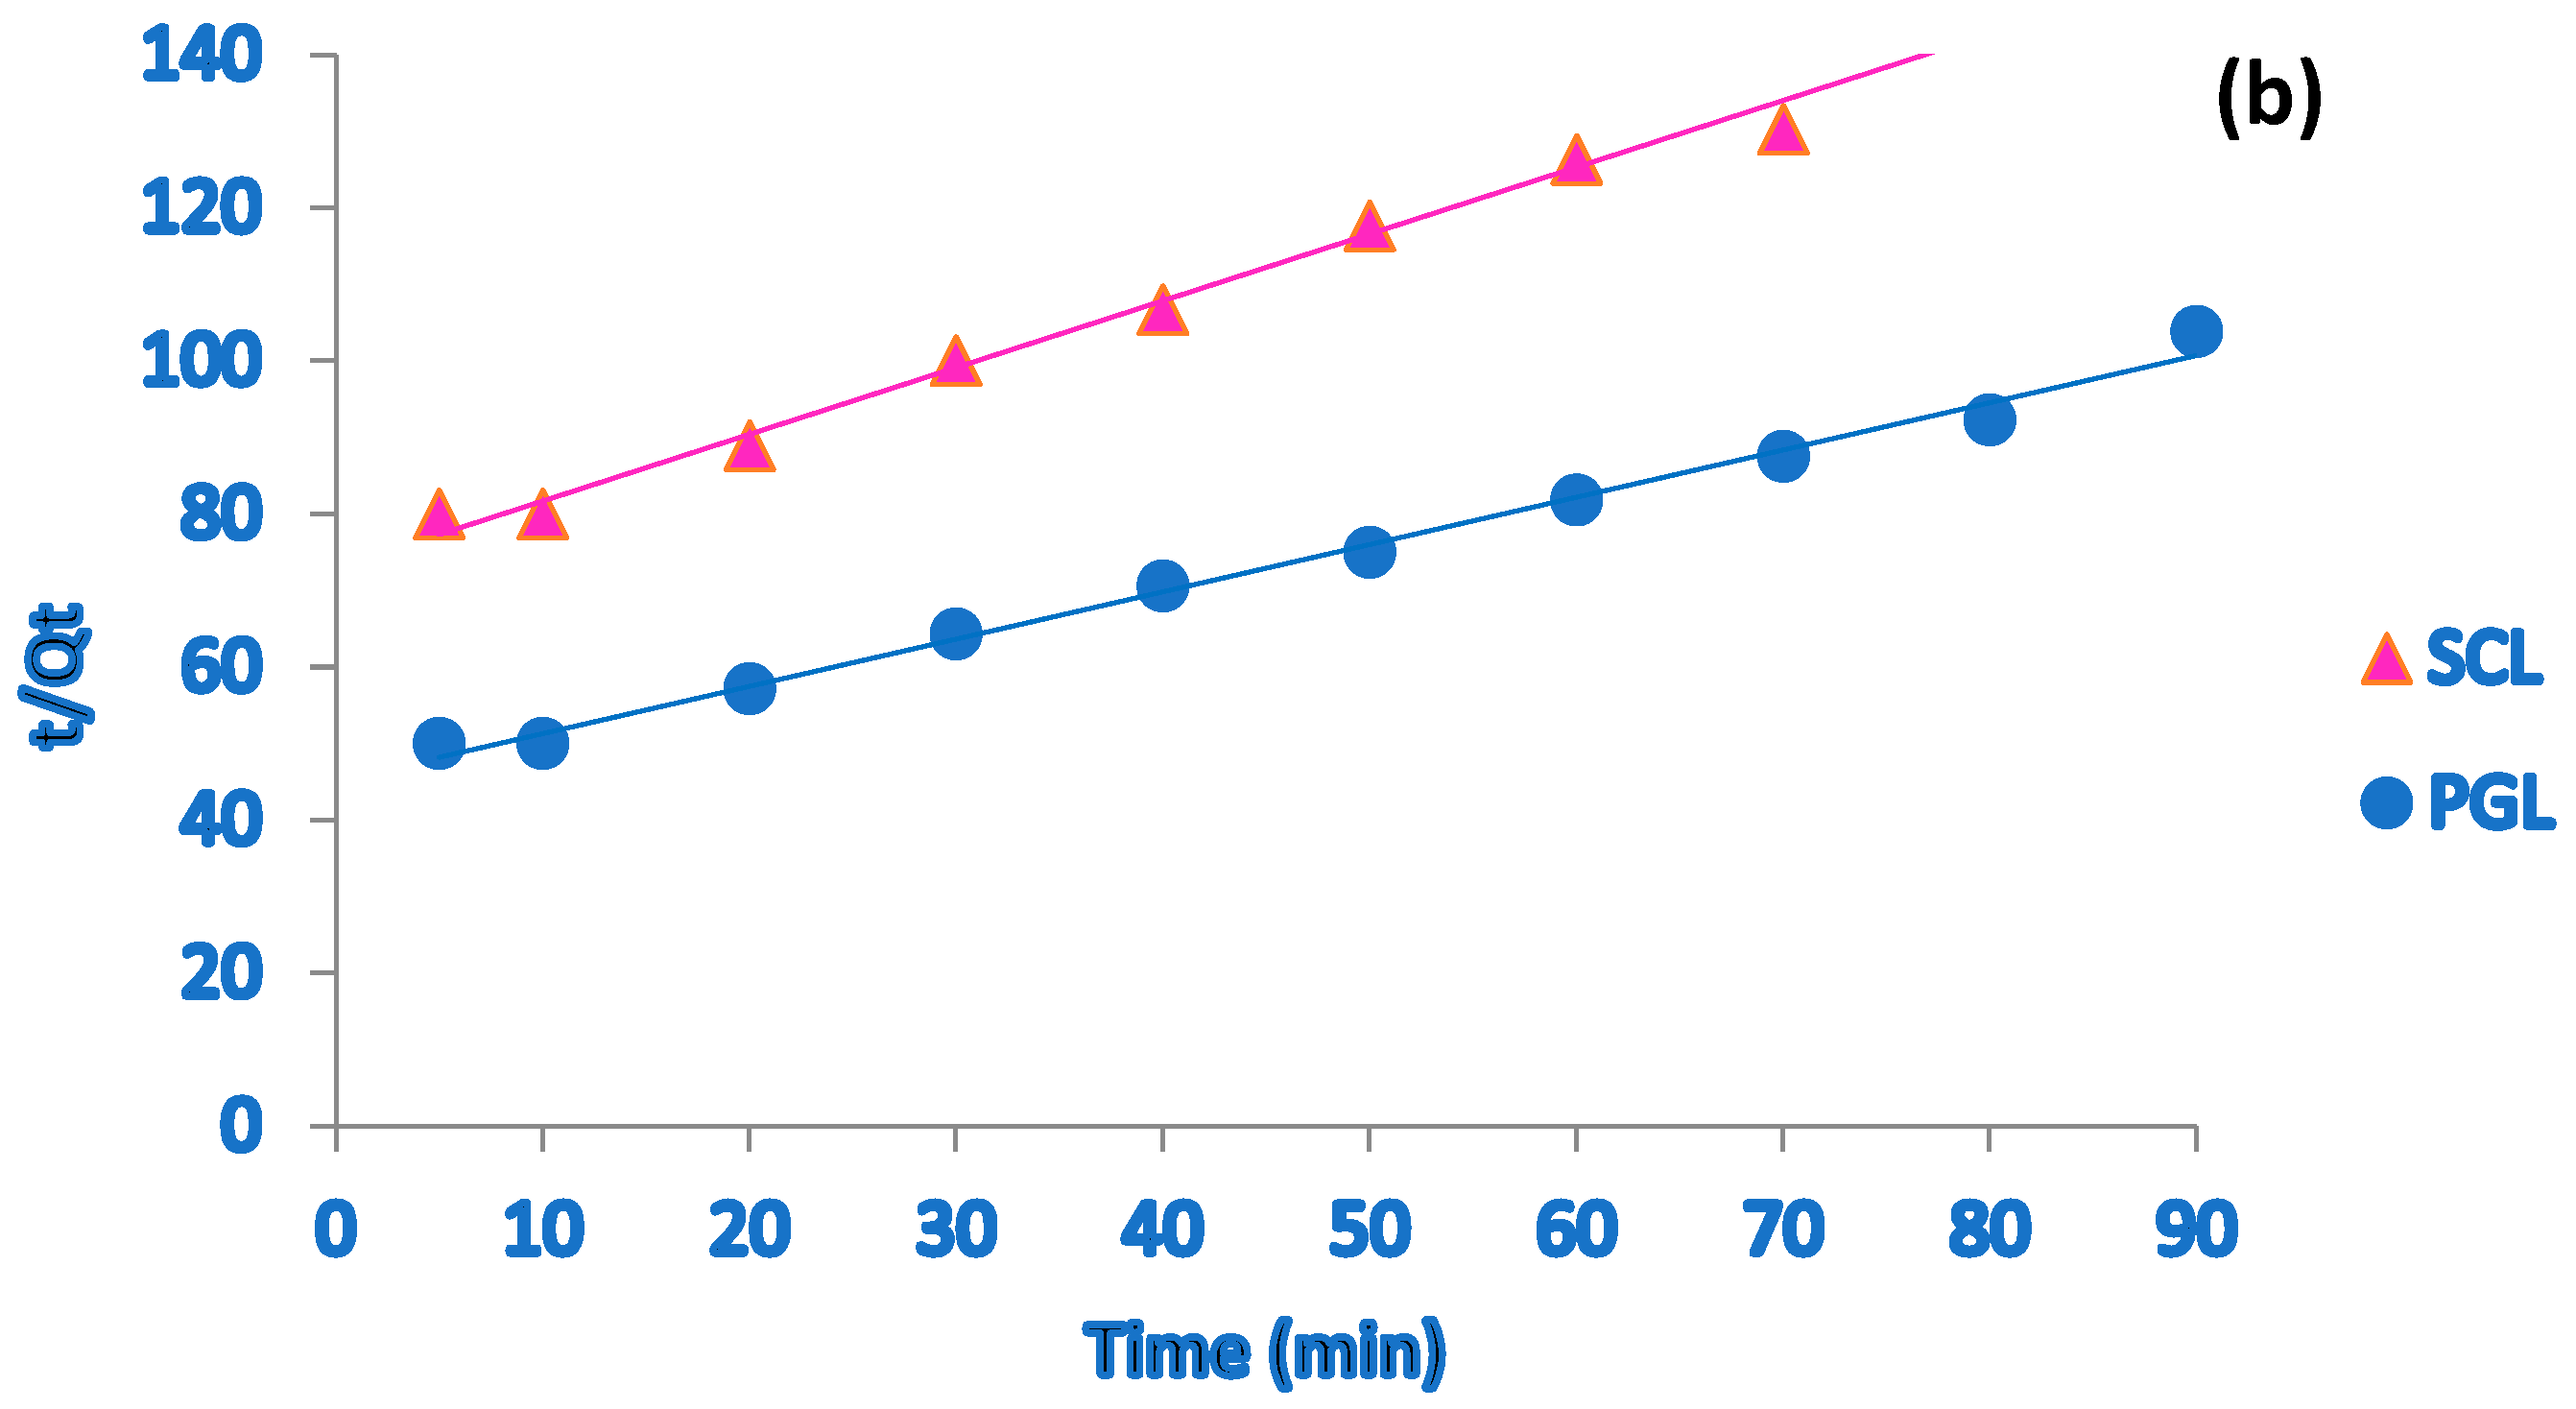
3.4.3. Effect of Contact time and Kinetic Study
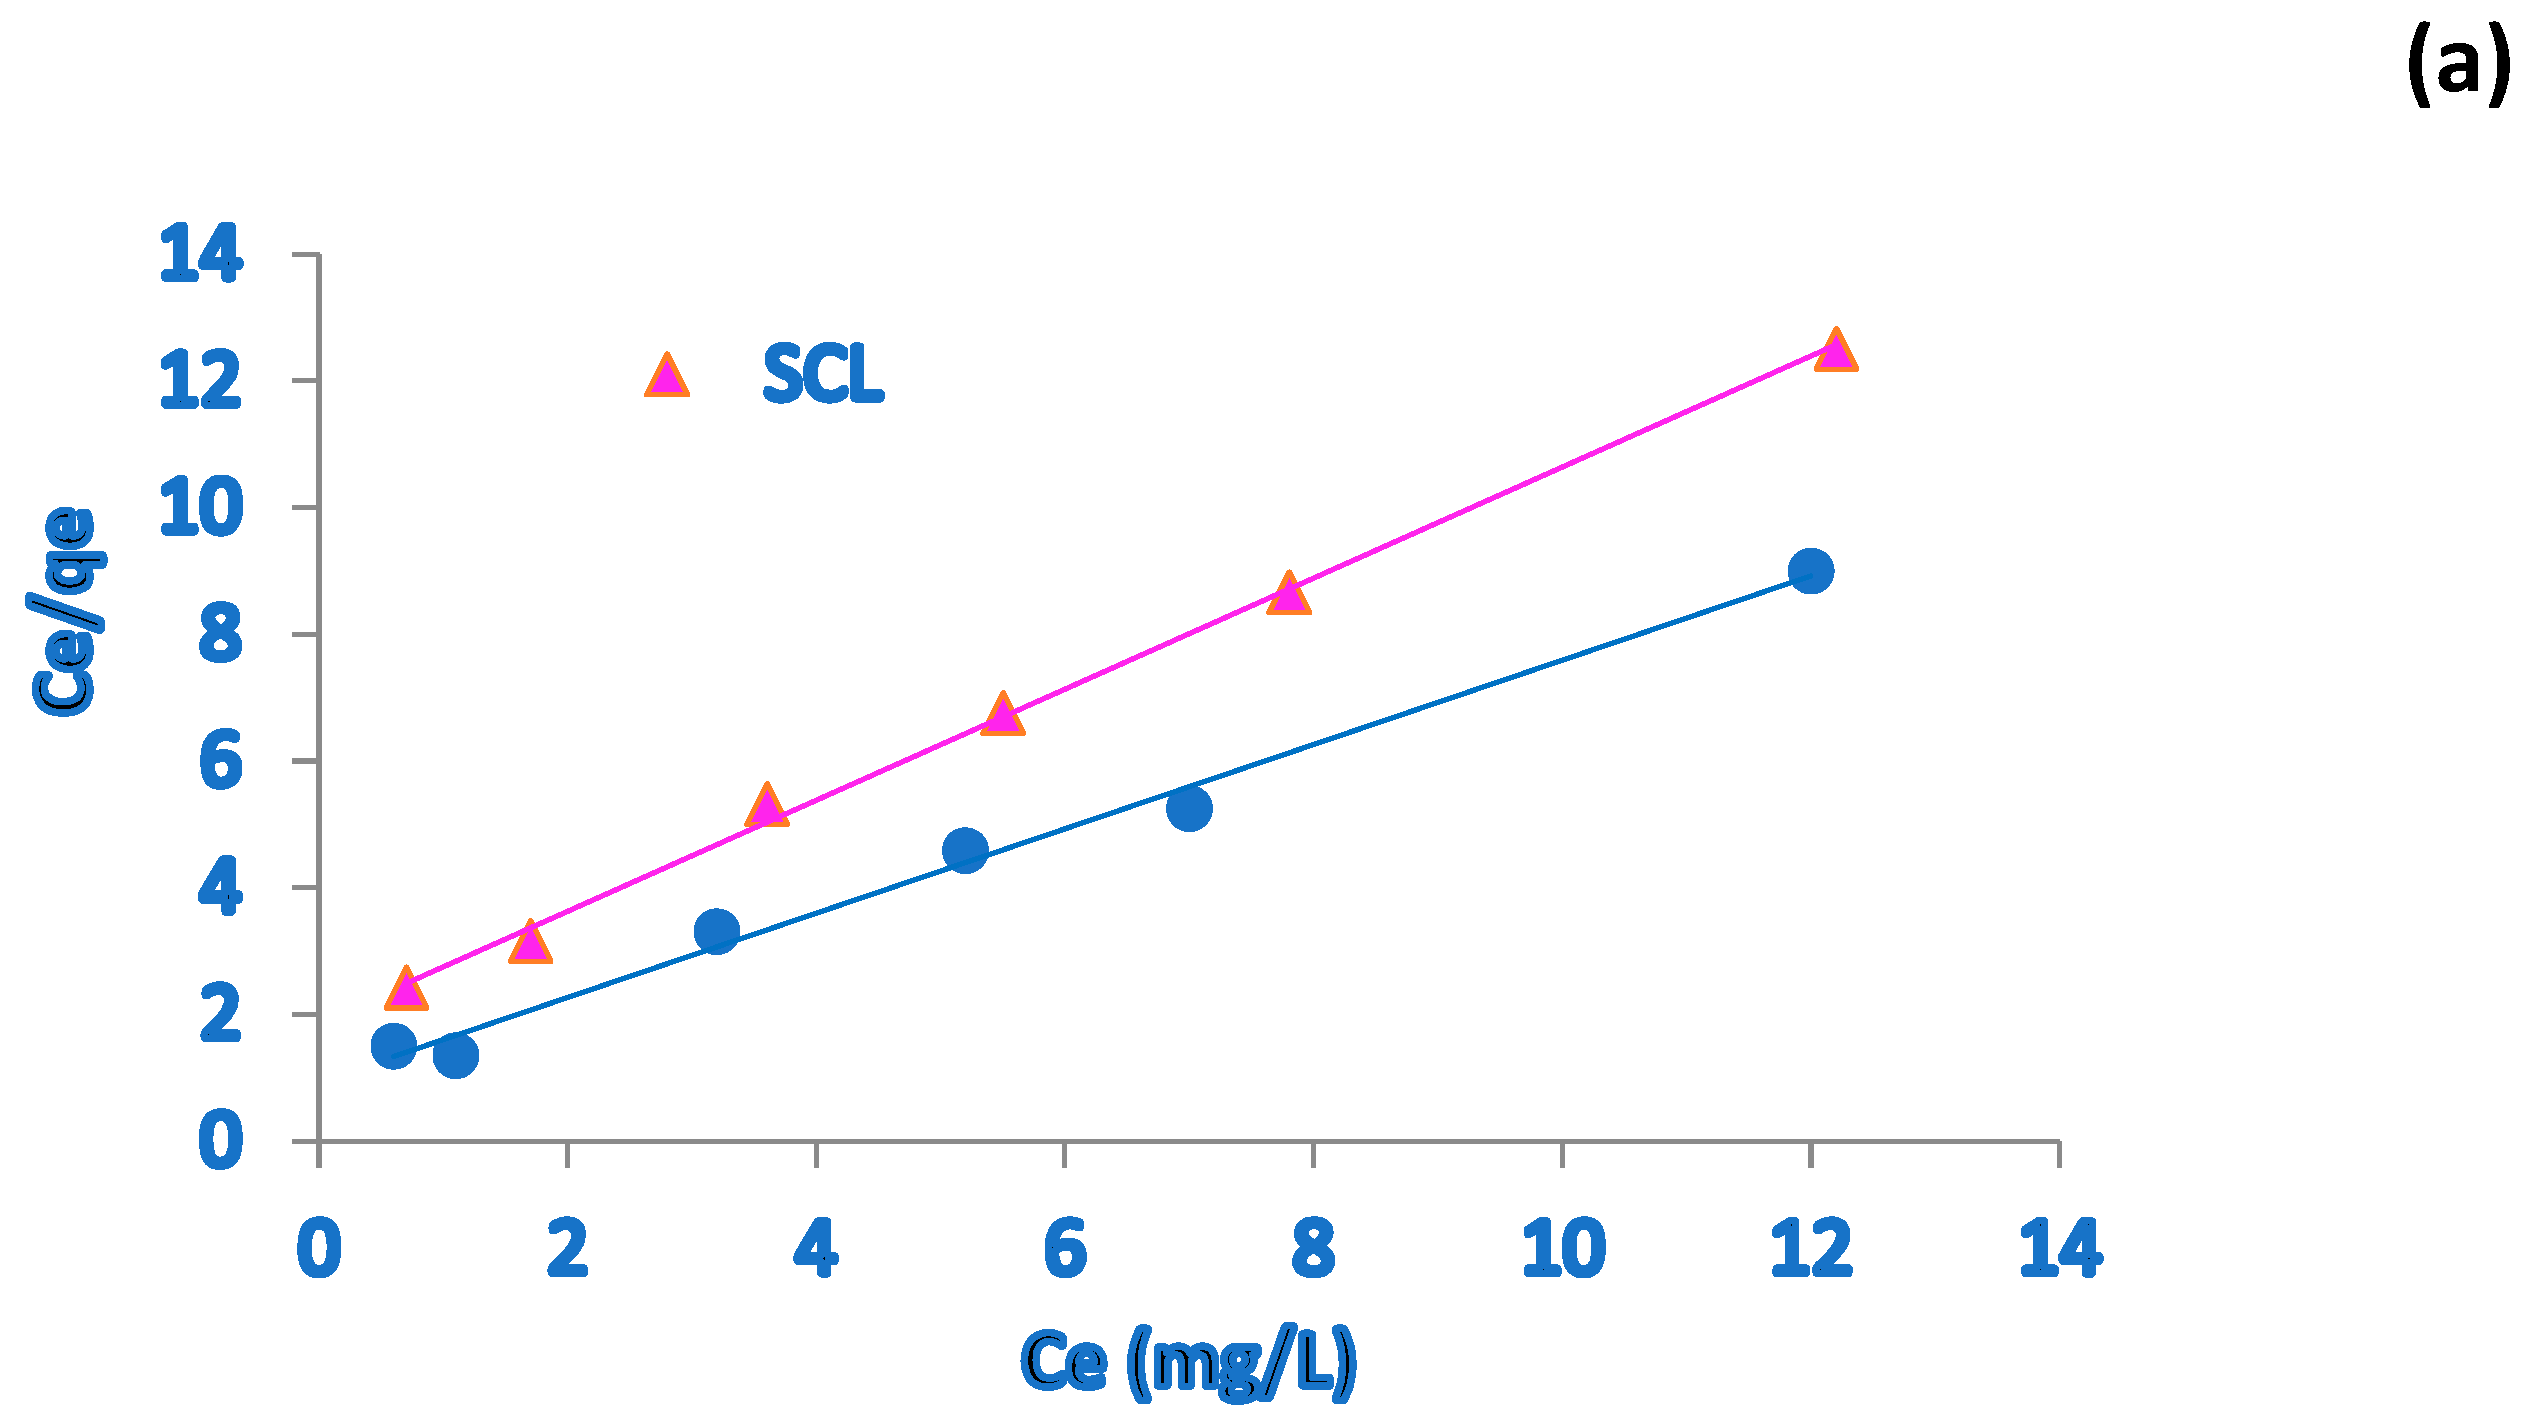
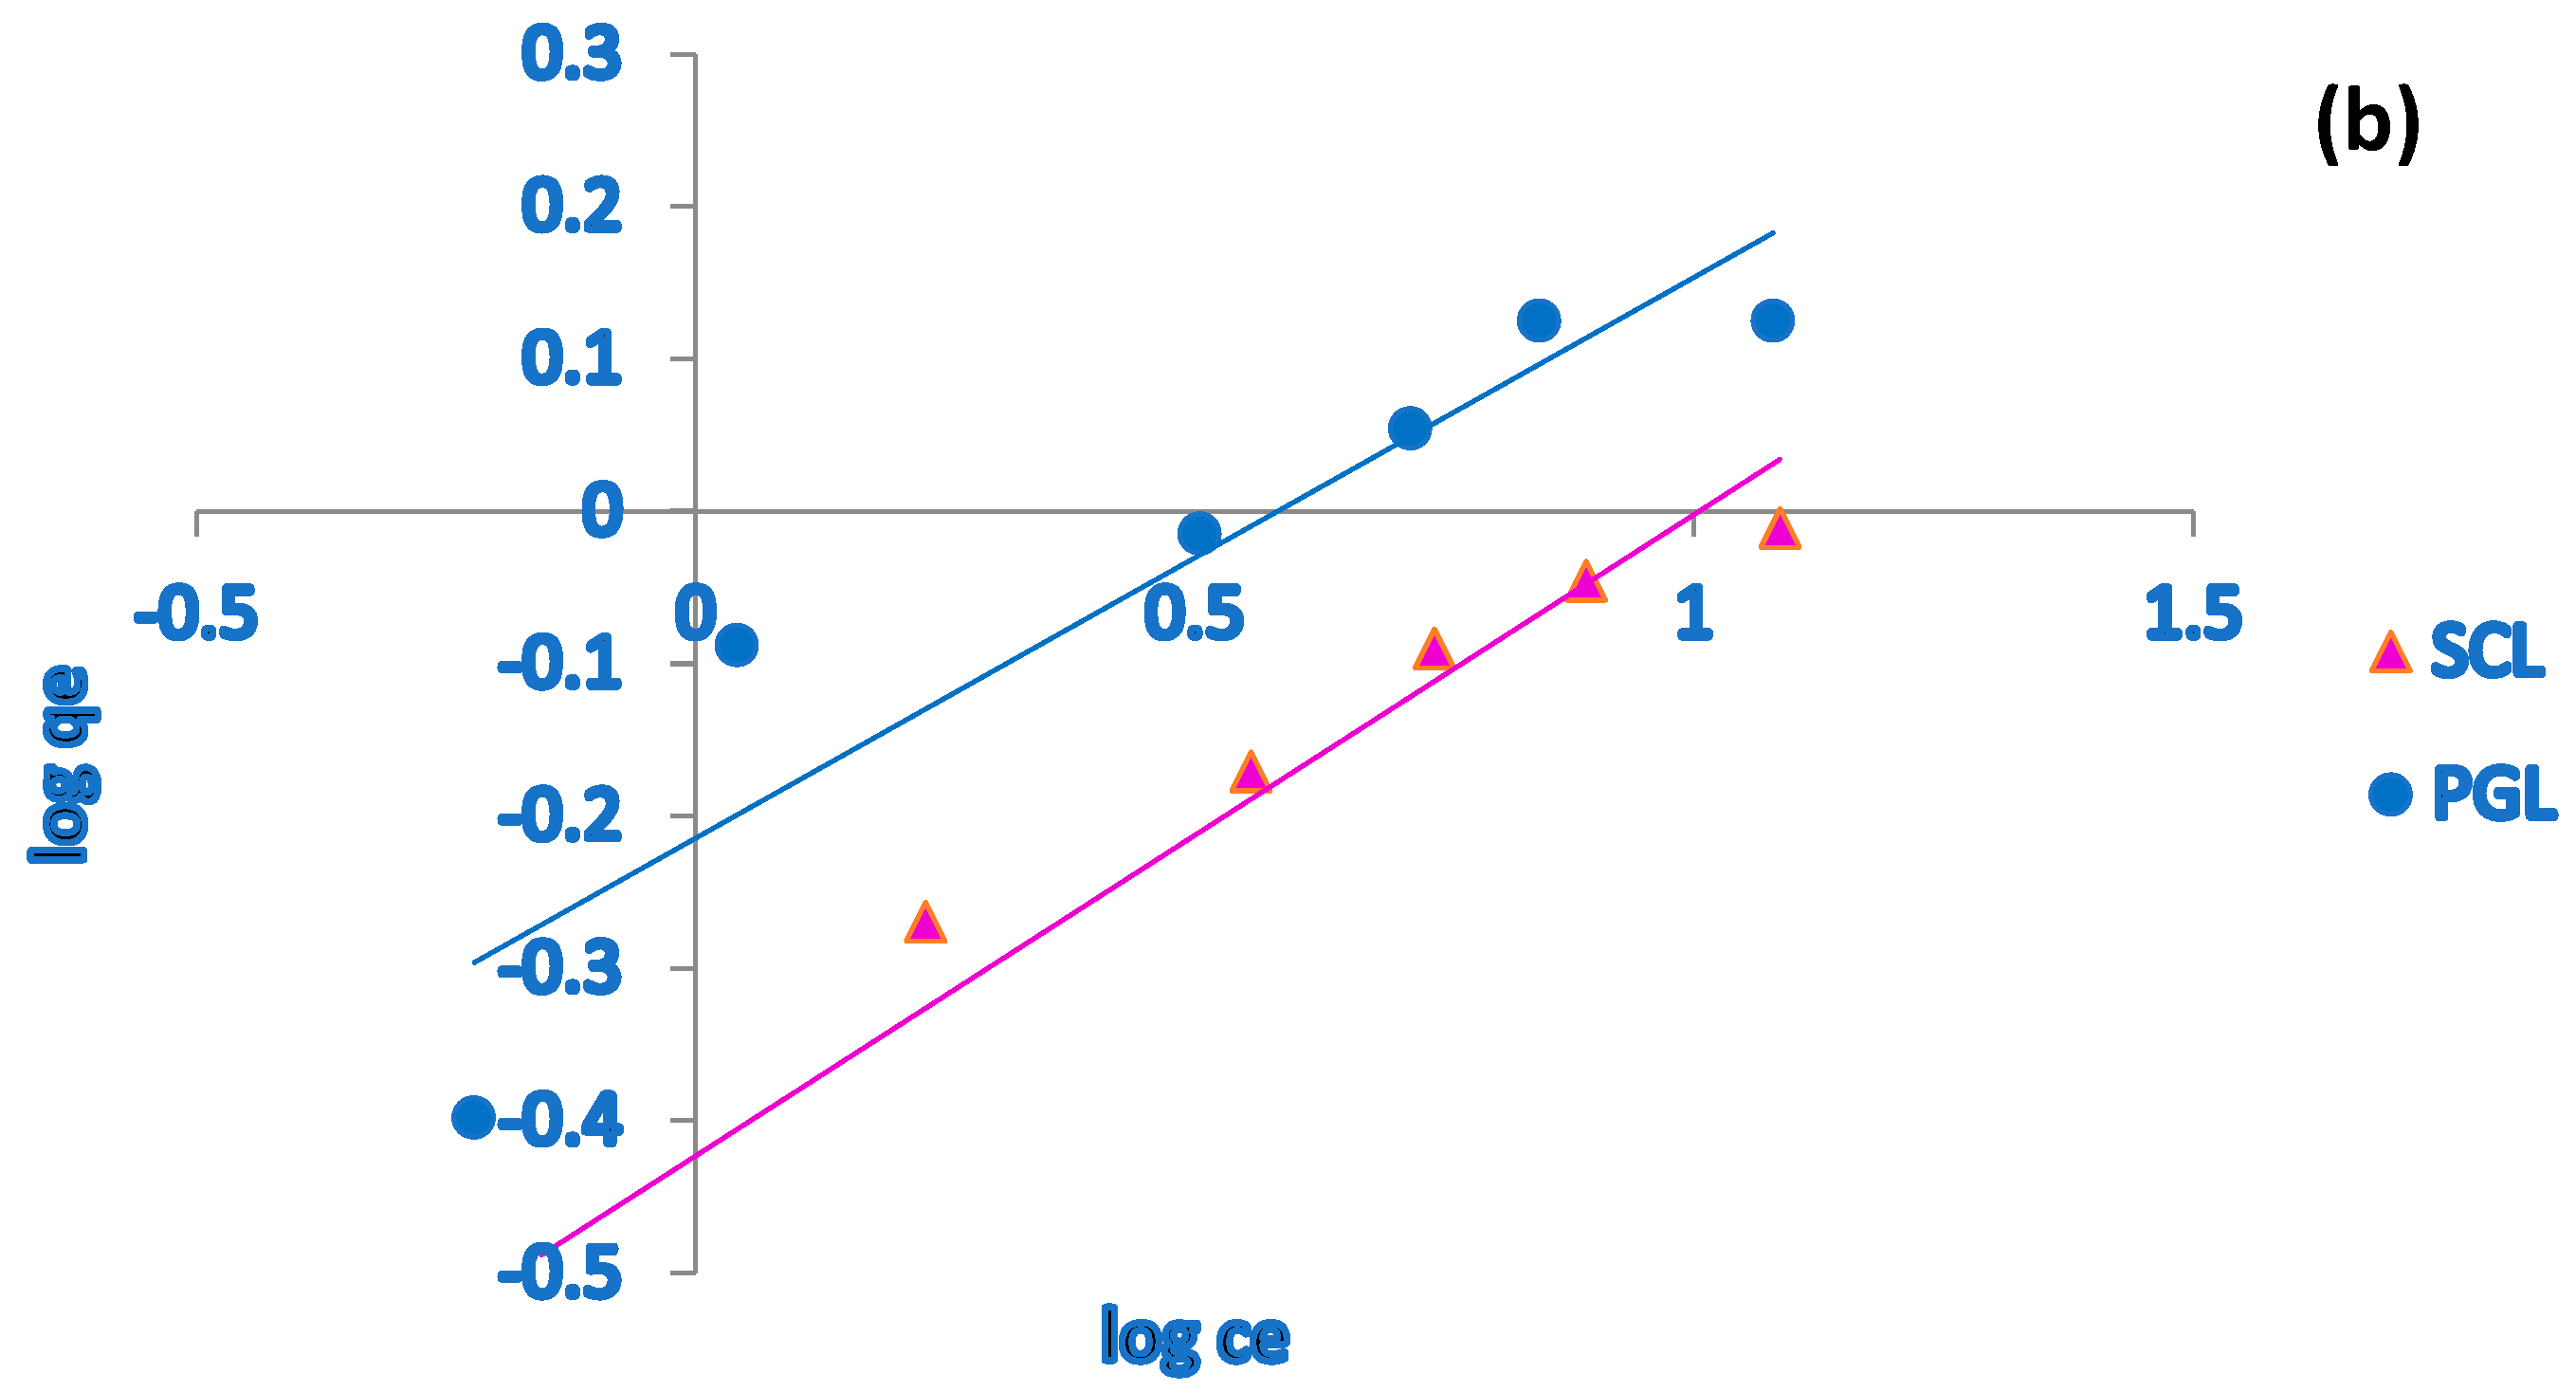
The removal efficiency of fluoride by both adsorbents was studied with respect to the contact time. In the following, an adsorption kinetic study was performed as a fundamental and important tool to understand the rate of the adsorption process and mechanisms. The results of kinetic modeling are depicted in Table 7. According to the adjusting parameters and through kinetic plots displayed in Figure 8, it can be seen that the adsorption of F onto SC and PG followed the pseudo-second-order model because it has a higher R2 of 0.99 and closer values to the experimental ones in comparison with the pseudo-first- order model. Moreover, the pseudo-second-order model suggests that the chemisorption process is the rate-limiting step based on accessible binding sites in the process of adsorption [48]. Similar results were obtained by other researchers [29,49].

3.5. Isotherm Study

Langmuir and Freundlich isotherm models were used to fit the experimental equilibrium data. The adsorption isotherms obtained for SC and PG are shown in Figure 9. Furthermore, the parameters acquired from isotherm model adjustment are presented in Table 7. For both adsorbents, the obtained data indicated that the biosorption of fluoride by both biosorbents followed the Langmuir isotherm model with a higher correlation coefficient, R2 = 0.99, than that of the Freundlich model. The Langmuir adsorption isotherm proposes a homogeneous adsorbent surface with a monolayer binding of adsorbate. The results are similar to the previous studies, where the adsorption of fluoride by adsorbents followed better the Langmuir model [44]. The maximum adsorption capacities of SC and PG, according to the Langmuir model, were 1.14 and 1.50 mg/g, respectively. As the separation factor of the Langmuir isotherm (RL) was within the range of 0 < RL < 1, it confirms the favorability of the fluoride adsorption on SC and PG, which can be calculated by applying the Langmuir constant (KL) and the initial concentration of fluoride to RL = 1/(1 + KL C0). This result further supported the Langmuir model’s suitability for explaining the adsorption of fluoride onto biosorbents under the study’s conditions. Since the values of 1/n from the Freundlich model were lower than 0.5, it can be concluded that there is strong bonding between fluoride and adsorbents, and the adsorption process is favorable [50].

3.6. Possible Biosorption Mechanisms

The FTIR spectroscopy gave useful information about the fluoride adsorption mechanisms of both biosorbents. It also revealed the presence of a variety of functional groups on the biosorbents’ surface, including hydroxyl, carbonyl, ether, etc. As discussed above, it can be anticipated that fluoride removal appears to be linked to both biosorption and ion exchange mechanisms. Given the FTIR spectra after the biosorption, there was decreased peak intensity of transmittance, indicating the ion exchange process between F in solution and hydroxyl groups (OH) on the biosorbent surface. Metal bonding such as M-F and a ligand exchange would be formed as a result of this process. In addition, interactions between negatively charged fluoride anions and positively charged adsorbent surface at pH values lower than pHzpc could lead to the formation of electrostatic attractions (Equation (10)) [2]. Moreover, at lower pH values, surface hydroxyl group protonation might facilitate the ligand exchange mechanism due to the easier displacement of OH+ from metal binding than hydroxyl groups [51]. At moderate pH values (5–7), the ion exchange will be established (Equation (11)), and at pH values greater than pHpzc, the surface becomes negatively charged due to deprotonation, which also supports that ion exchange will be the dominant mechanism for the biosorption of fluoride ions (Equation (12)) [19,52]. The related equations are displayed below:
≡AOH + H3O+ + F→ ≡AOH+2 − F + H2O
≡AOH + F → ≡AF + OH
≡A(OH)2+ 2F → ≡AF2 + 2OH
where ≡A stands for the biosorbent surface of SC and PG.

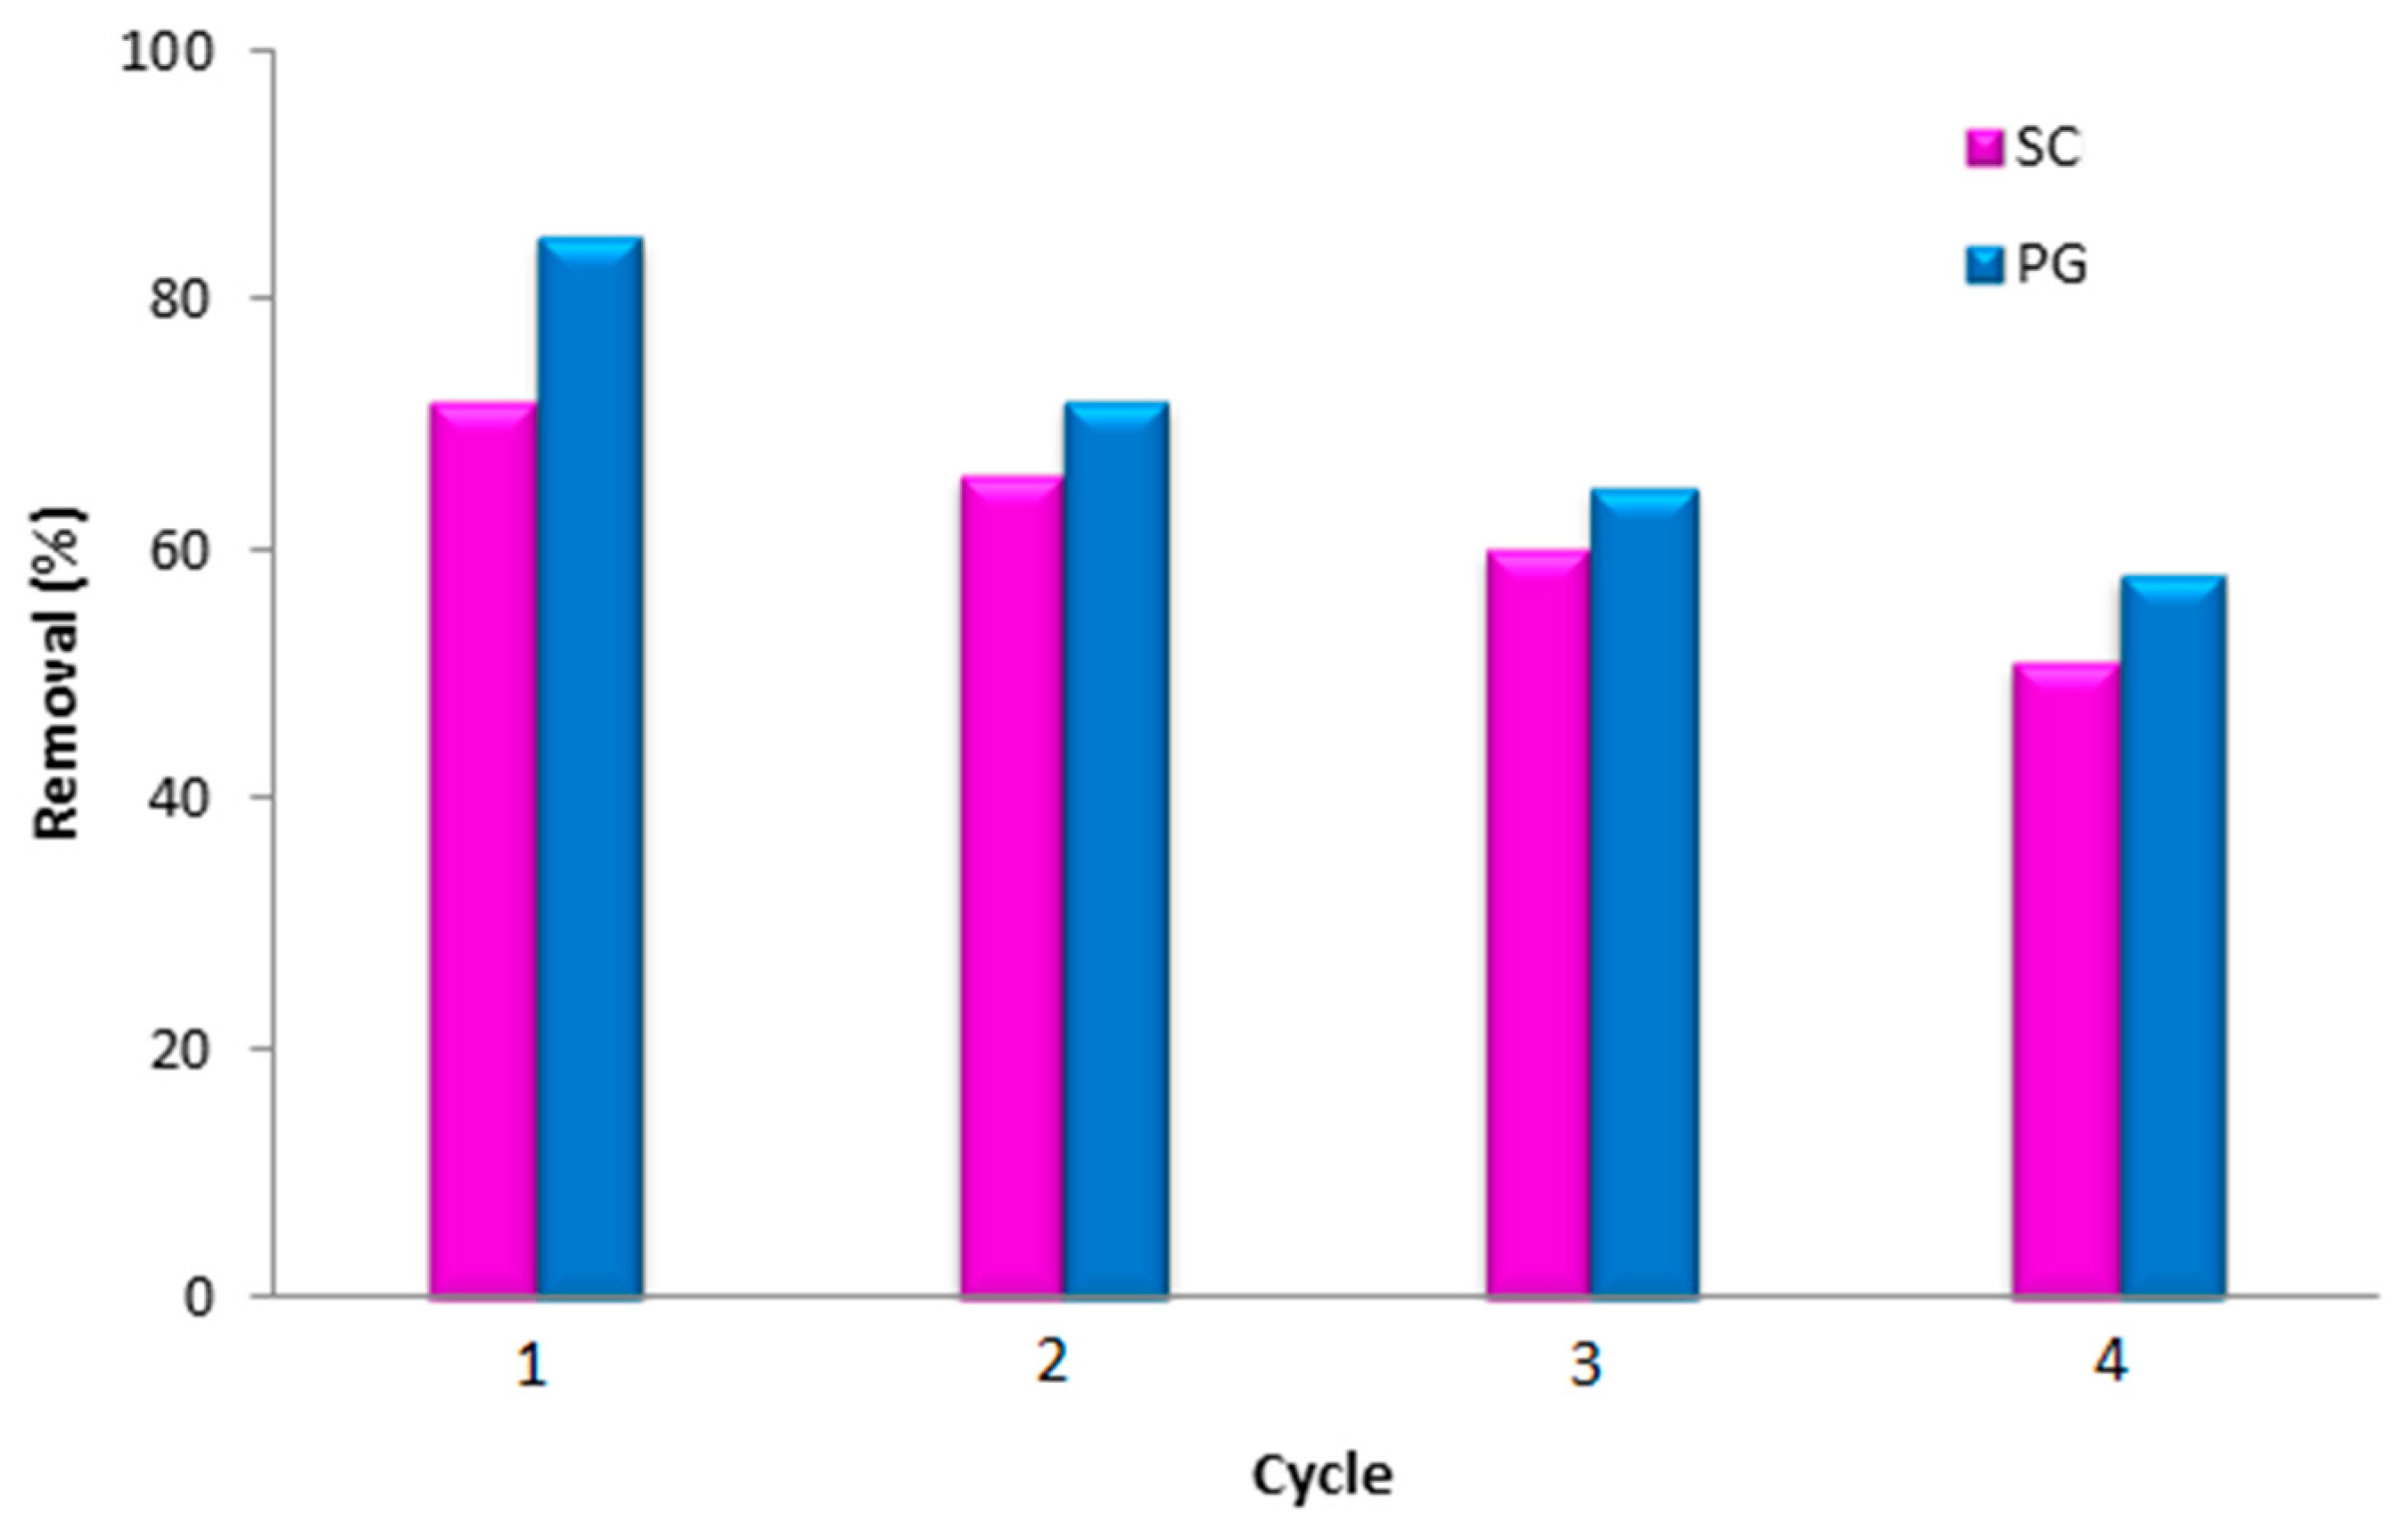
3.7. Regeneration Study

The biosorbents reusability capacity, as an important economical and applicable viewpoint, was determined by four consecutive adsorption/desorption cycles. The results are depicted in Figure 10. After each experimental run, they were separated and desorbed with NaOH 0.1 M solution for 60 min under gentle stirring; then, they were dried at 60 °C for 4 h in an oven. The as-regenerated samples were used for the next adsorption run. As shown in Figure 10, it is obvious that there is a slight reduction in the removal efficiency of regenerated adsorbents, from 72% to 51% for SC and from 85% to 58% for PG after the fourth cycle. The competition of OH ions with F at active sites resulted in regeneration and fluoride removal from active sites [53]; therefore, it can be concluded that the reusability of adsorbents is successfully achieved for de-fluoridation of contaminated water in repeated runs.

3.8. Comparison of Adsorbent Performances with Other Reported Adsorbents

Comparing the performances of both adsorbents shows that the maximum removal efficiencies of SC and PG were 72.5% and 88.3%, respectively, at an initial concentration of 6 mg/L and the equilibrium time of 75 and 90. Table 8 shows the adsorption capacity of SC and PG and those reported for other biosorbents in previous studies. It can be deduced that the maximum adsorption capacity (Qmax) of PG was 1.50 mg/g, a little higher than 1.14 mg/g obtained for SC. The presence of functional groups, high pore volume and specific surface area enhances the adsorption ability of the biosorbents. Moreover, the comparison indicated that the biosorbent had fine performance for fluoride removal, since it could provide higher adsorption capacities over some recent adsorbents such as sweet lemon peel, coffee husk, and Moringa stenopetala. Simple and low production expenses are the additional features of the biosorbents in this study.

4. Conclusions

According to the results of this study, despite a negligible specific surface area of the prepared biosorbents, they showed a high potential for fluoride removal, pointing to the -OH functional groups as crucial enhancers for the adsorption. Based on the optimization through central composite design and examining the role of four parameters, the results showed that initial pH and adsorbent dosage were the most effective factors influencing fluoride biosorption. Thus, the biosorption process mechanism was pH-dependent and controlled directly by the electrostatic attractions and hydrogen bonding. Under optimum conditions, the maximum fluoride removal efficiency was obtained for Syzygium cumini and Psidium guajava, 72.5% and 88.3%, respectively. The pseudo-second-order kinetic model showed a higher value of R2 and better linearity. Finally, it was deduced that the Langmuir isotherm model best described fluoride adsorption, highlighting a monolayer adsorption with the maximum sorption capacities of 1.14 mg/g for SC and 1.50 mg/g for PG. Conclusively, as-prepared effective biosorbents can be proposed as practical, valuable, and economic adsorbents to adsorb excess fluoride from an aqueous medium. Regarding future research, it is suggested that a new kinetic model be developed for fluoride absorption under both isothermal and non-isothermal conditions.

Author Contributions

Conceptualization, M.Q. and R.G.; methodology, data curation, software, and writing—original draft preparation, M.Q. and A.K.R.; validation and supervision, R.G.; writing—review and editing, R.G., H.A.J., R.D.C.S. and M.N. All authors have read and agreed to the published version of the manuscript.

Funding

This research was funded by the Research of QUMS, with financial supporting of Research Project No.IR.QUMS.REC.1399.404.

Institutional Review Board Statement

This study did not involve humans or animals.

Informed Consent Statement

This study did not involve humans.

Data Availability Statement

The authors confirm that the data supporting the findings of this study are available within the article.

Acknowledgments

This paper is partially the result of a Master’s thesis approved in School of Public Health, Qazvin University of Medical Sciences (QUMS). The authors wish to acknowledge the Vice Chancellery for Research of QUMS for the financial support of Research Project No.IR.QUMS.REC.1399.404, and all those who helped us with this research.

Conflicts of Interest

The authors declare no conflict of interest.

References

  1. Chigondo, M.; Paumo, H.K.; Bhaumik, M.; Pillay, K.; Maity, A. Hydrous CeO2-Fe3O4 decorated polyaniline fibers nanocomposite for effective defluoridation of drinking water. J. Colloid Interface Sci. 2018, 532, 500–516. [Google Scholar] [CrossRef] [PubMed]
  2. Dehghani, M.H.; Gholami, S.; Karri, R.R.; Lima, E.C.; Mahvi, A.H.; Nazmara, S.; Fazlzadeh, M. Process modeling, characterization, optimization, and mechanisms of fluoride adsorption using magnetic agro-based adsorbent. J. Environ. Manag. 2021, 286, 112173. [Google Scholar] [CrossRef] [PubMed]
  3. Chaudhary, K.; Saraswat, P.K.; Khan, S. Improvement in fluoride remediation technology using GIS based mapping of fluoride contaminated groundwater and microbe assisted phytoremediation. Ecotoxicol. Environ. Saf. 2019, 168, 164–176. [Google Scholar] [CrossRef] [PubMed]
  4. Ye, C.; Yan, B.; Ji, X.; Liao, B.; Gong, R.; Pei, X.; Liu, G. Adsorption of fluoride from aqueous solution by fly ash cenospheres modified with paper mill lime mud: Experimental and modeling. Ecotoxicol. Environ. Saf. 2019, 180, 366–373. [Google Scholar] [CrossRef] [PubMed]
  5. WHO. Guidlines for Drinking-Water Quality, Fourth Edition Incorporaing the First Addendum; World Health Organization: Geneva, Switzerland, 2017. [Google Scholar]
  6. WHO. Trace Elements in Human Nutrition and Health; World Health Organization: Geneva, Switzerland, 1996. [Google Scholar]
  7. Alhassan, S.I.; Huang, L.; He, Y.; Yan, L.; Wu, B.; Wang, H. Fluoride removal from water using alumina and aluminum-based composites: A comprehensive review of progress. Crit. Rev. Environ. Sci. Technol. 2021, 51, 2051–2208. [Google Scholar] [CrossRef]
  8. Onipe, T.; Edokpayi, J.N.; Odiyo, J.O. A review on the potential sources and health implications of fluoride in groundwater of Sub-Saharan Africa. J. Environ. Sci. Health A 2020, 55, 1078–1093. [Google Scholar] [CrossRef] [PubMed]
  9. Grzegorzek, M.; Majewska-Nowak, K.; Ahmed, A.E. Removal of fluoride from multicomponent water solutions with the use of monovalent selective ion-exchange membranes. Sci. Total Environ. 2020, 722, 137681. [Google Scholar] [CrossRef]
  10. Khalid, S.H.; Andy, S.; Rafid, A.K.; Montserrat Ortoneda, P.; David, P. Defluoridation of drinking water using a new flow column-electrocoagulation reactor (FCER)-Experimental, statistical, and economic approach. J. Environ. Manag. 2017, 197, 80–88. [Google Scholar] [CrossRef]
  11. Jadhav, S.V.; Marathe, K.V.; Rathod, V.K. A pilot scale concurrent removal of fluoride, arsenic, sulfate and nitrate by using nanofiltration: Competing ion interaction and modelling approach. J. Water Process. Eng. 2016, 13, 153–167. [Google Scholar] [CrossRef]
  12. Borgohain, X.; Boruah, A.; Sarma, G.K.; Rashid, M.H. Rapid and extremely high adsorption performance of porous MgO nanostructures for fluoride removal from water. J. Mol. Liq. 2020, 305, 112799. [Google Scholar] [CrossRef]
  13. Araga, R.; Soni, S.; Sharma, C.S. Fluoride adsorption from aqueous solution using activated carbon obtained from KOH-treated jamun (Syzygium cumini) seed. J. Environ. Chem. Eng. 2017, 5, 5608–5616. [Google Scholar] [CrossRef]
  14. Paudyal, H.; Pangeni, B.; Inoue, K.; Kawakita, H.; Ohto, K.; Harada, H.; Alam, S. Adsorptive removal of fluoride from aqueous solution using orange waste loaded with multi-valent metal ions. J. Hazard. Mater. 2011, 192, 676–682. [Google Scholar] [CrossRef] [PubMed]
  15. Roy, S.; Sengupta, S.; Manna, S.; Das, P. Chemically reduced tea waste biochar and its application in treatment of fluoride containing wastewater: Batch and optimization using response surface methodology. Process Saf. Environ. Prot. 2018, 116, 553–563. [Google Scholar] [CrossRef]
  16. Goswami, R.; Kumar, M. Removal of fluoride from aqueous solution using nanoscale rice husk biochar. Groundw. Sustain. Dev. 2018, 7, 446–451. [Google Scholar] [CrossRef]
  17. Mei, L.; Qiao, H.; Ke, F.; Peng, C.; Hou, R.; Wan, X.; Cai, H. One-step synthesis of zirconium dioxide-biochar derived from Camellia oleifera seed shell with enhanced removal capacity for fluoride from water. Appl. Surf. Sci. 2020, 509, 144685. [Google Scholar] [CrossRef]
  18. Tirkey, P.; Bhattacharya, T.; Chakraborty, S. Optimization of fluoride removal from aqueous solution using Jamun (Syzygium cumini) leaf ash. Process Saf. Environ. Prot. 2018, 115, 125–138. [Google Scholar] [CrossRef]
  19. Khound, N.J.; Bharali, R.K. Biosorption of fluoride from aqueous medium by Indian sandalwood (Santalum album) leaf powder. J. Environ. Chem. Eng. 2018, 6, 1726–1735. [Google Scholar] [CrossRef]
  20. Hegde, R.M.; Rego, R.M.; Potla, K.M.; Kurkuri, M.D.; Kigga, M. Bio-inspired materials for defluoridation of water: A review. Chemosphere 2020, 253, 126657. [Google Scholar] [CrossRef]
  21. Ramos-Vargas, S.; Alfaro-Cuevas-Villanueva, R.; Huirache-Acuña, R.; Cortés-Martínez, R. Removal of fluoride and arsenate from aqueous solutions by aluminum-modified guava seeds. Appl. Sci. 2018, 8, 1807. [Google Scholar] [CrossRef] [Green Version]
  22. Adeniyi, A.G.; Ighalo, J.O. Biosorption of pollutants by plant leaves: An empirical review. J. Environ. Chem. Eng. 2019, 7, 103100. [Google Scholar] [CrossRef]
  23. Mahmood, T.; Saddique, M.T.; Naeem, A.; Westerhoff, P.; Mustafa, S.; Alum, A. Comparison of different methods for the point of zero charge determination of NiO. Ind. Eng. Chem. Res. 2011, 50, 10017–10023. [Google Scholar] [CrossRef]
  24. APHA; AWWA; WPCF. Standard Methods for the Examination of Water and Wastewater, 23rd ed.; American Public Health Association: Washington, DC, USA; American Water Work Association: Denver, CO, USA; Water Environment Federation: Alexandria, VA, USA, 2017. [Google Scholar]
  25. Birniwa, A.H.; Mahmud, H.N.; Abdullahi, S.S.; Habibu, S.; Jagaba, A.H.; Ibrahim, M.N.; Ahmad, A.; Alshammari, M.B.; Parveen, T.; Umar, K. Adsorption behavior of methylene blue cationic dye in aqueous solution using polypyrrole-polyethylenimine nano-adsorbent. Polymers 2022, 14, 3362. [Google Scholar] [CrossRef]
  26. Darvishi Cheshmeh Soltani, R.; Rezaee, A.; Khataee, A.; Godini, H. Optimisation of the operational parameters during a biological nitrification process using response surface methodology. Can. J. Chem. Eng. 2014, 92, 13–22. [Google Scholar] [CrossRef]
  27. Zazouli, M.A.; Mahvi, A.H.; Mahdavi, Y.; Balarak, D. Isothermic and kinetic modeling of fluoride removal from water by means of the natural biosorbents sorghum and canola. Fluoride 2015, 48, 37–44. [Google Scholar]
  28. El Naga, A.O.A.; El Saied, M.; Shaban, S.A.; El Kady, F.Y. Fast removal of diclofenac sodium from aqueous solution using sugar cane bagasse-derived activated carbon. J. Mol. Liq. 2019, 285, 9–19. [Google Scholar] [CrossRef]
  29. Meilani, V.; Lee, J.-I.; Kang, J.-K.; Lee, C.-G.; Jeong, S.; Park, S.-J. Application of aluminum-modified food waste biochar as adsorbent of fluoride in aqueous solutions and optimization of production using response surface methodology. Microporous Mesoporous Mater. 2021, 312, 110764. [Google Scholar] [CrossRef]
  30. Babu, A.N.; Reddy, D.S.; Kumar, G.S.; Ravindhranath, K.; Mohan, G.K. Removal of lead and fluoride from contaminated water using exhausted coffee grounds based bio-sorbent. J. Environ. Manag. 2018, 218, 602–612. [Google Scholar] [CrossRef]
  31. Yu, X.; Tong, S.; Ge, M.; Zuo, J. Removal of fluoride from drinking water by cellulose@ hydroxyapatite nanocomposites. Carbohydr. Polym. 2013, 92, 269–275. [Google Scholar] [CrossRef]
  32. Mohan, S.; Sreelakshmi, G. Fixed bed column study for heavy metal removal using phosphate treated rice husk. J. Hazard. Mater. 2008, 153, 75–82. [Google Scholar] [CrossRef]
  33. Mohan, D.; Sharma, R.; Singh, V.K.; Steele, P.; Pittman, C.U., Jr. Fluoride removal from water using bio-char, a green waste, low-cost adsorbent: Equilibrium uptake and sorption dynamics modeling. Ind. Eng. Chem. Res. 2012, 51, 900–914. [Google Scholar] [CrossRef]
  34. Cai, H.; Xu, L.; Chen, G.; Peng, C.; Ke, F.; Liu, Z.; Li, D.; Zhang, Z.; Wan, X. Removal of fluoride from drinking water using modified ultrafine tea powder processed using a ball-mill. Appl. Surf. Sci. 2016, 375, 74–84. [Google Scholar] [CrossRef]
  35. Brahman, K.D.; Kazi, T.G.; Baig, J.A.; Afridi, H.I.; Arain, S.S.; Saraj, S.; Arain, M.B.; Arain, S.A. Biosorptive removal of inorganic arsenic species and fluoride from aqueous medium by the stem of Tecomella undulate. Chemosphere 2016, 150, 320–328. [Google Scholar] [CrossRef]
  36. Beltrame, K.K.; Cazetta, A.L.; de Souza, P.S.; Spessato, L.; Silva, T.L.; Almeida, V.C. Adsorption of caffeine on mesoporous activated carbon fibers prepared from pineapple plant leaves. Ecotoxicol. Environ. Saf. 2018, 147, 64–71. [Google Scholar] [CrossRef]
  37. De Luna, M.D.G.; Budianta, W.; Rivera, K.K.P.; Arazo, R.O. Removal of sodium diclofenac from aqueous solution by adsorbents derived from cocoa pod husks. J. Environ. Chem. Eng. 2017, 5, 1465–1474. [Google Scholar] [CrossRef]
  38. Roy, S.; Das, P.; Sengupta, S.; Manna, S. Calcium impregnated activated charcoal: Optimization and efficiency for the treatment of fluoride containing solution in batch and fixed bed reactor. Process Saf. Environ. Prot. 2017, 109, 18–29. [Google Scholar] [CrossRef]
  39. Mourabet, M.; El Rhilassi, A.; El Boujaady, H.; Bennani-Ziatni, M.; El Hamri, R.; Taitai, A. Removal of fluoride from aqueous solution by adsorption on hydroxyapatite (HAp) using response surface methodology. J. Saudi Chem. Soc. 2015, 19, 603–615. [Google Scholar] [CrossRef] [Green Version]
  40. Shakeri, E.; Mousazadeh, M.; Ahmadpari, H.; Kabdasli, I.; Jamali, H.A.; Graca, N.S.; Emamjomeh, M.M. Electrocoagulation-flotation treatment followed by sedimentation of carpet cleaning wastewater: Optimization of key operating parameters via RSM-CCD. Desalin. Water Treat. 2021, 227, 163–176. [Google Scholar] [CrossRef]
  41. Padhi, S.; Tokunaga, T. Surface complexation modeling of fluoride sorption onto calcite. J. Environ. Chem. Eng. 2015, 3, 1892–1900. [Google Scholar] [CrossRef]
  42. Hasan, Z.; Jhung, S.H. Removal of hazardous organics from water using metal-organic frameworks (MOFs): Plausible mechanisms for selective adsorptions. J. Hazard. Mater. 2015, 283, 329–339. [Google Scholar] [CrossRef]
  43. Bibi, S.; Farooqi, A.; Yasmin, A.; Kamran, M.A.; Niazi, N.K. Arsenic and fluoride removal by potato peel and rice husk (PPRH) ash in aqueous environments. Int. J. Phytoremediation 2017, 19, 1029–1036. [Google Scholar] [CrossRef]
  44. Massoudinejad, M.; Ghaderpoori, M.; Shahsavani, A.; Amini, M.M. Adsorption of fluoride over a metal organic framework Uio-66 functionalized with amine groups and optimization with response surface methodology. J. Mol. Liq. 2016, 221, 279–286. [Google Scholar] [CrossRef]
  45. Zendehdel, M.; Shoshtari-Yeganeh, B.; Khanmohamadi, H.; Cruciani, G. Removal of fluoride from aqueous solution by adsorption on NaP: HAp nanocomposite using response surface methodology. Process Saf. Environ. Prot. 2017, 109, 172–191. [Google Scholar] [CrossRef]
  46. Saikia, P.; Bharali, R.K.; Baruah, H.K. Kinetic and thermodynamic studies for fluoride removal using a novel bio-adsorbent from possotia (Vitex negundo) leaf. J. Anal. Sci. Technol. 2017, 8, 23. [Google Scholar] [CrossRef] [Green Version]
  47. Raghav, S.; Kumar, D. Adsorption equilibrium, kinetics, and thermodynamic studies of fluoride adsorbed by tetrametallic oxide adsorbent. J. Chem. Eng. Data 2018, 63, 1682–1697. [Google Scholar] [CrossRef]
  48. Simonin, J.-P. On the comparison of pseudo-first order and pseudo-second order rate laws in the modeling of adsorption kinetics. Chem. Eng. J. 2016, 300, 254–263. [Google Scholar] [CrossRef] [Green Version]
  49. Saikia, R.; Goswami, R.; Bordoloi, N.; Senapati, K.K.; Pant, K.K.; Kumar, M.; Kataki, R. Removal of arsenic and fluoride from aqueous solution by biomass based activated biochar: Optimization through response surface methodology. J. Environ. Chem. Eng. 2017, 5, 5528–5539. [Google Scholar] [CrossRef]
  50. Lee, J.-I.; Kang, J.-K.; Hong, S.-H.; Lee, C.-G.; Jeong, S.; Park, S.-J. Thermally treated Mytilus coruscus shells for fluoride removal and their adsorption mechanism. Chemosphere 2021, 263, 128328. [Google Scholar] [CrossRef]
  51. Adak, M.K.; Mondal, B.; Dhak, P.; Sen, S.; Dhak, D. A comparative study on fluoride removal capacity from drinking water by adsorption using nano-sized alumina and zirconia modified alumina prepared by chemical route. Adv. Water Sci. Technol. 2017, 4, 01–10. [Google Scholar]
  52. Bharali, R.K.; Bhattacharyya, K.G. Biosorption of fluoride on Neem (Azadirachta indica) leaf powder. J. Environ. Chem. Eng. 2015, 3, 662–669. [Google Scholar] [CrossRef]
  53. Talat, M.; Mohan, S.; Dixit, V.; Singh, D.K.; Hasan, S.H.; Srivastava, O.N. Effective removal of fluoride from water by coconut husk activated carbon in fixed bed column: Experimental and breakthrough curves analysis. Groundw. Sustain. Dev. 2018, 7, 48–55. [Google Scholar] [CrossRef]
  54. Singh, K.; Lataye, D.H.; Wasewar, K.L. Removal of fluoride from aqueous solution by using bael (Aegle marmelos) shell activated carbon: Kinetic, equilibrium and thermodynamic study. J. Fluor. Chem. 2017, 194, 23–32. [Google Scholar] [CrossRef]
  55. Mwangi, C.K.; Mwangi, I.W.; Wanjau, R.N.; Swaleh, S.; Ram, M.; Ngila, J. Remediation of fluoride laden water by complexation with triethylamine modified maize tassels. Environ. Nat. Resour. J. 2016, 6, 44–58. [Google Scholar] [CrossRef]
  56. Getachew, T.; Hussen, A.; Rao, V. Defluoridation of water by activated carbon prepared from banana (Musa paradisiaca) peel and coffee (Coffea arabica) husk. Int. J. Environ. Sci. Technol. 2015, 12, 1857–1866. [Google Scholar] [CrossRef] [Green Version]
  57. Mohammad, A.; Majumder, C. Removal of fluoride from synthetic waste water by using “bio-adsorbents”. Int. J. Res. Eng. Technol. 2014, 3, 776–785. [Google Scholar]
  58. De, D.; Santosha, S.; Aniya, V.; Sreeramoju, A.; Satyavathi, B. Assessing the applicability of an agro-industrial waste to Engineered Bio-char as a dynamic adsorbent for Fluoride Sorption. J. Environ. Chem. Eng. 2018, 6, 2998–3009. [Google Scholar] [CrossRef]
  59. Mereta, S.T. Biosorption of fluoride ion from water using the seeds of the cabbage tree (Moringa stenopetala). Afr. J. Environ. Sci. Technol. 2017, 11, 1–10. [Google Scholar] [CrossRef]
Figure 1. (a) Isotherms of N2 adsorption–desorption for SC and PG and (b) distribution of pore size.
Water 14 03939 g001
Figure 2. SEM images of (a) SC and (b) PG in a 50 µm and 10 µm scale.
Water 14 03939 g002
Figure 3. FTIR spectra: (a) SC and (b) PG before and after adsorption.
Water 14 03939 g003
Figure 4. SC and PG zeta potential in aqueous suspension: influence of pH.
Water 14 03939 g004
Figure 5. Pareto chart analysis for (a) SC and (b) PG.
Water 14 03939 g005
Figure 6. 3D plots of fluoride adsorption by the SC adsorbent showing the interaction effect of (a) F concentration and pH, (b) F concentration and dosage, (c) F concentration and time, (d) pH and dosage, (e) pH and time, and (f) dosage and time.
Water 14 03939 g006aWater 14 03939 g006b
Figure 7. 3D plots of fluoride adsorption by the PG adsorbent showing the interaction effect of (a) F concentration and pH, (b) F concentration and dosage, (c) F concentration and time, (d) pH and dosage, (e) pH and time, and (f) time and dosage.
Water 14 03939 g007
Figure 8. Kinetic adsorption curves (a) pseudo first order and (b) pseudo second order of F onto SC and PG. Conditions: C0 = 6 mg L−1, pH = 5, adsorbent dose = 8 g/L for SC and 6 g/L for PG.
Water 14 03939 g008aWater 14 03939 g008b
Figure 9. Adsorption values fitted with (a) Langmuir and (b) Freundlich isotherms. Conditions: pH = 5; adsorbent dosage = 8 g/L; t = 80 for SC and pH = 5.1, adsorbent dosage = 6 g/L, t = 90 min for PG.
Water 14 03939 g009aWater 14 03939 g009b
Figure 10. Variations in fluoride removal efficiency of both biosorbents after four consecutive adsorption/desorption cycles.
Water 14 03939 g010
Table 1. Levels of independent parameters and their coded values for the CCD modeling.
ParametersUnitRange and Levels
−α−10+1
Initial fluoride concentrationmg/L4681012
Initial pH----357911
Adsorbent doseg/L246810
Contact timemin20406080100
Table 2. Textural parameters of prepared biosorbents.
AdsorbentSSABET
(m2 g−1)
SSALang
(m2 g−1/)
V micro
(cm3 (STP) g−1)
V total
(cm3 g−1)
Average Pore Width (nm)
SC3.077115.4750.24750.00175.9853
PG3.197716.7560.27520.003511.672
Table 3. Experimental design with experimental data and predicted values for both biosorbents.
StdRunIndependent Variables F Removal %—SCF Removal %—PG
Initial Concentration
(mg/L)
pHAdsorbent Dosage
(g/L)
Contact Time (min)ExperimentalPredictedExperimentalPredicted
211872607.598.9236.5138.98
2728766054.5655.3777.4471.83
2338762037.6537.7634.5136.33
1146948024.3027.9948.7246.67
20581166030.5427.2319.5318.58
1968366036.1537.8953.8255.73
6710584058.7556.0951.6150.48
8810984054.2556.3352.9755.22
24987610049.3647.6867.5866.72
9106548040.4338.8988.6188.57
3116944019.3217.2938.7737.83
13126588069.3469.0789.4586.03
26138766056.4755.3768.6471.83
21410544033.3830.8131.5226.08
29158766055.5555.3771.9871.83
25168766050.5755.3774.3371.83
41710944044.4645.7613.4813.72
161810988049.2848.4567.5862.56
15196988040.3443.4553.5961.24
102010548038.5437.7152.952.15
17214766064.6661.3690.2388.93
1226544019.2321.0963.6765.51
182312766074.3476.0748.5650.82
122410948046.5345.5624.3425.56
142510588052.7355.3168.8772.03
5266584057.4358.9566.4967.48
30278766059.5355.3769.3571.83
28288766055.5355.3769.2571.83
222987106052.5749.6779.4577.94
7306984038.5840.4359.3456.91
Table 4. ANOVA results of fluoride removal by SC.
Source Sum of SquaresDegree of FreedomMean SquareF Valuep-Value
Prob > F
Model6699.7714478.5647.56<0.0001
A-concentration324.941324.9432.29<0.0001
B-pH170.611170.6116.960.0009
C-dosage2490.2312490.23247.48<0.0001
D-time147.561147.5614.660.0016
A.B351.661351.6634.95<0.0001
A.C158.191158.1915.720.0012
A.D118.861118.8611.810.0037
B.C216.311216.3121.500.0003
B.D50.45150.455.010.0407
C.D59.02159.025.870.0286
A2305.391305.3930.35<0.0001
B2891.771891.7788.62<0.0001
C21165.3711165.37115.81<0.0001
D2274.231274.2327.250.0001
Residual150.941510.06
Lack of Fit108.671010.871.290.4126
Pure Error42.2758.45
Cor Total6850.7129
Other statistical parameters
R2 = 0.98 Adj.R2 = 0.96 Prd.R2 = 0.90
Table 5. ANOVA results of fluoride removal by PG.
SourceSum of
Squares
Degree of FreedomMean
Square
F Valuep-Value
Prob > F
Model11,780.2314841.4551.87<0.0001
A-concentration2179.5112179.51134.36<0.0001
B-pH2070.3712070.37127.63<0.0001
C-dose2277.0212277.02140.37<0.0001
D-time1385.4811385.4885.41<0.0001
AB234.631234.6314.460.0017
AC502.771502.7730.99<0.0001
AD9.0219.020.560.4675
BC292.841292.8418.050.0007
BD202.141202.1412.460.0030
CD20.36120.361.260.2802
A26.5616.560.400.5344
B22061.3312061.33127.07<0.0001
C2306.501306.5018.890.0006
D2706.881706.8843.58<0.0001
Residual243.321516.22
Lack of Fit182.601018.261.500.3415
Pure Error60.73512.15
Cor Total12,023.5629
Other statistical parameters
R2 = 0.98 Adj.R2 = 0.96 Pred.R2 = 0.91
Table 6. Optimum values of parameters and maximum removal percentage.
AdsorbentsOptimal ConditionFluoride Removal (%)ErrorStandard Deviation
Initial Fluoride Concentration
(mg/L)
pHAdsorbent Dose
(g/L)
Contact Time
(min)
Experimental ResponsesModel Predicted
SC65875.672.5069.183.23±1.48
PG65.16.6990.2388.3090.231.93±0.67
Table 7. The fitted parameters obtained from adsorption kinetics and isotherm models.
ModelParametersAdsorbents
SCPG
Pseudo-first orderR2
K1 (min−1)
Qe (mg/g)
0.988
0.1 × 10⁻³
1.10
0.984
0.1 × 10⁻³
1.41
Pseudo-second orderR2
K2 (g/mg·h)
Qe (mg/g)
0.991
0.1 × 10⁻¹
1.15
0.992
0.8 × 10⁻²
1.62
Langmuir modelR2
Qm (mg/g)
KL (L/mg)
0.997
1.14
0.46
0.991
1.50
0.70
Freundlich modelR2
1/n
KF (mg/g (L/mg)1/n)
0.954
0.420
0.654
0.860
0.368
0.806
Table 8. Comparison of adsorption capacities of various biosorbents in F removal.
AdsorbentsQe
(mg/g)
References
Sandal wood leaf5.88[19]
Bael shell2.45[54]
Triethylamine modified Maize tassels0.19[55]
Coffee husk0.29[56]
Banana peel0.31[56]
Sweet lemon peel0.74[57]
Inactivated jamun seed0.8[13]
Pongammia pinnata seeds1.12[58]
Moringa stenopetala1.32[59]
Psidium guajava1.50Present study
Syzygium cumini1.14Present study
Publisher’s Note: MDPI stays neutral with regard to jurisdictional claims in published maps and institutional affiliations.

