
System Simulation and Prediction of the Green Development Level of the Chengdu-Chongqing City Group

1
State Key Laboratory of Water Resources and Hydropower Engineering Science, Wuhan University, Wuhan 430072, China
2
Hubei Key Laboratory of Water System Science for Sponge City Construction, Wuhan University, Wuhan 430072, China
3
Institute of Water Security, Wuhan University, Wuhan 430072, China
*
Authors to whom correspondence should be addressed.
Water 2022, 14(23), 3947; https://doi.org/10.3390/w14233947
Submission received: 9 November 2022
/
Revised: 28 November 2022
/
Accepted: 30 November 2022
/
Published: 4 December 2022
(This article belongs to the Special Issue China Water Forum 2022)
Abstract
:Green development is a low-carbon, sustainable model for the achievement of the harmonious development of the economy and nature. Nowadays, the problems of resource scarcity and environmental pollution in the process of economic development are pressing, and the promotion of green development is the general trend. As one of the three growth poles of China’s Yangtze River economic belt, the Chengdu-Chongqing City Group is an important platform to lead toward green development in the western region of China. Based on the understanding of the connotation of green development, this study established a green development-level evaluation system, including 19 indicators in three dimensions: target level, criterion level, and indicator level, and used the entropy weight method to measure the green development level of the Chengdu-Chongqing City Group. In view of the dynamic nature of the green development process, this study constructed a system dynamics model of the green development level of the Chengdu-Chongqing City Group and simulated and compared it between 2022 and 2050 under five shared socio-economic pathway (SSP) scenarios so as to provide a reference basis for future development. The results show that the overall green development level of the Chengdu-Chongqing City Group is on an upward trend, with the highest green development level under the SSP1 path and the lowest under the SSP3 path, and the lagging distance tends to increase further. In the next 30 years, the Chengdu-Chongqing City Group should initially follow SSP2 as the basis for development and then gradually perform a transition to SSP1 by 2035 to achieve real sustainable development, after which it should continue to develop according to the SSP1 path until 2050.
1. Introduction
Green development theory originated from the green movement in the West. British scholars first noticed the constraint relationship between socio-economic development and environmental capacity. In 1662, William Petty recognized that value originates from labor, whose ability to create wealth is not infinite, being constrained by conditions such as land and technology [1]. Although the theory of green development has been deeply studied by international scholars for decades, there is still no uniform definition.
The research on green development theory in China is relatively late compared to that in Western countries; it focuses on reducing the use of resources and environmental damage while ensuring economic growth.
The representative one is the “people-oriented” concept of green development, proposed by Hu Angang of the National Research Center of Tsinghua University, which emphasizes the win–win situation of economic development and ecological environmental protection, i.e., the rational exploitation of resources and the reduction in pollution under the premise of sustained and stable economic growth [2]. In synthesis, green development is a model of economic development that does not entail damage to the ecological environment or over-exploitation and consumption of resources. It differs from the traditional crude development mode as it is environmentally friendly and entails resource-saving; moreover, it increases green wealth, allows the realization of a green life, and promotes the harmonious coexistence of humans and nature.
In recent years, green development, as a transformative development concept, has gradually achieved global consensus. With the maturity of the green development theory, scholars have started to conduct research related to the green development level, mainly focusing on the relationship between the economy, resources, and the environment [3]. More specifically, the related research focused mainly on three aspects: the measurement and evaluation of the green development level [3,4]; the identification of its influence factors [5,6]; and its simulation prediction [7,8]. These studies focused on both single cities and the whole country.
At present, the green development level is measured and evaluated mainly through the comprehensive evaluation index system method, the TOPSIS model, and the data envelopment analysis method. At the end of the 20th century, the comprehensive green development index system was developed and was further improved [9,10,11,12,13] as a comprehensive evaluation index system to measure and evaluate the green development level in specific regional and urban scopes. In 2009, the Economist Intelligence Unit (London, UK) constructed eight categories of green city indicators to analyze the environmental situation in 30 European cities [14]. In 2018, Carli et al. constructed a multi-objective integrated indicator system to analyze the sustainable development of urban energy, water, and environmental systems [15]. In 2019, Tian et al. adopted the entropy method to measure the greening of the Yangtze River Delta city agglomeration in terms of green growth, green welfare, green wealth, and green governance [16]. In 2021, Hu et al. established an urban green development evaluation index system for 108 cities in the Yangtze River Economic Zone to analyze the role of technological innovation in promoting green development [17].
To fully reflect the dynamics of the green development process and the interaction of its subsystems, as well as to improve the guidance and support for realistic decision making, scholars introduced the system dynamics approach to study green development from a system perspective. Founded by Professor Forrester at MIT, system dynamics was initially called “industrial dynamics” [18]; after the 1960s, he transformed system dynamics into urban dynamics when he studied the rise and fall of cities. This concept was then gradually improved and developed by Mass and Alfeld [19,20].
In the field of green development, the research on system dynamics is mostly focused on future simulation, and system dynamics models have been constructed to analyze the change trend of the future green development level by setting different simulation scenarios so as to obtain the optimal development path or countermeasure suggestions. Rudneva et al. constructed a “green” economic system dynamics model and analyzed the scenarios of regional “green” economic development [21]. Yang Guangming et al. used Chongqing city as an example to simulate and predict the sustainable development of the water resource carrying capacity, based on a system dynamics model [22]. Zhou studied the optimal path of urban agglomeration development by simulating the system dynamics of green development in the Beijing-Tianjin-Hebei urban agglomeration under different paths, putting forward relevant policy suggestions [23]. Wang et al. simulated and predicted the future scenarios of the ecological security index of the Beijing-Tianjin-Hebei city agglomeration by constructing a system dynamics model [24]. Li et al. considered three scenarios of economic development, technological innovation, and government investment to simulate and predict the industrial green development of the Beijing-Tianjin-Hebei urban agglomeration [25]. Jing et al. developed a system dynamics model of green low-carbon development for the Beijing-Tianjin-Hebei urban agglomeration considering four factors: economy, energy, environment, and urban aggregation, to explore the future system effects under different scenarios [26]. O’Keeffe et al. proposed a natural capital system dynamics model framework to predict and assess the natural capital performance of urban development in London [27]. Gudlaugsson, B et al. apply a system dynamics approach to investigate the complexity of energy transition in the Tees Valley region of the UK under a sustainable transition pathway and make policy recommendations [28]. In synthesis, a large number of studies have shown the general applicability of system dynamics to perform simulation and prediction studies in the field of green development.
Through a literature review, it can be found that the simulation and prediction research on green development is relatively mature, although there are still some areas for improvement:
- In terms of spatial scope, the majority of the current research scholars on green development have focused on a single city, a single province, or a more developed socio-economic urban agglomeration, and there is almost no research on the green development of urban agglomerations in western China.
- In terms of temporal span, the current research on urban green development has focused on a relatively short period, and the future forecast research period is generally up to 2030.
- In terms of future simulation and prediction using system dynamics, most scholars have set up various scenarios for simulation based on the interplay of policies and indicators based on the construction of system dynamics models, and there is a lack of prediction and simulation under the different social system scenarios publicly released by the Intergovernmental Panel on Climate Change.
To address these shortcomings, this study selected the Chengdu-Chongqing City Group as the study area and divided the whole green development level system into four subsystems: social, economic, resource, and environmental subsystems. Next, a green development level system dynamics model was constructed, whose reliability and stability was verified through a historical test and a sensitivity test. On this basis, a simulation scheme of the system dynamics model of each city in the Chengdu-Chongqing City Group from 2019 to 2050 under five shared socio-economic pathways (SSPs) was set to analyze the change trend of the green development level, select the optimal pathway, and put forward corresponding suggestions and countermeasures.
2. Materials and Methods
2.1. Description of the Study Area
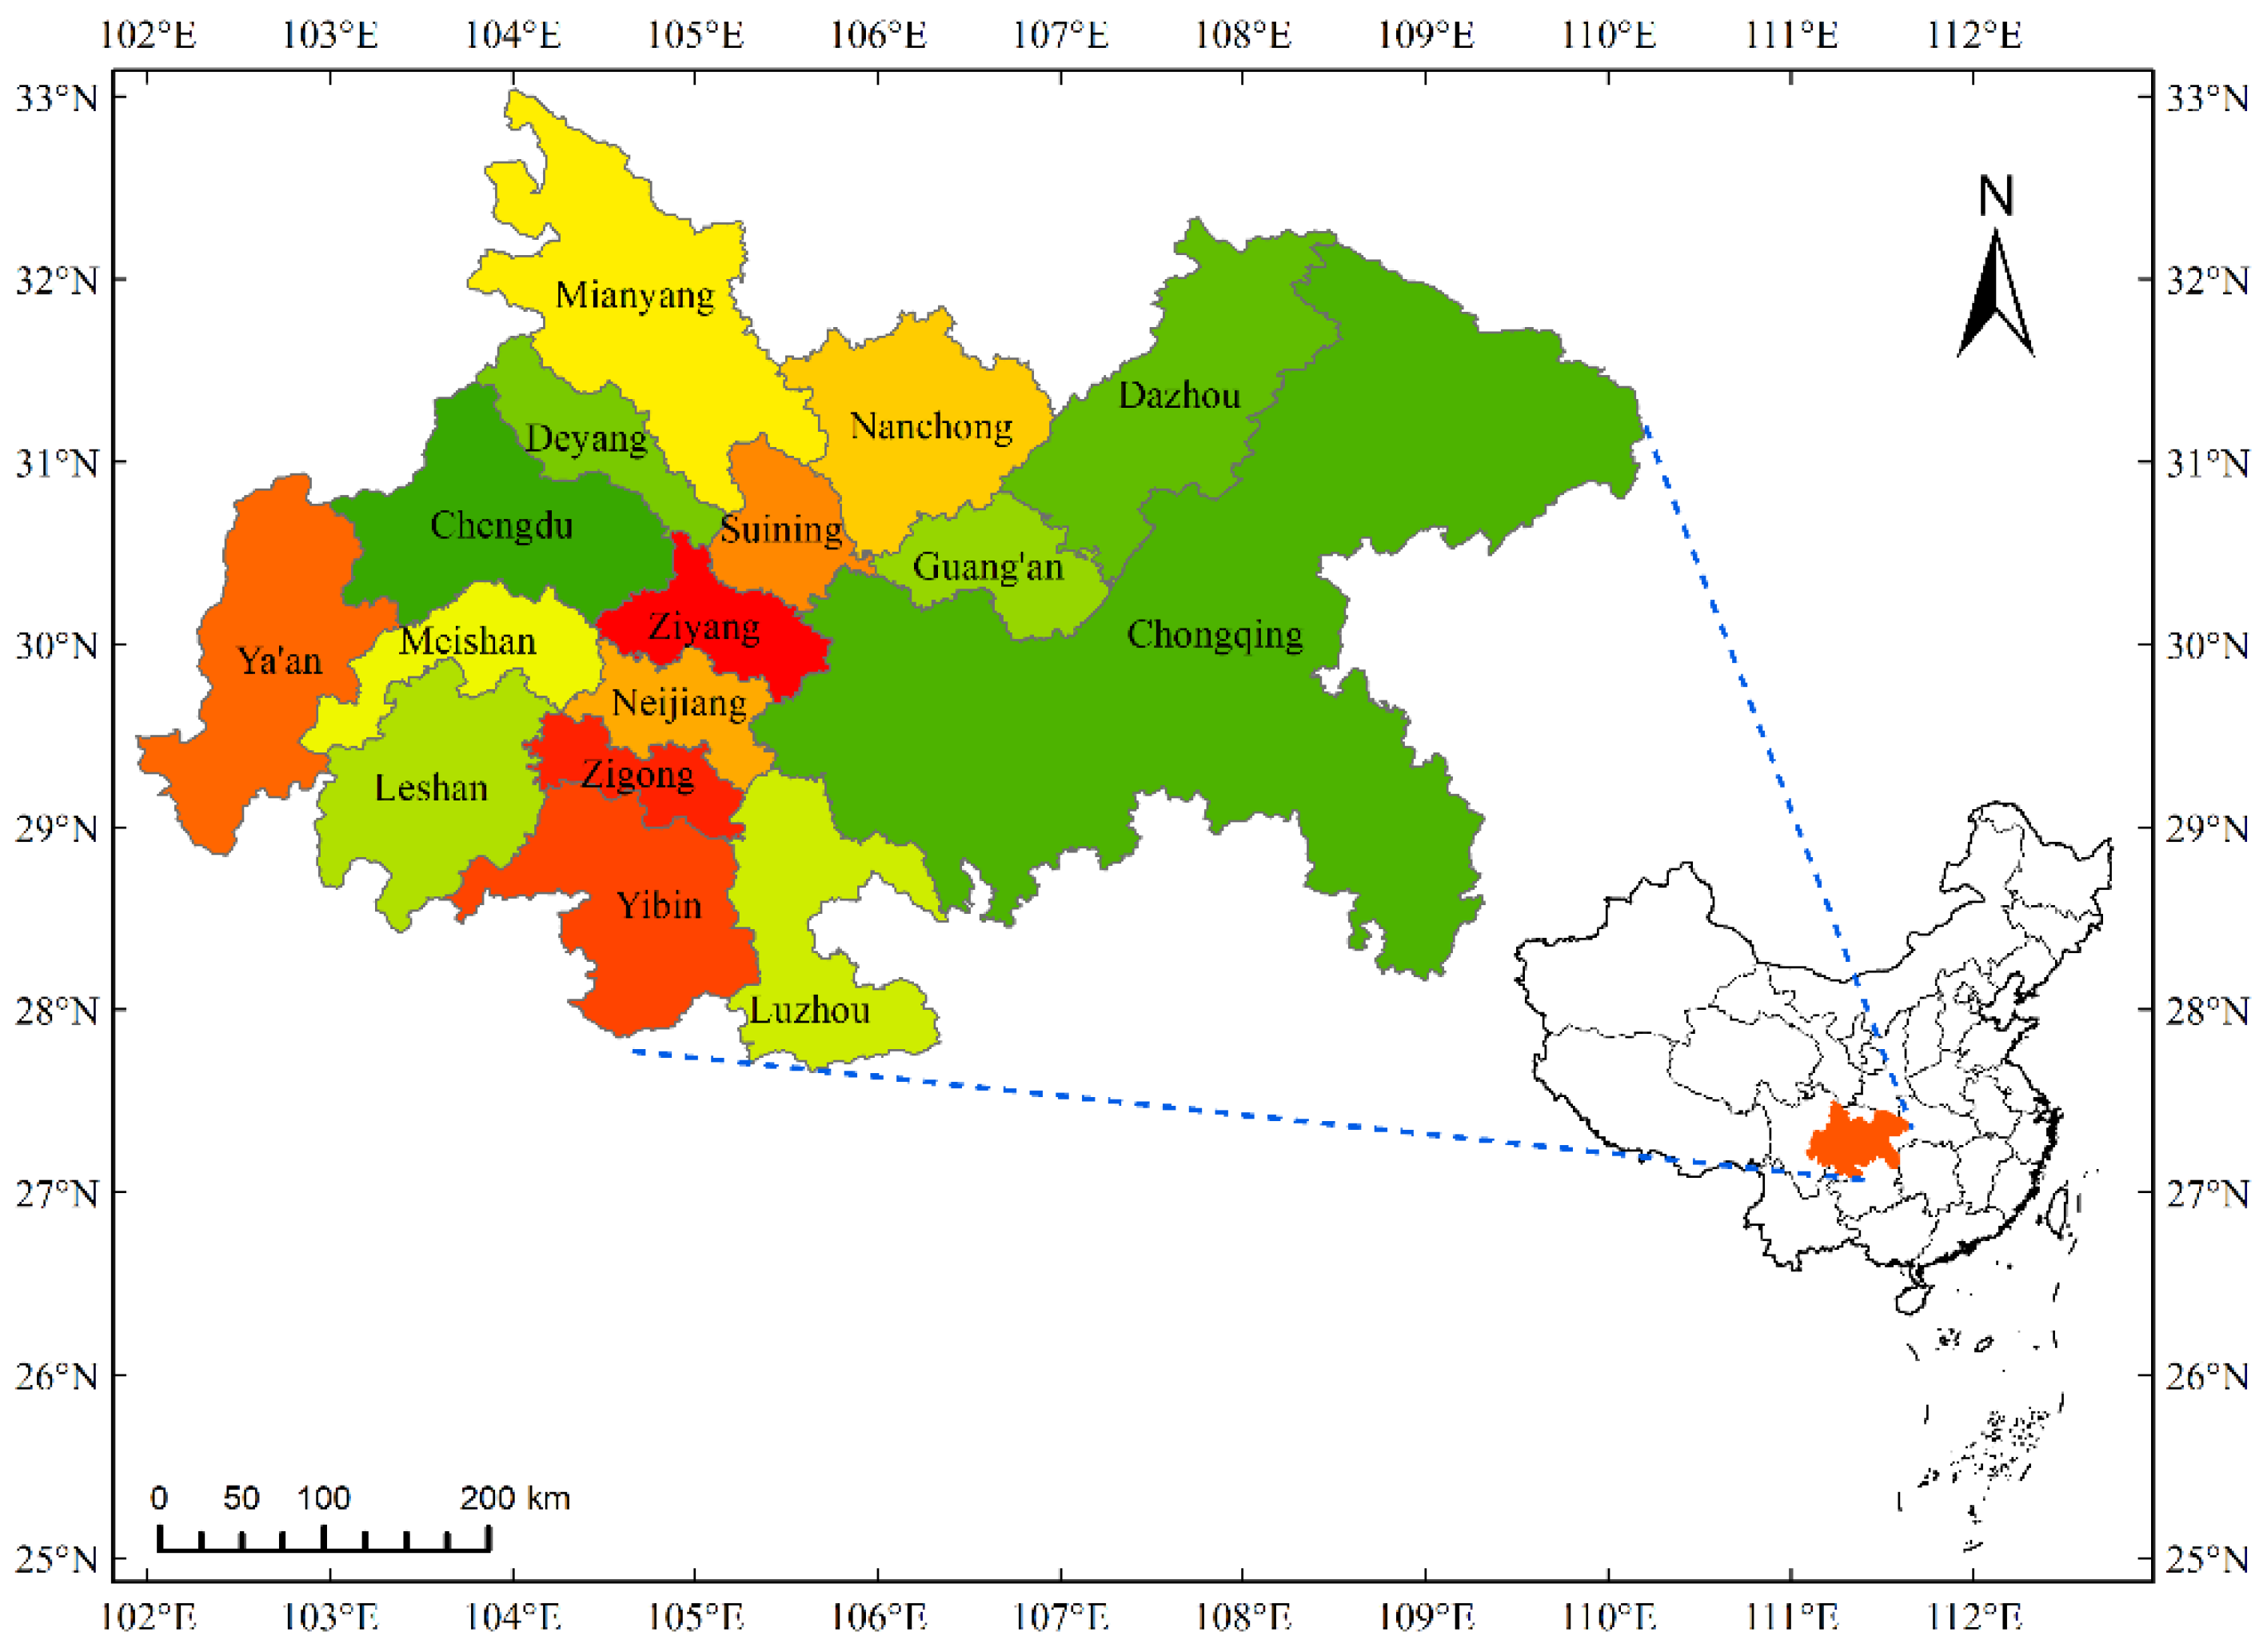
The Chengdu-Chongqing City Group, the Yangtze River midstream urban agglomeration, and the Yangtze River Delta urban agglomeration are the three major growth poles of China’s Yangtze River economic belt, and the core areas for the promotion of urbanization and economic growth. The Chengdu-Chongqing City Group is located in the upper reaches of the Yangtze River; it spans between 28°24′ N~32°27′ N and 101°56′ E~110°11′ E, and it is a region with both development strength and potential in western China. As such, it is an important basis for the green development of the Yangtze River economic belt. The core of the Chengdu-Chongqing City Group is represented by the cities of Chengdu and Chongqing; it includes 27 districts (counties) in Chongqing and parts of Kaixian and Yunyang and 15 cities in Sichuan Province [29]. The location and extension of the Chengdu-Chongqing City Group is shown in Figure 1.
In terms of natural resources, the Chengdu-Chongqing City Group has abundant precipitation, with an average annual precipitation of about 900~1300 mm and abundant underground thermal energy and drinking water, such that the groundwater and transit water can basically meet the residents’ water needs for living and production. At the same time, there are 12 main streams, including the Minjiang River and the Tuo River, and dozens of tributaries; hence, there are sufficient natural water resources in the Chengdu-Chongqing City Group area. According to the incomplete statistics alone, the animal and plant resources reach 11 classes, 200 families, 764 genera, and more than 3000 species, including rare animals such as giant pandas, red pandas, and golden snub-nosed monkeys, which are protected by the state. Thus, it can be seen that the Chengdu-Chongqing City Group is rich in natural resources such as water resources, mineral resources, land resources, and biological resources.
In terms of socio-economics, in 2018 the Chengdu-Chongqing City Group had a resident population of 95 million, accounting for 6.8% of the total population of the country. This area is rich in human resources and is a multi-ethnic area with more than 50 ethnic minorities, including Tibetans, Hui, Yi, and Tujia, in addition to the Han Chinese. Moreover, it is one of the regions with the best economic foundation and the strongest comprehensive strength in western China. Chengdu was awarded the first batch of national culture and tourism consumption demonstration cities in 2020; Chongqing has formed the world’s largest electronic information industry cluster and China’s largest domestic automotive industry cluster; the Chengdu and Chongqing region has strong strength in electronic information, equipment manufacturing, finance, and other industries; it has a better environment for innovation and entrepreneurship, and the open economic system is gradually taking shape.
In terms of spatial structure, the Chengdu-Chongqing City Group is located at the intersection of the horizontal axis along the Yangtze River corridor and the vertical axis of the Baokun corridor, with the Chengdu metropolitan area and the Chongqing metropolitan area as the main development axis, complemented by the urban belt along the river and the cities of Chengdu, Deyang, Mianyang, and Leshan, forming a spatial development pattern characterized by “one axis, two belts, two cores and three districts” [30]. As such, this region is key for the rapid development of central and western China and the creation of new space for economic growth [31].
2.2. Data Sources
The statistical data used in this article are mainly from the 1995–2018 “China Statistical Yearbook” (http://www.stats.gov.cn/tjsj./ndsj/) (accessed on 17 February 2022), released by the National Bureau of Statistics of China; the “Sichuan Statistical Yearbook” (http://tjj.sc.gov.cn/scstjj/c105855/nj.shtml) (accessed on 17 February 2022); the statistical yearbooks of 16 cities in the Chengdu-Chongqing City Group; the statistical bulletin of national economic and social development; the water resources bulletin; and other documents published in recent years. The interpolation method was employed to fill in the data gaps for single years.
2.3. The Entropy Weight Method
The entropy weight method is one of the most widely used objective weighting methods. This method determines the weights through a certain mathematical operation according to the relationships among the original data. It can avoid the non-objectivity and bias of the measurement results to a certain extent and has obvious advantages in calculating the level of green development [32]. The calculation steps are as follows:
Step 1: Data standardization processing
Because of the need to calculate the logarithm of the standardized index values in the calculation process of the entropy weighting method, in this study the index standardization method of non-zero transformation was adopted for data standardization [33]. The calculation formula is as follows:
Positive indicators:
Negative indicator:
where is the standardized value of the j-th indicator in the i-th year; is the original value of the j-th indicator in the i-th year; is the minimum value of the j-th indicator; and is the maximum value of the j-th indicator.
Step 2: Calculation of the specific gravity, as follows:
where is the proportion of the j-th indicator in the i-th year, and m is the number of years of the study.
Step 3: Calculation of the information entropy, as follows:
where is the information entropy of the j-th index.
Step 4: Calculation of the information utility value, as follows:
where is the weight of the j-th indicator, and n is the number of indicators.
Step 5: Calculation of the level of green development
The subsystem of the green development level was calculated as follows:
where is the weight of the j-th indicator, and n is the number of indicators.
Step 6: Calculation of the level of green development
The subsystem of the green development was calculated as follows:
where GDL is the overall green development level of the system, with a value range of (0,1). The larger the value, the higher the overall green development level of the system, and vice versa.
2.4. System Dynamics Model Theory
System dynamics (SD) is based on the feedback control theory. Through the qualitative analysis of the research problem, real data and information are used to quantitatively deduce the coupling relationship between variables, while computer simulation technology is employed to study the behavior of dynamic social systems [34], ensuring the integrated application of natural and social sciences [35]. The establishment of an SD model mainly includes the drawing of a causal loop diagram, a system flow chart, a model equation, and parameter alignment; the stability of the system is ensured through the historical test and the sensitivity test [36].
The commonly used software for modeling SD includes Vensim, Ithink, DYNAMO, and Stella [37]. Vensim is easy to operate, has a friendly interface, uses arrows to connect variables when building an SD model, and the relationship between the variables is written in the form of model equations, which allows users to easily modify the content of the model. Therefore, the Vensim PLE software was selected in this study to model the SD of the green development level of the Chengdu-Chongqing City Group in the Yangtze River economic belt.
Model Variables and Equations
The SD model mainly includes four types of variables: level variables, rate variables, auxiliary variables, and constant variables. The state variables and the rate variables are the key variables [38].
The four main types of model equations for SD are the state equation, the rate equation, the auxiliary equation, and the constant equation. A table function can be used when the nonlinear relationships between the variables are difficult to present through mathematical operations [39]. The following equations represent the basic mathematical expressions used by Vensim.
- State equation:
- 2.
- Rate equation:
- 3.
- Table Functions:
The table function is a function that describes the relationship between the independent and dependent variables by means of a list. The table function can be edited in Vensim PLE software using the “With lookup” function; its mathematical description is as follows:
where are the values of the independent and dependent variables that have been assigned.
2.5. Shared Socio-Economic Pathways (SSPs)
2.5.1. Overview of Shared Socio-Economic Pathways (SSPs)
SSPs are a powerful tool to describe global socio-economic development scenarios. This tool was launched in 2010 by the IPCC on the basis of Representative Concentration Pathways (RCP)s, taking into account factors such as population growth, economic development, environmental conditions, and technological progress [40,41,42]. They describe the possible future development of society without the impact of climate change or climate policy [43].
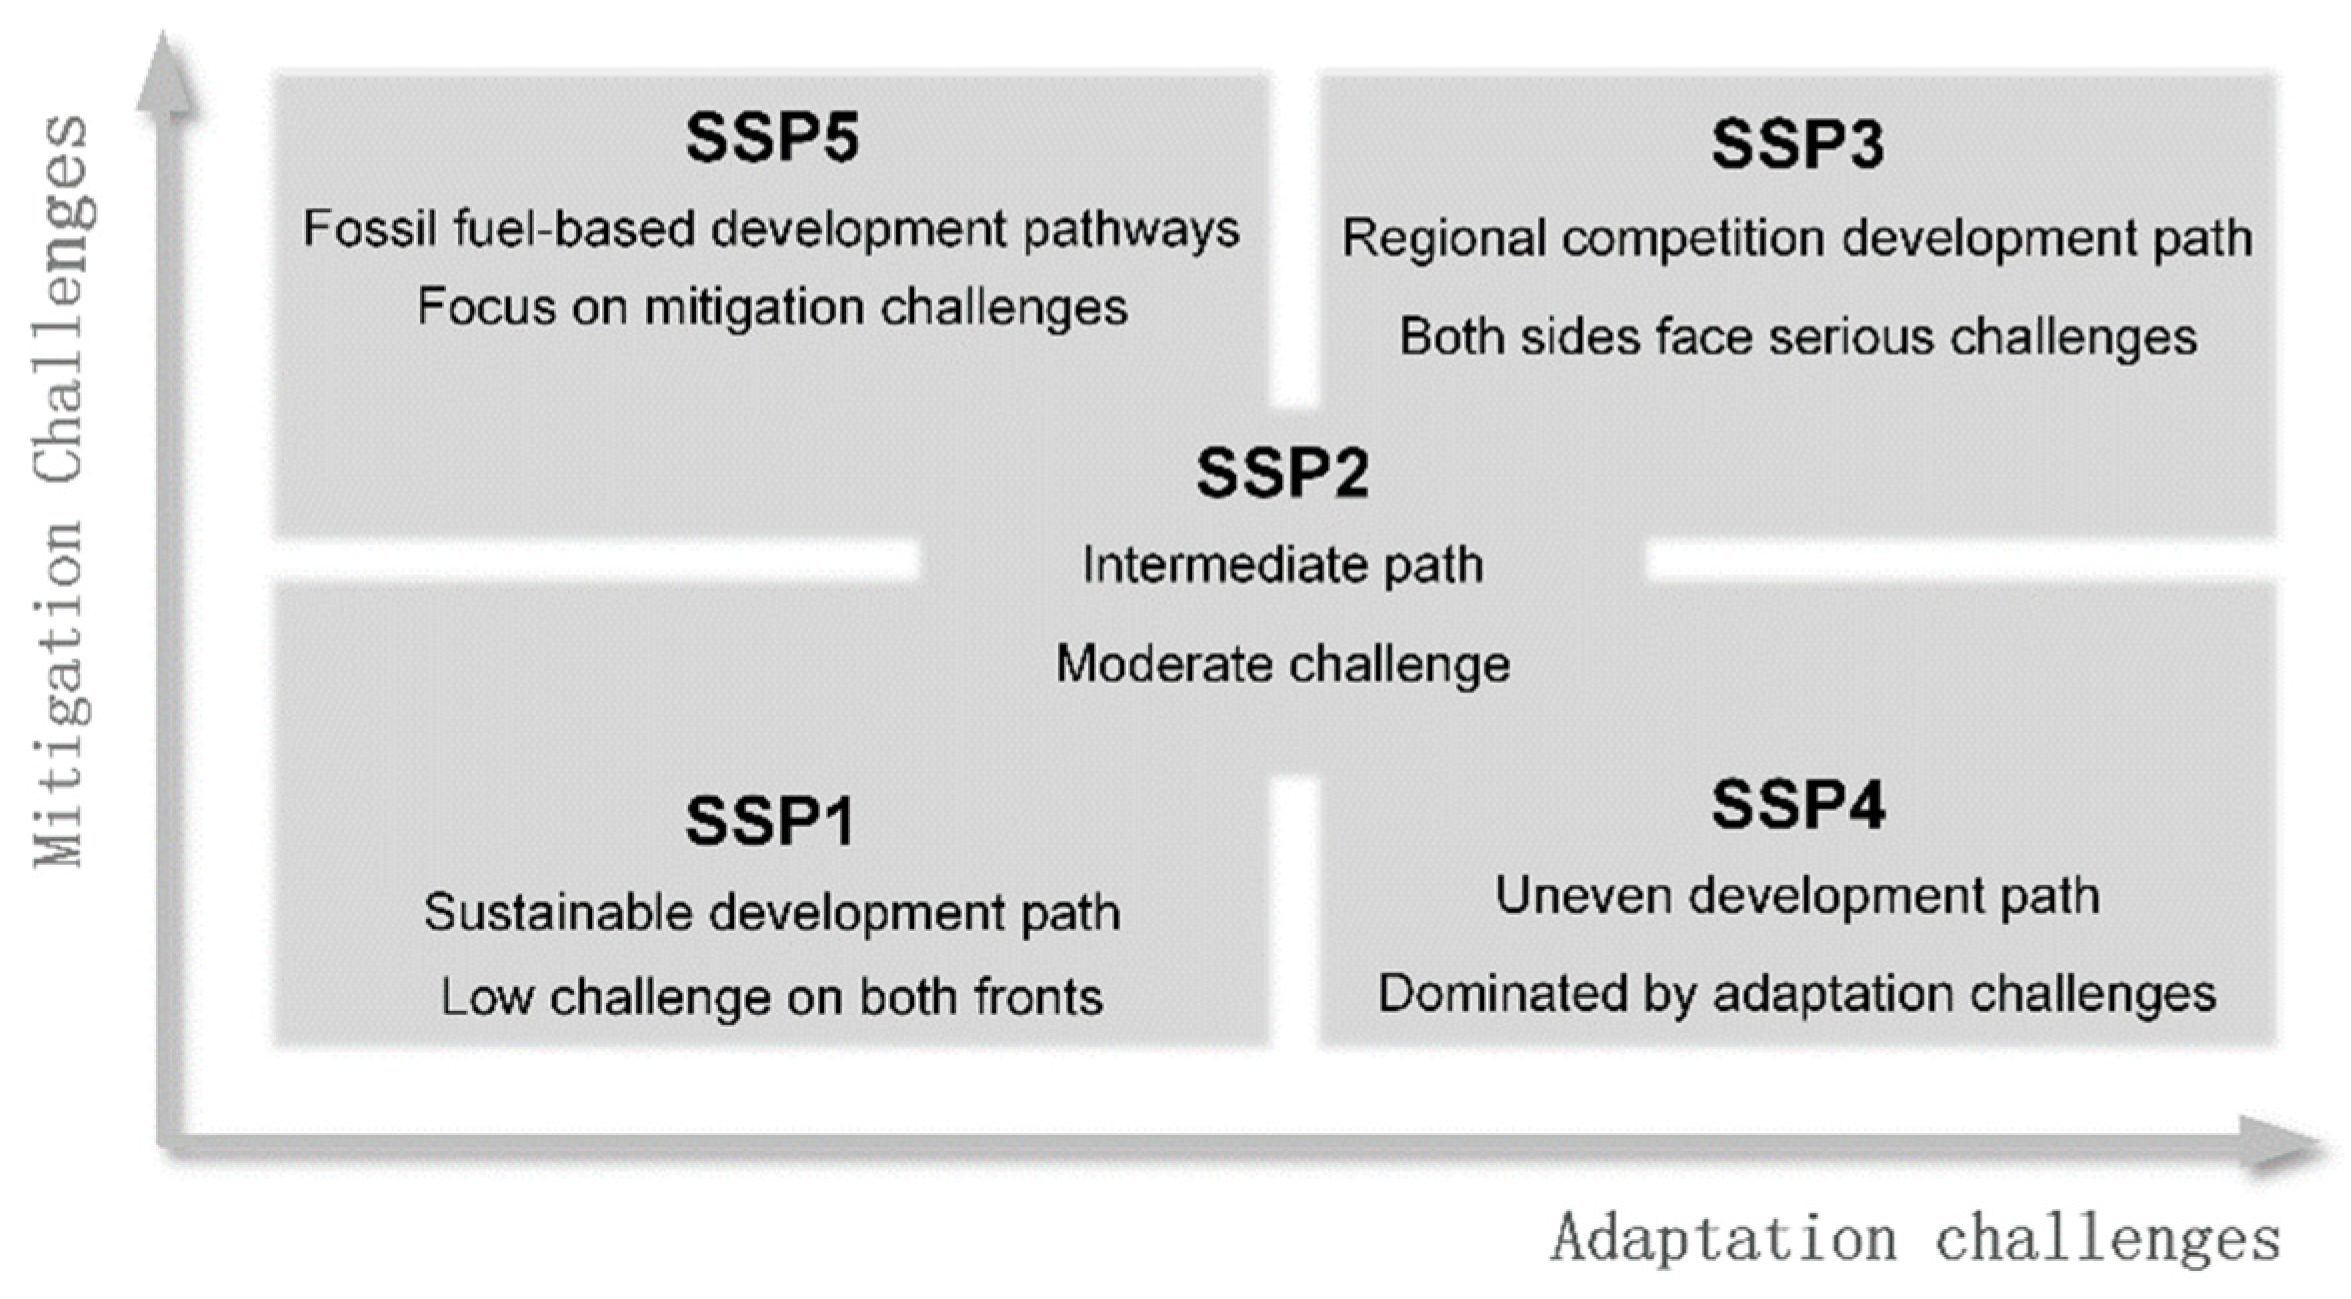
Through a comprehensive analysis of existing global development frameworks, the IPCC has identified five typical SSPs from the perspectives of both climate challenge adaptation and climate challenge mitigation, namely SSP1 (sustainable development pathway), SSP2 (intermediate pathway), SSP3 (regional competitive pathway), SSP4 (uneven pathway), and SSP5 (fossil fuel-based development pathway), as shown in Figure 2. The mitigation challenge in Figure 2 refers to slowing down the pace of climate change by multiple means, including carbon dioxide emissions reduction; the adaptation challenge refers to the adoption of measures to adapt to the various impacts of climate change and avoid catastrophic consequences.
2.5.2. Simulation Scheme of the Future Green Development Level of the Chengdu-Chongqing City Group under the SSPs
The green development of each city in the Chengdu-Chongqing City Group entails a process of continuous change; accordingly, the indicators that characterize the level of urban green development are also continuously changing. In order to ensure the validity of the SD model, it was necessary to carry out a historical statistical description of the model parameters of each city in the Chengdu-Chongqing City Group [44]. In this study, the maximum, minimum, and average values of the six rate variables in each city from 2004 to 2018 were assessed to provide a reference interval for the setting of the model parameters for each city. The results for Chengdu and Chongqing are detailed in Appendix A.
The SSPs introduced by the IPCC contain almost all the possible future development trends. A research team led by Jiang Tong conducted a study on the future population and economy of China under the five SSPs, based on domestic and international population and economic forecasting studies [45,46,47,48,49]. At present, the research of Jiang Tong’s team on China’s population and economic future prediction has reached a temporal scale up to 2100 and has proved to be very mature [45,50]. Therefore, in this study, when setting the parameters of the model for the prediction of the future green development level of each city in the Chengdu-Chongqing City Group, the population growth rate and the GDP growth rate referred to the research results of Jiang Tong’s team. The rate of the increase in the total energy consumption, arable land area, public green space area, and total water supply were assumed to be either high, medium-high, medium, or low according to the characteristics of the five SSPs considered. The details are shown in Table 1.
In synthesis, the following principles were followed to formulate the future simulation plan of each city in the Chengdu-Chongqing City Group based on the five SSPs. The model parameters of each city in the Chengdu-Chongqing City Group under the SSP2 path were mainly based on the development trend of the statistical data in the historical periods and cities. Moreover, the values of the model parameters under the SSP1, SSP3, SSP4, and SSP5 paths were either higher or lower than a certain level of the SSP2 path, according to the parameter assumptions and historical data fluctuations.
3. Results and Discussion
3.1. Construction of the Green Development Level Indicator System and Indicator Weights
Based on the understanding of the connotation of green development, this study constructed an indicator system to evaluate the level of green development of the urban agglomerations by referring to the evaluation index system used in previous studies on green development and the 56 green development indicators suggested by the National Development and Reform Commission of China.
The developed evaluation index system consists of three levels: the target level, which is the green development level of the urban agglomerations; the guideline level, which includes the socio-economic, resource, and environment levels; and the quality-of-life level. It is composed of 19 indicators at the indicator level. The results of the calculation of the indicator weights are shown in the Table 2.
3.2. Green Development Level SD Model Construction
3.2.1. Boundary Definition and Systematic Analysis
The SD model constructed in this study considered the administrative boundaries of 16 cities in the Chengdu-Chongqing City Group as the spatial boundaries. Considering China’s national construction goals and the reliability of the historical data, the temporal limit of the system was set as covering the period 2004–2050; 2004–2018 was set as the historical data period, while 2019–2050 was set as the model simulation period, and the time step was set as one year.
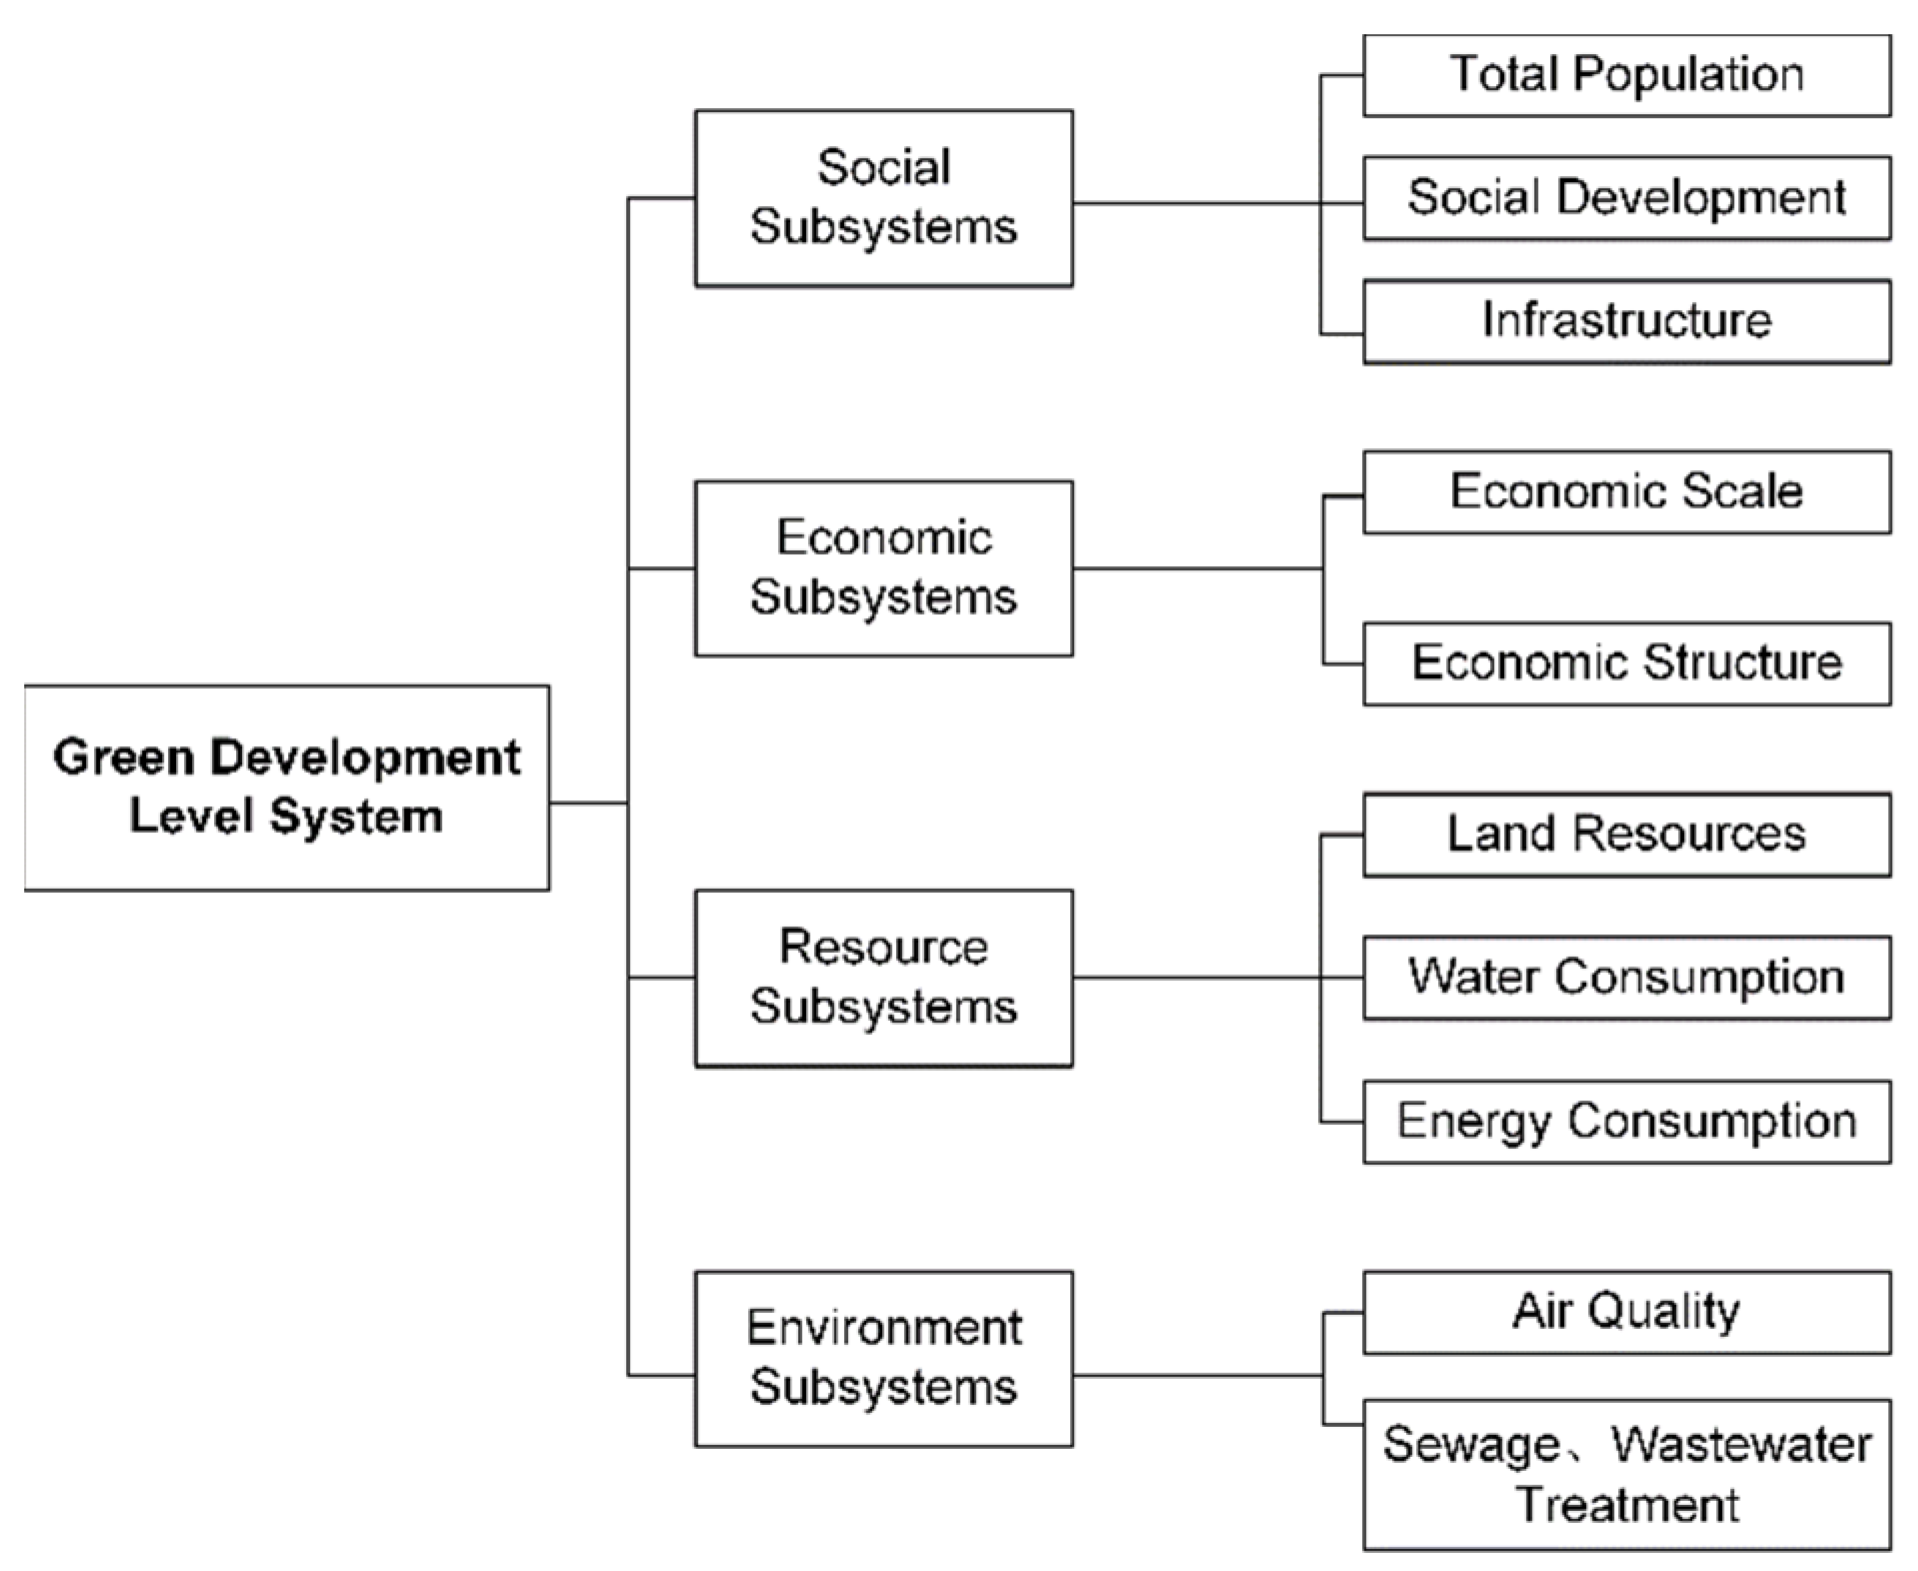
The systematic analysis of the green development level of the Chengdu-Chongqing City Group allowed the identification of the key factors affecting the green development level. The complex green development level system was divided into four subsystems: society, economy, resources, and environment. The indicator types of each subsystem are shown in Figure 3.
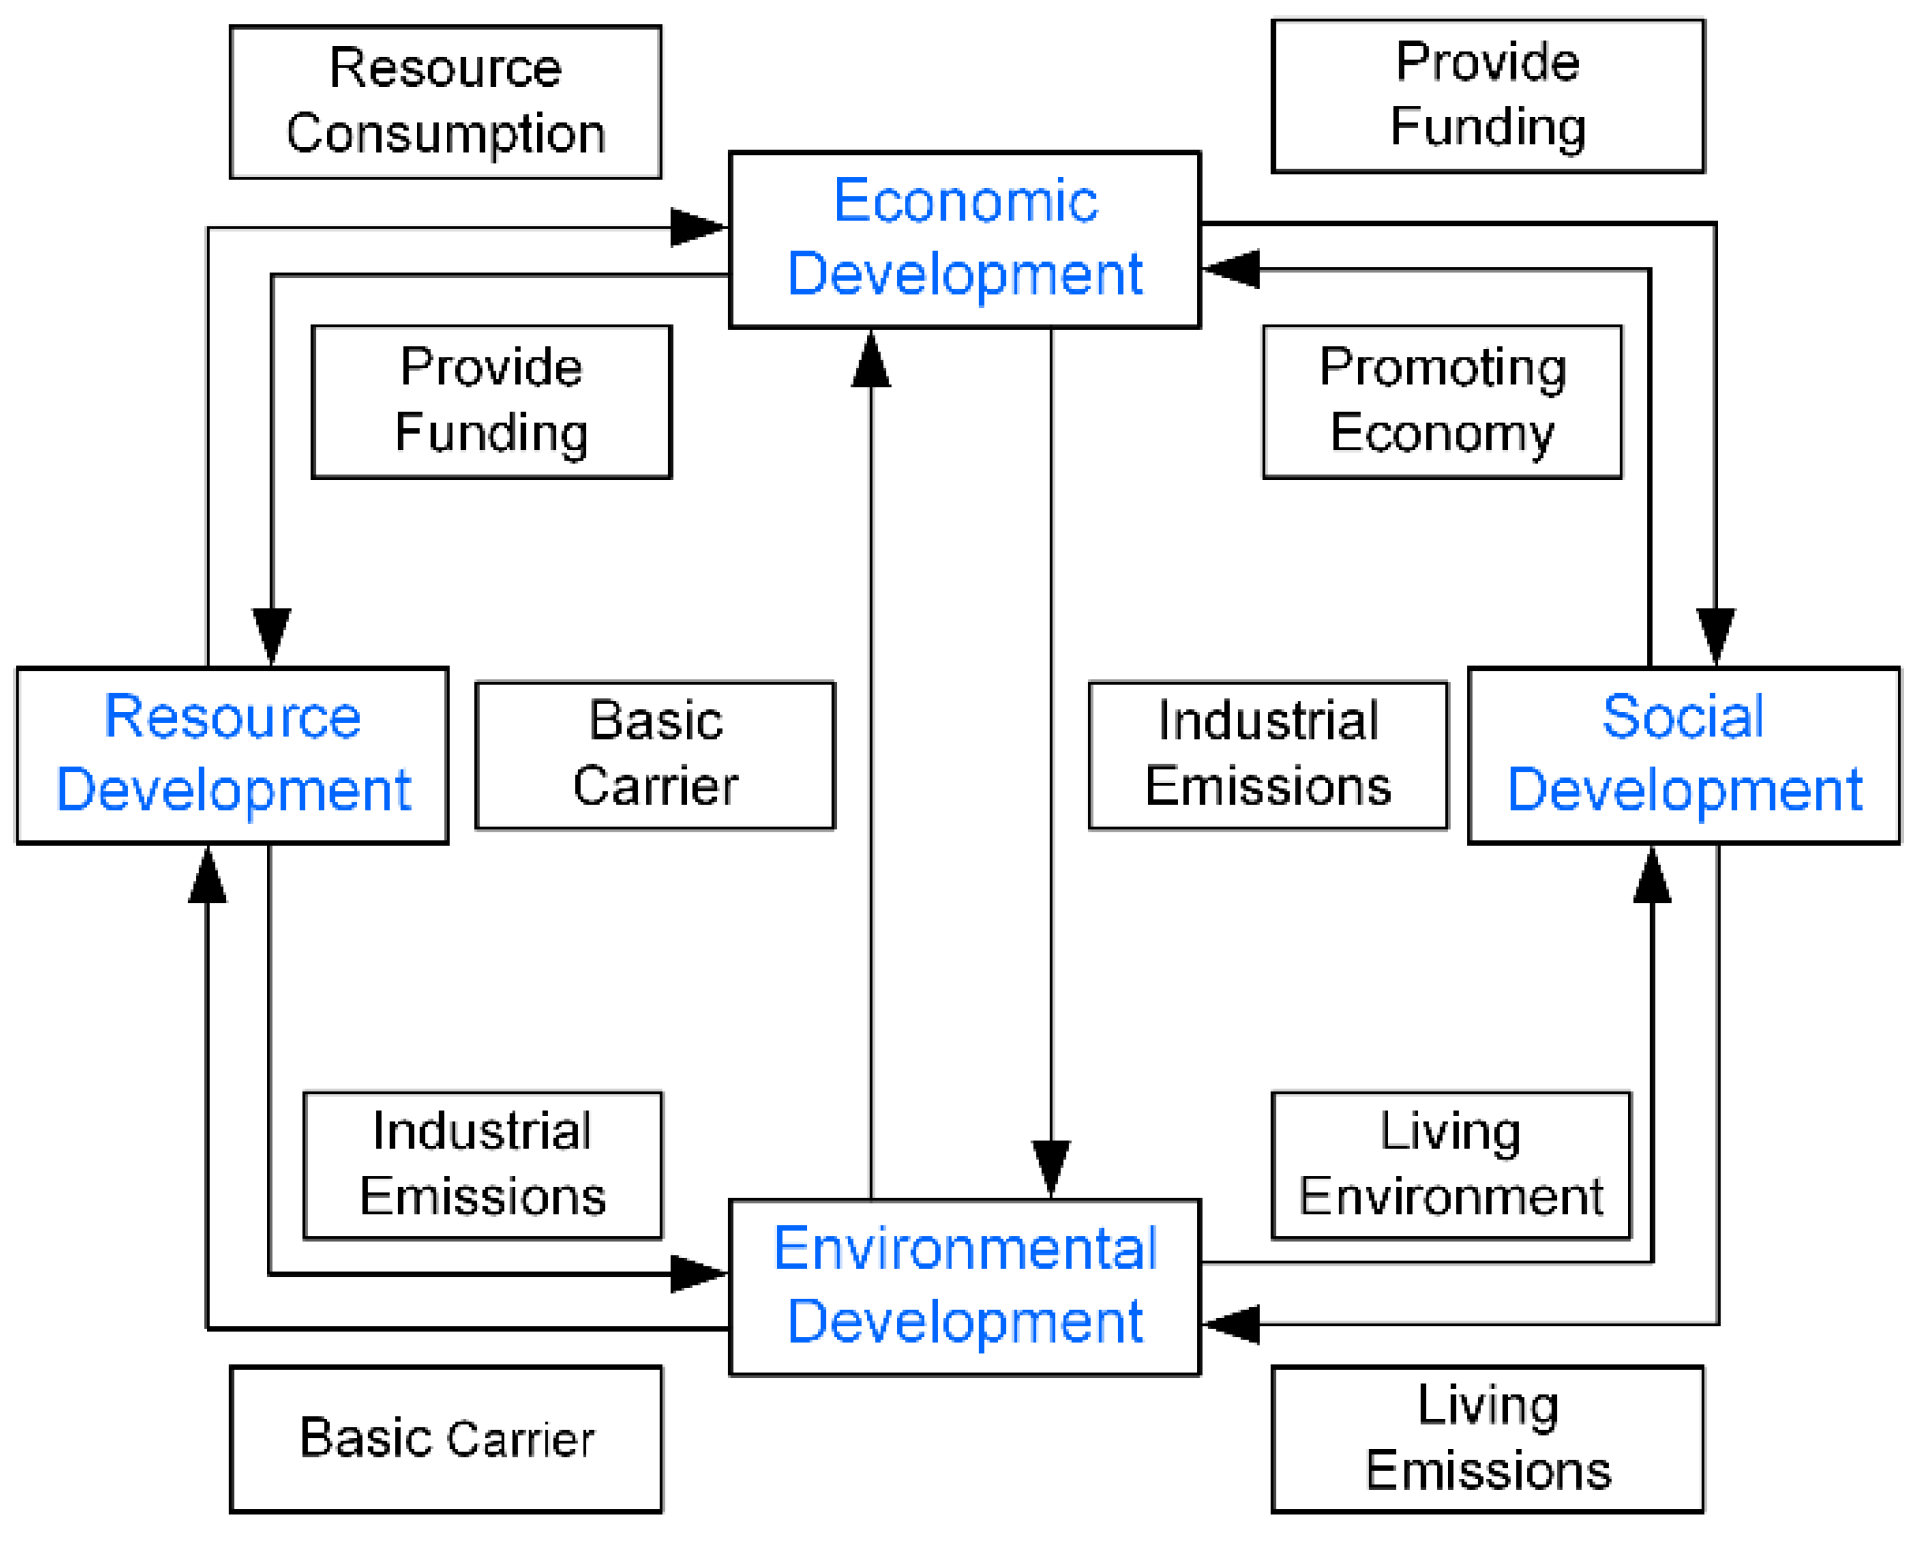
After the analysis of the four subsystems, an analysis framework of the subsystem of the green development level of the urban agglomeration was constructed, and the mutual influence relationship among the subsystems was clarified, as shown in Figure 4.
3.2.2. Causal Feedback Relation
A system can be divided into an open system and a feedback system [51]. The SD model of the green development level of the Chengdu-Chongqing City Group belongs to the feedback system; accordingly, the feedback loop of this system and the causal relationship between the variables could be clarified through the causality diagram. Combining the model index analysis and the green development level system analysis framework, the causal relationship between the subsystems and the variables was assessed, and the causal loop diagram of the SD model of the green development level of the Chengdu-Chongqing City Group in the Yangtze economic belt was drawn using the SD software Vensim PLE, as shown in Figure 5.
3.2.3. System Flow Chart
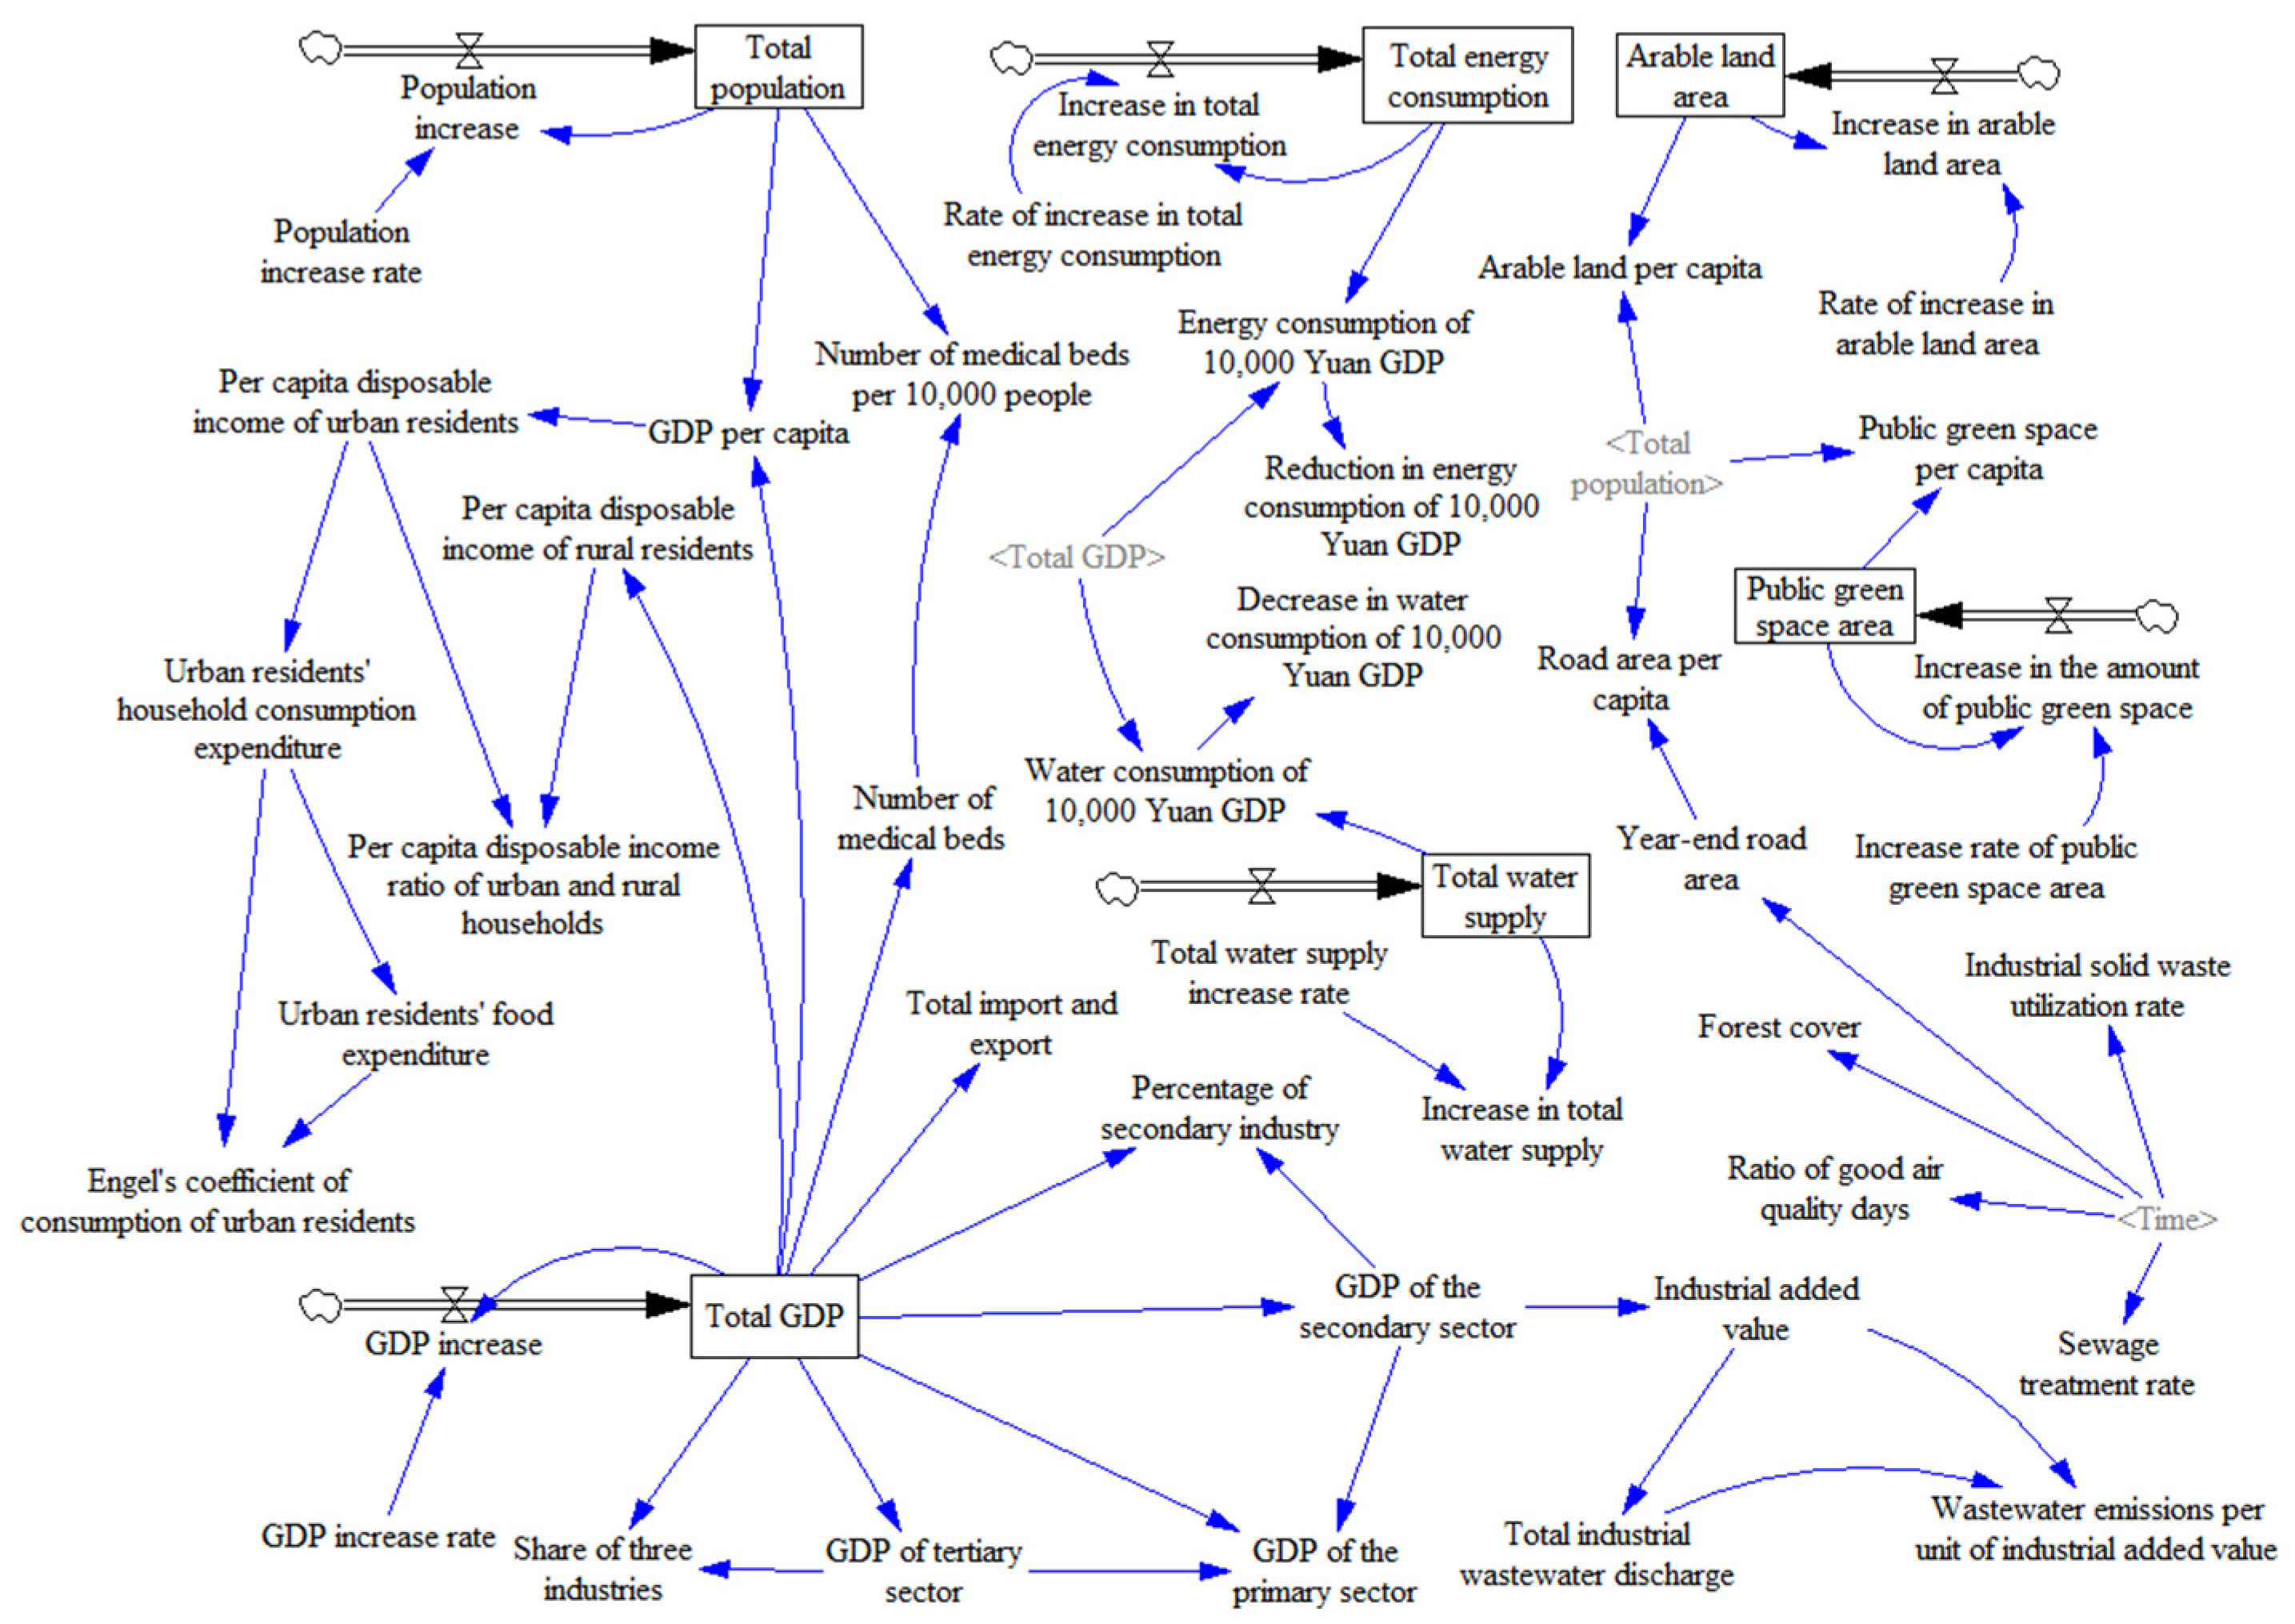
The system flow chart is the core of an SD model. Based on the causal loop diagram of the green development level of the Chengdu-Chongqing City Group, the system flow chart was further drawn. It includes 48 variables, including 6 state variables (i.e., total population, total GDP, total energy consumption, cultivated land area, public green area, and total water supply), 6 rate variables (i.e., population growth rate, GDP growth rate, increase rate of total energy consumption, increase rate of cultivated land area, increase rate of public green space, and increase rate of total water supply), and 36 auxiliary variables, as shown in Figure 6.
3.2.4. Establishment of Model Parameters and Equations
The variables of the SD model were divided into four main types: state variables, rate variables, auxiliary variables, and constants. The variables used in this model and their properties are shown in Table 3.
The model equations were established in the following three ways: for variables with clear mathematical relationships, they were established directly; for variables with random distributions and no clear mathematical relationships, the dataset was fitted using fitted regression analysis; for variables without functional relationships, or with functional relationships that were or difficult to establish, the table functions were created with the help of the “With lookup” function in the Vensim software. The model equations are shown in Table 4.
The parameters in the SD model generally include the constant values and the initial values of the state variables in the model. The constant values in the SD model of the green development level of the Chengdu-Chongqing City Group refer to six rate variables. Considering that the various cities were at different stages of development during the period of 2004–2018, the rate variables were assigned fixed values that were not in line with the actual situation. Therefore, a time-continuous function was adopted in this study to represent these variables; the specific functional relationship is shown in Table 5. The model also includes six state variables, whose initial values were taken from the statistical data of each city in 2003, as detailed in Appendix A.
3.3. Model Validity Test
3.3.1. Historical Test
The historical test aims to verify whether the relative error between the model simulation results and the historical values is within an acceptable range [52]; the formula employed in this study is as follows:
where is the relative error value at time t; is the model simulation value at time t; and is the historically true value at time t.
Six core indicators in the SD model of the green development level of the Chengdu-Chongqing City Group were selected to perform the historical test: total population, total GDP, total energy consumption, total water supply, arable land area, and public green space area. The passing rate of the historical test of each city in the Chengdu-Chongqing City Group is shown in Appendix A. The results of the historical test show that the SD model established in this study can fit the historical data well.
3.3.2. Sensitivity Check
In a stable SD model, the change in its simulation values when the model parameters change is relatively low, i.e., the SD model has low sensitivity [8,53]. To verify whether the SD model constructed in this study could operate effectively, six rate variables were selected to test its sensitivity. The sensitivity of the rate variables of each city in the Chengdu-Chongqing City Group from 2004 to 2018 was derived based on the sensitivity formula with a 10% increase and a 10% decrease. The sensitivity check formula employed is as follows:
where is the value of the i-th state variable L at time t; is the change in the i-th state variable L at time t; is the value of the j-th parameter X at time t; is the change in the j-th parameter X at time t; is the sensitivity of the i-th state variable L to the j-th parameter X; and is the sensitivity of the model to the j-th parameter X.
The results of the sensitivity test showed that the average sensitivity of the six rate variables to the SD model was lower than 0.01 in the two cases of the 10% increase and the 10% decrease. Hence, the structure of the SD model of the green development level of the Chengdu-Chongqing City Group constructed in this study was stable and could be used for the purposes of simulation and prediction.
3.4. Estimation of the Future Green Development Level of the Chengdu-Chongqing City Group under the SSPs
3.4.1. Analysis of Changes in Green Development Levels in the Chengdu-Chongqing City Group
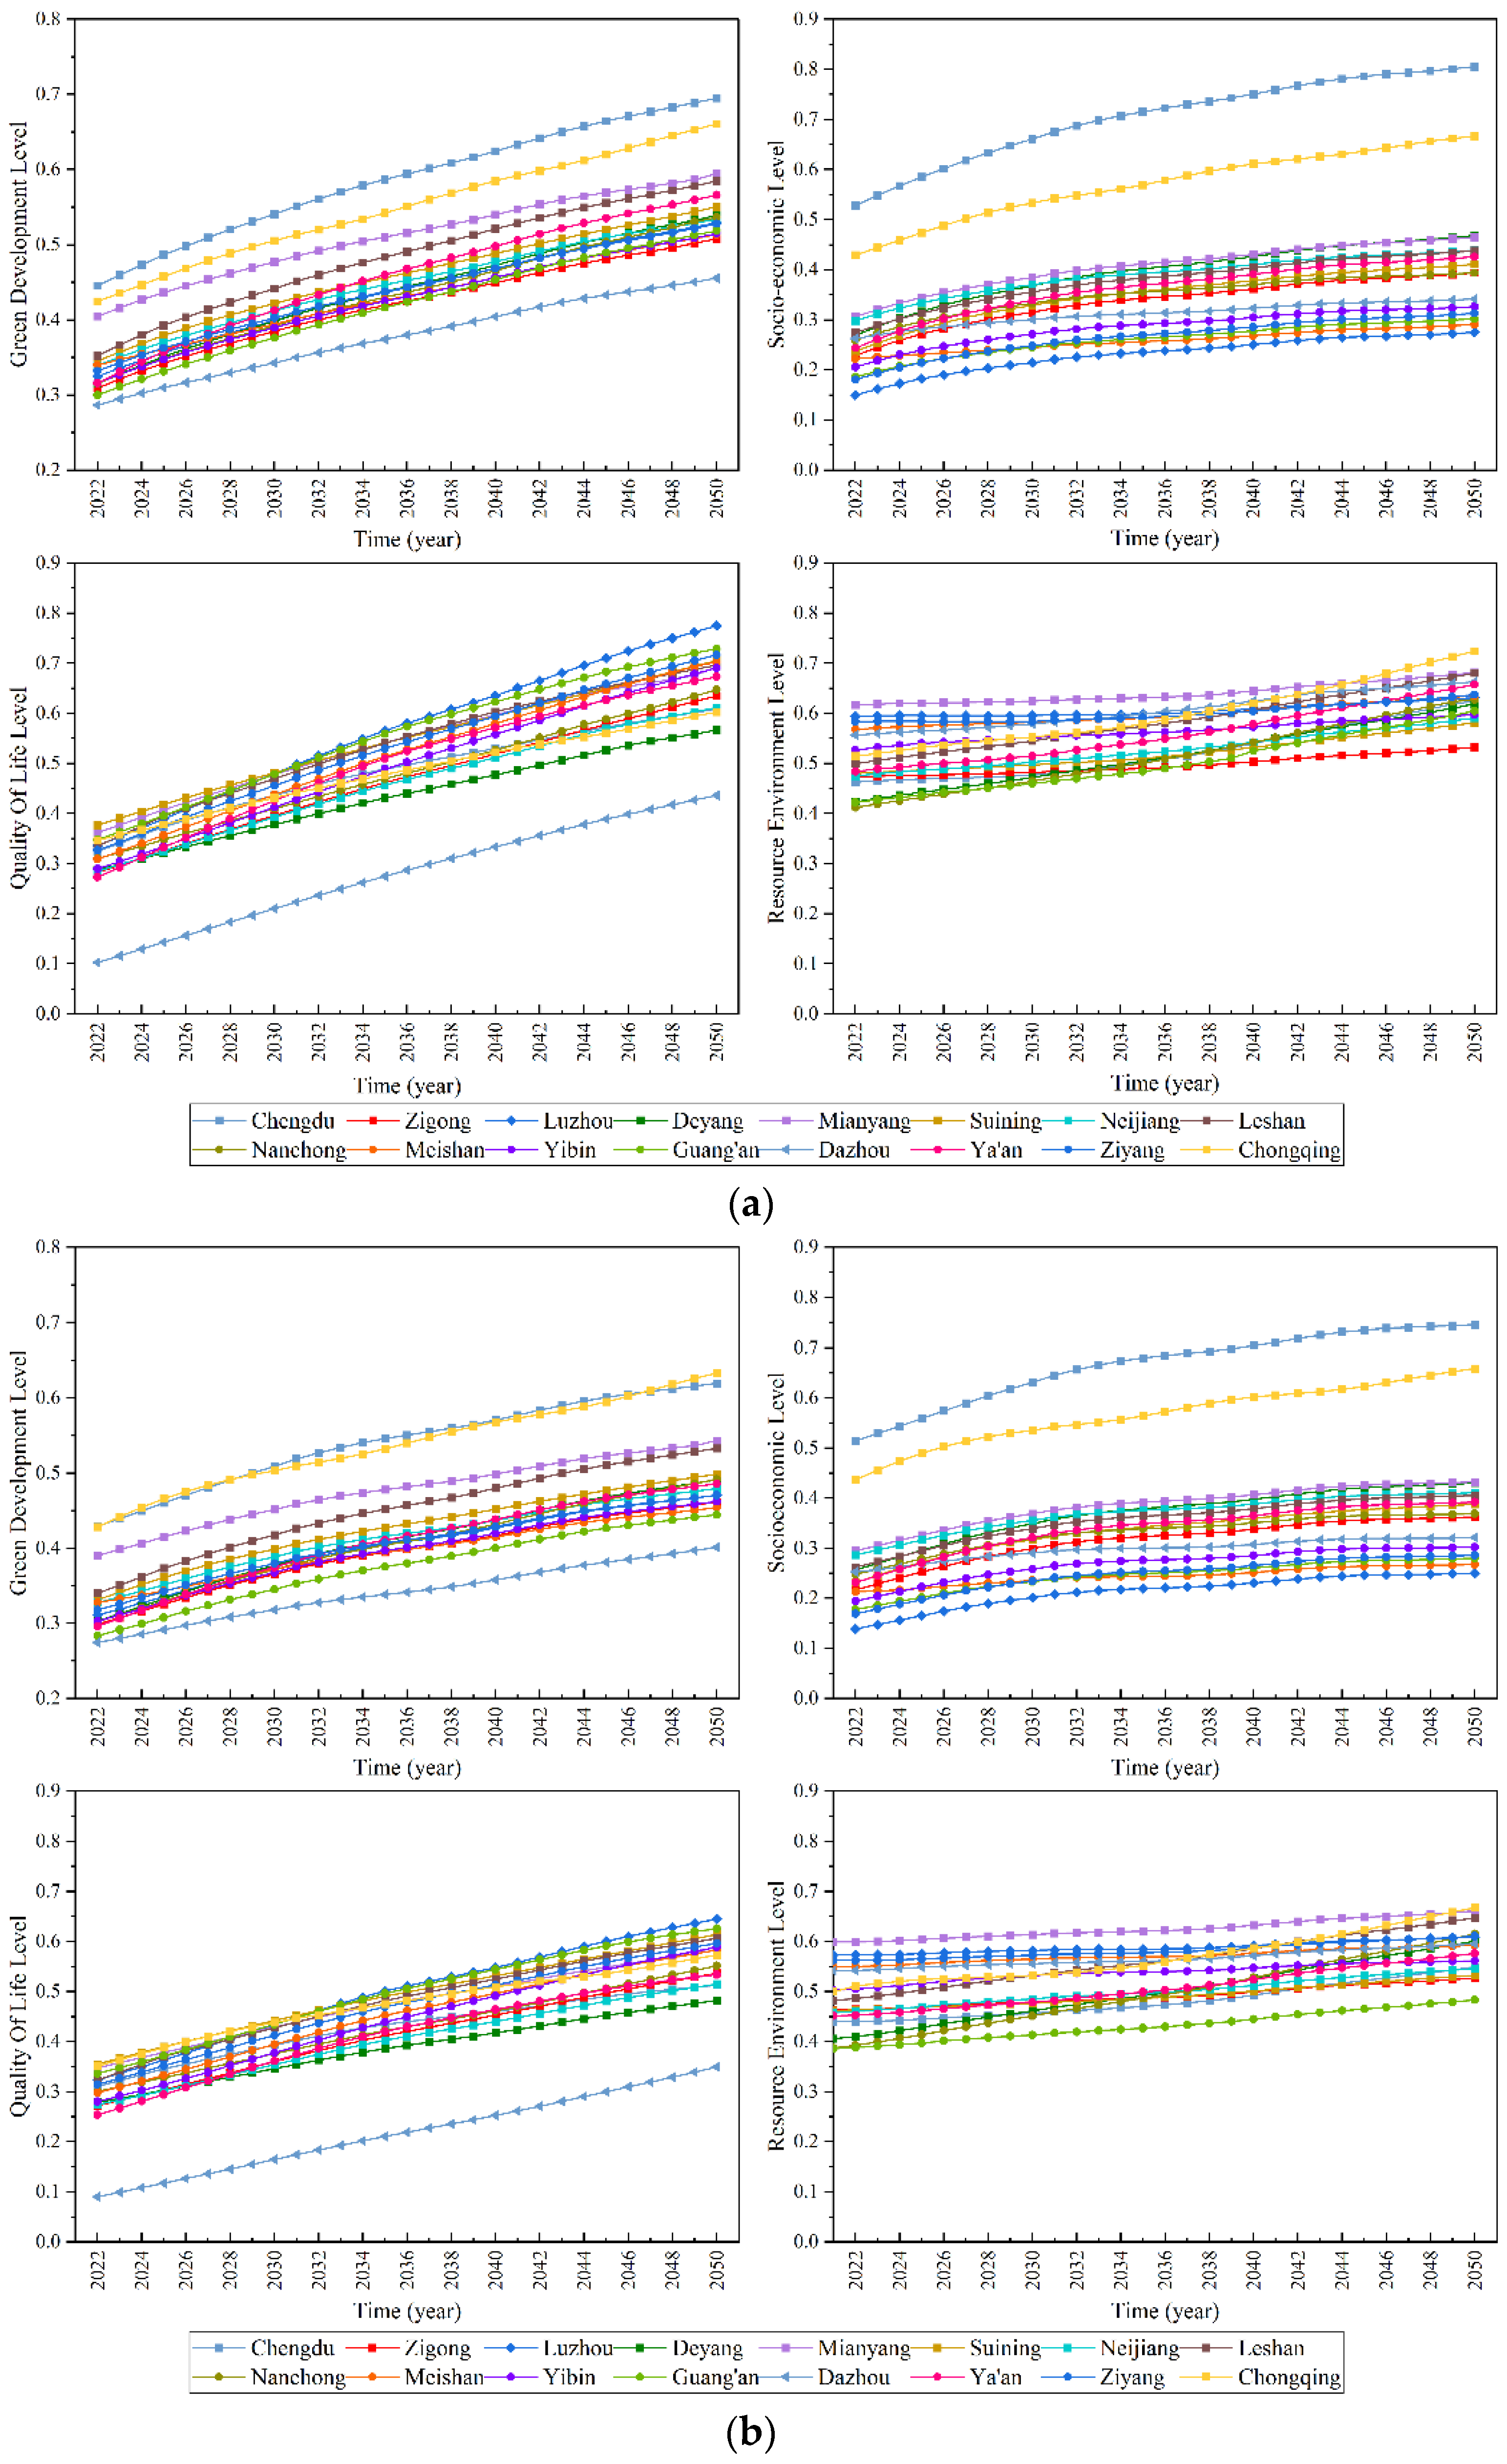
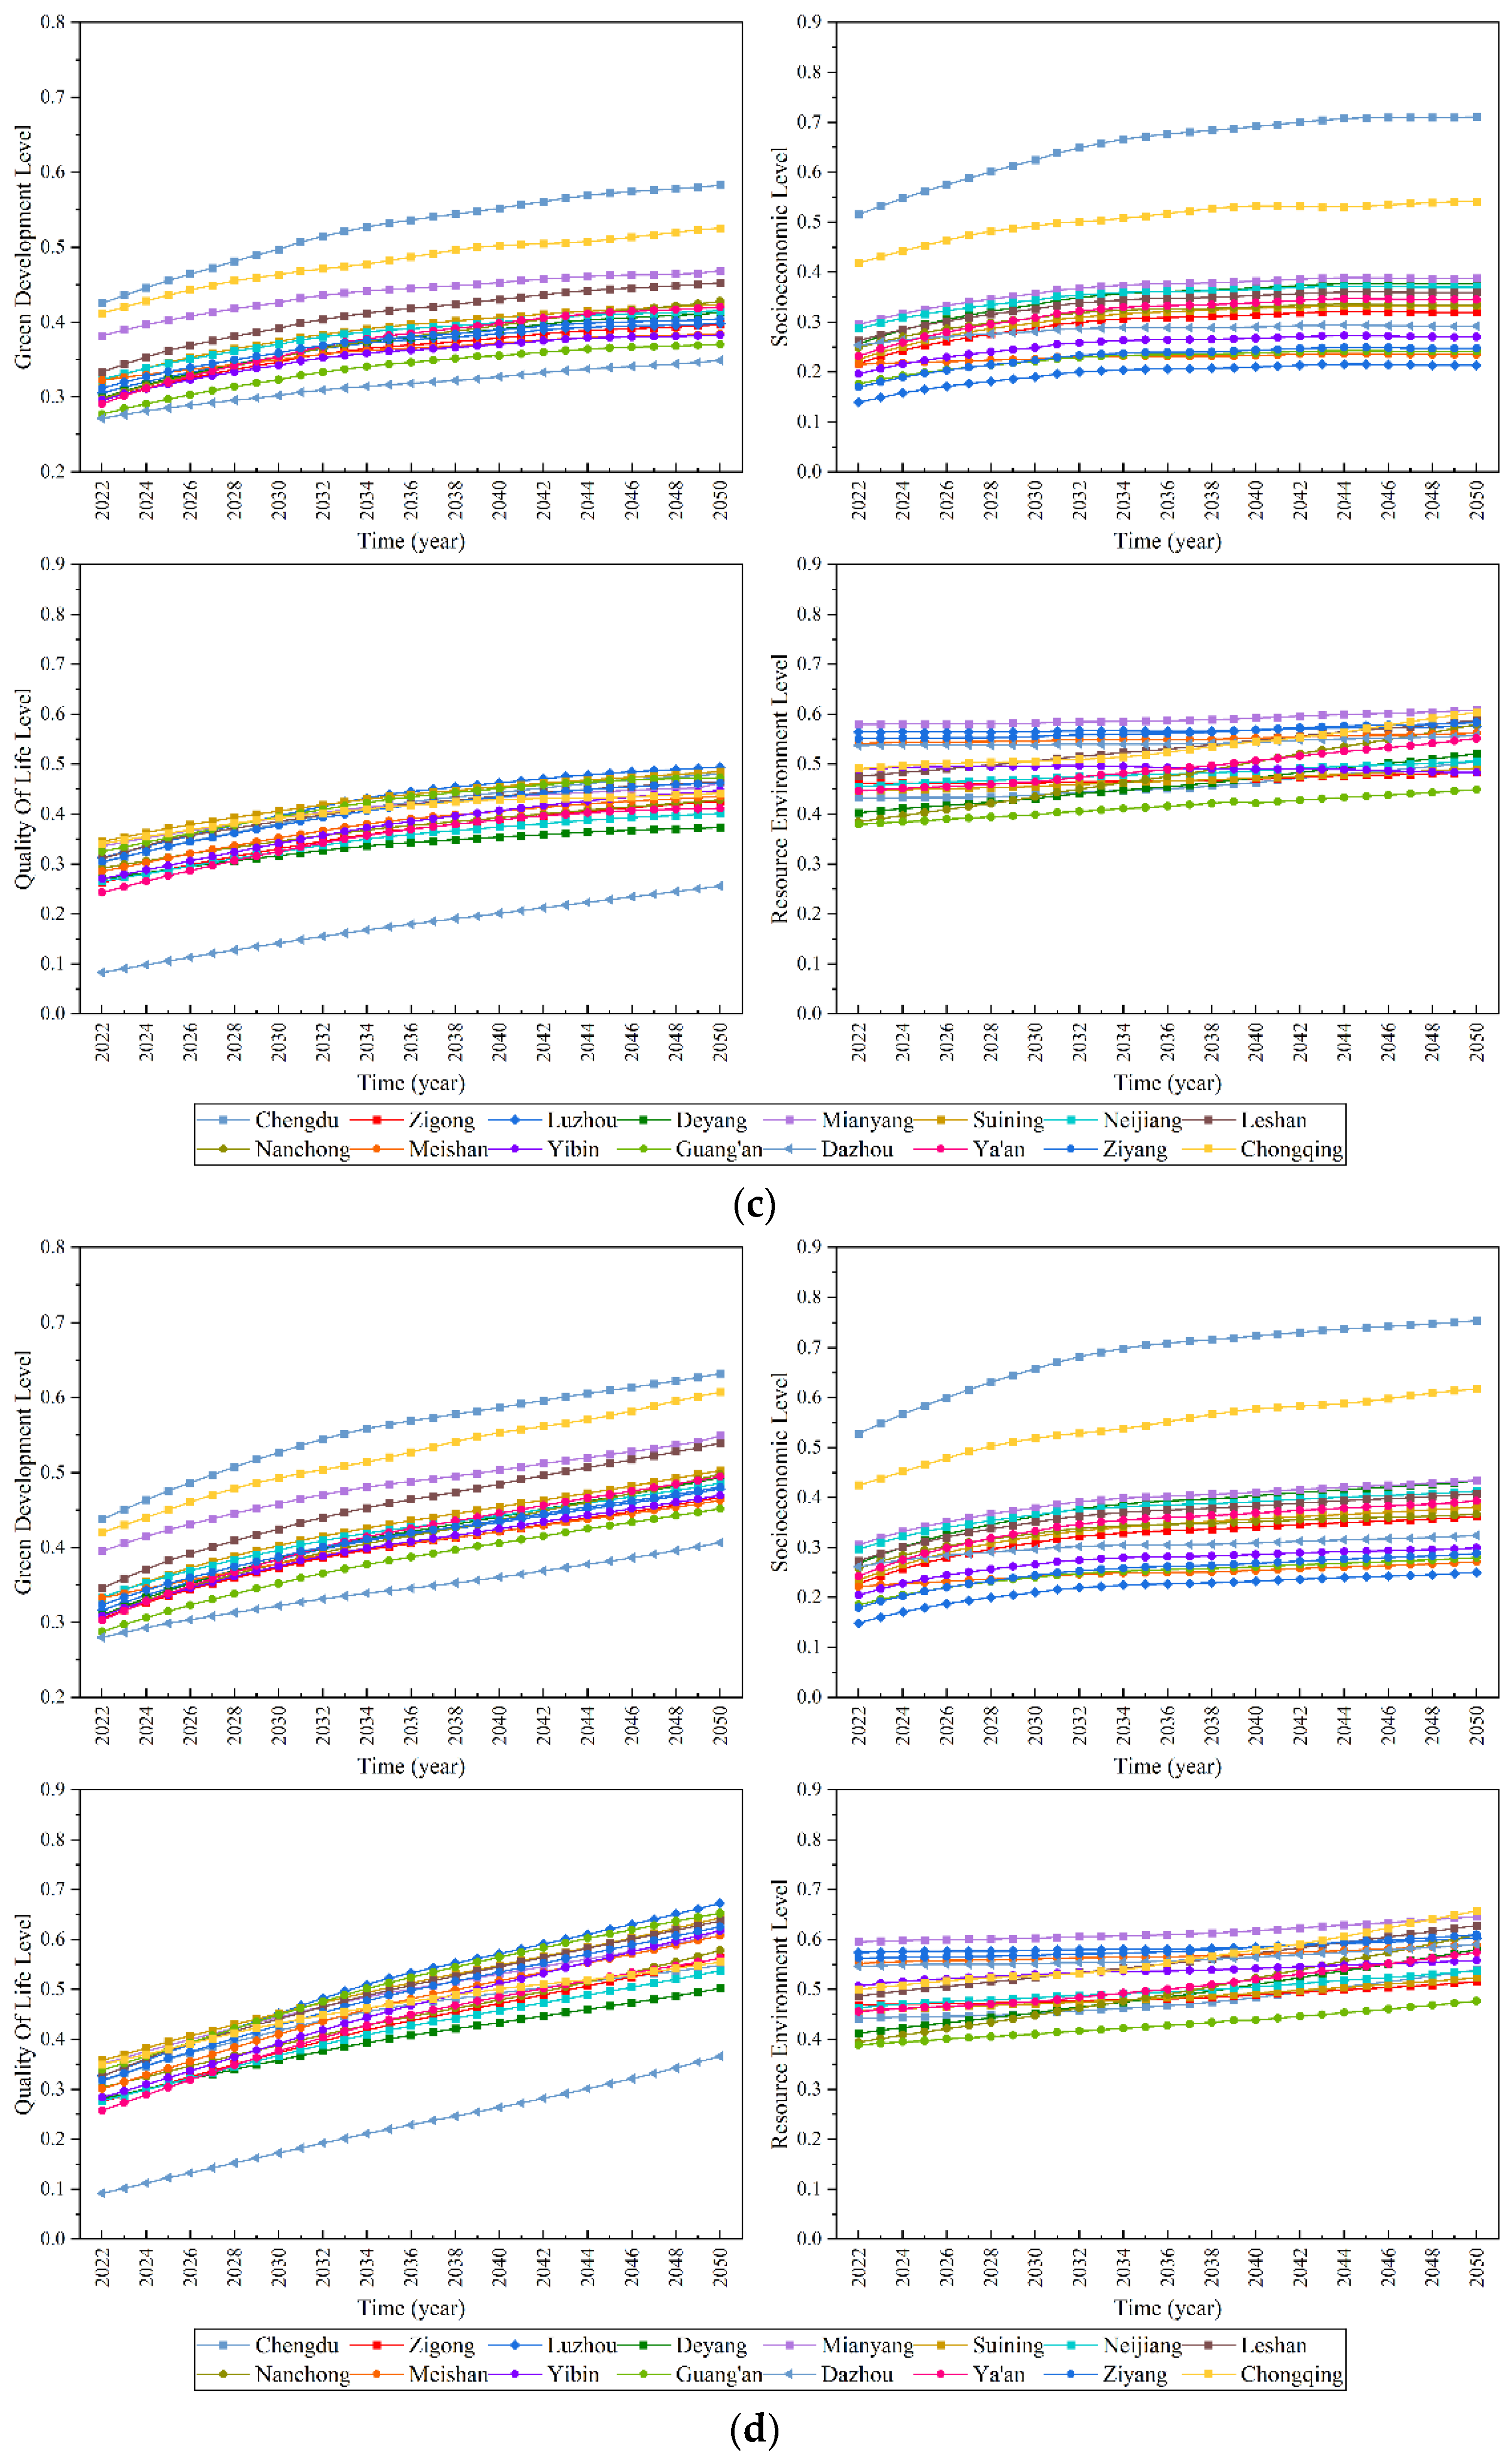
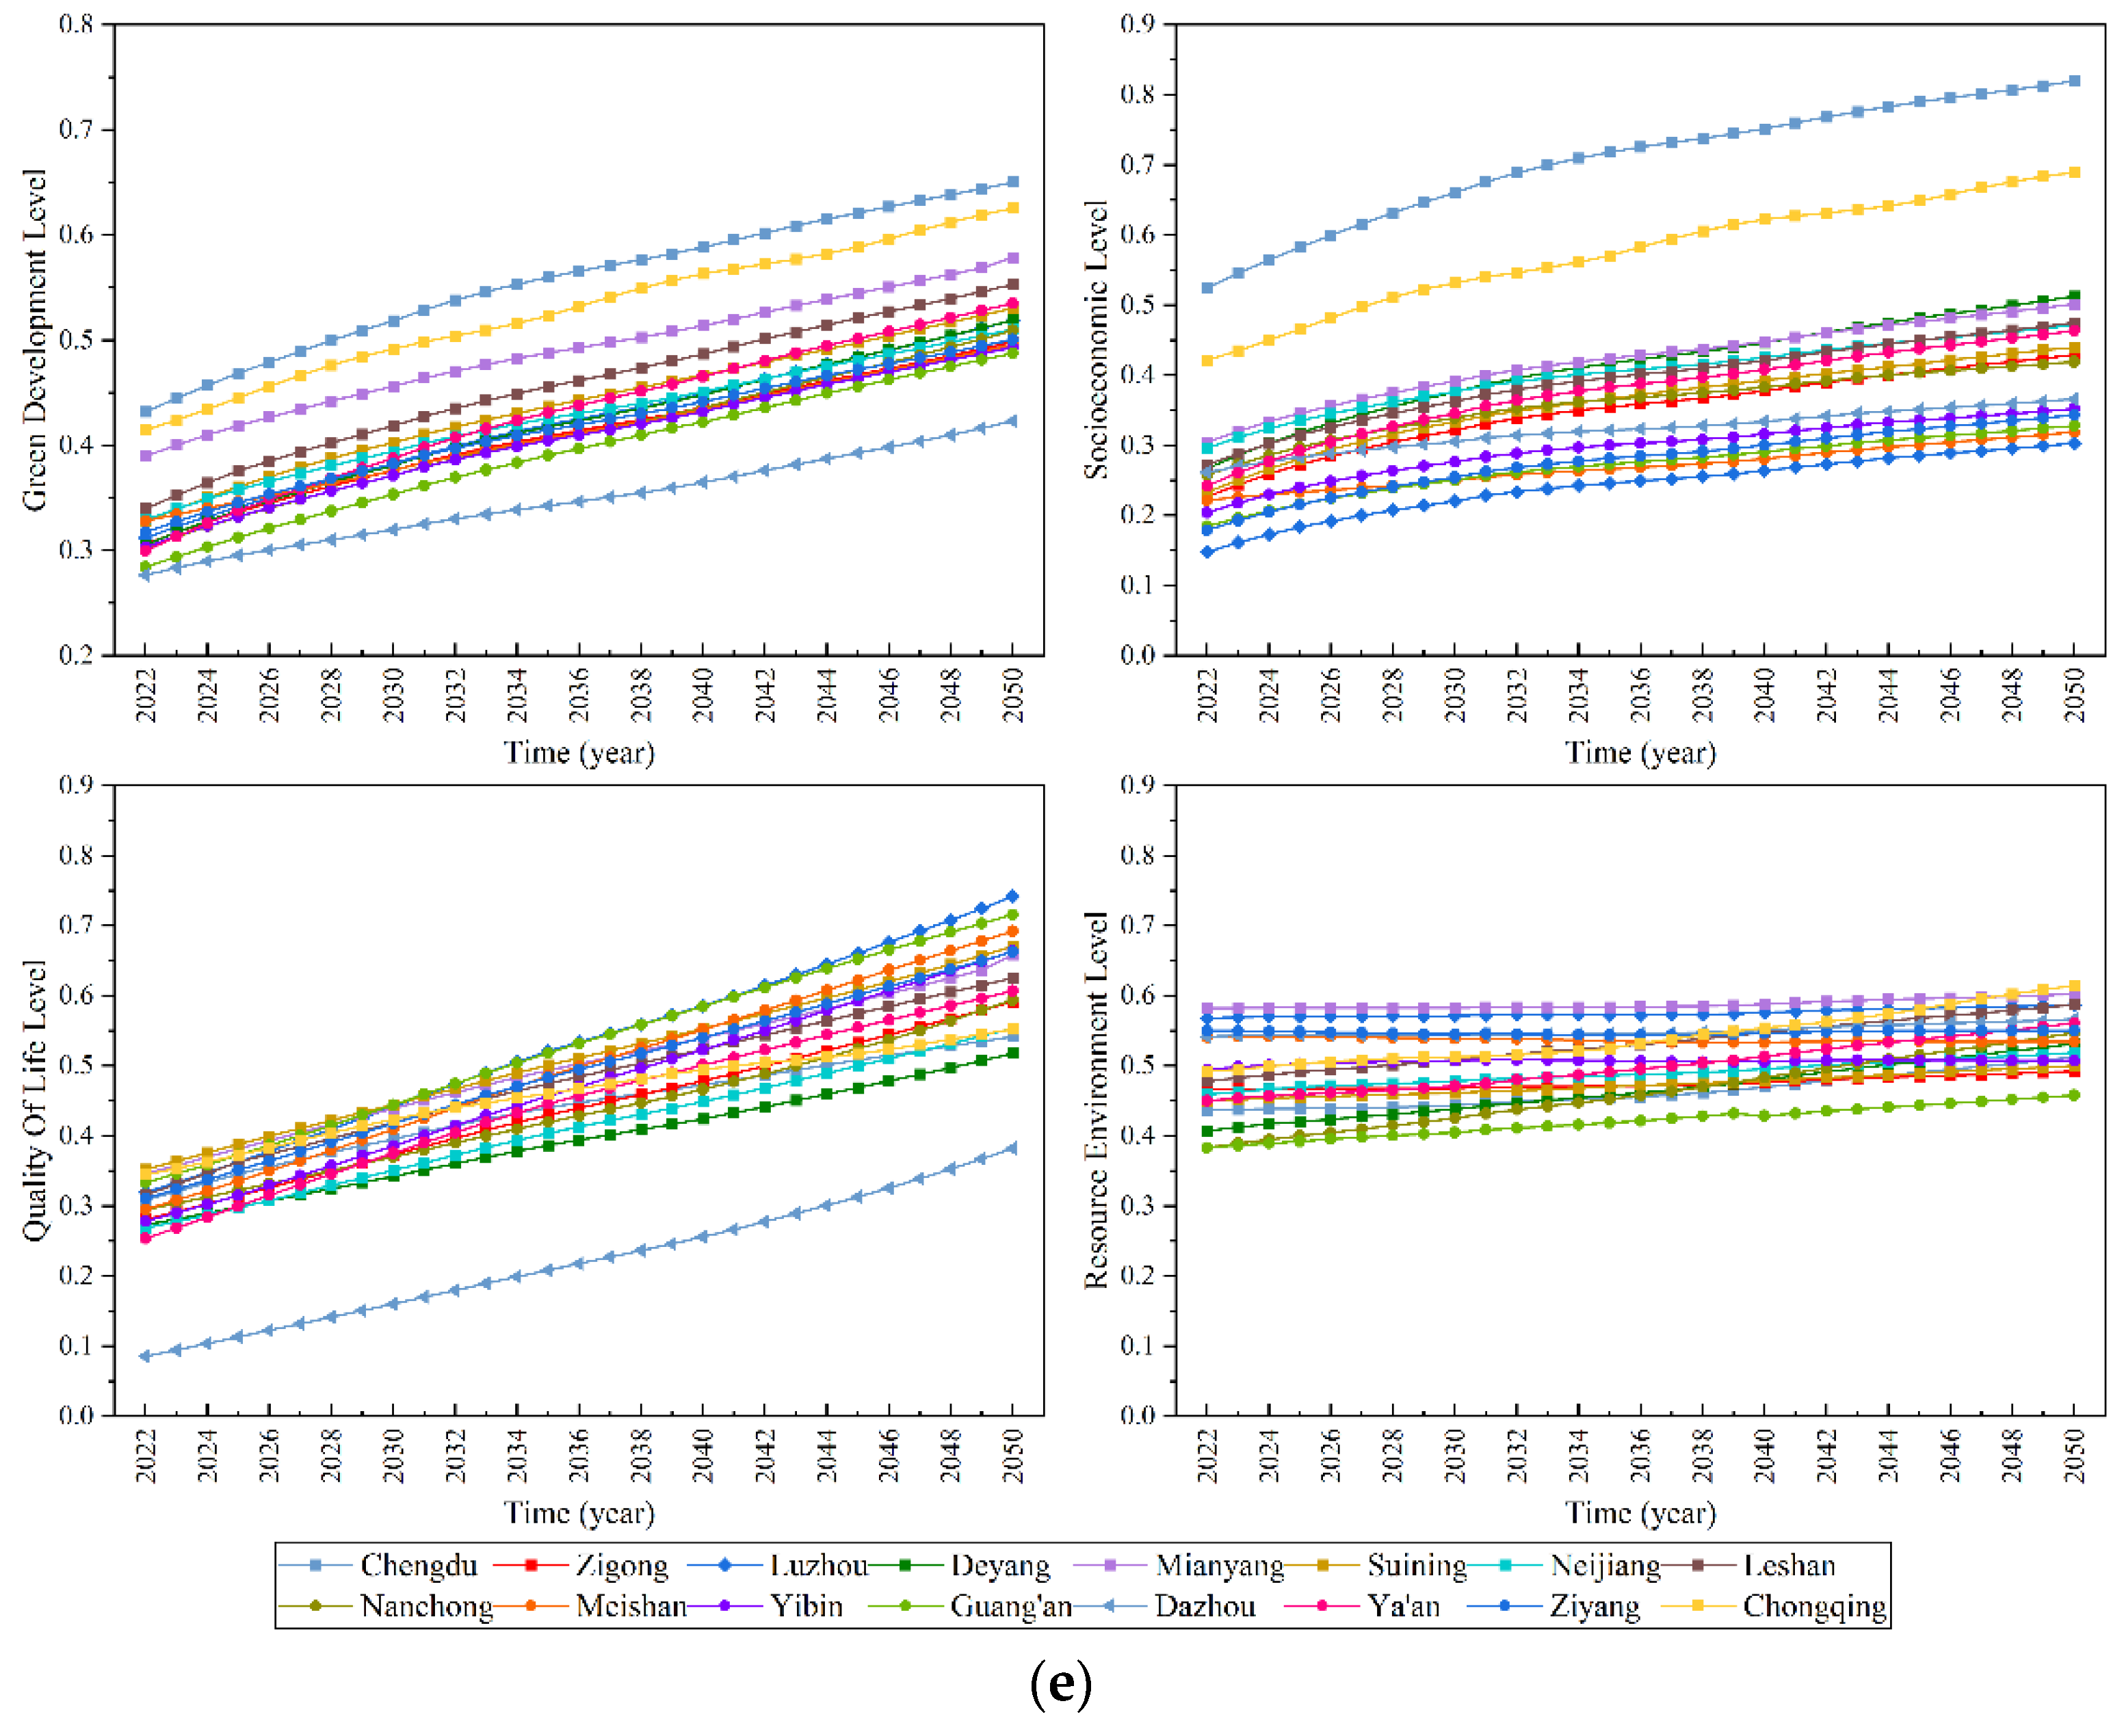
The abovementioned model parameters of each city in the Chengdu-Chongqing City Group were included in the SD model; the values of the various socio-economic indicators from 2019 to 2050 were simulated, and the entropy weight method was applied to calculate the green development level and criterion level of each city under the five SSPs considered, to further analyze the changes in the green development level in the Chengdu-Chongqing City Group. The simulation results are shown in Figure 7.
Under the five SSPs, the green development level and the guideline level of each city in the Chengdu-Chongqing City Group will increase overall. Specifically, the green development level of Chengdu and Chongqing will be significantly higher than that of other cities in the Chengdu-Chongqing City Group, and the gap will tend to further widen. Mianyang ranked third for green development level, showing a clear advantage over the other cities in 2022–2035. However, the gap between the green development level of Leshan and Mianyang is projected to gradually narrow, while that of Dazhou will be the lowest among all the cities investigated. In general, the green development level and the guideline level of each city will have different development growth rates and coordination levels under different pathways.
Under SSP1, the green development level of each city will have the fastest growth among all pathways considered; this growth is also expected to be coordinated and stable, although the gap between Dazhou and other cities will further expand.
Under SSP2, the cities were divided into four echelons according to their level of green development. Chengdu and Chongqing are in the first echelon and are characterized by similar levels of green development; the second echelon includes the cities of Mianyang and Leshan, the latter being expected to have almost the same level of green development as Mianyang by 2050. The fourth echelon includes only the city of Dazhou, and its gap with the other cities is projected to further expand. The other cities are in the third tier.
Under SSP3, the growth rate of the green development level will be the slowest among all the pathways considered; Chengdu and Chongqing will maintain the lead, with a large gap between them and the rest of the cities. Dazhou will have the lowest level of green development, although the gap between it and the other cities will first widen and then narrow.
Under SSP4, the growth rate of the green development level of each city will be stable overall, with a slowdown and a small plateau period appearing from 2030 to 2040, after which the growth will accelerate. Chengdu and Chongqing will have significantly higher levels of green development than the other cities, although this gap will first increase and then decrease. Mianyang and Leshan will follow in the ranking, and the gap between them will tend to shrink continuously until 2050, when it is expected to almost disappear.
Under SSP5, the green development level of each city will increase steadily, with Chengdu and Chongqing recording an almost equal level. Compared to other paths, the gap between Chengdu and Chongqing and the other cities will be the smallest, while the gap between Dazhou and the other cities will be the largest and will tend to expand continuously.
Looking at these results from the perspective of each city in the Chengdu-Chongqing City Group, it can be seen that the green development level of each city under SSP1 will be the highest and will have an overall steady growth trend; Chengdu will maintain the leading position, followed by Chongqing, and the gap between the remaining cities will tend to be stable. Under SSP3, all the cities in the Chengdu-Chongqing City Group will have the lowest level of green development and the slowest growth rate; moreover, the trend of growth will be uneven, with Chengdu and Chongqing expected to have a significantly higher growth trend than the other cities.
3.4.2. Analysis of the Overall Future Green Development Level of the Chengdu-Chongqing City Group
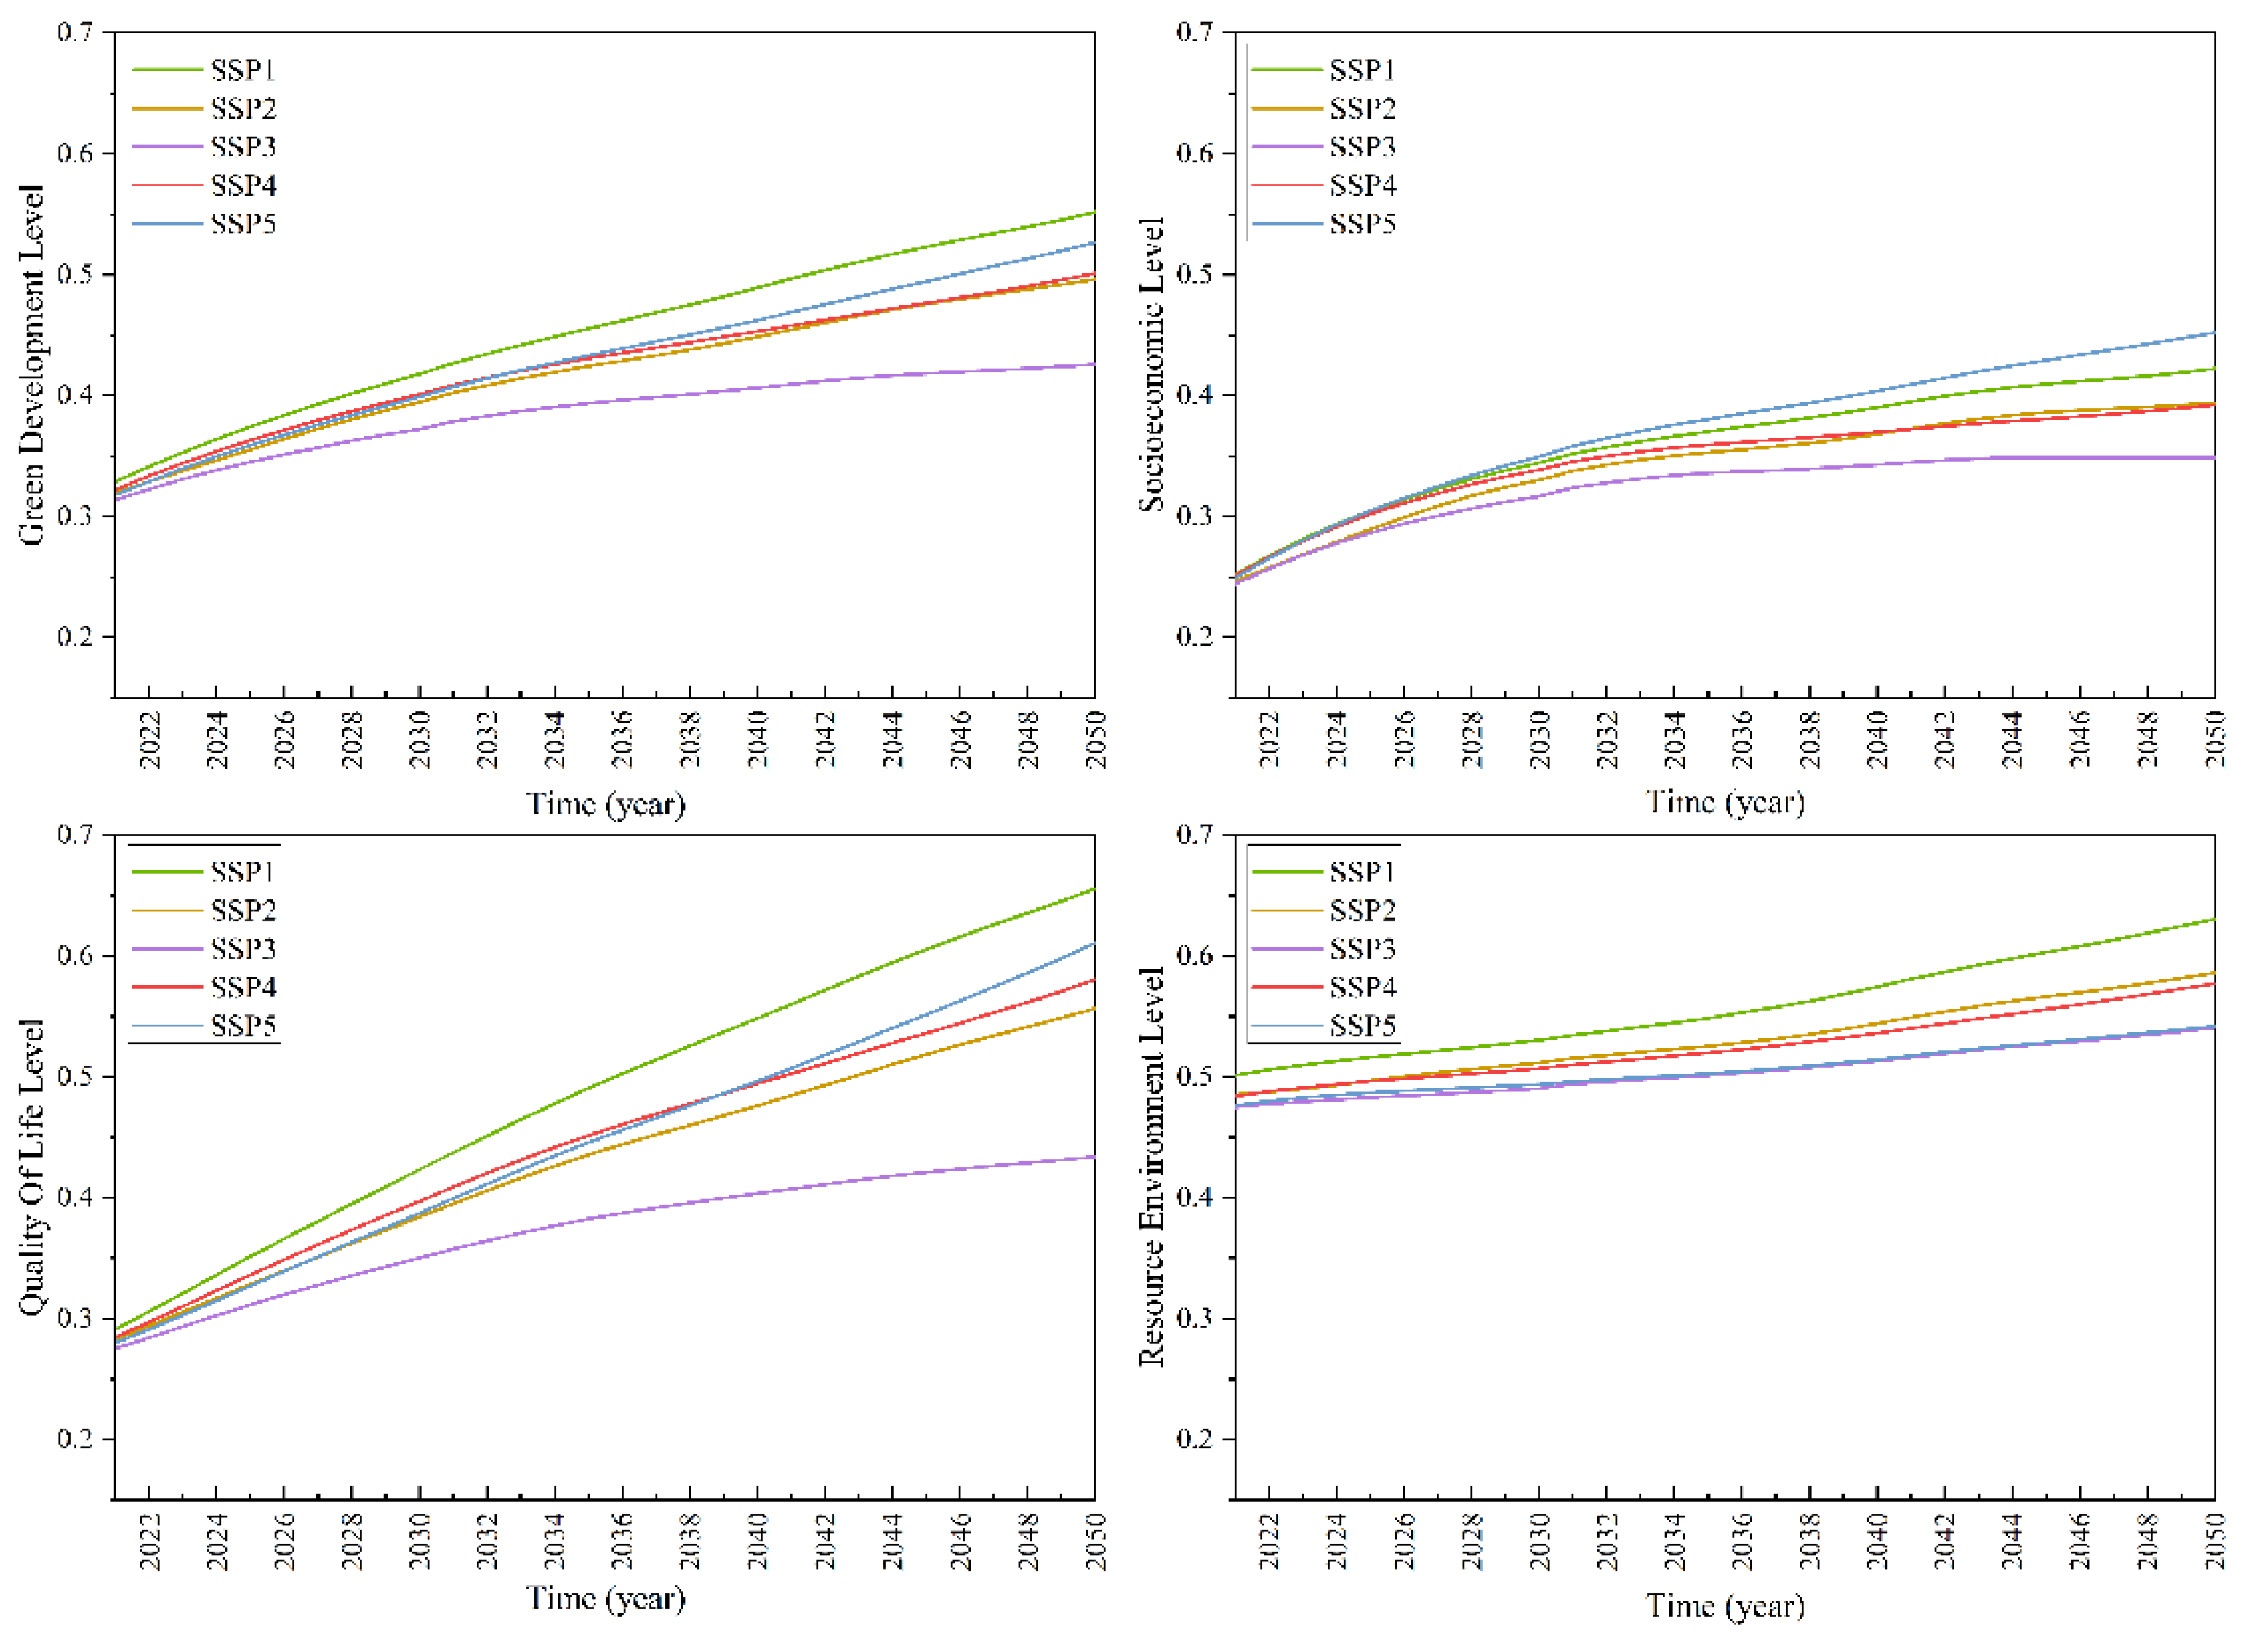
Based on the analysis of the future green development level of each city in the Chengdu-Chongqing City Group and the level of the criterion layer under the SSPs, the future green development level of the Chengdu-Chongqing City Group as a whole was calculated; it is shown in Figure 8.
From Figure 8, it can be seen that the future green development level and the guideline level of the Chengdu-Chongqing City Group as a whole will have a rising trend in all SSPs, and the growth rate will gradually decrease. In terms of green development, its level will be the highest under SSP1 and the lowest under SSP3, in which its growth rate will also be the slowest among all the SSPs considered. Moreover, the gap among the green development levels of SSP2, SSP4, and SSP5 will be narrow until 2035, with the highest level in SSP4 and the lowest in SSP2; after 2035, the growth rate under SSP4 will slow down and will be surpassed by that of SSP5, such that the level of green development under the latter will exceed that of the former and will be second only to SSP1. In terms of the socio-economic level of the Chengdu-Chongqing City Group, this will be the highest under SSP5, followed by SSP1, and it will be the lowest under SSP3. In terms of the resource and environment level, this will be the highest under SSP1 and the lowest under SSP3 and SSP5, with a small difference between the latter two. In terms of the quality-of-life level, this will be the highest under SSP1 and the lowest under SSP3. Moreover, under SSP4 it will be second only to SSP1 until 2039, after which that under SSP5 will grow relatively fast and will surpass SSP4.
From the perspective of individual paths, the green development level, the resource and environment level, and the quality-of-life level of the Chengdu-Chongqing City Group under SSP1 will be the highest, and their growth rate will also be the highest. The green development level will rise relatively steadily, increasing by 1.62 times by 2050, with an average annual growth rate of about 1.7%. The level of resources and environment will increase by 1.1 times until 2035, with an average annual growth rate of 0.63%; from 2035 to 2050, the growth rate will slightly accelerate, increasing by 1.14 times, with an average annual growth rate of about 0.93%. The development advantage of the level of resources and environment will become increasingly evident under SSP1, and the gap with the other paths will gradually increase. The socio-economic level of the Chengdu-Chongqing City Group under the SSP1 path will be second only to that of SSP5 and will be characterized by an increase of 1.56 times by 2050 and an average annual growth rate of about 1.6%.
Under SSP2, the green development level of the Chengdu-Chongqing City Group ranks fourth, with an increase of 1.5 times by 2050 and an average annual growth rate of about 1.5%. Under this pathway, the socio-economic level ranks fourth with an average annual growth rate of about 2.0% until 2041, after which SSP2 will overtake SSP4 and rank third, with an average annual growth rate of about 0.6% from 2041 to 2050.Under SSP2, the resource and environment level will be basically the same as that of SSP4 until 2026; after 2026, it will rank second after SSP1 and will increase by 1.2 times until 2050, with an average annual growth rate of 0.66%. In this pathway, the quality-of-life level will be similar to that under SSP5 until 2030, after which a gap will open up, and it will gradually lag behind SSP5, ranking fourth, with an increase of 1.9 times by 2050 and an average annual growth rate of about 2.3%.
The green development level and the guideline level of the Chengdu-Chongqing City Group under SSP3 will be the lowest, and the growth rate will be relatively slow and will tend to stabilize. Under this pathway, the green development level will increase by 1.34 times until 2050, with an average annual growth rate of about 0.99%. The socio-economic level will grow by 1.35 times by 2050, with an average annual growth rate of about 1.1%. Moreover, the resource and environment level will be only slightly lower than in SSP5; it will increase by about 1.1 times by 2050, with an average annual growth rate of about 0.44%. The quality-of-life level will increase by about 1.5 times by 2050, with an average annual growth rate of about 1.5%.
The green development level and the guideline level of the Chengdu-Chongqing City Group under SSP4 will be at an average level. The former will rank second after SSP1 until 2030; after 2030, it will be surpassed by that of SSP5 and will, thus, rank third; after 2042, it will be very close to that of SSP2 and will be equal to 0.46 in 2042. Overall, from 2022 to 2050, the green development level under SSP4 will increase by 1.5 times, with an average annual growth rate of about 1.46%. Under this pathway, the socio-economic level will be very close to that of SSP1 and SSP5 until 2030, after which it will gradually diverge, ranking third until 2041. After that, it will be slightly surpassed by that of SSP2, ranking fourth, with an average annual growth rate of about 1.39% until 2050. The quality-of-life level under SSP4 will rank second after SSP1 until 2040, after which it will be overtaken by that of SSP5 and will rank third, with an increase of 1.9 times by 2050 and an average annual growth rate of 2.4%.
The green development level, the socio-economic level, and the quality-of-life level of the Chengdu-Chongqing City Group under SSP5 will be the highest among all the pathways considered, while the resource and environment level will be the lowest. Under this pathway, the green development level will rank third until 2030, after which it will overtake SSP4 to rank second, increasing from 0.33 in 2022 to 0.53 in 2050, with an increase of 1.61 times and an average annual growth rate of about 1.69%. The socio-economic level will always be the highest, and its gap with that of the other pathways will widen, growing by 1.67 times by 2050, with an average annual growth rate of about 1.92%, i.e., the fastest growth rate among the five SSPs. Moreover, the resource and environment level under SSP5 will be almost the same as that in SSP3 and will be the lowest among the five SSPs considered, although it will slowly increase by 1.12 times by 2050. The quality-of-life level under SSP5 will rank third until 2039, after which it will overtake SSP4 to rank second, right after the SSP1 path, and will increase by 2.1 times by 2050, with an average annual growth rate of 2.68%.
3.5. Suggestions for the Future Development Path of the Chengdu-Chongqing City Group
The comparative analysis of the green development level of the Chengdu-Chongqing City Group as a whole and for each city under the shared SSPs considered, showed that under SSP1 both the green development level and its growth rate will be the highest among all the SSPs. Moreover, the green development level of the Chengdu-Chongqing City Group under SSP2 will be very similar to that under SSP4 and SSP5 before 2025, and will be lower only than that under SSP1. The year 2025 is the closing year of China’s 14th Five-Year Plan, which calls for the promotion of green development and the acceleration of the green transformation of the development methods. The period of 2025–2035 will be key for China to achieve a full modernization; moreover, the peak of carbon emissions is set to be reached before 2030, after which the steady decrease in carbon emissions will contribute to the achievement of the goal of building a beautiful China. Therefore, the transition from SSP2 to SSP1 should be completed by 2035 to achieve real sustainable development, and the latter pathway should be steadily followed from 2035 to 2050 so as to achieve carbon neutrality by 2060.
From the socio-economic point of view, the economic development of the Chengdu-Chongqing City Group will remain very uncoordinated and “polarized” for a long time in the future. The economic development level of Chengdu and Chongqing is far ahead of that of the other cities; the fundamental reason is that the regional GDP and the degree of openness of the other cities are relatively low, and the total import and export amount of Dazhou and Ya’an is only about 1% of that of Chengdu and Chongqing. Hence, it is important to narrow the economic differences among the cities in the Chengdu and Chongqing City Group to improve the overall green development level.
From the point of view of resources and environment, the resource and environment condition of the Chengdu-Chongqing City Group will not greatly improve in the future, which is in line with its development status; moreover, resource consumption and environmental pollution will increase together with the economic development. At present, the proportion of secondary industries in the Chengdu-Chongqing urban agglomeration is still very high, with more than 50% of the cities accounting for more than 45% of the secondary industries. The high energy consumption and pollution emissions of traditional heavy industries are the key factors hindering the green growth of the entire Chengdu-Chongqing City Group.
In terms of quality of life, the quality-of-life level of all the cities will steadily increase, although that of Dazhou will be considerably lower compared to the other cities. Although the population of Dazhou is gradually declining, its total population is higher than that of Mianyang, the second largest city in Sichuan, and its population pressure is also high. Accordingly, the resources at the disposal of each individual, such as medical care, roads, and green areas, are also relatively small.
4. Conclusions
This study constructed a green development SD model for the Chengdu-Chongqing City Group and set five simulation scenarios under the SSPs. The future green development level and the guideline level of each city and of the overall Chengdu-Chongqing City Group were simulated and calculated, with the comparison and analysis of the changes, obtaining the following main conclusions:
- The future green development level of each city in the Chengdu-Chongqing City Group under the SSPs considered will have an upward trend and will tend to be stable under SSP3. In SSP2, the green development level of Chengdu and of Chongqing will be very close, while in the other pathways the former will be the highest, followed by the latter. The socio-economic level of each city will tend to be stable under SSP3, while it will slowly increase in the other pathways. In terms of resource and environment level, the cities investigated will show little change in their resource and environment level under all the SSPs and only a weak upward trend overall. In terms of quality-of-life level, all the cities will have a stable upward trend under all the SSPs, which will gradually stabilize under SSP3.
- The results of the analysis of the changes in the green development level and the criterion level of the Chengdu-Chongqing City Group as a whole under the SSPs considered show that the green development level and the criterion level of the Chengdu-Chongqing City Group will increase under all of the five SSPs. The green development level, the resource and environment level, and the quality-of-life level will be the highest under SSP1 and the lowest under SSP3, and this gap will gradually increase. The socio-economic level will be the highest under SSP5, followed by SSP1, and it will be the lowest under SSP3.
Based on these findings, the Chengdu-Chongqing City Group should follow suitable pathways for future development. Specifically, SSP2 should be used as the basis for development until 2025, which entails the continuance of the current development trend, after which a transition should be gradually performed toward SSP1, which should be completed before 2035 to achieve real sustainable development. Afterwards, the Chengdu-Chongqing City Group should continue to develop according to SSP1 from 2035 to 2050.
Author Contributions
Conceptualization, Y.L., L.Z., M.L. and Y.X.; writing—original draft preparation, Y.L. and M.L.; writing—review and editing, L.Z. and Y.X.; supervision, L.Z. and Y.X.; funding acquisition, Y.X. and J.X. All authors have read and agreed to the published version of the manuscript.
Funding
This research is supported by the National Natural Science Foundation of China (Grant No.41890824, No.52279023).
Institutional Review Board Statement
Not applicable.
Informed Consent Statement
Not applicable.
Data Availability Statement
Not applicable.
Conflicts of Interest
The authors declare no conflict of interest.
Appendix A
Appendix A shows the historical statistical descriptions of the parameters and the initial values of the state variables of the green development level system dynamics model of the Chengdu-Chongqing City Group constructed in this study, together with the historical test results of the green development level system dynamics model of each city in the Chengdu-Chongqing City Group.

Table A1.
Statistical description of model parameters in Chengdu and Chongqing.
| City | Model Parameters | Maximum Value | Minimum Value | Average Value |
|---|---|---|---|---|
| Chengdu | Population growth rate | 0.1222 | 0.0080 | 0.0230 |
| GDP growth rate | 0.2013 | 0.0689 | 0.1337 | |
| Rate of increase in total energy consumption | 0.1878 | −0.1519 | 0.0158 | |
| Rate of increase in arable land area | 0.2015 | −0.0162 | 0.0238 | |
| Increase rate of public green space | 0.2089 | −0.0153 | 0.0477 | |
| Rate of increase in total water supply | 0.1725 | −0.0885 | 0.0473 | |
| Chongqing | Population growth rate | 0.0110 | −0.0012 | 0.0059 |
| GDP growth rate | 0.2088 | 0.0412 | 0.1250 | |
| Rate of increase in total energy consumption | 0.1369 | 0.0209 | 0.0648 | |
| Rate of increase in arable land area | 0.0595 | −0.1096 | −0.0032 | |
| Increase rate of public green space | 0.2655 | −0.0578 | 0.0969 | |
| Rate of increase in total water supply | 0.1128 | −0.0863 | 0.0500 |
Table A2.
Initial values of state variables of the SD model of the green development level of each city in the Chengdu-Chongqing City Group.
Table A2.
Initial values of state variables of the SD model of the green development level of each city in the Chengdu-Chongqing City Group.
| City | Total Population | Total GDP | Total Energy Consumption | Arable Land Area | Area of Public Green Space | Total Water Supply |
|---|---|---|---|---|---|---|
| Chengdu | 1044.31 | 1705.2732 | 1155.32 | 362,600 | 7289.28 | 48,810 |
| Chongqing | 2606.26 | 2400.2470 | 2693.21 | 1,353,200 | 8053.34 | 71,100 |
| Dazhou | 637.81 | 239.1671 | 1259.78 | 270,540 | 685.08 | 2933 |
| Deyang | 380.59 | 328.6206 | 358.60 | 194,162 | 2620.89 | 14,993 |
| Guang’an | 448.54 | 170.3600 | 372.66 | 173,600 | 1957.75 | 2400 |
| Leshan | 347.63 | 215.5705 | 668.07 | 149,900 | 2443.84 | 9823 |
| Luzhou | 468.10 | 204.3567 | 384.19 | 211,000 | 2515.80 | 8794 |
| Meishan | 340.66 | 171.7821 | 470.97 | 176,000 | 665.53 | 3200 |
| Mianyang | 527.50 | 396.6000 | 548.47 | 283,100 | 4239.74 | 7191 |
| Nanchong | 717.73 | 239.3039 | 315.12 | 300,519 | 5155.67 | 12,017 |
| Neijiang | 421.25 | 182.3293 | 499.88 | 164,507 | 504.60 | 6000 |
| Suining | 376.60 | 148.4155 | 166.10 | 154,891 | 2564.46 | 6247 |
| Ya’an | 153.15 | 91.9400 | 88.22 | 60,000 | 1131.37 | 3100 |
| Yibin | 515.01 | 257.6936 | 422.67 | 242,406 | 792.27 | 4900 |
| Ziyang | 344.77 | 124.5088 | 183.24 | 193,000 | 340.97 | 4200 |
| Zigong | 315.30 | 192.4271 | 735.49 | 123,100 | 3244.46 | 7622 |
Table A3.
Pass rate of historical test of SD model of the green development level of cities in the Chengdu-Chongqing City Group.
Table A3.
Pass rate of historical test of SD model of the green development level of cities in the Chengdu-Chongqing City Group.
| City | Total Population | Total GDP | Total Energy Consumption | |||
|---|---|---|---|---|---|---|
| 10% Pass Rate (%) | 20% Pass Rate (%) | 10% Pass Rate (%) | 20% Pass Rate (%) | 10% Pass Rate (%) | 20% Pass Rate (%) | |
| Chengdu | 100 | 100 | 100 | 100 | 93.3 | 100 |
| Chongqing | 100 | 100 | 93.3 | 100 | 100 | 100 |
| Dazhou | 100 | 100 | 100 | 100 | 66.7 | 80 |
| Deyang | 100 | 100 | 100 | 100 | 86.7 | 100 |
| Guang’an | 100 | 100 | 100 | 100 | 80 | 100 |
| Leshan | 100 | 100 | 100 | 100 | 80 | 100 |
| Luzhou | 100 | 100 | 93.3 | 100 | 60 | 86.7 |
| Meishan | 100 | 100 | 100 | 100 | 93.3 | 100 |
| Mianyang | 100 | 100 | 100 | 100 | 86.7 | 100 |
| Nanchong | 100 | 100 | 100 | 100 | 80 | 100 |
| Neijiang | 100 | 100 | 93.3 | 100 | 93.3 | 100 |
| Suining | 100 | 100 | 100 | 100 | 86.7 | 93.3 |
| Ya’an | 100 | 100 | 100 | 100 | 93.3 | 100 |
| Yibin | 100 | 100 | 100 | 100 | 80 | 86.7 |
| Ziyang | 100 | 100 | 93.3 | 100 | 86.7 | 100 |
| Zigong | 100 | 100 | 100 | 100 | 86.7 | 100 |
| City | Arable Land Area | Area of Public Green Space | Total Water Supply | |||
| 10% Pass Rate (%) | 20% Pass Rate (%) | 10% Pass Rate (%) | 20% Pass Rate (%) | 10% Pass Rate (%) | 20% Pass Rate (%) | |
| Chengdu | 86.7 | 100 | 100 | 100 | 100 | 100 |
| Chongqing | 100 | 100 | 80 | 93.3 | 100 | 100 |
| Dazhou | 100 | 100 | 73.3 | 93.3 | 93.3 | 100 |
| Deyang | 100 | 100 | 100 | 100 | 86.7 | 93.3 |
| Guang’an | 100 | 100 | 93.3 | 100 | 80 | 100 |
| Leshan | 100 | 100 | 100 | 100 | 86.7 | 100 |
| Luzhou | 100 | 100 | 93.3 | 100 | 80 | 100 |
| Meishan | 100 | 100 | 80 | 93.3 | 100 | 100 |
| Mianyang | 100 | 100 | 86.7 | 100 | 86.7 | 100 |
| Nanchong | 100 | 100 | 100 | 100 | 100 | 100 |
| Neijiang | 100 | 100 | 80 | 100 | 80 | 93.3 |
| Suining | 100 | 100 | 93.3 | 93.3 | 93.3 | 93.3 |
| Ya’an | 100 | 100 | 73.3 | 73.3 | 86.7 | 100 |
| Yibin | 100 | 100 | 86.7 | 100 | 93.3 | 100 |
| Ziyang | 100 | 100 | 66.7 | 80 | 86.7 | 100 |
| Zigong | 100 | 100 | 86.7 | 100 | 86.7 | 100 |
Ten percent pass rate: the ratio of the simulated year to the simulated year for which the relative error between the simulated model value and the historical statistical value is within ±10%; twenty percent pass rate: the ratio of the simulated year to the simulated year for which the relative error between the simulated model value and the historical statistical value is within ±20%.
References
- Wang, Z. On William Petty’s Thought of Market Economy. J. Suzhou Univ. Sci. Technol. 1996, 2, 18–22. [Google Scholar]
- Hu, A. Leading the Road to a Green Power with the “Red Line” of the Scientific Outlook on Development. Environ. Prot. 2009, 1, 47–49. [Google Scholar]
- Han, M.; Yuan, Q.; Fahad, S.; Ma, T. Dynamic Evaluation of Green Development Level of ASEAN Region and Its Spatio-Temporal Patterns. J. Clean Prod. 2022, 362, 132402. [Google Scholar] [CrossRef]
- Zhang, R.; Ma, Y.; Ren, J. Green Development Performance Evaluation Based on Dual Perspectives of Level and Efficiency: A Case Study of the Yangtze River Economic Belt, China. Int. J. Environ. Res. Public Health 2022, 19, 9306. [Google Scholar] [CrossRef] [PubMed]
- Jiang, S.; Yu, H.; Li, Z.; Geng, B.; Li, T. Study on the Evolution of the Spatial-Temporal Pattern and the Influencing Mechanism of the Green Development Level of the Shandong Peninsula Urban Agglomeration. Sustainability 2022, 14, 9549. [Google Scholar] [CrossRef]
- Wang, Z.; Zhang, X.; Zhang, C.; Yang, Q. How Regional Integration Affects Urban Green Development Efficiency: Evidence from Urban Agglomeration in the Middle Reaches of the Yangtze River. Int. J. Environ. Res. Public Health 2022, 19, 7937. [Google Scholar] [CrossRef]
- Wu, W.; Luo, X.; Knopp, J.; Jones, L.; Banzhaf, E. A European-Chinese Exploration: Part 2-Urban Ecosystem Service Patterns, Processes, and Contributions to Environmental Equity under Different Scenarios. Remote Sens. 2022, 14, 3488. [Google Scholar] [CrossRef]
- Gu, M.; Wang, F.; Wang, S. Simulation of China’s Green Development Policy Based on System Dynamics. Chin. J. Environ. Manag. 2021, 13, 126–135. [Google Scholar] [CrossRef]
- Hall, B.; Kerr, M.L. Green Index 1991–1992: A State-by-State Guide to the Nation’s Environmental Health; Island Press: Washington, DC, USA, 1991. [Google Scholar]
- Feng, C.; Wang, M.; Liu, G.; Huang, J. Green Development Performance and Its Influencing Factors: A Global Perspective. J. Clean. Prod. 2017, 144, 323–333. [Google Scholar] [CrossRef]
- Li, X.; Liu, Y.; Song, T. Calculation of the Green Development Index. Soc. Sci. China 2014, 6, 69–95. [Google Scholar]
- Wang, M.; Zhao, H.; Cui, J.; Fan, D.; Lv, B.; Wang, G.; Li, Z.; Zhou, G. Evaluating Green Development Level of Nine Cities within the Pearl River Delta, China. J. Clean. Prod. 2018, 174, 315–323. [Google Scholar] [CrossRef]
- Guo, M.; Nowakowska-Grunt, J.; Gorbanyov, V.; Egorova, M. Green Technology and Sustainable Development: Assessment and Green Growth Frameworks. Sustainability 2020, 12, 6571. [Google Scholar] [CrossRef]
- Shields, K.; Langer, H.; Watson, J.; Stelzner, K. European Green City Index. Assessing the Environmental Impact of Europe’s Major Cities; Siemens AG: Muenchen, Germany, 2009. [Google Scholar]
- Carli, R.; Dotoli, M.; Pellegrino, R. Multi-Criteria Decision-Making for Sustainable Metropolitan Cities Assessment. J. Environ. Manag. 2018, 226, 46–61. [Google Scholar] [CrossRef] [PubMed]
- Tian, S.; Ding, Y. Greenization Measurement of Urban Agglomeration in Yangtze River Delta and Its Influence Factors: An Empirical Study Based on the Entropy-Tobit Model of 26 Cities’ Panel Data. Econ. Geogr. 2019, 39, 94–103. [Google Scholar] [CrossRef]
- Hu, S.; Zeng, G.; Cao, X.; Yuan, H.; Chen, B. Does Technological Innovation Promote Green Development? A Case Study of the Yangtze River Economic Belt in China. IJERPH 2021, 18, 6111. [Google Scholar] [CrossRef] [PubMed]
- Forrester, J. Industrial Dynamics—A Major Breakthrough for Decision Makers. Harv. Bus. Rev. 1958, 36, 37. [Google Scholar]
- Mass, N.J. Readings in Urban Dynamics, 2nd ed.; The MIT Press: Cambridge, MA, USA, 1977; ISBN 978-0-262-06067-7. [Google Scholar]
- Alfeld, L.E.; Graham, A.K. Introduction to Urban Dynamics; Wright-Allen Press: MA, USA, 1976. [Google Scholar]
- Rudneva, L.; Pchelintseva, I.; Gureva, M. Scenario Modelling of the “Green” Economy in an Economic Space. Resour.-Basel 2018, 7, 29. [Google Scholar] [CrossRef] [Green Version]
- Yang, G.; Shi, Y.; Yang, F.; Zhang, F. Assessment of sustainable development of water resources carrying capacity based on system dynamics model: Case of Chongqing City. Yangtze River 2019, 50, 6–13+51. [Google Scholar] [CrossRef]
- Zhou, J. Research on Assessment and Improving Path of Green Development in the Beijing-Tianjin-Hebei Urban Agglomeration. Ph.D. Thesis, China University of Mining and Technology, Beijing, China, 2019. [Google Scholar]
- Wang, H.; Bao, C. Scenario Modeling of Ecological Security Index Using System Dynamics in Beijing-Tianjin-Hebei Urban Agglomeration. Ecol. Indic. 2021, 125, 107613. [Google Scholar] [CrossRef]
- Li, J.; Sun, K. Research on the Industrial Green Development of Beijing-Tianjin-Hebei Based on System Dynamics. Soft Sci. 2018, 32, 113–119. [Google Scholar] [CrossRef]
- Zhang, J.; Yang, D.; Zhu, J.; Sun, Z.; Yu, X. Research on the Green and Low-carbon Path of Urban Agglomeration on the Perspective of System Dynamics. Sci. Technol. Ind. 2021, 21, 307–314. [Google Scholar]
- O’Keeffe, J.; Pluchinotta, I.; De Stercke, S.; Hinson, C.; Puchol-Salort, P.; Mijic, A.; Zimmermann, N.; Collins, A.M. Evaluating Natural Capital Performance of Urban Development through System Dynamics: A Case Study from London. Sci. Total Environ. 2022, 824, 153673. [Google Scholar] [CrossRef] [PubMed]
- Gudlaugsson, B.; Ghanem, D.A.; Dawood, H.; Pillai, G.; Short, M. A Qualitative Based Causal-Loop Diagram for Understanding Policy Design Challenges for a Sustainable Transition Pathway: The Case of Tees Valley Region, UK. Sustainability 2022, 14, 4462. [Google Scholar] [CrossRef]
- Wu, C. Golden Waterway—Yangtze River Economic Belt, 1st ed.; Chongqing University Press: Chongqing, China, 2020. [Google Scholar]
- Wu, C.; Huang, L. Research on the Performance and the Synergistic Effect of Green Development of Yangtze River Economic Belt’s Industry. J. China Univ. Geosci. (Soc. Sci. Ed.) 2018, 18, 46–55. [Google Scholar] [CrossRef]
- Zhou, P.; Chen, S. Spatial and Economic Ties between Chengdu-Chongqing City Groups and Its Evolution. J. China West Norm. Univ. (Nat. Sci.) 2021, 1–11. [Google Scholar]
- Liu, H.; Liu, Y.; Meng, L.; Jiao, K.; Zhu, M.; Chen, Y.; Zhang, P. Research progress of entropy weight method in water resources and water environment. J. Glaciol. Geocryol. 2022, 44, 299–306. [Google Scholar]
- Wei, X.; Zhao, Y.; Li, X.; Xue, Z.; Xia, S. Characteristics and Optimization of Geographical Space in Urban Agglomeration in the Upper Reaches of the Yangtze River Based on the Function of “Production-Living-Ecological”. Resour. Environ. Yangtze Basin 2019, 28, 1070–1079. [Google Scholar]
- You, Z. Evaluation and Analysis of Ecological Carrying Capacity of Huainan City Based on System Dynamics. Master’s Thesis, Anhui Jianzhu University, Hefei, China, 2018. [Google Scholar]
- Wang, Q. System Dynamics, revised ed.; Tsinghua University Press: Beijing, China, 1994; ISBN 978-7-302-01523-9. [Google Scholar]
- Tian, L.; Zhang, H.; Zhang, X. A system dynamics approach for economic developing zone water demand forecasting:a case study of Tianjin Linkong area. J. Tiangong Univ. 2009, 28, 68–72. [Google Scholar]
- Vensim User Manual—Baidu Library. Available online: https://wenku.baidu.com/view/54635a0390c69ec3d5bb75e0.html (accessed on 6 September 2022).
- Lv, D. Research and Environment Carrying Capacity of Ordos:Based on System Dynamics Model. Master’s Thesis, China University of Geosciences, China, Beijing, 2016. [Google Scholar]
- Zhong, Y.; Jia, X.; Qian, Y. System Dynamics, 2nd ed.; Science Press: Beijing, China, 2009; ISBN 978-7-03-023535-0. [Google Scholar]
- Moss, R.H.; Edmonds, J.A.; Hibbard, K.A.; Manning, M.R.; Rose, S.K.; van Vuuren, D.P.; Carter, T.R.; Emori, S.; Kainuma, M.; Kram, T.; et al. The next Generation of Scenarios for Climate Change Research and Assessment. Nature 2010, 463, 747–756. [Google Scholar] [CrossRef]
- van Vuuren, D.P.; Edmonds, J.; Kainuma, M.; Riahi, K.; Thomson, A.; Hibbard, K.; Hurtt, G.C.; Kram, T.; Krey, V.; Lamarque, J.-F.; et al. The Representative Concentration Pathways: An Overview. Clim. Chang. 2011, 109, 5–31. [Google Scholar] [CrossRef]
- van Vuuren, D.P.; Riahi, K.; Moss, R.; Edmonds, J.; Thomson, A.; Nakicenovic, N.; Kram, T.; Berkhout, F.; Swart, R.; Janetos, A.; et al. A Proposal for a New Scenario Framework to Support Research and Assessment in Different Climate Research Communities. Glob. Environ. Change-Hum. Policy Dimens. 2012, 22, 21–35. [Google Scholar] [CrossRef] [Green Version]
- Zhang, L.; Chen, X.; Xin, X. Short commentary on CMIP6 Scenario Model Intercomparison Project (ScenarioMIP). Clim. Chang. Res. 2019, 15, 519–525. [Google Scholar]
- Elsawah, S.; Pierce, S.A.; Hamilton, S.H.; van Delden, H.; Haase, D.; Elmandi, A.; Jakeman, A.J. An Overview of the System Dynamics Process for Integrated Modelling of Socio-Ecological Systems: Lessons on Good Modelling Practice from Five Case Studies. Environ. Modell. Softw. 2017, 93, 127–145. [Google Scholar] [CrossRef]
- Jiang, T.; Zhao, J.; Jing, C.; Cao, L.G.; Sun, H.M.; Wang, A.Q.; Huang, J.L.; Su, B.D.; Wang, R. National and Provincial Population Projected to 2100 Under the Shared Socioeconomic Pathways in China. Clim. Chang. Res. 2017, 13, 128–137. [Google Scholar]
- Jing, C.; Su, B.; Cao, Q.; Zhai, J.; Wang, Y.; Tao, H.; Jiang, T. Projection of urbanization and economy in the ’Belt and Road’ countries based on the shared socioeconomic pathways. China Popul. Resour. Environ. 2019, 29, 21–31. [Google Scholar]
- Wang, Y.; Jing, C.; Jiang, T.; Zhai, J.; Feng, Z.; Yang, C.; Zhang, R.; Su, B. Projection of provincial urban and rural population and its influencing factors in China’s mainland (2015–2050). J. Nanjing Univ. Inf. Sci. Technol. (Nat. Sci. Ed.) 2020, 12, 395–405. [Google Scholar] [CrossRef]
- Zhao, J. Study on the Changes of National Population and Economy Based on the Grid under the Shared Socioeconomic Pathways by IPCC. Master’s Thesis, Nanjing University of Information Technology, Nanjing, China, 2018. [Google Scholar]
- Pan, J.; Su, B.; Wang, Y.; Jing, C.; Zhai, J.; Jiang, T. Spatio-temporal changes of output value from the primary, secondary and tertiary industries for 2020-2050 under the Shared Socioeconomic Pathways. Clim. Chang. Res. 2020, 16, 725–737. [Google Scholar]
- Jiang, T.; Zhao, J.; Cao, L.; Wang, Y.; Su, B.; Jing, C.; Wang, R.; Gao, C. Projection of national and provincial economy under the shared socioeconomic pathways in China. Clim. Chang. Res. 2018, 14, 50–58. [Google Scholar]
- Xu, G.; Zou, J. The Method of System Dynamics: Principle, Characteristics and New Development. J. Harbin Inst. Technol. (Soc. Sci. Ed.) 2006, 4, 72–77. [Google Scholar] [CrossRef]
- Mashaly, A.F.; Fernald, A.G. Analyzing and Assessing Dynamic Behavior of a Physical Supply and Demand System for Sustainable Water Management under a Semi-Arid Environment. Water 2022, 14, 1939. [Google Scholar] [CrossRef]
- Li, F.; Sun, Y.; Li, X.; Hao, X.; Li, W.; Qian, Y.; Liu, H.; Sun, H. Research on the Sustainable Development of Green-Space in Beijing Using the Dynamic Systems Model. Sustainability 2016, 8, 965. [Google Scholar] [CrossRef]
Figure 1.
The Chengdu-Chongqing City Group scope diagram.

Figure 2.
Shared social economy path diagram.

Figure 3.
Systematic analysis of SD model of the green development level in the Chengdu-Chongqing City Group.
Figure 3.
Systematic analysis of SD model of the green development level in the Chengdu-Chongqing City Group.

Figure 4.
Analytical framework of SD model of the green development level in the Chengdu-Chongqing City Group.
Figure 4.
Analytical framework of SD model of the green development level in the Chengdu-Chongqing City Group.

Figure 5.
The causal loop of the SD model of green development level in the Chengdu-Chongqing City Group.
Figure 5.
The causal loop of the SD model of green development level in the Chengdu-Chongqing City Group.

Figure 6.
System flow chart of SD model of the green development level in the Chengdu-Chongqing City Group.
Figure 6.
System flow chart of SD model of the green development level in the Chengdu-Chongqing City Group.

Figure 7.
The green development level and the guideline level of each city in the future under 5 SSPs paths: (a) SSP1, (b) SSP2, (c) SSP3, (d) SSP4, (e) SSP5.
Figure 7.
The green development level and the guideline level of each city in the future under 5 SSPs paths: (a) SSP1, (b) SSP2, (c) SSP3, (d) SSP4, (e) SSP5.


Figure 8.
The overall green development level and criteria level of the Chengdu-Chongqing City Group based on SSP paths.
Figure 8.
The overall green development level and criteria level of the Chengdu-Chongqing City Group based on SSP paths.

Table 1.
Hypothetical scenarios of model parameters under the shared social economy path.
| Path | Increase Rate of Total Energy Consumption | Increase Rate of Cultivated Land | Increase Rate of Public Green Space | Increase Rate of Total Water Supply |
|---|---|---|---|---|
| SSP 1 | Low | High | High | Low |
| SSP 2 | Medium | Medium | Medium | Medium |
| SSP 3 | High | Low | Low | High |
| SSP 4 | Medium-high | Medium | Medium | Medium-high |
| SSP 5 | High | Low | High | High |
Table 2.
Evaluation indicator system of green development level of the Chengdu-Chongqing City Group.
Table 2.
Evaluation indicator system of green development level of the Chengdu-Chongqing City Group.
| Target Layer | Guideline Layer | Indicator Layer | Unit | Attribute | w1 | w2 |
|---|---|---|---|---|---|---|
| Green Development Level | Socio-economic level | Real GDP per capita | Yuan | + | 0.0949 | 0.2273 |
| Growth rate of regional GDP | % | + | 0.0301 | 0.0721 | ||
| Value added of the secondary industry as a proportion of GDP | % | - | 0.0551 | 0.1321 | ||
| Value added of tertiary industry as a proportion of GDP | % | + | 0.0594 | 0.1423 | ||
| Total imports and exports | Billions of dollars | + | 0.1307 | 0.3131 | ||
| Per capita disposable income ratio of urban and rural households | / | − | 0.0162 | 0.0389 | ||
| Engel’s coefficient of consumption of urban residents | % | − | 0.0310 | 0.0742 | ||
| Resource environment level | Arable land area at the end of the year | hm2 | + | 0.0504 | 0.1952 | |
| Forest coverage rate | % | + | 0.0451 | 0.1747 | ||
| Total annual water supply | Million tons | − | 0.0248 | 0.0963 | ||
| Decrease in water consumption of CNY 10,000 GDP | % | + | 0.0322 | 0.1250 | ||
| Decrease in energy consumption per CNY 10,000 GDP | % | + | 0.0224 | 0.0866 | ||
| Emission of wastewater per unit of industrial value added | Tons/million yuan | − | 0.0291 | 0.1127 | ||
| Industrial solid waste utilization rate | % | + | 0.0541 | 0.2094 | ||
| Quality-of life level | Public green space per capita | m2 | + | 0.0592 | 0.1823 | |
| Ratio of good air quality days | % | + | 0.0329 | 0.1015 | ||
| Number of medical beds per 10,000 people | + | 0.1258 | 0.3875 | |||
| Road area per capita | m2 | + | 0.0576 | 0.1775 | ||
| Sewage treatment rate | % | + | 0.0491 | 0.1512 |
w1: weight of the indicator layer relative to the target layer; w2: weight of the indicator layer relative to the guideline layer.
Table 3.
SD model variables of the green development level in the Chengdu-Chongqing City Group.
| Serial Number | Variable Name | Type | Serial Number | Variable Name | Type |
|---|---|---|---|---|---|
| 1 | Total population | L | 25 | Total industrial wastewater discharge | A |
| 2 | Population increase | R | 26 | Industrial value added | A |
| 3 | Population growth rate | C | 27 | Wastewater discharge per unit of industrial value added | A |
| 4 | Total GDP | L | 28 | Public green space area | L |
| 5 | GDP growth | R | 29 | Increase in public green space area | R |
| 6 | GDP growth rate | C | 30 | Increase rate of public green space | C |
| 7 | GDP per capita | A | 31 | Public green space per capita | A |
| 8 | Total Import and Export | A | 32 | Arable land area | L |
| 9 | Per capita disposable income of urban residents | A | 33 | Increase in arable land area | R |
| 10 | Per capita disposable income of rural residents | A | 34 | Rate of increase in arable land area | C |
| 11 | Per capita disposable income ratio of urban and rural households | A | 35 | Arable land area per capita | A |
| 12 | Urban residents’ household consumption expenditure | A | 36 | Number of medical beds | A |
| 13 | Urban residents’ food expenditure | A | 37 | Number of medical beds per 10,000 people | A |
| 14 | Engel coefficient of urban residents’ consumption | A | 38 | Road area at the end of the year | A |
| 15 | Output value of primary industry | A | 39 | Road area per capita | A |
| 16 | Output value of secondary industry | A | 40 | Industrial solid waste utilization rate | A |
| 17 | Output value of tertiary industry | A | 41 | Forest coverage rate | A |
| 18 | Secondary industry output value as a proportion of GDP | A | 42 | Ratio of good air quality days | A |
| 19 | The proportion of the output value of the tertiary industry to GDP | A | 43 | Sewage treatment rate | A |
| 20 | Total energy consumption | L | 44 | Total water supply | L |
| 21 | Increase in total energy consumption | R | 45 | Increase in total water supply | R |
| 22 | Rate of increase in total energy consumption | C | 46 | Rate of increase in total water supply | C |
| 23 | Energy consumption of CNY 10,000 GDP | A | 47 | Water consumption of CNY 10,000 GDP | A |
| 24 | Reduction in energy consumption of CNY 10,000 GDP | A | 48 | Decrease in water consumption of CNY 10,000 GDP | A |
L: state variables; R: rate variables; A: auxiliary variables; C: constants.
Table 4.
Model equations for explicit mathematical relationships.
| Subsystems | Variables | Variable Equation |
|---|---|---|
| Social Subsystems | Total population | INTEG (annual population growth, initial population) |
| Population increase | Total population × Population growth rate | |
| Number of medical beds per 10,000 people | Number of medical beds/Total population | |
| Road area per capita | Road area/Total population | |
| Per capita disposable income ratio of urban and rural households | Per capita disposable income of urban households/Per capita disposable income of rural households | |
| Economy Subsystems | Total GDP | INTEG (amount of GDP growth, initial GDP) |
| GDP Growth | Total GDP × GDP growth rate | |
| GDP per capita | Total GDP/Total population | |
| Engel coefficient of urban residents’ consumption | Urban residents’ food expenditure/urban residents’ household consumption expenditure | |
| GDP share of output value of secondary industry | Output value of secondary industry/Total GDP | |
| The proportion of the output value of the tertiary industry to GDP | Output value of tertiary industry/Total GDP | |
| Output value of primary industry | Total GDP—Output value of secondary industry—Output value of tertiary industry | |
| Resources Subsystems | Total energy consumption | INTEG (total increase in energy consumption, total initial energy consumption) |
| Increase in total energy consumption | Total energy consumption × Total energy consumption increase rate | |
| Arable land area | INTEG (increase in arable land area, initial arable land area) | |
| Increase in arable land area | Arable land area × Arable land area growth rate | |
| Arable land area per capita | Arable land area/Total population | |
| Energy consumption of CNY 10,000 GDP | Total energy consumption/Total GDP | |
| Total water supply | INTEG (increase in total water supply, initial total water supply) | |
| Increase in total water supply | Total water supply × Total water supply growth rate | |
| Water consumption of CNY 10,000 GDP | Total water supply/Total GDP | |
| Environment Subsystems | Wastewater emissions per unit of industrial value added | Total industrial wastewater discharge/Industrial value added |
| Public green space area | INTEG (increase in public green space area, initial public green space area) | |
| Increase in public green space area | Public green space area × Public green space area growth rate | |
| Public green space per capita | Public green space area/Total population |
Table 5.
Chengdu and Chongqing rate variable time-continuous functions.
| City | Rate Variables | Time-Continuous Function |
|---|---|---|
| Chengdu | Population growth rate | |
| GDP growth rate | ||
| Rate of increase in total energy consumption | ||
| Rate of increase in arable land area | ||
| Growth rate of public green space | ||
| Rate of increase in total water supply | ||
| Chongqing | Population growth rate | |
| GDP growth rate | ||
| Rate of increase in total energy consumption | ||
| Rate of increase in arable land area | ||
| Growth rate of public green space | ||
| Rate of increase in total water supply |
Publisher’s Note: MDPI stays neutral with regard to jurisdictional claims in published maps and institutional affiliations. |
© 2022 by the authors. Licensee MDPI, Basel, Switzerland. This article is an open access article distributed under the terms and conditions of the Creative Commons Attribution (CC BY) license (https://creativecommons.org/licenses/by/4.0/).
Share and Cite
MDPI and ACS Style
Liang, Y.; Zhang, L.; Leng, M.; Xiao, Y.; Xia, J. System Simulation and Prediction of the Green Development Level of the Chengdu-Chongqing City Group. Water 2022, 14, 3947. https://doi.org/10.3390/w14233947
AMA Style
Liang Y, Zhang L, Leng M, Xiao Y, Xia J. System Simulation and Prediction of the Green Development Level of the Chengdu-Chongqing City Group. Water. 2022; 14(23):3947. https://doi.org/10.3390/w14233947
Chicago/Turabian StyleLiang, Yuxin, Liping Zhang, Mengsi Leng, Yi Xiao, and Jun Xia. 2022. "System Simulation and Prediction of the Green Development Level of the Chengdu-Chongqing City Group" Water 14, no. 23: 3947. https://doi.org/10.3390/w14233947
Note that from the first issue of 2016, this journal uses article numbers instead of page numbers. See further details here.