
Comprehensive Evaluation Model for Urban Water Security: A Case Study in Dongguan, China
by
Jianye Cao
1,
Zhicheng Yan
1,*,
Jinquan Wan
1,2,
Yan Wang
1,2,
Gang Ye
1,
Yingping Long
1 and
Quanmo Xie
3 1
School of Environment and Energy, South China University of Technology, Guangzhou 510006, China
2
Guangdong Plant Fiber High-Valued Cleaning Utilization Engineering Technology Research Center, Guangzhou 510640, China
3
Guangdong Yiding Environmental Protection Engineering Co., Ltd., Dongguan 523000, China
*
Author to whom correspondence should be addressed.
Water 2022, 14(23), 3957; https://doi.org/10.3390/w14233957
Submission received: 26 October 2022
/
Revised: 28 November 2022
/
Accepted: 2 December 2022
/
Published: 5 December 2022
(This article belongs to the Section Water Resources Management, Policy and Governance)
Abstract
:Water security plays a critical role in the development and stability of a region. Constructing an objective and reasonable evaluation indicator system is beneficial to quantitatively evaluating the regional water security status and improving water resource management. In this paper, an urban water security indicator system was established based on the Driving–Pressure–State–Impact–Response (DPSIR) framework with Dongguan City as a case study. By introducing the projection pursuit (PP) algorithm, a DPSIR–PP model was developed to quantitatively evaluate urban water security. The evaluation results show that Dongguan City’s water security index had an overall upward trend during the 13th Five-Year Plan period, with the evaluation grade rising from IV to III. The indicators with the top five weights are: river water quality condition, ecological index, the leakage rate of water supply network, the value added by industry, and the Dongjiang water resources development and utilization rate. The evaluation results are essentially in line with the reality of Dongguan City. On this basis, the internal links of water security and future trends were further analyzed. Through the evaluation results and policy analysis, it is shown that the water security-related measures implemented during the 13th Five-Year Plan period have been effective. Overall, the methodology proposed in this study is beneficial for gaining an in-depth understanding of urban water security impact factors and provides some theoretical basis and reference for future water resources management.
1. Introduction
With water as a core component of global life support systems [1], water security is critical to the development and stability of a region [2]. Water is one of the most important security issues in the world, and water security is necessary for social and economic development [3]. Relevant studies [4] have shown that nearly 80% of the world’s population is facing threats to their water security. Water security has become more complex under the combined influences of human activities and natural factors. In addition to water scarcity, water security issues include, for example, deteriorating water quality, low water utilization, climate change, ecological damage, and inadequate sewage treatment rates [5,6,7]. While abundant water resources are conducive to socio-economic development and population growth, rapid urbanization can also lead to an increased risk of water environment degradation. In areas where water resources are scarce, water security can become a constraint to urban development if appropriate management measures are not taken [8,9]. Especially in China, rapid urbanization and industrialization pose a great threat to urban water security [10]. Enhancing water security also became a major undertaking during the Chinese 13th (2016–2020) and 14th (2021–2025) Five-Year Plans [11]. Therefore, an accurate and effective evaluation of urban water security and the analysis of its influencing factors are of great importance for water resources management and policymaking.
In view of the importance of water security, discussions and studies addressing water security have been focused on by numerous scholars and policy makers. Since the concept of water security was introduced, researchers have studied different aspects of water security. For example, Su et al. considered water resources, water environment, and water disasters as the three pillars of urban water security [12]. Han et al. explored the impact of climate change and socio-economic development on water security in the context of the water–energy–food nexus [13]. Liu and Yang analyzed the need for water management in China to be designed, implemented, and evaluated from the perspective of water sustainability in conjunction with policies on other issues across various sectors [14]. Du et al. evaluated water resources security in terms of water resource quantity, water resources pressure, and water use efficiency [15]. Although there is no single definition of water security, there are some widely cited definitions by relevant agencies, as shown in Table 1. As previous studies have shown, water security is a broad concept that can be approached from different perspectives. Reviewing previous studies, there are many that focus on the macro-scale [10,16,17], such as national, provincial, and basin, but often tend to ignore the actual local water conditions. In this paper, we focus on the urban dimension of water security. Urban water security is equally complex and variable, and the quantitative measures of urban water security are more valuable and meaningful [18]. The quantification makes the concept more concrete, facilitates evaluation and tracking, and provides valid information for decision making [19]. Therefore, it is necessary to establish a framework suitable for quantitative studies to comprehensively evaluate urban water security.
Water security usually refers to the quantity and quality of water resources needed for the survival and development of a country or region [24]. The evaluation of water security cannot, of course, be separated from the evaluation methods of water quantity and quality, such as the Nemerow pollution index method, water quality index methods, fuzzy evaluation methods, and principal component analysis [25,26,27,28,29]. Moreover, the evaluation of only water quantity or quality ignores the effects of social and economic development, human activities, and environmental protection measures on water security; without evaluations of such topics, urban water security cannot be comprehensively evaluated [5,30]. Related studies have also found that ecological security cannot be revealed by simply analyzing the indicators of a particular aspect [31]. Urban water security is a result of a combination of natural, social, and economic factors [32]. Therefore, The Driving–Pressure–State–Impact–Response (DPSIR) based model is introduced in order to construct an urban water security system in this paper. The DPSIR model was first proposed by the Organisation for Economic Co-operation and Development in 1993 on the basis of the PSR (Pressures–States–Responses) and the DSR (Driving–States–Responses) models, and was later adopted and improved upon by the European Environment Agency [33]. The DPSIR model and its extensions are widely applied in various fields and effectively describe socio-economic and environmental causality [34,35]. Hu et al. developed an urban adaptive capacity evaluation index system based on the DPSIR model and analyzed the level of adaptive capacity in Changsha City, Hunan Province [36]. Cao et al. proposed an evaluation model based on the DPSIR-improved matter-element extension cloud model to quantitatively evaluate ecological performance and make recommendations for carbon neutrality [37]. Mosaffaie et al. analyzed the main environmental issues affecting the health of the Gorganroud watershed through the DPSIR framework, which, despite limited data, provided a robust framework to elucidate causal relationships [17]. Establishing an indicator system for water security based on the city level provides a tool for water security policymaking and management. Therefore, in this paper, urban water security elements, such as pressure on water security from industry, agriculture, residential life, and local water quality indicators, are introduced into the DPSIR framework to reconstruct the urban water security indicator system.
Determining the indicator weights is the second key to the evaluation. The methods commonly used to determine the indicator weights are the expert consultation method, analytic hierarchy process (AHP), analytic network process (ANP), DEMATEL method, entropy weight method, and combined weighting method [17,38,39,40,41,42]. The subjective weighting method is able to use the knowledge and experience of experts to make judgments and does not rely on large amounts of data to make decisions [43]. With the complexity and variability of water resources conditions and rapid urban development, the dimensions of urban water security have become more varied. The objective weighting method can avoid the bias of subjective judgment due to its multidimensionality and the difficulty of determining weights due to multiple variables. In objective weighting, the entropy method determines weights based on the degree of information dispersion [44]. However, in some cases, the entropy method may not take full advantage of the data, focusing only on the more variable data [45,46]. Therefore, an algorithm suitable for analyzing high-dimensional data is introduced in this paper. The projection pursuit (PP) model is a data-driven data analysis method. The statistical method is used to establish the evaluation model, which eliminates the need to artificially set indicator weights and makes the evaluation results more objective [47]. The introduction of the PP model can provide a reliable method for the indicator system by mining the high-dimensional data structure and avoiding subjective bias.
In summary, the aims of this paper are (1) to introduce the DPSIR model to establish a comprehensive indicator system for water security at the city level and to identify the key elements of urban water security; (2) to establish the DPSIR–PP model for the quantitative evaluation of the urban water security index (WSI); (3) to analyze the internal links through an improved decoupling model and to forecast the development trend through a gray prediction model; and (4) to evaluate and analyze the water security situation and policy factors in Dongguan City during the 13th Five-Year Plan period.
2. Materials and Methods
2.1. Study Area
Dongguan (113°31′–114°15′ E, 22°39′–23°09′ N) is located in the south-central part of Guangdong Province, downstream of the East River in the Pearl River Delta (Figure 1). Dongguan is one of the central cities of the Pearl River Delta and the Guangdong–Hong Kong–Macao Greater Bay Area. Dongguan is an emerging city with a dense population and has undergone rapid urbanization. It is also known as the “world’s factory” [48,49]. The resident population of Dongguan City reached 10.48 million in 2020, with a population density of up to 4262 people per square kilometer. According to the results of the Seventh National Census, Dongguan City is the second most densely populated city in China (not including Hong Kong, Macao, and Taiwan). Its gross domestic product reached CNY 965.019 billion in 2020. Dongguan has a subtropical monsoon climate with an average annual temperature of about 22 °C and an average annual rainfall of 1693 mm. Dongguan is rich in water resources but per capita water resources are scarce. The rivers in Dongguan mainly belong to the Dongjiang River Basin. Of the city’s water supply, surface water sources account for 97.79%, groundwater sources account for 0.01%, and other water sources (such as sewage reuse, rainwater use, desalination, etc.) account for 2.20%. The water system map of Dongguan City is shown in Figure 1, which was obtained from the National Geomatics Center of China (www.ngcc.cn/ngcc/, accessed on 1 October 2022).
2.2. DPSIR Model
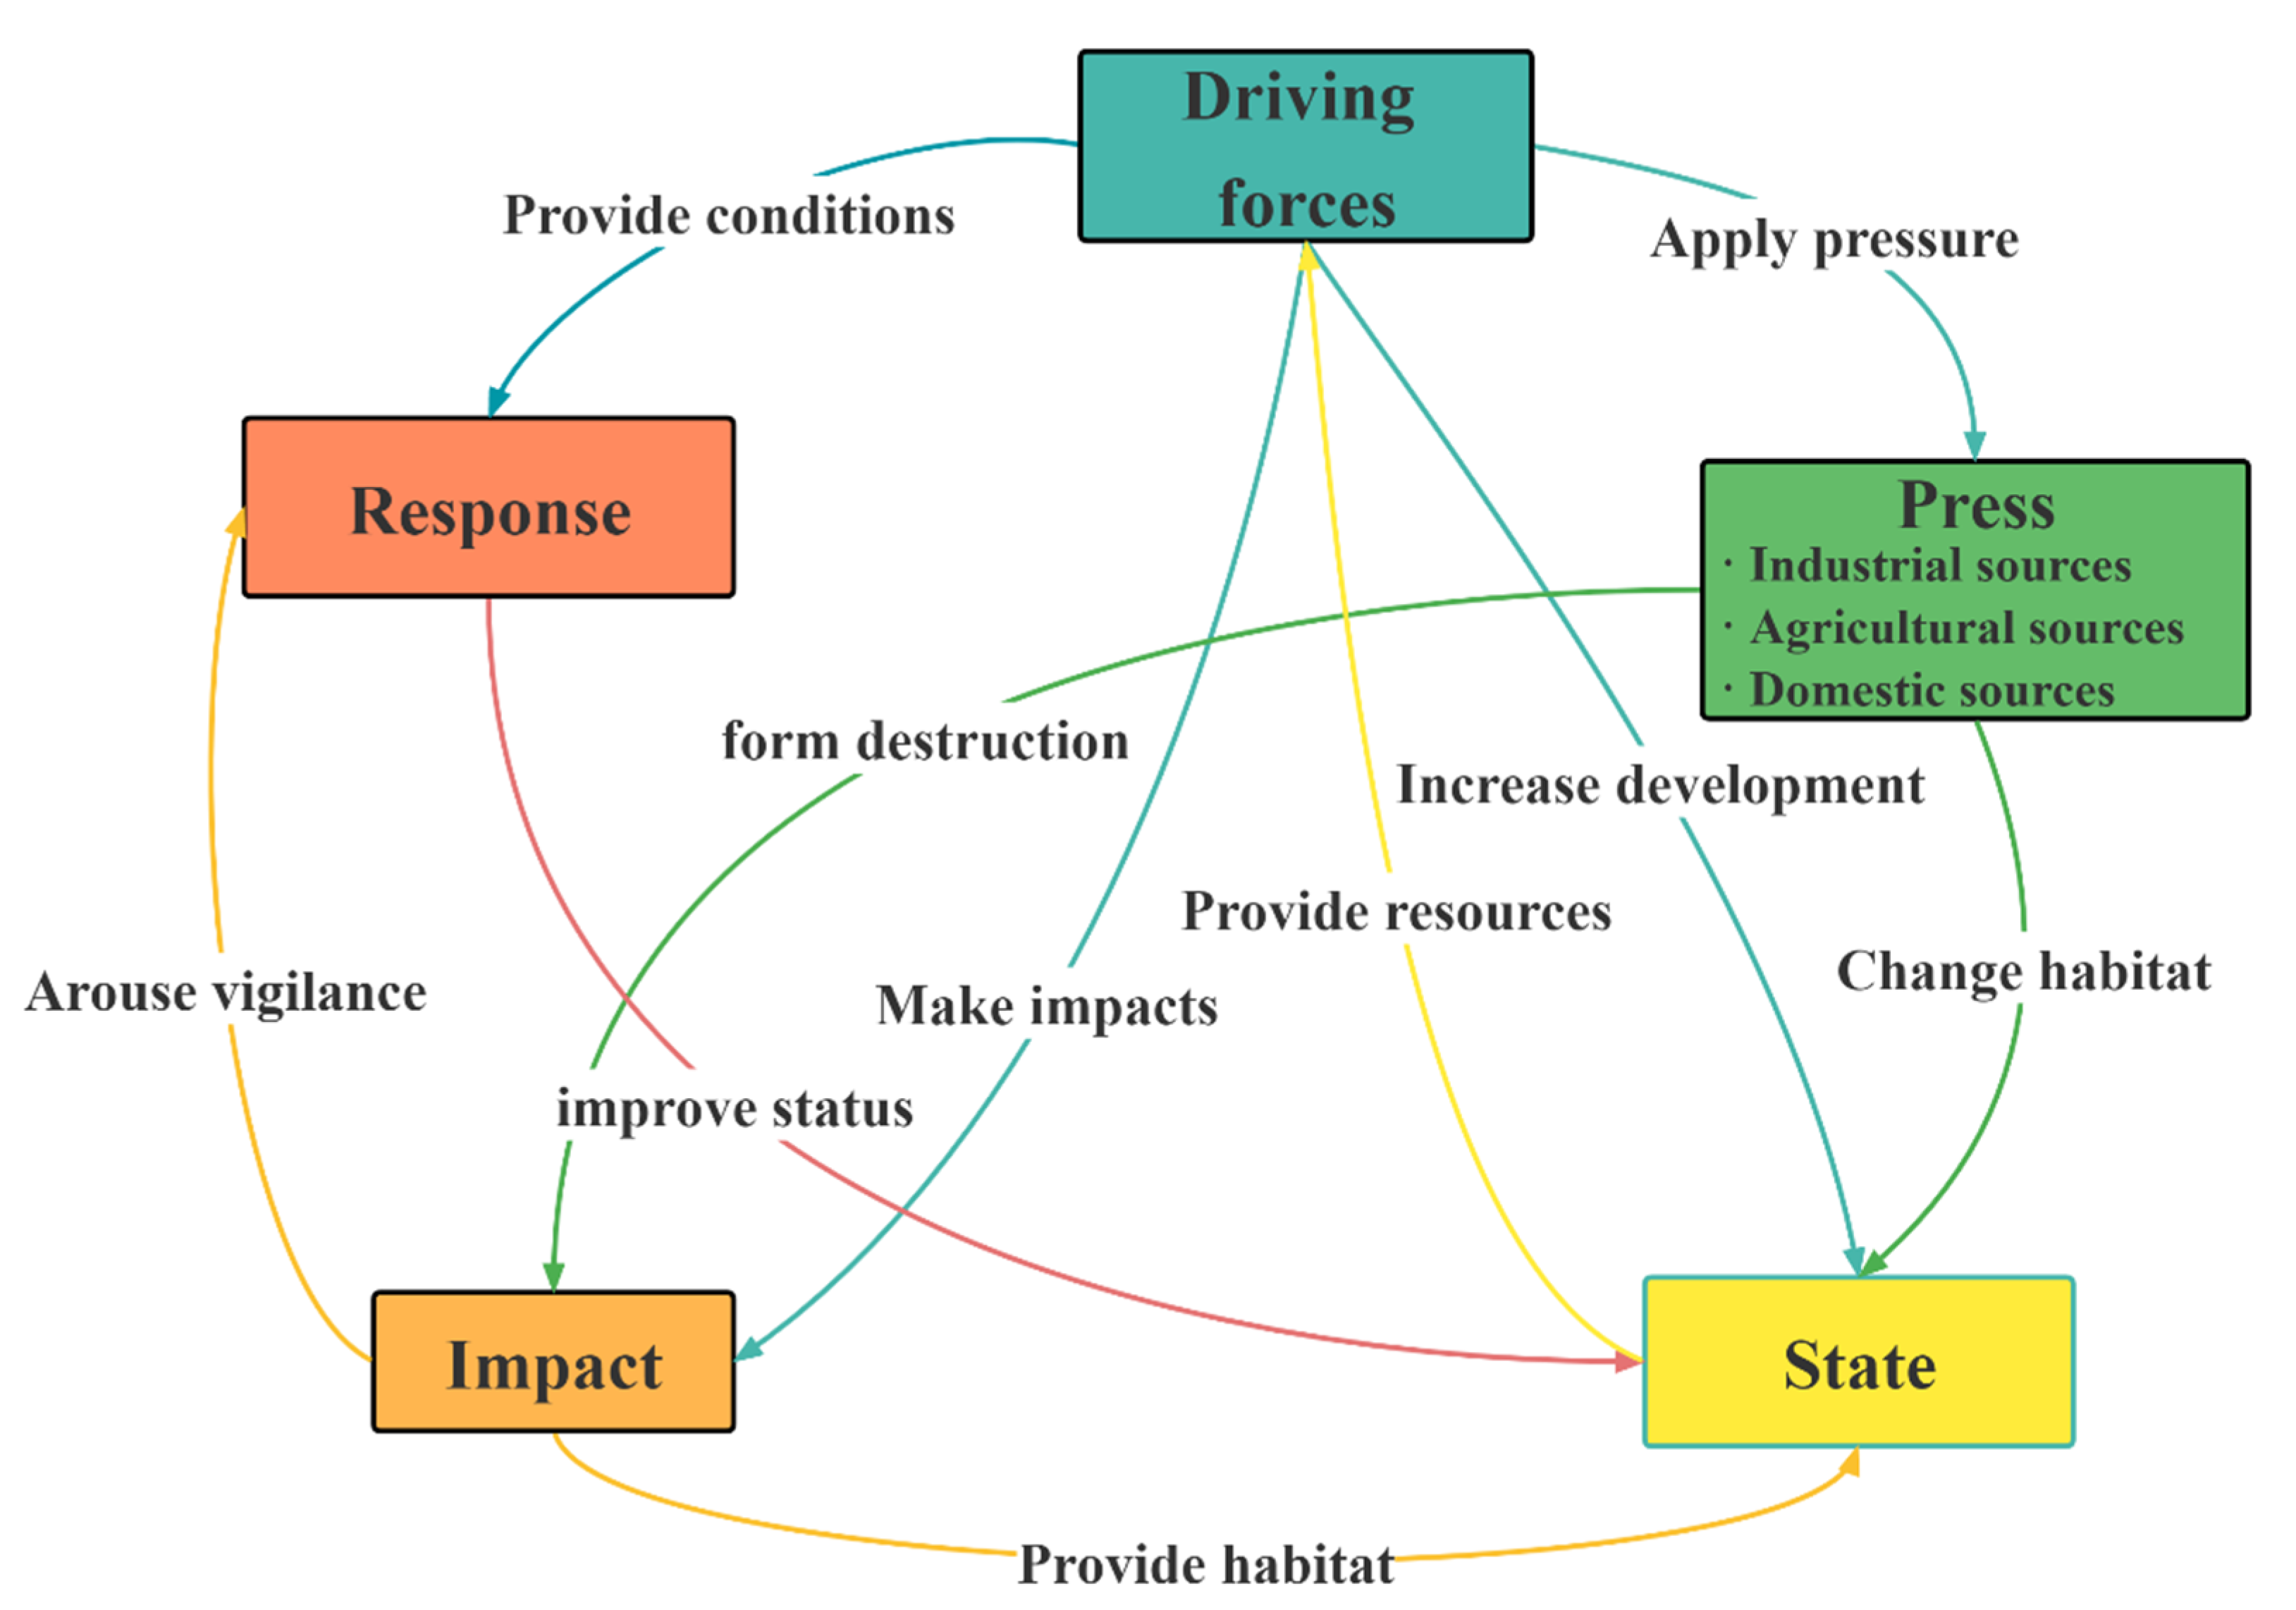
In the DPSIR model, the driving force (D) is the social and economic development status of the region. Pressure (P) refers to the consumption of regional water resources by human activities and the pollution of the water environment. In this case, this includes industrial, agricultural, and domestic sources. State (S) is the amount and state of regional water resources. Impact (I) refers to the interaction between ecosystems and socio-economics. Response (R) refers to the effective measures taken by management in response to water security as well as countermeasures. The interrelationships [50] are shown in Figure 2.
2.2.1. Indicator Selection
Considering the availability of data and after conducting a literature review, 23 representative indicators were selected to construct the water security evaluation system of Dongguan City. Indicators were divided into two categories: (1) positive indicators (+), where the value of the indicator is positively correlated with the evaluation result, i.e., the larger the value of the indicator, the better; (2) negative indicators (−), where the value of the indicator is negatively correlated with the evaluation result, i.e., the smaller the value of the indicator, the better. The indicator system is shown in Table 2.
2.2.2. Data Source
The indicators selected in this paper are taken from the Dongguan Statistical Yearbook, the Dongguan Water Resources Bulletin, Report on the State of Dongguan’s Ecological Environment, and the Guangdong Water Resources Bulletin. The ecological index (I4) is derived from the Report on the State of Dongguan’s Ecological Environment and calculated in accordance with the Technical Criterion Ecosystem Status Evaluation (HJ/T 192-2015), which mainly reflects the ecological environment status such as biodiversity and vegetation quantity. Dongguan water resources mainly come from rivers and reservoirs, so the water quality evaluation takes the water quality condition of rivers and reservoirs as indicators. The data for river water quality condition (S3) and reservoir water quality condition (S4) were obtained from the annual statistics of the routine testing by the Dongguan Water Affairs Bureau, listed in Tables S1 and S2. The time frame of the study is the 13th Five-Year Plan period (from 2016 to 2020).
The indicator S3 used the annual average water quality statistics of six major river cross-sections in Dongguan City from 2016 to 2020 (See Table S1). Dissolved oxygen (DO), permanganate index (CODMn), chemical oxygen demand (CODCr), five-day biochemical oxygen demand (BOD5), ammonia nitrogen (NH3-N), and total phosphorus (TP) were selected for water quality evaluation. The indicator was calculated using the comprehensive pollution index (CPI) method. The CPI is calculated by the following equations [51,52,53]:
where n is the number of water quality indicators and Pi is a single factor pollution index; the larger the value—the higher the degree of pollution.
where Ci is the monitoring value of the index, Si is the limit value in the corresponding standard; this paper adopts the standard of Class III water in the Environmental quality standard for surface water (GB 3838-2002) in China as the reference value.
The indicator S4 used the annual average water quality statistics of eight medium-sized reservoirs in Dongguan City from 2016 to 2020 (See Table S2). The indicator was calculated using the trophic level index (TLI) method. The TLI is calculated using the following equation [54,55]:
where TLI (∑) is the comprehensive trophic level index; Wj is the correlation weight of TLI for parameter j; and TLI (j) is the TLI for parameter j. The correlation weights were calculated according to the following equation:
where m is the number of parameters involved in the evaluation, the indicators involved in the evaluation are chlorophyll a (chl a), total phosphorus (TP), total nitrogen (TN), transparency (SD), and the permanganate index (CODMn) and rij is the correlation coefficient between chl a and the other parameters. The correlation coefficient rij and the formula for TLI (j) are derived from the Technical guidelines of prevention and treatment of eutrophication for important lake and reservoir water sources in the Guangdong–Hong Kong–Macao Greater Bay Area (T/CWEC 25-2021, T/CAQI 178-2021), as shown in Table S3. The results of the sensitivity analysis of the weights are shown in Figure S1.
2.3. Projection Pursuit Model
The projection pursuit (PP) model can be used to optimize the projection objective function to obtain the best projection vector reflecting the multidimensional data structure or features [57]. The basic principle is to find the projection direction that reflects the characteristics of the comprehensive index of the problem to be evaluated, make linear projections of multiple influencing factors, obtain the projected eigenvalues, and then establish the mapping relationship between the eigenvalues and the dependent variables; thus, transforming the multidimensional problem into a one-dimensional problem for research [58]. The specific calculation steps are as follows:
Step 1: The normalization of evaluation indicators.
Each indicator has a different outline quantity and range. In order to eliminate the effect of outline magnitude and range, the extreme value normalization method was used.
For positive indicators:
For negative indicators:
where Xij is the normalized value of the jth indicator of sample i; is the value of the jth indicator of sample i; and xjmin and xjmax are the minimum and maximum values of the jth indicator in the sample, respectively.
Step 2: Construct the projected eigenvalues.
The projection eigenvalues Zi are:
where m is the number of indicators; a = (a1, a2, …, am) is the projection vector; and aj is the projection coefficient of the jth indicator, also known as the weight of the indicator.
The key to determining the Zi is to find the optimal projection direction a that reflects the characteristic structure of the multidimensional data, so it is necessary to construct the projection indicator function Q(a).
Step 3: Construct the projection indicator function.
The projection indicator function Q(a) is as follows:
where S(a) is the inter-class scatter and D(a) is the inner-class scatter, calculated as follows:
where is the mean value of Zi; (i, k = 1~n); R is the window width of the density, the usual range of values is , and R = 0.1 S(a) is used in this paper [3,47,59]; and is the unit step function, which is calculated as follows:
Step 4: Optimize the projection indicator function.
The vector a is the optimal projection direction when Q(a) reaches its maximum value. Thus, the problem can be transformed as follows:
This is a complex nonlinear constrained optimization problem. In this paper, a genetic algorithm was used for the solution. The genetic algorithm (GA) is a method for solving global optimization problems and it can be suitable for avoiding the problem of falling into local optimal solutions [60]. The process of GA includes the following phases: I—initialization, II—evaluation, III—selection, IV—crossover, and V—mutation. First, the initial generation population is randomly generated, the individuals with better adaptation are selected by evaluation, and crossover and mutation are performed to generate the next generation. The operations II to V are repeated until the optimal individual objective function reaches a set value or the algorithm runs a predetermined number of times. Finally, the best individual in the population is used as the result of the solution.
By substituting the obtained optimal projection direction a into Formula (7), the projection eigenvalue Zi of each sample can be obtained. The sample can be analyzed by Zi and indicator weights, where a larger value of Zi indicates a better sample.
2.4. Gray Prediction Model
The gray system model utilizes uncertain systems as the research objects [61] and provides research methods for systems with “little data” and “poor information” [62]. It has been widely used in finance, economy, energy, environment, and other fields. GM (1,1) is one of the most commonly used gray prediction models able to help predict problems using less data [61,63]. In this study, the evaluation data from the 13th Five-Year Plan period can be used to predict future trends for the 14th Five-Year Plan. The calculation is as follows:
From the original sequence , the 1-order accumulation sequence, , can be obtained and a sequence of successive adjacent means, , can be generated.
After establishing the differential equation for the above sequence, the following can be obtained:
The data matrices B and Y can be constructed:
The coefficients can be solved by the least squares method:
Finally, the prediction sequence can be obtained by solving the differential equation:
After the construction of the GM (1,1) model, accuracy tests are required to deter-mine the degree of model fit. When the accuracy of the model is in the acceptable range, the model can be used to analyze the trend of the original series. The standards of the accuracy test [64] are shown in Table 3.
2.5. Decoupling Method
Decoupling is usually the degree of divergence between two variables. The Organisation for Economic Cooperation and Development first introduced the decoupling model to environmental economics to measure the relationship between economic growth and resource consumption or environmental pollution [65,66]. In this paper, the Tapio decoupling model [67] is used and improved to describe the interrelationships between the subsystems of the DPSIR model. The decoupling states were classified into eight categories according to the variables, as shown in Table S5.
where Equation (20) is used for the decoupling index of water security pressures and socio-economic drivers; Equation (21) is used for the decoupling index of water and ecological status and response measures; and D, P, S, I, and R are the projected eigenvalues of each subsystem obtained by the DPSIR–PP model.
3. Results
3.1. Indicator System
The WSI indicator system is divided into five categories based on the DPSIR framework. The data of specific indicators and grading standards are shown in Table S4. Four socio-economic indicators (D1~D4) were selected in the driver layer to reflect the driving forces and trends that drive the development and changes in water security. Changes in the socio-economic development indicators cause changes in the pressure layer. The indicators for industrial sources (P1, P2), agricultural sources (P3, P4), and domestic sources (P5, P6) were selected to reflect the pressure on water security. Under the influence of human social activities as well as natural factors, five indicators (S1~S5) were selected to characterize the state layer of the water environment. The impact layer is mainly utilized to select relevant indicators to reflect the ecological impact of the region, revealing the socio-economic impact on the ecological environment (I1~I3) and the feedback situation (I4). The response layer is the situation of measures taken in the face of social development pressure on water security and changes in the state of the water environment (R1~R4).
3.2. The Weights of Each Indicator and Subsystem
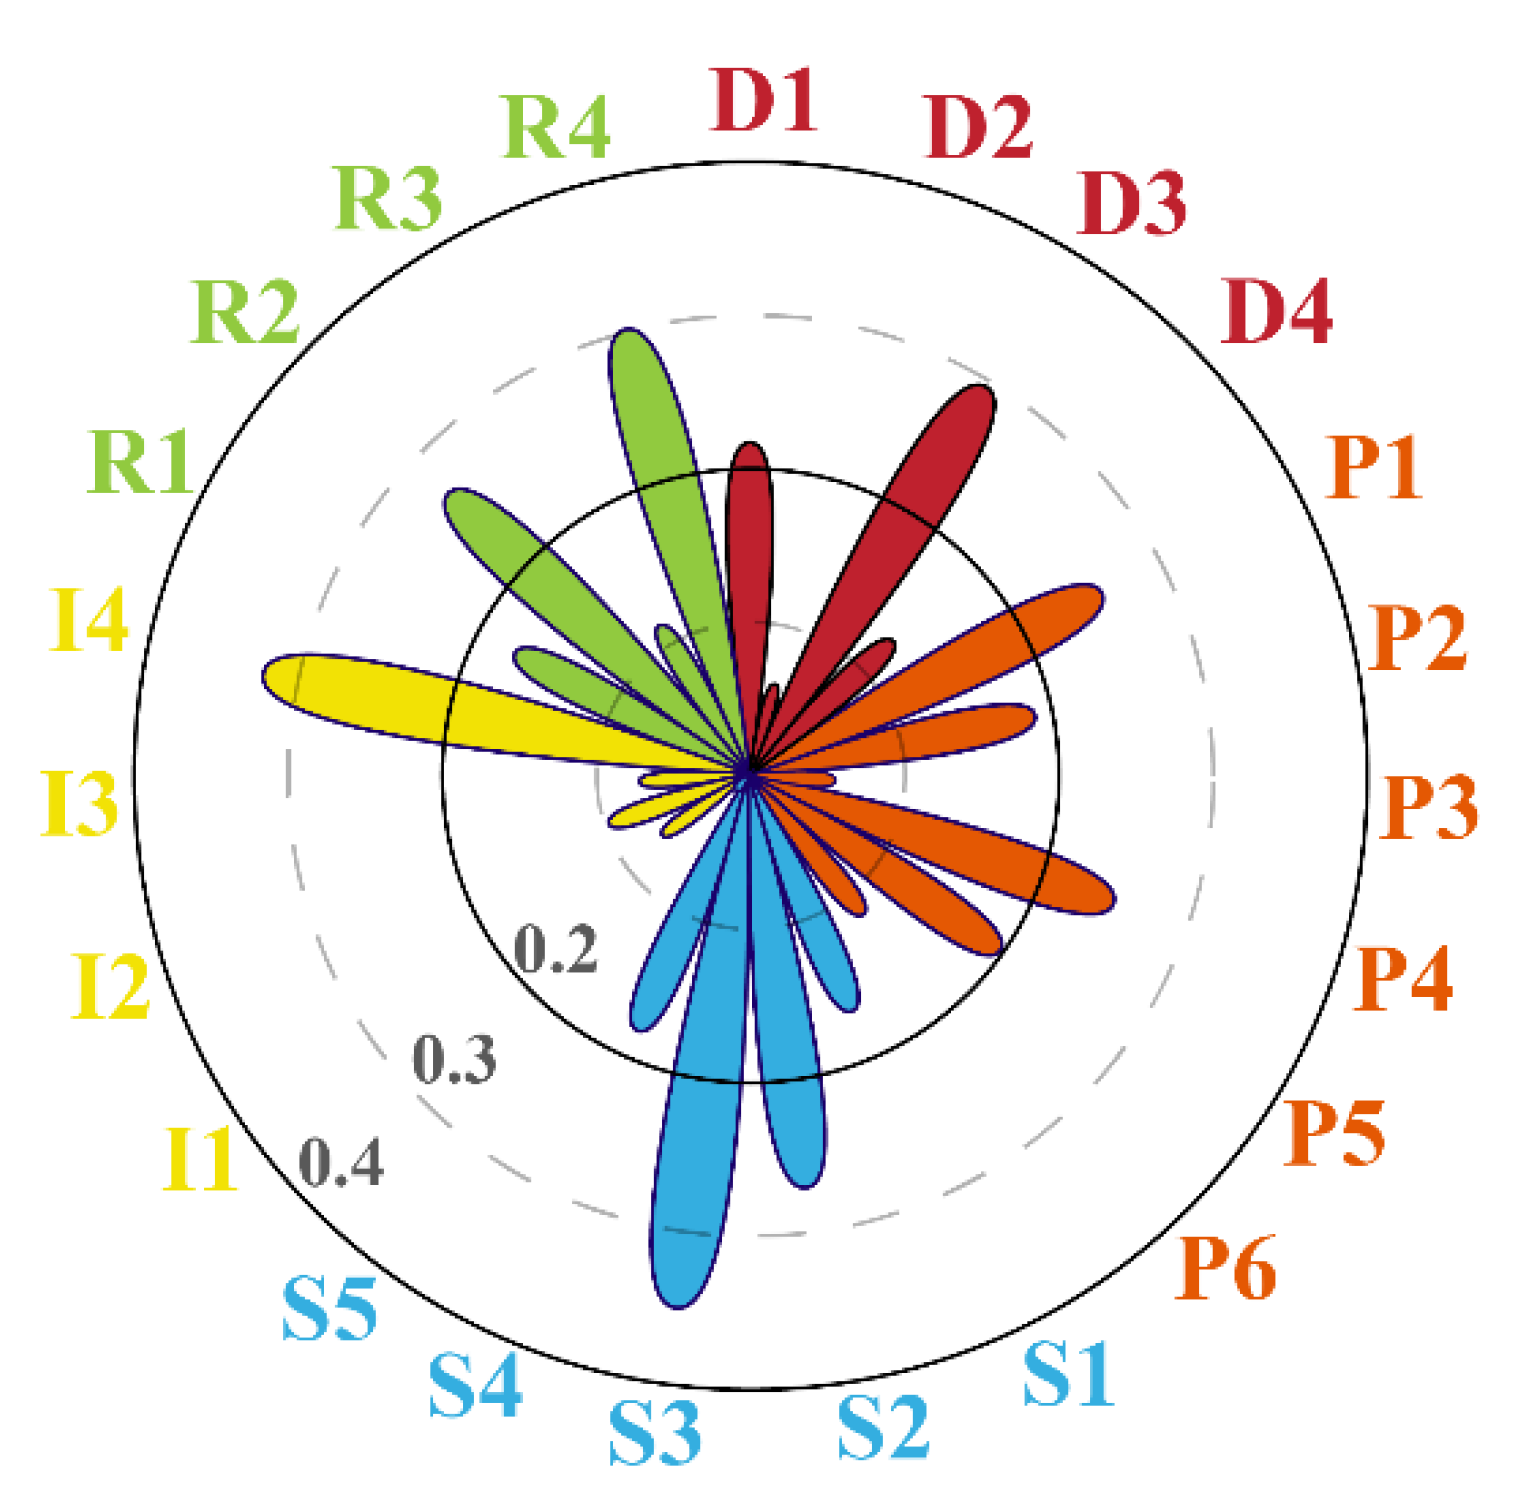
The normalized data were substituted into the formula of the projection pursuit model and optimized by the genetic algorithm. The optimal projection direction vector was obtained as: a = (0.2204, 0.0626, 0.3012, 0.1299, 0.2626, 0.1926, 0.0568, 0.2558, 0.2031, 0.1192, 0.1708, 0.2769, 0.3578, 0.1856, 0.0138, 0.0708, 0.0986, 0.0729, 0.3290, 0.1749, 0.2731, 0.1158, 0.3072).
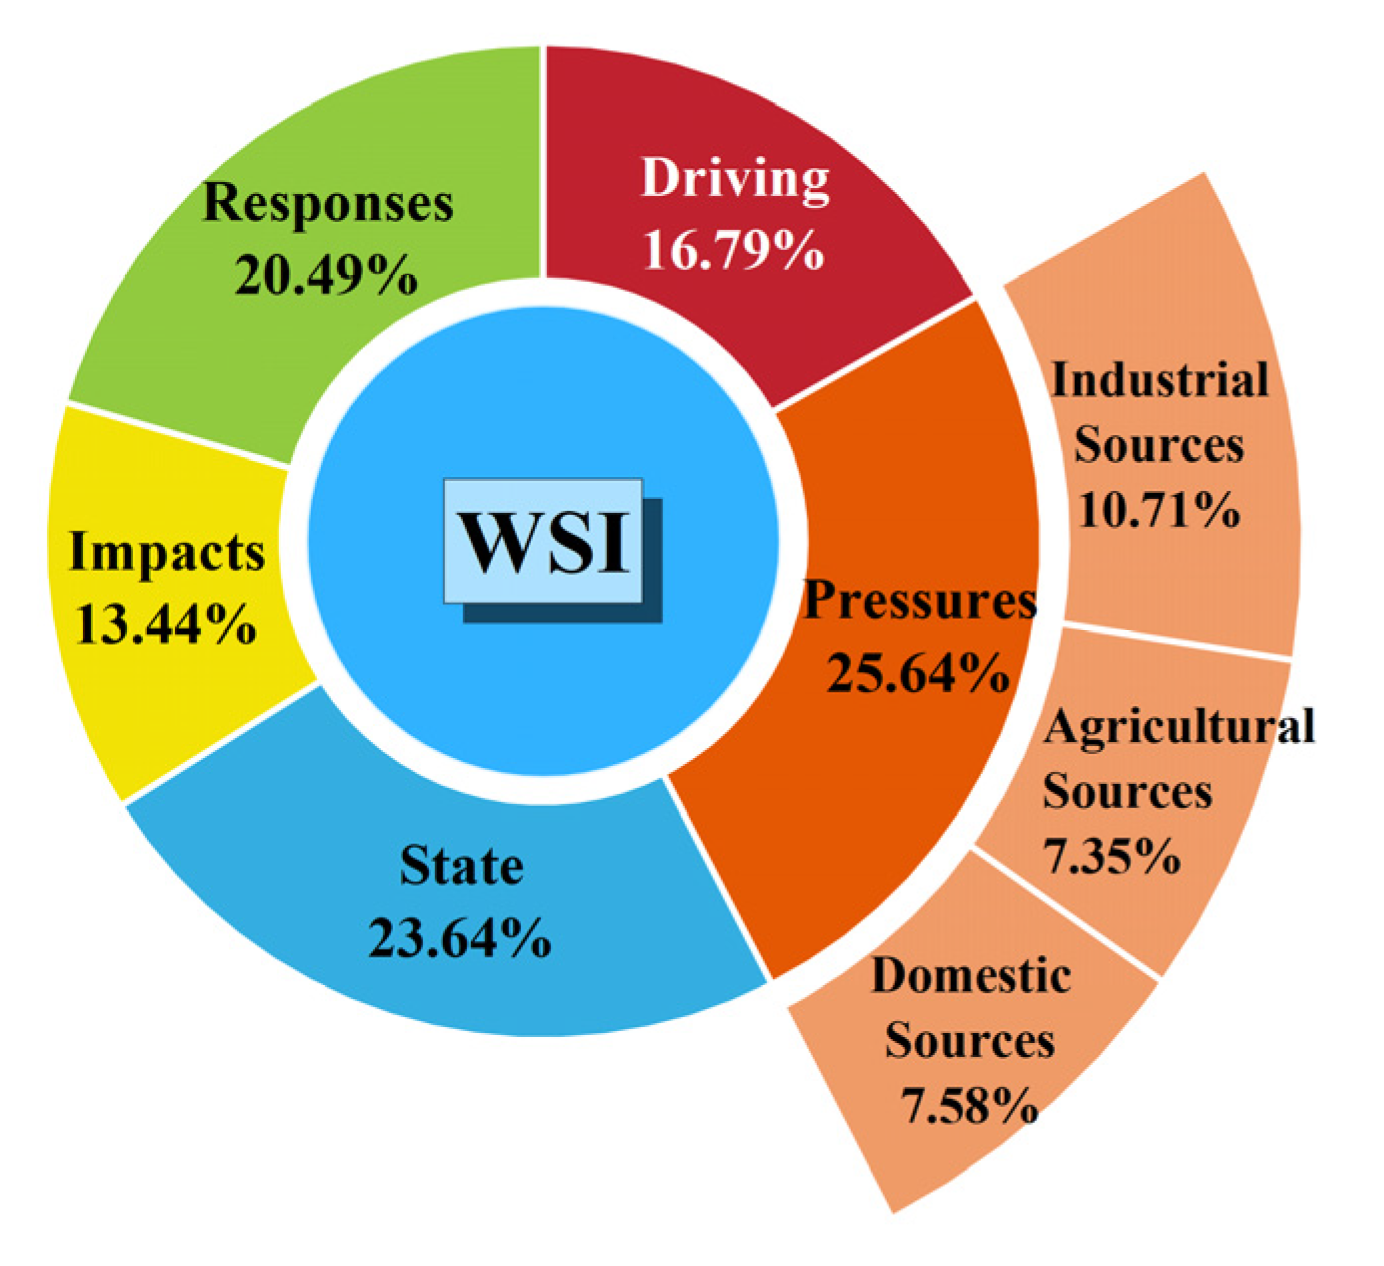
In the projection pursuit model, each component of the optimal projection direction vector represents the degree of influence of each indicator on the WSI. The larger value represents the greater influence weight of the indicator, as shown in Figure 3. The top five indicators affecting the WSI are: the river water quality condition (S3), ecological index (I4), leakage rate of water supply network (R4), value added by industry (D3), and the Dongjiang water resources development and utilization rate (S2). As shown in Figure 4, the weight proportions of the Driving, Pressure, State, Impact, and Response layers are: 16.79%, 25.64%, 23.64%, 13.44%, and 20.49%, respectively. The Pressure and State layers account for a high percentage, while industrial sources have the greatest impact on the Pressure layer.
3.3. WSI Comprehensive Evaluation Results
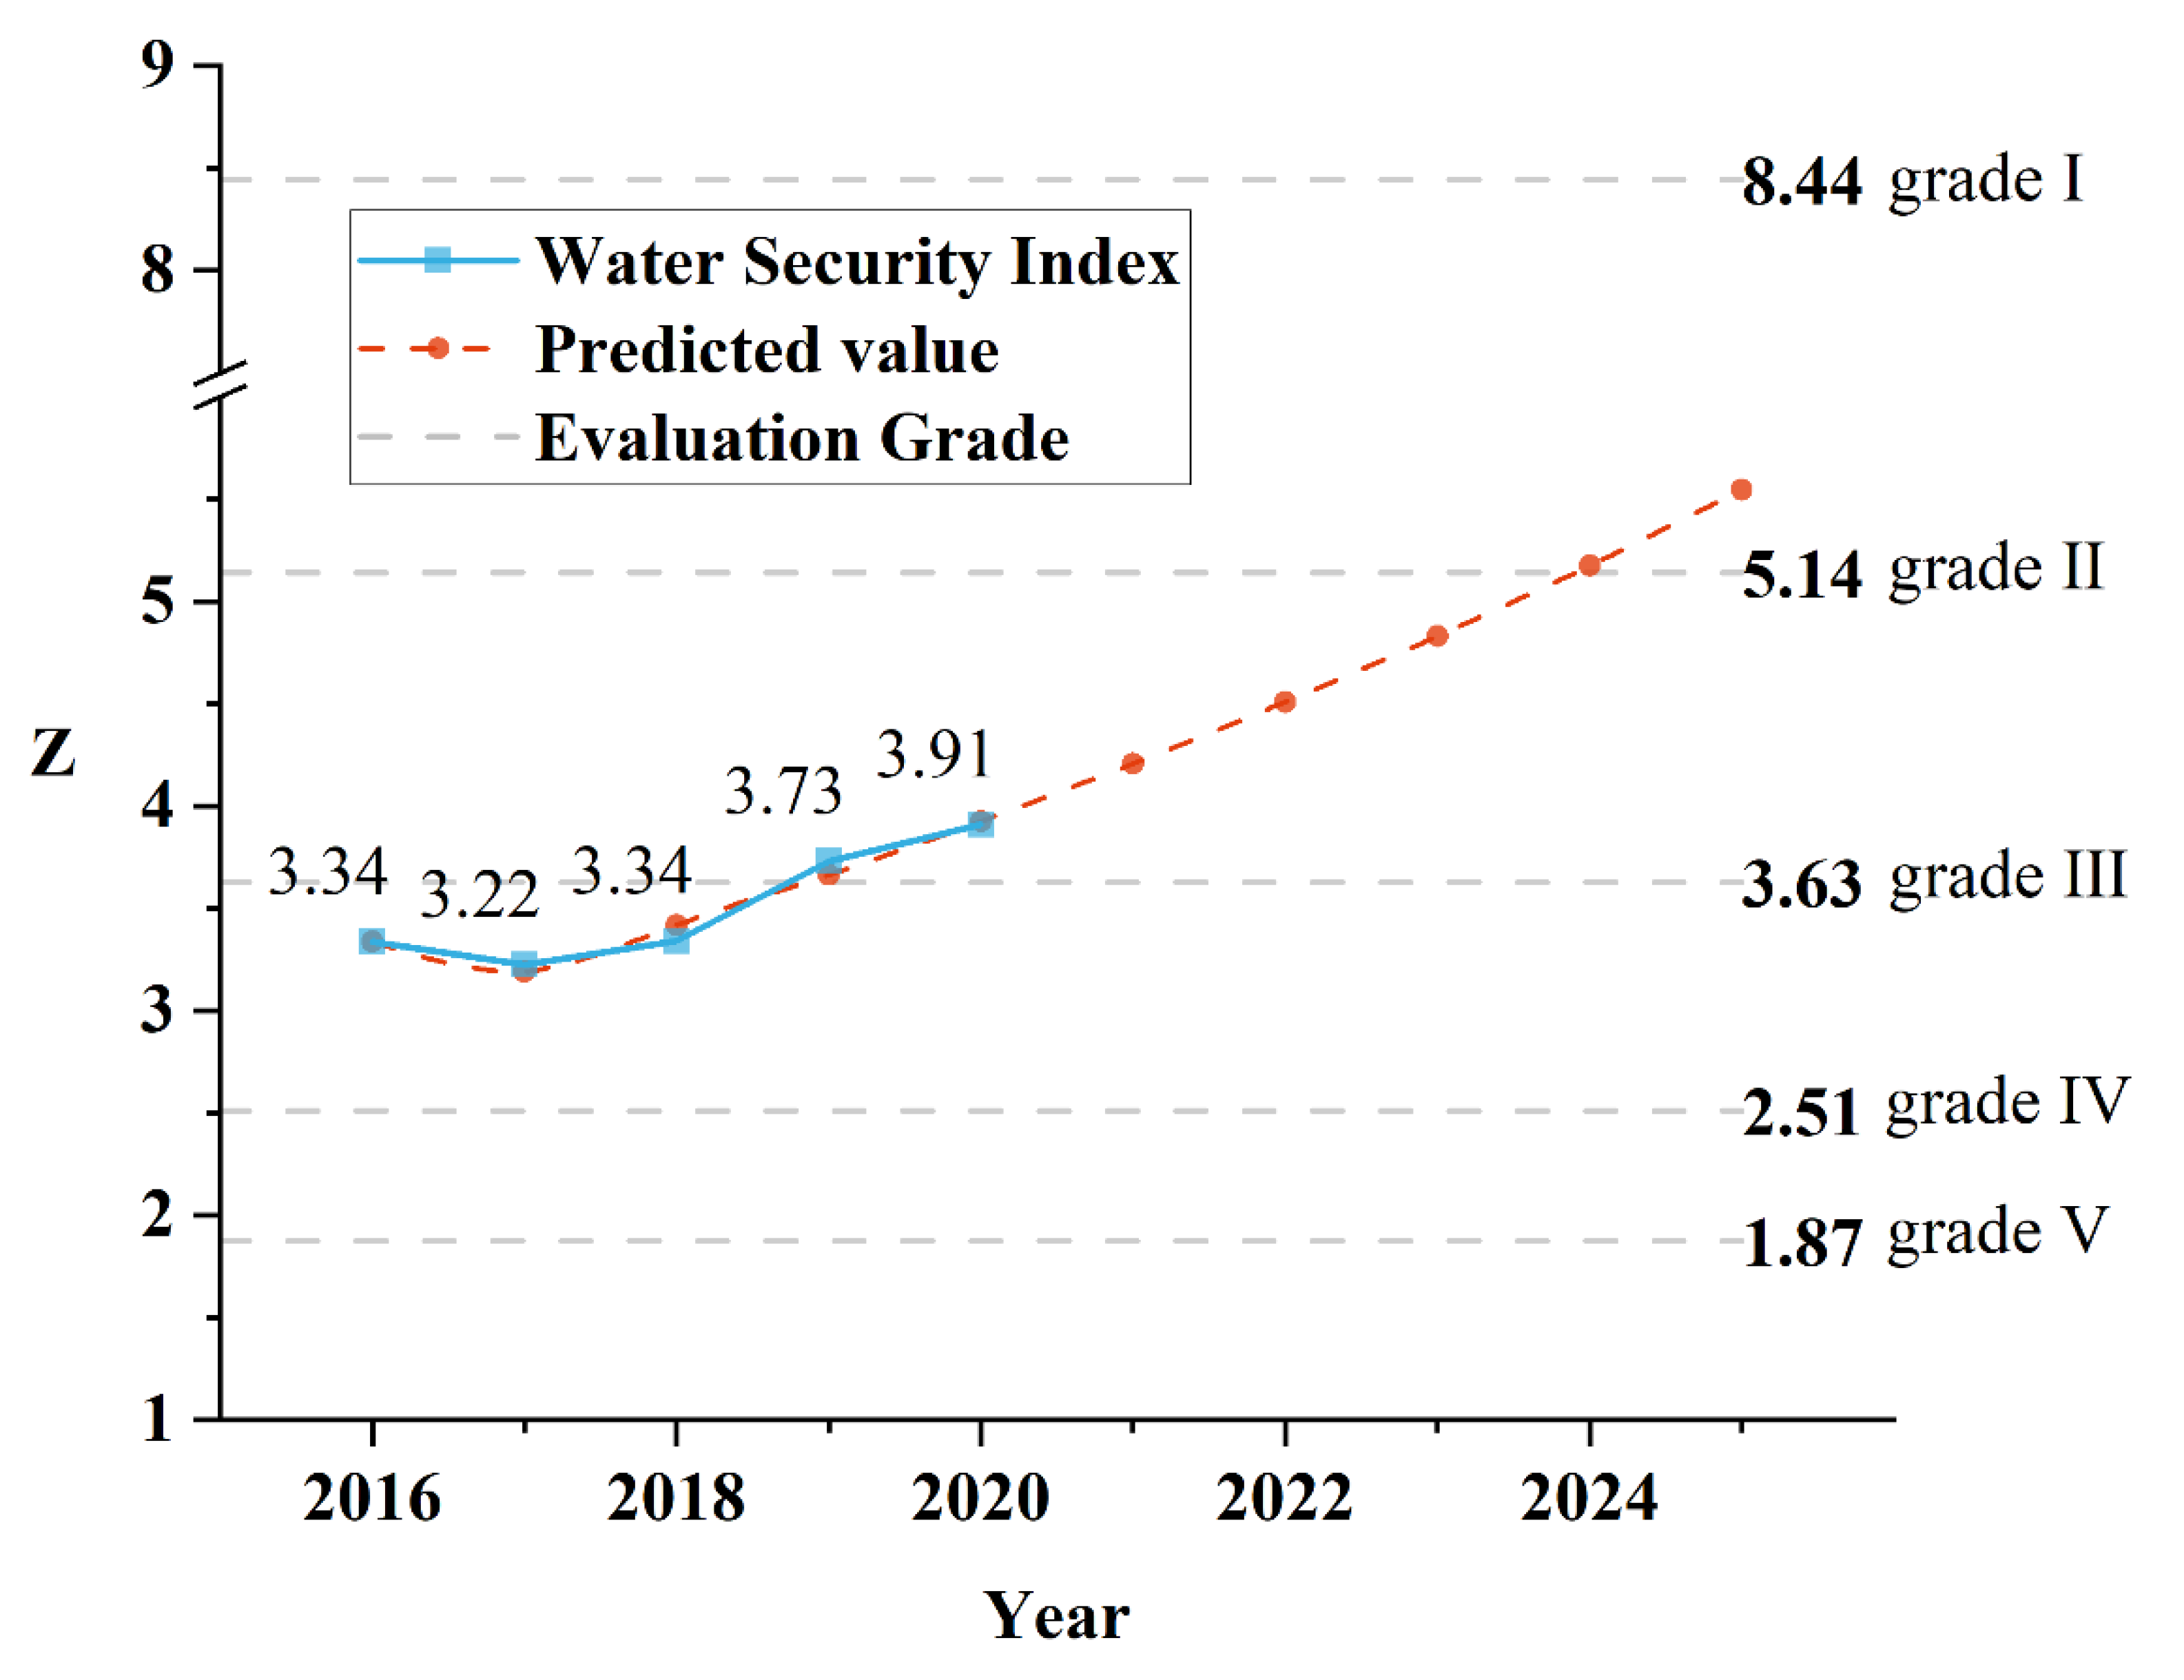
The value of the WSI is the projection characteristic value obtained by the DPSIR–PP model as the evaluation result. The weights of indicators and data and the critical values of grading standards are used to calculate the WSI (Z-value) for each year and the evaluation grade by substituting Formula (7), as shown in Figure 5. The predicted values are calculated by the gray prediction model based on the evaluation results.
The evaluation grade is divided into I~V, and its critical values are 8.44, 5.14, 3.63, 2.51, and 1.87, respectively. The WSI decreased slightly during 2016–2017 and increased significantly in the subsequent four years. The evaluation grade was changed from IV to III in 2019. The evaluation results and predicted trend results show that the water security situation in Dongguan is improving. As can be seen from Table 4, the fitting accuracy of the prediction model is within an acceptable range for predicting development trends.
4. Discussion
4.1. Analysis of Changes in WSI System Indicators
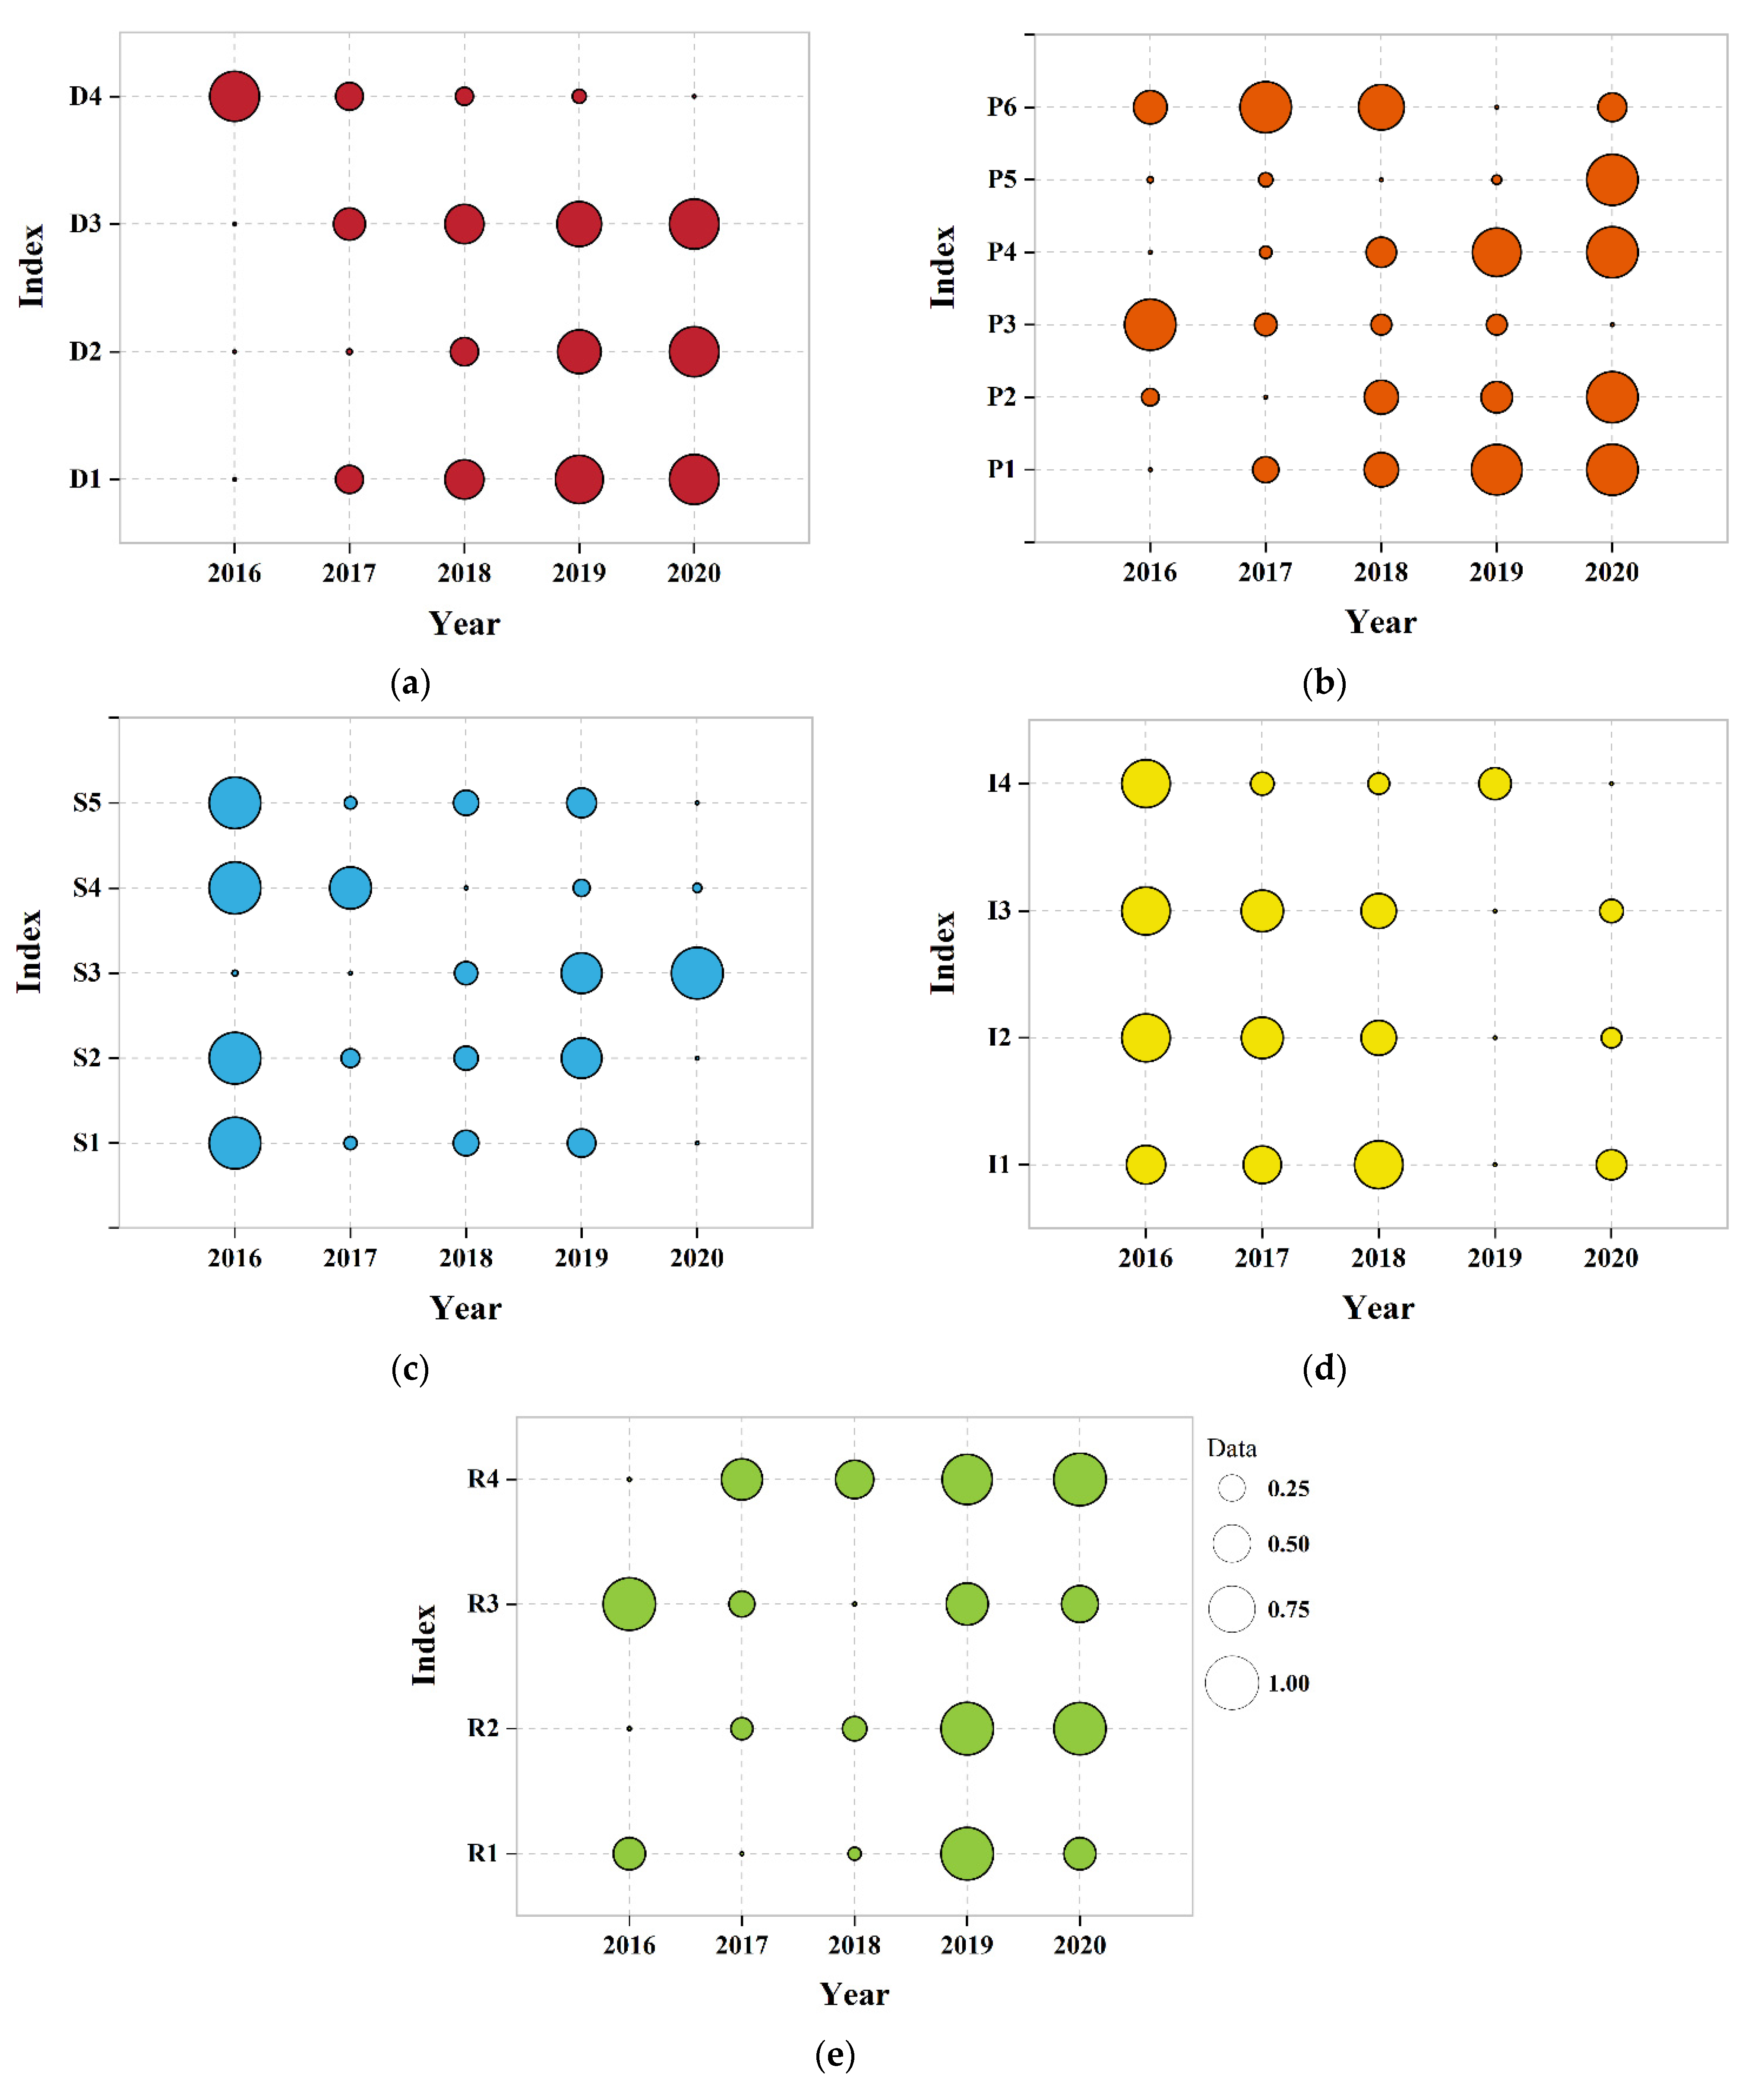
The trend of each indicator during the study period is shown in Figure 6. In terms of subsystem D, indicator D1 grew rapidly. As a famous manufacturing city known throughout China and even throughout the world, Dongguan is known as the “world’s factory” [49,68], and its GDP rose from CNY 726.092 billion in 2016 to CNY 965.019 billion in 2020, with an average annual growth rate of 7.37%. Both total agricultural output and the value added by industry (D2, D3) maintained a stable growth. This indicates that the economy of Dongguan City was on a continuous rise during the study period. At the same time, the population of Dongguan City also grew rapidly. According to the Seventh National Census, Dongguan’s resident population exceeded 10 million. In 2020, Dongguan’s resident population reached 10.48 million, with an urbanization rate of 92.15% of the population. The population density (D2) rose from 4132 to 4262 persons/km2. In general, excessive population density leads to reduced residential comfort [69], restricted water use, and increased polluting emissions. On the other hand, densely populated cities with a high level of urbanization usually see a better level of economic development. Therefore, they also have relatively good pollution control facilities and operational capabilities, which improve the efficiency of pollution control [70].
In terms of subsystem P, it is divided into industrial sources, agricultural sources, and domestic sources. Regarding industrial sources, there is a clear trend toward improvement in both the utilization of water resources (P1) and the rate of pollution discharge (P2). It shows that Dongguan City is reducing the pressure of industry on water security while achieving sustained economic growth. Related studies have shown that Dongguan City had a similar situation regarding its the atmospheric environment [49]. In terms of agricultural sources, agricultural water use (P3) increased and was mainly influenced by variations in the levels of water resources in different years, such as changes in precipitation. Fertilizer use (P4) decreased year by year, indicating a decrease in surface source pollution from agriculture. According to the Statistical Yearbook, the agricultural output value grew steadily, indicating the effectiveness of the high-quality development of agriculture during the study period. Regarding domestic sources, per capita domestic water consumption (P5) decreased, which was attributed to the construction of water-saving cities. In addition, Dongguan City was elected as the “tenth (2020) national water-saving cities”. Due to the rapid growth of the population, the discharge of domestic wastewater increased, while the discharge of domestic wastewater per capita (P6) fluctuated slightly with little overall change. The city’s total water consumption increased year by year from 1.854 billion m3 in 2016 to 1.975 billion m3 in 2019, with a small decrease to 1.96 billion m3 in 2020 due to the impact of the COVID-19 pandemic. This indicates that the demand for water resources is still increasing with economic growth.
In terms of subsystem S, the amount of water resources (S5) varied considerably. According to the hydrological year classification, 2016 was a wet year and the rest were normal years. According to the water resources bulletin, the total amount of water resources in 2020 was 2.002 billion m3 (98.80% and 1.20% for surface water and groundwater, respectively). Although Dongguan is located in the Pearl River Delta region and has relatively abundant water resources, the amount of water resources per capita (S1) is scarce due to the dense population and rapid economic growth. According to the Falkenmark index [8], less than 500 m3 of water per person per year means absolute water scarcity. The per capita amount of water resources in 2020 was only 190.96 m3/person. Currently, most of Dongguan City’s water intake comes directly or indirectly from the Dongjiang River, yet the development utilization rate (S2) of the Dongjiang River Basin reached 30% in 2020. A related study [71] concluded that a region is water scarce if the annual water withdrawals are between 20% and 40% of the annual supply and the region is severely water scarce if this figure exceeds 40%. Therefore, both the per capita water resources and the development and utilization rate of the Dongjiang River Basin indicate that Dongguan City’s water resources are relatively scarce. Dongguan’s surface water resources are mainly rivers and reservoirs. During the study period, the water quality condition (S3) of the major river crossings in Dongguan City improved significantly. According to the Report on the State of Dongguan’s Ecological Environment, the national surface water examination section in 2020 eliminated the poor results of all five categories of water quality. Relevant government reports also show that black odorous water bodies in built-up areas have largely been eliminated. This was made possible by the implementation of measures such as the River Chief System policy and the treatment of black odorous water bodies implemented during the 13th Five-Year Plan. At the same time, the water quality condition of major reservoirs (S4) has not changed significantly, and the water quality of some reservoirs still shows a deteriorating trend. This suggests that endogenous pollution is probably a key factor in eutrophication and that it is difficult to improve water quality by reducing external pollution alone [72].
The water environment is an important part of the ecosystem, so water security and the stability of the ecosystem are closely related [73]. In terms of subsystem I, indicator I1 changed inconsistently due to rapid urbanization and increased land area in built-up areas. During the 13th Five-Year Plan, Dongguan City created three forest parks and eleven wetland parks. This shows that, despite the economic development, ecological environment construction nevertheless received some attention. Indicators I2 and I3 showed an increasing trend, which is basically consistent with the trend of economic development. According to the Technical Criterion for Ecosystem Status Evaluation, the ecological index (EI) is a reflection of the state of the ecological environment, such as biodiversity, the amount of vegetation, etc. The overall change of EI (I4) in Dongguan was not significant, only decreasing slightly, which still represents good ecological condition.
In terms of subsystem R, the centralized treatment rate of wastewater plants (R1) fluctuated slightly and was generally at a high level. According to the Report on the State of Dongguan’s Ecological Environment, the annual new interceptor network grew from 260 km in 2016 to 5700 km in 2020. By 2021, a cumulative total of around 14,000 km of interceptor network had been completed, essentially achieving full sewage collection coverage. The city’s wastewater treatment capacity reached 4.31 million tons per day. Indicator R2 maintained a consistent increase over the study period, suggesting that economic development was accompanied by an increased focus on ecology. The indicator R3 has large variations, with the lowest value being in 2018 at only 66.3%. In the 14th Five-Year Plan of Dongguan Ecological Environmental Protection, the “Zero-waste City” city will be built. There is still room for improvement regarding solid waste treatment in the future as a way to reduce the threat to the environment and to water security. From indicator R4, it can be seen that Dongguan City has achieved a certain level of success in terms of water conservation measures.
4.2. Analysis of the WSI System
By substituting the weights of the subsystems in the optimal projection vector a and the normalized data into Equation (7), the WSI of each subsystem can be obtained. The trend of each subsystem during the study period and the percentage of each indicator are shown in Figure 7. Except for subsystem I, all the subsystems showed an increasing trend. The largest upward trend is for subsystem P, which has a trend slope of 0.07. The contribution of subsystem P is also seen to be larger in Figure 7f. This indicates that improvements are being made in terms of pressure on water security, which has been made possible by the increasing efficiency of water use in Dongguan and the control of the water environment discharge situation. Subsystem D maintained a slow increase, indicating that Dongguan City’s socio-economic development is relatively stable. Subsystem S showed a faster decrease from 2016 to 2017, mainly due to the fact that 2016 was a wet year with 64.07% more total water resources (3406 million m3) than the multi-year average (2076 million m3). The years 2017–2020 saw a return to normal resource levels. Subsystem I slowly declined, indicating that there is still some potential for improvement in Dongguan’s ecological environment. Subsystem R showed an overall upward trend, with the latter two years significantly better than the previous three years, indicating an increase in the importance given to water security response measures. As shown in Figure 5, the WSI has maintained a steady increase since 2017, and water security in Dongguan City is improving. It shows that in Dongguan City socio-economic growth has occurred alongside the improvement of the situation of water security to a certain extent and that management measures have been effective. The gray prediction model shows that it will continue to improve during the 14th Five-Year Plan. However, the projected value may be overestimated due to the economic slowdown caused by the COVID-19 pandemic, population growth, and water constraints.
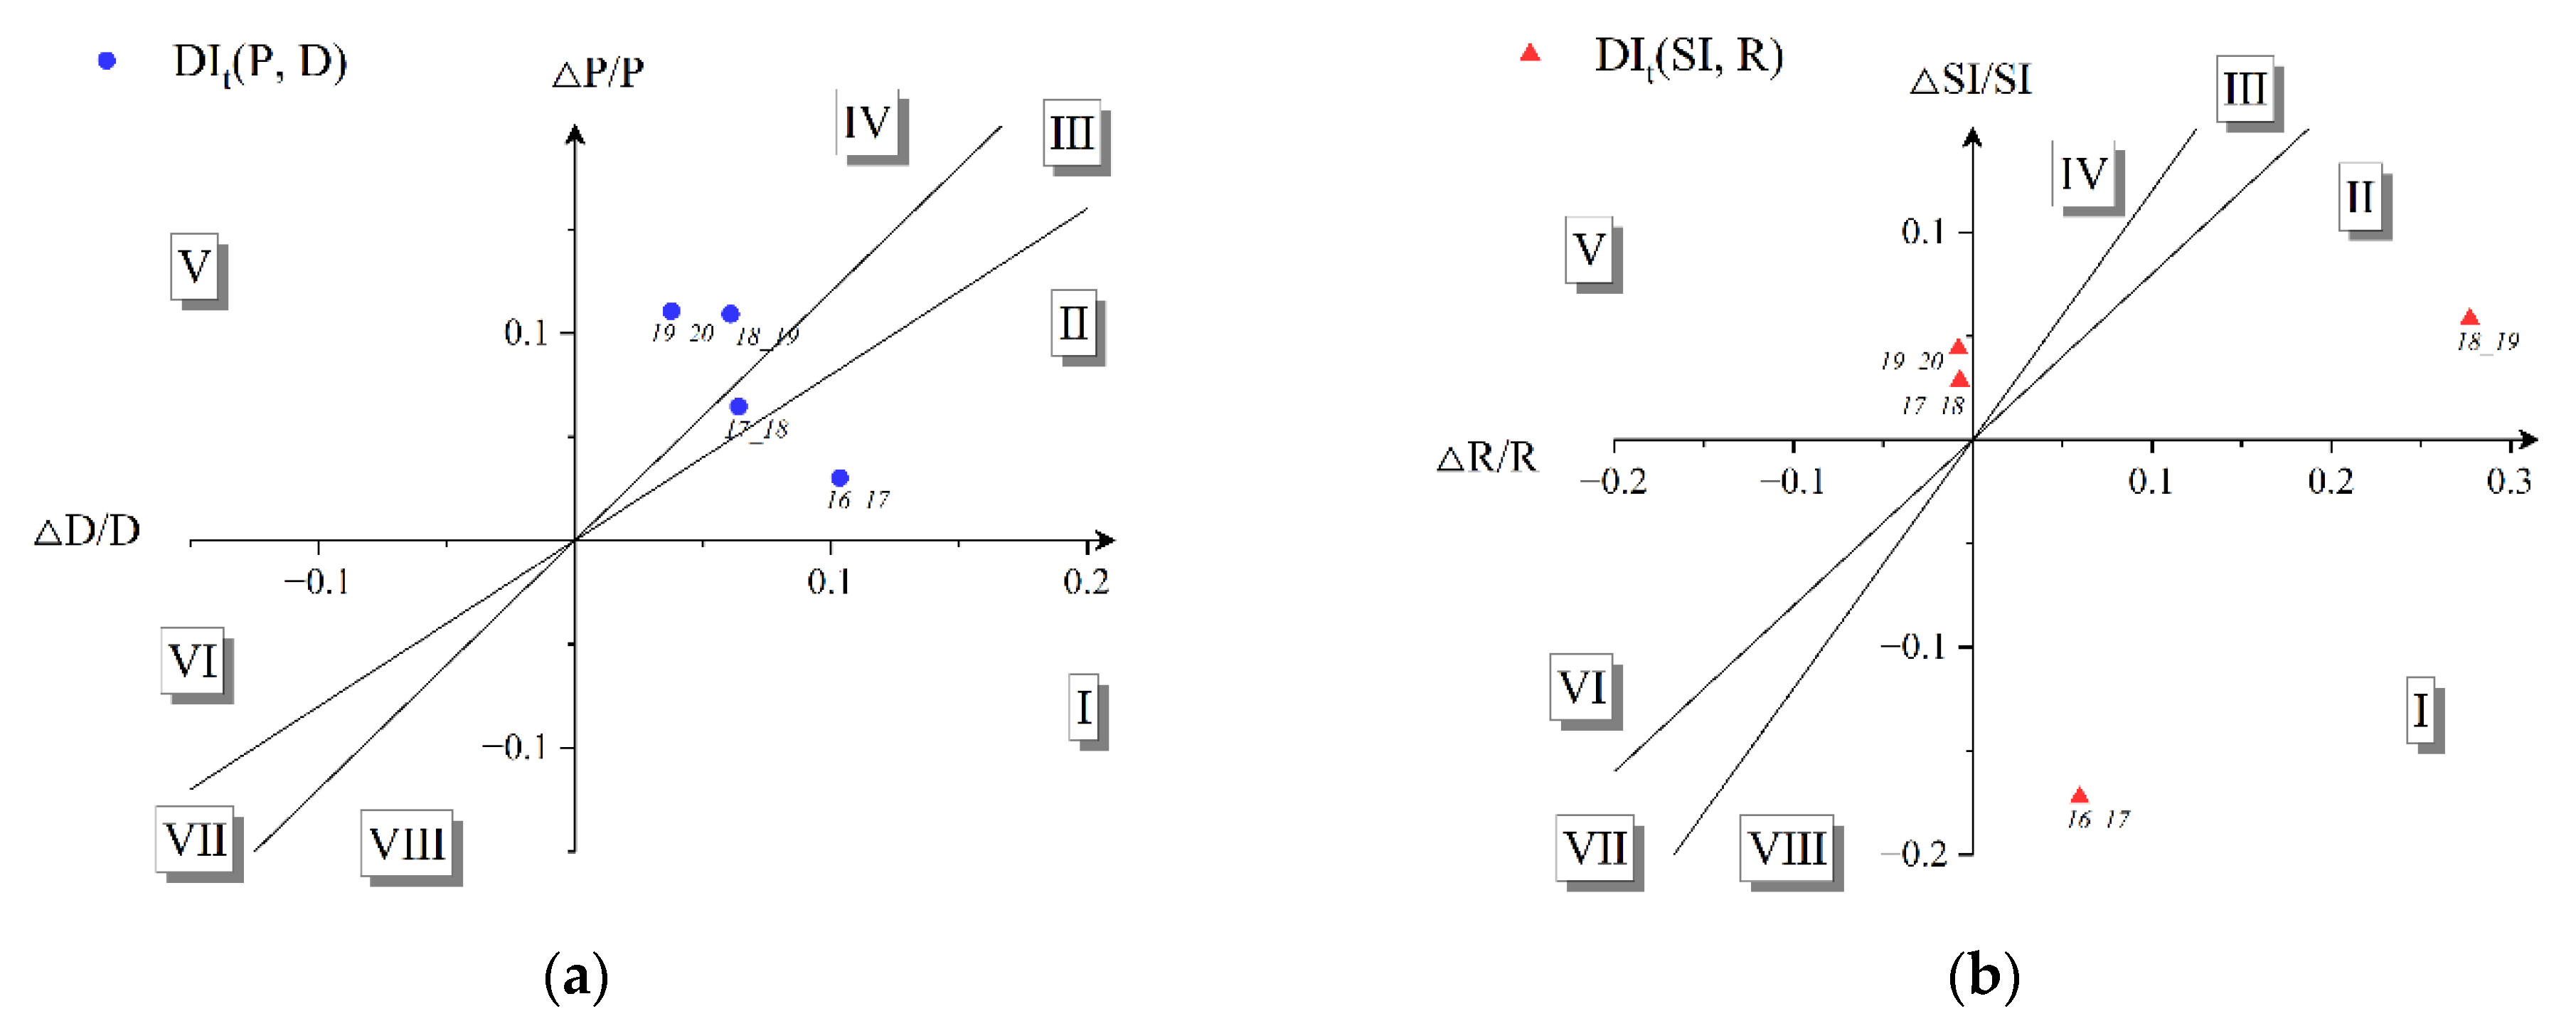
Figure 8 shows the decoupling status of P & D and SI & R. During the 13th Five-Year Plan period, the decoupling state of water security pressure and socio-economic drivers gradually changed from weak decoupling to expansive negative decoupling. The pressure on water security improved faster than economic development, which means that the pressure on water security from economic development was offset to some extent. However, the rate of improvement in water and ecosystem status has not been consistent with the response measures. On the one hand, there might be a certain delay in the effect of the previous response measures. On the other hand, the increase in response measures was lower than the improvement in water security status. Therefore, while economic growth was accompanied by some improvement in water utilization and pollution emissions, there is still some room for improvement regarding the government’s response measures.
4.3. Policy Analysis
It is worth noting that the improvement of the WSI in Dongguan during the study period was closely related to some of the policies implemented during the 13th Five-Year Plan. The Five-Year Plan is an important part of China’s national economic planning, setting the goals and directions for the vision of national economic development. With the country’s focus on environmental protection, the five-year plan also incorporates measures to protect the environment rather than just aiming for economic growth [74]. For example, starting with the 10th Five-Year Plan, environmental policies were included for the first time, with targets set for the reduction of pollutants, such as sulfur dioxide and chemical oxygen demand [75]. In the 11th Five-Year Plan, moreover, environmental protection targets were linked to the performance of local governments [76]. During the 13th Five-Year Plan, the State Council issued the 13th Five-Year Plan for Ecological Environmental Protection. In terms of water security, the relevant state departments have also released relevant documents, such as the “13th Five-Year Plan” of Action for the Double Control of Total Water Consumption and Intensity and the “13th Five-Year Plan” for the Comprehensive Management of Water Environment in Key Watersheds. Water security is not a fixed goal but rather a dynamic process that is continuously updated to respond to constant change [5]. As an adaptive governance method [77], the upcoming 14th Five-Year Plan can also play an important role in water security governance. Sustainability is achieved through the governance, planning, implementation of decisions, and monitoring and evaluation of subsequent outcomes [78] with continuous adjustment and feedback.
In the specific local sector, Dongguan City also issued the “13th Five-Year Plan” for Environmental Protection and Ecological Construction in Dongguan, the “13th Five-Year Plan” for Water Development in Dongguan and other related plans. Some of the targets set in the above plan, such as the water consumption of CNY 10,000 industrial added value (P1), the river water quality conditions (S3), the greenery coverage rate (I1), the centralized treatment rate of sewage plants (R1), and other related indicators, have met planning expectations. The results of the WSI evaluation also show that the implementation of the policy has been effective. During the 13th Five-Year Plan period, for water environment management, Dongguan City developed the Work Plan for the Comprehensive Implementation of the River Chief System in Dongguan and the Implementation Plan for the Battle on Urban Black-Odorous Water Bodies in Dongguan. The implementation of the river chief system and the treatment of black odorous water bodies have achieved certain results. By 2021, 22 black odorous water bodies in the built-up area of the city have been essentially eliminated. This has led to the task of preventing water bodies from returning to a black and odorous state and the continued task of eliminating rural black odorous water bodies during the 14th Five-Year Plan. In addition, in order to address the lack of per capita water resources, as well as to reduce the pressure on the Dongjiang water source, the Zhujiang Delta Water Resources Allocation Engineering has been officially launched. The engineering project, which draws water from the Xijiang River, is expected to be opened in 2023 and will be able to provide water resources of 330 million m3 per year for Dongguan City.
By comparing the relative trends of the economy and river water quality, it is found that there may be a turning point for the Environmental Kuznets Curve [79] (EKC) hypothesis (i.e., that environmental pollution presents a variation of an inverted U shape in its relationship with socio-economic development). Although there are not enough data to prove the EKC hypothesis, what can be determined is that economic growth and the state of the water environment were in a state of decoupling [80] throughout the 13th Five-Year Plan period. By analyzing the indicator data and policies, the improvement of water security in Dongguan City can be summarized in the following three aspects: (1) restructuring and optimizing the industrial structure to maintain economic growth while reducing pressure on water security; (2) implementing water body and ecological restoration to improve the condition of water bodies and ecological environments, such as the treatment of black odorous water bodies; and (3) the appoint of local officials as river chiefs to ensure the effective implementation of relevant measures.
5. Conclusions and Recommendations
This paper established a water security evaluation system under the DPSIR–PP model, quantitatively evaluated the WSI of Dongguan City during the 13th Five-Year Plan and predicted the change trends in the 14th Five-Year Plan. The results show that the WSI of Dongguan City has been improving and increasing since 2017. The evaluation grade changed from IV to III during the 13th Five-Year Plan. The prediction model results also show an upward trend in the coming 14th Five-Year Plan period. In terms of subsystems, all subsystems show an increasing trend, except for subsystem I, which decreases slightly. The subsystems P and S have a higher weight of influence. In addition, the pressure on water security has improved in the context of increased socio-economic conditions. However, the decoupling of response measures from the state of the water and ecological environment shows that more attention still needs to be paid to measures in ecological restoration.
Through evaluation results and policy analysis, it can be concluded that the water resources management measures in Dongguan City have been effective to a certain extent. In keeping with the original policy implementation, the following aspects can be further considered: (1) Although the current water resources meet the present requirements, the existing water resources of Dongguan City are primarily from a single source and the amount per capita is scarce. Considering the rapid development of the city and the influence of the climate, corresponding measures should be accelerated to ensure the safety of the water supply. For example, the corresponding water transfer project and reservoir storage project should be improved. (2) Regarding the analysis of water quality conditions, the river water quality has been greatly improved, but reservoir water quality and ecological environment conditions remain unimproved. Therefore, more attention needs to be paid to ecological restoration measures to improve the regulation capacity of the water environment and water security. (3) Since sudden water security incidents are difficult to quantify, they cannot be applied to model calculations, such as flood drainage and rapid water pollution. Therefore, the government should take measures to ensure water security, such as increasing monitoring, improving municipal facilities, and designating emergency plans.
This paper constructed a water security indicators system through urban water security elements and proposed the DPSIR–PP model to quantitatively evaluate the water security index. In addition, an improved Tapio decoupling model was used to analyze the internal links of water security in the DPSIR framework and a gray prediction model was used to predict future trends. This model provides a feasible approach for the comprehensive evaluation of urban water security and water resources management. However, there are certain limitations. Future studies may need to consider the following points: (1) Due to the availability of data, some of the indicators can still be further improved. For example, more specific indicators such as biodiversity could be added to the ecological impact assessment. (2) This study focused on the 13th Five-Year Plan period, and further research could be conducted in the future on large scale changes, such as changes between multiple five-year plans. (3) The prediction model was mainly based on existing data and did not take into account the macro-regulation of policies. In future studies, trends in water security could be predicted based on the assumptions of different policy developments.
Supplementary Materials
The following supporting information can be downloaded at: https://www.mdpi.com/article/10.3390/w14233957/s1, Table S1: The annual average water quality statistics of six major river cross-sections in Dongguan City; Table S2: The annual average water quality statistics of eight medium-sized reservoirs in Dongguan City; Table S3: The correlation rij between parameters and chl a and the value of rij2; Table S4: Dongguan WSI evaluation indicators and grading standards; Table S5: The classification criteria for the decoupling states; Figure S1. The sensitivity analysis of TLI weights. Refs. [81,82,83,84,85,86] are cited in the Supplementary Materials.
Author Contributions
Conceptualization, J.C.; methodology, J.C. and Y.L.; validation, Y.W.; formal analysis, J.C., G.Y. and Y.L.; investigation, Q.X., J.C., G.Y. and Y.W.; resources, J.W.; data curation, J.C. and G.Y.; writing—original draft preparation, J.C.; writing—review and editing, J.C., Z.Y. and J.W.; visualization, G.Y.; supervision, J.W.; project administration, Z.Y.; funding acquisition, J.W. All authors have read and agreed to the published version of the manuscript.
Funding
This research was funded by the National Key Research and Development Project (No. 2018YFE0110400), the Guangdong Special Support Program (No. 2021JC060580), the National Natural Science Foundation of China (No. 22278156 and No. 21978102), and the Foshan Science and Technology Innovation Project of Guangdong Province (No. 2130218003140).
Data Availability Statement
The data presented in this study are available in Supplementary Material.
Acknowledgments
The authors sincerely appreciate the Dongguan Water Affairs Bureau for preparing the data. The authors are also grateful to the anonymous reviewers for their valuable suggestions and comments.
Conflicts of Interest
The authors declare no conflict of interest.
References
- Falkenmark, M. Water resilience and human life support-global outlook for the next half century. Int. J. Water Resour. Dev. 2020, 36, 377–396. [Google Scholar] [CrossRef] [Green Version]
- Zhang, Z.F.; He, W.J.; An, M.; Degefu, D.M.; Yuan, L.; Shen, J.Q.; Liao, Z.Y.; Wu, X. Water Security Assessment of China’s One Belt and One Road Region. Water 2019, 11, 607. [Google Scholar] [CrossRef] [Green Version]
- Wang, X.; Chen, Y.; Li, Z.; Fang, G.; Wang, Y. Development and utilization of water resources and assessment of water security in Central Asia. Agric. Water Manag. 2020, 240, 106297. [Google Scholar] [CrossRef]
- Voeroesmarty, C.J.; McIntyre, P.B.; Gessner, M.O.; Dudgeon, D.; Prusevich, A.; Green, P.; Glidden, S.; Bunn, S.E.; Sullivan, C.A.; Liermann, C.R.; et al. Global threats to human water security and river biodiversity. Nature 2010, 467, 555–561. [Google Scholar] [CrossRef] [PubMed] [Green Version]
- Li, J.H.; Lei, X.H.; Qiao, Y.; Kang, A.Q.; Yan, P.R. The Water Status in China and an Adaptive Governance Frame for Water Management. Int. J. Environ. Res. Public Health 2020, 17, 2085. [Google Scholar] [CrossRef] [Green Version]
- Qin, J.X.; Duan, W.L.; Chen, Y.N.; Dukhovny, V.A.; Sorokin, D.; Li, Y.P.; Wang, X.X. Comprehensive evaluation and sustainable development of water-energy-food-ecology systems in Central Asia. Renew. Sustain. Energy Rev. 2022, 157, 112061. [Google Scholar] [CrossRef]
- Zhang, X.H.; Lin, Z.K. Evaluation of Water Resource Utilization Efficiency in Provincial Areas of China Based on the Unexpected Output SBM Model. J. Environ. Public Health 2022, 2022, 9554730. [Google Scholar] [CrossRef]
- Gleick, P.H.; Cooley, H. Freshwater Scarcity. Annu. Rev. Environ. Resour. 2021, 46, 319–348. [Google Scholar] [CrossRef]
- Zhang, Z.; Zhang, X.; Shi, M. Urban transformation optimization model: How to evaluate industrial structure under water resource constraints? J. Clean. Prod. 2018, 195, 1497–1504. [Google Scholar] [CrossRef]
- Zhang, C.J.; Zhao, Y.; Shi, C.F.; Chiu, Y.H. Can China achieve its water use peaking in 2030? A scenario analysis based on LMDI and Monte Carlo method. J. Clean. Prod. 2021, 278, 123214. [Google Scholar] [CrossRef]
- Xu, Z.C.; Cheng, L.; Liu, P.; Hou, Q.Y.; Cheng, S.J.; Qin, S.J.; Liu, L.; Xia, J. Investigating the spatial variability of water security risk and its driving mechanisms in China using machine learning. J. Clean. Prod. 2022, 362, 132303. [Google Scholar] [CrossRef]
- Su, Y.; Gao, W.J.; Guan, D.J.; Zuo, T.A. Achieving Urban Water Security: A Review of Water Management Approach from Technology Perspective. Water Resour. Manag. 2020, 34, 4163–4179. [Google Scholar] [CrossRef]
- Han, X.X.Q.; Hua, E.; Engel, B.A.; Guan, J.J.; Yin, J.L.; Wu, N.; Sun, S.K.; Wang, Y.B. Understanding implications of climate change and socio-economic development for the water-energy-food nexus: A meta-regression analysis. Agric. Water Manag. 2022, 269, 107693. [Google Scholar] [CrossRef]
- Liu, J.G.; Yang, W. Water Sustainability for China and Beyond. Science 2012, 337, 649–650. [Google Scholar] [CrossRef] [PubMed]
- Du, Y.B.; Tu, Y.; Li, Z.M.; Nie, L. Regional water resources security grading evaluation considering both visible and virtual water: A case study on Hubei province, China. Environ. Sci. Pollut. Res. 2022, 29, 25824–25847. [Google Scholar] [CrossRef]
- Lu, M.T.; Wang, S.Y.; Wang, X.Y.; Liao, W.H.; Wang, C.; Lei, X.H.; Wang, H. An Assessment of Temporal and Spatial Dynamics of Regional Water Resources Security in the DPSIR Framework in Jiangxi Province, China. Int. J. Environ. Res. Public Health 2022, 19, 3650. [Google Scholar] [CrossRef]
- Mosaffaie, J.; Jam, A.S.; Tabatabaei, M.R.; Kousari, M.R. Trend assessment of the watershed health based on DPSIR framework. Land Use Policy 2021, 100, 104911. [Google Scholar] [CrossRef]
- Hoekstra, A.Y.; Buurman, J.; van Ginkel, K.C.H. Urban water security: A review. Environ. Res. Lett. 2018, 13, 053002. [Google Scholar] [CrossRef] [Green Version]
- Marcal, J.; Antizar-Ladislao, B.; Hofman, J. Addressing Water Security: An Overview. Sustainability 2021, 13, 13702. [Google Scholar] [CrossRef]
- Partnership, G.W. Towards Water Security: A Framework for Action; GWP Secretariat: Stockholm, Sweden, 2000. [Google Scholar]
- Grey, D.; Sadoff, C.W. Sink or Swim? Water security for growth and development. Water Policy 2007, 9, 545–571. [Google Scholar] [CrossRef]
- United Nations ESCAP. Water Security & the Global Water Agenda: A UN-Water Analytical Brief; United Nations University (UNU): Hamilton, ON, Canada, 2013; ISBN 9280860380. [Google Scholar]
- UNESCO. “Water Security”. Available online: https://en.unesco.org/themes/water-security (accessed on 1 October 2022).
- Gerlak, A.K.; House-Peters, L.; Varady, R.G.; Albrecht, T.; Zuniga-Teran, A.; de Grenade, R.R.; Cook, C.; Scott, C.A. Water security: A review of place-based research. Environ. Sci. Policy 2018, 82, 79–89. [Google Scholar] [CrossRef]
- Li, X.; Bing, J.; Zhang, J.; Guo, L.; Deng, Z.; Wang, D.; Liu, L. Ecological risk assessment and sources identification of heavy metals in surface sediments of a river-reservoir system. Sci. Total Environ. 2022, 842, 156683. [Google Scholar] [CrossRef] [PubMed]
- Nong, X.; Shao, D.; Zhong, H.; Liang, J. Evaluation of water quality in the South-to-North Water Diversion Project of China using the water quality index (WQI) method. Water Res. 2020, 178, 115781. [Google Scholar] [CrossRef] [PubMed]
- Xu, H.; Jia, A.; Song, X.; Bai, Y. Suitability evaluation of carrying capacity and utilization patterns on tidal flats of Bohai Rim in China. J. Environ. Manag. 2022, 319, 115688. [Google Scholar] [CrossRef] [PubMed]
- Tian, Y.; Wen, Z.; Cheng, M.; Xu, M. Evaluating the water quality characteristics and tracing the pollutant sources in the Yellow River Basin, China. Sci. Total Environ. 2022, 846, 157389. [Google Scholar] [CrossRef] [PubMed]
- Arif, M.; Behzad, H.M.; Tahir, M.; Li, C. The impact of ecotourism on ecosystem functioning along main rivers and tributaries: Implications for management and policy changes. J. Environ. Manag. 2022, 320, 115849. [Google Scholar] [CrossRef] [PubMed]
- Keeler, L.W.; Wiek, A.; White, D.D.; Sampson, D.A. Linking stakeholder survey, scenario analysis, and simulation modeling to explore the long-term impacts of regional water governance regimes. Environ. Sci. Policy 2015, 48, 237–249. [Google Scholar] [CrossRef]
- Yu, H.; Kong, B.; He, Z.-W.; Wang, G.; Wang, Q. The potential of integrating landscape, geochemical and economical indices to analyze watershed ecological environment. J. Hydrol. 2020, 583, 124298. [Google Scholar] [CrossRef] [Green Version]
- Zhao, J.; Chen, Y.; Xu, J.; Jin, J.; Wang, G.; Shamseldin, A.; Guo, Y.; Cheng, L. Regional water security evaluation with risk control model and its application in Jiangsu Province, China. Environ. Sci. Pollut. Res. 2021, 28, 55700–55715. [Google Scholar] [CrossRef]
- Yang, B.; Ding, L.; Zhan, X.; Tao, X.; Peng, F. Evaluation and analysis of energy security in China based on the DPSIR model. Energy Rep. 2022, 8, 607–615. [Google Scholar] [CrossRef]
- Chen, H.Z.; Xu, J.F.; Zhang, K.; Guo, S.Z.; Lv, X.; Mu, X.Y.; Yang, L.; Song, Y.Y.; Hu, X.R.; Ma, Y.; et al. New insights into the DPSIR model: Revealing the dynamic feedback mechanism and efficiency of ecological civilization construction in China. J. Clean. Prod. 2022, 348, 131377. [Google Scholar] [CrossRef]
- Atkins, J.P.; Burdon, D.; Elliott, M.; Gregory, A.J. Management of the marine environment: Integrating ecosystem services and societal benefits with the DPSIR framework in a systems approach. Mar. Pollut. Bull. 2011, 62, 215–226. [Google Scholar] [CrossRef] [PubMed]
- Hu, Q.; He, X. An Integrated Approach to Evaluate Urban Adaptive Capacity to Climate Change. Sustainability 2018, 10, 1272. [Google Scholar] [CrossRef] [Green Version]
- Cao, Y.Q.; Bian, Y.J. Improving the ecological environmental performance to achieve carbon neutrality: The application of DPSIR-Improved matter-element extension cloud model. J. Environ. Manag. 2021, 293, 112887. [Google Scholar] [CrossRef] [PubMed]
- Ji, J.; Qu, X.; Zhang, Q.; Tao, J. Predictive analysis of water resource carrying capacity based on system dynamics and improved fuzzy comprehensive evaluation method in Henan Province. Environ. Monit. Assess. 2022, 194, 500. [Google Scholar] [CrossRef] [PubMed]
- Yu, D.; Hong, X. A theme evolution and knowledge trajectory study in AHP using science mapping and main path analysis. Expert Syst. Appl. 2022, 205, 117675. [Google Scholar] [CrossRef]
- Selerio, E., Jr.; Caladcad, J.A.; Catamco, M.R.; Capinpin, E.M.; Ocampo, L. Emergency preparedness during the COVID-19 pandemic: Modelling the roles of social media with fuzzy DEMATEL and analytic network process. Socio-Econ. Plan. Sci. 2022, 82, 101217. [Google Scholar] [CrossRef]
- Zeng, P.; Wei, X.; Duan, Z. Coupling and coordination analysis in urban agglomerations of China: Urbanization and ecological security perspectives. J. Clean. Prod. 2022, 365, 132730. [Google Scholar] [CrossRef]
- Liu, L.P.; Tang, D.S.; Chen, T.L.; Ieee. Assessment on the Water Security of ZhangYe Based on the DPSIR Model. In Proceedings of the IEEE 5th International Conference on Advanced Computational Intelligence (ICACI), Nanjing, China, 18–20 October 2012; pp. 850–855. [Google Scholar]
- Ranji, A.; Parashkoohi, M.G.; Zamani, D.M.; Ghahderijani, M. Evaluation of agronomic, technical, economic, and environmental issues by analytic hierarchy process for rice weeding machine. Energy Rep. 2022, 8, 774–783. [Google Scholar] [CrossRef]
- Liu, B.; Zhang, F.L.; Qin, X.S.; Wu, Z.; Wang, X.L.; He, Y.Y. Spatiotemporal assessment of water security in China: An integrated supply-demand coupling model. J. Clean. Prod. 2021, 321, 128955. [Google Scholar] [CrossRef]
- Xiang, J.Y.; Tan, S.; Tan, X.L.; Long, J.W.; Xiao, T.L.; Wang, W. Spatiotemporal assessment of water security in the Dongting Lake region: Insights from projection pursuit method and sparrow search algorithm. J. Clean. Prod. 2022, 378, 134447. [Google Scholar] [CrossRef]
- Zhang, L.; Li, H.B. Construction Risk Assessment of Deep Foundation Pit Projects Based on the Projection Pursuit Method and Improved Set Pair Analysis. Appl. Sci. 2022, 12, 1922. [Google Scholar] [CrossRef]
- Wang, Q.; Zhan, L. Assessing the sustainability of the shale gas industry by combining DPSIRM model and RAGA-PP techniques: An empirical analysis of Sichuan and Chongqing, China. Energy 2019, 176, 353–364. [Google Scholar] [CrossRef]
- Chen, Y.; Xie, Q.; Wan, J.; Yang, S.; Wang, Y.; Fan, H. Occurrence and risk assessment of antibiotics in multifunctional reservoirs in Dongguan, China. Environ. Sci. Pollut. Res. 2020, 27, 13565–13574. [Google Scholar] [CrossRef] [PubMed]
- Wu, J.; Wang, X.; Wang, H.; Gong, D.; Yang, J.; Jiang, B.; Zhang, C.; Deng, X.; Zhou, L.; Wang, B. Rapidly alleviating particulate matter pollution while maintaining high-speed economic development in the “world’s factory”. J. Clean. Prod. 2020, 266, 121844. [Google Scholar] [CrossRef]
- Gao, L.-H.; Ning, J.; Bao, W.-L.-T.-Y.; Yan, A.; Yin, Q.-R. A study on the marine ecological security assessment of Guangdong-Hong Kong-Macao Great Bay Area. Mar. Pollut. Bull. 2022, 176, 113416. [Google Scholar] [CrossRef]
- Fan, C.; Liu, Y.; Liu, C.; Zhao, W.; Hao, N.; Guo, W.; Yuan, J.; Zhao, J. Water quality characteristics, sources, and assessment of surface water in an industrial mining city, southwest of China. Environ. Monit. Assess. 2022, 194, 259. [Google Scholar] [CrossRef]
- Matta, G.; Kumar, A.; Nayak, A.; Kumar, P.; Kumar, A.; Tiwari, A.K. Water quality and planktonic composition of river Henwal (India) using comprehensive pollution index and biotic-indices. Trans. Indian Natl. Acad. Eng. 2020, 5, 541–553. [Google Scholar] [CrossRef]
- Ihsane, O.; Zahra, E.; Sanae, R.; Mohammed, E.; Bourhia, M.; Ali, G.A.M.; Ouahmane, L.; Salamatullah, A.M.; Aboul-Soud, M.A.M.; Giesy, J.P.; et al. Physicochemical Characterization and Assessment of Magnitude of Pollution to Contribute to Water Sustainability. Sustainability 2022, 14, 6689. [Google Scholar] [CrossRef]
- Yuan, L.; Fang, L.; Wang, Y.; Mi, W.; Li, J.; Zhang, G.; Yang, P.; Chen, Z.; Bi, Y. Anthropogenic activities accelerated the evolution of river trophic status. Ecol. Indic. 2022, 136, 108584. [Google Scholar] [CrossRef]
- Li, N.; Li, M.; Zhou, F.; Ma, X.; Lyu, H. Spatio-temporal variations in water quality of urban landscape waters in the plain city. Environ. Pollut. Bioavailab. 2022, 34, 215–223. [Google Scholar] [CrossRef]
- Yang, X.; Chen, X. Using a combined evaluation method to assess water resources sustainable utilization in Fujian Province, China. Environ. Dev. Sustain. 2021, 23, 8047–8061. [Google Scholar] [CrossRef]
- Wei, X.M.; Wang, J.Y.; Wu, S.G.; Xin, X.; Wang, Z.L.; Liu, W. Comprehensive evaluation model for water environment carrying capacity based on VPOSRM framework: A case study in Wuhan, China. Sustain. Cities Soc. 2019, 50, 101640. [Google Scholar] [CrossRef]
- Shuai, J.; Zhao, Y.; Wang, Y.; Cheng, J. Renewable energy product competitiveness: Evidence from the United States, China and India. Energy 2022, 249, 123614. [Google Scholar] [CrossRef]
- Suwal, N.; Huang, X.; Kuriqi, A.; Chen, Y.; Pandey, K.P.; Bhattarai, K.P. Optimisation of cascade reservoir operation considering environmental flows for different environmental management classes. Renew. Energy 2020, 158, 453–464. [Google Scholar] [CrossRef]
- Hu, F.; Hughes, K.J.; Ingham, D.B.; Ma, L.; Pourkashanian, M. Dynamic economic and emission dispatch model considering wind power under Energy Market Reform: A case study. Int. J. Electr. Power Energy Syst. 2019, 110, 184–196. [Google Scholar] [CrossRef] [Green Version]
- Liu, H.Y.; Xia, J.; Zou, L.; Huo, R. Comprehensive quantitative evaluation of the water resource carrying capacity in Wuhan City based on the "human-water-city" framework: Past, present and future. J. Clean. Prod. 2022, 366, 132847. [Google Scholar] [CrossRef]
- Xing, Y.; Li, F.; Sun, K.; Wang, D.; Chen, T.Y.; Zhang, Z. Multi-type electric vehicle load prediction based on Monte Carlo simulation. Energy Rep. 2022, 8, 966–972. [Google Scholar] [CrossRef]
- Wang, T.; Li, K.Y.; Liu, D.F.; Yang, Y.; Wu, D. Estimating the Carbon Emission of Construction Waste Recycling Using Grey Model and Life Cycle Assessment: A Case Study of Shanghai. Int. J. Environ. Res. Public Health 2022, 19, 8507. [Google Scholar] [CrossRef]
- Liu, C.X.; Shu, T.; Chen, S.; Wang, S.Y.; Lai, K.K.; Gan, L. An improved grey neural network model for predicting transportation disruptions. Expert Syst. Appl. 2016, 45, 331–340. [Google Scholar] [CrossRef]
- Wang, Q.; Wang, X.W. Moving to economic growth without water demand growth—A decomposition analysis of decoupling from economic growth and water use in 31 provinces of China. Sci. Total Environ. 2020, 726, 138362. [Google Scholar] [CrossRef]
- Liu, F.Q.; Kang, Y.X.; Guo, K. Is electricity consumption of Chinese counties decoupled from carbon emissions? A study based on Tapio decoupling index. Energy 2022, 251, 123879. [Google Scholar] [CrossRef]
- Tapio, P. Towards a theory of decoupling: Degrees of decoupling in the EU and the case of road traffic in Finland between 1970 and 2001. Transp. Policy 2005, 12, 137–151. [Google Scholar] [CrossRef] [Green Version]
- Chen, Q.; Su, M.; Meng, F.; Liu, Y.; Cai, Y.; Zhou, Y.; Yang, Z. Analysis of urban carbon metabolism characteristics based on provincial input-output tables. J. Environ. Manag. 2020, 265, 110561. [Google Scholar] [CrossRef] [PubMed]
- Xiao, Y.; Li, Y.; Tang, X.; Huang, H.; Wang, R. Assessing spatial-temporal evolution and key factors of urban livability in arid zone: The case study of the Loess Plateau, China. Ecol. Indic. 2022, 140, 108995. [Google Scholar] [CrossRef]
- Wang, Y.; Duan, X.; Wang, L.; Zou, H. Spatial temporal patterns and driving factors of industrial pollution and structures in the Yangtze River Economic Belt. Chemosphere 2022, 303, 134996. [Google Scholar] [CrossRef] [PubMed]
- Rijsberman, F.R. Water scarcity: Fact or fiction? Agric. Water Manag. 2006, 80, 5–22. [Google Scholar] [CrossRef] [Green Version]
- Tong, Y.; Xu, X.; Qi, M.; Sun, J.; Zhang, Y.; Zhang, W.; Wang, M.; Wang, X.; Zhang, Y. Lake warming intensifies the seasonal pattern of internal nutrient cycling in the eutrophic lake and potential impacts on algal blooms. Water Res. 2021, 188, 116570. [Google Scholar] [CrossRef]
- Li, Y.; Zhu, C.; Zhang, L.; Wang, Y.; Wu, Z.; Niu, X. Ecological security assessment and countermeasures of water environment based on improved analytic hierarchy process: A case study of Xingtai city. Beijing Da Xue Xue Bao 2019, 55, 310–316. [Google Scholar]
- Yang, J.; Gu, W.; Wu, B.; Liu, B.; Zhang, B. Towards cost-effective total pollution control in Chinese industries. J. Environ. Manag. 2022, 320, 115744. [Google Scholar] [CrossRef]
- Zheng, J.; He, J.; Shao, X.; Liu, W. The employment effects of environmental regulation: Evidence from eleventh five-year plan in China. J. Environ. Manag. 2022, 316, 115197. [Google Scholar] [CrossRef] [PubMed]
- Jin, Y.; Andersson, H.; Zhang, S. Air Pollution Control Policies in China: A Retrospective and Prospects. Int. J. Environ. Res. Public Health 2016, 13, 1219. [Google Scholar] [CrossRef] [Green Version]
- Xue, L.; Weng, L.F.; Yu, H.Z. Addressing policy challenges in implementing Sustainable Development Goals through an adaptive governance approach: A view from transitional China. Sustain. Dev. 2018, 26, 150–158. [Google Scholar] [CrossRef]
- Blal, A.E.; Davide, G.; Christian, A. Boundary work for implementing adaptive management: A water sector application. Sci. Total Environ. 2017, 593, 274–285. [Google Scholar] [CrossRef]
- Sarkodie, S.A.; Strezov, V. A review on Environmental Kuznets Curve hypothesis using bibliometric and meta-analysis. Sci. Total Environ. 2019, 649, 128–145. [Google Scholar] [CrossRef]
- Wang, Q.; Jiang, R.; Li, R.R. Decoupling analysis of economic growth from water use in City: A case study of Beijing, Shanghai, and Guangzhou of China. Sustain. Cities Soc. 2018, 41, 86–94. [Google Scholar] [CrossRef]
- Li, P.Y.; Qian, H.; Wu, J.H.; Chen, J. Sensitivity analysis of TOPSIS method in water quality assessment: I. Sensitivity to the parameter weights. Environ. Monit. Assess. 2013, 185, 2453–2461. [Google Scholar] [CrossRef]
- Chen, Y.; Yu, J.; Khan, S. Spatial sensitivity analysis of multi-criteria weights in GIS-based land suitability evaluation. Environ. Model. Softw. 2010, 25, 1582–1591. [Google Scholar] [CrossRef]
- Xu, E.Q.; Zhang, H.Q. Spatially-explicit sensitivity analysis for land suitability evaluation. Appl. Geogr. 2013, 45, 1–9. [Google Scholar] [CrossRef]
- Sun, Y.; Xu, J.Z. Evaluation Model and Empirical Research on the Green Innovation Capability of Manufacturing Enterprises from the Perspective of Ecological Niche. Sustainability 2021, 13, 11710. [Google Scholar] [CrossRef]
- Song, Y.L.; Wang, Y.; Liu, F.; Zhang, Y.X. Development of a hybrid model to predict construction and demolition waste: China as a case study. Waste Manag. 2017, 59, 350–361. [Google Scholar] [CrossRef] [PubMed]
- Liu, L.Y.; Guan, D.J.; Yang, Q.W. Evaluation of Water Resource Security Based on an MIV-BP Model in a Karst Area. Water 2018, 10, 786. [Google Scholar] [CrossRef]
Figure 1.
The Water System Map of Dongguan City.

Figure 2.
The structure of the DPSIR model.

Figure 3.
The projection weights of each indicator.

Figure 4.
The weight proportion of each subsystem.

Figure 5.
The WSI evaluation results and predicted trends.

Figure 6.
(a–e) Trends in normalized indicators for each subsystem.

Figure 7.
(a–e) Trends in the projection eigenvalues of each subsystem and the proportion of indicators; (f) trends of change in each subsystem.
Figure 7.
(a–e) Trends in the projection eigenvalues of each subsystem and the proportion of indicators; (f) trends of change in each subsystem.

Figure 8.
(a) The decoupling state of water security pressures and socio-economic drivers; (b) The decoupling state of water and ecological status and response measures; I~VIII are eight categories of decoupling states, see Table S5.
Figure 8.
(a) The decoupling state of water security pressures and socio-economic drivers; (b) The decoupling state of water and ecological status and response measures; I~VIII are eight categories of decoupling states, see Table S5.


Table 1.
Definition of water security by relevant institutions.
| Reference | Definition |
|---|---|
| Global Water Partnership (2000) [20] | Water security, at any level from the household to the global, means that every person has access to enough safe water at affordable cost to lead a clean, healthy and productive life, while ensuring that the natural environment is protected and enhanced. |
| Grey and Sadoff (2007) [21] | Water security is the availability of an acceptable quantity and quality of water for health, livelihoods, ecosystems and production, coupled with an acceptable level of water-related risks to people, environments and economies. |
| UN-Water (2013) [22] | Water security is the capacity of a population to safeguard sustainable access to adequate quantities of and acceptable quality water for sustaining livelihoods, human well-being, and socio-economic development, for ensuring protection against water-borne pollution and water-related disasters, and for preserving ecosystems in a climate of peace and political stability. |
| UNESCO (2016) [23] | Freshwater is the most important resource for humankind, cross-cutting all social, economic and environmental activities. It is a condition for all life on our planet, an enabling or limiting factor for any social and technological development, a possible source of welfare or misery, cooperation or conflict. |
Table 2.
Dongguan City water security evaluation indicator system.
| Rule Layer | Index Layer | Unit | Identifier (Type) | Statistical Methods | |
|---|---|---|---|---|---|
| Driving force (D) | GDP per capita | Chinese Yuan | D1 (+) | Gross regional product/Resident population | |
| Total agricultural output | hundred million Chinese Yuan | D2 (+) | Gross output value of farming, forestry, animal husbandry and fishery | ||
| Value added by industry | hundred million Chinese Yuan | D3 (+) | - | ||
| Population density | person/km2 | D4 (−) | Number of resident population/Area | ||
| Pressure (P) | Industrial sources | Water consumption of ten thousand Yuan industrial value added | m3 | P1 (−) | Industrial water consumption/Industrial value added |
| Industrial wastewater emissions of ten thousand Chinese Yuan GDP | m3/ten thousand Chinese Yuan | P2 (−) | Industrial wastewater discharge/Secondary industry output | ||
| Agricultural sources | Water consumption for agricultural irrigation | m3/ha | P3 (−) | Agricultural water consumption/Farmland area | |
| Fertilizer application per unit sown area | kg/ha | P4 (−) | Annual fertilizer use/Sown area | ||
| Domestic sources | Per capita water consumption for residential use | L/d | P5 (−) | Daily domestic water consumption/Resident population | |
| Annual per capita domestic sewage discharge | m3/person | P6 (−) | Annual domestic sewage discharge/Resident population | ||
| State (S) | Water resources per capita | m3/person | S1 (+) | Total water resources/Resident population | |
| Dongjiang water resources development and utilization rate | % | S2 (−) | - | ||
| River water quality conditions | - | S3 (−) | Comprehensive pollution index method | ||
| Reservoir water quality conditions | - | S4 (−) | Comprehensive trophic level index method | ||
| Annual precipitation | mm | S5 (+) | - | ||
| Impact (I) | Greenery coverage rate | % | I1 (+) | - | |
| Industrial waste gas emissions | one hundred million m3 | I2 (−) | - | ||
| Industrial solid waste generation | ten thousand tons | I3 (−) | - | ||
| Ecological index | - | I4 (+) | Eco-environmental status evaluation method | ||
| Response (R) | Centralized treatment rate of sewage plants | % | R1 (+) | - | |
| Ecological water use ratio | % | R2 (+) | Ecological water consumption/Total water consumption | ||
| Comprehensive utilization rate of industrial solid waste | % | R3 (+) | - | ||
| Leakage rate of water supply network | % | R4 (+) | - | ||
Table 3.
The accuracy test standards of the GM (1,1) model.
| Standard | Average Relative Percentage Error * | Variance Ratio * | Minor Probability * |
|---|---|---|---|
| Excellent | <0.01 | <0.35 | >0.95 |
| Good | <0.05 | <0.5 | >0.8 |
| Qualified | <0.10 | <0.65 | >0.7 |
| Unqualified | ≥0.20 | ≥0.65 | ≤0.7 |
* The accuracy calculation formula can be found in Supplementary Material Chapter S4.
Table 4.
The accuracy test of the GM (1,1) model.
| Standard | Average Relative Percentage Error Φ | Variance Ratio C | Minor Probability p |
|---|---|---|---|
| Predicted value error | 0.0110 (Good) | 0.1825 (Excellent) | 1 (Excellent) |
Publisher’s Note: MDPI stays neutral with regard to jurisdictional claims in published maps and institutional affiliations. |
© 2022 by the authors. Licensee MDPI, Basel, Switzerland. This article is an open access article distributed under the terms and conditions of the Creative Commons Attribution (CC BY) license (https://creativecommons.org/licenses/by/4.0/).
Share and Cite
MDPI and ACS Style
Cao, J.; Yan, Z.; Wan, J.; Wang, Y.; Ye, G.; Long, Y.; Xie, Q. Comprehensive Evaluation Model for Urban Water Security: A Case Study in Dongguan, China. Water 2022, 14, 3957. https://doi.org/10.3390/w14233957
AMA Style
Cao J, Yan Z, Wan J, Wang Y, Ye G, Long Y, Xie Q. Comprehensive Evaluation Model for Urban Water Security: A Case Study in Dongguan, China. Water. 2022; 14(23):3957. https://doi.org/10.3390/w14233957
Chicago/Turabian StyleCao, Jianye, Zhicheng Yan, Jinquan Wan, Yan Wang, Gang Ye, Yingping Long, and Quanmo Xie. 2022. "Comprehensive Evaluation Model for Urban Water Security: A Case Study in Dongguan, China" Water 14, no. 23: 3957. https://doi.org/10.3390/w14233957
Note that from the first issue of 2016, this journal uses article numbers instead of page numbers. See further details here.