

Smart Water Solutions for the Operation and Management of a Water Supply System in Aracatuba, Brazil

1
Environment Solution Research Team, GS Engineering & Construction Gran Seoul Tower 2, 33 Jong-ro, Jongro-gu, Seoul 03159, Republic of Korea
2
Concession Segment, GS Inima Brazil, Rua Joaquim Floriano, 913–5º andar—Itaim Bibi, São Paulo 04534-004, SP, Brazil
3
Department of Environmental and Energy Engineering, Chonnam National University, 77 Yongbong-ro, Buk-gu, Gwangju 61186, Republic of Korea
*
Author to whom correspondence should be addressed.
Water 2022, 14(23), 3965; https://doi.org/10.3390/w14233965
Submission received: 24 October 2022
/
Revised: 23 November 2022
/
Accepted: 28 November 2022
/
Published: 5 December 2022
(This article belongs to the Section Urban Water Management)
Abstract
:Because of population growth, rapid urbanization, and climate change, many water supply utilities globally struggle to provide water that is safe to drink. A particular problem is the aging of the water supply facilities, which is exacerbated by their inefficient operation and maintenance (O&M). For this reason, many water utilities have recently been actively adopting intelligent and integrated water supply O&M solutions that utilize information and communication technology, the Internet of Things, big data, and artificial intelligence to solve water supply system problems. In this study, smart water solutions (GSWaterS) were implemented to enhance the efficiency of the water supply system in the city of Aracatuba, Brazil. They were used to monitor and analyze the operating conditions of the water supply system in real time, thus allowing for the effective management of water supply assets. GSWaterS also supports the design and optimization of district metered areas, the reduction and management of water losses, real-time water network analysis, and big data analysis using artificial intelligence. Economic analysis revealed that GSWaterS produces various direct and indirect benefits for the water supply system.
1. Introduction
Despite the consistent technological development and significant investment in water supply infrastructure, many people worldwide still do not have access to a sufficient and safe water supply. In the 21st century, population growth, rapid urbanization, water pollution, and climate change have put more significant pressure on water utilities. As such, there has been a growing need for smart water solutions and water digitalization to efficiently and economically solve water supply challenges. The concept of smart water solutions (or smart water systems) is the more intelligent use of probes, sensors, real-time communication, and automation and control technologies. They can generate, transmit, and store various water data to give operators a much more in-depth understanding of their water systems [1,2]. Smart water solutions employ a variety of technologies, including information and communications technology (ICT), Internet of Things (IoT), big data, and artificial intelligence (AI) across the water supply system, from the input of raw water to the delivery of clean and safe water [3,4,5,6,7]. These technologies allow the water quantity and quality, energy consumption, and assets to be scientifically managed while also providing large volumes of water data that can be used by water utilities and consumers. Many experts foresee significant changes in water treatment processes and facility operations due to the adoption of 4th Industrial Revolution technologies, and many water utilities have already invested in the construction of smart water management systems incorporating smart and digital technologies such as a geographic information system (GIS), online sensor-based real-time network monitoring, system operation optimization, anomaly detection and early warning, and asset management [8,9,10,11,12]. According to a Global Water Intelligence report, the global market for smart solutions in the water sector was expected to reach USD 31 billion in 2021, up from USD 21.3 billion in 2016, with a compound annual growth rate (CAGR) of 7.2% [1].
There are three forces driving the adoption of smart water solutions. The first is the desire to improve efficiency. Water utilities are constantly seeking to optimize their facilities in terms of operations and management (O&M), including improving water intake, water treatment, and water supply networks, and providing better services to customers. Smart water solutions can reduce the energy and chemicals required for water treatment and supply, minimize water losses and burst pipes, and provide consumers with more information on their water usage. The second goal in employing smart water solutions is cost reduction through improved monitoring, automated control, and asset management. Non-revenue water (NRW) can significantly contribute to the lowering of water treatment and supply costs by reducing the energy, chemicals, and labor required to operate and manage water facilities. These solutions were difficult to employ in the past due to high implementation and operating costs, but subsequent technological developments and evidence of their economic effects have increased their attractiveness. The third important factor has been regulatory compliance. New regulations typically require more spending from water utilities and industrial end-users to remain in compliance, and smart water solutions can help to minimize this additional investment. Therefore, these regulations have promoted the widespread adoption of smart solutions by water utilities [1].
Accordingly, many companies have developed smart water solutions for the water utility market. For example, IBM provides an advanced water solution that integrates smart sensors into asset management, while Siemens offers an enhanced monitoring approach that analyzes data obtained using wideband online and natural real-time sensors [13]. Global water utility companies such as Suez, Veolia, and Thames Water have also collaborated with ICT providers such as IBM and CISCO to monitor and manage their water supply systems [14,15]. TaKaDu, a water O&M solution company from Israel, employs central event management with big data analytics based on cloud services to monitor and reduce water leakage. Public Utilities Board (PUB), a Singapore government agency, and Visenti developed the WaterWiSe platform to effectively control water leaks based on real-time monitoring and decision-support technologies using hydraulic and water quality parameters [16]. In addition, various studies have been conducted on the use of AI for water supply systems. Rhee et al. investigated the prediction of water demand using fuzzy neurons, leading to a maximum error of 18.46% and an average of 2.36% [17]. Lee et al. [18] and Choi et al. [19] also examined water leakage detection by sensors such as smart meters and pressure meters, while Lee et al. [20] and Kim [21] developed a pipe deterioration analysis model using a probabilistic neural network. Other studies have reported the use of machine learning techniques for water pipe failure prediction, water leakage detection, and pipeline rehabilitation prioritization [22,23,24,25].
In line with this trend, this paper reports on the implementation of GSWaterS, an advanced intelligent O&M solution that is employed in Brazil’s water supply system. Brazil has experienced rapid growth in the demand for smart water technologies to improve the O&M efficiency of its water supply systems. In the project described in this paper, GSWaterS was customized for use in the water supply system for Aracatuba, Sao Paulo, Brazil, and integrated with existing supervisory control and data acquisition (SCADA) and GIS systems. In addition to the implementation of GSWaterS, new district metered areas (DMAs) were designed and constructed with a flow and pressure monitoring system. It was thus possible to enhance the efficiency of the water system and generate significant economic benefits. The potential use of big data and AI algorithms to predict the operating parameters for the water supply system was also evaluated.
2. Material and Methods
2.1. Aracatuba Water Supply System
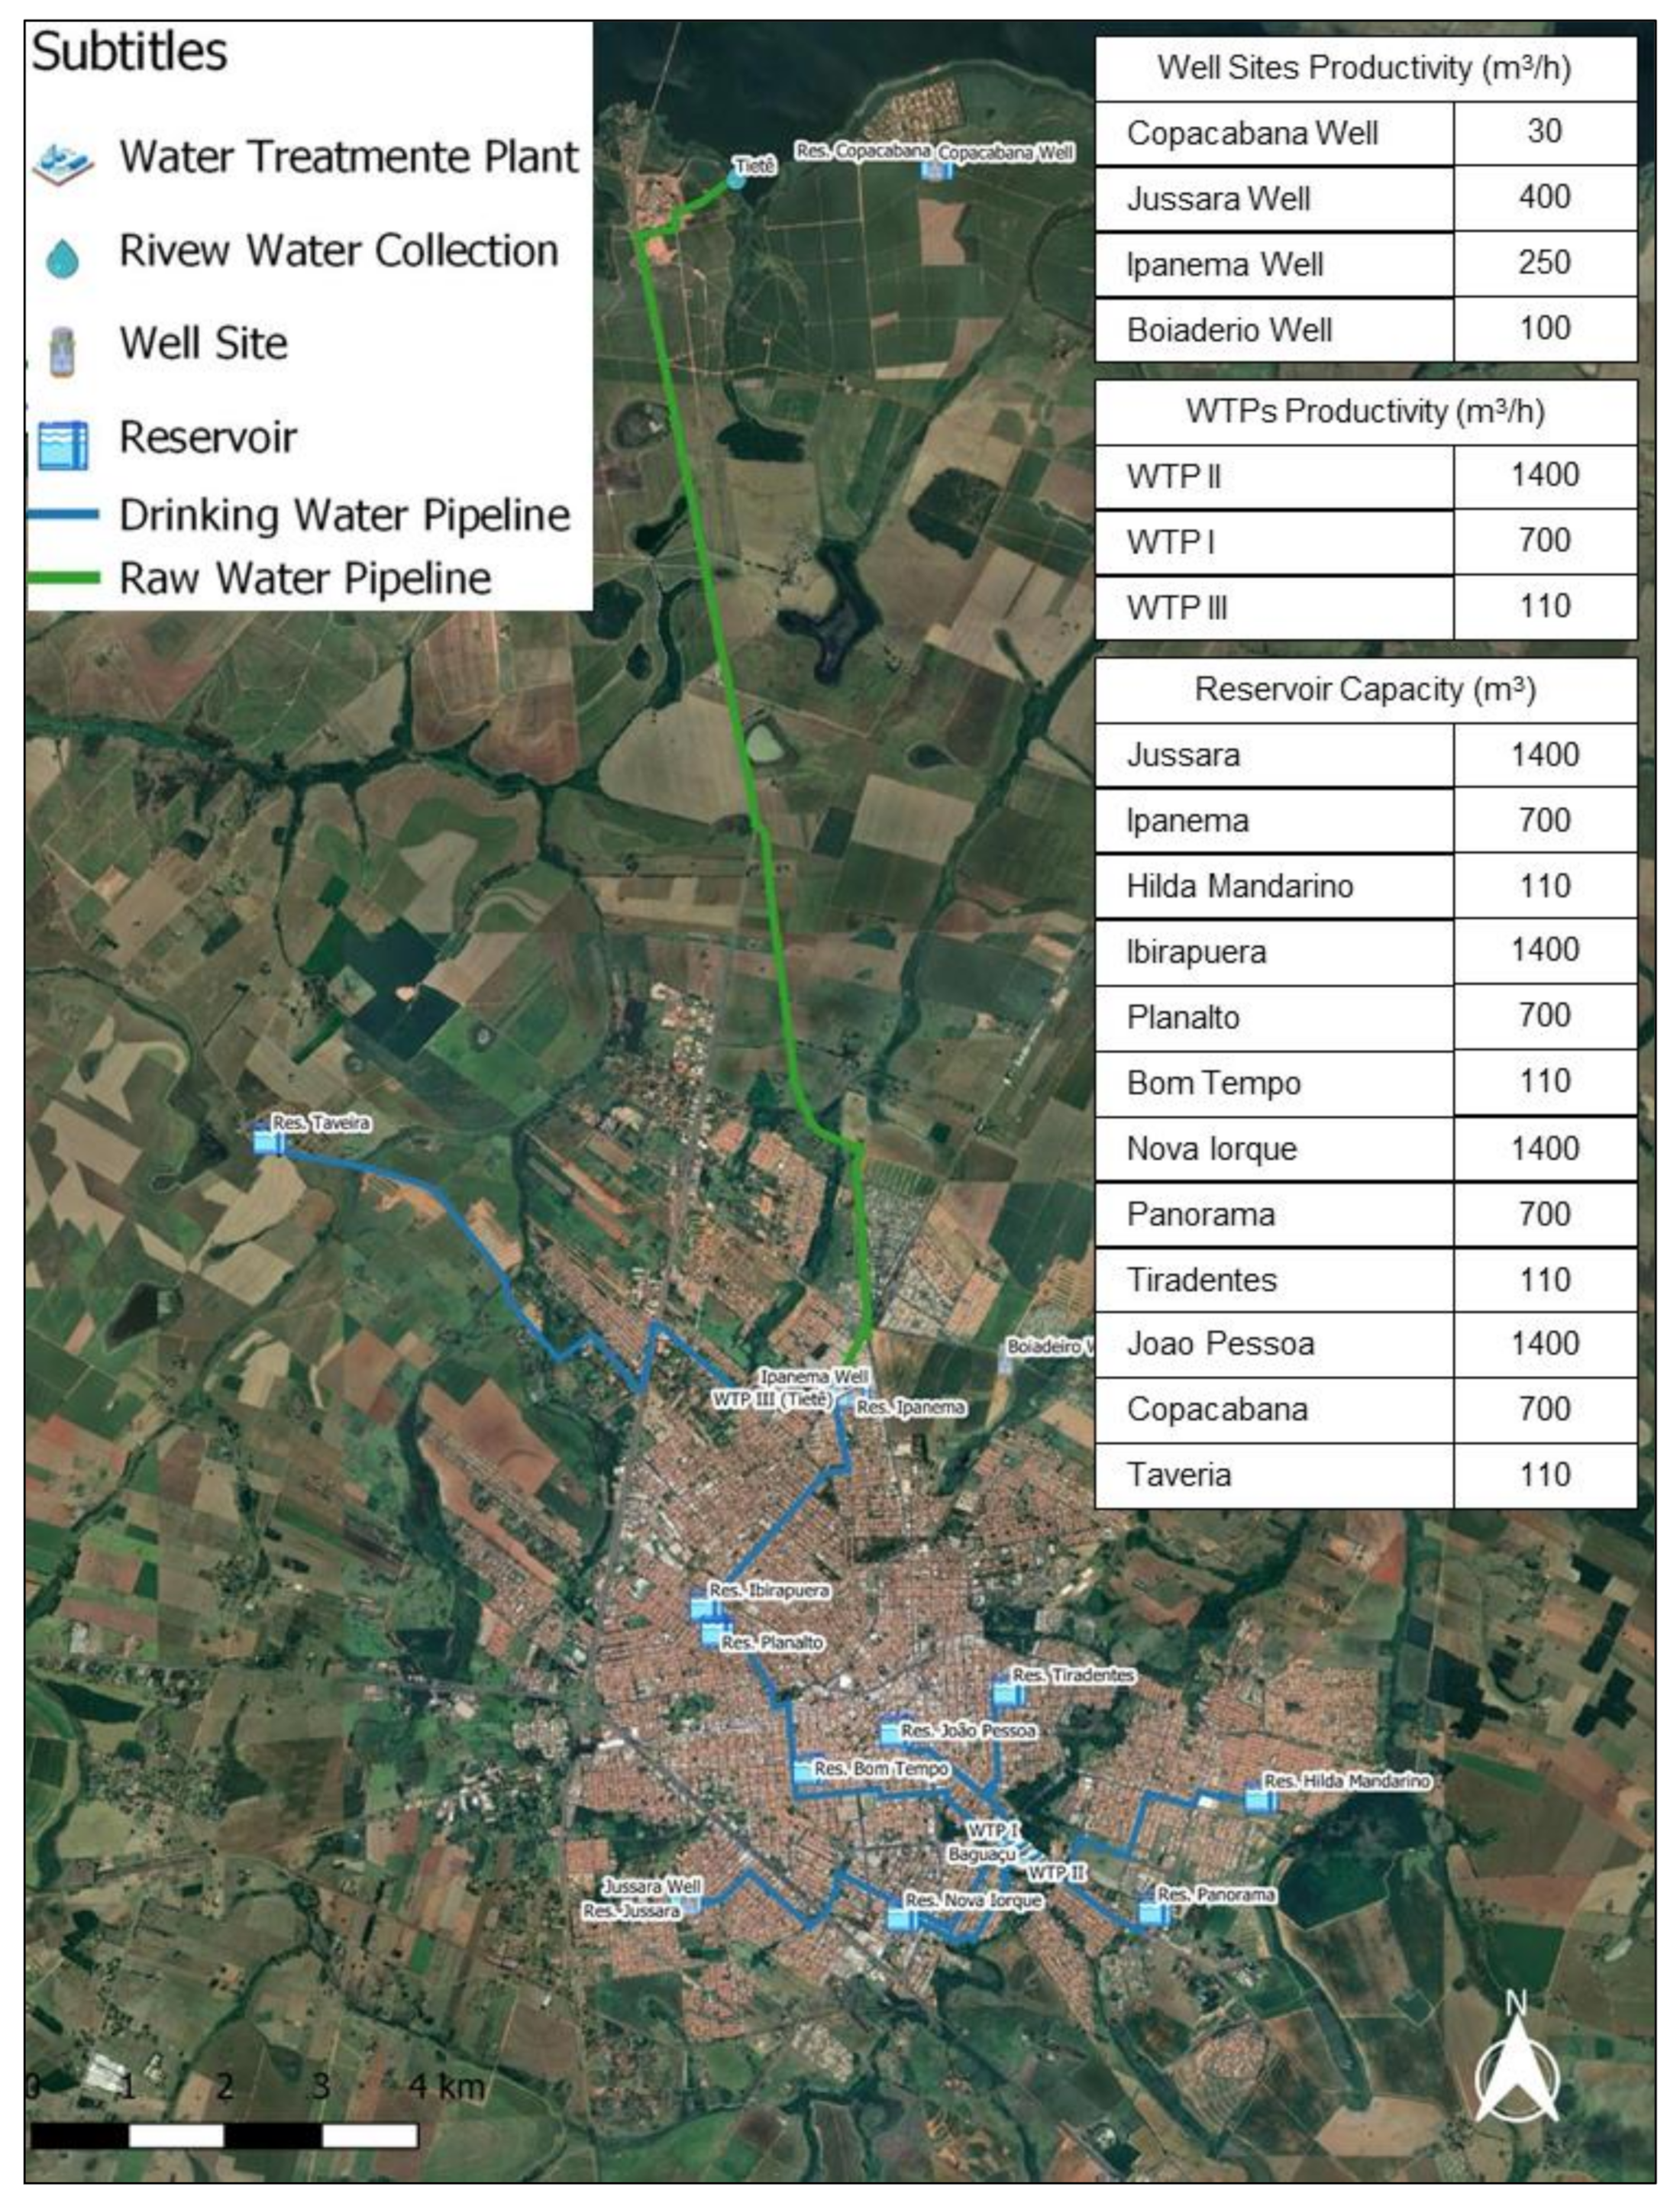
The city of Aracatuba is located in the northwest of Sao Paulo state, Brazil, with a population of 198,129 in 2020 and an area of 1167.4 km2. SAMAR, a GS Inima Brasil subsidiary, provides water and sanitation services for Aracatuba residents. The company has a treatment capacity of 81,600 cubic meters per day, and it manages a water network system of 874 km with 74,200 water connections. Figure 1 presents an overview of the water supply system in Aracatuba. Unlike other mid- and large-sized cities in Brazil, SAMAR has recently made significant efforts to improve the water supply system by adopting O&M technologies and solutions such as SCADA, GIS, and water network design software. However, the city’s water supply has faced various challenges, including relatively high levels of water loss at around 38%. Because there were no flow and pressure monitoring instruments in the water network system before the introduction of the DMAs, it was difficult to effectively manage the water supply system and to significantly reduce water loss by relying on manual water leakage detection only. Therefore, there was a strong need for the city to develop an advanced water supply monitoring and management system to resolve these issues and provide a high-quality water supply that can be fully integrated with existing water solutions.
2.2. GSWaterS Development and Structure
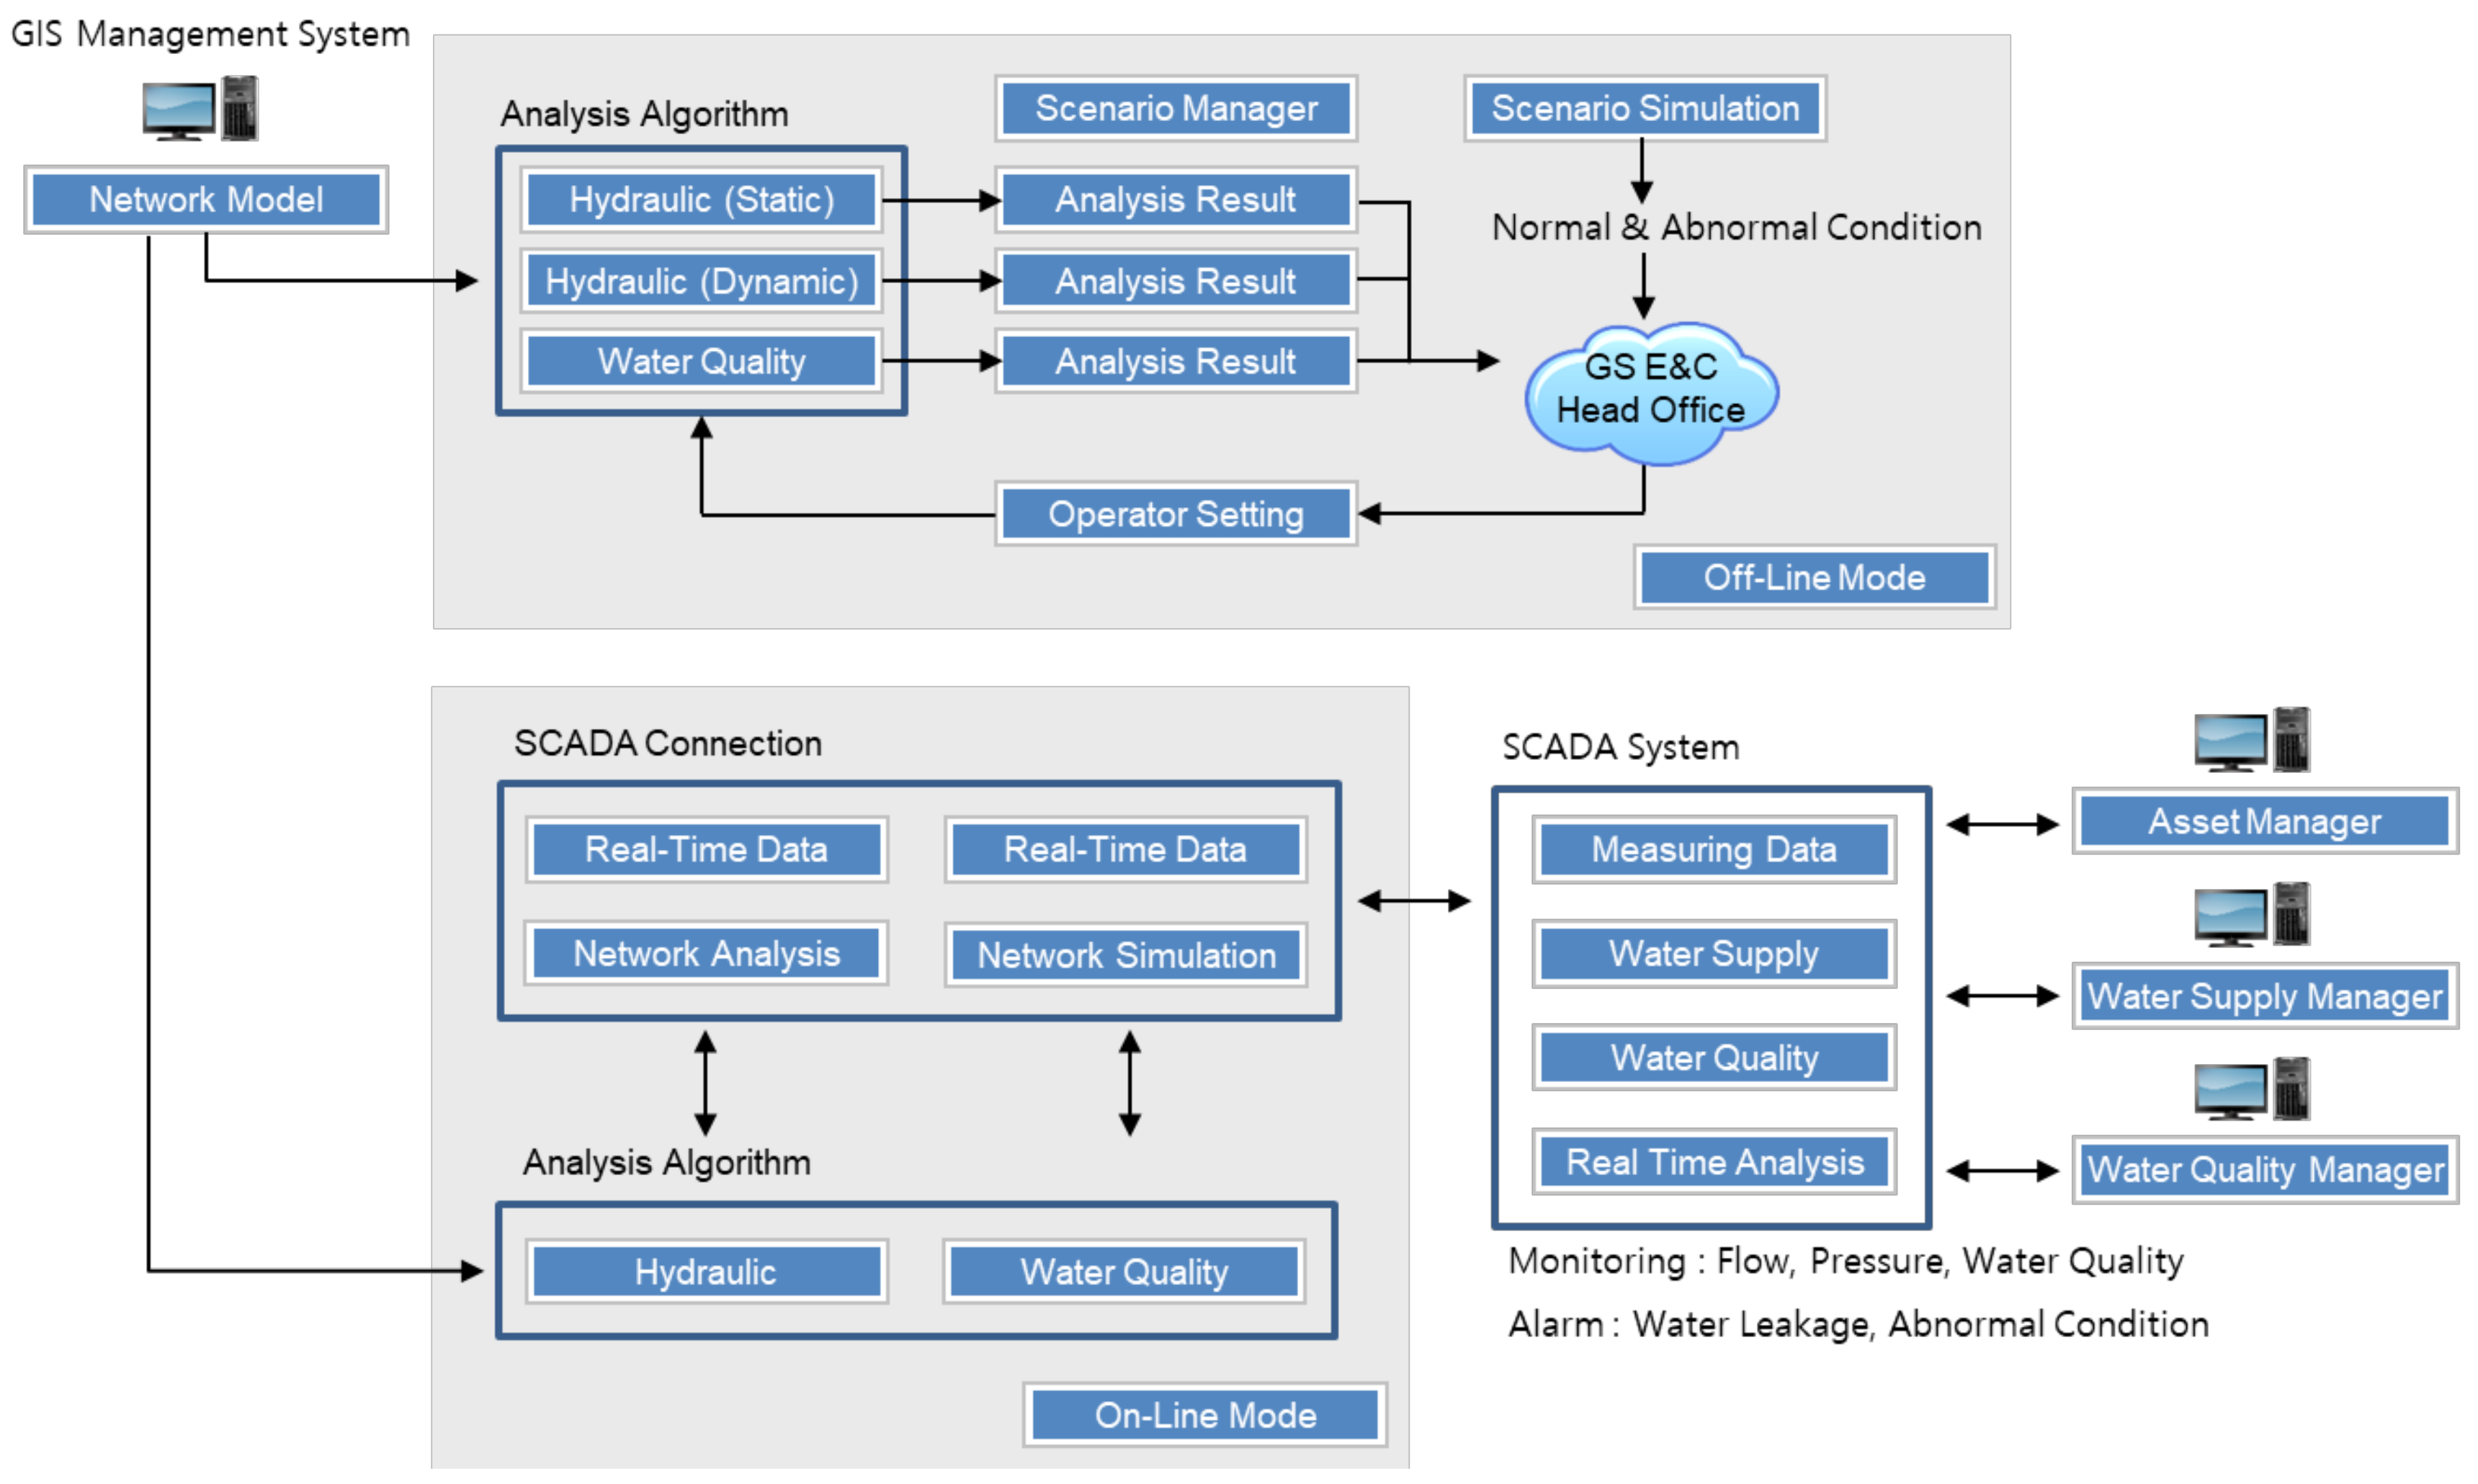
As shown in Figure 2, GSWaterS is a web- and GIS-based water supply O&M platform developed with the support of the Ministry of Environment (Korea) and the Korea Environmental Industry and Technology Institute. It was tested on water supply systems in Korea and Vietnam from 2012 to 2016. GSWaterS comprises six functional modules: (1) water supply monitoring, (2) water network analysis, (3) asset management, (4) GIS management, (5) water network design, and (6) customer management. This solution was customized for the water supply system in Aracatuba, thus the GIS management, water network design, and customer management modules were excluded because the city already had similar systems. The water supply monitoring module was customized to ensure it was fully integrated with the existing SCADA system, which employed real-time monitoring data as input into a water network analysis model and as calibration parameters. This module monitored in detail operating conditions such as the DMA flow rate and pressure, reservoir water level, and pump status. The water network analysis module was customized to incorporate GIS data and included various O&M functions for the water supply system, such as automated event alerts, dynamic modeling that minimized false alarms, historical data analysis, network-based spatial analysis, geolocation of specific events, reports, and managerial dashboards. The asset management module is essential for water utilities to efficiently operate and manage their water supply systems, guiding the acquisition, use, and disposal of assets to optimize their service delivery potential and to manage related risks and costs over their entire lifetime. It employs procedures, tools, principles, and methods that manage life expectancy and the business impact of the costs, performance, and risk associated with infrastructure assets.
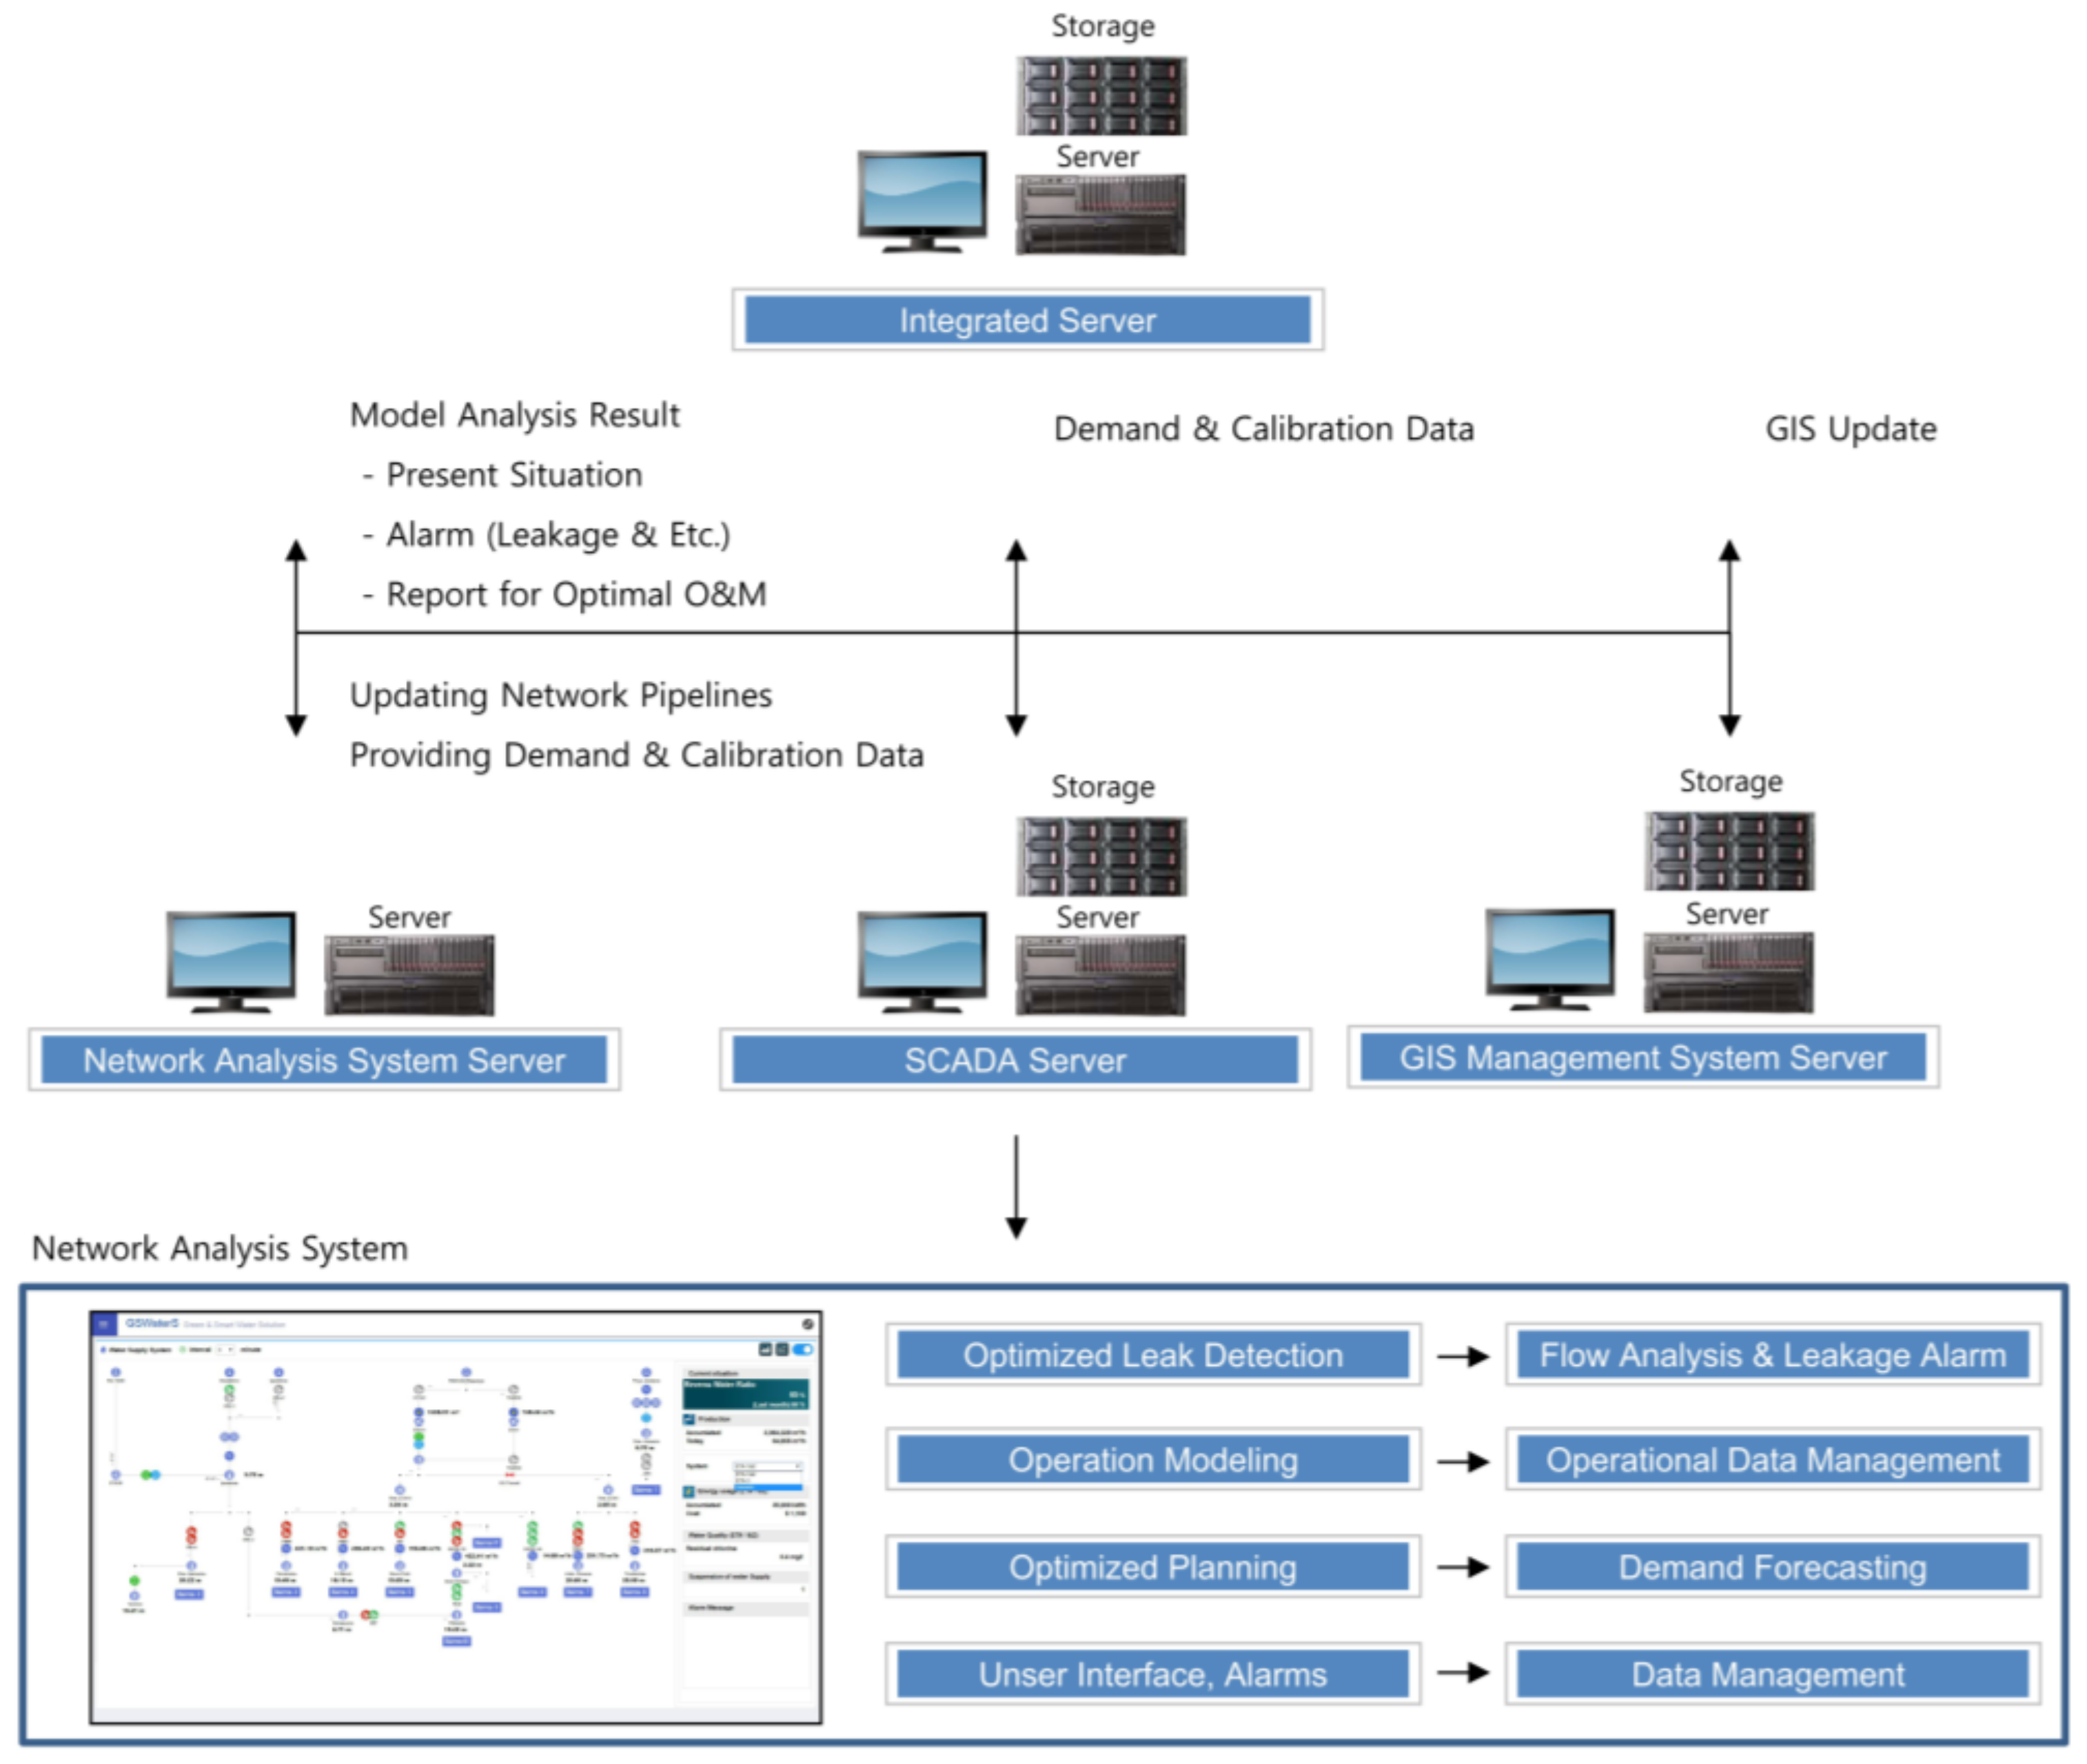
Figure 3 presents a conceptual diagram of the Aracatuba water network system based on the initial database used to customize GSWaterS providing detailed information on its components, including the water tanks and pumping stations. The program was developed based on a field survey and data for the pipe networks and water supply facilities to reflect the existing water supply system. The water supply facilities, maintenance, and asset modules were connected to the SCADA monitoring system, and the GIS data were integrated through an application programming interface (API).
2.3. GSWaterS Customization and Integration
In the first stage of GSWaterS customization, identification numbers for the water supply facilities, including the meters and sensors, were employed based on engineers’ opinions to allow the operators to distinguish between them. The GIS files were used to map the water supply monitoring system so that the operators could use the information on the pipe networks and facilities (e.g., location, length, diameter, equipment specification, etc.). Based on previous studies, a hydraulic model was constructed and compared with actual data in real time through simulations to test the dashboard and alarms for outliers considering various analysis algorithms based on expert opinions and evaluation criteria. Lastly, because it is inefficient to employ too much data for asset management, data were selected based on the functions that the operators required. SCADA provides continuous real-time information and allows the control of thousands of parameters within the water network. However, this massive amount of data does not automatically translate into operational, planning, or service improvements for the water utilities. Rather, the information needs to be interpreted and transformed into actual knowledge that is useful when operating the water supply facilities and making asset management and planning decisions.
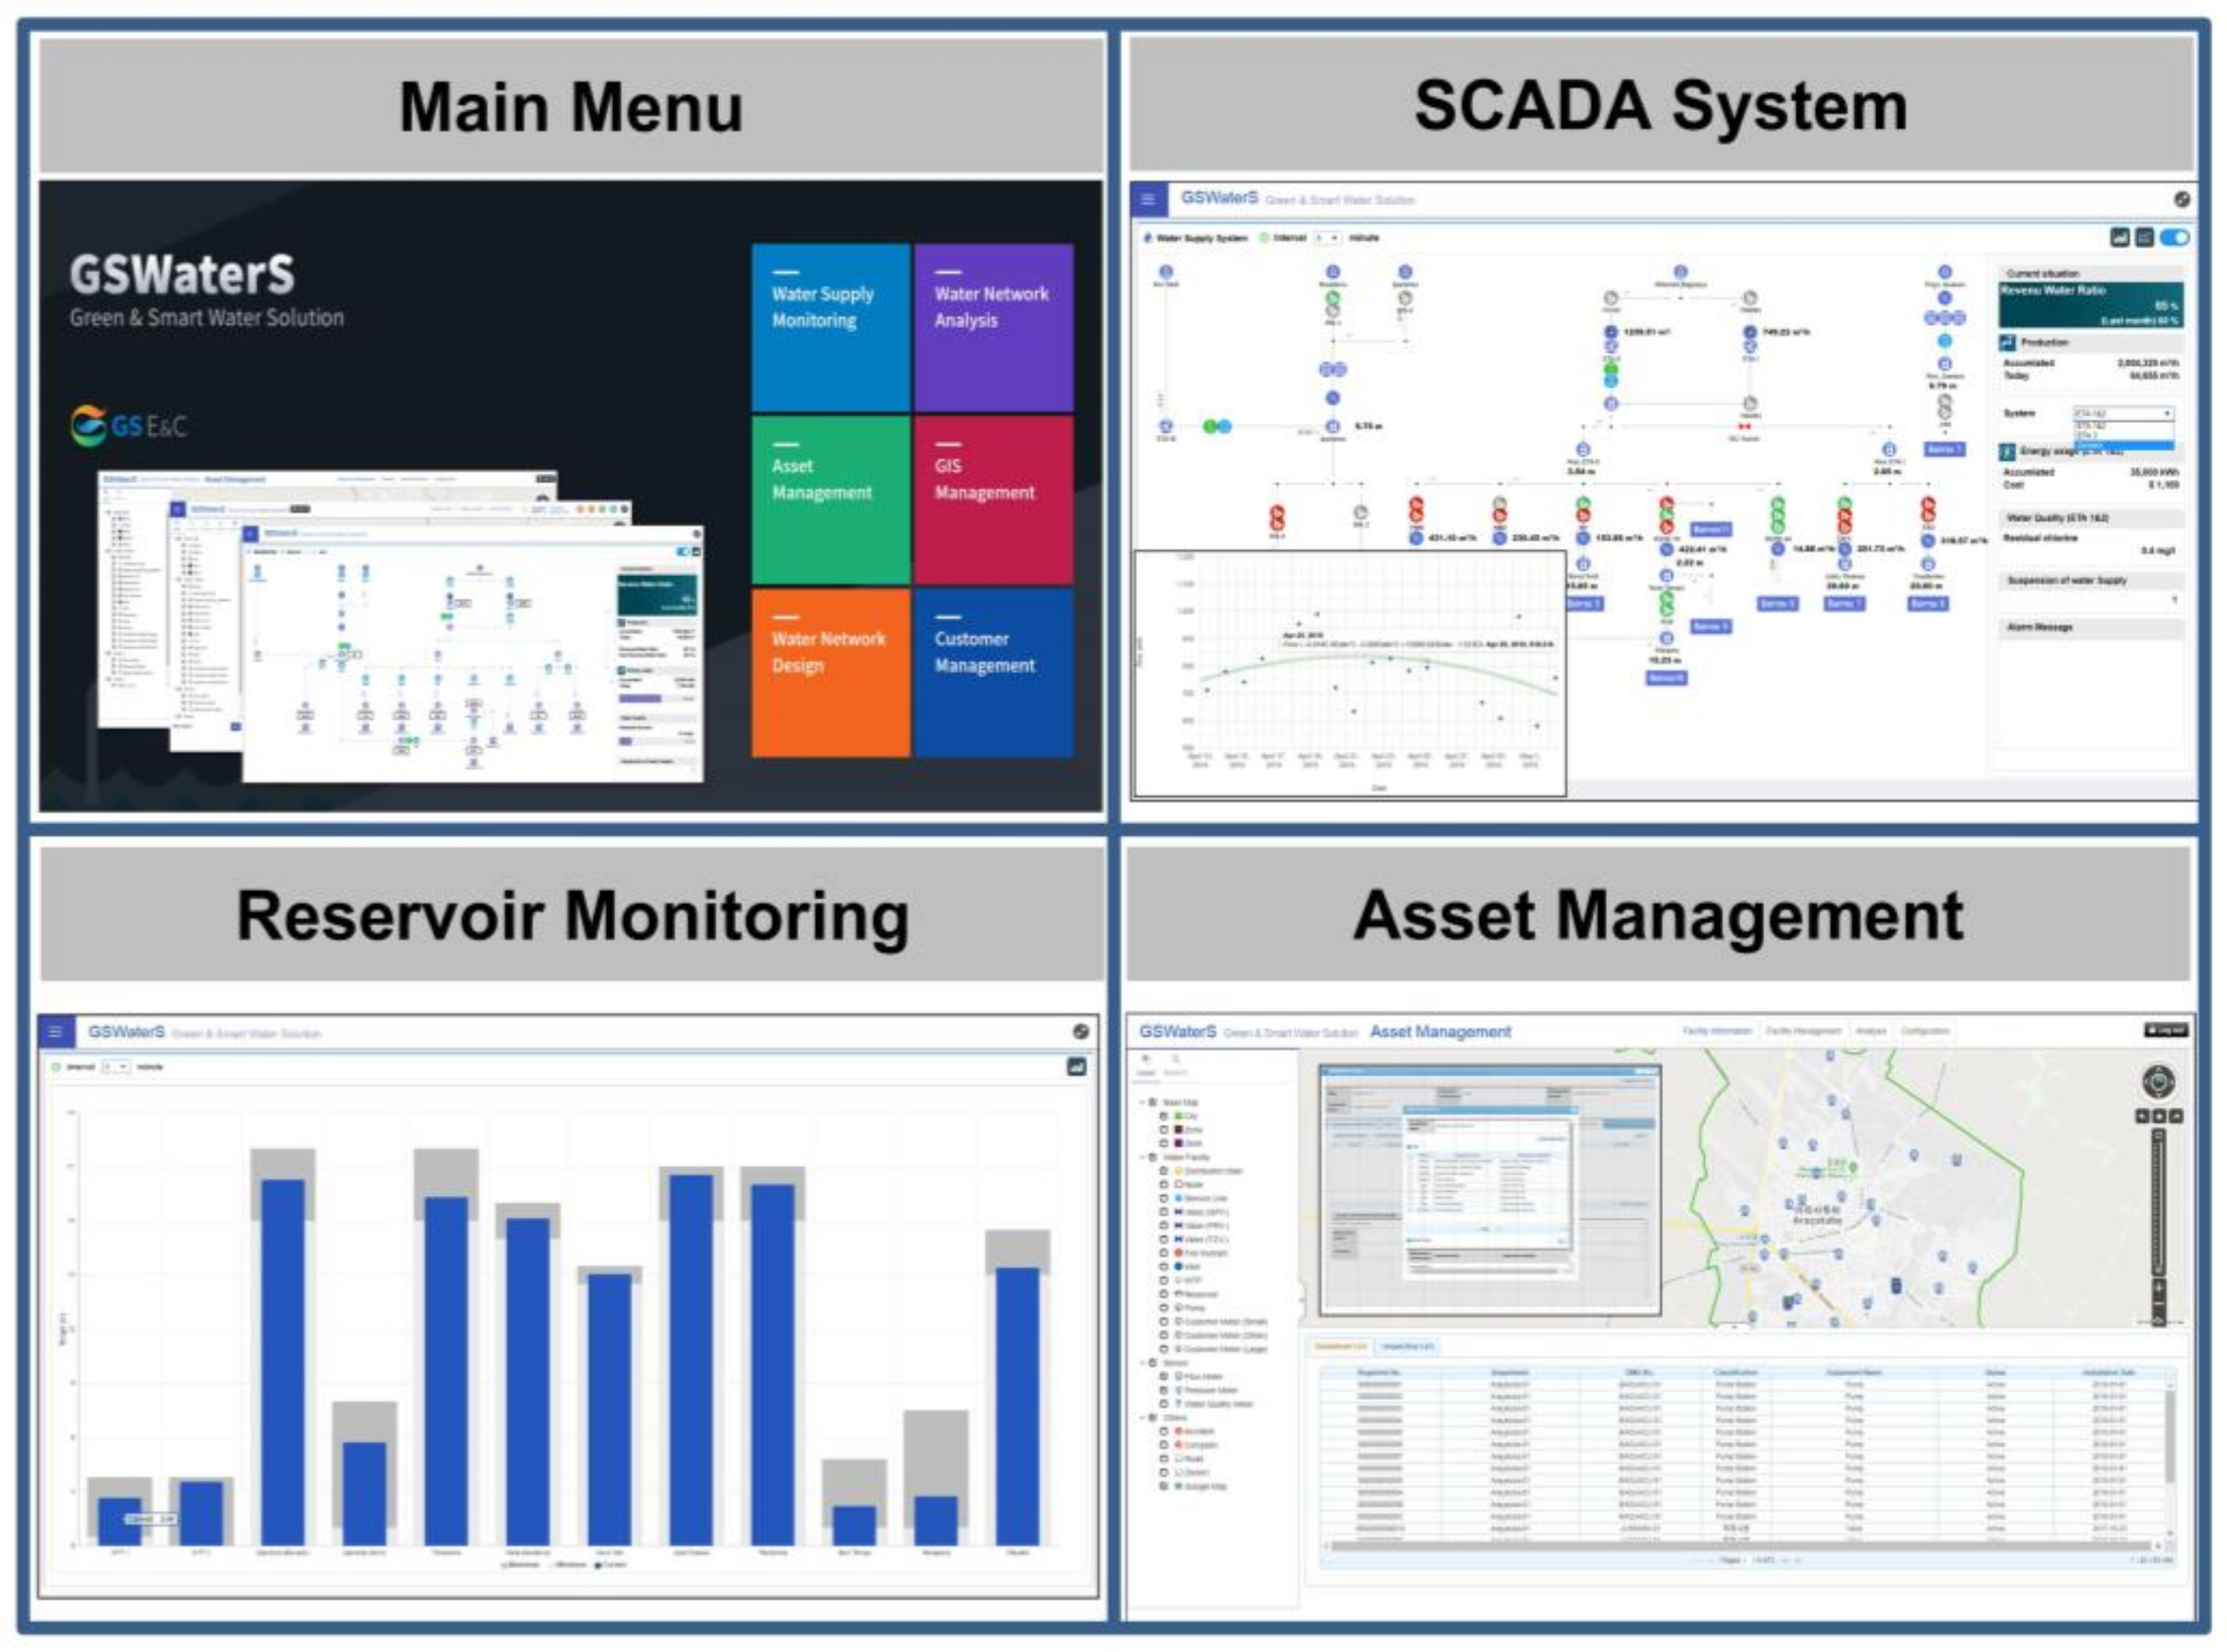
The implementation of GSWaterS involved three major components: a GIS system synchronizing the required data through an API, locally customized water network analysis using SCADA, and an asset management system with various alert functions and an alarm message window (Figure 4). Asset management and associated evaluation tools were developed based on DMA assessment and DMA O&M prioritization to ensure that the assets were effectively used and maintained. Frequent asset health assessments that accounted for expected lifecycles and historical maintenance costs, reduced unnecessary asset acquisitions, and reduced overall ownership and use of assets could increase the overall value of the water supply system and enhance the efficient use of the operating assets.
2.4. AI Algorithm Development
An AI prototype was developed for GSwaterS as a maintenance evaluation tool. For this, flow and pressure data were collected from five DMAs in the Jussara area (a pilot study site), and a machine learning model was trained using six months of data and validated using the data for the following month. The IDs of the flow meters used were 108791 (DMA No. 1), 108783 (DMA No. 2), 108788 (DMA No. 3), 108773 (DMA No. 4), and 108784 (DMA No. 5), and the IDs of the pressure meters were 108774 (DMA No. 1), 108764 (DMA No. 2), 108765 (DMA No. 3), 108777 (DMA No. 4), and 108759 (DMA No. 5). In order to improve the accuracy of the machine learning model, reduce the simulation time, and prevent overfitting, outliers and erroneous data were removed from the dataset.
Prediction algorithms were employed based on the collected pressure and flow data using an RNN and Tensorflow 1.13 (Figure 3). A pilot study was carried out for raw data with no data processing, leading to low prediction. As a result, in the second study, the Orange3 program, which is widely used for data visualization, machine learning, and data mining analysis, was employed to improve the prediction accuracy of machine learning through data processing. The dataset was divided into training and test sets. The training set used the data obtained for six months in Aracatuba, Brazil, and the test set used data for the following month.
The machine learning model was implemented with Python and Tensorflow 1.13. The training dataset consisted of 212 daily, 5088 hourly, and 20,352 minute-based data points, while the validation dataset contained 15 daily, 360 hourly, and 1440 minute-based data points. An RNN (recurrent neural network) is used as a machine learning model because it is a suitable artificial neural network for processing time-series data. RNN can make a connection between nodes to create a cycle allowing output from some nodes to affect subsequent input to the same nodes, as shown in Figure 5. Therefore, it is generally used when successive observations are related, such as for analyzing speech, sentence structure, and time series.
2.5. Economic Evaluation
To evaluate the economic outcomes of a project, a cost–benefit analysis (CBA) is generally applied, which has three types: the net present value (NPV), benefit–cost (B/C) ratio, and internal rate of return (IRR). The NPV is the difference between the present value of the cash outflows and inflows during the project period, which is typically larger than 0. The B/C ratio is the overall relationship between the relative costs and benefits, which is generally larger than 1. The IRR refers to a discount rate that makes the NPV of all cash flows equal to zero in a discounted cash flow analysis. In the present study, the B/C ratio was employed for the economic analysis of the NRW reduction project in Aracatuba by considering technical, economic, and social factors related to the facility investment costs and operating benefits.
3. Results and Discussion
3.1. DMA Design and Operation Optimization
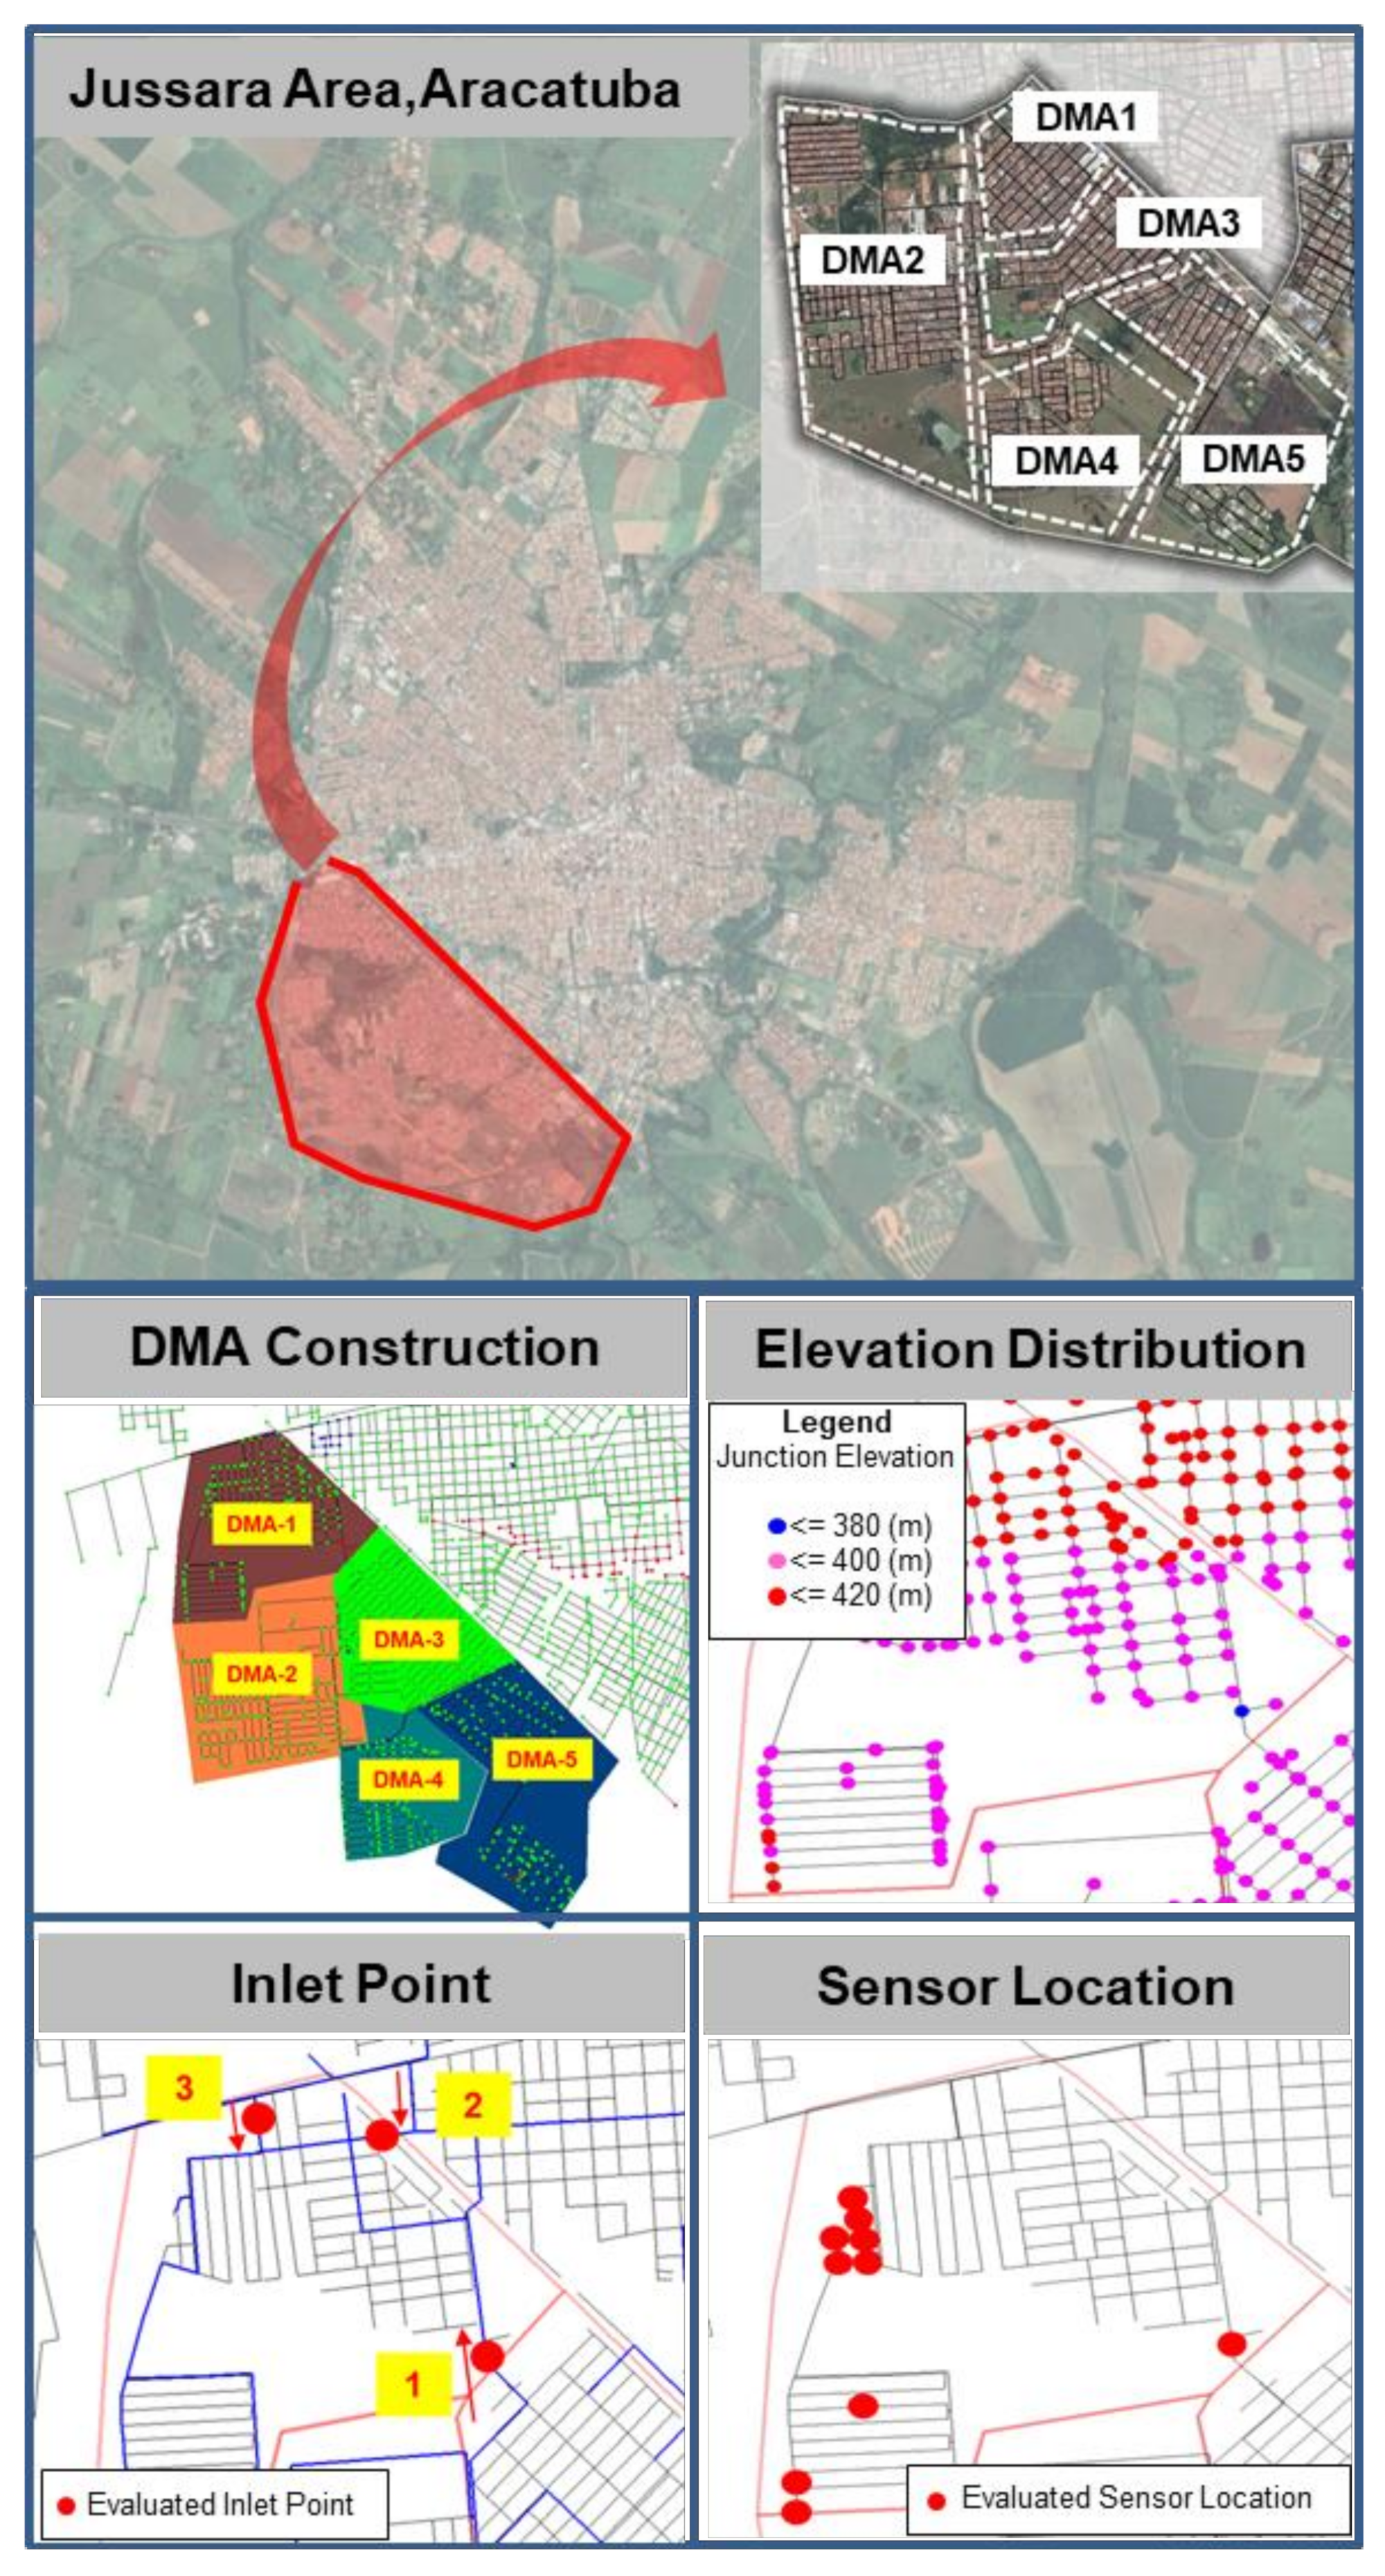
Various technologies are needed to effectively reduce water loss, including pressure management, the establishment of DMAs, and the implementation of an integrated operation and management system. Pressure management can be achieved by installing pressure-reducing valves and regular leakage detection sensors. In addition, to monitor and manage water leakage, DMAs should be established with monitoring instruments such as flow meters and pressure sensors and an integrated water network and management system [11]. Before this project, the water network system did not employ DMAs or monitoring instruments. In the first step, the optimal size of the DMAs was determined based on the water supply, population growth, and future development plans. In the second step, the locations of the inlet point for the water supply and the three pressure sensors (at the inlet, mid-point, and end-point) for each DMA were determined. The location of the flow meter was determined by examining the water pressure distribution from the inlet point. The pressure sensors were selected and installed at large water consumers, which exhibited the highest change in the water pressure during the day. Finally, DMA development priorities were evaluated based on a comprehensive analysis of the items in Table 1. This integrated management system also considered the water leakage monitoring system. Table 1 and Figure 6 present the DMA implementation and evaluation results based on the analysis of DMA operation and maintenance priority, the year the pipe was installed, elevation, optimization of the sensor location, inlet point, and valves. In the Jussara area, DMAs 1–3 (from 78 to 79 points) were in moderate condition, while DMAs 4 (83 points) and 5 (80 points) were in good condition. These results were calculated according to Table 1, and 90 points or more were classified as excellent, 80 points or more as good, 70 points or more as moderate, 60 points or more as bad, and less than 60 points as serious. The evaluation criteria can be effectively used to make an optimal DMA design. Moreover, it can be used for DMA operation and maintenance. Because of limited human resources within many water utilities, each DMA can be diagnosed once or twice yearly. Furthermore, there is no guideline for prioritizing the DMA diagnosis and maintenance order. Accordingly, the evaluation system can be a useful tool to determine which DMA needs to be diagnosed and repaired first.
3.2. Water Loss Reduction
The real-time flow and pressure monitoring system effectively detected warnings and unexpected events, and problems such as sensor location and tag errors were improved through trial and error in the commissioning stage to manage the water leakage. As a result, the accuracy of the real-time monitoring was enhanced. The water pressure was monitored using the flow meters and pressure sensors installed in each DMA. Pump operation and water levels in the reservoir were adjusted based on data analysis to ensure the target leakage level was maintained.
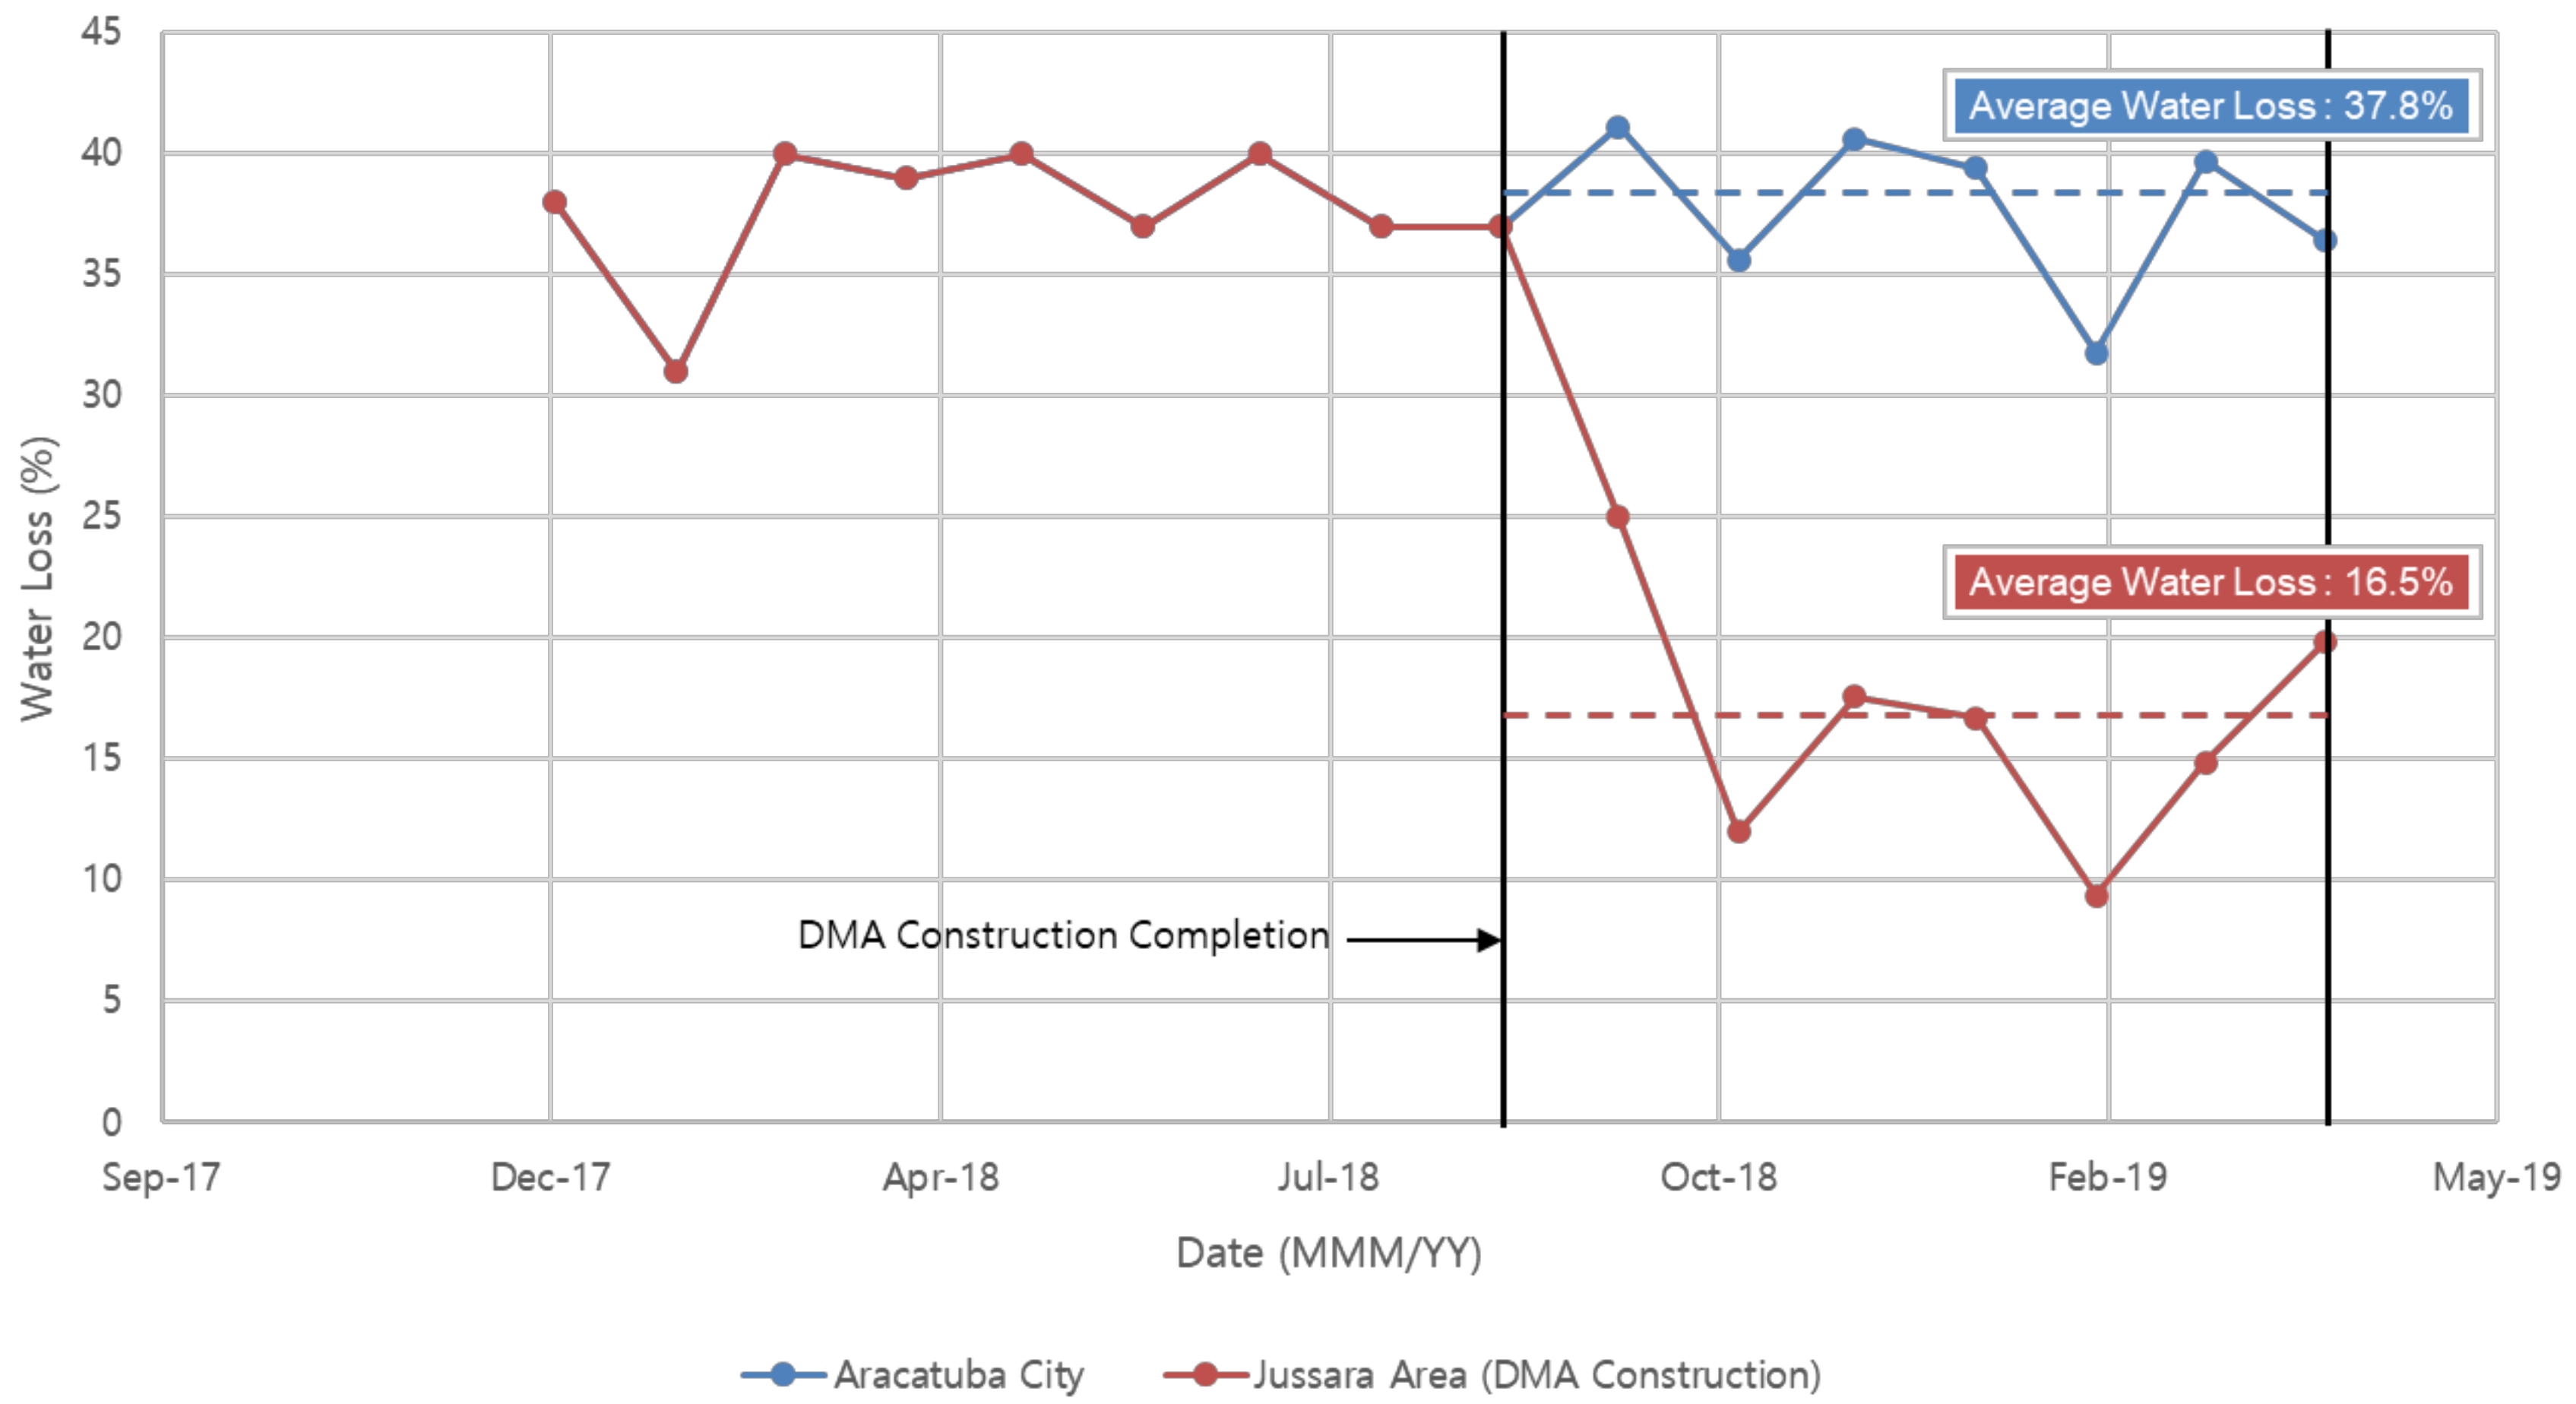
When an abnormal situation occurred in real-time monitoring, an alarm sounded to alert the operator, allowing them to effectively manage water leakage using the appropriate measures. If there was a pump malfunction or abnormal water levels in the reservoir, the operator could immediately contact the site manager to fix the water leakage, the approximate location of which was quickly determined using the sensors installed in the DMA. As a result, in the Jussara region, water leakage was reduced from 38% to 17% (Figure 7 and Table 2).
3.3. AI Analysis
A pilot study was conducted to examine whether big data and AI algorithms could predict the flow rate and pressure in the water supply system of Aracatuba using GSWaterS. Raw data were collected for data analysis. The overall error rate was around 10%, and some DMAs exhibited a relatively large error of between 20% and 50% because the water pressure was calculated by estimating the flow rate in areas where DMAs had not been established. Table 3 presents the results after 1 week, 24 h, and 120 min, which were simulated using data points every 15 min (101,760), 1 h (25,440), and 1 d (1060). The prediction results for the pressure (Tag ID: 108774) and flow (Tag ID: 108791) in DMA 1 had an average error rate of 12.2% and 35.2% each day, 19.0% and 13.9% each hour, and 14.2% and 11.1% each minute, respectively. The prediction results for the pressure (Tag ID: 108764) and flow (Tag ID: 108783) in DMA 2 had an average error rate of 5.3% and 15.4% per day, 7.9% and 19.2% per hour, and 6.5% and 17.0% per minute, respectively. The prediction results for the pressure (Tag ID: 108765) and flow (Tag ID: 108788) in DMA 3 had an average error rate of 11.3% and 12.9% per day, 6.5% and 8.1% per hour, and 7.2% and 6.6% per minute, respectively. The prediction results for the pressure (Tag ID: 108777) in DMA 4 and pressure (Tag ID: 108759) in DMA 5 had an average error rate of 3.3% and 9.0% per day, 52.2% and 8.8% per hour, and 25.1% and 4.1% per minute, respectively. The flow meters in DMA 4 (Tag ID: 108773) and DMA 5 (Tag ID: 108784) were excluded from this simulation because no signal was received due to sensor failure.
Prediction algorithms were employed based on the collected pressure and flow data using an RNN and Tensorflow 1.13 (Figure 3). A pilot study was carried out for raw data with no data processing, leading to low prediction. As a result, in the second study, the Orange3 program, which is widely used for data visualization, machine learning, and data mining analysis, was employed to improve the prediction accuracy of machine learning through data processing. The dataset was divided into training and test sets. The training set used the data obtained for six months in Aracatuba, Brazil, and the test set used data for the following month.
Data pre-processing was conducted by removing noise, missing data, and duplicate data using statistical methods. Machine learning training was performed after excluding data that exceeded ±3 sigma (99.7%) from the minimum/average/maximum and the standard normal distribution. Missing values and outliers were also excluded, and by checking the skewness (<3) and kurtosis (<8), it was confirmed that the data might be biased because the dataset was small. It was found that no data deviated from the distribution except for the missing values.
The root-mean-square error (RMSE) and R2 were calculated to evaluate how well the predicted values reflected the actual data when using the machine learning algorithm. Using the raw data in the prediction model, the minimum, average, and maximum R2 were 0.661, 0.775, and 0.872, respectively, which increased to 0.837, 0.864, and 0.889, respectively, when the processed data were used, yielding an improvement of 26.6%, 11.5%, and 1.9%, respectively (Table 4). The machine learning algorithm thus increased the prediction accuracy of calculated pressure, which can improve further with the optimization of the parameters. In the future, if the machine learning parameters such as the learning rate and weight are tuned, the learning time can also be reduced.
3.4. Economic Analysis
The facility investment costs included the development of the DMAs, GSWaterS, and the other water network activity necessary to reduce the physical loss of water. The operating benefits were the cost savings arising from the reduction of water production and supply (i.e., pumping energy) and less construction of water treatment plants. To improve the reliability of the analysis, the indirect operating benefits were excluded. It was assumed that the project duration was 25 years, and the interest rate was 4%. Details of the analysis parameters and conditions are presented in Table 5.
It was found that the B/C ratio was 4.02. If the indirect benefits, such as increased system availability, prevention of collateral damage, improved visibility, personnel efficiency, improved customer experience, pipe rehabilitation planning, and knowledge preservation, are included, it can be assumed that the B/C ratio could be increased further. Considering the relatively high B/C ratio, the project will be beneficial for the water utility company and ultimately the local government and consumers.
4. Conclusions
The present study analyzed the customization and application of GSWaterS in Aracatuba, Brazil. The design and functions of GSWaterS were customized in consideration of the local conditions for the O&M system and the requirements of the engineers, managers, and operators working for the water utility company. It was found to have significant benefits, but it required continuous upgrades to reflect the change in the water supply system conditions over time. The DMA design was evaluated in terms of various O&M factors, and this evaluation method was very useful for determining the DMAs’ O&M status. However, the DMA evaluation method and applied conditions need to be adjusted for more effective analysis. Big data and AI technology were also implemented to predict the operating parameters, flow rate, and pressure. It was proven that this technology can be beneficial for the O&M of water supply systems and can be used in conjunction with real-time monitoring and hydraulic modeling. Finally, the economic analysis indicated that it is worthwhile to establish DMAs using GSWaterS and apply its various functions to effectively operate and manage the water supply system, including reducing water loss and saving energy. If the indirect benefits of the DMA system and GSWaterS are considered, the B/C ratio will be higher than 4.02. An Al algorithm will be developed further in future research to predict other O&M parameters.
Author Contributions
Investigation, E.B.; Writing—original draft, K.S.; Writing—review & editing, Y.-G.P. Author Contributions: All authors have read and agreed to the published version of the manuscript.
Funding
This work was financially supported by GS Inima, the Korea Ministry of Environment (Project for Development of Disaster Response Technology for Environmental Facilities, Project No.: 2022002860001), and Chonnam National University (Grant number: 202233850001).
Conflicts of Interest
The authors declare no conflict of interest.
References
- GWI. Water’s Digital Future; GWI: London, UK, 2016. [Google Scholar]
- Li, J.; Yang, X.; Sitzenfrei, R. Rethinking the framework of smart water system: A review. Water 2020, 12, 412. [Google Scholar] [CrossRef] [Green Version]
- Koo, D.; Piratla, K.; Matthews, C.J. Towards sustainable water supply: Schematic development of big data collection using internet of things (IoT). Procedia Eng. 2015, 118, 489–497. [Google Scholar] [CrossRef] [Green Version]
- Lee, S.W.; Sarp, S.; Jeon, D.J.; Kim, J.H. Smart water grid: The future water management platform. Desalination Water Treat. 2015, 55, 339–346. [Google Scholar] [CrossRef]
- PUB. Managing the water distribution network with a Smart Water Grid. Smart Water 2016, 1, 4. [Google Scholar] [CrossRef] [Green Version]
- Lalle, Y.; Fourati, M.; Fourati, L.C.; Barraca, J.P. Communication technologies for smart water grid applications: Overview, opportunities, and research directions. Comput. Netw. 2021, 190, 107940. [Google Scholar] [CrossRef]
- Singh, M.; Ahmed, S. IoT based smart water management systems: A systematic review. Mater. Today Proc. 2021, 46, 5211–5218. [Google Scholar] [CrossRef]
- Boulos, P.F.; Jacobsen, L.B.; Heath, J.E.; Kamojjala, S. Real-time modeling of water distribution systems: A case study. J. Am. Water Work. Assoc. 2014, 106, E391–E401. [Google Scholar] [CrossRef]
- Cembrano Gennari, G.; Puig Cayuela, V.; Ocampo-Martínez, C.; Quevedo Casín, J.J.; Mirats Tur, J.M.; Meseguer Amela, J.; Ariño Tarrago, R.; López Martínez, S. Real-time monitoring and control for efficient management of drinking water networks: Barcelona case study. In Proceedings of the 11th International Conference on Hydroinformatics, New York, NY, USA, 17–21 August 2014; pp. 1–8. [Google Scholar]
- Geetha, S.; Gouthami, S. Internet of things enabled real time water quality monitoring system. Smart Water 2016, 2, 1–19. [Google Scholar] [CrossRef]
- Machell, J.; Mounce, S.R.; Boxall, J.B. Online modelling of water distribution systems: A UK case study. Drink. Water Eng. Sci. 2010, 3, 21–27. [Google Scholar] [CrossRef]
- Pule, M.; Yahya, A.; Chuma, J. Wireless sensor networks: A survey on monitoring water quality. J. Appl. Res. Technol. 2017, 15, 562–570. [Google Scholar] [CrossRef]
- Hauser, A.; Rosen, R. Simens Perspectives on Smart Water Grid Technologies. In Proceedings of the 1st International Smart Water Grid Workshop, Seoul, Republic of Korea, March 2011. [Google Scholar]
- Sempere-Payá, V.; Todolí-Ferrandis, D.; Santonja-Climent, S. ICT as an enabler to smart water management. In Smart Sensors for Real-Time Water Quality Monitoring; Springer: Berlin/Heidelberg, Germany, 2013; pp. 239–258. [Google Scholar]
- Armon, A.; Gutner, S.; Rosenberg, A.; Scolnicov, H. Algorithmic network monitoring for a modern water utility: A case study in Jerusalem. Water Sci. Technol. 2011, 63, 233–239. [Google Scholar] [CrossRef]
- Allen, M.; Preis, A.; Iqbal, M.; Whittle, A.J. Case study: A smart water grid in Singapore. Water Pract. Technol. 2012, 7, wpt2012089. [Google Scholar] [CrossRef] [Green Version]
- Rhee, K.-H.; Moon, B.-S.; Kang, I.-H. A Study of Prediction of Daily Water Supply Usion ANFIS. J. Korea Water Resour. Assoc. 1998, 31, 821–832. [Google Scholar]
- Lee, J.-S.; Choi, I.-H.; Hong, K.-E.; Choi, H.-Y.; Roh, H.-J.; Ahn, J.-K. An Efficient Water Pressure Measurement System of the Water Pipes using IoT. J. Korea Inst. Intell. Transp. Syst. 2018, 17, 114–122. [Google Scholar] [CrossRef]
- Choi, J.; Kim, J. Analysis of water consumption data from smart water meter using machine learning and deep learning algorithms. J. Inst. Electron. Inf. Eng. 2018, 55, 31–39. [Google Scholar]
- Lee, C.; Kim, E.; Shin, H.; Kim, J. A Study of Deterioration estimation Model for Drinking Water Pipe Using Probabilist Neural Network (PPN). KSCE J. Civ. Eng. 2000, 20, 197–210. [Google Scholar]
- Kim, E.-S. Development of Optimal Rehabilitation Model for Water Distribution System Based on Prediction of Pipe Deterioration (I)-Theory and Development of Model. J. Korea Water Resour. Assoc. 2003, 36, 45–59. [Google Scholar] [CrossRef] [Green Version]
- Fan, X.; Zhang, X.; Yu, X.B. Machine learning model and strategy for fast and accurate detection of leaks in water supply network. J. Infrastruct. Preserv. Resil. 2021, 2, 10. [Google Scholar] [CrossRef]
- Fan, X.; Wang, X.; Zhang, X.; Yu, P.A.X.B. Machine learning based water pipe failure prediction: The effects of engineering, geology, climate and socio-economic factors. Reliab. Eng. Syst. Saf. 2022, 219, 108185. [Google Scholar] [CrossRef]
- Elshaboury, N.; Marzouk, M. Prioritizing water distribution pipelines rehabilitation using machine learning algorithms. Soft Comput. 2022, 26, 5179–5193. [Google Scholar] [CrossRef]
- Ravichandran, T.; Gavahi, K.; Ponnambalam, K.; Burtea, V.; Mousavi, S.J. Ensemble-based machine learning approach for improved leak detection in water mains. J. Hydroinformatics 2021, 23, 307–323. [Google Scholar] [CrossRef]
Figure 1.
Water supply system in Aracatuba, Brazil.

Figure 2.
Functional diagram of the network system in GSWaterS.

Figure 3.
System configuration of the water network system in Aracatuba, Brazil.

Figure 4.
Customized graphical user interface for GSWaterS.

Figure 5.
Deep learning algorithm and RNN model.

Figure 6.
DMA design and information for the Jussara area, Aracatuba.

Figure 7.
Water loss rates (Aracatuba vs. Jussara).


Table 1.
DMA evaluation criteria.
| Item | Score | Criteria | Points |
|---|---|---|---|
| DMA Size (Customer Meters) | 5 |
| 5 |
| 4 | ||
| 3 | ||
| 2 | ||
| Network Type | 10 |
| 10 |
| 8 | ||
| Pressure Distribution (Equality) | 10 |
| 10 |
| 9 | ||
| 8 | ||
| No. of Dead-end Pipes | 5 |
| 5 |
| 4 | ||
| 3 | ||
| 2 | ||
| 1 | ||
| Leakage Detection Facility | 10 |
| 10 |
| 9 | ||
| 8 | ||
| 6 | ||
| Leakage Detection Management | 10 |
| 10 |
| 9 | ||
| 8 | ||
| 7 | ||
| 5 | ||
| Leakage Occurrence | 10 |
| 10 |
| 9 | ||
| 8 | ||
| 7 | ||
| 5 | ||
| Rust Occurrence | 10 |
| 10 |
| 9 | ||
| 8 | ||
| 6 | ||
| 4 | ||
| Pipeline Scale | 10 |
| 10 9 8 6 5 |
| Revenue Water Rate | 20 |
| 20 |
| 17 | ||
| 15 | ||
| 12 | ||
| 10 | ||
| Total | 100 |
Table 2.
Non-revenue water ratios (Aracatuba vs. Jussara).
| Year | 2018 | 2019 | |||||||||||||||
|---|---|---|---|---|---|---|---|---|---|---|---|---|---|---|---|---|---|
| Month | 1 | 2 | 3 | 4 | 5 | 6 | 7 | 8 | 9 | 10 | 11 | 12 | 1 | 2 | 3 | 4 | |
| Non-revenue water ratio (%) | Avg. | ||||||||||||||||
| Aracatuba | 38 | 40 | 40 | 39 | 40 | 37 | 40 | 37 | 37 | 41.1 | 35.6 | 40.6 | 39.4 | 31.8 | 39.7 | 36.4 | 37.8 |
| Jussara | - | - | - | - | - | - | - | - | - | 25.0 | 12.0 | 17.6 | 16.7 | 9.4 | 14.9 | 19.9 | 16.5 |
Table 3.
AI prediction results with and without data preprocessing and validation.
| DMA | Type | Tag ID | Result | ||
|---|---|---|---|---|---|
| Period | Error Rate (%) | Number of Data Points | |||
| DMA 1 | Pressure Meter | 108774 | Day | 12.242 | 1,595,392 |
| Hour | 19.008 | 1,367,040 | |||
| Minute | 14.166 | 1,085,440 | |||
| DMA 1 | Flow Meter | 108791 | Day | 35.220 | 1,141,760 |
| Hour | 13.897 | 1,583,104 | |||
| Minute | 11.063 | 1,441,792 | |||
| DMA 2 | Pressure Meter | 108764 | Day | 5.300 | 1,665,024 |
| Hour | 7.854 | 1,448,960 | |||
| Minute | 6.500 | 1,072,128 | |||
| DMA 2 | Flow Meter | 108783 | Day | 15.410 | 1,425,408 |
| Hour | 19.242 | 1,201,152 | |||
| Minute | 16.954 | 1,402,880 | |||
| DMA 3 | Pressure Meter | 108765 | Day | 11.258 | 1,238,016 |
| Hour | 6.539 | 1,181,696 | |||
| Minute | 7.150 | 1,605,632 | |||
| DMA 3 | Flow Meter | 108788 | Day | 12.861 | 1,049,600 |
| Hour | 8.072 | 1,382,400 | |||
| Minute | 6.635 | 1,355,776 | |||
| DMA 4 | Pressure Meter | 108777 | Day | 3.305 | 1,358,848 |
| Hour | 52.201 | 1,358,848 | |||
| Minute | 25.097 | 1,070,080 | |||
| DMA 4 | Flow Meter | 108773 | Day | N/A | 1,048,576 |
| Hour | N/A | 1,207,296 | |||
| Minute | N/A | 1,754,112 | |||
| DMA 5 | Pressure Meter | 108759 | Day | 9.024 | 1,186,816 |
| Hour | 8.776 | 1,128,448 | |||
| Minute | 4.091 | 1,072,128 | |||
| DMA 5 | Flow Meter | 108784 | Day | N/A | 1,048,576 |
| Hour | N/A | 1,054,720 | |||
| Minute | N/A | 1,263,616 | |||
Table 4.
AI prediction results for raw and processed data.
| Classification | R2 of the Prediction Values | ||
|---|---|---|---|
| Min. | Ave. | Max. | |
| Raw data | 0.661 | 0.775 | 0.872 |
| Processed data | 0.837 | 0.864 | 0.889 |
| Difference | 0.176 (+26.6%) | 0.086 (+11.5%) | 0.017 (+1.9%) |
Table 5.
Economic analysis.
| Classification | Description |
|---|---|
| Cost | (1) Software costs - Software installation: One lot (customization and software upgrade every 5 years) O&M: 5% of the software installation costs every year (2) DMA construction costs - Flow meter: 41 DMAs ⅹ1 EA O&M: battery replacement every 3 years, flow meter replacement every 15 years - Sensor: 41 DMAs ⅹ3 EA O&M: battery replacement every 3 years, sensor replacement every 6 years - Flow meter chamber: 41 DMAs ⅹ1 EA O&M: 5% of the flow meter chamber construction costs every year - New pipeline installation: D100–D250, L = 67.27 kmO&M: Repair of the pipelines (1.5%) of total pipe networks every year |
| Benefit | Because of water loss reduction (from 35% to 15%), the following benefits are obtained (1) Reduction in water production costs: USD 0.4/m3 (2) Pumping energy reduction = 0.5 kWh/m3, electric costs = 0.2 USD/kWh (3) Reduction of construction cost for water treatment plants: construction cost = USD 1000/m3 |
| Interest rate | 4% |
| Operation period | 25 years |
| B/C ratio | NPV of total benefits/NPV of total costs = 4.02 (>1.0) |
Publisher’s Note: MDPI stays neutral with regard to jurisdictional claims in published maps and institutional affiliations. |
© 2022 by the authors. Licensee MDPI, Basel, Switzerland. This article is an open access article distributed under the terms and conditions of the Creative Commons Attribution (CC BY) license (https://creativecommons.org/licenses/by/4.0/).
Share and Cite
MDPI and ACS Style
Shim, K.; Berrettini, E.; Park, Y.-G. Smart Water Solutions for the Operation and Management of a Water Supply System in Aracatuba, Brazil. Water 2022, 14, 3965. https://doi.org/10.3390/w14233965
AMA Style
Shim K, Berrettini E, Park Y-G. Smart Water Solutions for the Operation and Management of a Water Supply System in Aracatuba, Brazil. Water. 2022; 14(23):3965. https://doi.org/10.3390/w14233965
Chicago/Turabian StyleShim, Kyudae, Eduardo Berrettini, and Yong-Gyun Park. 2022. "Smart Water Solutions for the Operation and Management of a Water Supply System in Aracatuba, Brazil" Water 14, no. 23: 3965. https://doi.org/10.3390/w14233965
Note that from the first issue of 2016, this journal uses article numbers instead of page numbers. See further details here.